Abstract
To address the issues of numerous influencing factors on material quality, difficulty in determining the optimal mix proportion, and the need to clarify the formation mechanism when foam concrete is used as an internal mold for prefabricated components, this study conducted orthogonal tests to investigate the influence laws of fly ash content, foam content, foaming agent dilution ratio, and water–binder ratio on the dry density and compressive strength of foam concrete, and determined the optimal mix proportion via analysis of variance (ANOVA). Additionally, scanning electron microscopy (SEM) tests were performed to analyze the effects of these four factors on the microscopic pore morphology of foam concrete from a microscopic perspective, thereby revealing its formation mechanism, and engineering applications were carried out. The results show that the primary-to-secondary order of factors affecting the dry density and compressive strength of foam concrete is as follows: foam content (B) > water–binder ratio (D) > foaming agent dilution ratio (C) > fly ash content (A). The optimal mix proportion is 5% fly ash content, 18% foam content, a 30-fold foaming agent dilution ratio, and a water–binder ratio of 0.55. Under this mix proportion, the pore size of foam concrete ranges from 200 μm to 500 μm with uniform distribution, and the pore spacing is between 20 μm and 30 μm, with almost no connected pores. When the foam concrete slurry sets and hardens, hydration products such as calcium silicate hydrate (C-S-H) gel, calcium hydroxide, ettringite (AFt), and monosulfate aluminate (AFm) are generated around the bubbles. The mechanical properties of foam concrete are afforded by the combined action of these hydration products and the pore structure.
1. Introduction
Foam concrete is a new type of material prepared by fully foaming a foaming agent through physical or chemical means to form foam, using cement as the main cementitious material, mixing and stirring the foam with cement slurry in a certain proportion, and then curing it. It contains a large number of closed pores and is also known as foamed concrete [1,2,3]. In its preparation, foam stability and foam content play a crucial role in affecting the material’s stability and physicomechanical properties. Relevant studies have found that adding fly ash as an admixture during preparation can improve physical properties [4,5]. In addition, mineral admixtures such as slag and recycled concrete powder have also been proven to optimize its properties [6,7]. Furthermore, due to its advantages such as “lightweight”, “thermal insulation”, “fire resistance”, and “noise reduction”, it is currently widely used in fields such as ground insulation cushions, sandwich components, and landscaping [8,9,10,11,12,13].
With the popularization of prefabricated buildings, prefabricated components often have large volumes, special shapes, and cavity structures for design, efficiency, and lightweight needs, requiring matching internal forms during pouring. Existing internal forms face issues like poor adaptability to special shapes, high material consumption, and costs. Foam concrete as an internal form effectively addresses these, aligning with green, eco-friendly, and economic concepts, with relevant research conducted by many. Regarding stability, Fan Dingqiang et al. [14,15,16] focused on high-strength CO2 foam concrete design, stable foaming agent preparation, foam concrete optimization, and volume stability. For modification and admixtures, Yang Yifan et al. [17,18,19] explored how geopolymer foam concrete preparation and characterization affect its mechanical properties, thermal conductivity, and pore structure, improving performance. In environmental adaptability, Huang Weihong [20], based on practical projects, investigated foam concrete’s mechanical and pore structure properties under salt erosion, clarified damage thresholds, and anti-erosion optimization directions, supporting applications in coastal/saline areas. Xie Hongyang et al. [21] provided data for special environment applications via multi-factor and dry–wet cycle tests. In structural performance, Ma Chuanyi et al. [22,23], via loading tests, proposed shear strength and ultimate bearing capacity of sludge-based foam concrete under local vertical loads. Wang Yanzi [24] identified strength characteristics of polypropylene fiber-reinforced rubber foam concrete through modified rubber microstructure characterization. These studies further solidified the theoretical foundation for foam concrete’s structural application. Palamarchuk, A. et al. [25] conducted experimental and modeling research on the mechanical properties of polymer concrete and polymer-modified concrete, including efficient prediction models and additives that can significantly improve compressive strength, which provides a reference for the research and optimization of the compressive performance of foam concrete. Gao Yibo et al. [26] found that nanomaterials optimized the properties of nano-reinforced polymer-modified cement-based composites through synergistic effects, and this mechanism provides a reference for research related to foam concrete. El-Mir A. et al. [27] designed nine permeable concrete (PC) mixtures via the Taguchi method, tested their properties, and determined the optimal mix proportion via TOPSIS to obtain high-performance and sustainable permeable concrete; their optimization approach provides a reference for research on foam concrete.
The above literature has carried out beneficial explorations on the stability, mechanical properties, and engineering applications of foam concrete with different admixtures. However, using it as an internal support for prefabricated components is a new attempt. Therefore, it is urgent to study the suitable mix proportion, forming mechanism, and microscopic characteristics of foam concrete used as an internal form for cavity components. In this paper, the effects of factors such as fly ash content on the dry density and compressive strength of foam concrete are explored through orthogonal tests, and the optimal mix proportion is determined by analysis of variance; the effects of the above factors on the pore morphology are analyzed from a microscopic perspective through SEM tests to reveal its forming mechanism. The research results can provide a reference for similar projects.
2. Engineering Background
The Phase IV Project of Shenzhen Urban Rail Transit Line 3 has a total of seven stations and one parking lot along the entire line. Among them, Pingxi Station adopts a fully prefabricated structure, whose main outline is assembled by eight precast concrete components, with a middle slab set inside the outline, as shown in Figure 1. In view of the particularity of the inner cavity of precast components in this project, it is specially proposed to use lightweight foam concrete as the permanent internal formwork for precast concrete components, as shown in Figure 1 and Figure 2. Compared with wooden internal formwork and inflatable rubber internal formwork, the foam concrete internal formwork can better meet the requirements of light weight, high load-bearing capacity, fire resistance, noise reduction, and easier production during the construction of precast components, while also taking into account environmental friendliness.
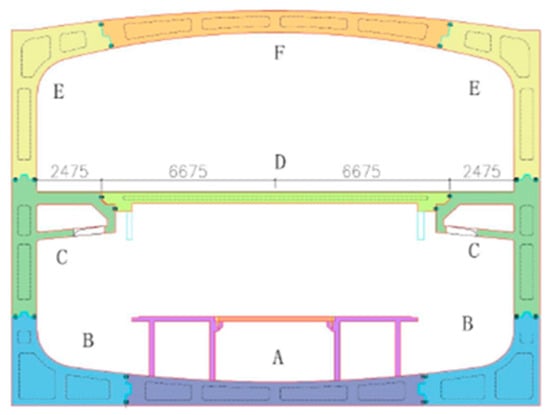
Figure 1.
Structural diagram of prefabricated metro station.
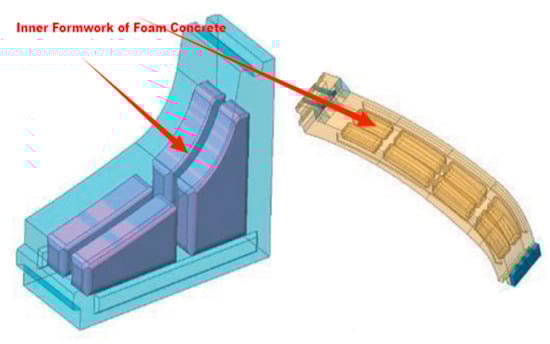
Figure 2.
Schematic diagram of hollow internal mold for precast components.
3. Experimental Overview
3.1. Experimental Material Properties
3.1.1. Cement

Table 1.
Main mineral compositions of cement.
Table 2.
Performance indicators of cement.
3.1.2. Fly Ash
The main compositions and technical properties of fly ash used in the experiment are listed in Table 3 and Table 4.
Table 3.
Main chemical compositions of fly ash.
Table 4.
Performance indicators of fly ash.
3.1.3. Foaming Agent
Foaming agents, also known as blowing agents, exhibit high surface activity and are commonly used as admixtures for preparing foam concrete. Due to their high surface activity, they can reduce the surface tension of aqueous solutions, thereby generating a large number of uniform and stable bubbles. The main compositions and performance indicators of the foaming agent used in the experiment are listed in Table 5 and Table 6.
Table 5.
Main chemical compositions of foaming agent.
Table 6.
Performance indicators of foaming agent.
3.1.4. Foam Stabilizer
The foam stabilizer selected for this experiment is a protein-based foam stabilizer, and its main compositions and performance indicators are listed in Table 7 and Table 8.
Table 7.
Main compositions of foam stabilizer.
Table 8.
Performance indicators of foam stabilizer.
3.2. Orthogonal Experimental Design
To investigate the influence of each component dosage in foam concrete on its mechanical properties, four factors were selected for the orthogonal experiment: fly ash dosage (A), foam dosage (B), foam dilution ratio (C), and water–binder ratio (D). The fly ash dosage was set at 0%, 5%, 10%, and 15% of the cementitious material mass; the foam dosage was 9%, 12%, 15%, and 18% of the cementitious material mass; the foam dilution ratio was 15, 20, 25, and 30 times; and the water–binder ratio was 0.55, 0.50, 0.45, and 0.40. Specific orthogonal experimental parameters are listed in Table 9.
Table 9.
Orthogonal experimental levels and factors settings.
3.3. Specimen Standards and Preparation
3.3.1. Specimen Standards
For the tests of dry density and compressive strength of foam concrete, the specimens used are 100 mm × 100 mm × 100 mm cubic specimens, with 3 specimens in each group. They are demolded 24 h after casting and then subjected to standard curing for 28 days.
3.3.2. Preparation of Foamed Concrete
According to the designed mix proportion of foamed concrete, weigh the corresponding mass of foaming agent, add tap water according to the dilution ratio required by the test, and stir well. Then, pass the diluted foaming agent into a foam generator to prepare the foam. The foam generator pumps the foaming agent into the machine. The air compressor presses high-pressure air and the diluted foaming agent solution into the foam mixing tube. The steel wire balls in the foam mixing tube rub against the high-pressure air and the diluted foaming agent solution quickly to generate foam, making the total foaming volume meet the requirements of the mix proportion. Generally, the process continues until the generated foam is stable and uniform. See Figure 3 and Figure 4.
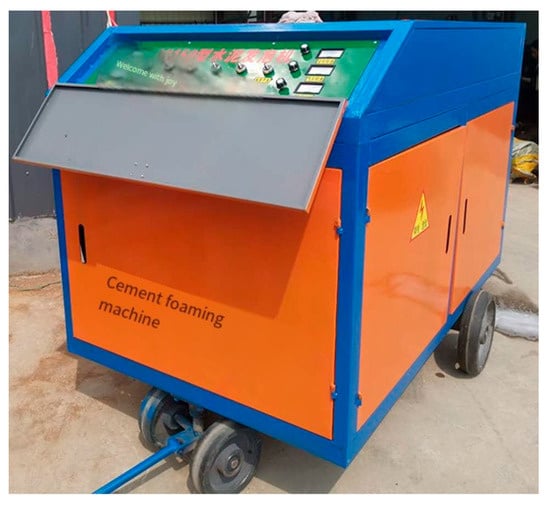
Figure 3.
Cement foam generator.
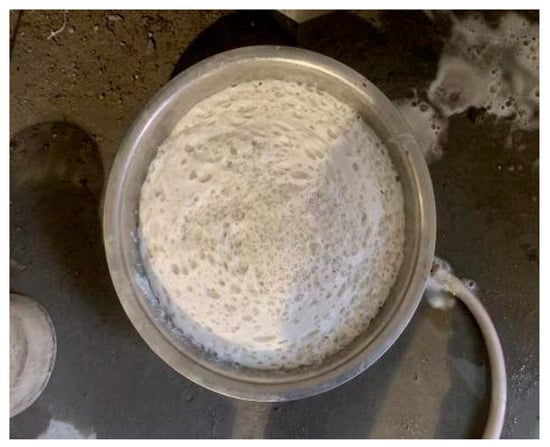
Figure 4.
Foam preparation.
Mix the prepared foam with cement paste and stir thoroughly. A well-stirred foamed concrete slurry should be uniform and stable, with no floating foam on the surface. The optimal mixing time for the foam and cement paste during foamed concrete preparation is approximately 5 min. Insufficient mixing time may result in an uneven slurry, leading to significant variations in the dry density of the foamed concrete specimens. Conversely, excessive mixing time may cause mechanical damage to the foam, increasing the dry density of the foamed concrete.
3.3.3. Specimen Molding
During the test, to avoid errors caused by human factors, foam concrete specimens in the same group will be cast in the same batch. The prepared liquid foam concrete is poured into 100 mm × 100 mm × 100 mm cubic molds, and a tamping rod is used to tamp it compactly from the outside to the inside. The part of foam concrete that is higher than the mold is cut off and troweled to a smooth finish. After casting is completed, the molds are placed into a curing box for curing to form. The formed foam concrete specimens are shown in Figure 5.
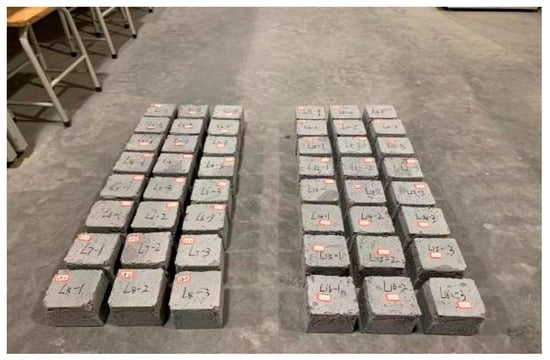
Figure 5.
Formed foamed concrete specimens.
4. Analysis and Discussion of Test Results
4.1. Influence of Different Mix Proportions on the Dry Density of Foamed Concrete
The dry density of foam concrete exhibits different patterns under various factors and levels. The test results are shown in Figure 6.
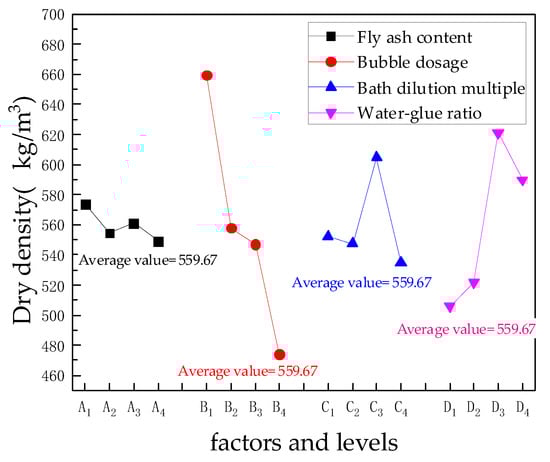
Figure 6.
Influence of different factors and levels on dry density of foamed concrete.
Analysis of the test results shows that the fly ash content (A) is the least significant factor affecting the dry density of foam concrete. When the fly ash content (A) changes from 0% to 5%, the dry density of foam concrete shows a slight decrease; when it changes from 5% to 15%, the dry density of foam concrete shows almost no change. The foam content (B) is the most significant factor affecting the dry density of foam concrete. When the foam content is 9%, the dry density of foam concrete is the maximum; when the foam content is 18%, the dry density of foam concrete is the minimum. For the dilution ratio of the foaming agent (C), there is almost no change in the dry density of foam concrete when the dilution ratio is 15 and 20 times. When the dilution ratio of the foaming agent increases to 25 times, the dry density of foam concrete shows a slight increase, and the increasing trend is not obvious; when it increases to 30 times, the dry density of foam concrete shows a more obvious decrease. When the water–binder ratio changes from 0.55 to 0.50, the dry density of foam concrete increases slightly; when the water–binder ratio changes from 0.50 to 0.45, the dry density of foam concrete shows a relatively significant increasing trend; when the water–binder ratio (D) changes from 0.45 to 0.40, the dry density of foam concrete shows a slight decrease.
4.2. Effect of Mix Proportions on Compressive Strength of Foamed Concrete
The compressive strength of foamed concrete exhibits different patterns under various factors and levels. The test results are shown in Figure 7.
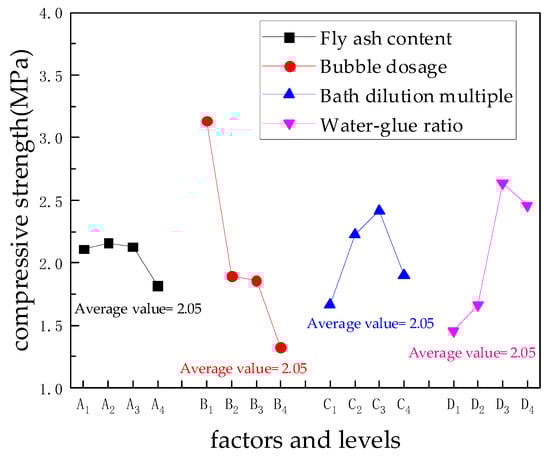
Figure 7.
Influence of different factors and levels on compressive strength of foamed concrete.
Analysis of the test results indicates that when the fly ash content (A) changes from 0% to 5%, the compressive strength of foam concrete slightly increases; when it changes from 5% to 15%, the compressive strength shows a decreasing trend. The foam content (B) is the most significant factor affecting the compressive strength of foam concrete, and the compressive strength of foam concrete shows a decreasing trend with the increase in foam content. The dilution ratio of the foaming agent (C) has no significant effect on the compressive strength of foam concrete. At a dilution ratio of 25 times, the addition of foam stabilizer changes the quality of the foam, resulting in a decrease in the slurry density of foam concrete, and thus the compressive strength decreases accordingly. The effect of the water–binder ratio (D) on the compressive strength of foam concrete shows a consistent trend with its effect on the dry density of foam concrete. An appropriate water–binder ratio and foam content can adjust the consistency (thickness or thinness) of the foam concrete slurry, thereby affecting the compressive strength of foam concrete.
In particular, a comparison of the degrees of influence of various factors on the compressive strength of foamed concrete (Figure 8) shows that the foam content has a significant impact on enhancing the compressive strength of foamed concrete: the lower the foam content, the higher the strength, whereas the fly ash content has the least impact on enhancing compressive strength. This is because foam forms pores in the concrete, thereby reducing the material density. While this is beneficial for reducing self-weight, it significantly impairs compressive strength. This is consistent with the conclusion in reference [25] that polysaccharide resins form pores in polymer concrete, thereby reducing the material density and compressive strength. Fly ash does not participate in the hydration reaction of concrete; however, it provides a stable “encapsulating environment” for bubbles, reducing the floating, rupture, or coalescence of bubbles during pouring, and thus has the least impact on compressive strength.
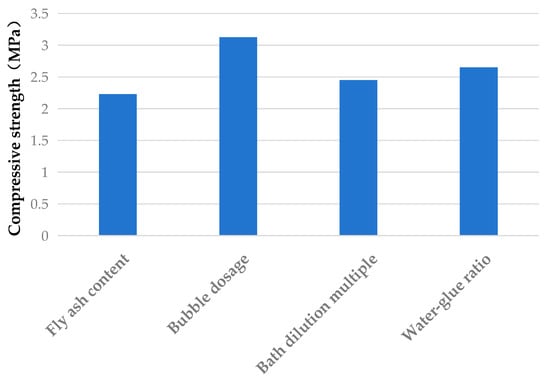
Figure 8.
The degree of influence of various factors on the compressive strength of foamed concrete.
4.3. Results of Analysis of Variance
To further investigate the significance of the effects of various factors on the dry density and compressive strength of foamed concrete, analysis of variance (ANOVA) was conducted on the orthogonal test results of foamed concrete, and the analysis results are presented in Table 10.
Table 10.
Analysis of variance (ANOVA) for properties of concrete.
For the dry density of foamed concrete, the minimum mean square (Mimin = 748.028) was selected as the error term and the variance ratios (VRi) of dry density were calculated by dividing the mean squares of other factor groups by the minimum mean square; for dry density, the relationship 1.00 < 2.23 < F0.05(3,3) = 9.28 < 17.30 < F0.05(3,3) = 29.46 < 38.39 indicates that factor B (foam content) has a highly significant effect on dry density, factor D (water–binder ratio) has a significant effect on dry density, factors A (fly ash content) and C (foaming agent dilution ratio) have non-significant effects on dry density, and the order of factor significance is B > D > C > A.
For the compressive strength of foamed concrete, the minimum mean square (Mimin = 0.064) was selected as the error term; for compressive strength, the relationship 1.00 < 2.41 < F0.05(3,3) = 9.28 < 20.13 < 28.66 < F0.05(3,3) = 29.46 indicates that factors B (foam content) and D (water–binder ratio) have significant effects on compressive strength, factors A (fly ash content) and C (foaming agent dilution ratio) have non-significant effects on compressive strength, and the order of factor significance is B > D > C > A.
4.4. Selection of Optimal Mix Proportion
For factor A (fly ash content), the optimal level for the dry density of foamed concrete with the addition of foam stabilizer is A4, while the optimal level for compressive strength is A2. When the fly ash content is low, it has little effect on the dry density of foamed concrete. When the dry density difference is minimal, improving compressive strength should be the primary consideration. Therefore, factor A (fly ash content) should adopt the A2 level, i.e., the fly ash content is 5%.
For factor B (foam content), the optimal level for the dry density of foamed concrete with the addition of foam stabilizer corresponds to B4, while the optimal level for compressive strength corresponds to B1. As shown in Figure 7, increasing the foam content can effectively reduce the dry density of foamed concrete. Therefore, factor B (foam content) should adopt the B4 level, i.e., the foam content is 18%.
For factor C (foaming agent dilution ratio), the optimal level for the dry density of foamed concrete with the addition of foam stabilizer corresponds to C4, while the optimal level for compressive strength corresponds to C2. At the C4 level, the dry density decreases significantly, whereas the compressive strength shows no obvious change. Therefore, comprehensively considering both factors, factor C (foaming agent dilution ratio) should be selected at the C4 level, i.e., the foaming agent dilution ratio is 30 times.
For factor D (water–binder ratio), the optimal level for the dry density of foamed concrete with the addition of foam stabilizer corresponds to D1, while the optimal level for compressive strength corresponds to D3. As shown in Figure 6 and Figure 7, factor D (water–binder ratio) has a significant effect on both the dry density and compressive strength of foamed concrete. Since the factor significantly influencing dry density aims to reduce it, factor D (water–binder ratio) should adopt the D1 level, i.e., the water–binder ratio is 0.55.
According to the analysis of variance, the significance order of factors influencing the dry density and compressive strength of foamed concrete is both B > D > C > A; therefore, the optimal scheme for preparing foamed concrete is A2B4C4D1, that is, fly ash content of 5%, foam content of 18%, foaming agent dilution ratio of 30 times, and water–binder ratio of 0.55.
5. Microstructural Analysis of Foamed Concrete
5.1. Microstructural Test Design
The internal pore morphology of foamed concrete is a key factor in its quality. Based on the optimal mix proportion of foamed concrete, this experiment individually varies the fly ash content, foam content, foaming agent dilution ratio, and water–binder ratio in sequence, and uses a ZEISS Sigma500 scanning electron microscope (SEM) (Carl Zeiss AG, Oberkochen, Germany,) to investigate the effects of each factor on the micro-pore morphology of foamed concrete, revealing the formation mechanism of foamed concrete from a microstructural perspective. The test matrix for the microstructural characteristics of foamed concrete is shown in Table 11. For ease of comparative study in each group, groups E2, F4, G4, and H4 all represent the optimal mix proportion group.
Table 11.
Microscopic properties test array of foam concrete.
Before the test, the foamed concrete specimens were dried and cut into flat sheet-like structures with a length and width of 0.5 cm each using a knife. The specimens were firmly bonded to a pin-type sample stage with conductive adhesive. As foamed concrete is a poor conductor, to prevent image distortion or deformation caused by the inability to timely discharge excess electrons on the sample surface (leading to repeated charging or discharging) during the test, gold sputtering treatment was performed on the specimens before placing them into the sample chamber to enhance surface conductivity. After sputtering, an air gun was used to remove any debris of foamed concrete from the pin-type sample stage, which was then placed into the sample chamber. A reasonable magnification was first selected to analyze the pore morphology and patterns of the foamed concrete, followed by increasing the magnification to observe the microstructural characteristics of its hydration products.
5.2. Microstructural Pore Morphology Analysis of Foamed Concrete
The microstructural pore morphology of foamed concrete prepared with the optimal mix proportion is shown in Figure 9. The pore size distribution is uniform, with most pores ranging between 200 μm and 500 μm. The pores exhibit well-preserved morphology, and the thickness of the pore walls between adjacent pores is mostly between 20 μm and 30 μm, with uniform thickness. Almost no connected pores are observed, and only a few pores show slight damage.
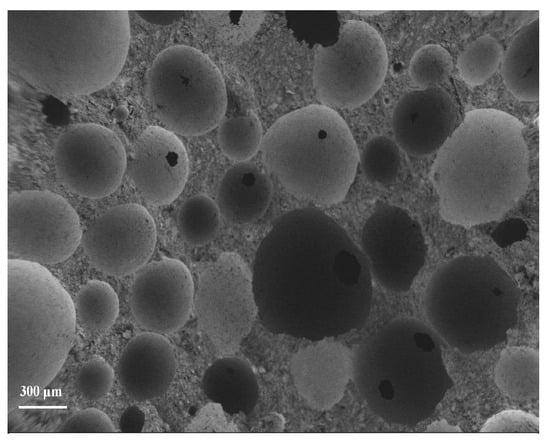
Figure 9.
Pore morphology under the optimal mix proportion.
5.2.1. Influence of Fly Ash on Pore Morphology
The variation in pore morphology of foamed concrete with fly ash content is shown in Figure 10. As can be seen from the figure, when the fly ash content is 0%, the pore size of foamed concrete is not uniform: some pores are far apart with thick walls, while some pores are severely damaged, forming many connected pores, resulting in poor pore structure quality. When the fly ash content is 5% and 10%, there is no significant change in pore diameter compared to 0%, with most pores ranging between 300 μm and 500 μm, but the pore distribution is more uniform. At 10% fly ash content, the number of pores is higher than at 5%, but a small number of slightly damaged pores also appeared. When the fly ash content reaches 15%, larger pores form in the foamed concrete, with the maximum pore diameter reaching 1424 μm, accompanied by significantly damaged pores.
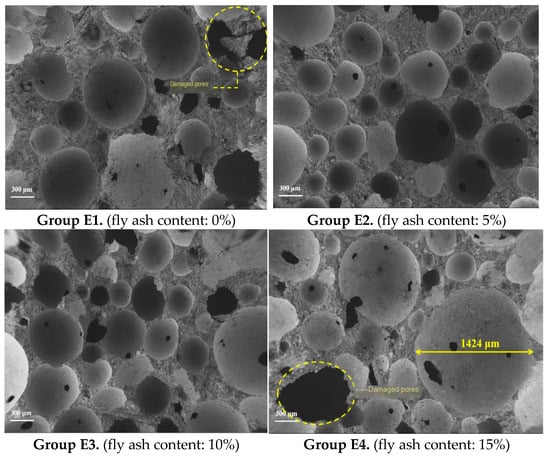
Figure 10.
Pore morphology with fly ash as the variable.
As the fly ash content increases, the pore structure of foamed concrete exhibits a trend of more uniform distribution. When the fly ash content is 15%, although the pore diameter varies significantly, the pores are densely arranged, without the phenomenon of excessively large pore spacing and fewer pores observed at 0% fly ash content. During the setting and hardening of the foamed concrete paste, pore damage occurs when the strength of the pores cannot withstand the shrinkage deformation, forming irregular hole structures. If pore damage occurs in the late stage of cement setting and hardening, connected pores will form.
5.2.2. Influence of Foam Content on Pore Morphology
The variation in pore morphology of foamed concrete with foam content is shown in Figure 11. As can be seen from the figure, with the increase in foam content, the changes in the number and diameter of pores in foamed concrete are relatively obvious. When the foam content is 9%, the pore distribution in foamed concrete is relatively dispersed, most pore diameters are approximately 300 μm, a large amount of set and hardened cement exists between pores, the walls between adjacent pores are thick, and the pores are obviously in an unsaturated state. When the foam content is 12%, the number of pores increases significantly, and the pore number is basically in a saturated state as observed from the micrographs, with pore diameters mostly within 300 μm and no large-diameter pores appearing. When the foam content is 15%, the number and distribution of pores in foamed concrete show little difference from those at 12% foam content, but larger-diameter pores begin to appear, while a large number of smaller-diameter pores still exist. When the foam content reaches 18%, the number of larger-diameter pores in foamed concrete increases significantly and distributes uniformly.
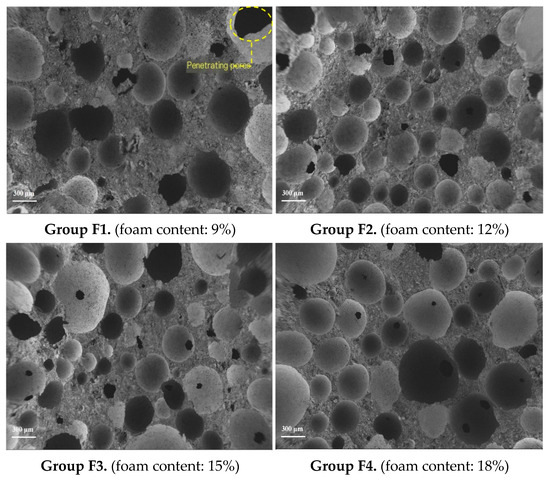
Figure 11.
Pore morphology with foam content as the variable.
5.2.3. Influence of Foaming Agent Dilution Ratio on Pore Morphology
The variation in pore morphology of foamed concrete with the foaming agent dilution ratio is shown in Figure 12 and as can be seen from the figure, when the foaming agent dilution ratio is 15 times, the pore morphology of the foamed concrete is relatively fragmented with poor uniformity in pore diameter and wall thickness, where larger pore diameters are accompanied by thinner wall thickness and more through-pores appear; when the dilution ratio is 20 times, the pore morphology of the foamed concrete is intact with most pore diameters ranging from 200 μm to 300 μm and uniform distribution; when the dilution ratio is 25 times, the pores of the foamed concrete are more dispersed with larger broken holes forming, some pores having larger spacing and more set and hardened cement structure between pores; when the dilution ratio is 30 times, the pore morphology is intact and similar to that at a dilution ratio of 20 times but with a larger pore diameter compared to the latter.
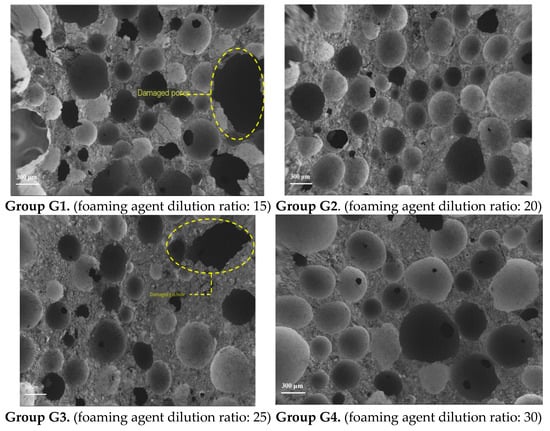
Figure 12.
Pore morphology with foaming agent dilution ratio as the variable.
5.2.4. Influence of Water-to-Binder Ratio on Pore Morphology
The variation in pore morphology of foamed concrete with the water-to-binder ratio is shown in Figure 13. As can be seen from the figure, when the water-to-binder ratio is 0.55 and 0.50, the pore morphology of foamed concrete shows little difference, with relatively intact pores, most of which have a diameter between 300 μm and 500 μm and are uniformly distributed. When the water-to-binder ratio is 0.45 and 0.40, the number of pores with a diameter within 200 μm in foamed concrete increases significantly, and more broken pores appear.
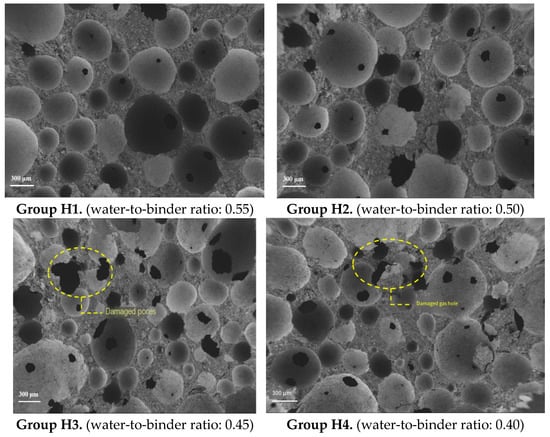
Figure 13.
Pore morphology with water-to-binder ratio as the variable.
5.3. Formation Mechanism of Foamed Concrete
The aggregate composition of foamed concrete differs from that of ordinary concrete. In ordinary concrete, fine aggregates that resist shrinkage deformation during setting and hardening exhibit good stability, while in foamed concrete, this part is replaced by air bubbles formed by foaming agents through air compression. When the bubble quality is good, the pore structure of foamed concrete can withstand a certain degree of shrinkage deformation; when the bubble quality is poor, the pore structure is more prone to cracking. Therefore, when the density of foamed concrete is high, the content of ettringite generated by cement hydration is higher, providing better internal strength constraints for the structure. When the density of foamed concrete is low, with the increase in the proportion of pore structure, the internal strength constraints of the structure are reduced, making foamed concrete more prone to form collapse at lower densities.
Under the optimal mix proportion of foamed concrete, its microstructure is shown in Figure 14. It can be seen from the figures that cement forms a dense structure under the action of CSH (calcium silicate hydrate), and there are partially unhydrated fly ash particles. These particles can alter the pore structure of foamed concrete by filling the pores, which helps reduce the dry density of foamed concrete.
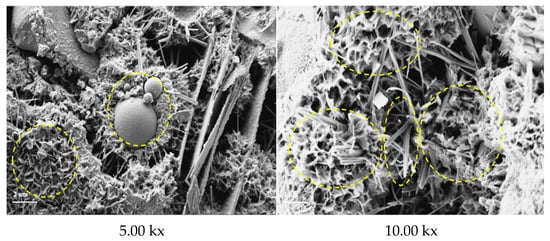
Figure 14.
Microstructure of optimal mix proportion sample.
In foamed concrete, the addition of light aggregates such as fly ash can provide a certain degree of supporting effect by adsorbing onto the skeletal structure, restricting shrinkage during the setting and hardening process to reduce its dry density. Meanwhile, the incorporation of fly ash decreases the density of the foamed concrete paste, thereby leading to an increase in flowability. After molding, the structure is relatively porous, and the unhydrated fly ash particles are not closely bonded to the cement hydration products, which can facilitate rapid migration of moisture within the paste.
As fly ash hardly participates in hydration reactions in the early stage, only ordinary Portland cement is involved in the hydration reaction during the setting and hardening of foamed concrete paste. The hydration reactions of Portland cement in the foamed concrete paste during setting and hardening are as follows:
- (1)
- In Portland cement, C3S (3CaO·SiO2) and C2S (2CaO·SiO2) react immediately upon mixing with water to form hydrates, yielding C-S-H gel and calcium hydroxide, where C3S is characterized by fast reaction rate and substantial heat release, while C2S exhibits slightly slower hydration rate and less heat release compared to C3S; calcium hydroxide generated from their hydration reactions precipitates as plate-like crystals after saturation, with C-S-H gel appearing as colloidal particles.
- (2)
- In Portland cement, C3A reacts with the set regulator (gypsum) under temperature influence to form AFt (ettringite), also known as calcium trisulfoaluminate hydrate. When all the set regulators in the Portland cement are consumed, part of the AFt begins to transform into AFm crystals, with AFm being termed monosulfate calcium sulfoaluminate hydrate.
As circled in Figure 14, during the setting and hardening of foamed concrete paste, hydration products such as C-S-H gel, calcium hydroxide, AFt (ettringite), and AFm (monosulfate calcium sulfoaluminate hydrate) form around the air bubbles, creating foamed concrete with a porous structure. The mechanical properties of foamed concrete are provided by the combined action of hydration products and the pore structure.
Favorable pore morphology can effectively reduce the dry density of foamed concrete and significantly enhance its compressive strength. Since cement initiates hydration immediately upon mixing with water, the preparation of foamed concrete requires not only the selection of a rational mix proportion but also strict control of the mixing duration between foam and cement paste, ensuring that the hardened foamed concrete exhibits optimal pore morphology.
6. Engineering Application
In the construction of prefabricated stations, the on-site prefabrication processes of the foam concrete inner formwork project mainly include the mixing of foam concrete, formwork installation, concrete pouring, and curing. The production process is shown in Figure 15.
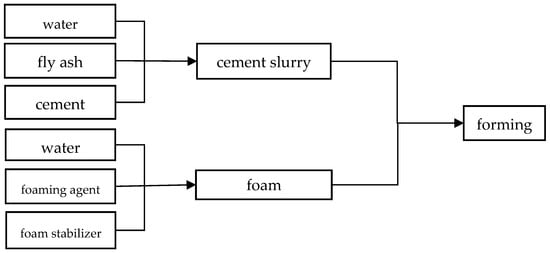
Figure 15.
Production process of foam concrete inner formwork.
During construction, a special area will be designated for the preparation of foam concrete. The foam concrete slurry will be transported to the pouring location before initial setting. During transportation, it will be ensured that the foam concrete slurry meets the specified fluidity and uniformity, and no laitance (bleeding) will appear on the surface of the slurry. The foaming agent will be diluted according to the specified dilution ratio and prepared in line with the required amount of foam concrete. The diluted foaming agent will not be reused. When mixing the foam concrete slurry with foam, the rotational speed of the mixer will be 90 r/min, and the mixing time will be more than 3 min and less than 5 min.
During the casting and forming of foam concrete, the production of test specimens will comply with the requirements of standards such as “Foam Concrete” (JG/T 266-2011) and “Test Methods for Foam Concrete and Its Products” (GB/T 43487-2023). 100 mm × 100 mm × 100 mm cubic specimens will be used, with six specimens per group. Random sampling will be conducted at the pouring site, and forming will be completed within 15 min. After compaction by vibration or manual tamping, the specimens will first stand for 24 ± 2 h (which can be extended when the strength is low), then undergo standard curing in an environment with a temperature of (20 ± 2) °C and relative humidity >95% until reaching 28 days of age. For special projects such as metro projects, additional tests on frost resistance, fluidity, etc., are required. The compliance of relevant indicators in the Shenzhen Metro project has verified the effectiveness of this specification.
To enhance the strength of foam concrete and resist stress concentration during pouring, a layer of galvanized steel wire mesh will be laid inside the steel formwork prior to pouring. The mesh must be free of rust, with adjacent meshes overlapping by 50 mm and secured with iron wire. Foam concrete will be poured by pumping, and the pumping pressure will be adjusted according to the pipeline conveying distance. Direct spraying onto the formwork surface or top-down spraying is strictly prohibited. Instead, the nozzle of the pouring pipe will be obliquely inserted into the foam concrete, and the pouring will proceed from the center to the periphery to minimize foam rupture. Photos of the prefabrication and application sites are presented in Figure 16.
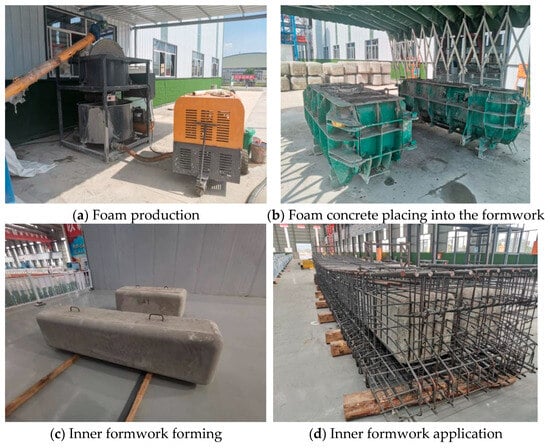
Figure 16.
Prefabrication and application of foam concrete.
The quality and allowable deviations in the foam concrete inner formwork for the background project are presented in Table 12. For this project, the foam concrete inner formwork exhibits a compressive strength of 2.2 MPa, a density of 553 kg/m3, and forming standard deviations of ±4 mm, all of which meet the project requirements specified in Table 12.
Table 12.
Quality and allowable deviations in inner formwork.
7. Conclusions
- (1)
- The fly ash content (A) has the lowest significance in influencing the dry density of foamed concrete. The foam content (B) has the highest significance in influencing the dry density of foamed concrete. When the foaming agent dilution ratio (C) is 15 times and 20 times, the dry density of foamed concrete shows almost no change; when the dilution ratio increases to 30 times, its dry density decreases significantly. When the water–binder ratio (D) is adjusted from 0.50 to 0.45, the dry density of foamed concrete shows a relatively significant increasing trend.
- (2)
- When the fly ash content (A) increases from 0% to 5%, the compressive strength of foamed concrete increases slightly; when it increases from 5% to 15%, the compressive strength shows a downward trend. The foam content (B) is the most significant factor affecting the compressive strength of foamed concrete, and the compressive strength of foamed concrete decreases with the increase in foam content. The dilution ratio of foaming agent (C) has no significant effect on the compressive strength of foamed concrete, and the effect of water–binder ratio (D) on the compressive strength of foamed concrete is consistent with its effect on the dry density of foamed concrete.
- (3)
- According to the results of variance analysis, the primary-to-secondary order of factors influencing the dry density and compressive strength of foamed concrete is consistently B > D > C > A. Considering the comprehensive effects of fly ash content (A), foam content (B), foaming agent dilution ratio (C), and water–binder ratio (D) on both the dry density and compressive strength, the optimal mix proportion for foamed concrete is determined as follows: 5% fly ash content, 18% foam content, 30-fold dilution of the foaming agent, and a water–binder ratio of 0.55.
- (4)
- Mix proportion has a significant effect on the microscopic pore morphology of foamed concrete. Under the optimal mix proportion, the pore diameter ranges from 200 μm to 500 μm, with uniform size and relatively intact morphology. The pore spacing is mostly between 20 μm and 30 μm, with almost no interconnected pores and only minor damage observed in a few pores. Foamed concrete with other mix proportions exhibits irregular pore sizes, larger pore spacing, pore damage, and other issues to varying degrees.
- (5)
- During the setting and hardening of foamed concrete paste, hydration products such as C-S-H gel, calcium hydroxide, AFt (ettringite), and AFm (monosulfate calcium sulfoaluminate hydrate) form around the air bubbles, creating foamed concrete with a porous structure. The mechanical properties of foamed concrete are collectively provided by the synergistic action of hydration products and the pore structure. Partially unhydrated fly ash particles can alter the pore structure of foamed concrete by filling the pores, contributing to reducing its dry density.
- (6)
- The Phase IV Project of Shenzhen Metro Line 3 comprises seven stations and one parking lot. Pingxi Station adopts a fully prefabricated structure, assembled from eight precast concrete components with an internal middle slab. Owing to the particularity of the inner cavity of the precast components, lightweight foam concrete is employed as the permanent internal formwork. This formwork has a compressive strength of 2.2 MPa, a density of 553 kg/m3, and a forming dimensional deviation of ±4 mm, with all indicators meeting engineering requirements. Compared with wooden formwork and inflatable rubber formwork, it better meets construction requirements such as light weight and high load-bearing capacity, while also being eco-friendly. Additionally, this material is widely utilized in fields including building walls and roofs, civil engineering backfilling, municipal pipeline protection, and green prefabricated buildings.
Author Contributions
Conceptualization, B.L. and C.Z.; methodology, X.D.; software, B.L. and R.L.; validation, B.L., C.Z. and X.D.; formal analysis, D.S.; investigation, B.L. and X.D.; resources, B.L.; data curation, B.L. and R.L.; writing—original draft preparation, B.L.; writing—review and editing, X.D. and L.M.; visualization, D.S.; supervision, Y.Q.; project administration, L.M. and Y.Q.; funding acquisition, X.D. All authors have read and agreed to the published version of the manuscript.
Funding
This study was supported by the Science and Technology Program of Shandong Provincial Department of Transportation (No. 2024B114) and the National Natural Science Foundation of China (No. 52208265), Shandong Key Laboratory of Technologies and Systems for Intelligent Construction Equipment, Jinan 250357, China.
Data Availability Statement
The data supporting the findings of this study are included within the article. Further inquiries can be directed to the corresponding authors.
Conflicts of Interest
Authors Yuanhui Qiao, Lingqiang Meng were employed by the company China Railway 14th Bureau Group Corporation Limited. Authors Lingqiang Meng was employed by the company Tiezheng Testing Technology Co., Ltd. The remaining authors declare that the research was conducted in the absence of any commercial or financial relationships that could be construed as a potential conflict of interest.
Correction Statement
This article has been republished with a minor correction to the Data Availability Statement. This change does not affect the scientific content of the article.
References
- Zhang, W.-H.; Yang, F.-H.; Lü, Y.-J.; Wu, P.-P.; Zeng, W.-Z.; Xu, G.-D. Research Progress on Foam Stabilization Measures and Mechanisms of Foam Concrete. J. Chin. Ceram. Soc. 2021, 49, 2266–2275. [Google Scholar]
- Zhang, L.L. Study on Composition, Performance and Microstructure of Foam Concrete. Master’s Thesis, China Building Materials Academy, Beijing, China, 2011. [Google Scholar]
- Shill, S.K.; Garcés, E.O.; Al-Deen, S.; Subani, M. The effect of foam content and concentration on the physical and mechanical properties of foam concrete. Appl. Sci. 2024, 14, 8385. [Google Scholar] [CrossRef]
- Hu, J.-C. Study on the Properties of Nano-Material Modified Cement-Fly Ash Based Foam Concrete. Master’s Thesis, Wuhan University of Technology, Wuhan, China, 2019. [Google Scholar]
- Wang, D.; Xu, Z.; Yu, Y.; Xu, N.; Li, C.; Tian, X.; Wang, H.; Shi, F.; Xia, K. Influence of Carbonized Garbage Fly Ash on the Performance of Foam Concrete. Coatings 2025, 15, 736. [Google Scholar] [CrossRef]
- Gon, Y.; Liu, C.; Zhao, Z.; Wu, Z.; Wu, B. Effect of alkaline activators and mineral admixtures on the properties of alkali-activated recycled concrete powder foam concrete. Materials 2025, 18, 2567. [Google Scholar]
- Fan, K.; Wei, J.; Feng, C. Fundamental Properties of Expanded Perlite Aggregated Foamed Concrete with Different Supplementary Cementitious Materials. Materials 2025, 18, 2671. [Google Scholar] [CrossRef]
- Kang, C.; Seo, K.-Y.; Park, Y.-M.; Kim, T. Characteristics of Lightweight Foam Concrete Manufactured Using Water-Soluble Polymers and Lightweight Aggregates. Materials 2025, 18, 1881. [Google Scholar] [CrossRef]
- Motadi, A.; Ghomeishi, M.; Dehghanbanadaki, A. Toward Sustainable Construction: Assessing Thermal Conductivity in Advanced Foam Concrete Mixtures. Buildings 2024, 14, 3636. [Google Scholar] [CrossRef]
- Liu, F.; Zhao, L.; Yuan, L.; Wu, G.; Zheng, R.; Mu, Y. Study on Flexural Performance of Basalt Fiber Reinforced Steel-Expanded Polystyrene Foam Concrete Composite Wall Panels. Buildings 2025, 15, 285. [Google Scholar] [CrossRef]
- Wang, S. Preparation and Performance Study on TRC Laminated Low-Density Foam Concrete Composite Wall Panels. Master’s Thesis, Fuzhou University, Fuzhou, China, 2021. [Google Scholar]
- Mao, J.; Xu, Y.; Kang, X.; Tong, S.; Chu, H.; Jiang, L. The Production and Durability of Superhydrophobic Foamed Concrete. Materials 2025, 18, 663. [Google Scholar] [CrossRef] [PubMed]
- Liu, Y.-L.; Liu, C.; Qian, L.-P.; Wang, A.-G.; Sun, D.-S.; Guo, D. Foaming Processes and Properties of Geopolymer Foam Concrete: Effect of the Activator. Constr. Build. Mater. 2023, 391, 131830. [Google Scholar] [CrossRef]
- Fan, D.-Q.; Lu, J.-X.; Liu, K.-N.; Pan, Z.-S. Design, Preparation, and Macro-Micro Properties of High-Strength CO2 Foam Concrete. J. Chin. Ceram. Soc. 2025, 53, 1193–1204. [Google Scholar]
- Li, H.R. Study on Optimization Design and Performance of High-Stability Foaming Agent and Foam Concrete. Master’s Thesis, Nanjing University of Aeronautics and Astronautics, Nanjing, China, 2014. [Google Scholar]
- Chen, S.H. Study on Volume Stability and Mechanical Properties of Foam Concrete. Master’s Thesis, Nanjing University of Aeronautics and Astronautics, Nanjing, China, 2016. [Google Scholar]
- Yang, Y.; Li, M.; He, Q.; Liao, C. Study on the Properties and Pore Structure of Geopolymer Foam Concrete Incorporating Lead–Zinc Tailings. Buildings 2025, 15, 1703. [Google Scholar] [CrossRef]
- Abdellatief, M.; Mortagi, M.; Hamouda, H.; Skrzypkowski, K.; Zagórski, K.; Zagórska, A. Influence of Silicate Modulus and Eggshell Powder on the Expansion, Mechanical Properties, and Thermal Conductivity of Lightweight Geopolymer Foam Concrete. Materials 2025, 18, 2088. [Google Scholar] [CrossRef] [PubMed]
- Wang, W.-J. Preparation and Characterization of Graphene Oxide-Reinforced Geopolymer Foam Concrete Materials. Master’s Thesis, Hunan University, Hunan, China, 2022. [Google Scholar]
- Huang, W.; Liu, J.; Shi, Q.; Niu, W. Mechanical and Pore Properties of Foam Concrete Under Salt Erosion Environment. Materials 2025, 18, 2810. [Google Scholar] [CrossRef]
- Xie, H.Y.; Dai, Y.W.; Ren, Y.H.; Deng, Y. Effects of Multiple Factors and Dry-Wet Cycles on the Properties of Foam Concrete. China Powder Sci. Technol. 2023, 29, 125–134. [Google Scholar]
- Ma, C.; Wang, J.; Zhang, N.; Wang, C.; Zhang, S.; Tao, Y.; Lou, S.; Sun, Q.; Ren, X.; Zhang, H. Shear Strength and Ultimate Bearing Capacity of Silt-Based Foamed Concrete Under Local Vertical Loading. Buildings 2025, 15, 1914. [Google Scholar] [CrossRef]
- Li, R.; Ding, Z.; Wang, S.; Huang, J.; Zhu, C. Experimental Study on the Interfacial Shear Behavior Between ECC and Foamed Concrete. Buildings 2025, 15, 1582. [Google Scholar] [CrossRef]
- Wang, Y.; Tian, M.; Theogene, S.; Wang, J.; Lv, B.; Zhang, X.; Gong, H.; Zhang, H.; Liu, Y. Strength Characteristics of Polypropylene Fiber-Modified Rubber Foamed Concrete. Buildings 2025, 15, 1663. [Google Scholar] [CrossRef]
- Palamarchuk, A.; Yudaev, P.; Chistyakov, E. Polymer Concretes Based on Various Resins: Modern Research and Modeling of Mechanical Properties. J. Compos. Sci. 2024, 8, 503. [Google Scholar] [CrossRef]
- Gao, Y.; Luo, J.; Zhang, J.; Ejaz, M.A.; Liu, L. Advances in Nano-Reinforced Polymer-Modified Cement Composites: Synergy, Mechanisms, and Properties. Buildings 2025, 15, 2598. [Google Scholar] [CrossRef]
- El-Mir, A.; Tannouri, P.; Assaad, J.J.; Nasr, D.; Ghannoum, M.; Barraj, F.; El-Hassan, H. Performance Optimization of SBR-Modified Pervious Composite Incorporating Recycled Concrete Aggregates. J. Compos. Sci. 2025, 9, 372. [Google Scholar] [CrossRef]
Disclaimer/Publisher’s Note: The statements, opinions and data contained in all publications are solely those of the individual author(s) and contributor(s) and not of MDPI and/or the editor(s). MDPI and/or the editor(s) disclaim responsibility for any injury to people or property resulting from any ideas, methods, instructions or products referred to in the content. |
© 2025 by the authors. Licensee MDPI, Basel, Switzerland. This article is an open access article distributed under the terms and conditions of the Creative Commons Attribution (CC BY) license (https://creativecommons.org/licenses/by/4.0/).