Article

First-Order Structural Modal Damping Ratio Identification by Withdrawing Amplitudes of Free Decaying Responses

1
School of Civil Engineering, Shaoxing University, Shaoxing 312000, China
2
School of Civil and Transportation Engineering, Ningbo University of Technology, Ningbo 315211, China
*
Author to whom correspondence should be addressed.
Coatings 2025, 15(8), 962; https://doi.org/10.3390/coatings15080962
Submission received: 7 July 2025 / Revised: 1 August 2025 / Accepted: 12 August 2025 / Published: 19 August 2025
(This article belongs to the Section Surface Characterization, Deposition and Modification)

Abstract

In the field of structural engineering, accurate identification of modal damping ratio is the key to structural dynamic response analysis. In order to accurately identify the modal damping ratio of the structure, this study proposes a method to identify the first-order modal damping ratio of the structure by analyzing the free attenuation response of the acceleration signal. By intercepting the free attenuation section from the structural dynamic response output, the amplitude is extracted, and the logarithmic estimation slope of the amplitude is fitted by the least square method to establish a theoretical model for identifying the first-order modal damping ratio. The results show that the method has high accuracy and good stability when the modal damping ratio is in the range of 0.00500~0.06400, and different nodes have little effect on the accuracy of identification. When the modal damping ratio is in the range of 0.06400~0.07000, the accuracy of the method is relatively low and the stability is relatively poor, but it is still within the acceptable range. When the damping ratio is greater than 0.07000 or less than 0.00500, the accuracy may be reduced. In order to further verify the effectiveness of the method, it is applied to the damping identification of a steel arch bridge project. The dynamic response of the bridge under random excitation and El Centro seismic wave excitation is analyzed by using the recommended value and identification value of the first-order damping ratio. The results show that the method can accurately and reliably identify the first-order modal damping ratio, which is significantly different from the empirical modal damping ratio. The identified modal damping ratio can more accurately describe the dynamic response of the structure after long-term use, while the recommended value is not applicable. This method can be applied to the modal damping ratio identification of other structural types, which reflects that the modal damping ratio identification method proposed in this study has certain engineering significance. It is worth noting that the accuracy of identification will be reduced when the modal damping ratio is less than 0.00500 or more than 0.07000, and it may not even be applicable if the modal damping ratio is too small or too large. This method has higher requirements for acceleration signals. In engineering, it may be affected by noise and other factors, resulting in reduced identification accuracy. In practical engineering, it is necessary to improve the identification accuracy of first-order modal damping ratio by changing the interception point of the free attenuation section of the acceleration signal and the screening of the amplitude.

1. Introduction

In structural engineering, to accurately evaluate the impact of dynamic loads such as wind and earthquakes on structures, it is necessary to accurately grasp the dynamic characteristics of the structure, such as natural frequency, mode shape, and modal damping ratio [1,2,3,4,5]. In the dynamic response analysis of structures, the overall mass matrix and overall stiffness matrix determined by the geometric structure of the structure can be used to calculate the natural frequency and modal shape of the structure [6], which can be accurately identified [7,8,9]. As a key parameter characterizing the energy dissipation capacity of the system, the modal damping ratio has a decisive influence on the response characteristics of engineering structures (such as buildings and bridges) under dynamic loads [10,11,12]. However, the modal damping ratio of the structure is difficult to determine [13,14]. In design, we usually adopt a subjective value as the modal damping ratio of the structure, which can be manually set in existing structural design software [15,16], design software such as Midas Civil. However, many studies have shown [17,18,19,20] that the modal damping ratio of the structure is not constant and can change due to many factors. This indicates that the conclusions obtained from dynamic analysis of structures using empirical modal damping ratios are not accurate enough. Therefore, research on the accurate identification methods of modal damping ratio is of great significance in engineering.
There are many methods for identifying structural modal damping ratios, which can generally be classified into frequency domain methods and time domain methods. Frequency domain methods identify damping by analyzing the frequency response function (FRF) of the system, which describes the system’s response under different frequency excitations [21]. They have unique advantages in damping identification, such as noise resistance [21,22], non-parametric identification [23], and ease of extracting modal parameters [24]. However, they also have many disadvantages. Frequency domain methods are mainly applicable to linear systems. For nonlinear systems, the FRF curve will distort, leading to inaccurate damping identification results [25]. Although some frequency domain methods can be used for nonlinear system identification, their complexity and applicability are limited [26]. For large and complex systems, the calculation of FRF data and modal parameter identification require significant computational resources [27]. The frequency resolution of frequency domain analysis is limited by the sampling frequency and data length. If the frequency resolution is insufficient, the damping may not be accurately identified [28]. The half-power bandwidth method is one of the most commonly used frequency domain methods [29], which calculates the modal damping ratio by using the frequency difference between the left and right half-power points of the frequency domain signal and the frequency of the peak point of the signal [30]. This method is simple to calculate and widely applied [31], and can directly use the experimentally measured FRF for damping identification [32]. The half-power bandwidth method was originally derived based on a single-degree-of-freedom system [33]. When applied to multi-degree of freedom systems, especially in cases of strong modal coupling, the accuracy of damping estimation will significantly decrease [34]. The frequency response curves of multi-degree of freedom systems may become complex, making it difficult to accurately identify the half-power points, thereby leading to deviations in the modal damping ratio estimation. Wu found that as the modal damping ratio increases, the peak of the frequency response curve becomes flattened, making the identification of the half-power points difficult and increasing the error [35]. Therefore, the half-power bandwidth method has lower accuracy in damping identification for high-damping structures. For slightly damped structures, the type of excitation (such as shakers or impact hammers) may affect the damping measurement results [36]. Time domain methods have their unique advantages in damping identification and have received extensive attention in recent years as an important identification means [37,38,39]. Compared with frequency domain identification methods, time domain methods have the advantages of simplicity, accuracy, and efficiency in analyzing the transient response of transmission lines [40]. The logarithmic decrement method is a commonly used time domain method, especially suitable for single-degree-of-freedom systems [41]. However, the applicability of the logarithmic decrement method is limited. It is mainly applicable to linear, time-invariant, and lightly damped single-degree-of-freedom systems. For systems with nonlinearity, time-varying, or heavy damping, the accuracy of this method will significantly decrease [41]. Moreover, the logarithmic decrement method has high requirements for data quality. Noise, measurement error, and non-ideal excitation conditions will affect the accuracy of amplitude measurement, resulting in the deviation of modal damping ratio estimation [42]. In high noise environments in particular, the accurate identification of signals becomes very difficult [43]. To reduce the influence of noise, sensitivity enhancement methods can be adopted [37]. The logarithmic decrement method can only provide an overall equivalent modal damping ratio and cannot reveal the complex damping mechanisms within the system, such as material damping, structural damping, and interface damping, etc. [44]. In response to the limitations of the logarithmic decrement method, researchers have proposed various improved and alternative methods, such as modal analysis [45,46], stochastic subspace [47], time-frequency analysis [48,49], etc. In recent years, researchers have continuously developed new damping identification methods to improve the accuracy and efficiency of identification. For instance, damping identification methods based on Bayesian methods [50,51], adaptive modal extended Kalman filter (AMEKF) for identifying the modal damping ratio of long-span bridges [52], Damping Identification by Sparse Decomposition (DISD) [53], and an improved Hilbert–Huang Transform (HHT) method for modal parameter identification in long-span bridges and high-rise buildings with closely spaced modes [54], as well as intelligent damping identification methods combining machine learning and signal processing techniques [55,56].
Based on the Rayleigh damping model, combined with frequency domain and time domain methods, this study proposes a method to identify the first-order modal damping ratio of the structure by analyzing the free attenuation response of the acceleration signal, which can accurately identify the first-order modal damping ratio of the structure and improve the reliability of structural dynamic analysis. Firstly, the free attenuation response section of the structural dynamic response output acceleration is intercepted, and the first-order natural frequency is obtained by Fourier transform. The first-order natural frequency obtained by Fourier transform is compared with the theoretical first-order natural frequency calculated by the mass matrix and stiffness matrix to verify the accuracy of the first-order natural frequency of the structure obtained by spectral analysis and indirectly verify the reliability of the selected acceleration signal. Secondly, the computer is used to extract each amplitude of the free attenuation section in the first quadrant of the coordinate. Through logarithmic processing of the amplitude coordinates, the logarithm of the amplitude envelope curve is fitted, and slope fitting is performed by the least square method to establish the first-order modal damping ratio identification model of the structure. The method of identifying the first-order modal damping ratio of the structure by analyzing the free attenuation response of the acceleration signal is proposed. Compared with other methods, the calculation process is simple and convenient, and has high accuracy, which is convenient for application in practical engineering. At the same time, this method is suitable for different types of structures and has certain engineering significance.

2. Establishment of Numerical Model

During the dynamic analysis of a structure, the global mass matrix, the global stiffness matrix, and the global damping matrix of the structure must be determined first. In the numerical simulation, it is necessary to use the state space theory to output the acceleration signal of the structural dynamic response and to identify the first-order modal damping ratio of the structure through the acceleration free decaying response segment. The software used is MATLAB R2019b.

2.1. Global Mass Matrix, Stiffness Matrix, and Damping Matrix

For beam elements, the element mass matrix under the local coordinate system is generally expressed as [57]
m e = ρ A l 420 140 0 0 70 0 0 0 156 22 l 0 54 13 l 0 22 l 4 l 2 0 13 l 3 l 2 70 0 0 140 0 0 0 54 13 l 0 156 22 l 0 13 l 3 l 2 0 22 l 4 l 2
The element stiffness matrix under the corresponding local coordinate system can be expressed as [58]
k e = E A l 0 0 E A l 0 0 0 12 E I l 3 6 E I l 2 0 12 E I l 3 6 E I l 2 0 6 E I l 2 4 E I l 0 6 E I l 2 2 E I l E A l 0 0 E A l 0 0 0 12 E I l 3 6 E I l 2 0 12 E I l 3 6 E I l 2 0 6 E I l 2 2 E I l 0 6 E I l 2 4 E I l
where A is the cross-sectional area, E is the elastic modulus, I is the cross-sectional moment of inertia, l is the element length, and ρ is the density.
The global mass matrix MZ under the global coordinate system can be constructed from the element mass matrix under the local coordinate system, and the global stiffness matrix KZ under the global coordinate system can be constructed from the element stiffness matrix under the local coordinate system [59].
In general, Rayleigh damping can be expressed as [60]
[ C ] = a 0 [ M ] + a 1 [ K ]
[ M ] and [ K ] are, respectively, the mass matrix and stiffness matrix of the global mass matrix and the global stiffness matrix in the overall coordinate system after boundary processing. a 0 and a 1 are two scale coefficients. After calculation, two coefficient expressions can be obtained [61]:
a 0 = 2 ξ ω 1 ω 2 ω 1 + ω 2
a 1 = 2 ξ ω 1 + ω 2
ω1 and ω2 denote the first-order frequency and the second-order frequency of the structure, respectively. ξ represents the modal damping ratio of the structure. For convenience, the preceding two modal damping ratios of the structure analyzed in this paper are given the same value.

2.2. State Space Theory

Since the measured structural output response is discrete with respect to time, the state space model of discrete systems is adopted [62,63,64].
Discrete the continuous time t into different time points: t = 0 , Δ t , 2 Δ , . At the kth sampling point,
X [ k ] = X ( k Δ t ) Y [ k ] = Y ( k Δ t ) P [ k ] = P ( k Δ t )
Then, the discrete system state space model of the system can be expressed as
X [ k + 1 ] = A 1 X [ k ] + B P [ k ] Y [ k ] = C 1 X [ k ] + D P [ k ]
where A1 is the state matrix of the discrete system, B is the input matrix of the discrete system, and C1 and D are the observation matrices of the state and input of the discrete system, respectively, and
X [ k + 1 ] = X ( k Δ t + Δ t )
Taking t = k Δ t as the initial time, at t = k Δ t + Δ t , it can be concluded that
X [ k + 1 ] = X ( k Δ t + Δ t )   = e A c Δ t X ( k Δ t ) + 0 Δ t   e A c ( Δ t τ ) B c P ( k Δ t + τ ) d τ   = e A c Δ t X [ k ] + 0 Δ t   e A c τ B c d τ P [ k ]
Y [ k ] = C c X [ k ] + D c P [ k ]
Let
A 1 = e A c Δ t B = 0 Δ t   e A c τ B c d τ = A c 1 ( A I 1 ) B c C 1 = C c = C d C a M 1 K C v C a M 1 C D = D c = C a M 1
where Δ t is the sampling period; C a , C v , and C d are acceleration output matrix, velocity output matrix, and displacement output matrix, respectively; A c is the state matrix of the structural continuous system; and B c is the input matrix of the structural continuous system.
A c = 0 I 1 M 1 K M 1 C , B c = 0 M 1
I 1 is the unit matrix, C is the damping matrix, and M and K are the overall mass matrix and the global stiffness matrix after the finite element boundary treatment.

2.3. Identification Model of First-Order Modal Damping Ratio

The free vibration of a structure is generally easy to realize. The homogeneous differential form of the motion equation of the structure can be expressed as
M λ ¨ ( t ) + C λ ˙ ( t ) + K λ ( t ) = 0
Assuming that the first-order vibration response is the main component of the vibration of the structure, then the reduced order form of Equation (13) can be expressed as
x ¨ ( t ) + 2 ξ ω 1 x ˙ ( t ) + ω 1 2 x ( t ) = 0
where ω1 represents the first-order natural circular frequency of the structure, which can be identified by performing fast Fourier transform (FFT) on the acceleration signal, and ξ represents the first-order modal damping ratio of the structure, which is the unknown parameter to be identified next, and can be identified by the acceleration time history curve under free vibration. The theoretical solution of Equation (14) is obtained as follows:
x ( t ) = X e ξ ω 1 t c o s ( 1 ξ 2 ω 1 t )
In Equation (15), X represents the initial value. The maximum value of trigonometric function is 1, which can be obtained
X e ξ ω 1 t X e ξ ω 1 t c o s ( 1 ξ 2 ω 1 t )
Thus, the envelope curve of the amplitudes of decaying acceleration signal is given by
x ( t ) = X e ξ ω 1 t
By taking the second-order derivative of Equation (17), that is, by taking the second-order derivative of the displacement, the envelope curve of the amplitude of the attenuation curve of the acceleration signal can be obtained:
x ¨ ( t ) = X ( ξ ω l ) 2 e ξ ω l t
Logarithmic processing on both sides of Equation (18) yields
l n ( x ¨ ( t ) ) = ξ ω 1 t + l n ( X ) + 2 l n   ξ ω 1
Obviously, the form of Equation (19) is y = kx + b, and the slope can be estimated by using the least square method. That is, the first-order modal damping ratio of the structure ξ is
ξ = k ω 1
After extracting the free attenuation segment of the structure’s acceleration, the first-order natural frequency ω 1 can be calculated through the Fourier transform. Then, a computer is used to extract each amplitude of the free attenuation segment in the first quadrant of the coordinates. By logarithmic processing of the amplitude coordinates and fitting the logarithm of the amplitude envelope curve, the slope k can be estimated using the least square method. Substituting it into Equation (20), the first-order modal damping ratio can be calculated.

3. Analysis of Numerical Simulation

The numerical simulation analysis steps of modal damping ratio identification model are as follows.
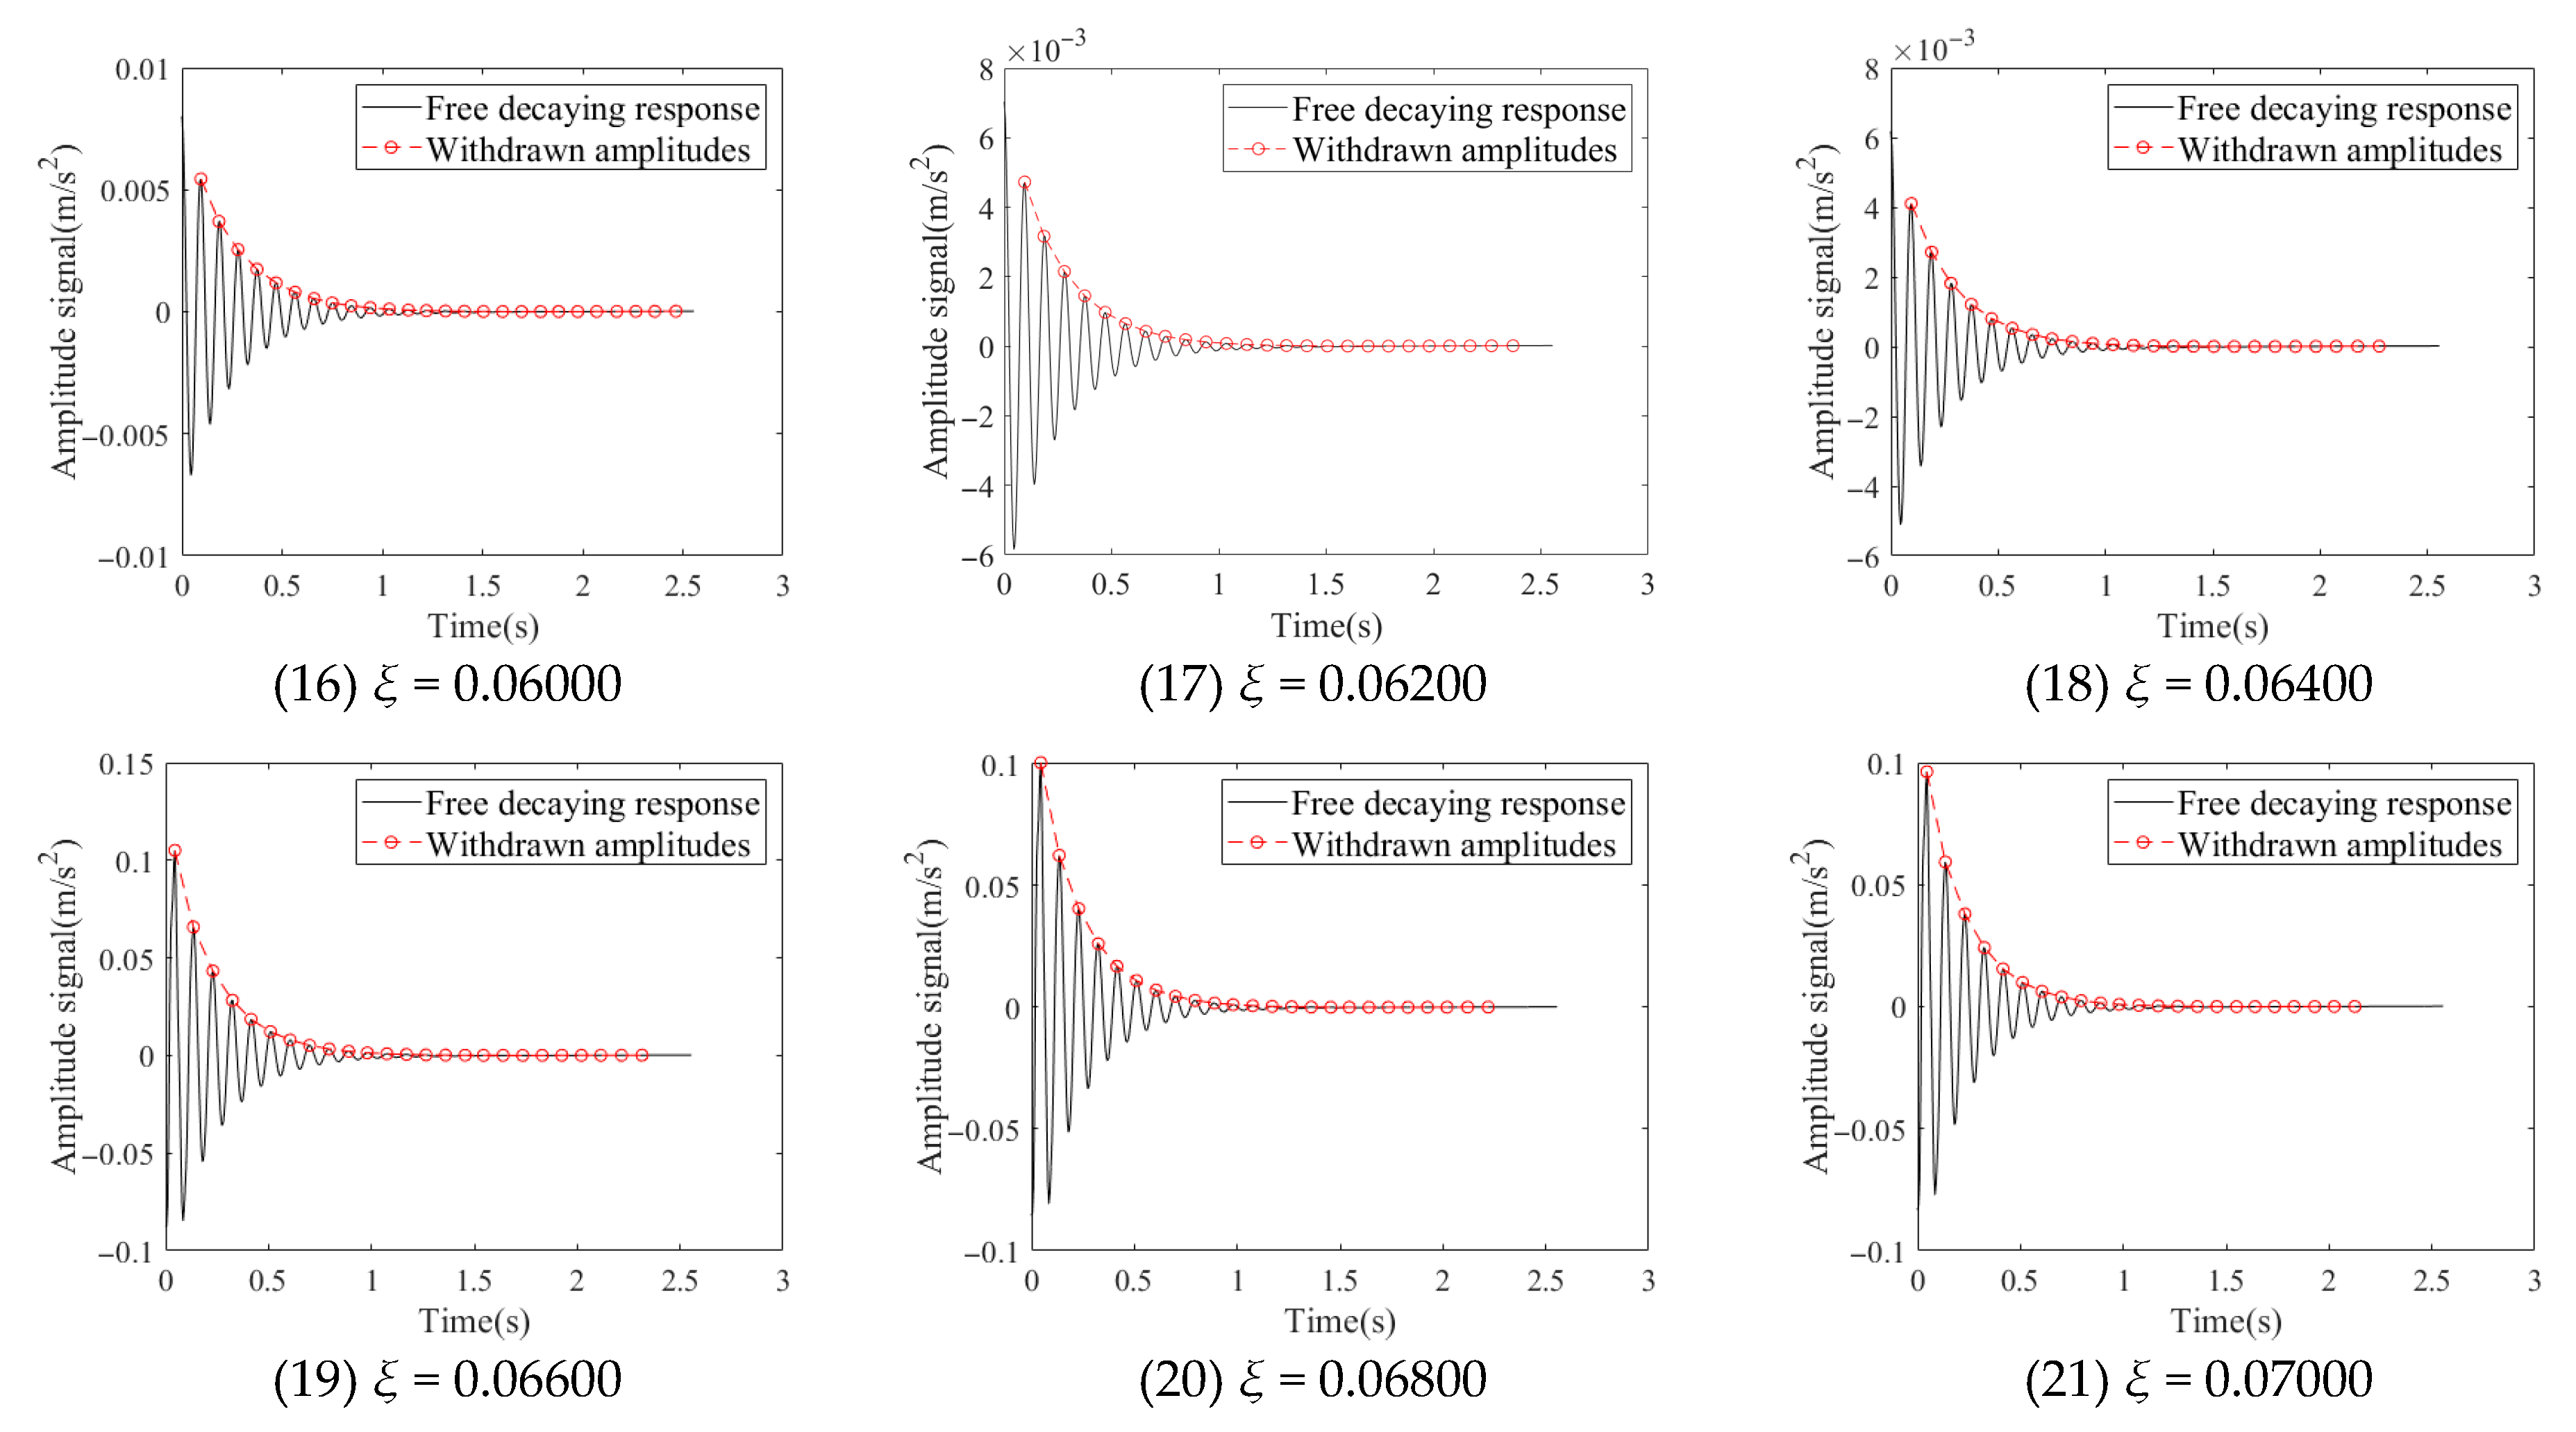
The damping matrix established using a set modal damping ratio is substituted into the state space theory to output the acceleration signal. The free decaying responses segment of the acceleration of the structure’s dynamic response output is intercepted, and amplitudes are withdrawn from the free decaying responses segment in the first quadrant of coordinates. The first natural frequency of the structure is obtained by fast Fourier transform of the intercepted acceleration free decaying response. The amplitudes and the first circular frequency ω1 of the structure are substituted into the first-order mode damping ratio identification model, and then the first-order mode damping ratio of the structure is identified by estimating the slope. The feasibility and accuracy of the identification method are analyzed by comparing the identification modal damping ratio with the set modal damping ratio.

3.1. Profile of Simulation

A simply supported beam shown in Figure 1 is taken as the numerical simulation example. The simply supported beam is spliced with high-performance steel plates, which dimensions of each cross-section are equal. Its material properties are shown in Table 1.
To facilitate finite element modeling and analysis, we discretized the simply supported beam into 10 beam elements, each with a length of 1.5 m.

3.2. Proposition of Set Modal Damping Ratios

In the numerical simulation, the set modal damping ratios of the simply supported beam under different cases are shown in Table 2.

3.3. Withdrawing Amplitudes of Free Decaying Responses and Calculation of Natural Frequency

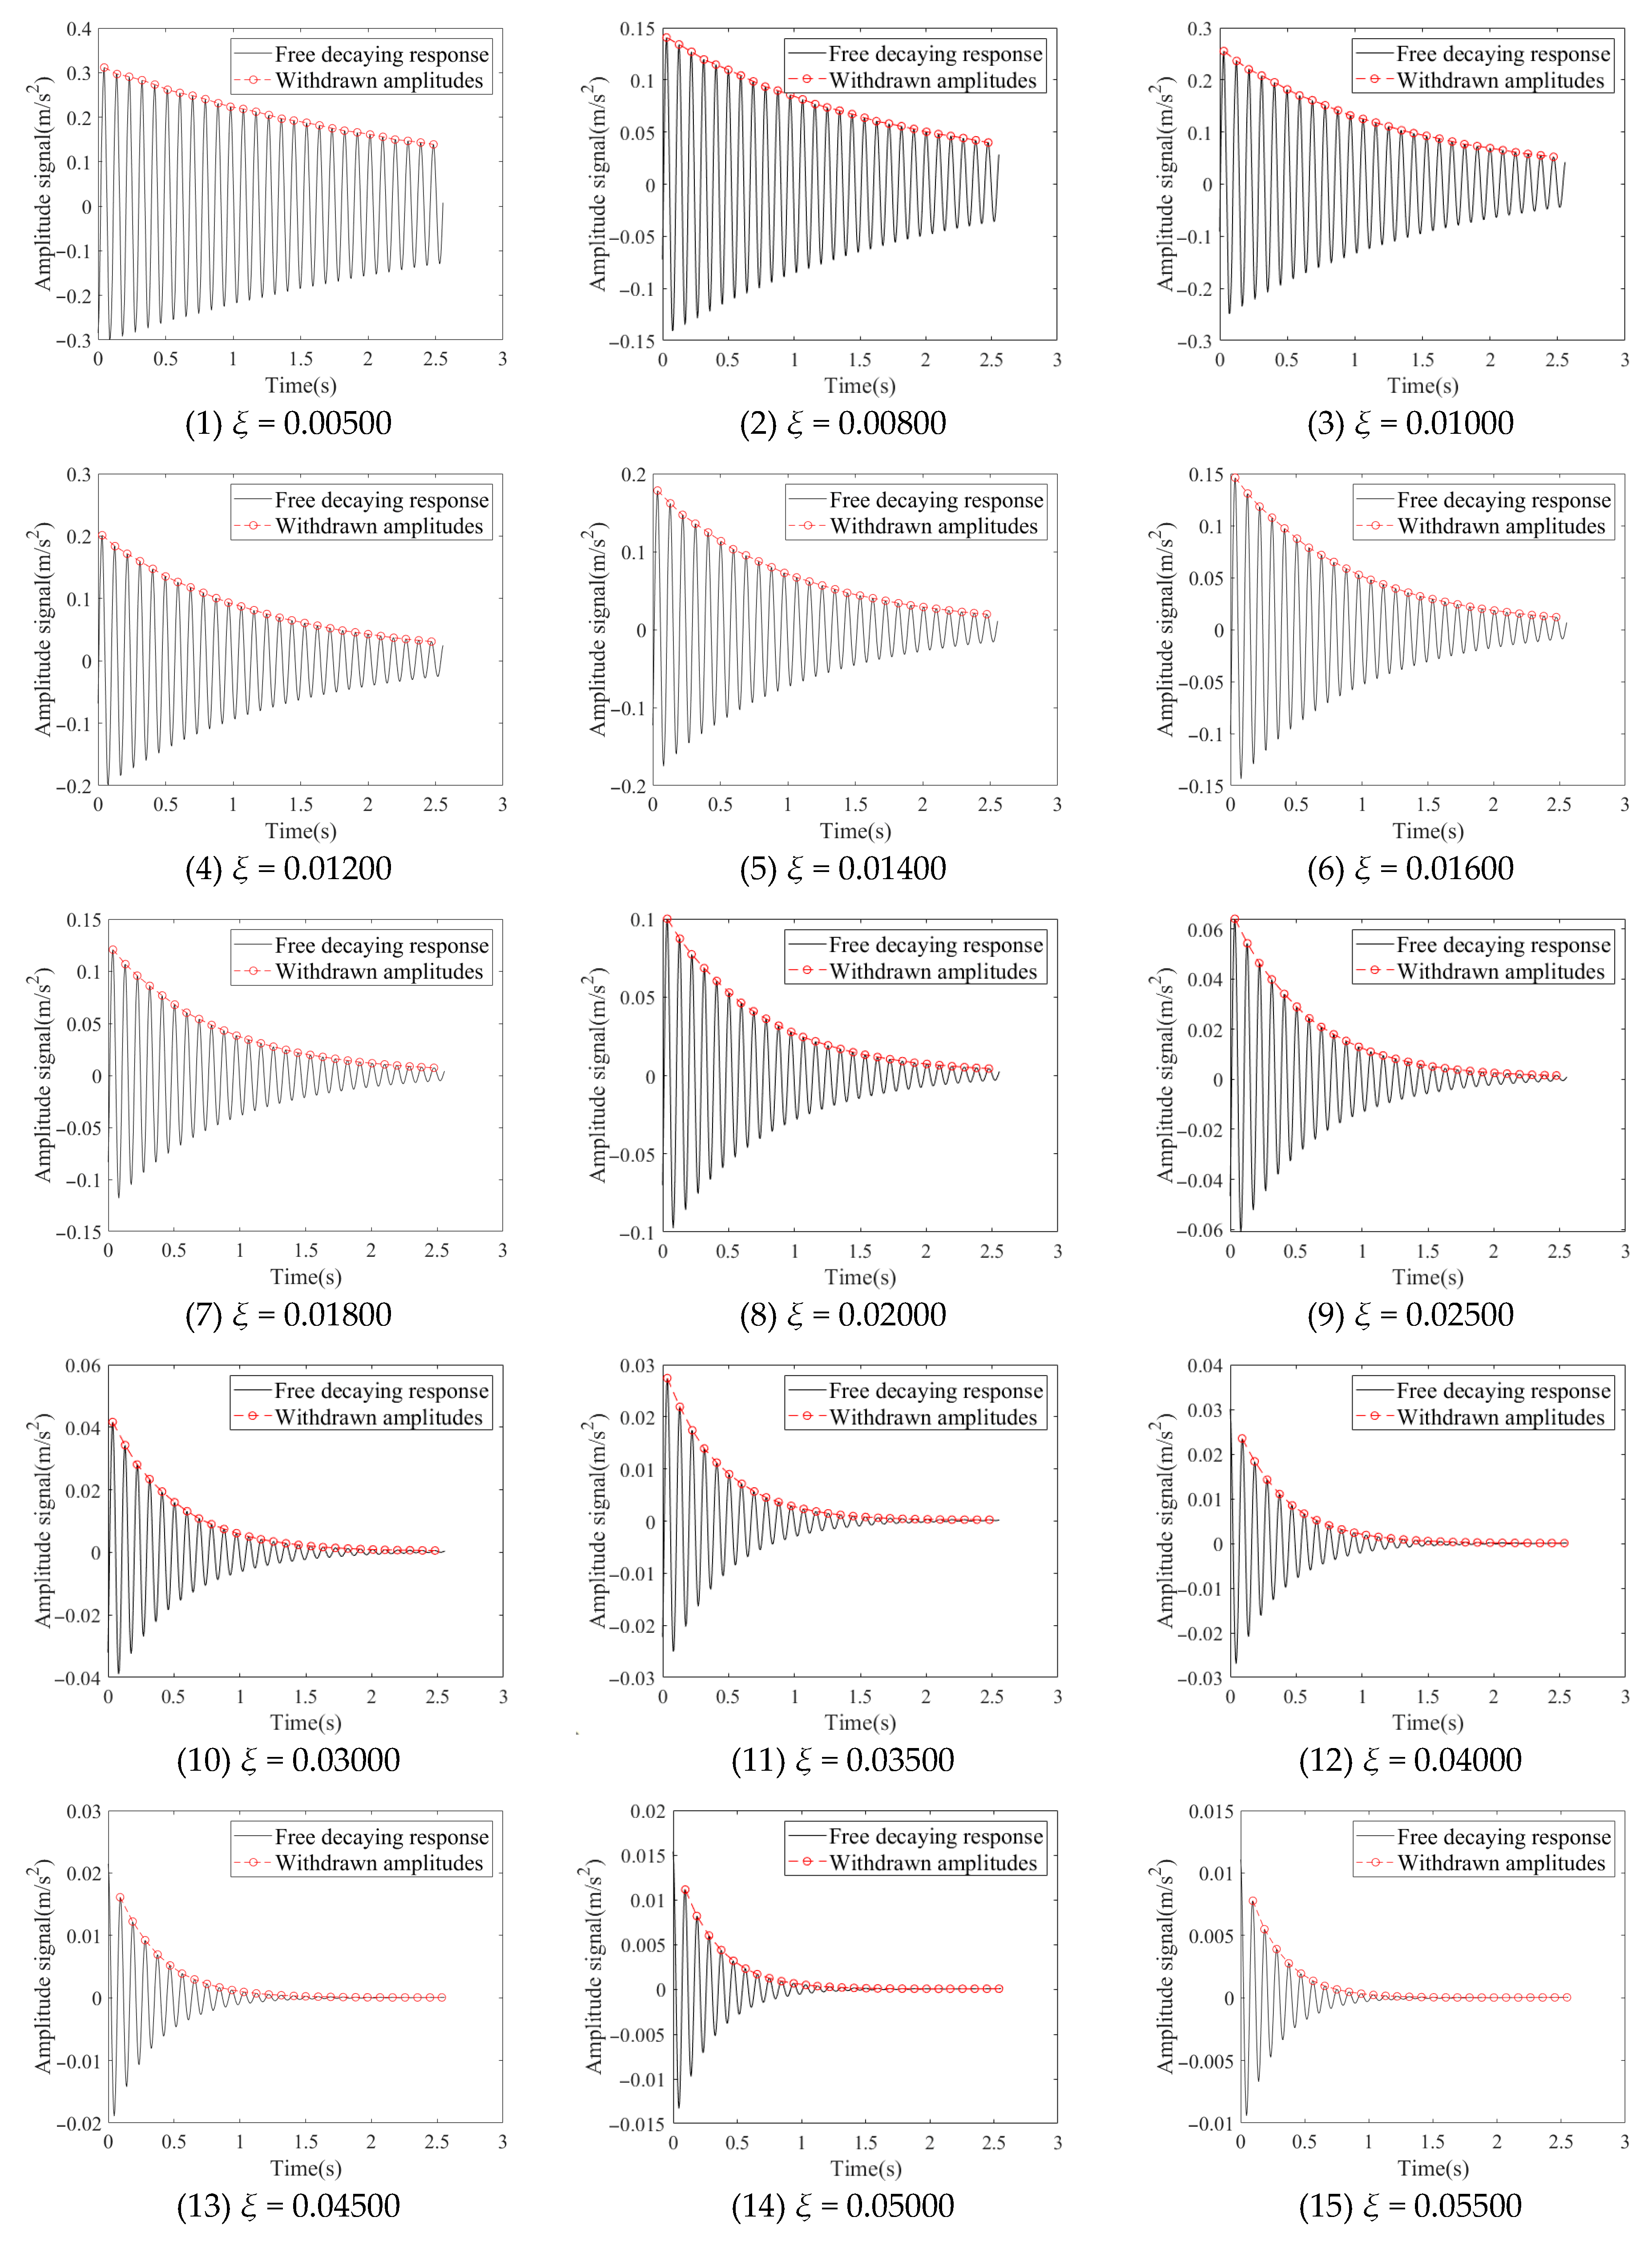
The sampling frequency is FS = 200 Hz. The sampling interval is 1/Fs, and the number of generated samples is n = 4000. If the vertical random excitation is applied at the No. 6 node of the simply supported beam to make the beam vibrate, the acceleration signal can be collected at the nodes 2 to 10. Due to the symmetry of the structure, only acceleration signals at the nodes 2 to 6 are selected for modal damping ratio calculation and analysis. First, the vertical acceleration signals outputs at node 2 under 18 different cases are calculated, respectively, and the free decaying response part is intercepted. To ensure that there are sufficient amplitude values in the free decay section and to facilitate the extraction of amplitude values for analysis, 29 data points were intercepted. The amplitude coordinate extraction of the free attenuation segment of the acceleration signal under different conditions is shown in Figure 2. The abscissa is the time and the ordinate is the acceleration value.
The first-order natural frequency f 1 of the structure is obtained by FFT from the acceleration signal output on the node 2 of the simply supported beam. f 1 is compared with the first-order natural frequency f obtained by using the global mass matrix and stiffness matrix of the structure to ensure the reliability of the modal damping ratio calculation.
It can be seen from Table 3 that the first natural frequency f calculated by the global stiffness matrix and mass matrix under each case is 10.64795 Hz. The first-order natural frequency f 1 obtained by FFT of the output acceleration signal is 10.54688 Hz. The error of f 1 and f , of 0.95%, is very small, which ensures the reliability of the modal damping ratio identification results.

3.4. Identification of Modal Damping Ratio

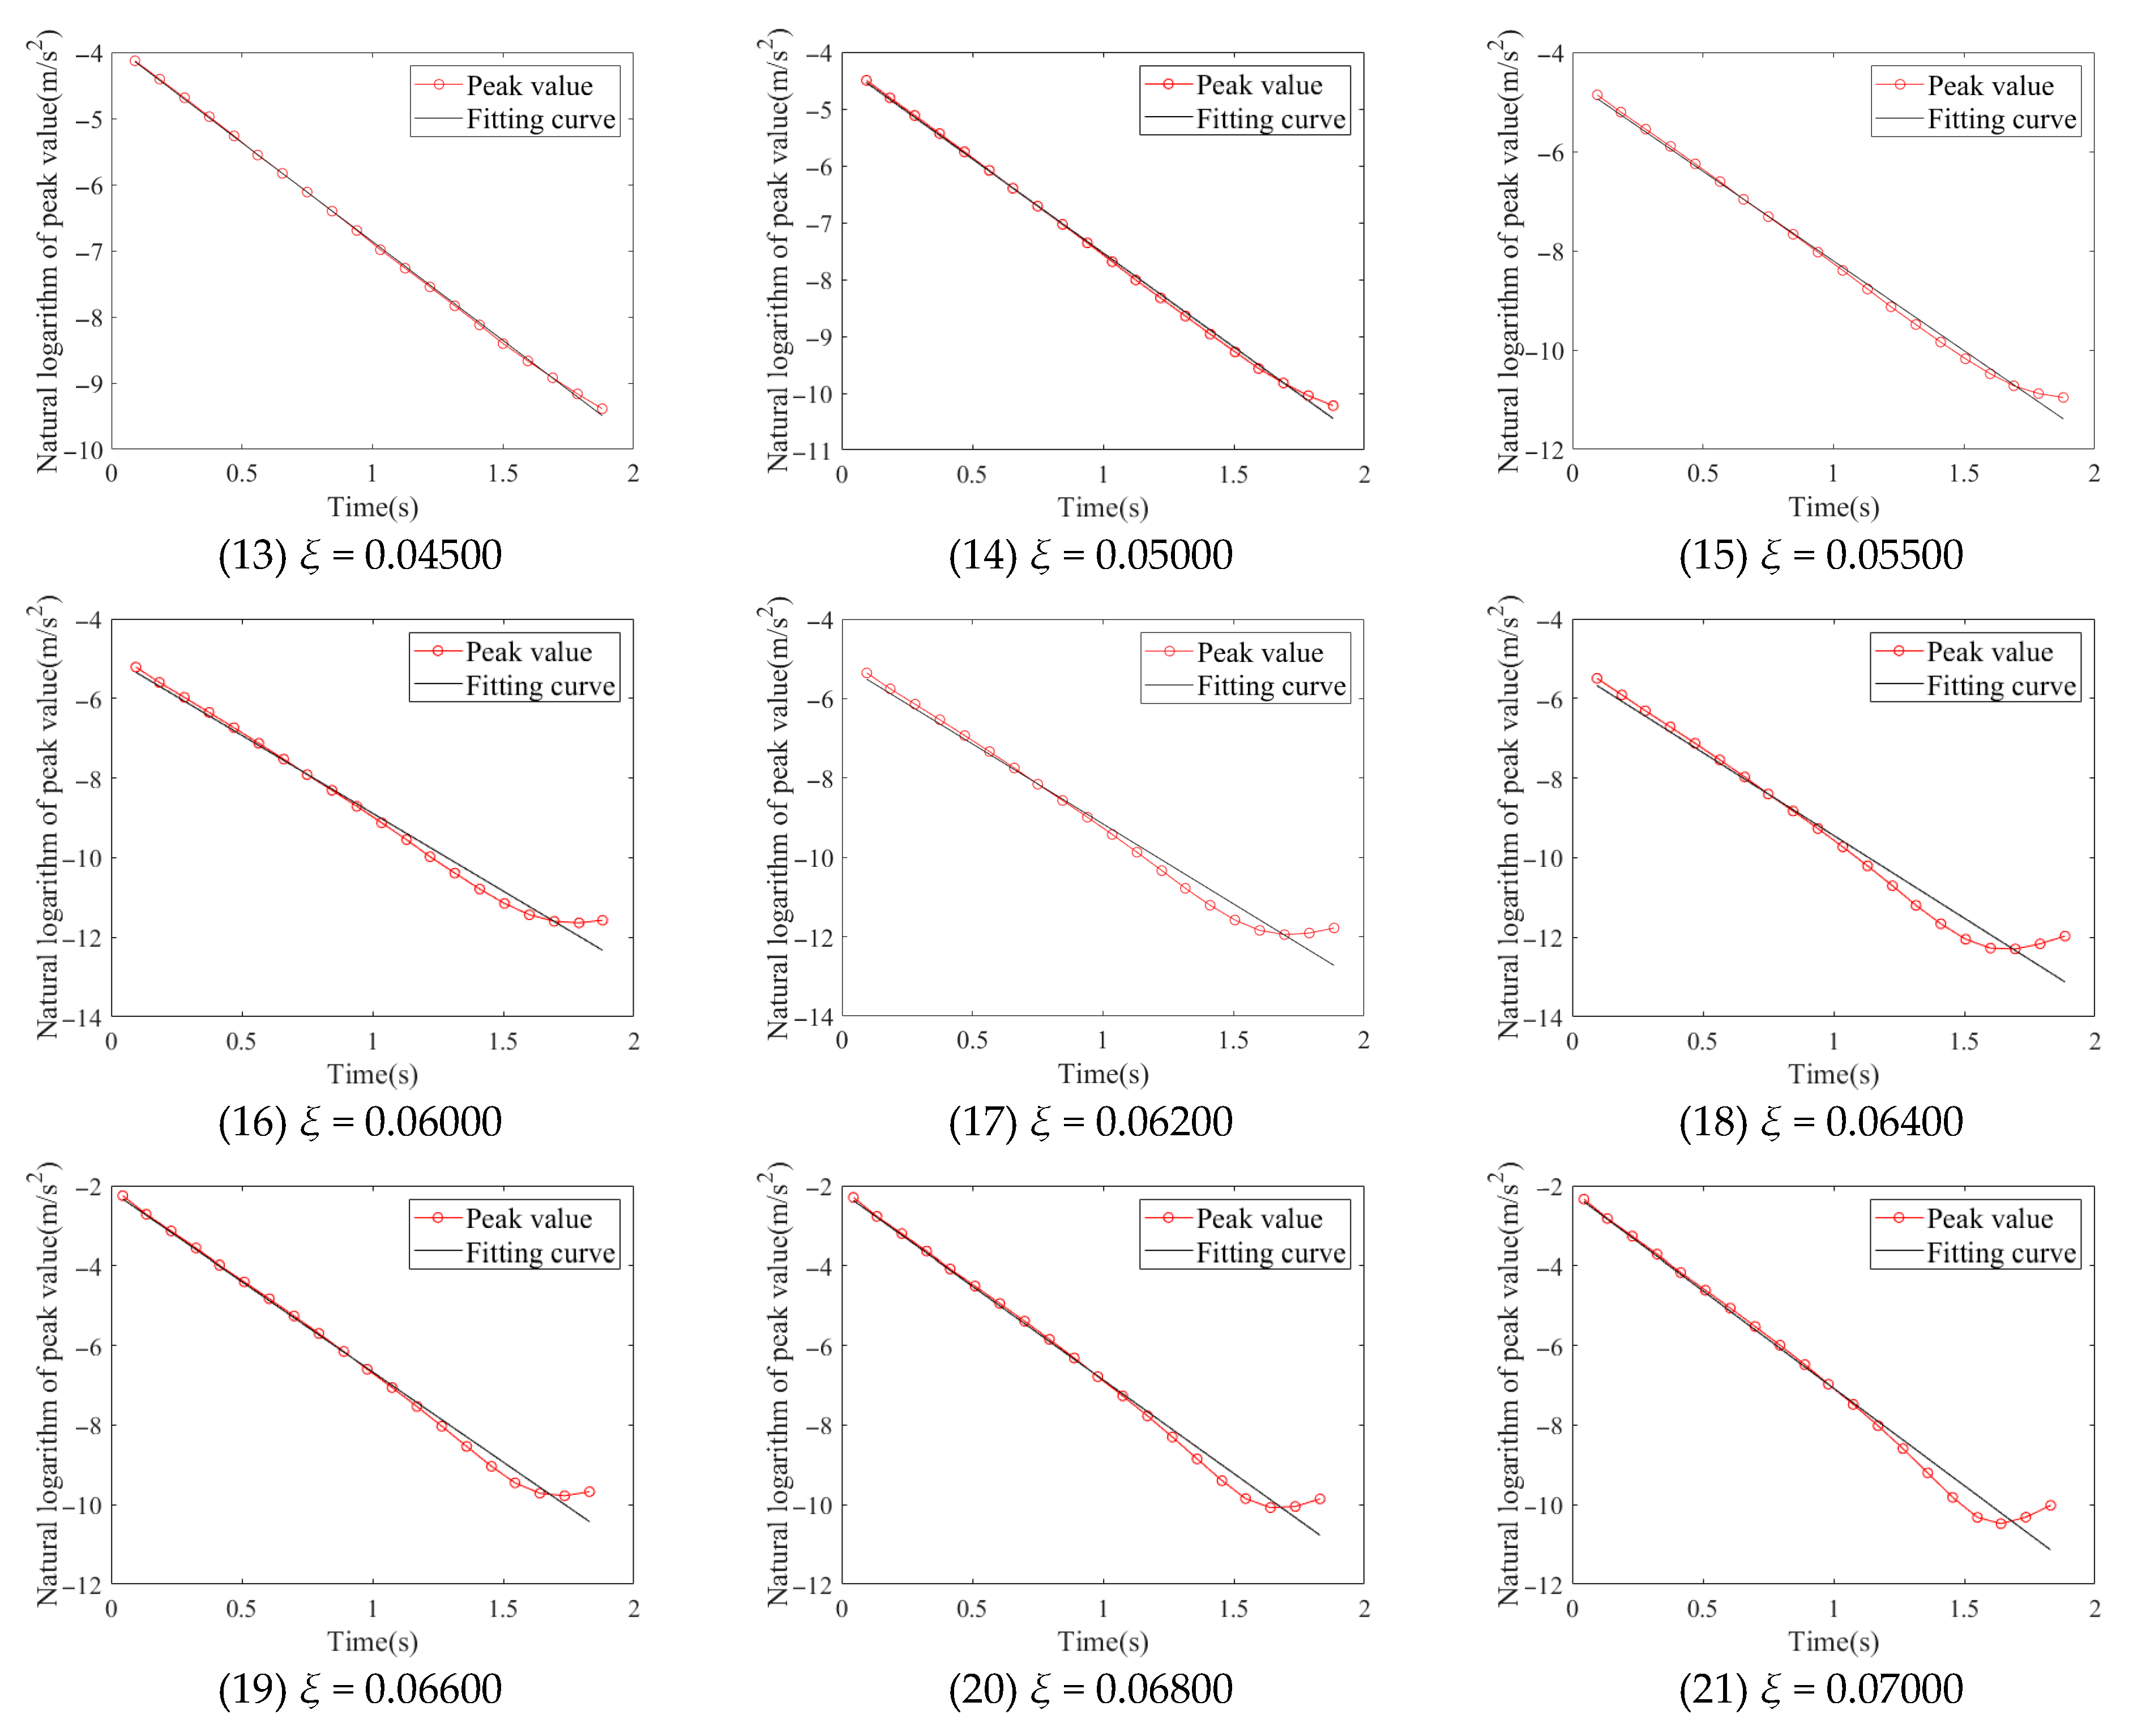
In the previous section, we extracted the free attenuation segment of the acceleration signal and obtained the frequency of the structure through Fourier transform, from which the self-oscillating circle frequency ω1 can be calculated. Only the amplitude of the free attenuation segment of the extracted acceleration signal needs to be fitted as an amplitude envelope curve, and then logarithmic processing is carried out. The slope k can be estimated through the least square method, as shown in Figure 3. Substituting the calculated ω1 and k into Equation (20), the modal damping ratio of the structure ξ can be calculated.
Table 4 shows the results of comparison between the identification modal damping ratios the set modal damping ratios under different cases and the relative errors of the identification.
We conducted a simple error analysis on the first-order damping ratio identified at node 2 to verify whether the method proposed in this study has high accuracy in the identification of node 2. Figure 4 shows the schematic diagram of the relative error identification of the modal damping ratio under various working conditions at node 2.
From Figure 4, when identifying the first-order modal damping ratio at node 2, the identification error generally exhibits a pattern of decreasing and then increasing twice. Specifically, when the first-order modal damping ratio is within the range of 0.00500 to 0.03500, the error initially decreases and subsequently increases for the first time. Within this range, the largest error occurs when the first-order modal damping ratio is 0.00500, with a value of 1.60%. The smallest error occurs when the first-order modal damping ratio is 0.01800, with a value of 0.00%. When the first-order modal damping ratio exceeds 0.01800, the error gradually increases as the damping ratio increases. At a damping ratio of 0.03500, the error reaches 0.91%. When the first-order modal damping ratio is within the range of 0.03500 to 0.07000, the error exhibits a second decrease and subsequent increase. Within this range, as the damping ratio increases beyond 0.03500, the error initially decreases. When the damping ratio reaches approximately 0.05000, the error reduces to 0.14%. Beyond this point, as the damping ratio continues to increase, the error also increases. However, even when the damping ratio reaches 0.07000, the error remains relatively low at 5.50%.
Furthermore, it can be observed that when the first-order modal damping ratio is within the approximate range of 0.00889 to 0.05625, the identification accuracy is very high, with an error less than 1.00%. Outside this range, where the modal damping is either relatively high or low, the recognition error becomes larger. Notably, the recognition error for higher modal damping ratios is greater than that for lower modal damping ratios, indicating that the recognition accuracy for lower modal damping ratios is superior. Despite this, the maximum recognition error remains limited to 5.50%. Therefore, the method proposed in this paper demonstrates high accuracy in analyzing the acceleration signal of node 2 to obtain the modal damping ratio.

3.5. Analysis of Identification Error of Damping Ratio

To further verify the method proposed in this study, the output acceleration signals at nodes 3 to 6 are used to identify the damping ratio. The method of intercepting the acceleration signal at node 3–6 is the same at node 2, and the number of intercepted points is also 29. The identification results are shown in Table 5.
As shown in Table 5, when the modal damping ratio is within the range of 0.00800 to 0.02000, i.e., under relatively low modal damping conditions, the identified modal damping ratio decreases with variations in signal collection points, and its associated error gradually increases. Specifically, when the modal damping ratio is 0.00500, the change magnitude is the largest. For instance, the modal damping ratio identified at node 6 is 0.00490, which represents a decrease of 0.00018 compared to the value identified at node 2. The error increases from 1.60% to 2.00%, corresponding to an increase of 0.40%. However, this change in error remains relatively small. When the modal damping ratio is within the range of 0.02000 to 0.06600, under identical conditions, the identified modal damping ratios at nodes 2 through 6 are consistent. Conversely, when the modal damping ratio falls within the range of 0.06600 to 0.07000, i.e., under relatively high modal damping conditions, the identified modal damping ratio decreases with changes in signal collection points, and its associated error gradually decreases. Notably, when the modal damping ratio is 0.07000, the change magnitude is the largest. At node 6, the identified modal damping ratio is 0.07304, representing a decrease of 0.00081 compared to the value identified at node 2. The error decreases from 5.50% to 4.34%, corresponding to a reduction of 1.16%. This change in error is not significant. From this analysis, it can be observed that the error variation trends at nodes 2 through 6 are approximately consistent with those depicted in Figure 4.
To verify the reliability and accuracy of the method proposed in this study, we conducted an error analysis on the first-order modal damping ratios identified at nodes 2 to 6, including the mean, standard deviation, root mean square error, and confidence interval, as shown in Table 6.
As shown in Table 6, when the modal damping ratio is within the range of 0.00500 to 0.06000, the measurement results fluctuate around the set value by no more than 0.001, with the minimum being only 0.00001. This indicates that the damping ratio identification results at each node fluctuate relatively little around the set value, and the consistency between the central position and the set value is relatively high. Within the range of 0.06000 to 0.06400, the measurement results fluctuate around the set value by no more than 0.00123, indicating that the damping ratio identification results at each node fluctuate moderately around the set value, and the consistency between the central position and the set value is good. Within the range of 0.06400 to 0.07000, the fluctuation is relatively high, with the maximum being 0.00346, suggesting that the damping ratio identification results at each node fluctuate significantly around the set value, and the consistency between the central position and the set value is relatively low.
Regarding standard deviations, when the modal damping ratio is within the range of 0.00500 to 0.02000, the standard deviation is less than 0.0001, indicating that the differences among the identification results at each node are small, and the overall data stability is high. Within the range of 0.02000 to 0.06400, the standard deviation is 0, which means that the identification results at each node are almost the same, and the data stability is extremely high. Within the range of 0.06400 to 0.07000, the standard deviation is relatively high, but the maximum is only 0.00031, suggesting that the differences among the identification results at each node are small, and the overall data stability is good.
For root mean square error (RMSE), when the modal damping ratio is within the range of 0.00500 to 0.05500, RMSE is less than 0.00020, indicating that the comprehensive error is small within this range, and the accuracy and stability of the identification results are good. When the modal damping ratio is greater than 0.05500, RMSE is greater than 0.00040 and gradually increases. When the modal damping ratio is 0.07000, it reaches 0.00179. This indicates that the comprehensive error is relatively large within the range of 0.05500 to 0.07000, and the accuracy and stability of the identification results are poor.
Confidence interval analysis: When the modal damping ratio is within the range of 0.00500 to 0.02000, the width of the confidence interval is relatively narrow, indicating that the confidence range of the identification results in this interval is relatively concentrated, and the data accuracy is high. Within the range of 0.02000 to 0.06400, since the damping ratios identified at each node are equal, the standard deviation is 0, and the confidence interval of the overall mean degenerates into a single point. Combined with the average value, the differences between the average values of each working condition and the set value in this interval are relatively small, indicating that the identification accuracy in this interval is high. Within the range of 0.06400 to 0.07000, the width of the confidence interval is relatively wide compared to other intervals, indicating that the confidence range is more dispersed, and the accuracy is slightly lower.
Therefore, when the damping ratio is in the range of 0.00500~0.06400, the method proposed in this study has higher identification accuracy for the first-order modal damping ratio of the simply supported beam model and the selection of different acceleration signal acquisition points has little effect on the identification error of the first-order modal damping ratio of the simply supported beam. When the damping ratio value is in the range of 0.06400~0.07000, the recognition accuracy is low, but the recognition accuracy is within the acceptable range. From the trend of the data, it can be predicted that when the damping ratio is less than 0.00500 or more than 0.07000, the accuracy of the identification may be reduced. When the damping ratio is too small or too high, it may even not adapt.

4. Case Analysis of Steel Arch Bridges

4.1. Overview of Steel Arch Bridge Project

The engineering example used here is a steel arch bridge, as shown in Figure 5, which is used for electric cables crossing a river. The bridge was completed in 2007.
Figure 6 shows the plan view of the steel arch bridge. The transverse railing of each side of the bridge is mainly composed of one rod with 76 mm diameter and two rods with 50 mm diameter, with each rod being 37 m long. The vertical railings of each side of the bridge are composed of 80 rods, each rod with a 76 mm diameter and 1.1 m length. The superstructure of the bridge is mainly composed of arch rings, suspenders, and tie bars. The section of arch rings comprises steel pipe arches with an outer diameter of 273 mm and a thickness of 6 mm. The distance between the suspenders is 4 m. The suspenders are made of steel pipes with an outer diameter of 108 mm and a thickness of 3.5 mm.
The bottom section of the bridge is shown in Figure 7a. The deck checkered steel plate is 37 m long, 2.6 m wide, and 4 mm thick. Eighteen electric cables of the model of YJV22-8.7/15 are installed under the bridge deck. The outer sleeves of the electric cables are made of double-wall corrugated pipe with a diameter of 160 mm.
The main girders, as shown in Figure 7b, have a box section with cover plates that are 250 mm wide × 4 mm thick and web plates that are 384 mm wide × 4 mm thick.
The ends on both sides of the girders are equipped with steel jackets with a length of 2.5 m. Figure 7c shows the section dimensions of the steel jackets.
The material used for the bridge is Q235 steel with a density of 7.85 × 10³ kg/m3, and the elastic modulus is 200 Gpa.

4.2. Identification of Modal Damping Ratio of Steel Arch Bridge

4.2.1. Measurement of Acceleration Time History

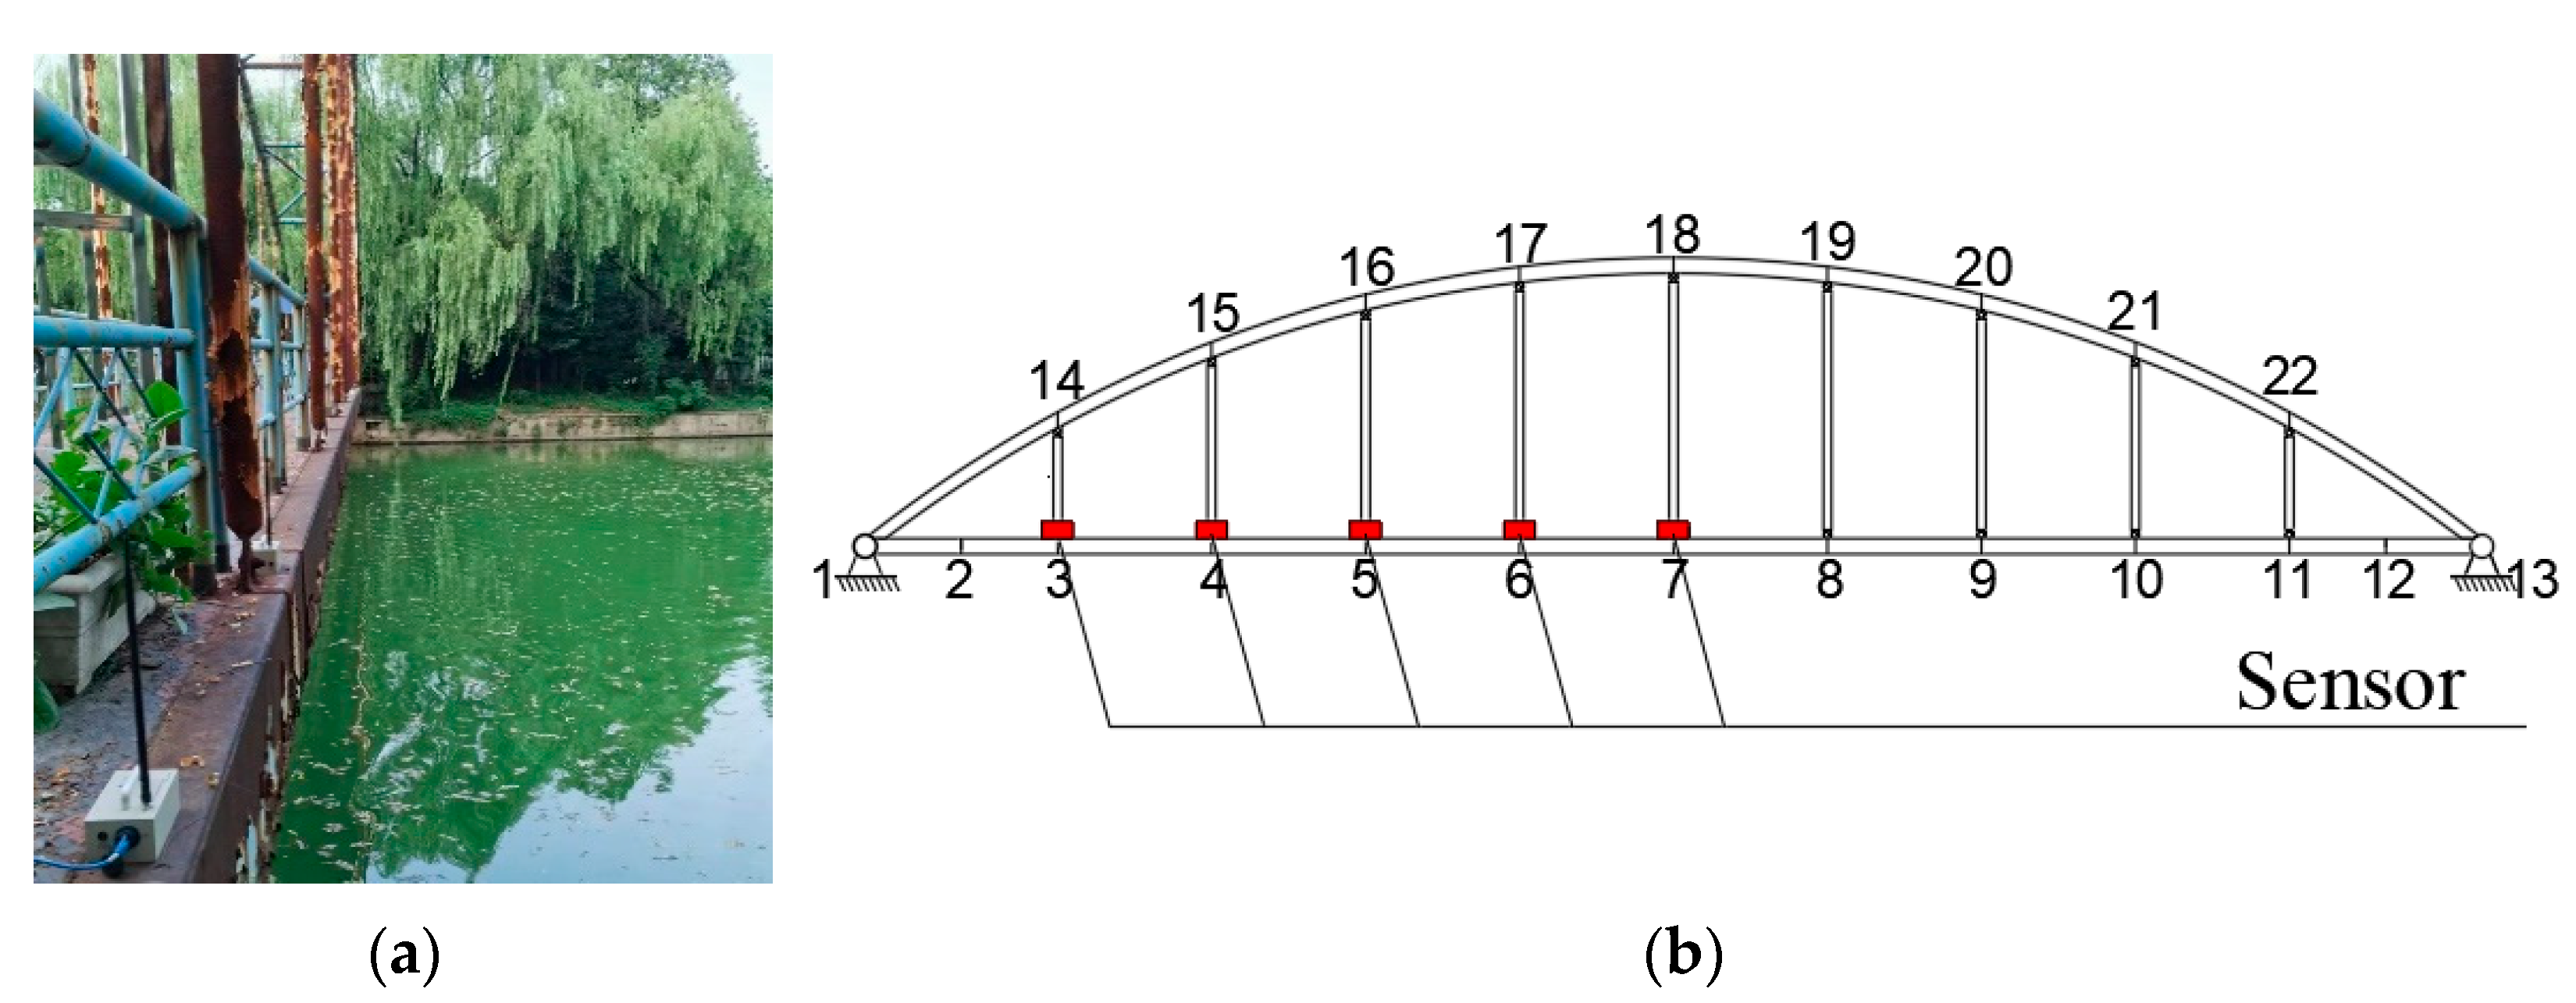
Two channel acceleration sensors are used for field measurement, with a sampling frequency of 100 Hz. Because the steel arch bridge has structural symmetry, the node acceleration signal on one side of the structure can be taken for analysis when determining the modal damping ratio. The noise at the support has a great influence on the data. In order to obtain higher signal-to-noise ratio data and improve the accuracy of recognition. Five acceleration sensors are arranged at nodes 3, 4, 5, 6, and 7 on the main beam of the steel arch bridge, as shown in Figure 8. Vertical excitation is applied to the steel bridge at node 7 (mid-span), and three groups of measured acceleration data are collected. The measurement time of each group of data is about 2 to 3 min.

4.2.2. Selection of Data

The quality of the acceleration signal will affect the recognition accuracy. The position of the sensor will affect the quality of the acceleration signal. For example, the acceleration signal collected with a small amplitude is unstable, and the acquisition position cannot identify the first-order natural frequency of the structure. In addition, the acquisition of the second-order modal signal is closely related to the installation position of the sensor. Arranging the sensor according to the theoretical model can effectively avoid the damping estimation error caused by the second-order signal. Therefore, in order to accurately identify the first-order modal damping ratio, it is necessary to first verify whether the placement of the sensor meets the requirements.
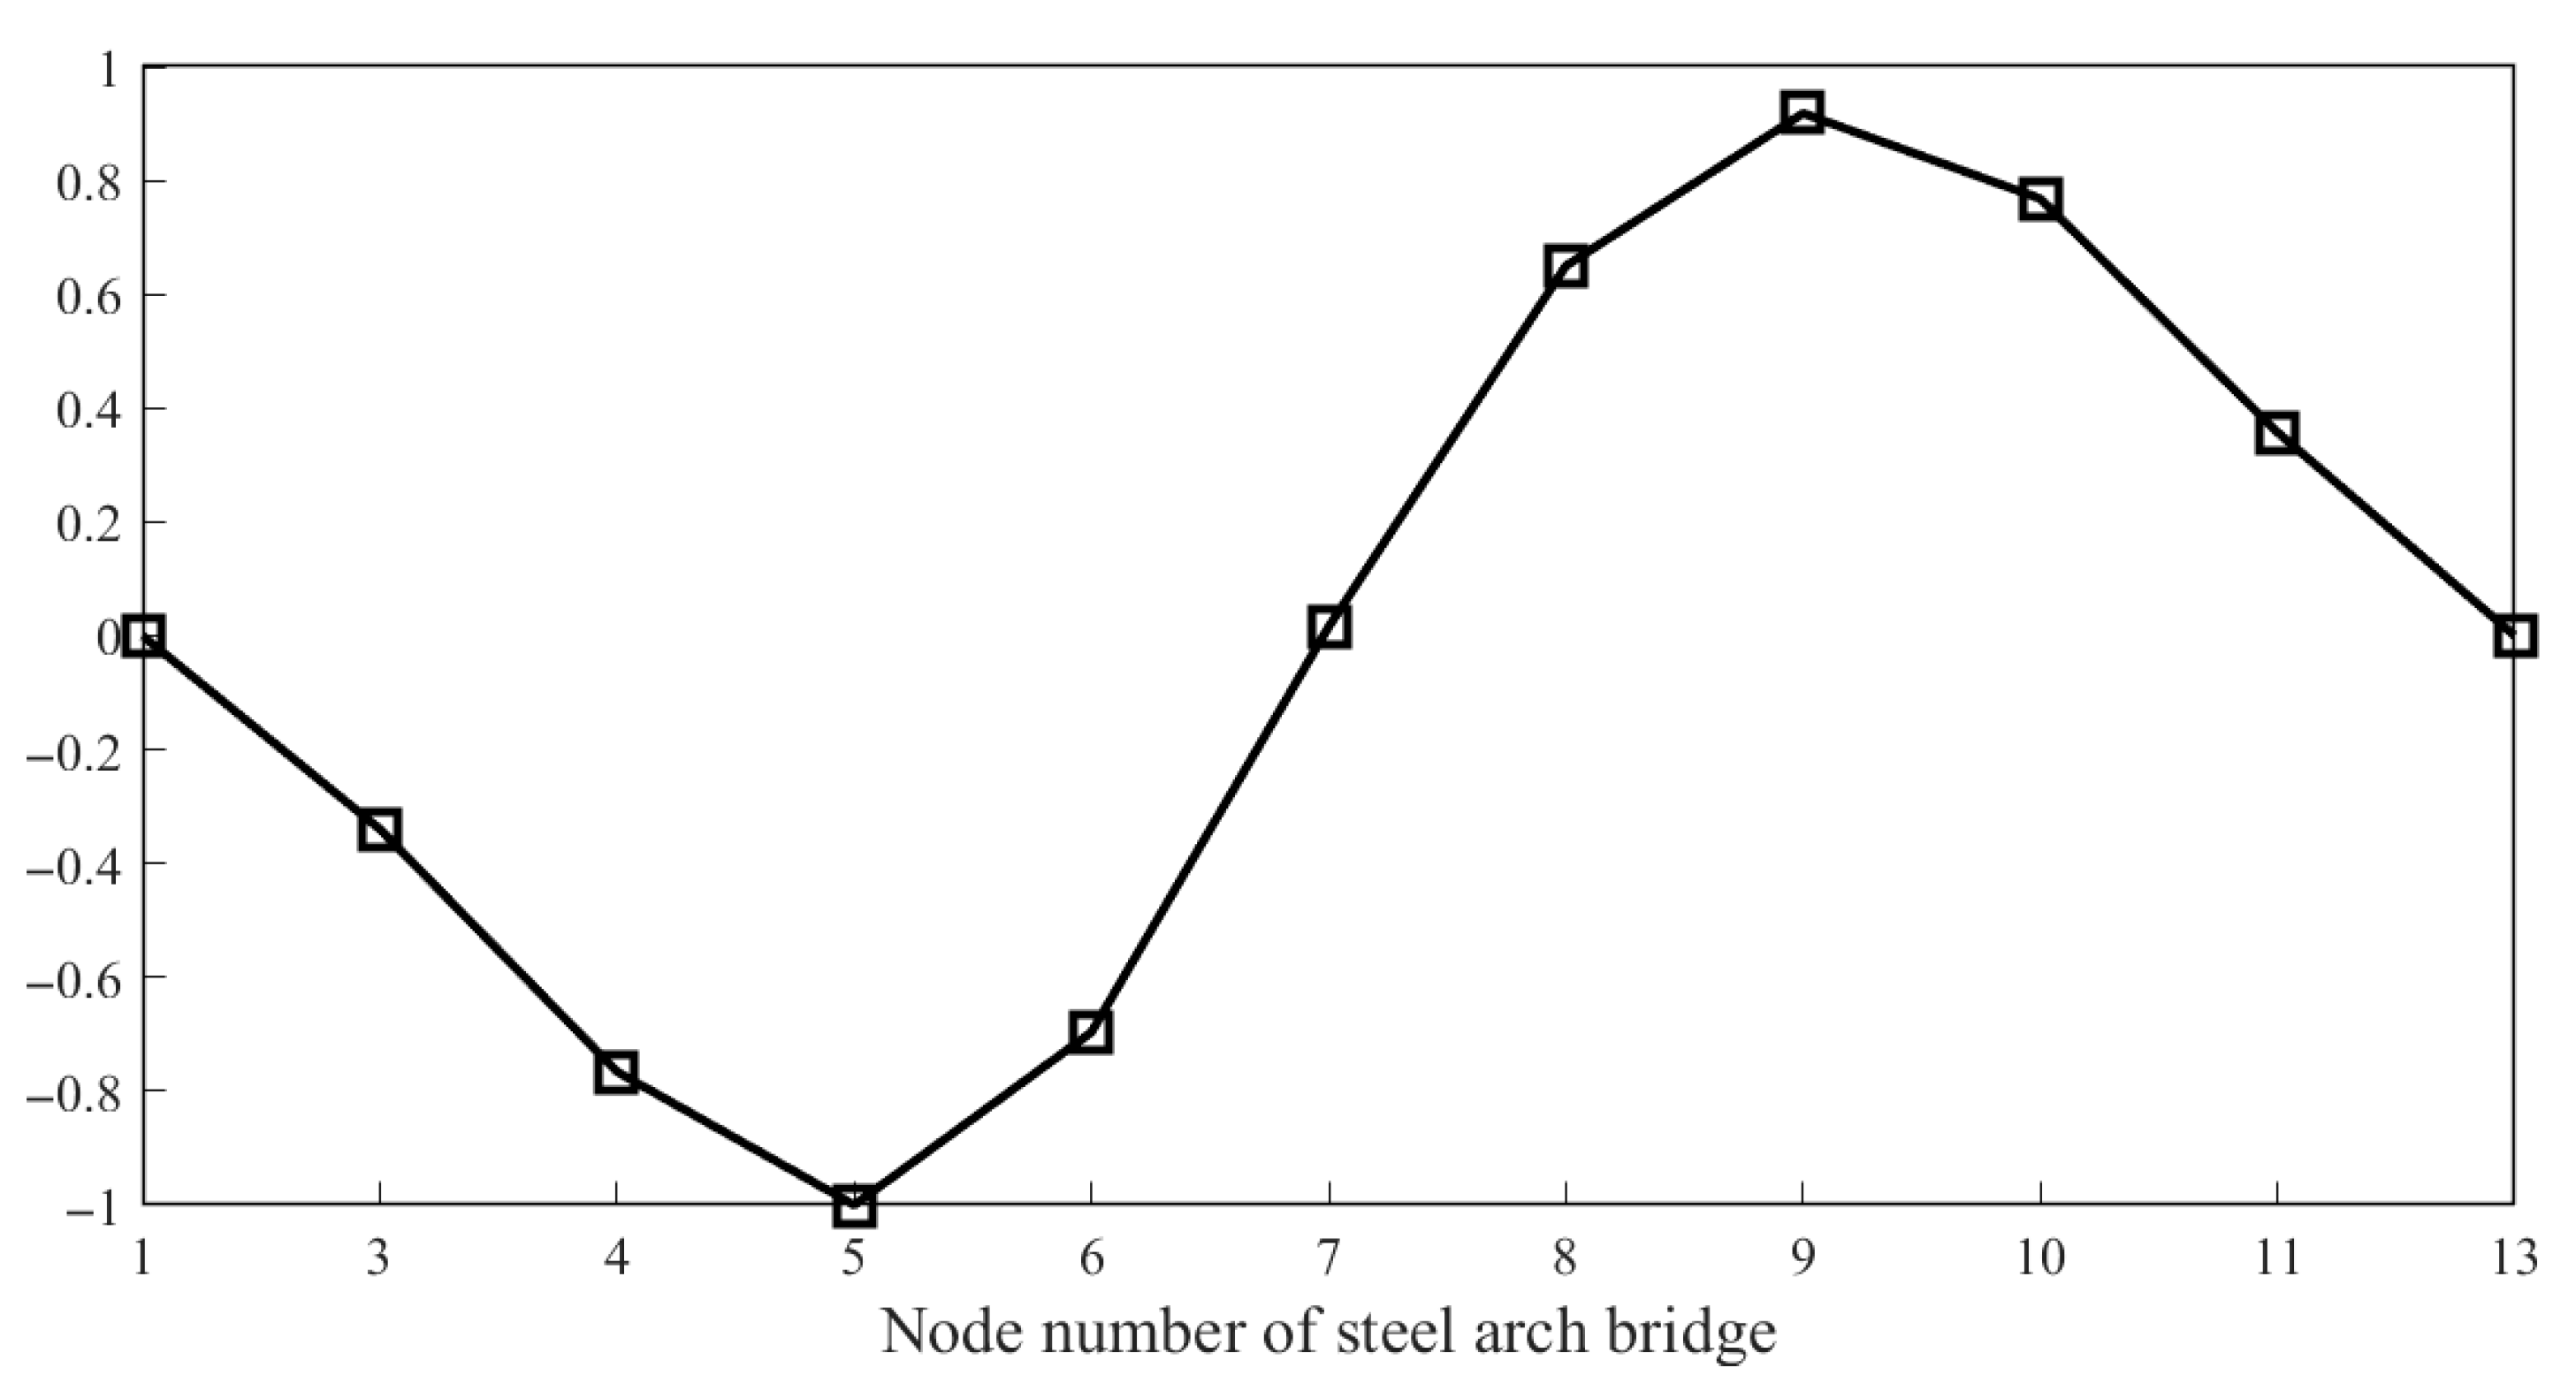
By establishing the theoretical model of the steel arch bridge and analyzing its vibration mode, the first-order vibration mode diagram of the bridge is obtained, as shown in Figure 9. It can be seen from Figure 9 that the amplitude corresponding to the first-order natural frequency of the structure at node 7 is 0; that is, the acceleration signal measured at node 7 cannot identify the first-order natural frequency of the structure. Therefore, we will no longer use the measured acceleration signal to analyze the damping ratio at node 7. The location of other sensors has good amplitude, which is suitable for the identification of first-order modal damping ratio. Therefore, the acceleration signals collected at nodes 3, 4, 5, and 6 are used to identify the first-order modal damping ratio.
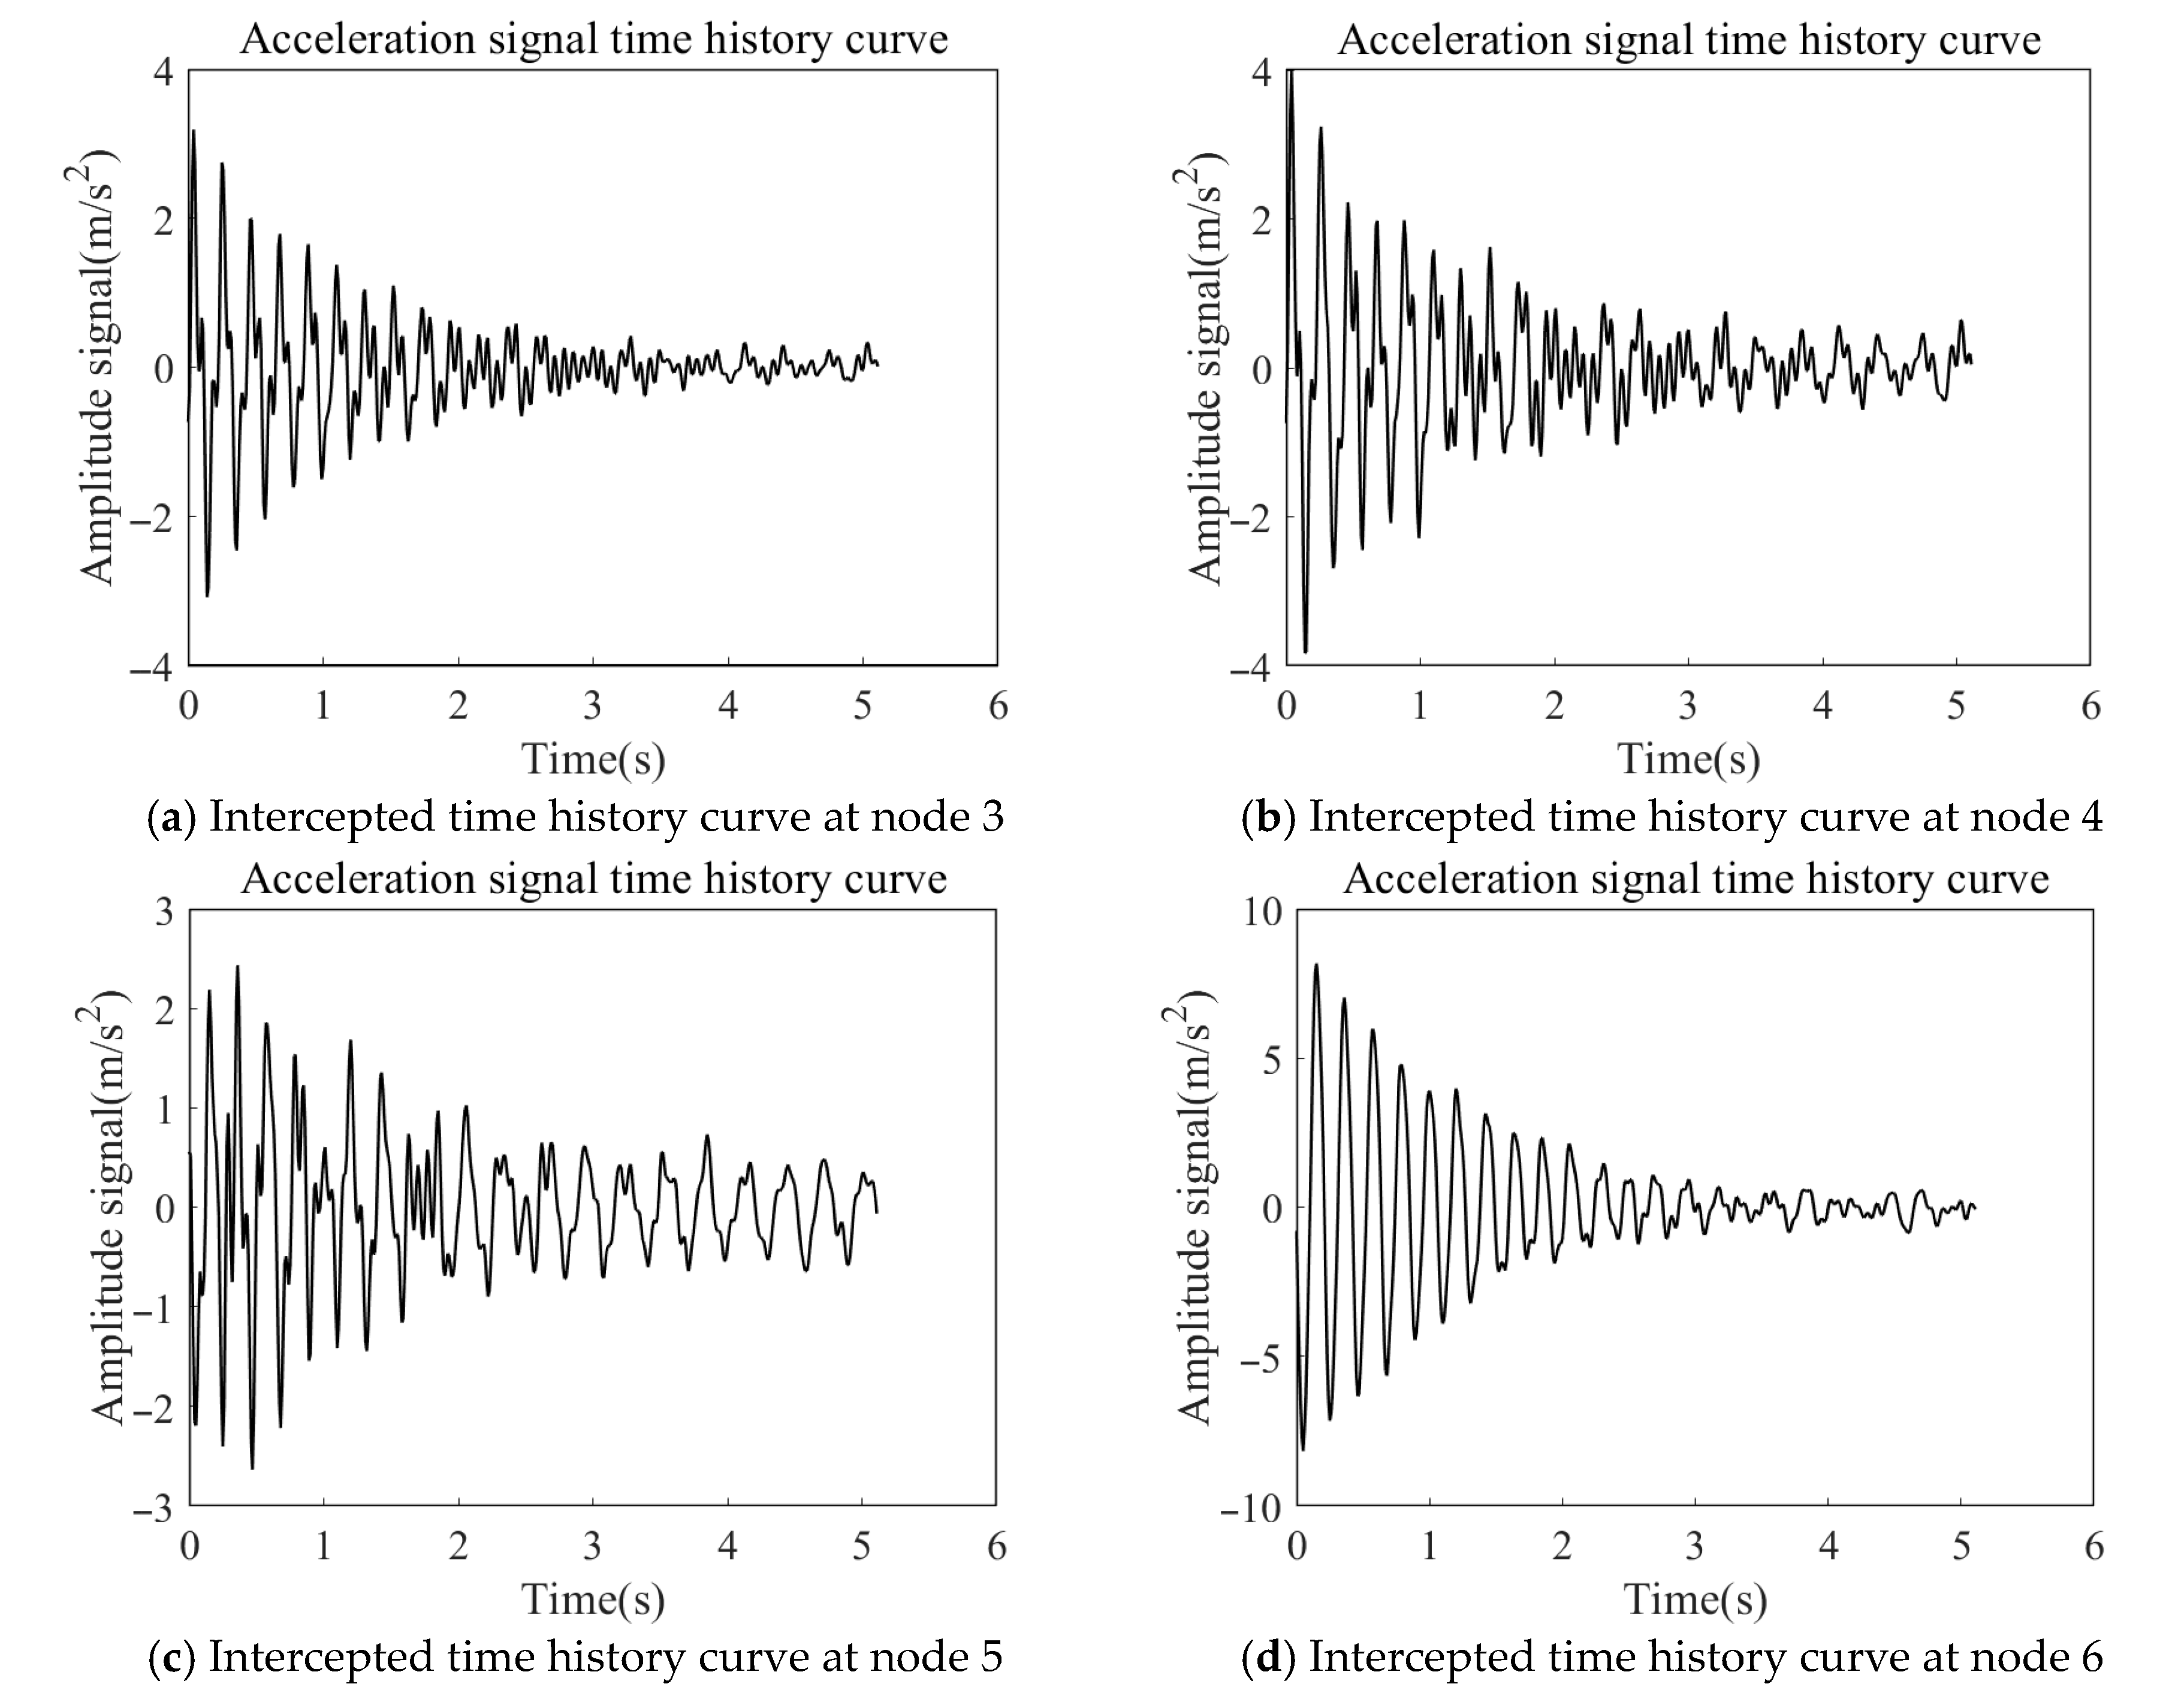
Three sets of acceleration signals were collected, and the free attenuation section of each set of acceleration signals was intercepted. In order to ensure sufficient amplitude data, the intercepted data points were consistent with the numerical simulation of 29. Figure 10 shows the time history curves of intercepted free decaying responses sections of the acceleration signals of the first datum group at nodes 3–6.
It can be seen from Figure 10 that the waveforms of free decay curve at node 3, node 4, and node 6 are regular, while the waveform at node 5 is chaotic. After the spectrum analysis on the second and third datum groups, it is found that the identification of the first-order natural frequency of the structure can be stable by using the free decay curves at nodes 3 and 4, and cannot be stable by using the free decaying curve at node 6, even though it has a good waveform. Based on the above, we select the acceleration signals at node 3 and node 4 to identify the modal damping ratio of the bridge.

4.2.3. Identification of First-Order Modal Damping Ratio

Identification of Damping Ratio at Node 3
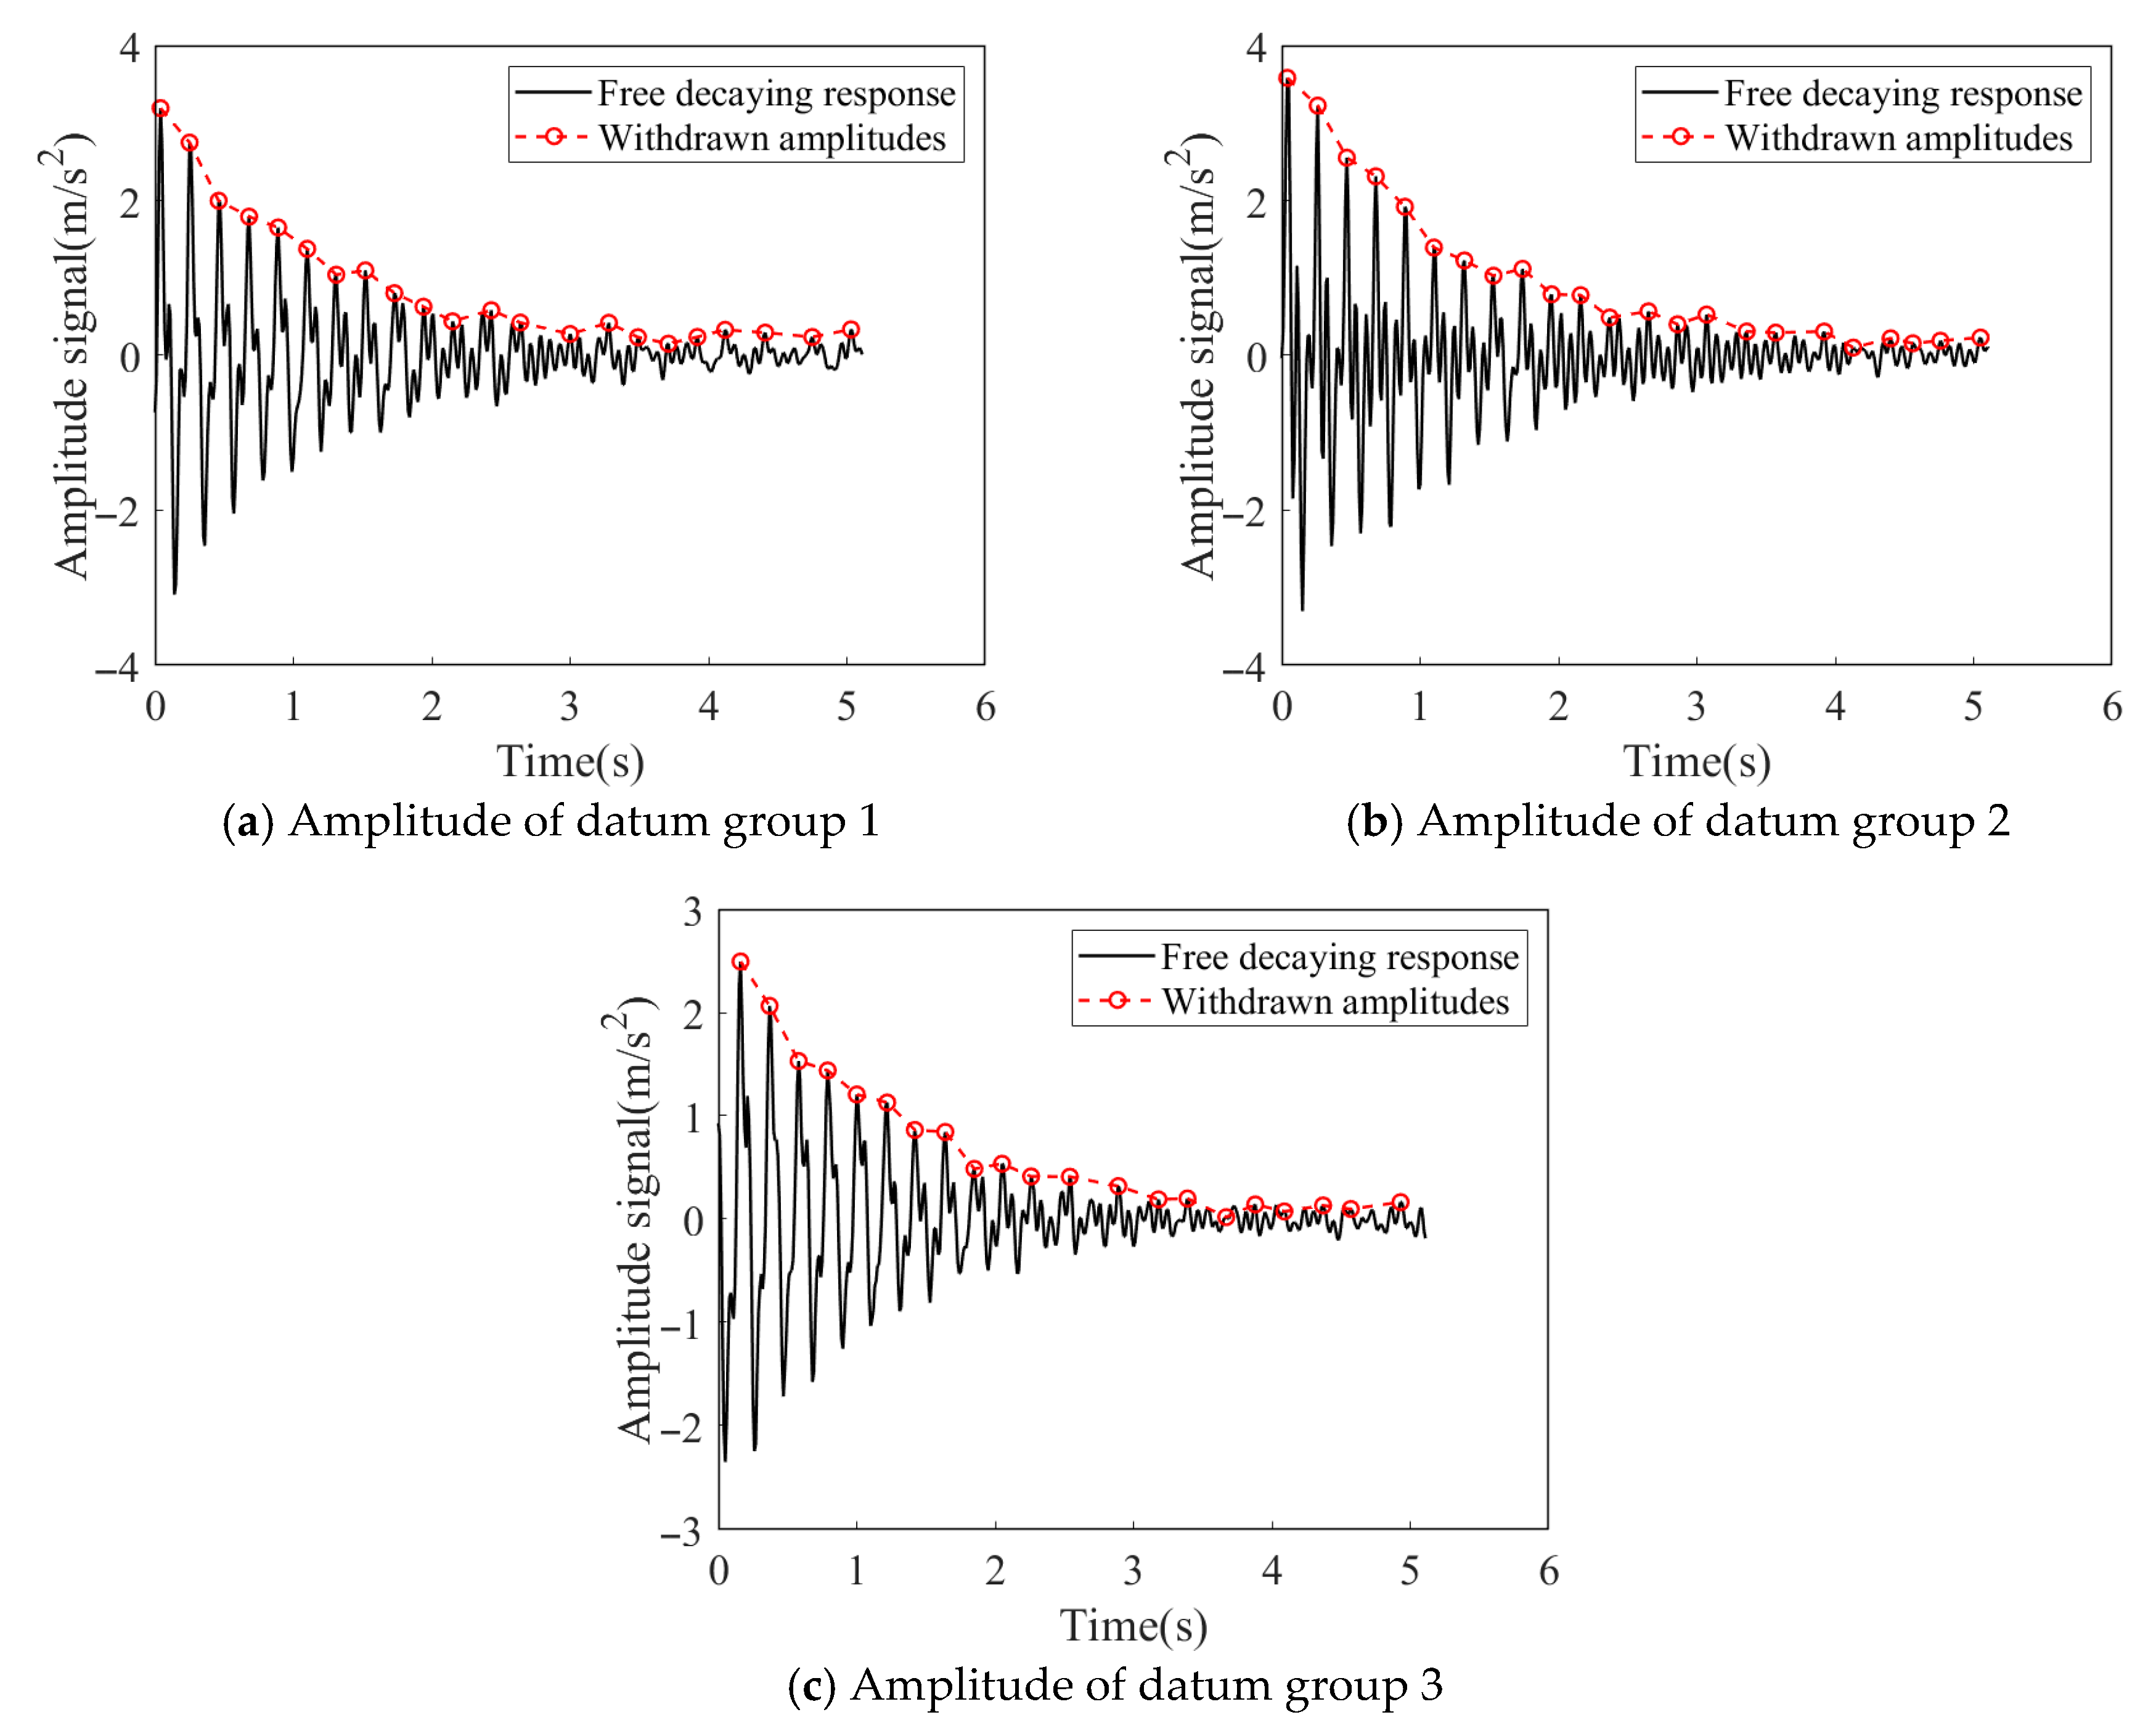
The free attenuation section of the acceleration signal collected by the acceleration sensor at node 3 is intercepted (three sets of data are intercepted, respectively), and the amplitude is extracted, as shown in Figure 11.
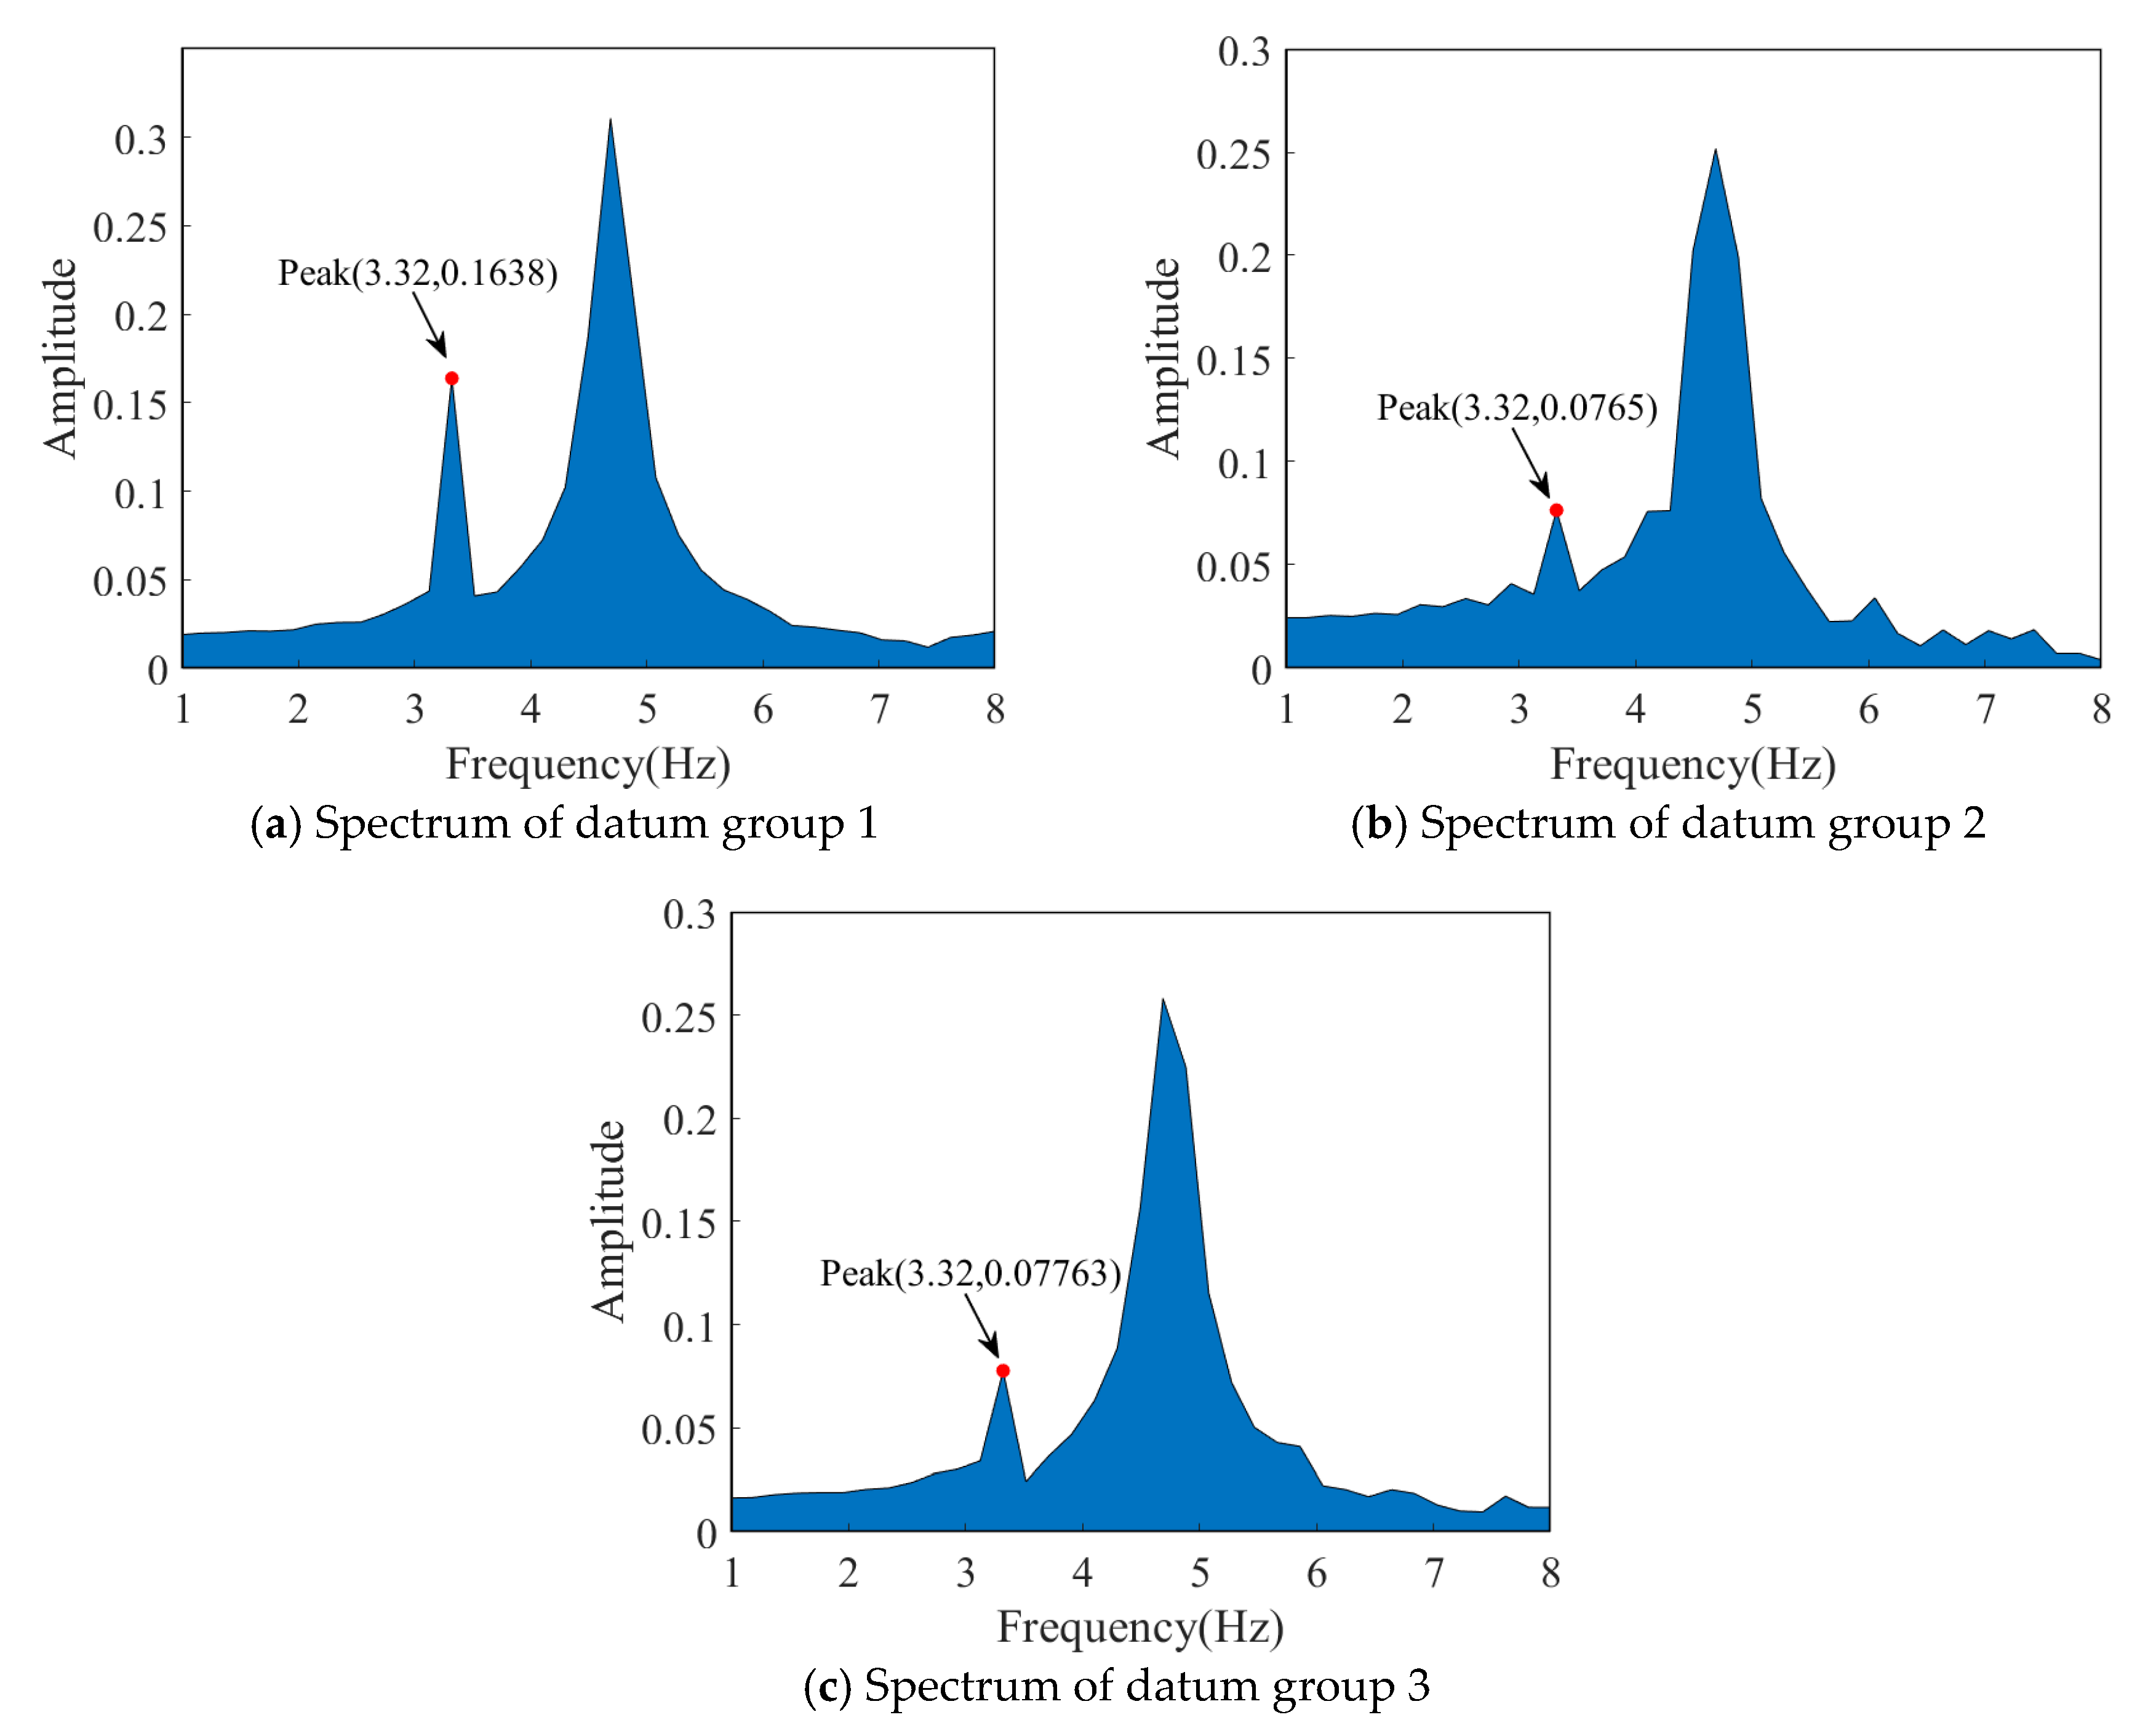
Figure 12 shows the Fourier spectrums of the acceleration signals of three datum groups. In the figure, the first-order natural frequency of the bridge is 3.32 Hz for each group, which means that the identification is reliable.
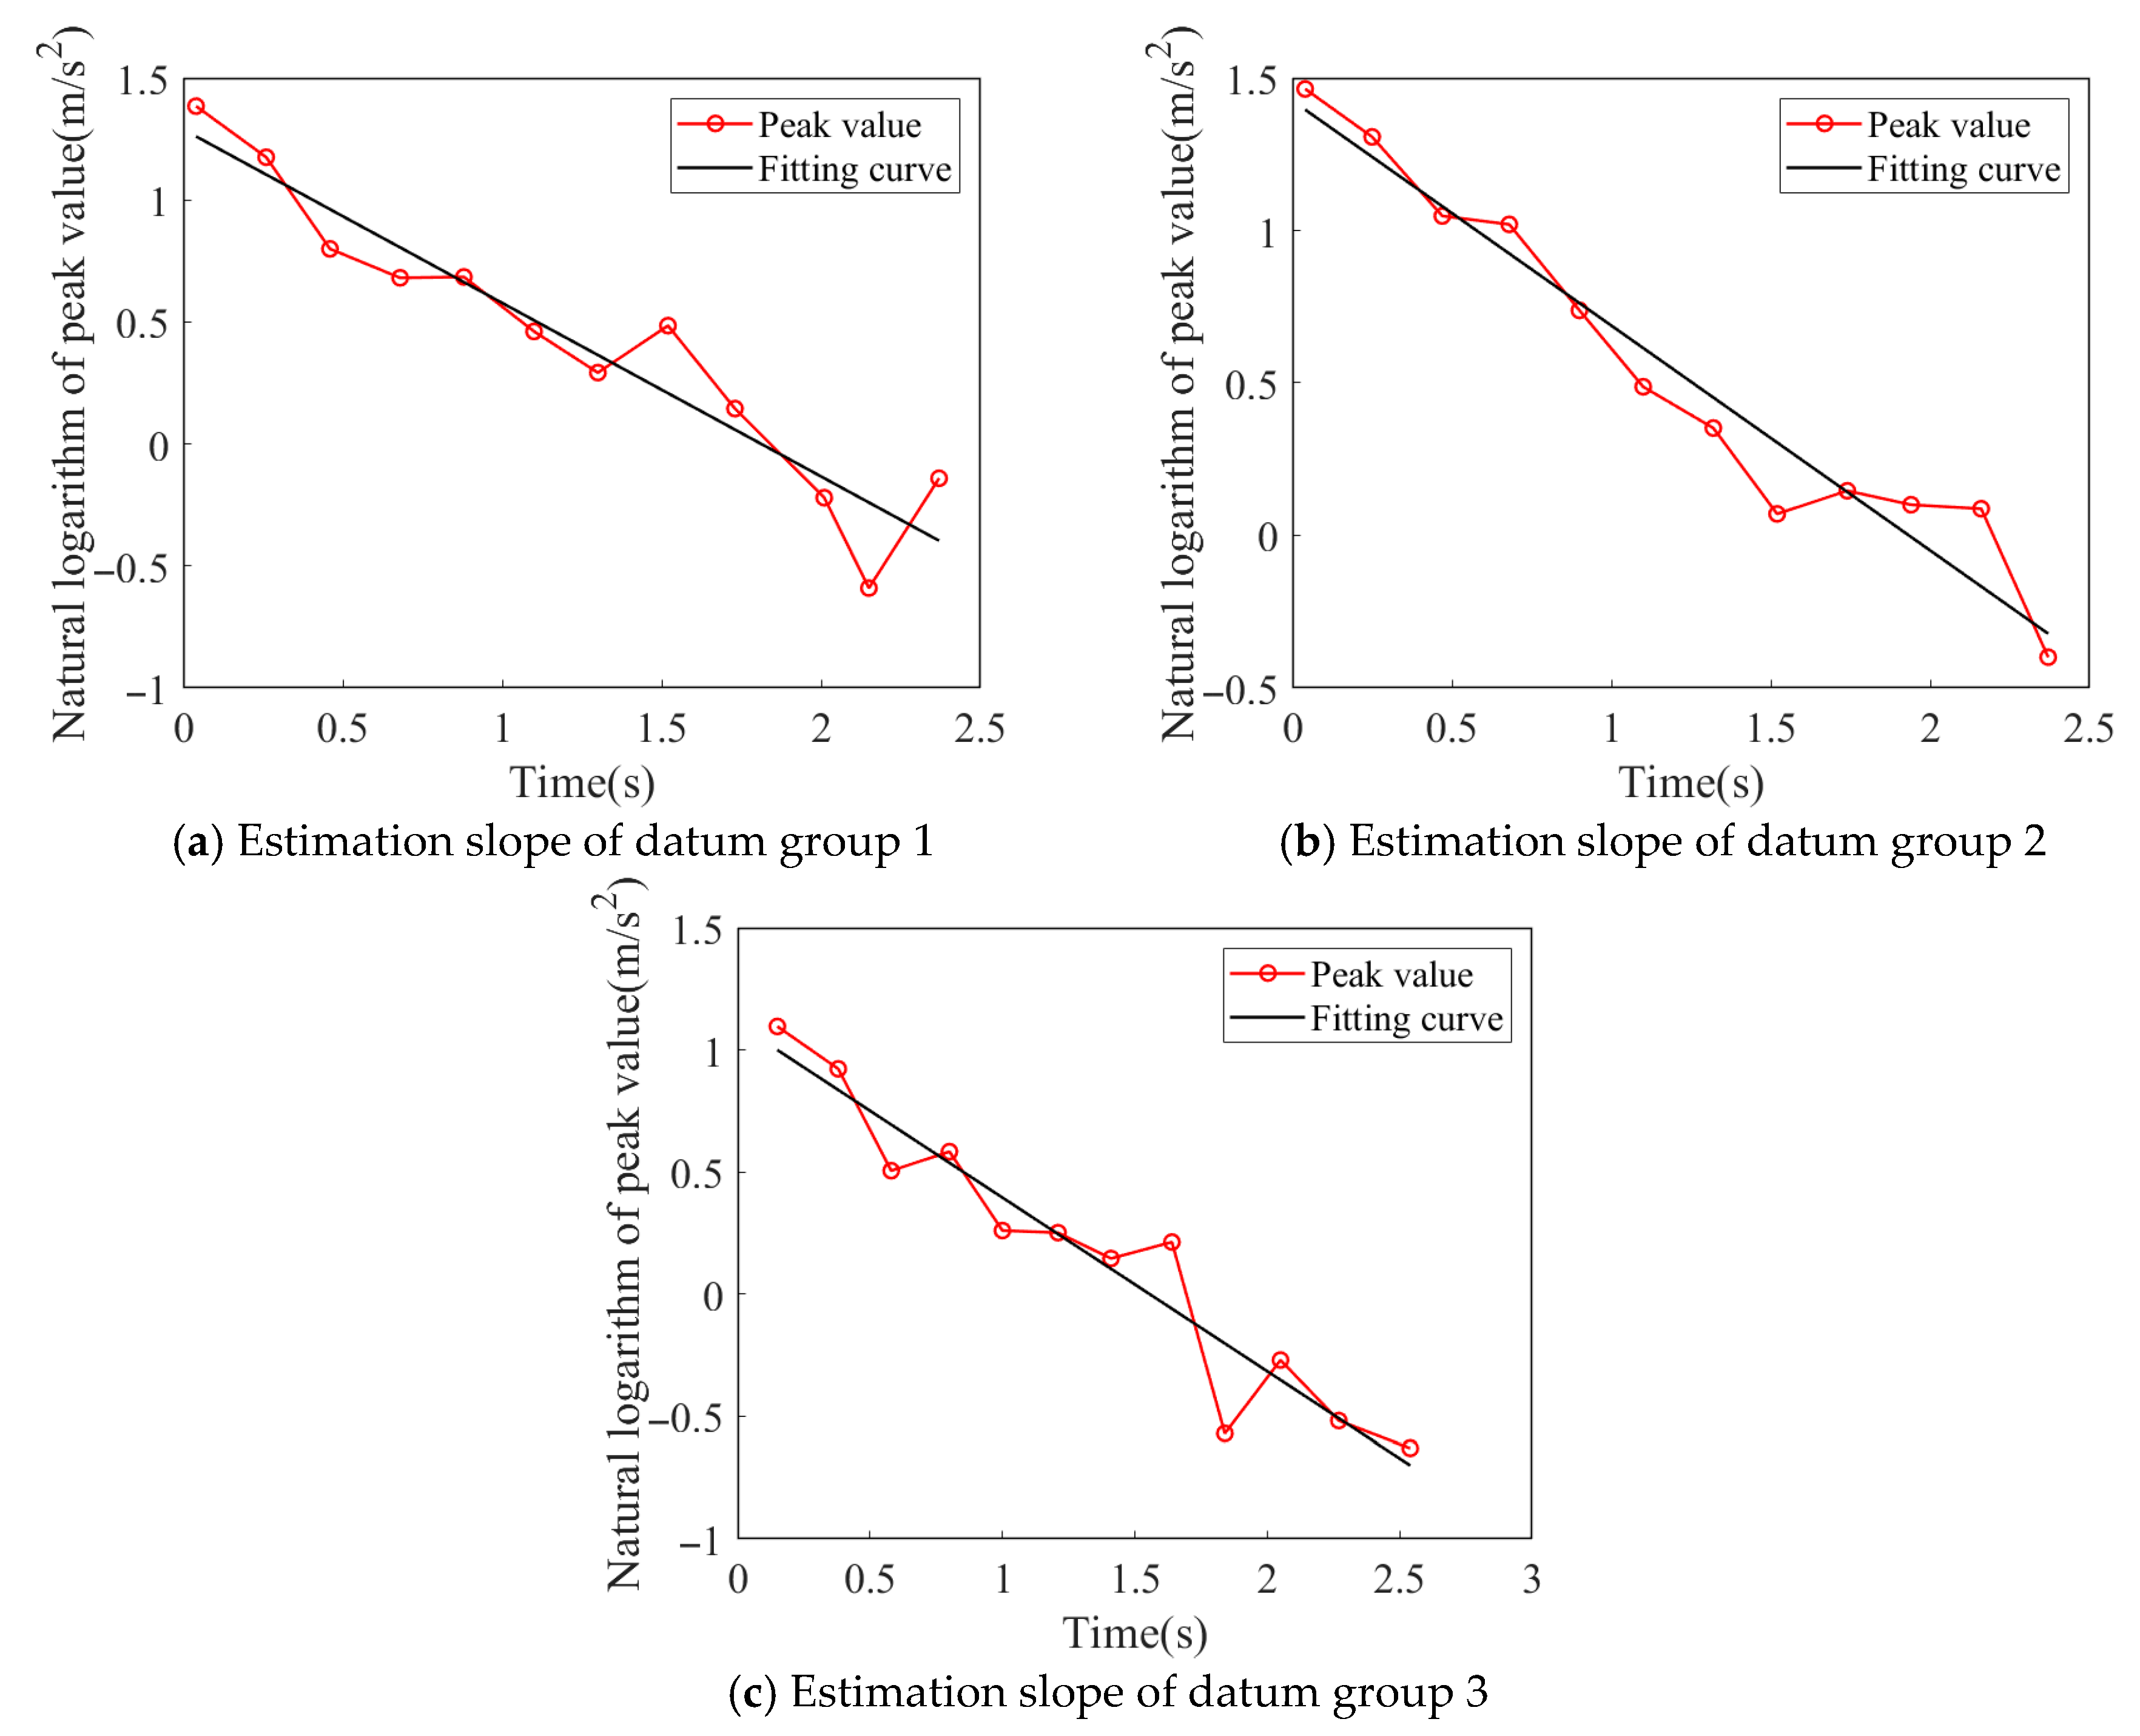
Figure 13 shows, in logarithmic coordinates, the amplitudes of the free decaying responses and the estimation slopes of Equation (18) (black lines), representing damping ratios. The identification damping ratios and their errors for three datum groups are shown in Table 7.
It can be seen from Table 7 that the average value of the damping ratios of the three datum groups is 0.0383. The maximum relative error of identification is 0.52%, which means that the identification with the method proposed in this paper is accurate, stable, and reliable.
Identification of Damping Ratio at Node 4
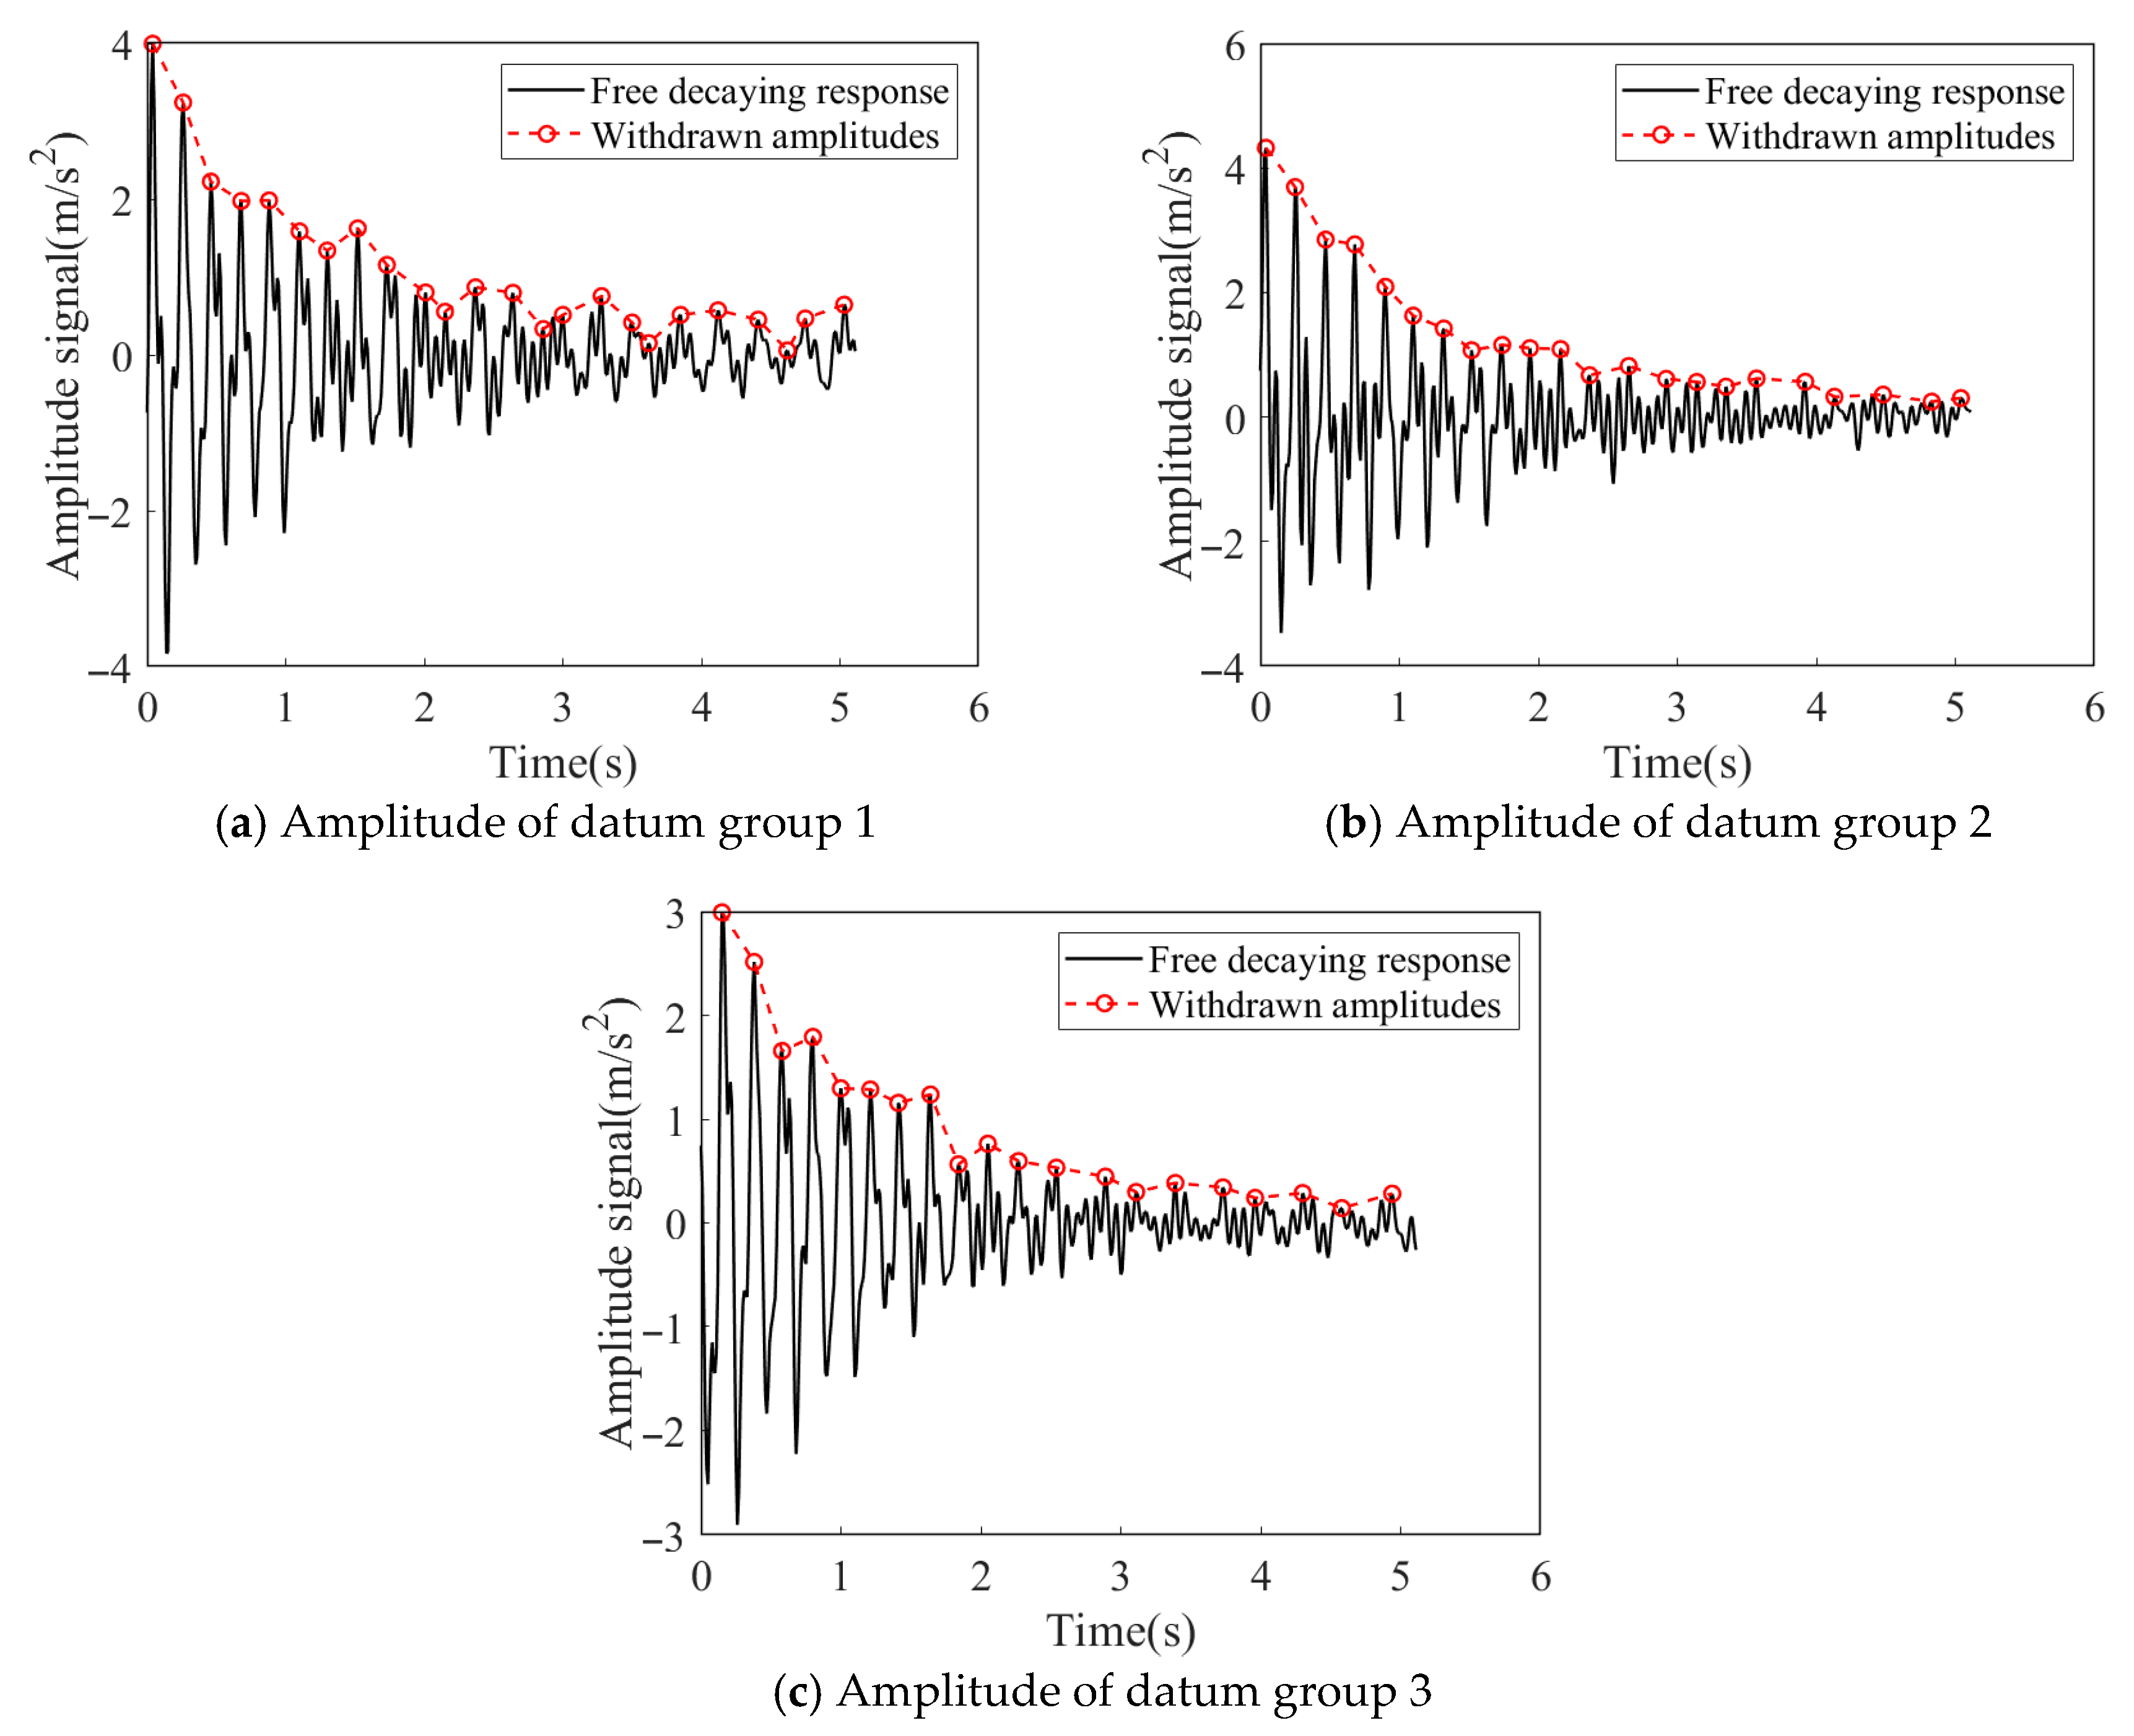
The free attenuation section of the acceleration signal collected by the acceleration sensor at node 4 is intercepted (three sets of data are intercepted, respectively), and the amplitude is extracted, as shown in Figure 14.
Figure 15 shows the Fourier spectrums of the acceleration signals of three datum groups. In the figure, the first-order natural frequency of the bridge is 3.32 Hz for each group, which means that the identification is reliable.
Figure 16 shows in logarithmically coordinates the amplitudes of the free decaying responses and the estimation slopes of Equation (18) (black lines), representing the damping ratios. The identification damping ratios and their errors for three datum groups are shown in Table 8.
It can be seen from Table 8 that the average value of the identification damping ratios of the three datum groups at node 4 is 0.0345. The maximum relative error of identification at node is 2.61%, which means that the identification with the method proposed in this paper is accurate, stable, and reliable.
Taking the average value of identification damping ratio at node 3 as a reference, the relative error of the average value at node 4 is 9.92%. In engineering, the empirical value 0.02 is usually used as the damping ratio of steel structure, and the error between this damping ratio and the damping ratio identified by node 3 is as high as 47.8%. Therefore, does the relative error of the measured damping ratio affect the dynamic response analysis of the structure? Is the value of empirical damping ratio reliable? To discuss these problems, we need to further analyze the dynamic response of the steel arch bridge.

4.3. Dynamic Response Analysis of Steel Arch Bridge

The dynamic response of steel arch bridge is analyzed by numerical simulation. A random excitation and an El Centro seismic wave excitation are, respectively, input to the steel arch bridge to analyze the dynamic response by using the identification and recommended values of damping ratio. The acceleration time history curves can be calculated by using Equation (3) and the state space model. All cases for the analysis are shown in Table 9.

4.3.1. Dynamic Response Analysis Under Random Excitation

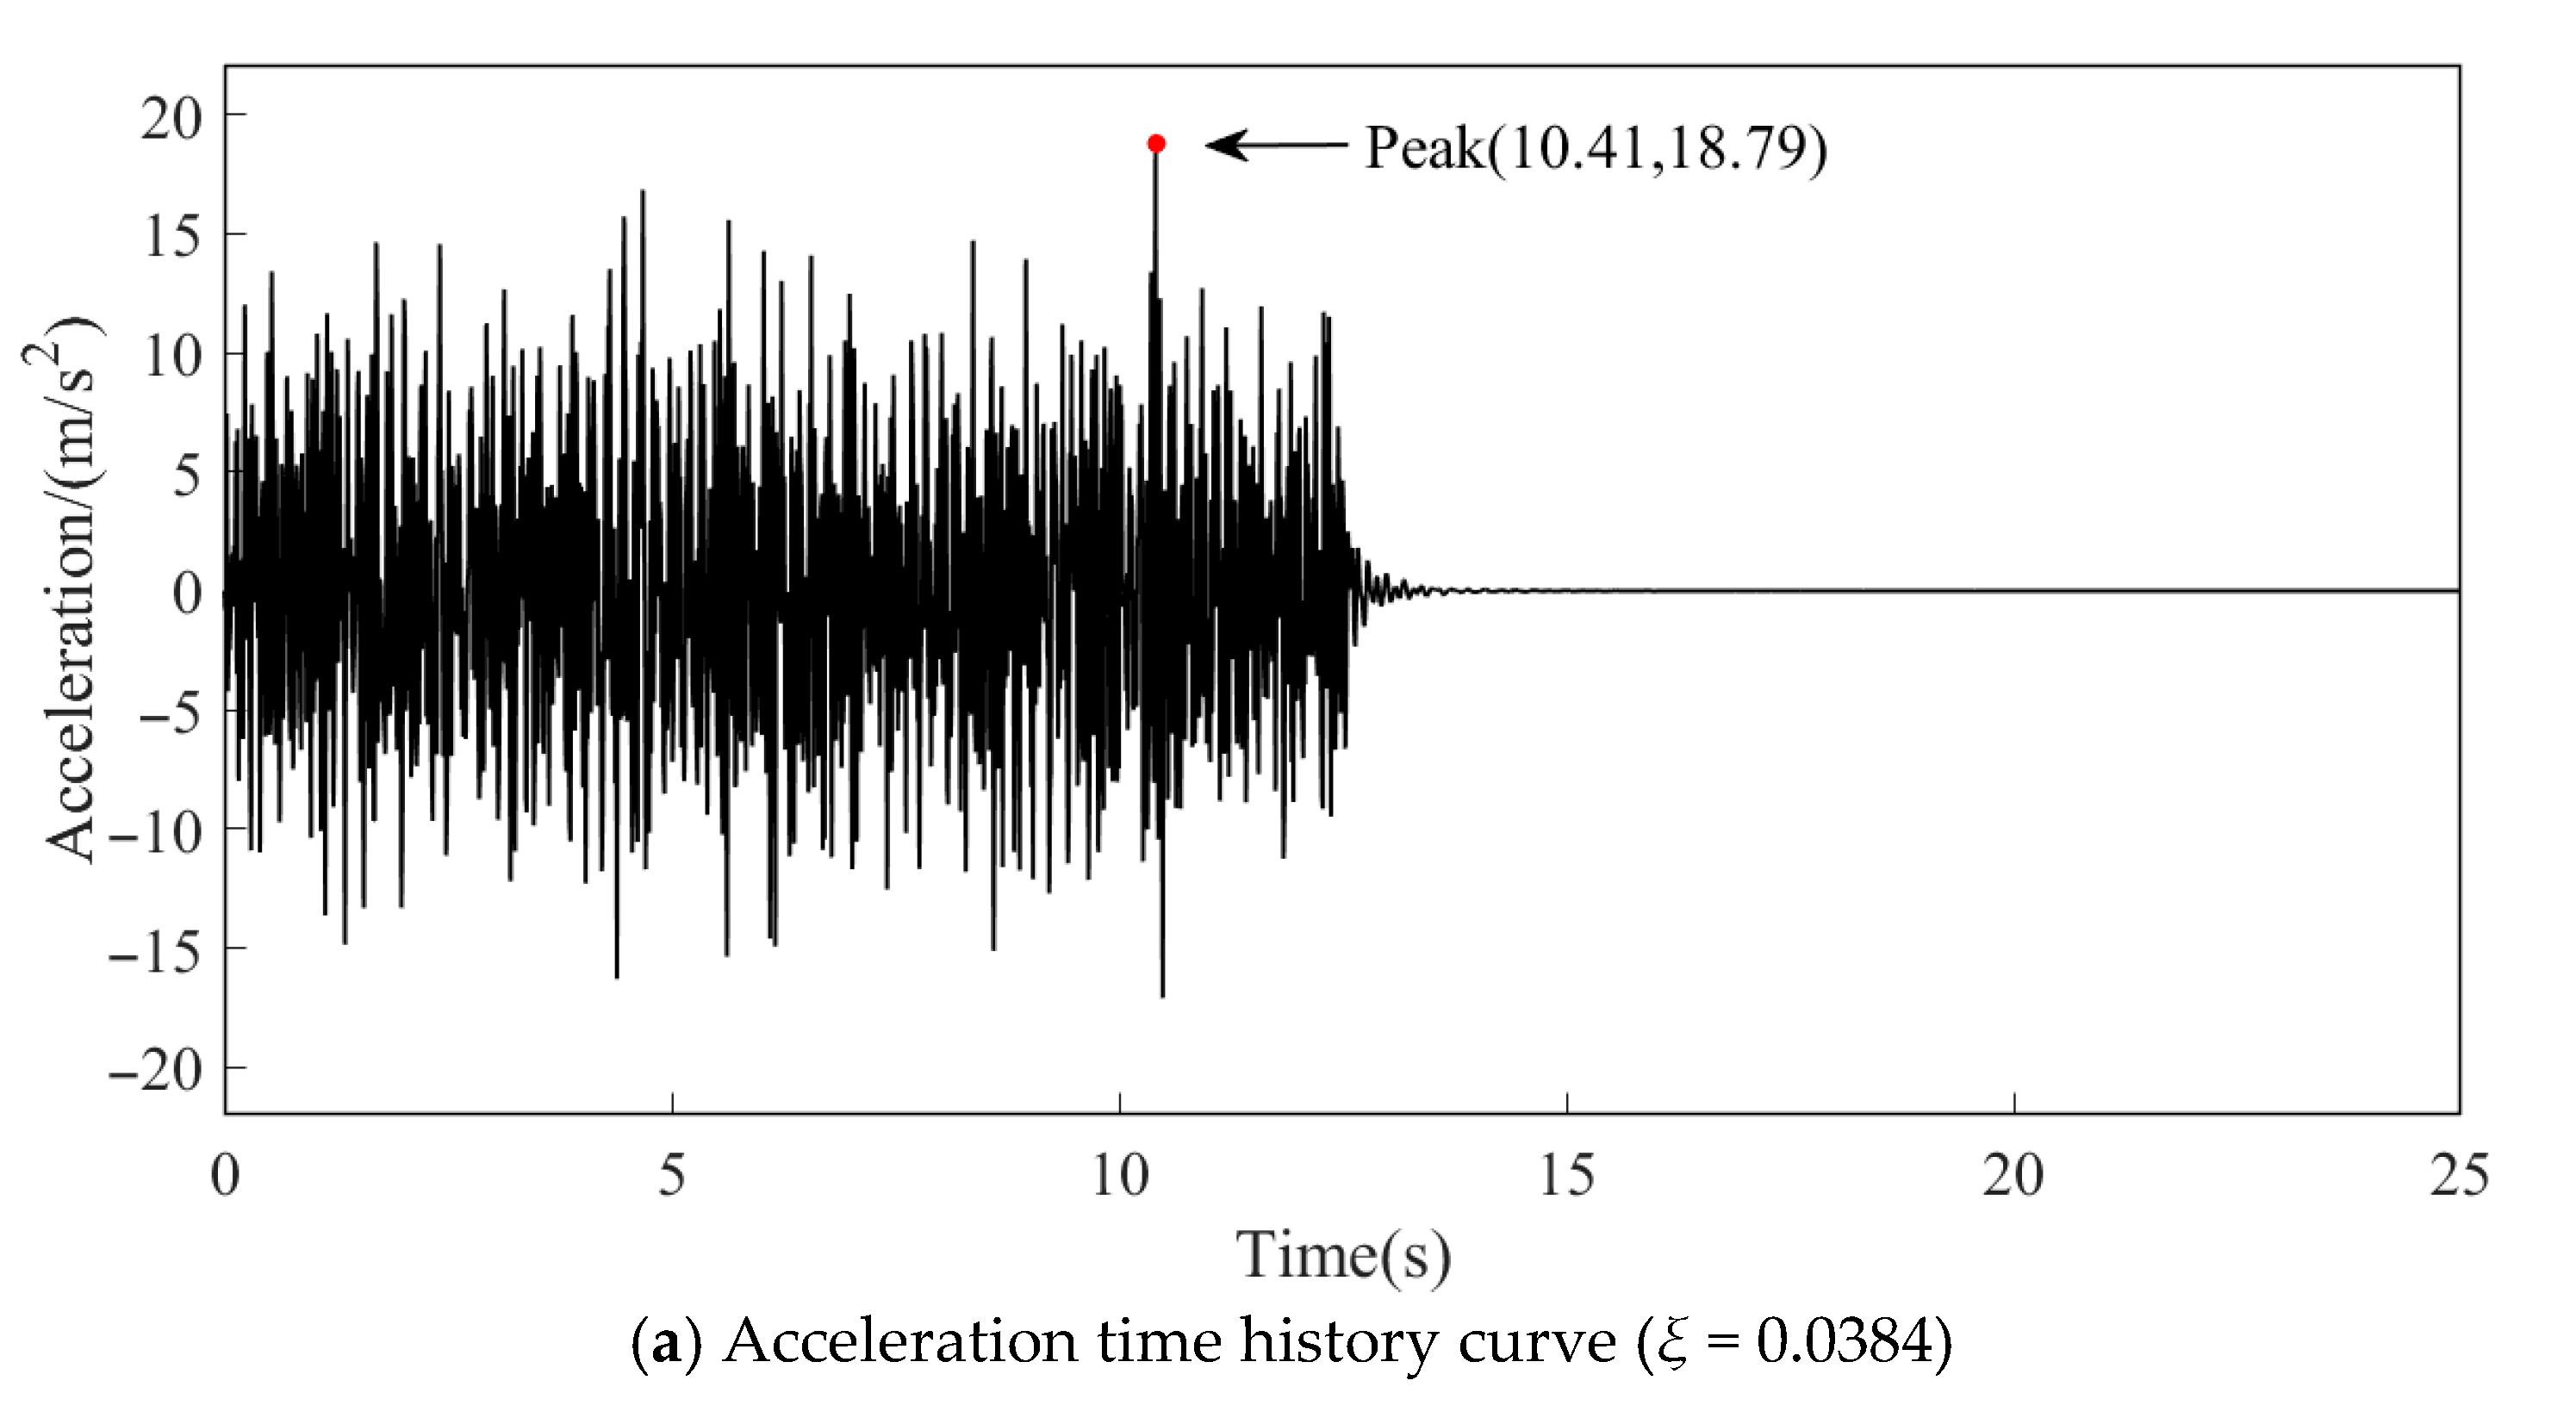
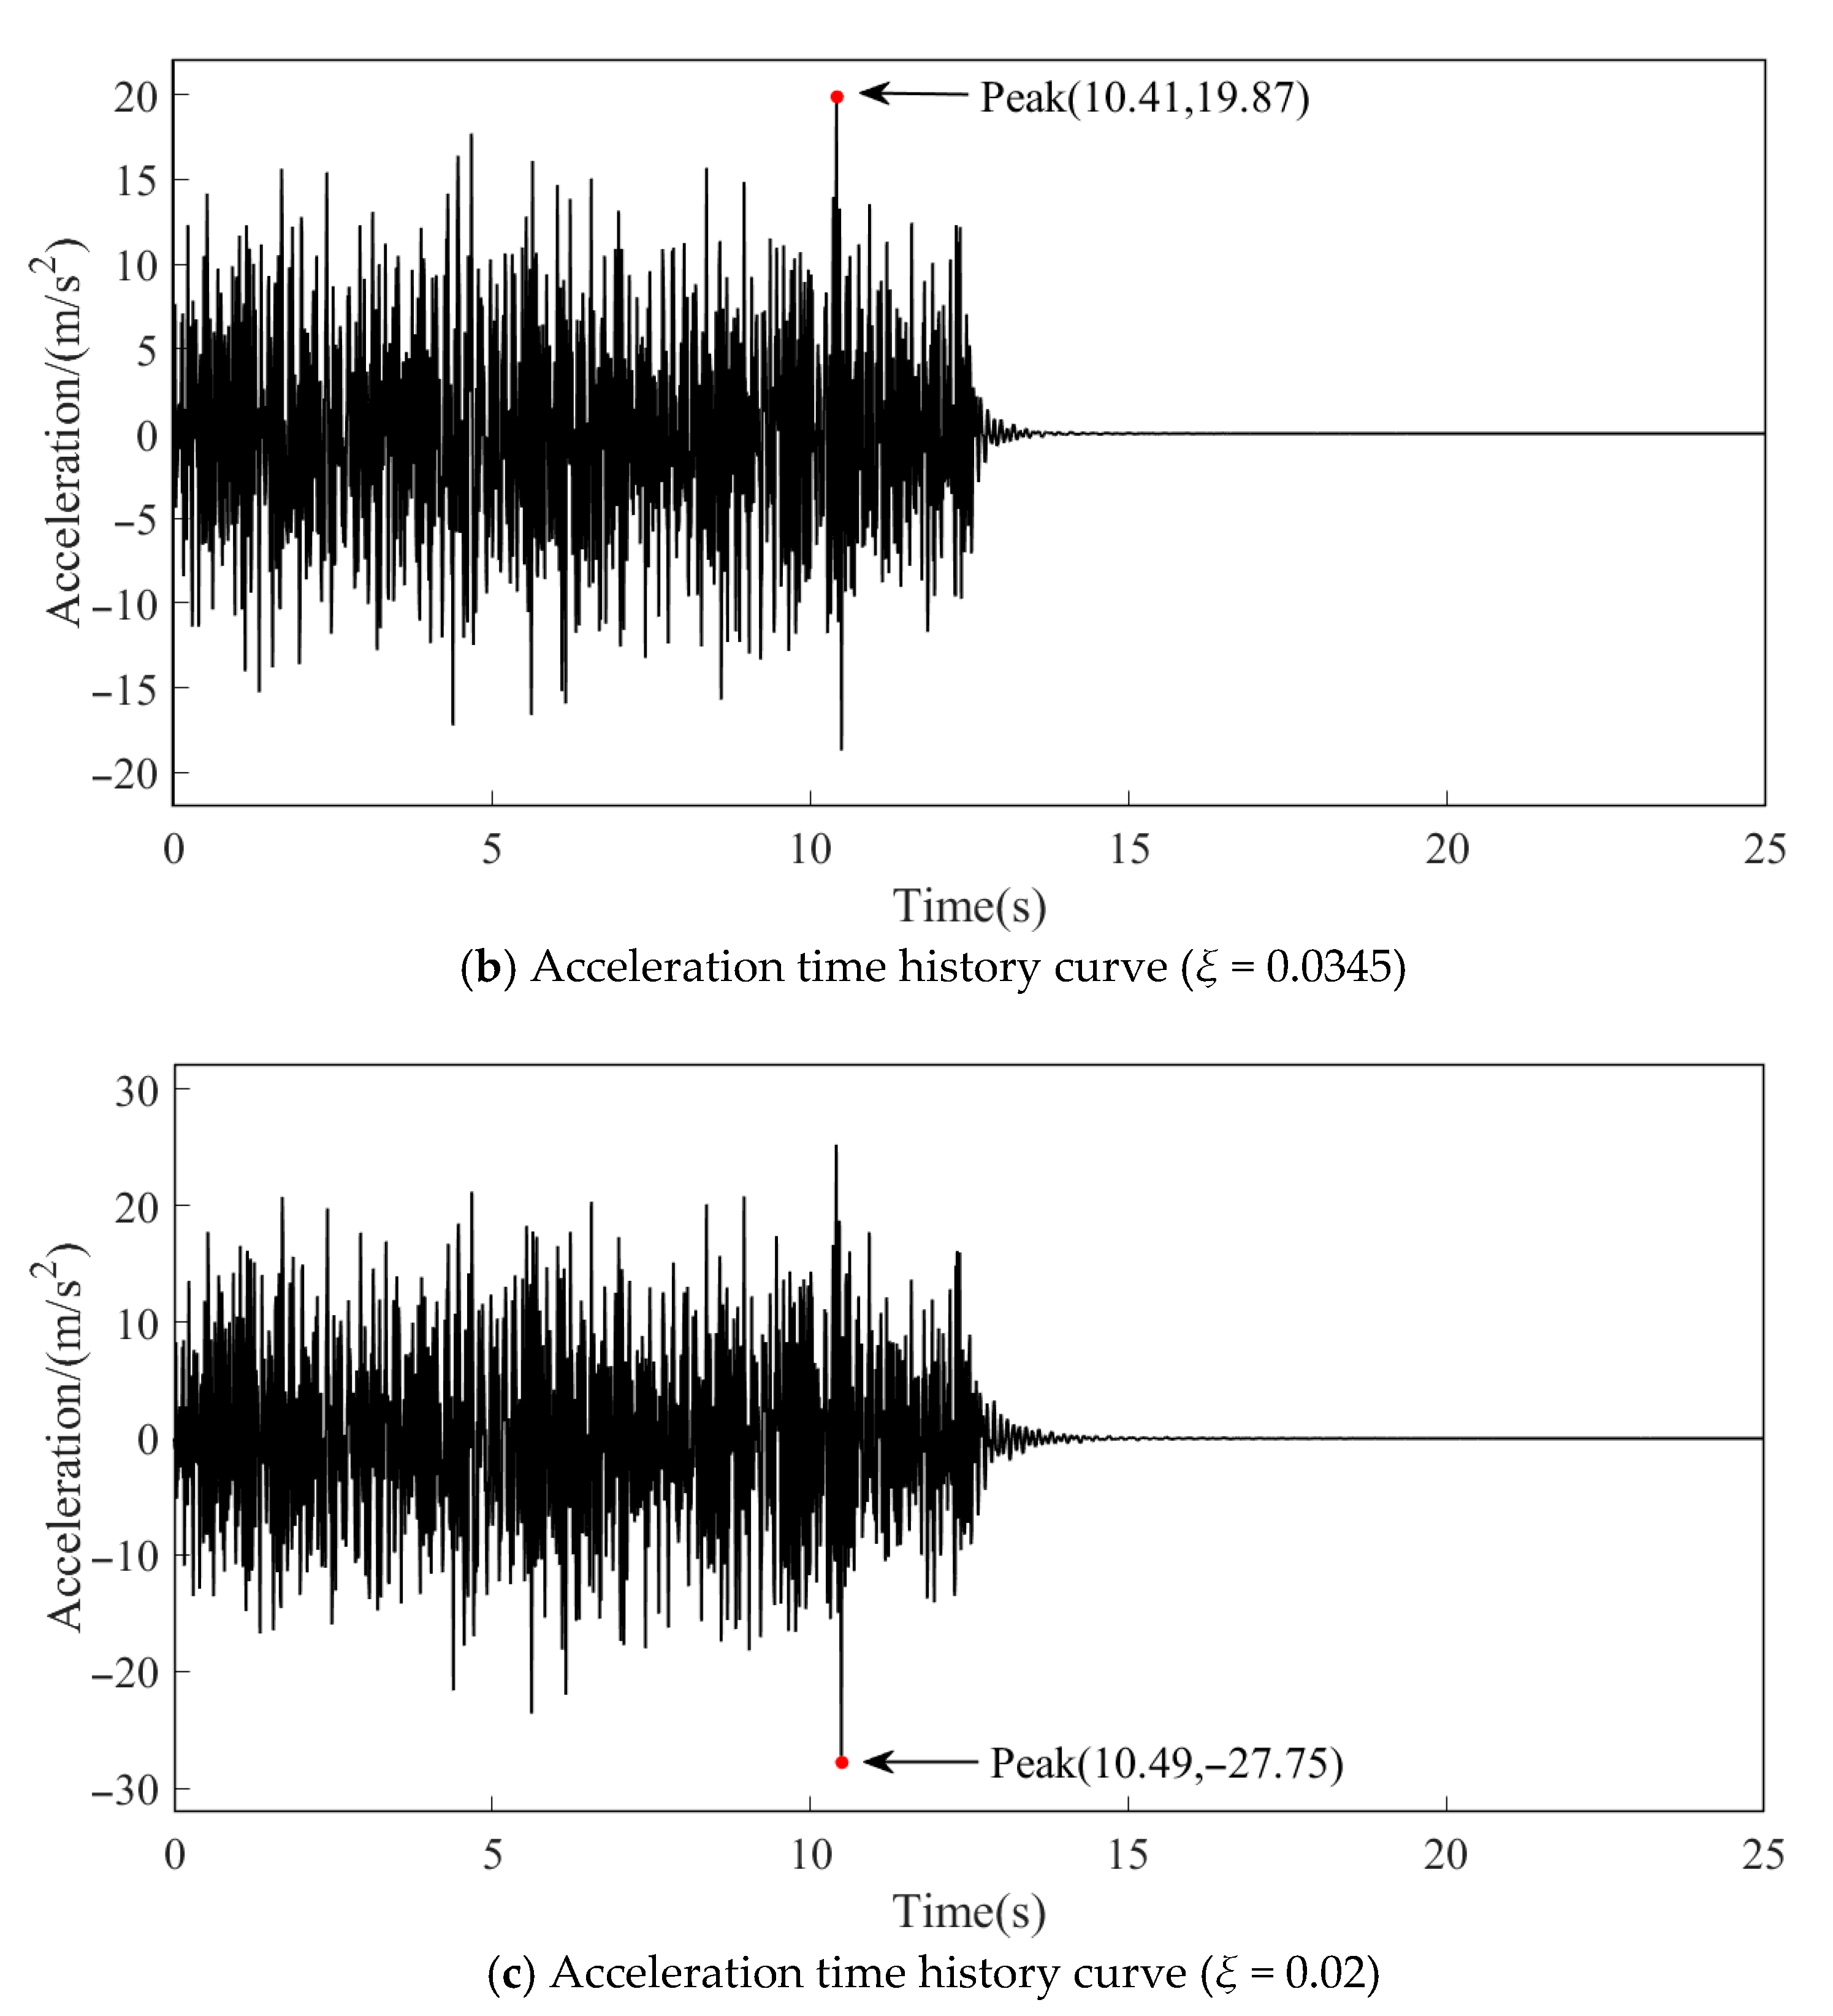
The sampling frequency was set as FS = 100 Hz, the sampling interval as 1/Fs, and the number of generated samples as n = 3000. The vertical random excitation as shown in Figure 17 is applied at node 7 of the steel arch bridge. After the excitation, the output acceleration at node 5 is sampled. Figure 18 shows the acceleration time history curves at node 5.
From the dynamic responses in Figure 18, it can be seen that the acceleration peak is 18.79 m/s2 at 10.41 s when the damping ratio is 0.0383, 19.87 m/s2 at 10.41 s when the damping ratio is 0.0345, and −27.75 m/s2 at 10.49 s when the damping ratio 0.02. The results of the dynamic response analysis are summarized in Table 10.
It can be seen from Table 10 that the relative error of the peak acceleration is 5.75% when using the damping ratios 0.0383 and 0.0345, respectively, to analyze the dynamic response of the steel arch bridge. When the empirical damping ratio of 0.02 is used for dynamic response analysis of steel arch bridge, the relative error of peak acceleration is 47.68% compared with condition 1. Therefore, it can be concluded that the identification damping ratios of node 3 and node 4 are used for the dynamic response of steel arch bridge, and the analysis results are relatively consistent, thus verifying the accuracy of the damping identification method. In contrast, when using empirical damping ratio to analyze the dynamic response of steel arch bridges, it is difficult to accurately describe the dynamic response of the structure with large errors.

4.3.2. Dynamic Response Analysis Under El Centro Seismic Wave Excitation

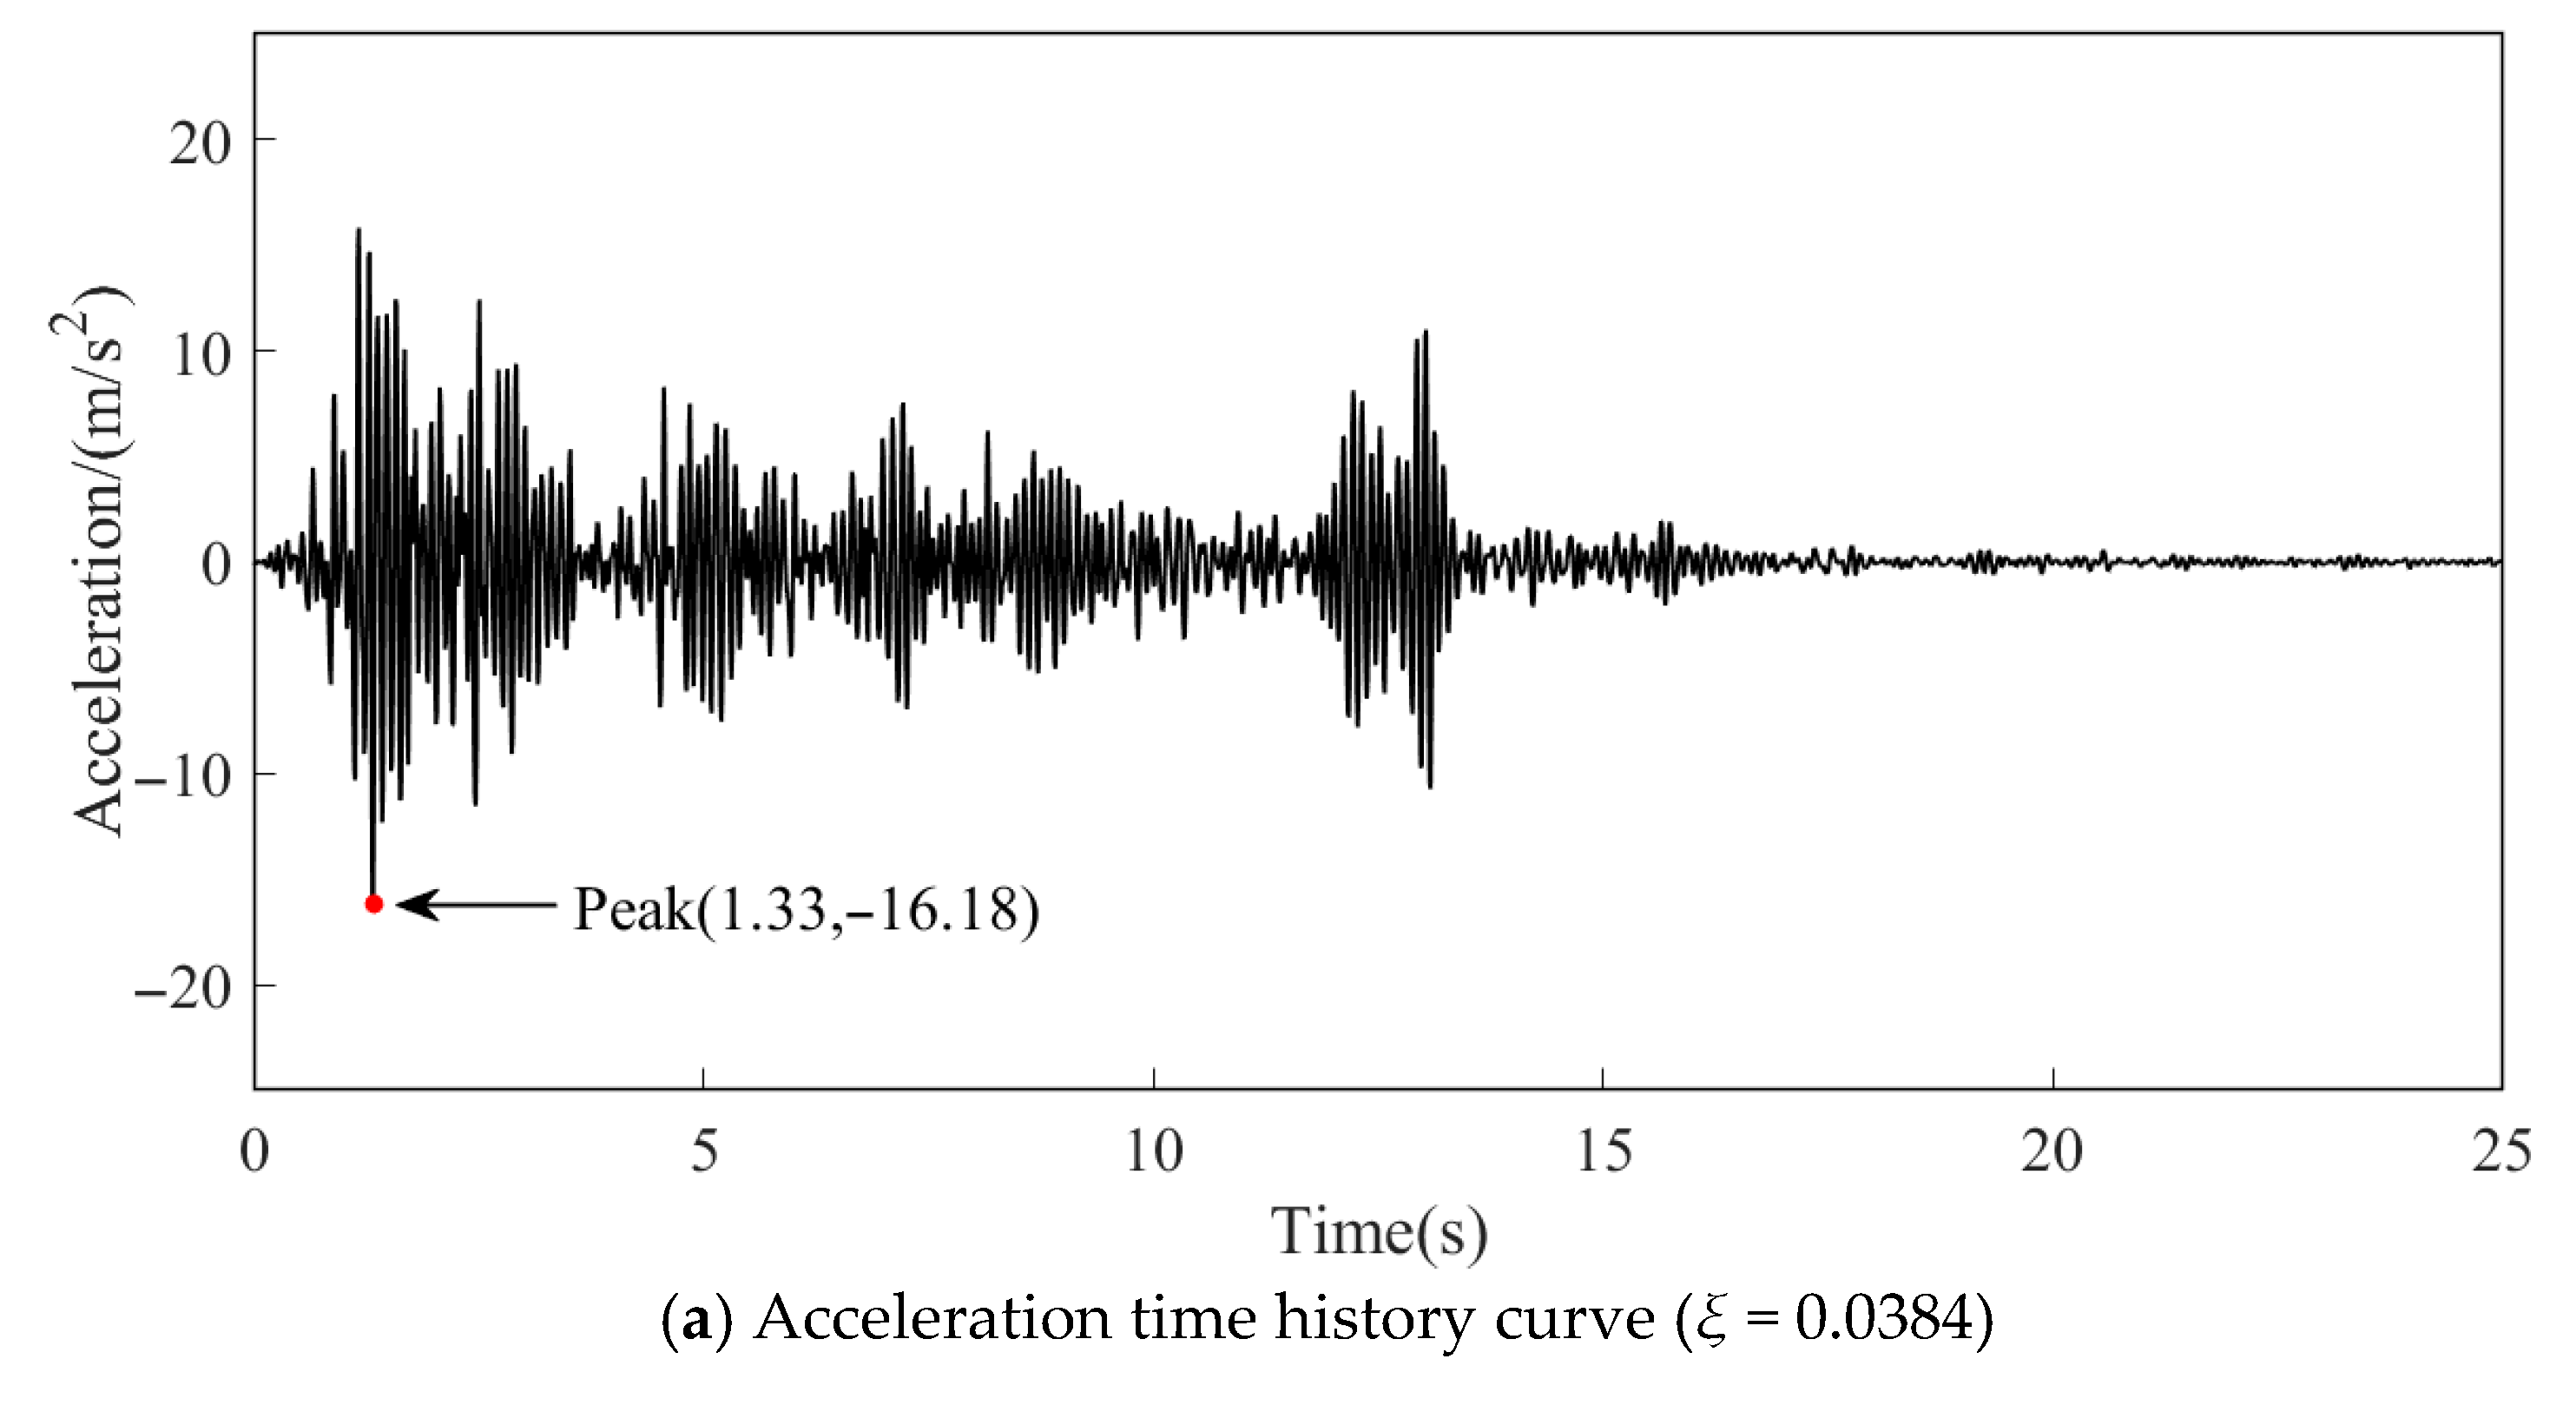
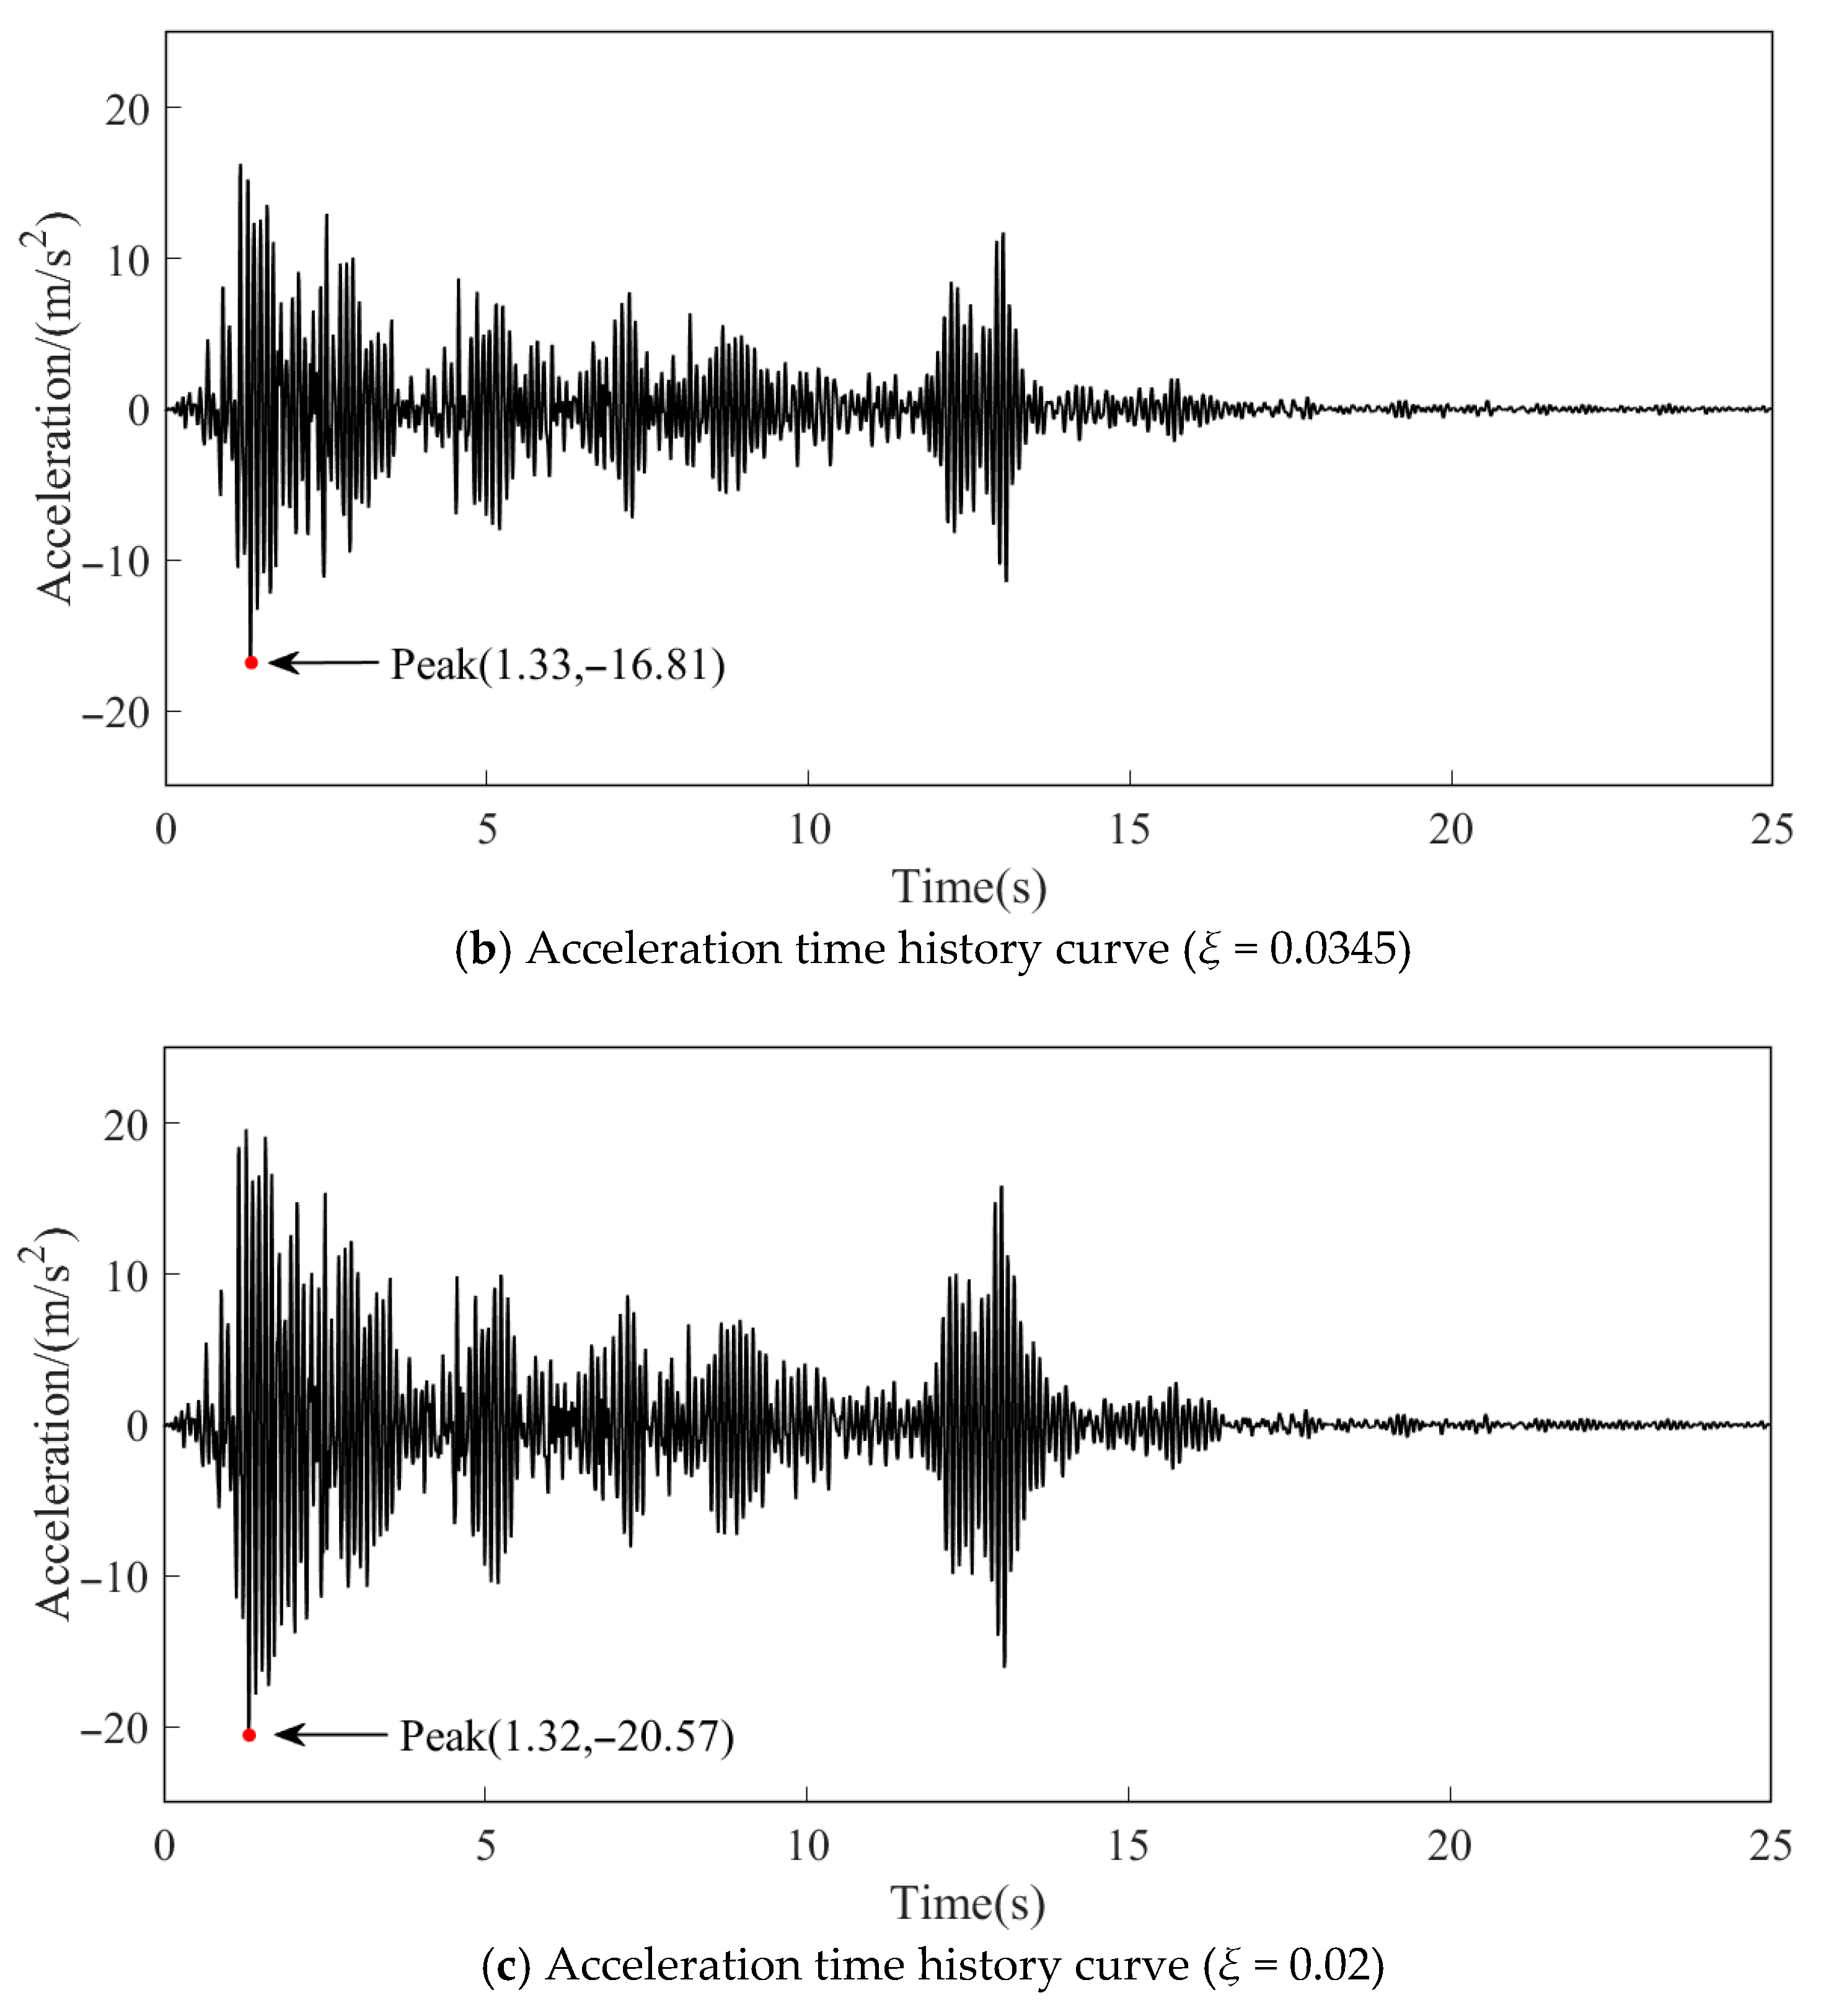
The sampling frequency was set as FS = 100 Hz, the sampling interval as 1/Fs, and the number of generated samples as n = 2500. The excitation of 200 gal El Centro seismic wave as shown in Figure 19 is applied the steel arch bridge. After the excitation, the output acceleration at node 5 is sampled. Figure 20 shows the acceleration time history curves at node 5.
From the dynamic responses in Figure 20, it can be seen that the acceleration peak is −16.18 m/s2 at 1.33 s when the damping ratio is 0.0383, −16.81 m/s2 at 1.33 s when the damping ratio is 0.0345, and −20.57 m/s2 at 1.32 s when the damping ratio 0.02. The results of the dynamic response analysis are summarized in Table 11.
It can be seen from Table 11 that the relative error of the peak acceleration is 3.89% when using the damping ratios 0.0383 and 0.0345, respectively, to analyze the dynamic response of the steel arch bridge. The difference in peak acceleration obtained by using recommended damping ratio 0.02 is 27.13% relative to peak acceleration obtained by using the identification damping ratio of 0.0383. The large difference signifies that the recommended damping ratio cannot be used to correctly describe the dynamic response of the structure after long-term use.
It can be seen from the above that the identification damping ratio of node 3 and node 4 is used for the dynamic response of steel arch bridge, and the analysis results are relatively consistent, which further verifies the accuracy of the damping identification method. In contrast, when using recommended damping ratio to analyze the dynamic response of steel arch bridges, it is difficult to accurately describe the dynamic response of the structure with large errors, so it is necessary to use the identification damping ratio to analyze the dynamic response of the structure.

4.4. The Universality Analysis of Application

The method proposed in this study has high accuracy in numerical simulation applications and steel arch bridge engineering examples. In order to ensure wider applicability, we analyze whether the method is applicable to other engineering structures, such as concrete buildings, composite structures, etc. For different structural types, the material properties, mass distribution, and boundary conditions are different, which will lead to different stiffness matrix, stiffness matrix size, and dimension. The method proposed in this study is to identify the first-order modal damping ratio of the structure by analyzing the free attenuation response of the acceleration signal. In numerical simulation, this method is only related to the mass matrix and the stiffness matrix. When applied to practical engineering, only the acceleration signal needs to be collected to identify the first-order modal damping ratio. In the process of identification, it is necessary to verify the rationality of the sensor placement position to improve the quality of the acceleration signal, ensure that the first-order natural frequency obtained by spectrum analysis (FFT) is accurate, and improve the accuracy of the first-order modal damping ratio identified. The formation analysis of the structure is carried out, and the formation analysis is only related to the mass matrix and stiffness matrix of the structure. Therefore, the method proposed in this study is also applicable to the first-order modal damping ratio identification of other structural types, which has certain engineering significance.

5. Conclusions

This study proposes a method for identifying the first-order modal damping ratio of structures by analyzing the free decay response of acceleration signals. The method involves extracting the free decay response segment from the acceleration output of the structural dynamic response and fitting the logarithm of the amplitude envelope curve. Then, the least squares method is used to estimate the slope of these logarithmic values to establish a theoretical model for identifying the first-order structural modal damping ratio. The method is verified through numerical simulation and an engineering example of a steel arch bridge, and the following conclusions are drawn:
(1) The first-order natural frequency obtained from the spectral analysis (FFT) of the simulated acceleration signal has a very small error compared to the theoretical first-order natural frequency calculated using the stiffness matrix and mass matrix, ensuring the accuracy of the frequency parameter in the damping ratio identification model. This also indicates that the acceleration signal used for damping ratio identification is relatively accurate, thereby ensuring more precise identification results of the first-order damping ratio of the structure.
(2) In the numerical simulation, when the damping ratio is within the range of 0.00500 to 0.06400, the proposed method has a relatively high accuracy in identifying the first-order modal damping ratio of the simply supported beam model. Within this range, the influence of the acceleration signal collection points on the proposed modal damping ratio identification method is relatively small, demonstrating good stability. When the damping ratio is within the range of 0.06400 to 0.07000, the identification accuracy is comparatively lower, but still within an acceptable range. Within this range, the influence of the acceleration signal collection points on the proposed first-order modal damping ratio identification method is relatively high, and the stability is slightly lower.
(3) In the engineering example of the steel arch bridge, the relative error of damping ratio identifications obtained from node 3 data is less than 1.00%, and that from node 4 data is less than 3.00%. The average relative error of the identified modal damping ratios at nodes 3 and 4 is 9.92%. In the dynamic response analysis of the steel arch bridge, the identified first-order modal damping ratio and the empirical value are, respectively, adopted. The results show that the identified first-order modal damping ratio can more effectively describe the dynamic response of the steel arch bridge, and the recommended modal damping ratio value may not be universally applicable. This proves that the method proposed in this study can accurately identify the first-order modal damping ratio of the steel arch bridge and has certain engineering significance.
(4) The proposed method is applicable not only to steel arch bridges but also to other structural types, such as concrete buildings, composite structures, etc., which has certain engineering significance.
The modal damping ratio identification model established in this study is a simple, convenient, practical, and efficient method, which provides an effective and practical method for structural dynamic analysis. However, in numerical simulation, when the modal damping ratio is less than 0.00500 or more than 0.07000, the accuracy of identification may be reduced, and when it is too small or too high, it may even be unsuitable. In engineering applications, it may be affected by factors such as noise, which will cause the acceleration free attenuation response amplitude to mutate at a certain moment. This mutation causes the curve of amplitude fitting to produce errors. In the least squares method, it is easy to cause the estimated slope to be inaccurate, affecting the accuracy of the first-order modal damping ratio identification. This requires further optimization of the first-order damping ratio identification model and improvement of the first-order modal damping ratio identification accuracy by changing the interception point of the free attenuation section of the acceleration signal and the screening of the amplitude.

Author Contributions

Conceptualization, S.L. and Q.Y.; methodology, S.L.; software, Y.N.; validation, Y.N.; formal analysis, G.H.; investigation, Q.Y.; resources, G.H.; data curation, G.H.; writing—original draft preparation, S.L.; writing—review and editing, S.L. and Y.N.; visualization, Y.N.; supervision, S.L. and Q.Y.; project administration, S.L. All authors have read and agreed to the published version of the manuscript.

Funding

This research received no external funding.

Institutional Review Board Statement

Not applicable.

Informed Consent Statement

Not applicable.

Data Availability Statement

Dataset available on request from the authors. The raw data supporting the conclusions of this article will be made available by the authors on request.

Acknowledgments

The author hereby expresses his gratitude to all the contributors who participated in this research. We are also very grateful for the valuable comments provided by the anonymous reviewers and editors.

Conflicts of Interest

The authors declare no conflict of interest.

References

  1. Bartilson, D.T.; Jang, J.; Smyth, A.W. Symmetry Properties of Natural Frequency and Mode Shape Sensitivities in Symmetric Structures. Mech. Syst. Signal Process. 2020, 143, 106797. [Google Scholar] [CrossRef]
  2. Bertrand, D.; Grange, S. Progressive Collapse Analysis of RC Frame Building Based on Pseudo-Dynamic (PsD) Testing with Sub-Structuring. J. Build. Eng. 2022, 52, 104420. [Google Scholar] [CrossRef]
  3. Huang, F.L.; Wang, X.M.; Chen, Z.Q.; He, X.H.; Ni, Y.Q. A New Approach to Identification of Structural Damping Ratios. J. Sound Vib. 2007, 303, 144–153. [Google Scholar] [CrossRef]
  4. Wang, Z.; Chen, J.; Shen, J. Coarse-Grained Evaluation of the First Mode Damping Ratios in Buildings. J. Wind Eng. Ind. Aerodyn. 2022, 223, 104944. [Google Scholar] [CrossRef]
  5. Nejad, A.Z.B.; Sahebi, M.M. An Investigation on the Capability of Proper Orthogonal Modes in Determining the Natural Frequencies and Damping Ratios of Linear Structural Systems. Eng. Struct. 2021, 243, 112691. [Google Scholar] [CrossRef]
  6. Williams, K.R.; Lesser, T.H.J. A Finite Element Analysis of the Natural Frequencies of Vibration of the Human Tympanic Membrane. Part I. Br. J. Audiol. 1990, 24, 319–327. [Google Scholar] [CrossRef]
  7. Nandan, H.; Singh, M.P. Effects of Thermal Environment on Structural Frequencies. II: A System Identification Model. Eng. Struct. 2014, 81, 491–498. [Google Scholar] [CrossRef]
  8. Huang, M.S.; Gul, M.; Zhu, H.P. Vibration-Based Structural Damage Identification under Varying Temperature Effects. J. Aerosp. Eng. 2018, 31, 04018014. [Google Scholar] [CrossRef]
  9. Ji, X.; Xu, X.; Huang, K. Damage Detection of Frame Structure Using a Novel Time-Domain Regression Method. Discover Appl. Sci. 2024, 6, 359. [Google Scholar] [CrossRef]
  10. Khatami, S.; Naderpour, H.; Barros, R.; Jakubczyk-Gałczyńska, A.; Jankowski, R. Effective Formula for Impact Damping Ratio for Simulation of Earthquake-Induced Structural Pounding. Geosciences 2019, 9, 347. [Google Scholar] [CrossRef]
  11. Gong, F.; Pan, C.; Xia, Y. Experimental Study on the Damping Ratio Evaluation of a Cable-Stayed Bridge Based on Damping Dissipation Function. Struct. Control Health Monit. 2025, 2025, 5810450. [Google Scholar] [CrossRef]
  12. De Risi, M.T.; Scala, S.A.; Del Gaudio, C.; Verderame, G.M. Seismic Retrofit of Italian Pre-‘70 Case-Study RC Buildings by Solving Shear Failures: Code-Compliant Assessment and Economic Effort. Int. J. Disaster Risk Reduct. 2023, 97, 104007. [Google Scholar] [CrossRef]
  13. Magalhães, F.; Cunha, Á.; Caetano, E.; Brincker, R. Damping Estimation Using Free Decays and Ambient Vibration Tests. Mech. Syst. Signal Process. 2010, 24, 1274–1290. [Google Scholar] [CrossRef]
  14. Torvik, P.J. On Estimating System Damping from Frequency Response Bandwidths. J. Sound Vib. 2011, 330, 6088–6097. [Google Scholar] [CrossRef]
  15. Lee, S.H.; Min, K.W.; Hwang, J.S.; Kim, J. Evaluation of Equivalent Damping Ratio of a Structure with Added Dampers. Eng. Struct. 2004, 26, 335–346. [Google Scholar] [CrossRef]
  16. Avci, O. Amplitude-Dependent Damping in Vibration Serviceability: Case of a Laboratory Footbridge. J. Archit. Eng. 2016, 22, 04016005. [Google Scholar] [CrossRef]
  17. Zou, D.J.; Liu, T.J.; Qiao, G.F. Experimental Investigation on the Dynamic Properties of RC Structures Affected by the Reinforcement Corrosion. Adv. Struct. Eng. 2014, 17, 851–860. [Google Scholar] [CrossRef]
  18. Dai, K.; Lu, D.; Zhang, S.; Shi, Y.; Meng, J.; Huang, Z. Study on the Damping Ratios of Reinforced Concrete Structures from Seismic Response Records. Eng. Struct. 2020, 223, 111143. [Google Scholar] [CrossRef]
  19. Ha, T.; Shin, S.H.; Kim, H. Damping and Natural Period Evaluation of Tall RC Buildings Using Full-Scale Data in Korea. Appl. Sci. 2020, 10, 1568. [Google Scholar] [CrossRef]
  20. Khosravi, M.R.; Mohammadizadeh, M.R.; Saffari, H.; Torkzadeh, P. A Study of Progressive Collapse in Moment-Resisting Reinforced Concrete Structures Considering Damping Ratio. Iran. J. Sci. Technol. Trans. Civ. Eng. 2024, 48, 3323–3337. [Google Scholar] [CrossRef]
  21. Guo, Z.; Sheng, M.; Ma, J.; Zhang, W. Damping Identification in Frequency Domain Using Integral Method. J. Sound Vib. 2015, 338, 237–249. [Google Scholar] [CrossRef]
  22. Brumat, M.; Slavič, J.; Boltežar, M. Spatial Damping Identification in the Frequency Domain—A Theoretical and Experimental Comparison. J. Sound Vib. 2016, 376, 182–193. [Google Scholar] [CrossRef]
  23. Zhou, R.; Yang, M.; Shang, C.; Zeng, Q. A Frequency Domain Identification Method of General Mechanical Drive System. In Proceedings of the 2023 IEEE 4th China International Youth Conference On Electrical Engineering (CIYCEE), Chengdu, China, 8–10 December 2023; pp. 1–7. [Google Scholar]
  24. Qu, C.-X.; Liu, Y.-F.; Yi, T.-H.; Li, H.-N. Structural Damping Ratio Identification through Iterative Frequency Domain Decomposition. J. Struct. Eng. 2023, 149, 5. [Google Scholar] [CrossRef]
  25. Kerschen, G.; Golinval, J. Frequency Domain Approaches for the Identification of an Experimental Beam with a Local Nonlinearity. In Proceedings of the 20th International Modal Analysis Conference, Los Angeles, CA, USA, 4–7 February 2002. [Google Scholar]
  26. Karaağaçlı, T.; Özgüven, H.N. A Frequency Domain Nonparametric Identification Method for Nonlinear Structures: Describing Surface Method. Mech. Syst. Signal Process. 2020, 144, 106872. [Google Scholar] [CrossRef]
  27. Gründel, L.; Reiners, C.; Lienenlüke, L.; Storms, S.; Brecher, C.; Bitterolf, D. Frequency-Based Identification of the Inertial Parameters of an Industrial Robot. In Lecture Notes in Production Engineering; Springer: Berlin/Heidelberg, Germany, 2020; pp. 429–438. [Google Scholar]
  28. Álvarez, R.; Borbor, E.; Grijalva, F. Comparison of methods for signal analysis in the time-frequency domain. In Proceedings of the 2019 IEEE Fourth Ecuador Technical Chapters Meeting (ETCM), Guayaquil, Ecuador, 11–15 November 2019; pp. 1–6. [Google Scholar]
  29. Ying, H.; Liu, J.; Shen, S. Half-Power Band Width Method and INV Damping Ratio Solver Study. Noise Vib. Control 2006, 2006, 4–6. [Google Scholar]
  30. Sun, W.P.; Sun, Y.H.; Yu, Y.P.; Wu, B.S. A Comparison of the Improved and Classic Half-Power Bandwidth Methods in Estimating Damping for Multi-DOF Systems. J. Vib. Eng. Technol. 2018, 6, 219–225. [Google Scholar] [CrossRef]
  31. Vu, D.H.; Ta, D.-T. Viscous damping estimation of structures using extreme frequency bandwidth method. Vietnam Inst. Build. Sci. Technol. 2024, 3, 22–30. [Google Scholar] [CrossRef]
  32. Sun, P.; Wang, D. Comparison of Damping Parameters Based on the Half-Power Bandwidth Methods of Viscous and Hysteretic Damping Models. J. Vib. Control 2021, 29, 968–979. [Google Scholar] [CrossRef]
  33. Wang, J.-T.; Jin, F.; Zhang, C.-H. Estimation Error of the Half-Power Bandwidth Method in Identifying Damping for Multi-DOF Systems. Soil Dyn. Earthq. Eng. 2012, 39, 138–142. [Google Scholar] [CrossRef]
  34. Papagiannopoulos, G.A.; Hatzigeorgiou, G.D. On the Use of the Half-Power Bandwidth Method to Estimate Damping in Building Structures. Soil Dyn. Earthq. Eng. 2011, 31, 1075–1079. [Google Scholar] [CrossRef]
  35. Wu, B. A Correction of the Half-Power Bandwidth Method for Estimating Damping. Arch. Appl. Mech. 2015, 85, 315–320. [Google Scholar] [CrossRef]
  36. Treszkai, M.F.; Sipos, D.; Feszty, D. Damping Determination by Half-Power Bandwidth Method for a Slightly Damped Rectangular Steel Plate in the Mid-Frequency Range. Acta Tech. Jaurinensis 2020, 13, 177–196. [Google Scholar] [CrossRef]
  37. Wang, X.; Liu, K.; Liu, H.; He, Y. Damping Identification with Acceleration Measurements Based on Sensitivity Enhancement Method. Shock Vib. 2018, 2018, 6476783. [Google Scholar] [CrossRef]
  38. Zhang, G.; Tang, B.; Chen, Z. Operational Modal Parameter Identification Based on PCA-CWT. Measurement 2019, 139, 334–345. [Google Scholar] [CrossRef]
  39. Zhang, M.; Huang, X.; Li, Y.; Sun, H.; Zhang, J.; Huang, B. Improved Continuous Wavelet Transforms for Modal Parameter Identification of Long-Span Bridges. Shock Vib. 2020, 2020, 4360184. [Google Scholar] [CrossRef]
  40. Dou, H.; Hua, Y.; Qi, A.; Xu, J.; Zhao, J. A Transient Response Domain Time Analysis Method of Transmission Lines. In Advances in Intelligent Systems and Computing; Springer International Publishing: Cham, Switzerland, 2019; pp. 869–873. [Google Scholar]
  41. Ge, C.; Sutherland, S. Application of Experimental Modal Analysis to Determine Damping Properties for Stacked Corrugated Boxes. Math. Probl. Eng. 2013, 2013, 651348. [Google Scholar] [CrossRef]
  42. López-Aragón, J.A.; Puchol, V.; Astiz, M.A. Influence of the Modal Damping Ratio Calculation Method in the Analysis of Dynamic Events Obtained in Structural Health Monitoring of Bridges. J. Civil Struct. Health Monit. 2024, 14, 1191–1213. [Google Scholar] [CrossRef]
  43. Yang, P.; Ying, L.; Chen, M.; Wang, J.; Wang, G. The Processing Method of Background Noise in Secondary Path Identification of ANC System. In Electrical Measurement and Instrumentation; Atlantis Press: Amsterdam, The Netherlands, 2017. [Google Scholar]
  44. Koruk, H.; Rajagopal, S. A Comprehensive Review on the Viscoelastic Parameters Used for Engineering Materials, Including Soft Materials, and the Relationships between Different Damping Parameters. Sensors 2024, 24, 6137. [Google Scholar] [CrossRef]
  45. Dziedziech, K.; Staszewski, W.J.; Uhl, T. Wavelet-Based Modal Analysis for Time-Variant Systems. Mech. Syst. Signal Process. 2015, 50–51, 323–337. [Google Scholar] [CrossRef]
  46. Xi, Y.; Zhang, X.; Pan, J.; Sun, L.; Li, H.; Wang, Z. Assessment of Damping in Monopile-Supported Offshore Wind Turbines: Integrating Operational Modal Analysis with Regression Techniques. Structures 2025, 75, 108702. [Google Scholar] [CrossRef]
  47. Bernal, D. Analytical Minimization of Synchronicity Errors in Stochastic Identification. Mech. Syst. Signal Process. 2018, 98, 415–424. [Google Scholar] [CrossRef]
  48. Stachiw, T.; Ricciardi, J.; Crain, A. Combined Time- and Frequency-Domain Aircraft System Identification Using Pareto Optimization. In Volume 4: Advances in Aerospace Technology, Proceedings of the ASME 2021 International Mechanical Engineering Congress and Exposition, Virtual, 1–5 November 2021; ASME: New York, NY, USA, 2021. [Google Scholar]
  49. Stollwitzer, A.; Bettinelli, L.; Loidl, S.; Schellander, J.; Vospernig, M.; Fink, J. Novel Evaluation Methods for Data-Based Determination of Damping Factors in the Frequency and Time Domains with Application on Railway Bridges. Railw. Eng. Sci. 2025; in press. [Google Scholar] [CrossRef]
  50. Zhang, X.; Luo, R.; He, J.; Hua, X.; Yang, L.; Peng, X.; Yang, C.; Chen, Z. Identification of Damping Ratios of Long-Span Bridges Using Adaptive Modal Extended Kalman Filter. Struct. Control Health Monit. 2025, 2025, 1493319. [Google Scholar] [CrossRef]
  51. Wang, J.; Zhu, Q.; Zhang, Q.; Wang, X.; Du, Y. Bayesian Continuous Wavelet Transform for Time-Varying Damping Identification of Cables Using Full-Field Measurement. Autom. Constr. 2024, 168, 105791. [Google Scholar] [CrossRef]
  52. Gong, F.; Xia, Y.; Komarizadehasl, S.; He, T. Bridge Damping Ratio Identification and Variation Analysis Based on Two-Year Monitoring Data Considering Operational Environment Effects. Struct. Control Health Monit. 2025, 2025, 9191209. [Google Scholar] [CrossRef]
  53. Zhou, J.; Li, H.W.; Wang, Y.W.; Ni, Y.Q. Operational Modal Damping Identification Based on Compressive Sensing. J. Civ. Struct. Health Monit. 2025; in press. [Google Scholar] [CrossRef]
  54. Shang, X.-Q.; Huang, T.-L.; He, Y.-B.; Chen, H.-P. Operational Modal Analysis of Civil Engineering Structures with Closely Spaced Modes Based on Improved Hilbert–Huang Transform. Sensors 2024, 24, 7600. [Google Scholar] [CrossRef]
  55. Wang, Q.-G.; Zhang, L. System Identification in the Network Era: A Survey of Data Issues and Innovative Approaches. IEEE/CAA J. Autom. Sin. 2025, 12, 1305–1319. [Google Scholar] [CrossRef]
  56. Burdzik, R.; Khan, D. An Overview of the Current State of Knowledge and Technology on Techniques and Procedures for Signal Processing, Analysis, and Accurate Inference for Transportation Noise and Vibration. Measurement 2025, 252, 117314. [Google Scholar] [CrossRef]
  57. Felippa, C.A.; Guo, Q.; Park, K.C. Mass Matrix Templates: General Description and 1D Examples. Arch. Comput. Methods Eng. 2015, 22, 1–65. [Google Scholar] [CrossRef]
  58. Luo, S.; Liu, W. Coordinate Transformation Method of Finite Element Model for Frame Structures. Sichuan Build. Sci. 2016, 36, 17–23. [Google Scholar]
  59. Luo, S.; Zhu, J.; Liang, C.; Liu, W. Assembling Global Stiffness Matrix for Finite Element Model. J. Shenzhen Univ. Sci. Eng. 2018, 35, 467–472. [Google Scholar] [CrossRef]
  60. Hu, C.-B.; Wang, Y.-G.; Ling, D.-S. Physical Essence and Influence of Model Parameters on Dynamic Response of Rayleigh Damping. J. Zhejiang Univ. (Eng. Sci.) 2017, 51, 1284–1290. [Google Scholar]
  61. Zand, H.; Akbari, J. Selection of Viscous Damping Model for Evaluation of Seismic Responses of Buildings. KSCE J. Civ. Eng. 2018, 22, 4414–4421. [Google Scholar] [CrossRef]
  62. Swindlehurst, A.; Roy, R.; Ottersten, B.; Kailath, T. A Subspace Fitting Method for Identification of Linear State-Space Models. IEEE Trans. Autom. Control 1995, 40, 311–316. [Google Scholar] [CrossRef]
  63. Bernal, D.; Döhler, M.; Kojidi, S.M.; Kwan, K.; Yang, L. First Mode Damping Ratios for Buildings. Earthq. Spectra 2015, 31, 367–381. [Google Scholar] [CrossRef]
  64. Wu, X.; He, H.; Chen, G. A New State-Space Method for Exponentially Damped Linear Systems. Comput. Struct. 2019, 212, 137–144. [Google Scholar] [CrossRef]
  65. Luo, S.; Song, D.; Shen, K.; Fang, R.; Wang, W. Influence of the Order Exchange of the Node Connection in the Force Analysis of Steel Structures. Front. Mater. 2022, 9, 893291. [Google Scholar] [CrossRef]
Figure 1. Calculation model and section size of simply supported beam. (a) Calculation model (unit: mm); (b) Section size (unit: mm) [65].
Coatings 15 00962 g001
Figure 2. Extraction of amplitude values of the free decay section of the time-history curve under different conditions.
Coatings 15 00962 g002aCoatings 15 00962 g002b
Figure 3. Estimation of the slope of the peak logarithmic curve of the free decay section under different conditions.
Coatings 15 00962 g003aCoatings 15 00962 g003b
Figure 4. Diagram of relative errors of damping ratio identification under all cases.
Coatings 15 00962 g004
Figure 5. Panorama of bridge.
Coatings 15 00962 g005
Figure 6. Floor plan of the steel arch bridge.
Coatings 15 00962 g006
Figure 7. (a) Bottom section of steel arch bridge; (b) Section dimensions of main girders; (c) Section dimensions of steel jackets.
Coatings 15 00962 g007
Figure 8. Layout of acceleration sensor. (a) Site layout of acceleration sensor; (b) acceleration sensor layout diagram.
Coatings 15 00962 g008
Figure 9. First-order vibration mode diagram of steel arch bridge.
Coatings 15 00962 g009
Figure 10. Intercepted time history curves of acceleration decay sections of first datum group.
Coatings 15 00962 g010
Figure 11. Extraction of the free attenuation amplitude of the acceleration signal at node 3.
Coatings 15 00962 g011
Figure 12. The Fourier spectrum of the acceleration signal at node 3.
Coatings 15 00962 g012
Figure 13. Estimation of the slope of the peak logarithmic curve of the free decay section at node 3.
Coatings 15 00962 g013
Figure 14. Extraction of the free attenuation amplitude of the acceleration signal at Node 4.
Coatings 15 00962 g014
Figure 15. The Fourier spectrum of the acceleration signal at node 4.
Coatings 15 00962 g015
Figure 16. Estimation of the slope of the peak logarithmic curve of the free decay section at node 4.
Coatings 15 00962 g016
Figure 17. Random excitation.
Coatings 15 00962 g017
Figure 18. Acceleration time history curves after random excitation.
Coatings 15 00962 g018aCoatings 15 00962 g018b
Figure 19. El Centro seismic wave excitation.
Coatings 15 00962 g019
Figure 20. Acceleration time history curves after El Centro seismic wave excitation.
Coatings 15 00962 g020aCoatings 15 00962 g020b
Table 1. Material properties of simply supported beam.
Material PropertiesElastic Modulus (E)
KN/m2
Sectional Area (A)
M2
Moment of Inertia (I)
M4
Density (ρ)
kg/m3
Material property value2.1 × 1080.230.027.85 × 103
Table 2. Set values of modal damping ratio of simply supported beam.
Case1234567
Damping ratio0.00500 0.00800 0.01000 0.01200 0.01400 0.01600 0.01800
Case891011121314
Damping ratio0.02000 0.02500 0.03000 0.03500 0.04000 0.04500 0.05000
Case15161718192021
Damping ratio0.05500 0.06000 0.06200 0.06400 0.06600 0.06800 0.07000
Table 3. Comparison between two natural frequencies under different cases.
CaseSet Damping RatioFirst-Order Natural Frequency Obtained by Matrices f’
Hz
First-Order Natural Frequency Obtained by FFT f1
Hz
Relative Error
10.00500 10.6479510.546880.95%
20.00800 10.6479510.546880.95%
30.01000 10.6479510.546880.95%
40.01200 10.6479510.546880.95%
50.01400 10.6479510.546880.95%
60.01600 10.6479510.546880.95%
70.01800 10.6479510.546880.95%
80.02000 10.6479510.546880.95%
90.02500 10.6479510.546880.95%
100.03000 10.6479510.546880.95%
110.03500 10.6479510.546880.95%
120.04000 10.6479510.546880.95%
130.04500 10.6479510.546880.95%
140.05000 10.6479510.546880.95%
150.05500 10.6479510.546880.95%
160.06000 10.6479510.546880.95%
170.06200 10.6479510.546880.95%
180.06400 10.6479510.546880.95%
190.06600 10.6479510.546880.95%
200.06800 10.6479510.546880.95%
210.07000 10.6479510.546880.95%
Table 4. Comparison of modal damping ratios and relative errors under different cases.
CaseSet Damping RatioIdentification Damping RatioRelative Error
10.00500 0.00508 1.60%
20.00800 0.00788 1.50%
30.01000 0.01006 0.60%
40.01200 0.01197 0.25%
50.01400 0.01399 0.07%
60.01600 0.01599 0.06%
70.01800 0.01800 0.00%
80.02000 0.02002 0.10%
90.02500 0.02510 0.40%
100.03000 0.03018 0.60%
110.03500 0.03532 0.91%
120.04000 0.04027 0.67%
130.04500 0.04512 0.27%
140.05000 0.04993 0.14%
150.05500 0.05456 0.80%
160.06000 0.05904 1.60%
170.06200 0.06081 1.92%
180.06400 0.06277 1.92%
190.06600 0.06840 3.64%
200.06800 0.07099 4.40%
210.07000 0.07385 5.50%
Table 5. Identification values of damping ratio at node 2–6 in all cases.
CaseSet ValueIdentification Value at Node 2Identification Value at Node 3Identification Value at Node 4Identification Value at Node 5Identification Value at Node 6
10.00500 0.00508 0.00504 0.00500 0.00494 0.00490
20.00800 0.00788 0.00788 0.00787 0.00786 0.00785
30.01000 0.01006 0.01003 0.00997 0.00991 0.00986
40.01200 0.01197 0.01195 0.01193 0.01191 0.01189
50.01400 0.01399 0.01398 0.01397 0.01395 0.01393
60.01600 0.01599 0.01599 0.01598 0.01597 0.01596
70.01800 0.01800 0.01800 0.01800 0.01799 0.01798
80.02000 0.02002 0.02002 0.02002 0.02001 0.02000
90.02500 0.02510 0.02510 0.02510 0.02510 0.02510
100.03000 0.03018 0.03018 0.03018 0.03018 0.03018
110.03500 0.03532 0.03532 0.03532 0.03532 0.03532
120.04000 0.04027 0.04027 0.04027 0.04027 0.04027
130.04500 0.04512 0.04512 0.04512 0.04512 0.04512
140.05000 0.04993 0.04993 0.04993 0.04993 0.04993
150.05500 0.05456 0.05456 0.05456 0.05456 0.05456
160.06000 0.05904 0.05904 0.05904 0.05904 0.05904
170.06200 0.06081 0.06081 0.06081 0.06081 0.06081
180.06400 0.06277 0.06277 0.06277 0.06277 0.06277
190.06600 0.06840 0.06831 0.06819 0.06801 0.06796
200.06800 0.07099 0.07088 0.070720.07049 0.07040
210.07000 0.07385 0.07373 0.07350 0.07320 0.07304
Table 6. Error analysis for each working condition.
CaseSet ValueMean ValueStandard DeviationRoot Mean Square ErrorLower Limit of Confidence IntervalUpper Limit of
Confidence Interval
10.005000.004990.000070.000120.004910.00507
20.008000.007870.000010.000060.007850.00788
30.010000.009970.000070.000120.009870.01006
40.012000.011930.000030.000050.011890.01197
50.014000.013960.000020.000030.013940.01399
60.016000.015980.000010.000020.015960.01599
70.018000.017990.000010.000010.017980.01800
80.020000.020010.000010.000010.020000.02002
90.025000.025100.000000.000040.025100.02510
100.030000.030180.000000.000080.030180.03018
110.035000.035320.000000.000140.035320.03532
120.040000.040270.000000.000120.040270.04027
130.045000.045120.000000.000050.045120.04512
140.050000.049930.000000.000030.049930.04993
150.055000.054560.000000.000200.054560.05456
160.060000.059040.000000.000430.059040.05904
170.062000.060810.000000.000530.060810.06081
180.064000.062770.000000.000550.062770.06277
190.066000.068170.000170.001110.067960.06838
200.068000.070700.000220.001390.070420.07097
210.070000.073460.000310.001790.073080.07384
Table 7. Three sets of tests at node 3 identify damping ratio and error.
Datum Group 1Datum Group 2Datum Group 3Average Value
Identification damping ratio0.03820.03850.03810.0383
Relative error0.26%0.52%0.52%0.43%
Table 8. Three sets of tests at node 4 identify damping ratio and error.
Datum Group 1Datum Group 2Datum Group 3Average Value
Identification damping ratio0.03410.03540.03410.0345
Relative error1.16%2.61%1.16%
Table 9. Different cases for analysis of dynamic response.
CasesIncentive TypeDamping Ratio TypeDamping Ratio
1Random Measured damping ratio of node 30.0383
2Random Measured damping ratio of node 40.0345
3RandomEmpirical damping ratio0.0200
4El Centro seismic waveMeasured damping ratio of node 30.0383
5El Centro seismic waveMeasured damping ratio of node 40.0345
6El Centro seismic waveEmpirical damping ratio0.0200
Table 10. Results of dynamic response analysis of bridge under random excitation.
CaseDamping RatioTime (s)Absolute Value of Peak Acceleration
(m/s2)
Relative Error of Peak Acceleration
10.038310.4118.79000
20.034510.4119.87005.75%
30.0210.4927.750047.68%
Table 11. Results of dynamic response analysis of bridge under El Centro seismic wave excitation.
CaseDamping RatioTime
(s)
Absolute Value of Peak Acceleration
(m/s2)
Relative Error of Peak Acceleration
30.03831.3316.180
40.03451.3316.813.89%
50.021.3220.5727.13%
Disclaimer/Publisher’s Note: The statements, opinions and data contained in all publications are solely those of the individual author(s) and contributor(s) and not of MDPI and/or the editor(s). MDPI and/or the editor(s) disclaim responsibility for any injury to people or property resulting from any ideas, methods, instructions or products referred to in the content.