Article

3D Printed Parts Exhibit Superior Elastic Properties to Milled Ones

by
Laisvidas Striška
1,2,
Dainius Vaičiulis
3,
Sonata Tolvaišienė
2,
Dainius Udris
2,
Nikolajus Kozulinas
4,
Rokas Astrauskas
4,
Arūnas Ramanavičius
1,5 and
Inga Morkvėnaitė
1,2,*
1
Department of Nanotechnology, Center for Physical Sciences and Technology, 10257 Vilnius, Lithuania
2
Department of Electrical Engineering, Vilnius Gediminas Technical University, 10223 Vilnius, Lithuania
3
Panevėžys Faculty of Technology and Business, Kaunas University of Technology, 44249 Kaunas, Lithuania
4
Faculty of Mathematics and Informatics, Vilnius University, 01513 Vilnius, Lithuania
5
Department of Physical Chemistry, Vilnius University, 01513 Vilnius, Lithuania
*
Author to whom correspondence should be addressed.
Coatings 2025, 15(8), 963; https://doi.org/10.3390/coatings15080963 (registering DOI)
Submission received: 19 July 2025 / Revised: 11 August 2025 / Accepted: 16 August 2025 / Published: 19 August 2025
(This article belongs to the Section Environmental Aspects in Colloid and Interface Science)

Abstract

While many studies on fused filament fabrication (FFF)-printed polymers focus on ultimate tensile strength or failure analysis, the elastic region of the stress–strain curve is frequently overlooked. However, in most engineering applications, components operate well within the elastic range. In mechanical joints, support frames, and other load-bearing structures, stiffness and elastic response are more critical than post-failure behavior, as these properties determine system performance during standard operating conditions before any damage occurs. This study examines the elastic properties of acrylonitrile butadiene styrene (ABS) components fabricated via FFF, with a focus on the impact of printing orientation and nozzle temperature. Tensile tests were performed according to ISO 527-2:1993, and the results were compared to those of milled ABS parts (referred to as FT). Two print orientations were studied: XT, where the layers are oriented perpendicular to the loading direction, and ZT, where the layers are aligned parallel to the loading direction (load-aligned). The study reveals that printing orientation has a significant impact on mechanical behavior. The specimens printed in the ZT orientation exhibited superior elastic modulus and tensile strength compared to the XT specimens and also outperformed the milled FT parts. At 245 °C, the ZT specimens achieved an average tensile strength of 41.0 MPa, substantially higher than the FT’s 31.1 MPa. Moreover, the ZT had approximately 12.6% higher elastic moduli than the FT (1.97 GPa ZT compared to 1.74 GPa FT). Although the FT parts showed higher strain at break, the ZT-printed parts demonstrated a stiffness and strength that suggest their viability as replacements for machined components in load-bearing applications.

1. Introduction

Additive manufacturing, commonly known as 3D printing, has rapidly evolved from a prototyping tool to a mainstream manufacturing process [1,2]. Among various 3D printing technologies, fused filament fabrication (FFF) has gained widespread adoption due to its simplicity, affordability, and ability to produce complex geometries with thermoplastic materials such as acrylonitrile butadiene styrene (ABS) [3,4,5]. However, FFF parts’ mechanical properties, compared to those of traditionally manufactured components, tend to be lower, primarily due to issues like anisotropy and weak interlayer bonding [6,7]. High initial costs, poor surface finishes, and limited scalability remain persistent challenges with regard to the broader adoption of the technology [8].
Mechanical properties such as tensile strength, elastic modulus, and compressive resistance are critical for ensuring the functionality and reliability of structural parts [4,9]. Optimizing the performance of 3D-printed components requires a thorough understanding of how process parameters, such as nozzle temperature, layer orientation, layer thickness, and printing speed, affect their mechanical properties [10]. These effects were studied on calcium-sulfate-based scaffold prototypes, where layer orientation and delay time significantly affected the accuracy, strength, and porosity of the part [11,12]. Mechanical properties can be improved through preheating, the use of an IR lamp, or other technologies [13].
The tensile behavior of printed parts depends on barrel temperature, layer orientation, layer thickness, infill pattern (rectilinear, honeycomb, triangular), and platform temperature [14,15]. The infill pattern governs the internal structure’s ability to distribute stress [16]. Rectilinear infill patterns typically provide enhanced strength along specific directions; honeycomb structures offer a balanced combination of strength and material efficiency, while triangular infills contribute to increased stiffness, albeit with reduced compliance. Additionally, it was demonstrated that triangular and honeycomb printing exhibit superior tensile and flexural strength [15].
The nozzle temperature affects the degree of polymer chain diffusion and bonding between layers. Higher nozzle temperatures typically enhance interlayer adhesion, resulting in improved tensile strength, but excessively high temperatures may degrade the material. It was shown that higher printing temperatures resulted in lower yield strength and stiffness [17]. The platform temperature controls the adhesion of the first layer and the residual stress during cooling [18]. A heated platform reduces wrapping and enhances adhesion between the print and the platform, indirectly supporting better interlayer bonding and tensile strength.
When the raster angles align more closely with the tensile load (e.g., 0°), tensile strength increases [19]. Alternating angles (e.g., ±45°) can improve isotropy but may reduce strength in the loading direction. The layer thickness determines the bonding surface area between adjacent layers [20]. Thinner layers promote better fusion and smoother surfaces but increase print time and may introduce thermal stress.
Additionally, the layer thickness may influence intralayer cohesion [15]; for example, the decrease in strength when changing the layer height from the minimum to the maximum was approximately 3.5 times [21]. The tensile strength of parts printed at higher retraction speeds shows 10–15% improvement in the ultimate tensile strength; for example, at high retraction speeds (i.e., 75 mm/s), the surface quality was observed to either slightly or significantly increase depending on the position from the z-axis parts [22]. The tensile strength of the printed part depends on its printing orientation; it was shown that horizontal orientation maximizes toughness and tensile strength responses [23]. The fatigue performance of prints strongly depends on the direction of fatigue loading. Layer orientation mechanical properties are best when aligned parallel to the tensile loads and perpendicular to the compressive and bending forces [24].
While many studies on FFF-printed polymers focus on ultimate tensile strength or failure analysis, the elastic region of the stress–strain curve is often neglected in data analysis. However, in most engineering applications, parts operate well within the elastic limit. For instance, in mechanical joints, support frames, and other mechanical linkages, knowledge of stiffness and elastic response is more critical than the system behavior after the component has failed, as these properties govern system performance during operation, not after failure, when the system is no longer functional.
This research aims to experimentally investigate the mechanical properties of ABS parts 3D-printed under various nozzle temperatures and layer orientations, compare them with the mechanical performance of milled ABS parts, and provide practical recommendations for enhancing the mechanical durability of 3D-printed ABS parts. Three-dimensional-printed and milled specimens were tested by the ISO standards for tensile, bending, and compression, using the same testing machine and under controlled laboratory conditions at a temperature of 20 °C. To our knowledge, no previous study has quantitatively compared the elastic modulus and tensile strength, bending, and compression of FFF-printed and CNC-milled ABS parts within the elastic region using ISO 527-2:1993 [25]. This unique combination of standard-based mechanical testing and comparative design-focused analysis distinguishes this work from previous research focused solely on failure metrics or process parameters.

2. Materials and Methods

2.1. Sample Preparation

The 3D printing was carried out using a Bambu Lab X1 Carbon printer. The build platform temperature was 50 °C, the infill density was 100%, the raster angle was 0 and 90 degrees, the layer thickness was 0.2 mm, and the print speed was 50 mm/s.
Fused filament fabrication (FFF) technology was used to print specimens from ABS plastic (Devil design, Mikolow, Poland) in two orientations (Figure 1): perpendicular (X) and longitudinal (Z). Specimens were printed at four nozzle temperatures: 215 °C, 225 °C, 235 °C, and 245 °C (Table 1). The specimens of the control group (FT, FB, FC), made by CNC milling from a solid ABS material (density 1.05–1.07 g/cm3, working temperature 40–90 °C), were purchased from UAB “Arloks”. For every temperature–orientation combination (215X, 225X, 235X, 245XT, and 215Z, 225Z, 235Z, 245Z) and for the control group, sets of specimens for each test (tensile, bending, compression) were prepared with the same dimensions.

2.2. Testing Procedures

The primary goal of this study was to determine the optimal 3D printing parameters and compare mechanical performance across different parameter sets, using the same widely available ABS filament. As an additional reference point, we also manufactured specimens by milling from a readily available ABS grade commonly used in CNC-fabricated parts. This approach enabled a direct comparison not only between different printing parameters but also between two manufacturing processes, both employing ABS materials that are easily sourced and widely used in industry. The laboratory environment maintained a constant temperature of 20 °C during all testing procedures. The tests were performed with a calibrated “TIRA Test 2300” universal testing machine.
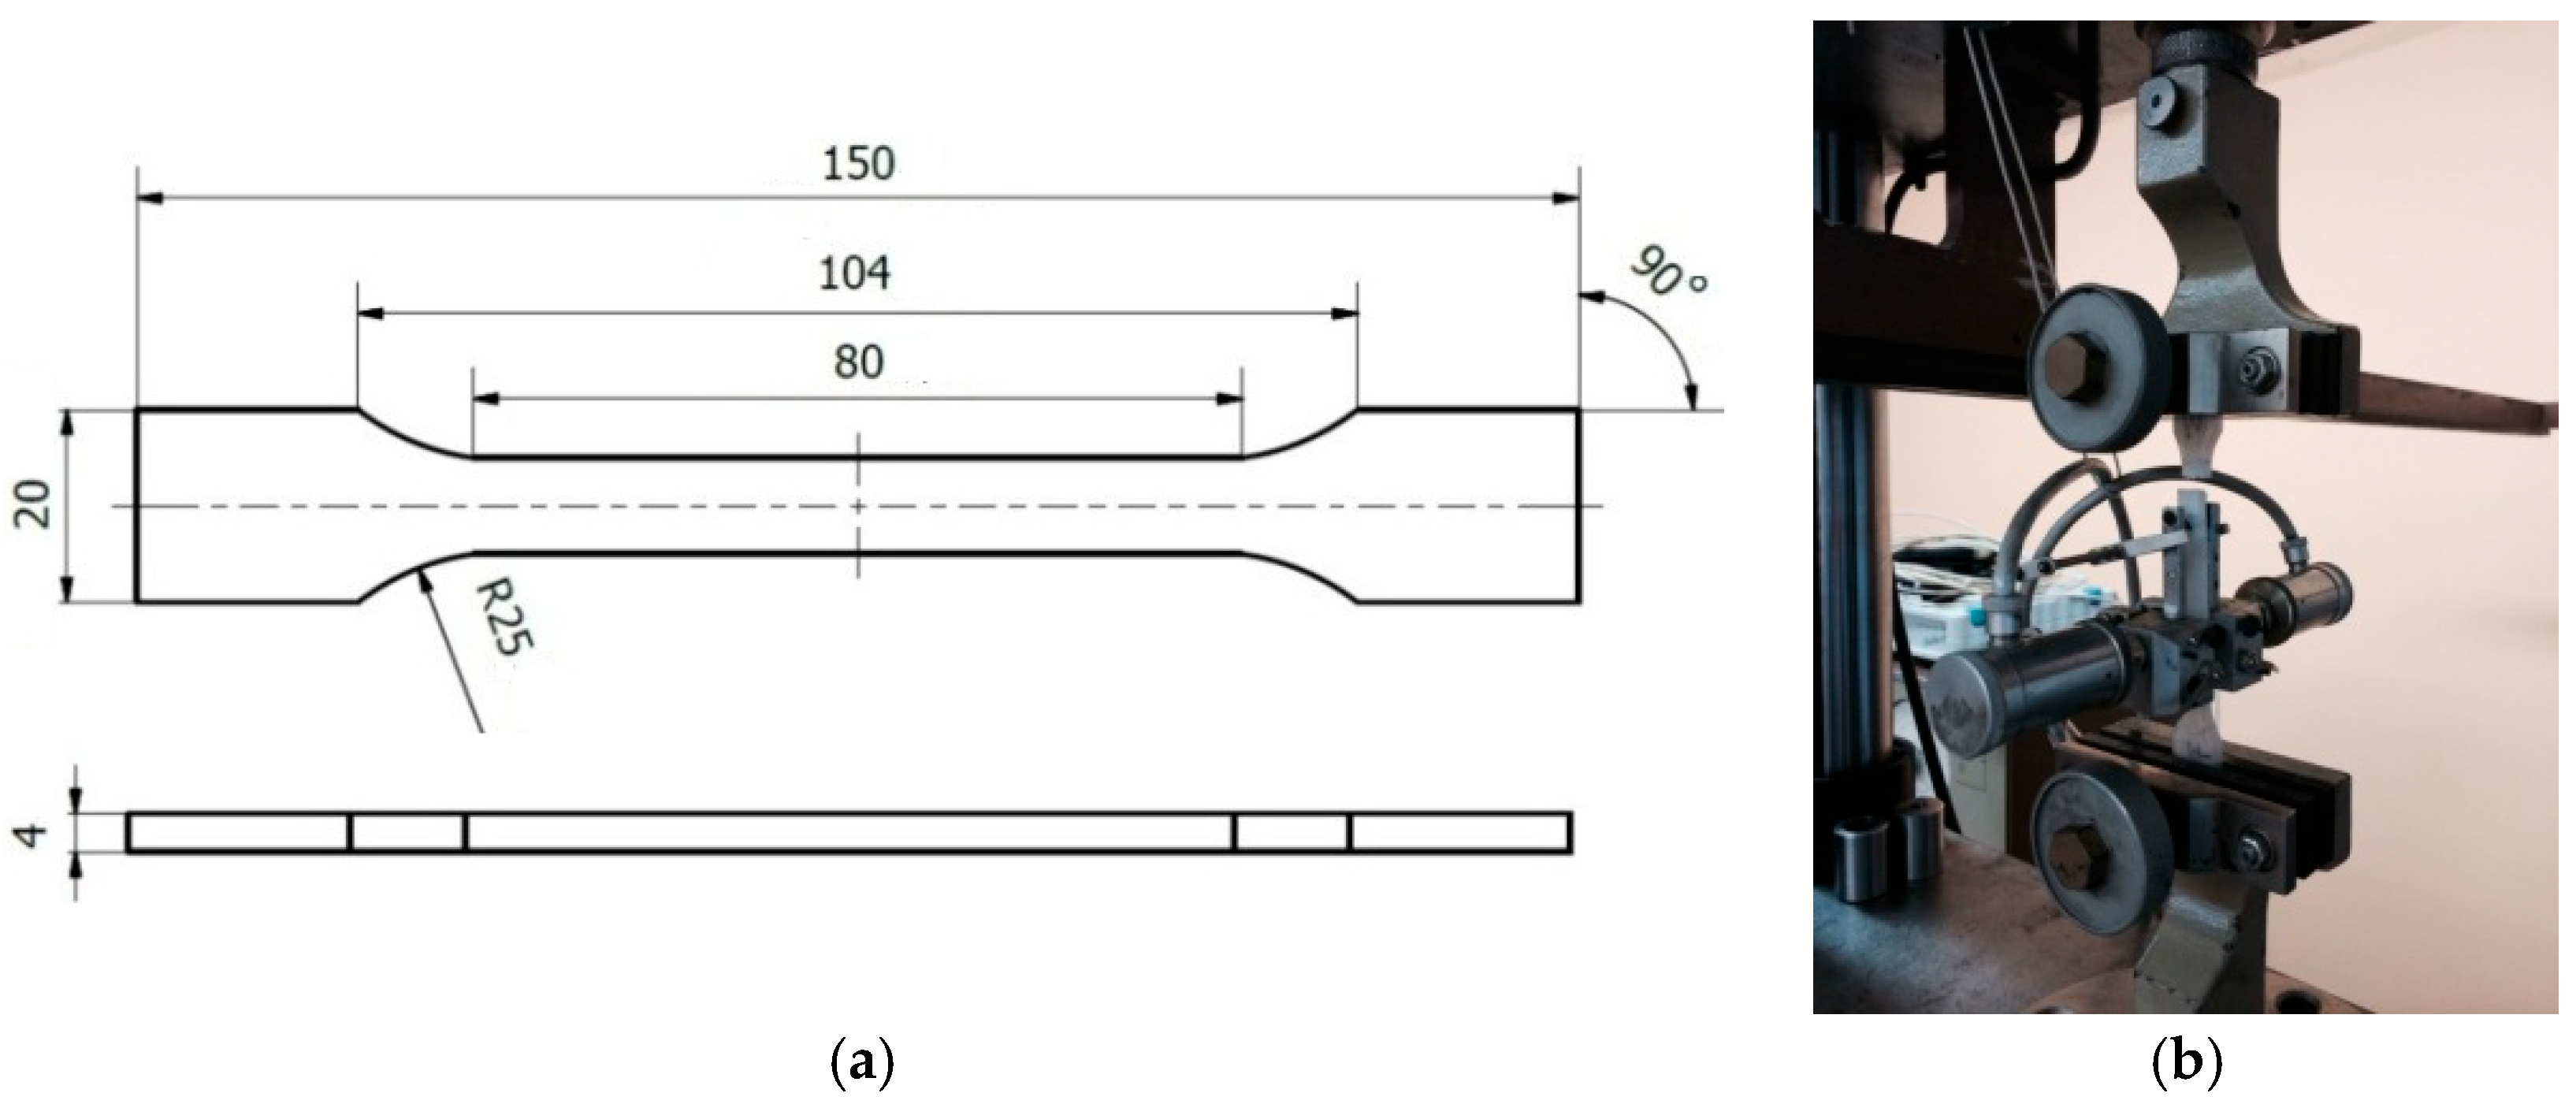
The tensile testing was performed with a specimen printed and milled with the dimensions shown in Figure 2, following the ISO 527-2:1993 standard protocol.
The bending experiments were performed with a specimen printed and milled with the dimensions shown in Figure 3, which were chosen according to the requirements of ISO 178:2003 [26]. Following the ISO 178:2003 recommendations, such specimens are tested up to a deflection equal to 1.5 h (where h is the specimen thickness). Each experiment was repeated three times. Statistical evaluation was performed by the least squares method.
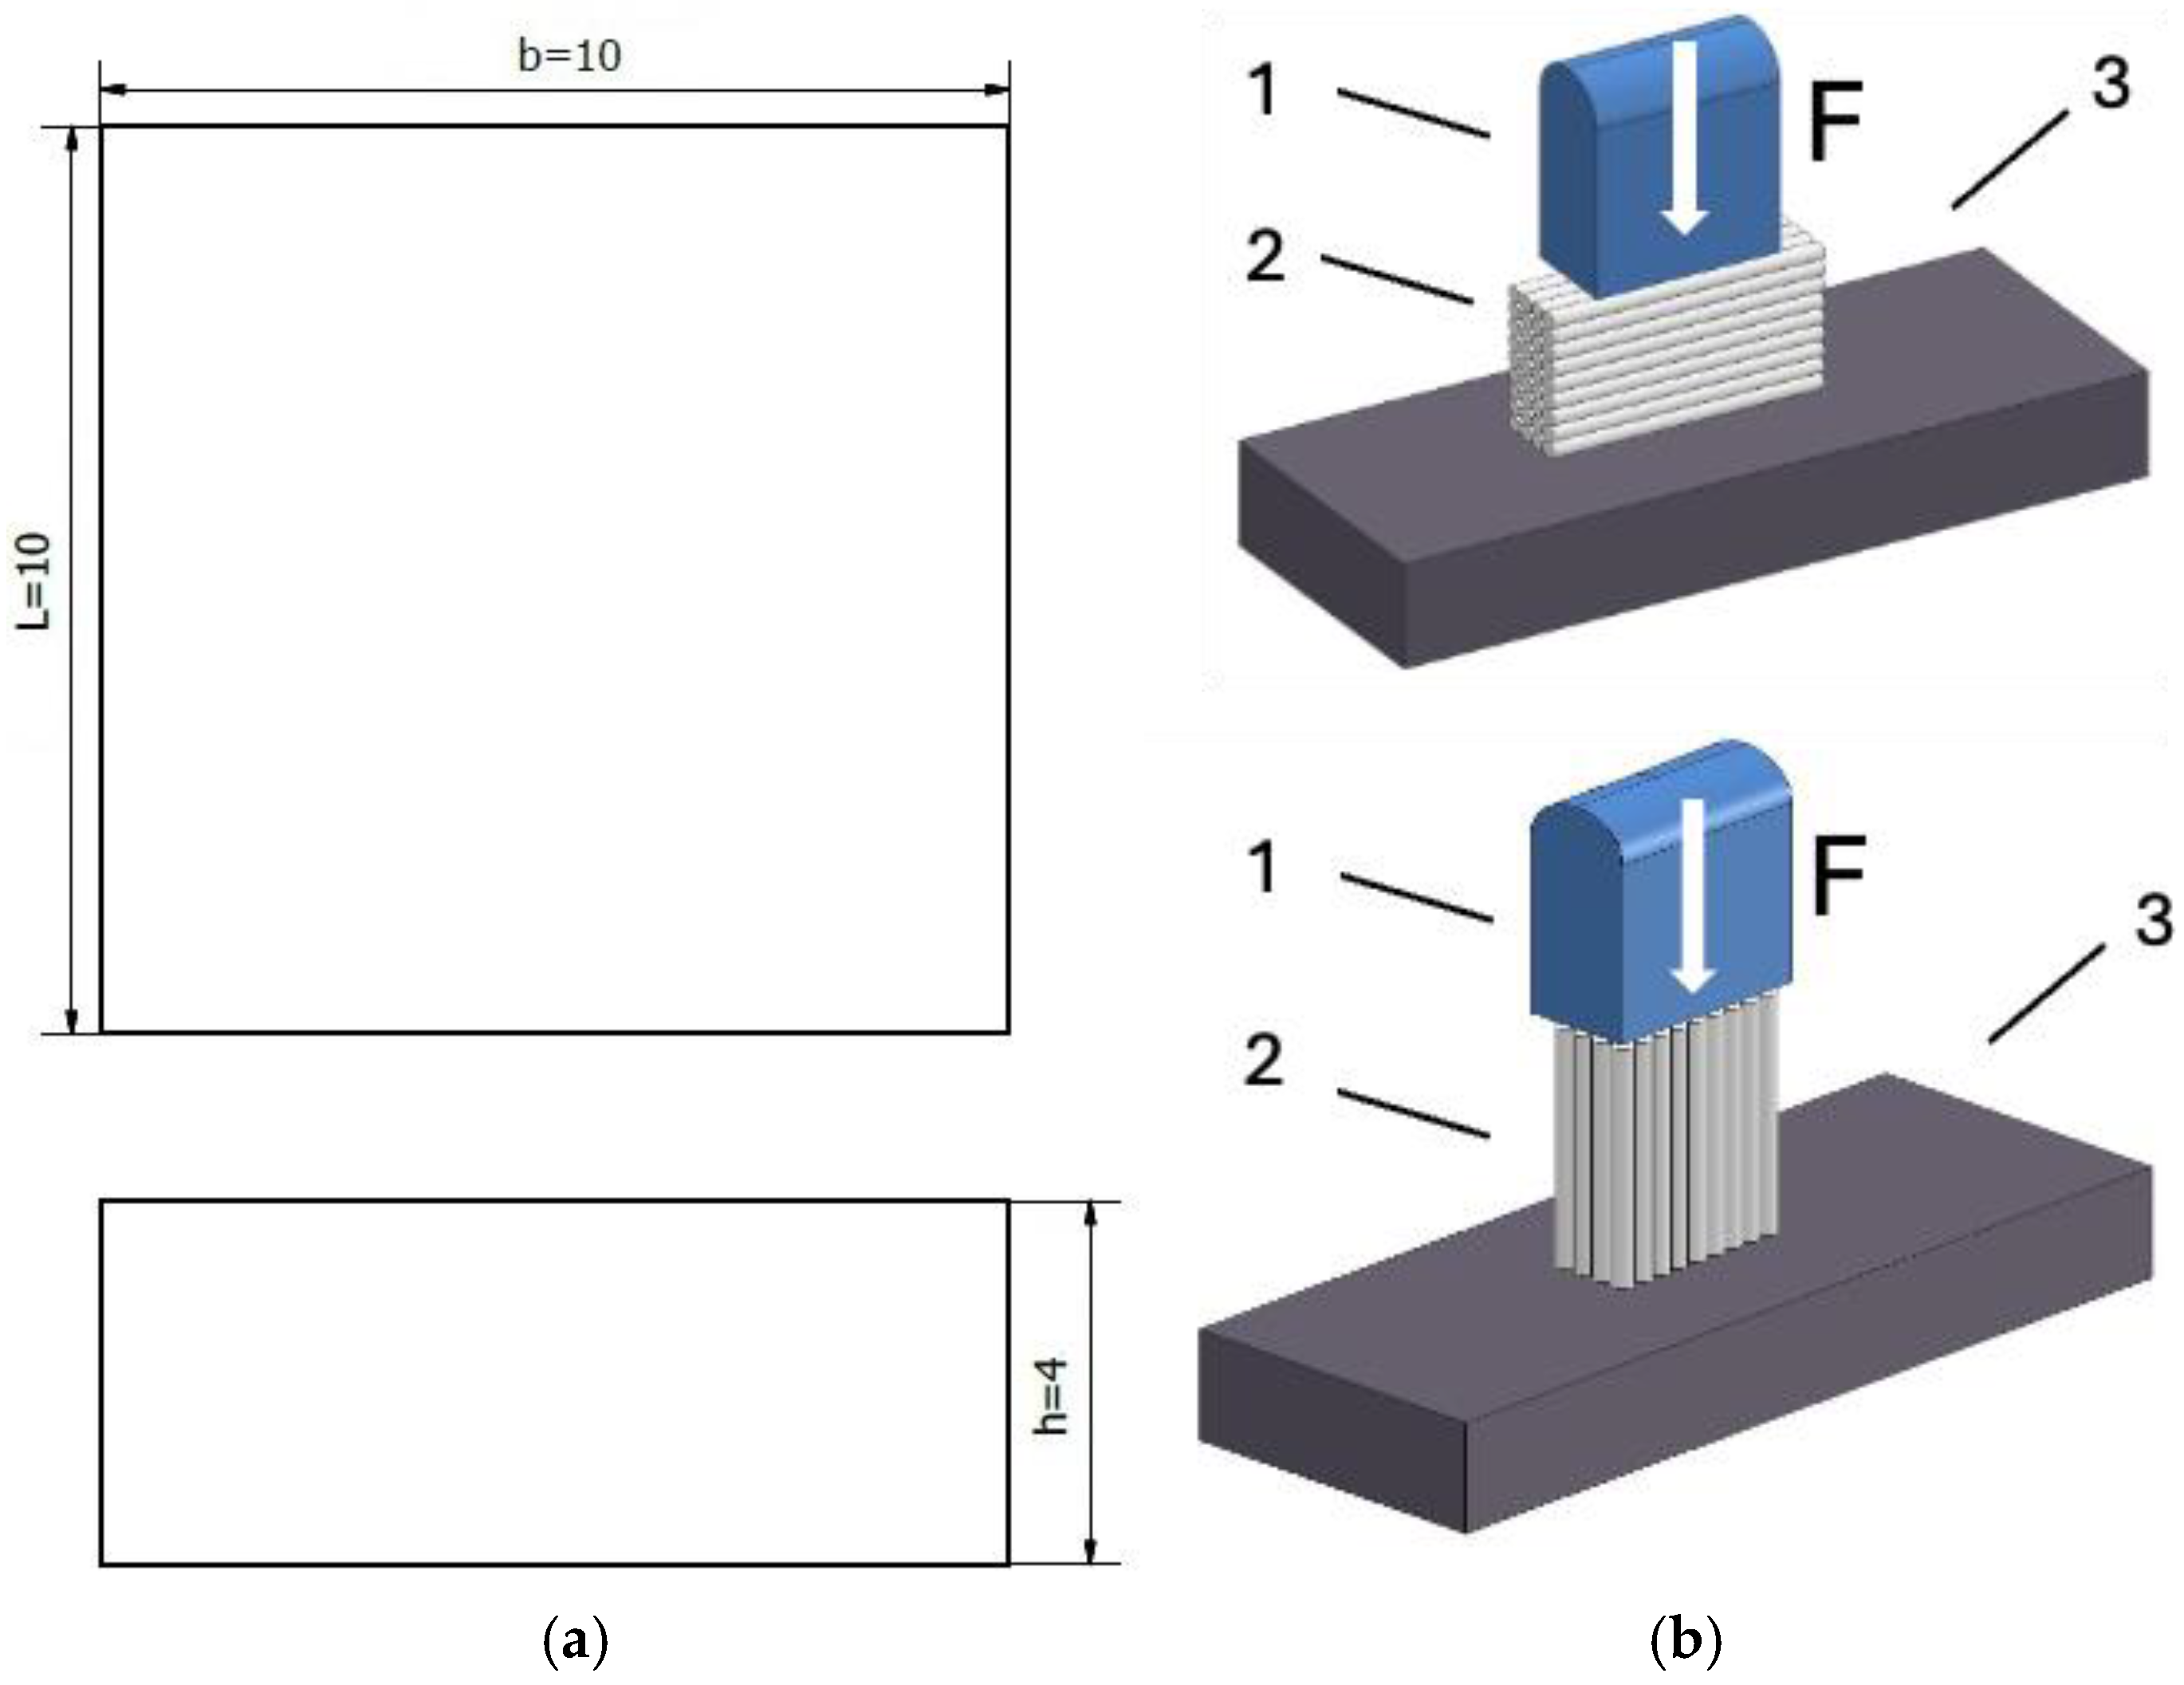
The compression test specimens were prepared in accordance with the ISO 604:2002 [27] standard requirements (Figure 4).
All compression specimens were tested within the elastic range. The maximum stresses were recorded at a relative strain of 4% according to ISO 604:2002. Testing beyond this strain value was considered unnecessary, as permanent deformations occur beyond this limit—unacceptable for a designed or engineered system. Therefore, experimental results are approximated only within the conditional elastic zone using the least squares method. The results were fitted with a power function (Equation (1)), which was used to determine the elastic modulus.

2.3. Evaluation of the Results

The resulting stress–strain relationship was fitted using
σ = Ea × εn,
where Ea is the approximated modulus of elasticity, ε is the relative deformation, and n is the coefficient indicating the curve type (n = 1 corresponds to a linear curve consistent with Hooke’s law—i.e., the conditional elastic limit for polymers). The specimens’ results were approximated specifically within this region.
The average modulus of elasticity was calculated as follows:
E v = 1 k × i = 1 k σ 2 i σ 1 i ε 2 i ε 1 i ,
where σ0 is the normal stress at the value of ε = 0.0005, σ1 is the normal stress at the value of ε = 0.0025, ε0 is the strain (0.0005), ε1 is the strain (0.0025), k is the number of tests, and i is the individual test index.
The approximated elastic moduli was compared with the average value of the elastic moduli, calculated as follows:
Δ E ( % ) = E v E a E v × 100 ,
where Ev is the average value of the elastic modulus.
Using the least squares method, the stress–strain data results of different specimens of the same experiment type were fitted. It was also verified that the elastic moduli obtained in this way agreed with the arithmetic means of the elastic moduli calculated from each experiment type (difference not exceeding 5%).

3. Results

3.1. Tensile Properties

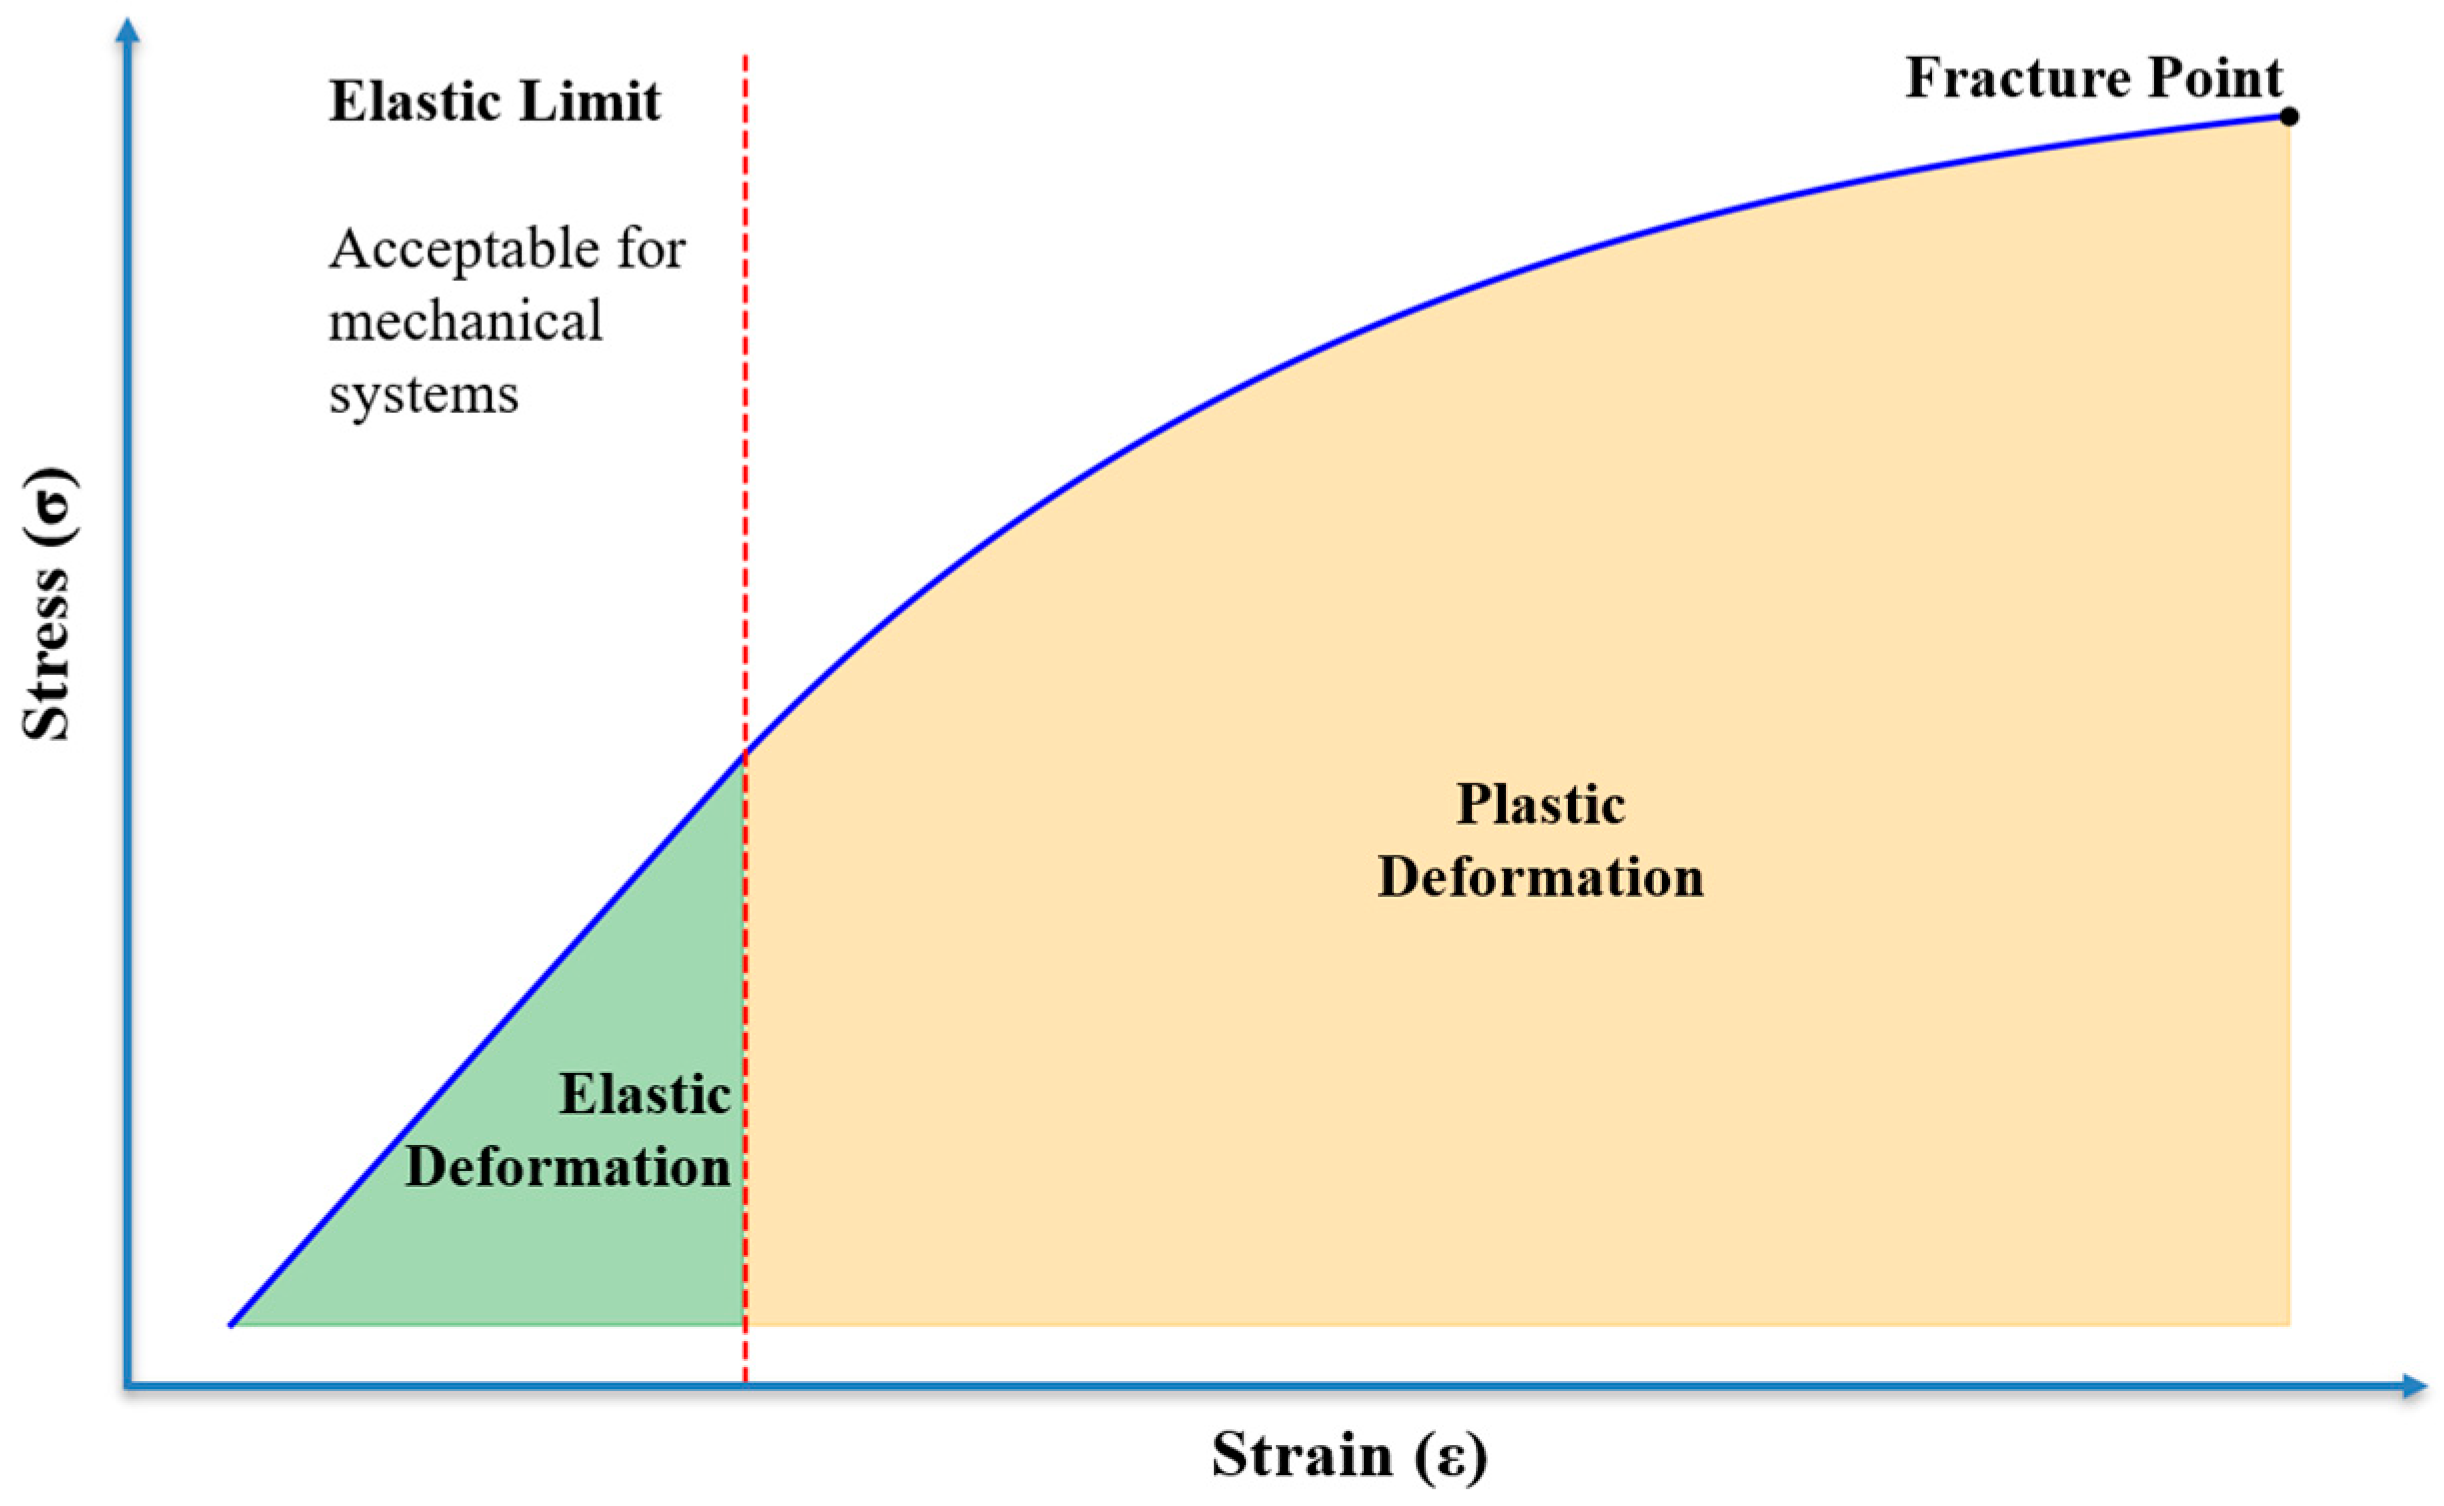
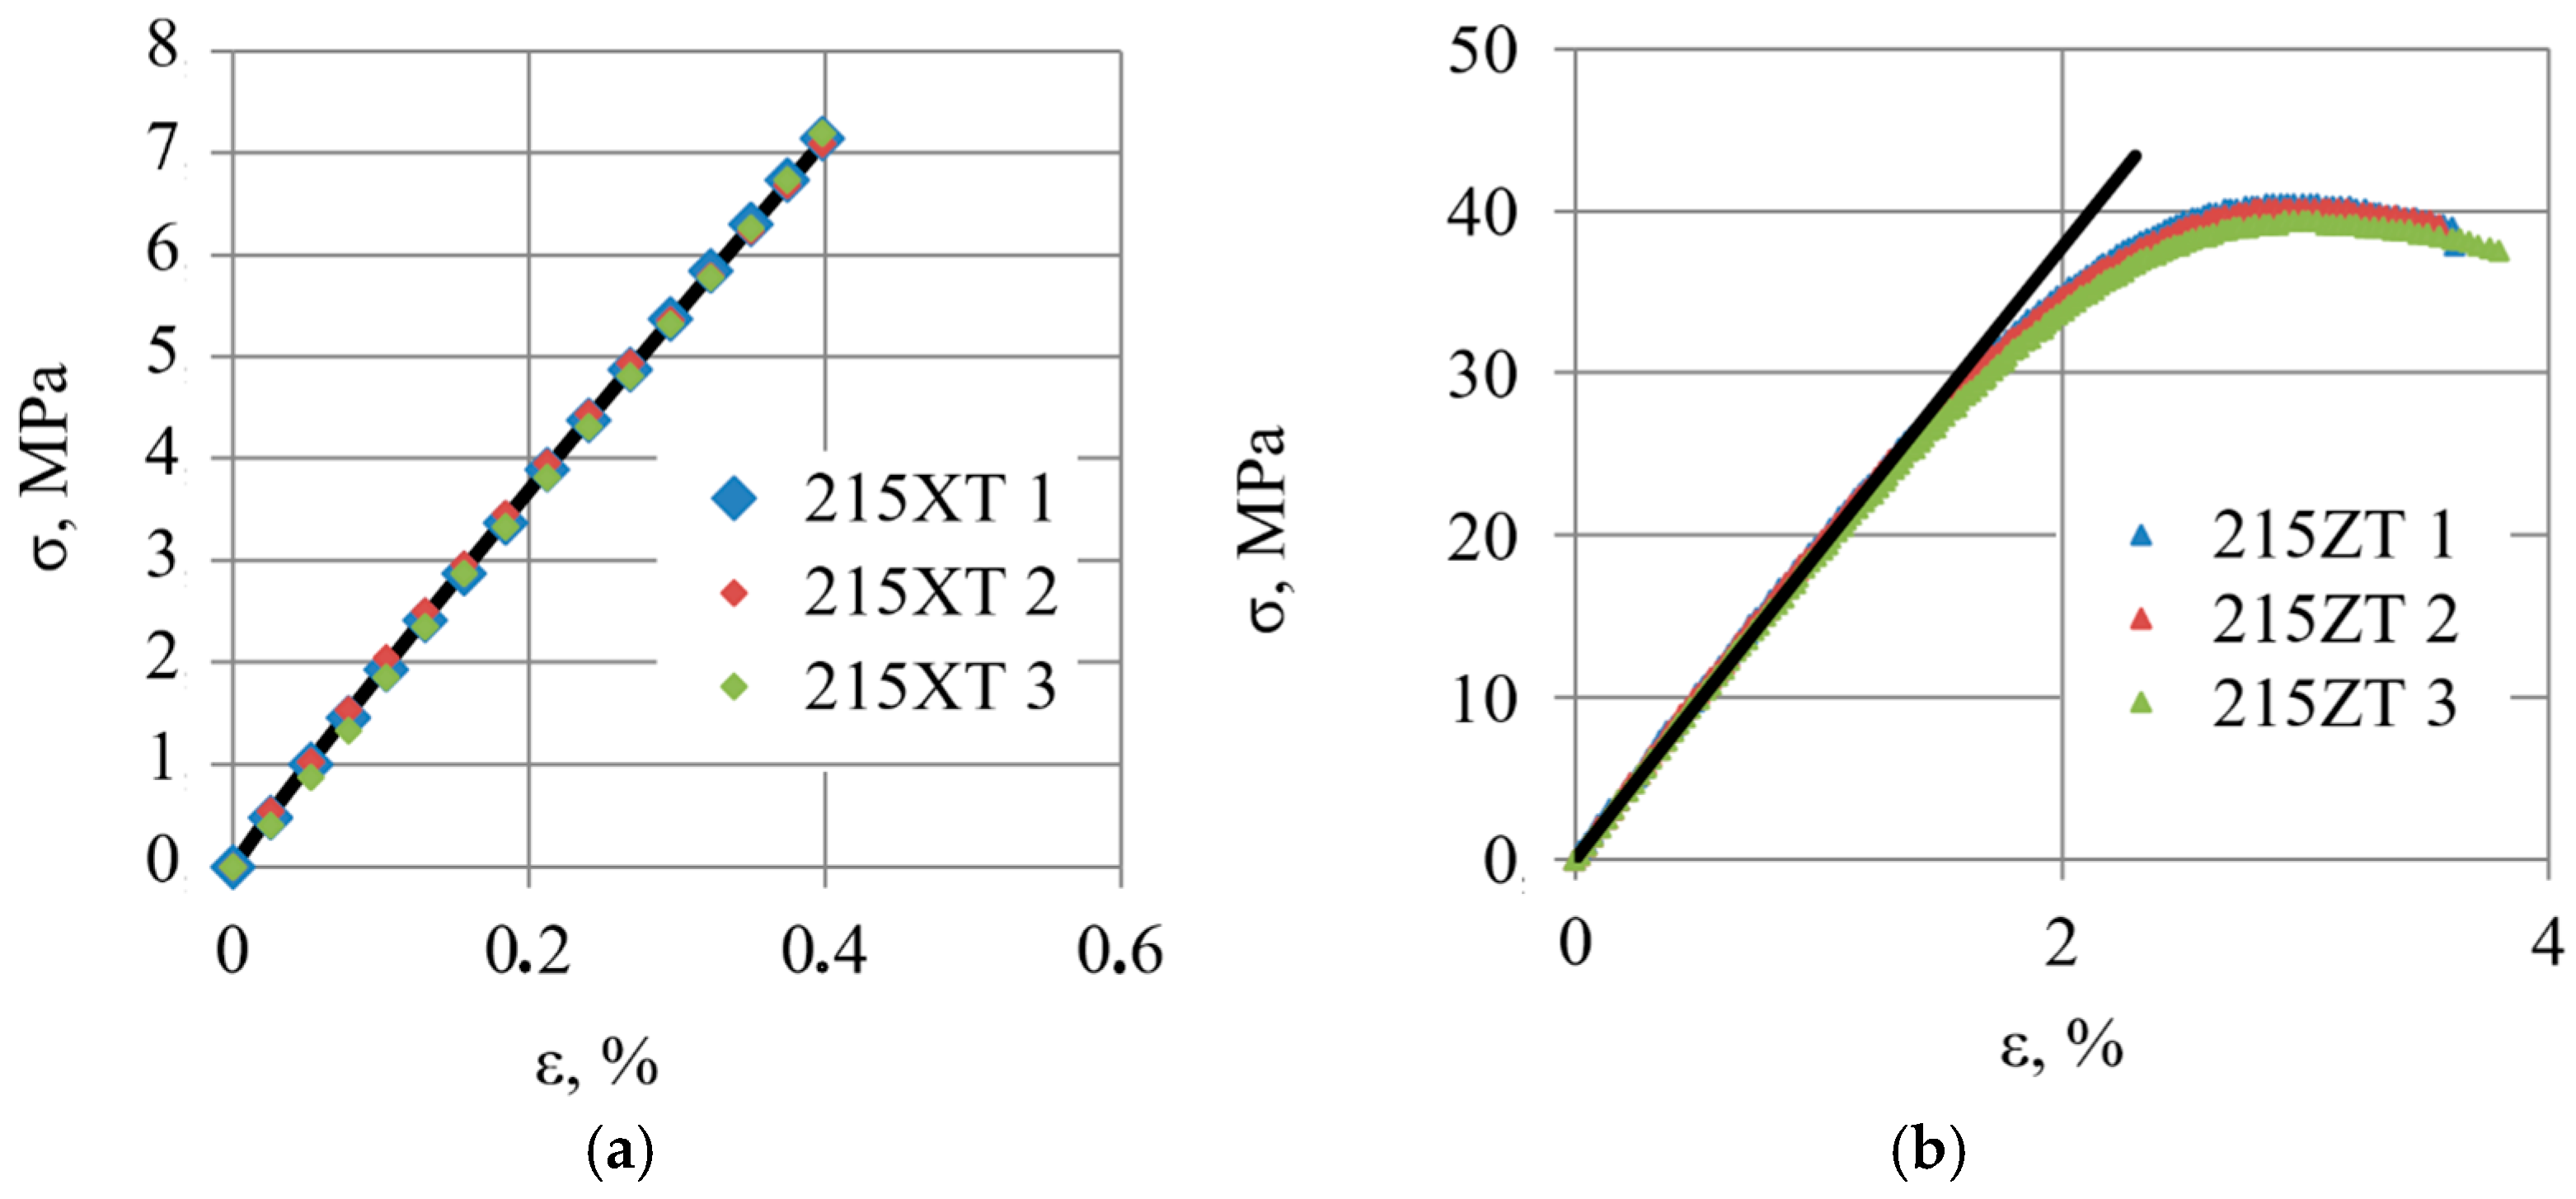
The ZT specimens demonstrated different values of ultimate tensile strength and fracture limit, indicating a separation between the load capacity and the point of failure. However, analysis outside the range of the elastic (Hookean) region is not suitable for any mechanical design, as plastic deformations introduce permanent changes that violate elasticity-based design assumptions. Therefore, only data within the elastic region were approximated using the least squares method for both the XT and ZT specimens’ results (Figure 5).
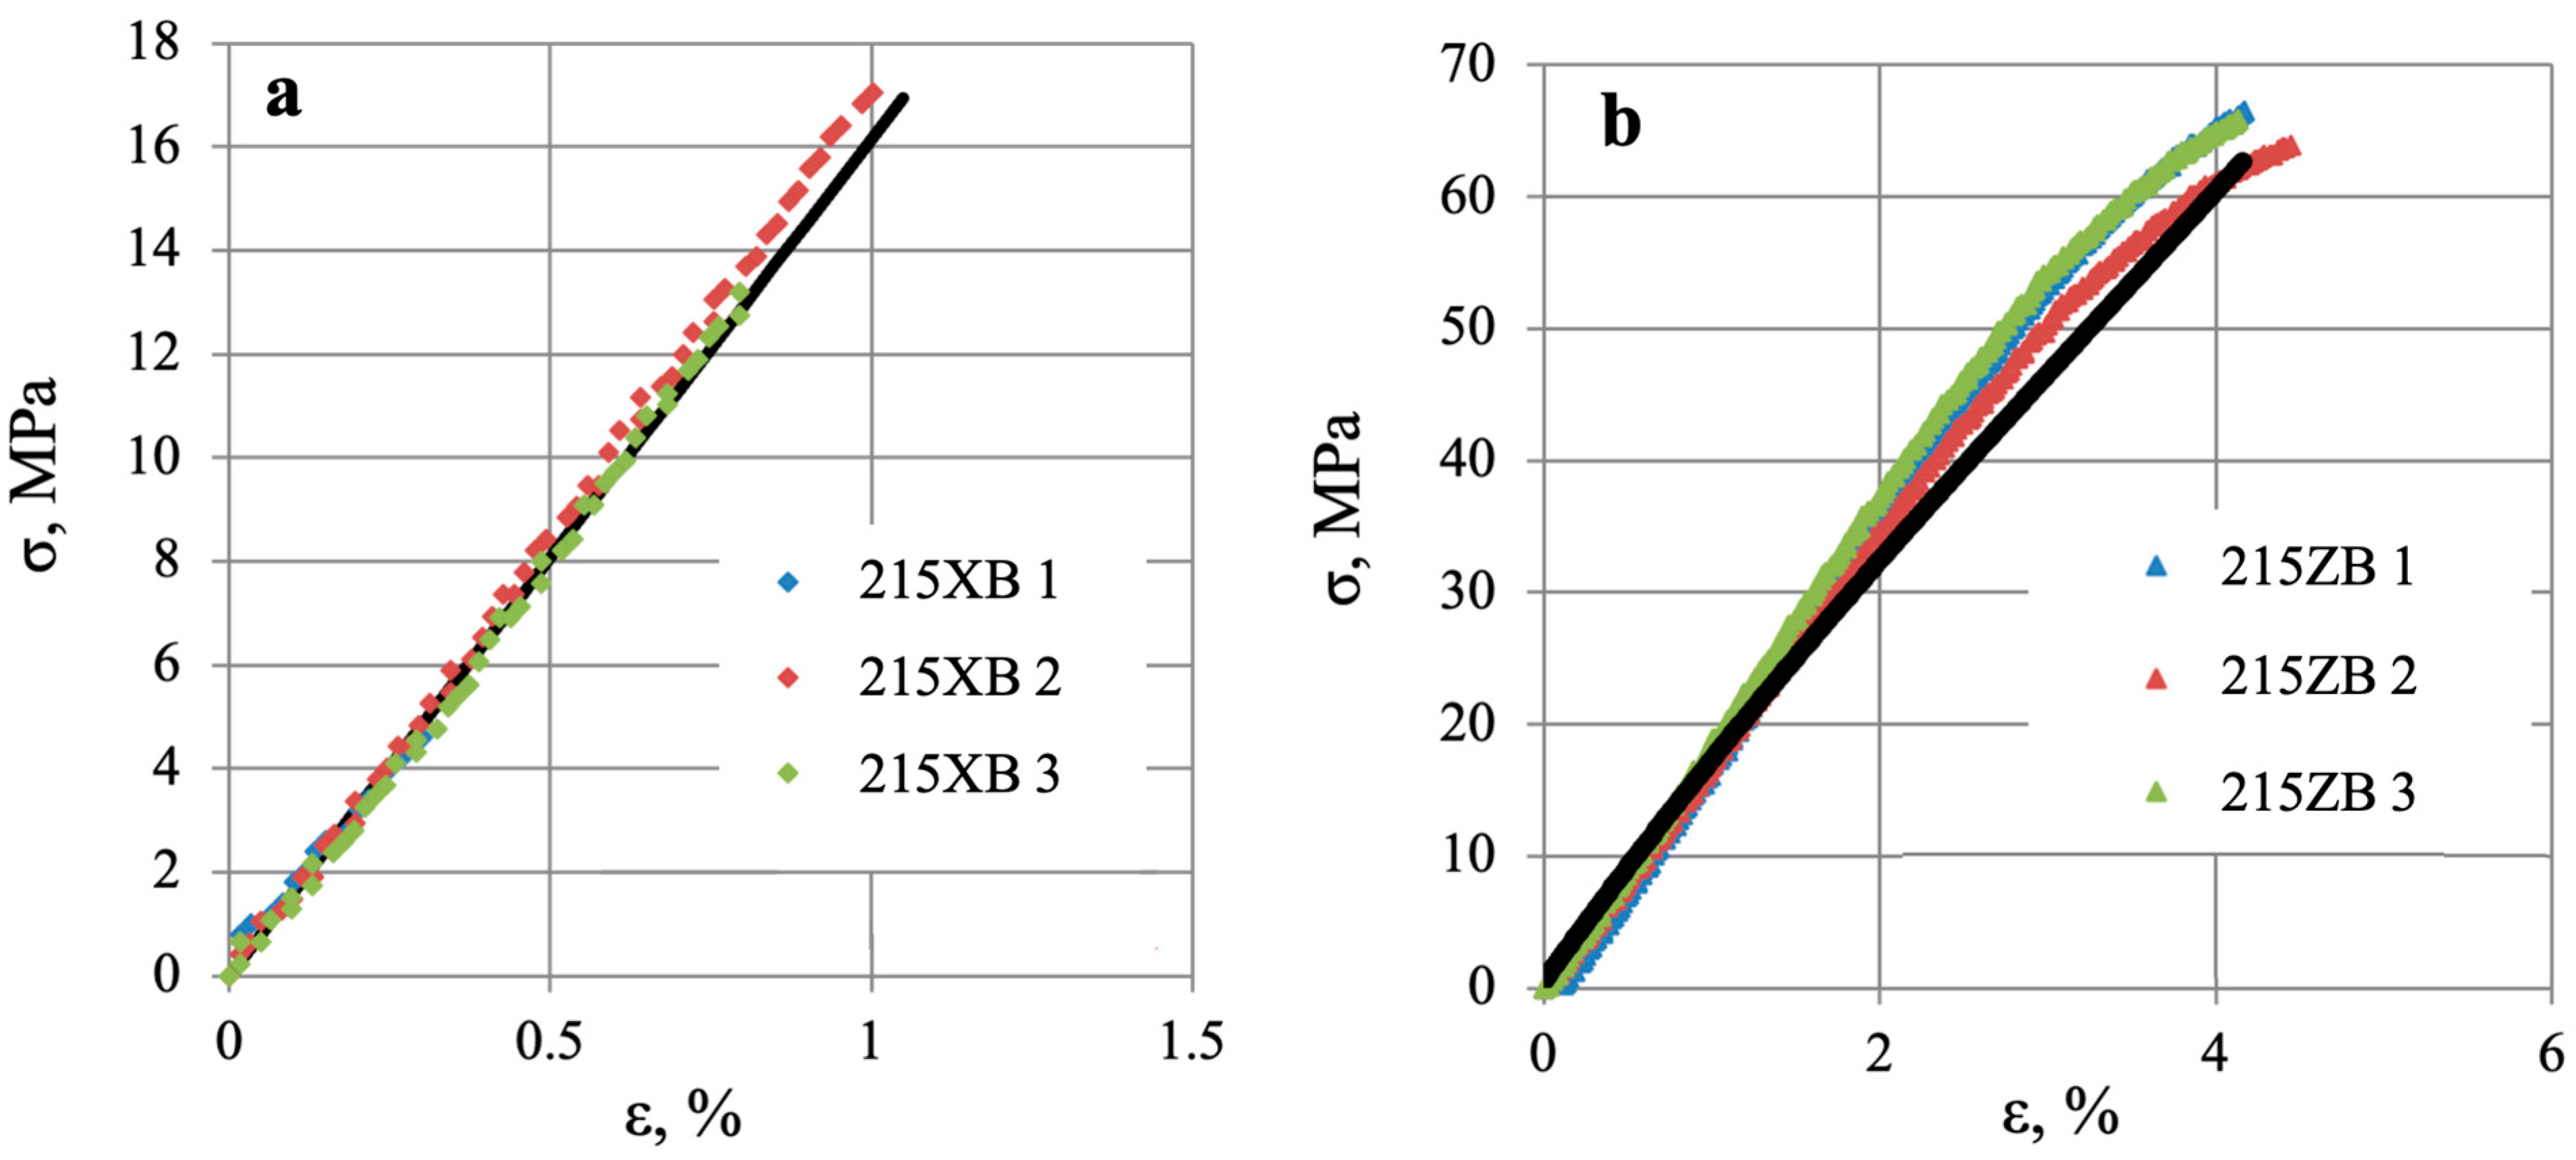
For the XT specimens, the ultimate tensile strength coincided with the elastic limit. Hence, the entire data set was treated with a single approximation curve (Figure 6a). In contrast, the ZT specimens exhibited a separation between the elastic limit and the ultimate tensile strength. Therefore, the data were evaluated by approximation curve only in the elastic region (Figure 6b).
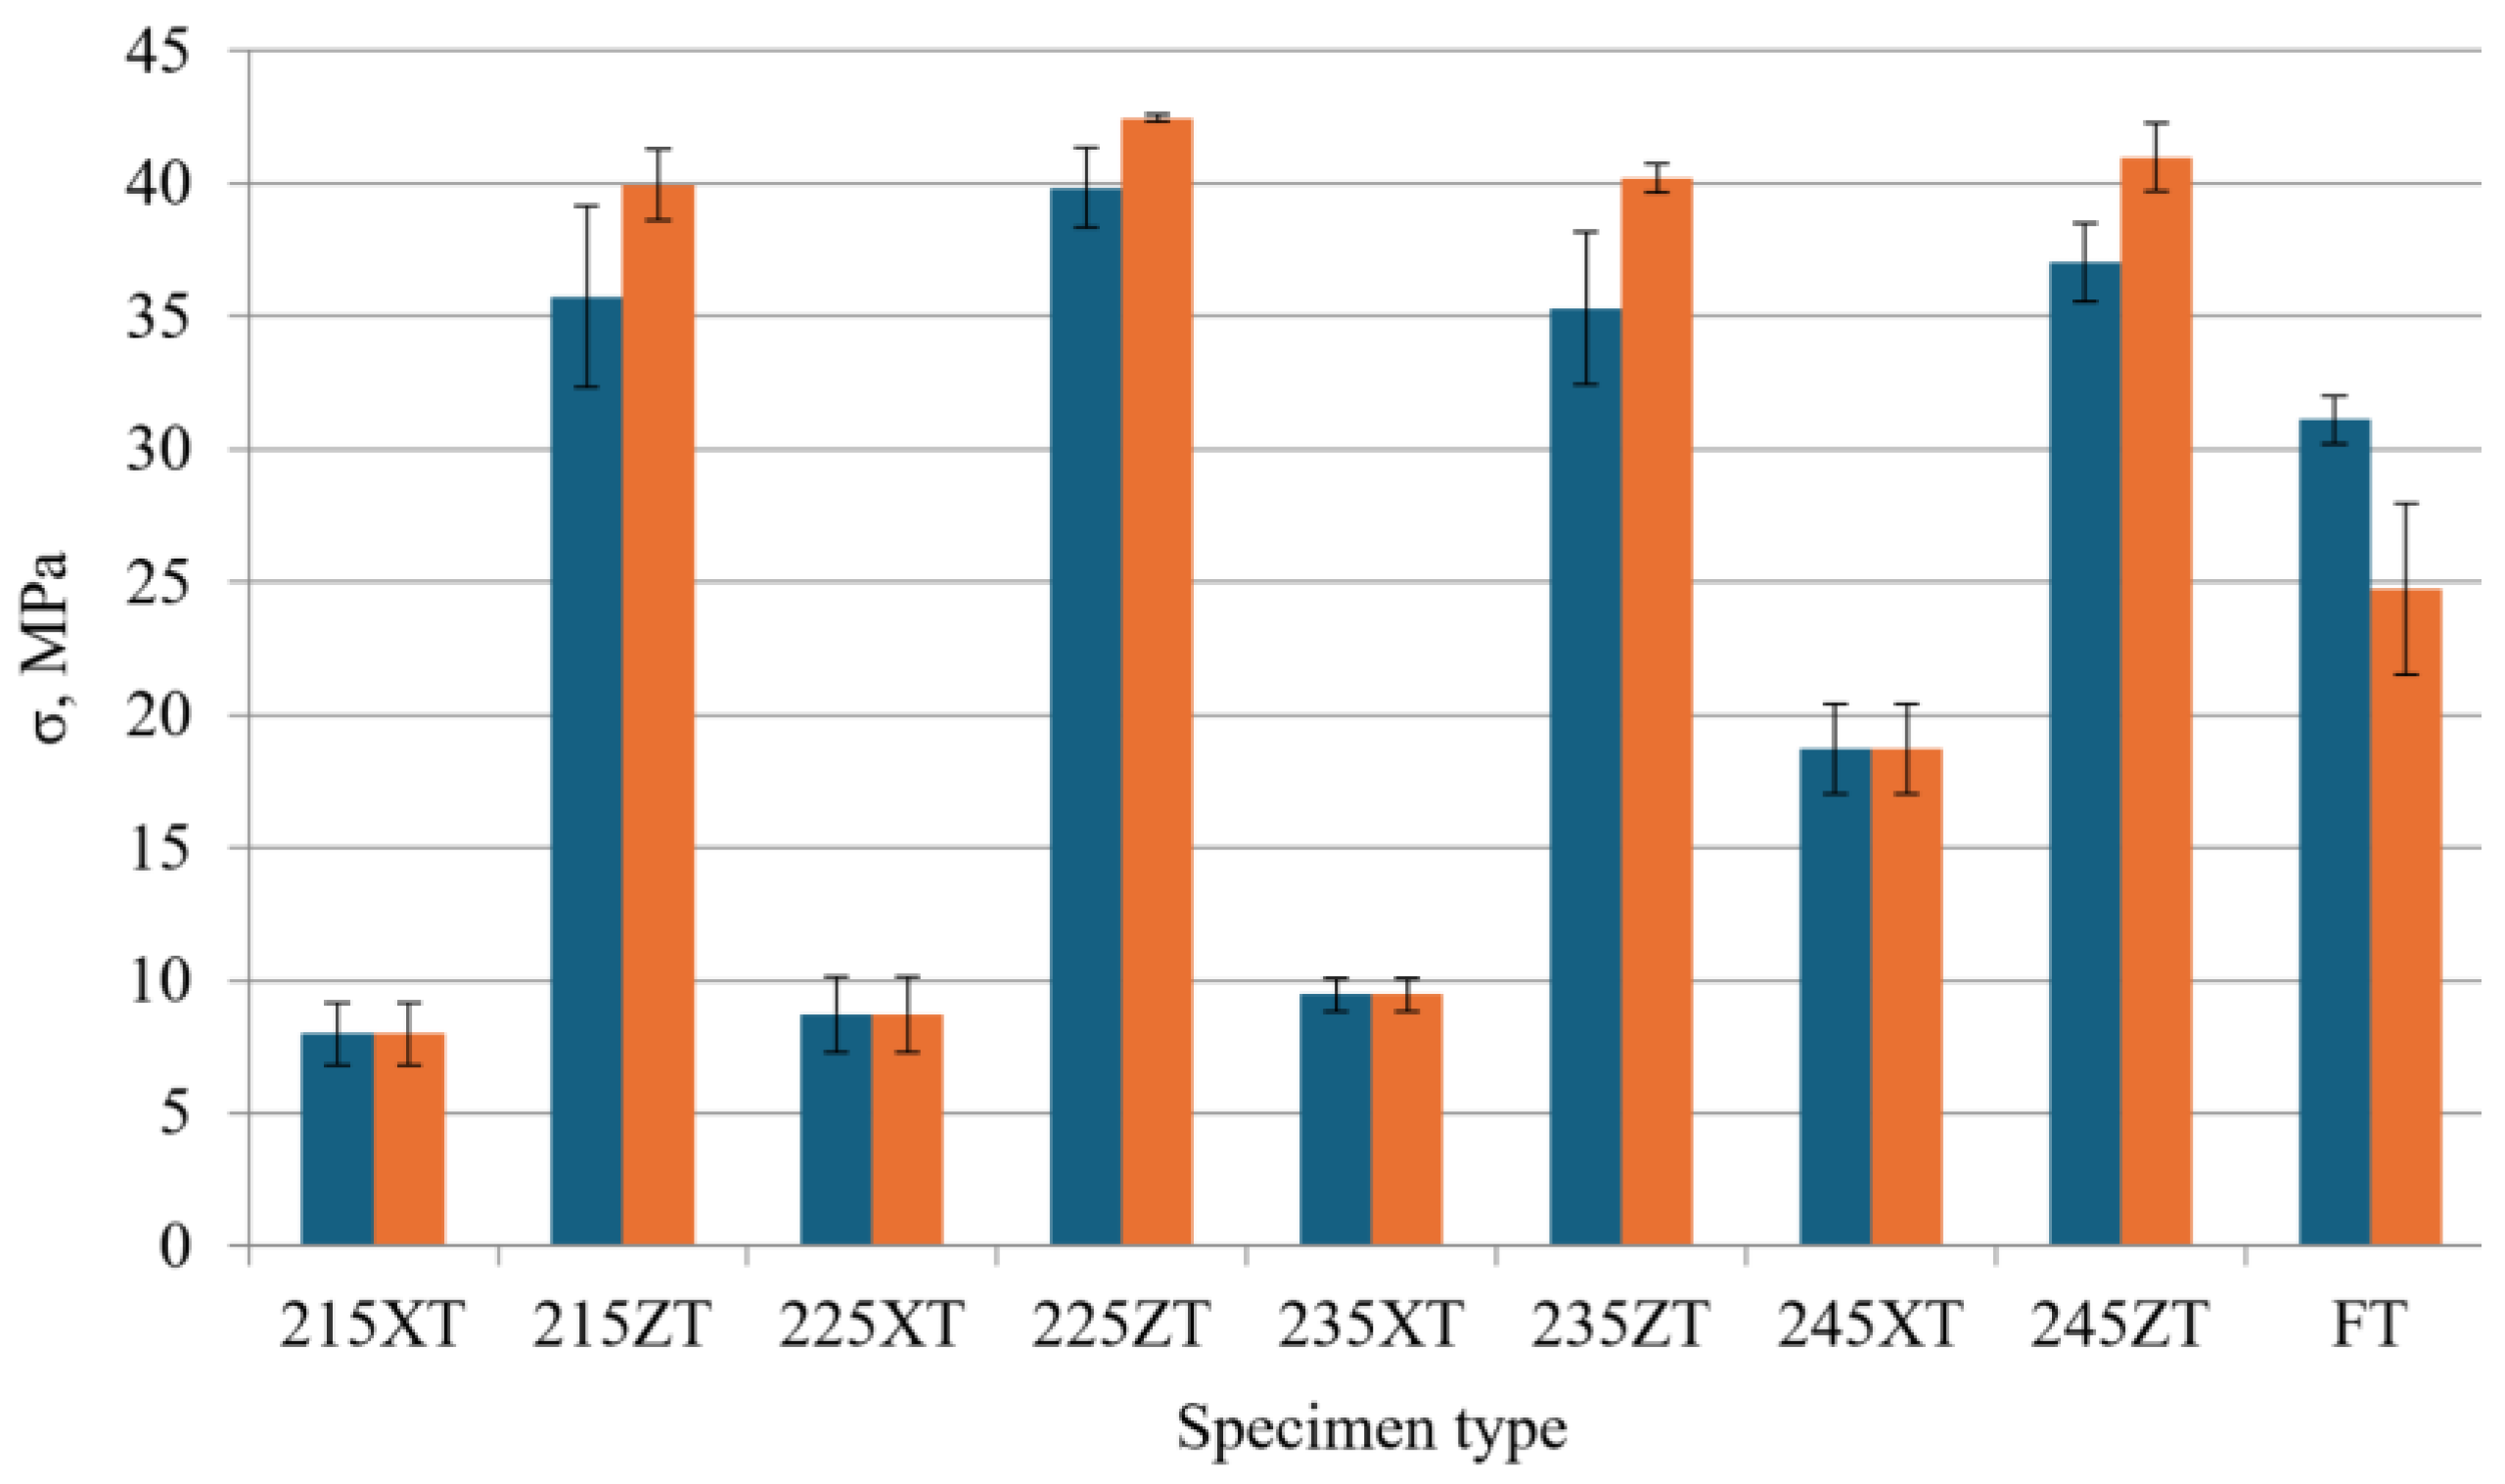
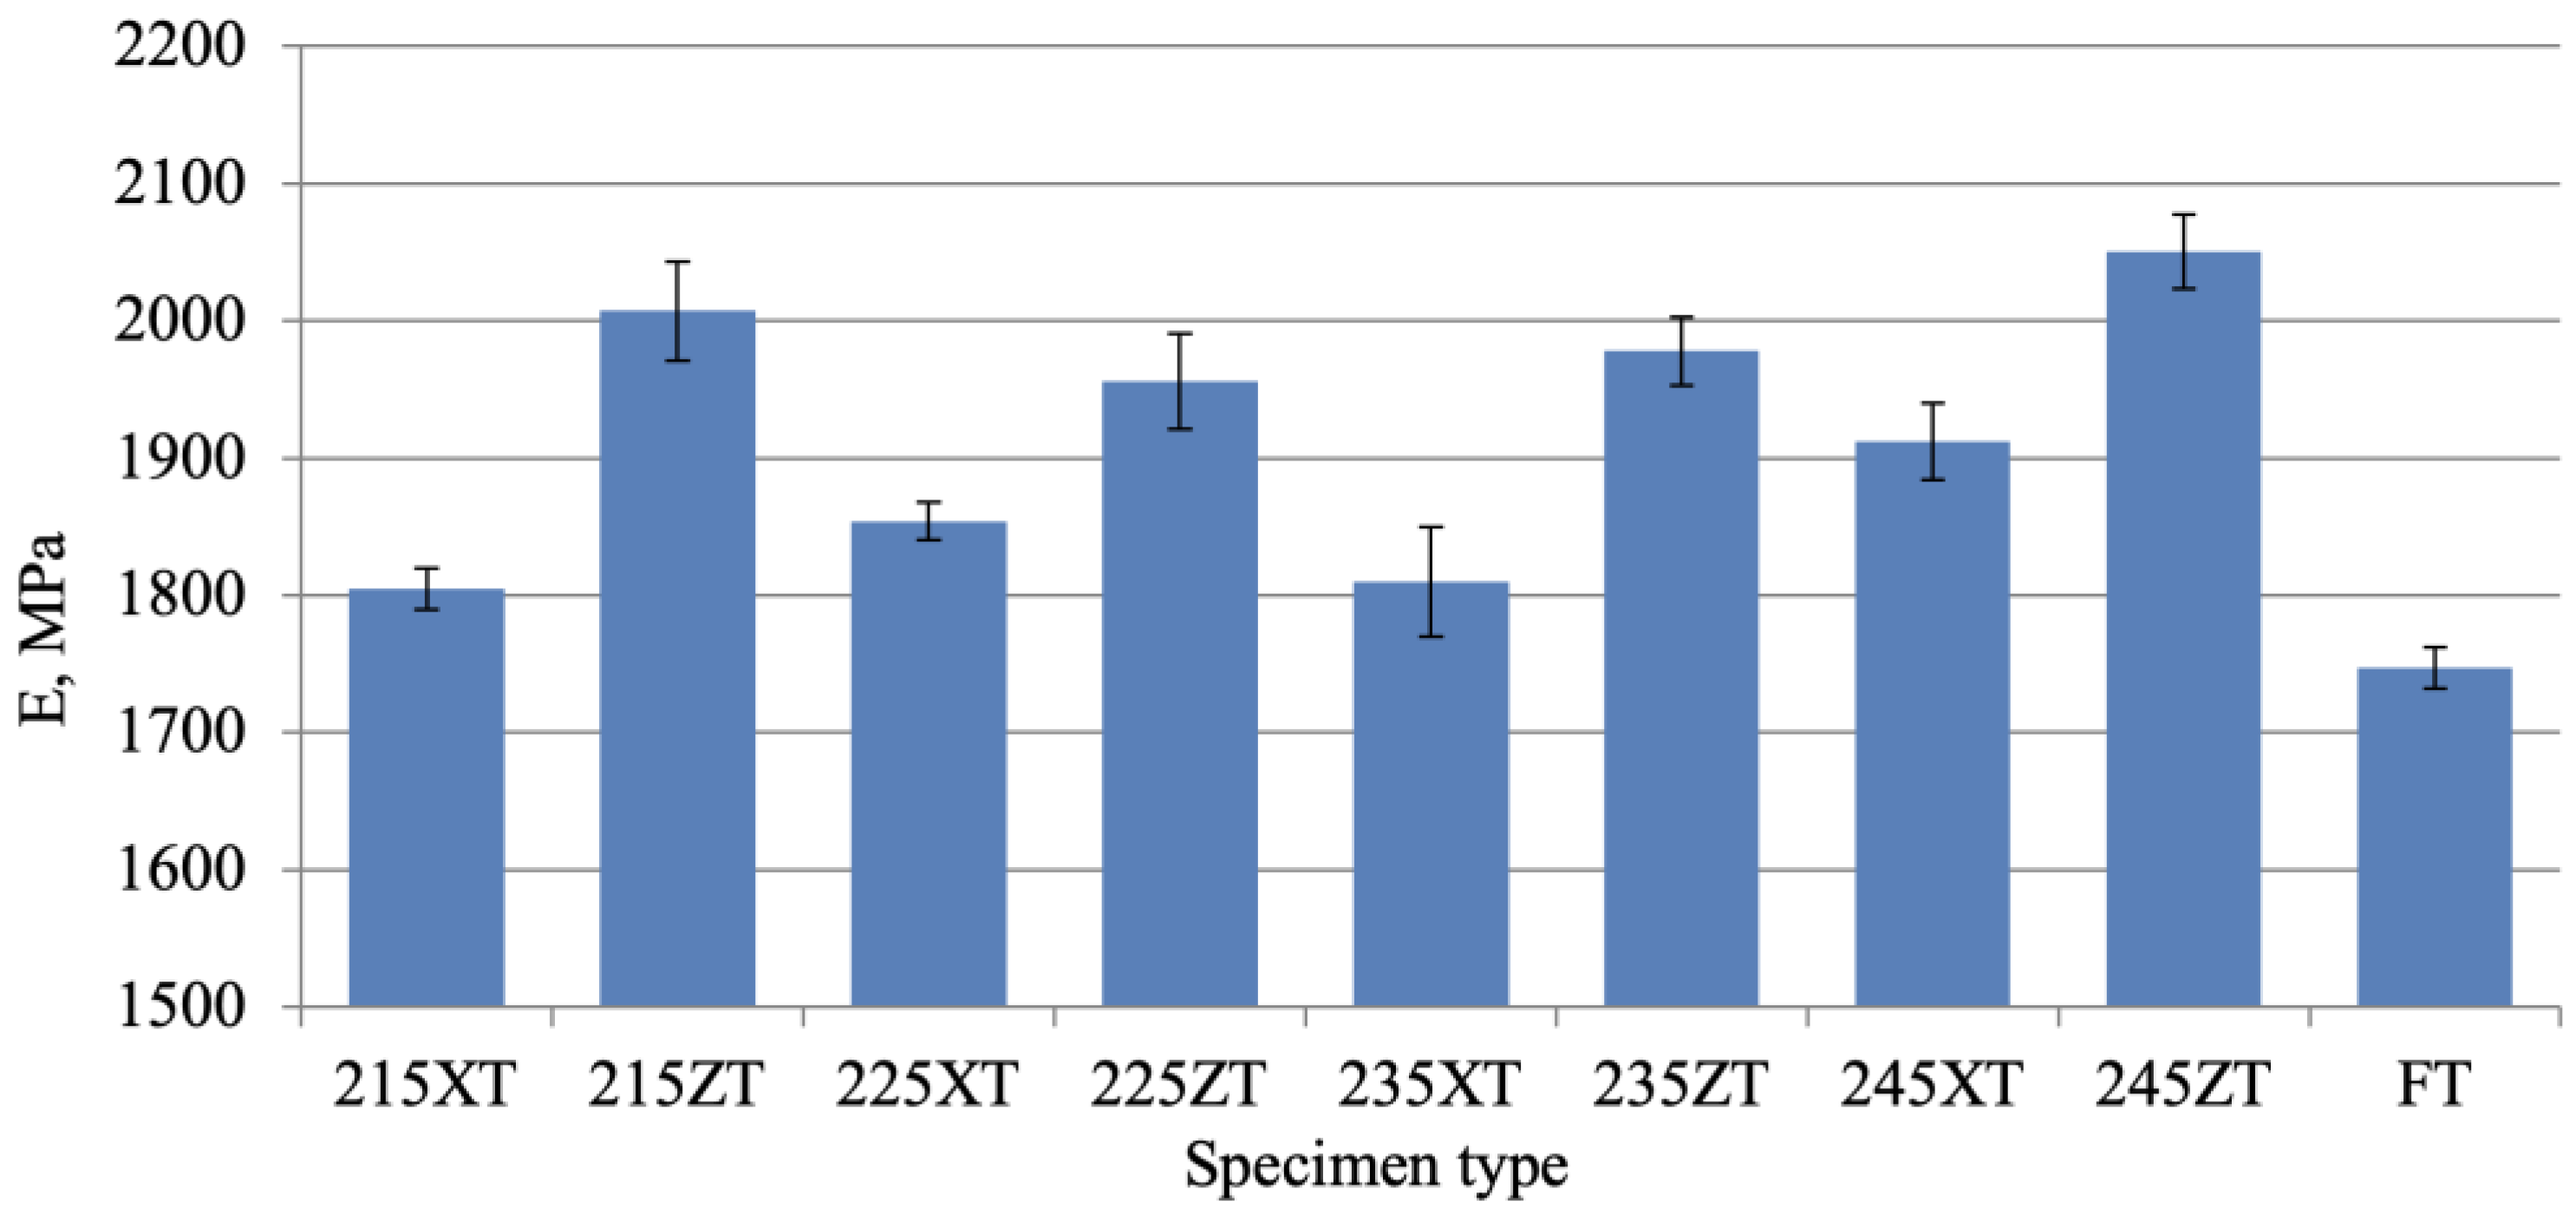
The printing temperature had no considerable impact on the ZT specimens’ mechanical properties (Figure 7). Also, on average, ZT had approximately 12.6% higher elastic moduli than FT (1.97 GPa ZT compared to 1.74 GPa FT). All XT specimens exhibited lower tensile strength (Figure 7a) compared to FT, clearly highlighting the better mechanical performance of FT. Moreover, the printing temperature had a significant effect on the mechanical properties of the printed XT specimens (Figure 7b).
The XT specimens demonstrated significantly lower tensile strength compared to the ZT specimens, due to the layer orientation (Figure 1, Figure 8 and Figure 9, Table A1). The most substantial differences in mechanical properties between orientations occurred at lower printing temperatures, e.g., 215 °C and 225 °C (Figure 8A,B and Figure 9). The XT specimens printed at temperatures ranging from 235 °C to 245 °C (Figure 8C,D and Figure 9) achieved the best mechanical properties, outperforming the specimens printed at 215 °C and 225 °C. The 215ZT specimen exhibited a strain increase of 87%, an ultimate tensile strength increase of 80%, and an elastic modulus increase of 10% compared to 215XT (Figure 8A). Similarly, at 225 °C, the strain was 87% higher, the ultimate tensile strength was 79% higher, and the elastic modulus was 5% higher for specimen 225ZT relative to specimen 225XT (Figure 8B). This effect can be explained by improved interlayer adhesion at higher nozzle temperatures [17]. The strain, ultimate tensile strength, and elastic modulus of the 245ZT specimens were 72%, 54%, and 6.7% higher, respectively, compared to the 245XT specimens (Figure 8D). This difference is attributed to anisotropic material behavior.
The ultimate and fracture strength values in the XT specimens were identical, indicating failure without significant plastic deformation. Furthermore, all XT specimens remained within the elastic deformation range throughout testing, exhibiting linear behavior within Hooke’s law up to the point of fracture.
FT outperformed the 3D-printed XT specimens but was comparable to or slightly lower than the high-temperature ZT specimens in terms of fracture strength.
This indicates that both orientation and temperature critically affect mechanical performance, with interlayer bonding being the most influential factor [18].
The ZT specimens exhibited higher average elastic moduli than the XT specimens (Figure 10 and Table A2). The elastic modulus increased with temperature, peaking at 245 °C for both orientations. This can be explained by higher layer adhesion and reduced porosity. FT maintained a relatively high modulus but could be matched or slightly exceeded by the ZT specimens at higher printing temperatures.
The data revealed that print orientation and nozzle temperature are vital in optimizing mechanical properties, with ZT orientation and higher temperatures yielding the best results.
The strength limit coincided with the fracture limit—unlike in the tensile tests, where these limits did not align. This observation suggests that in bending, failure is more abrupt and directly tied to the ultimate strength capacity of the material.

3.2. Bending Properties

For this study, two types of bending specimens were evaluated: XB specimens, in which the printed layers were oriented perpendicular to the specimen’s length, and ZB specimens, in which the layers were oriented longitudinally. The results of the bending tests, along with their corresponding approximation curves, are presented in Figure 11. All XB specimens fractured during testing, with their maximum stress coinciding with the fracture limit. The ZB specimens did not fracture. Normal stresses for the XB, ZB, and FB specimens are presented in Table A3.
The ZB-oriented specimens demonstrated significantly greater elasticity, with the strain increasing from ~1% to ~4%—representing an approximate increase of 300%. Furthermore, the ZB specimens exhibited substantially higher stress resistance, reaching approximately 60 MPa compared to 16 MPa for the XB specimens—an increase of around 275%.
These specimens were manufactured at a printing temperature of 215 °C. This temperature was intentionally selected in order to highlight the importance of printing orientation because it showed the poorest mechanical properties across the tested temperature range. Additionally, a comparison of the influence of printing temperature can be observed in Figure 12a.
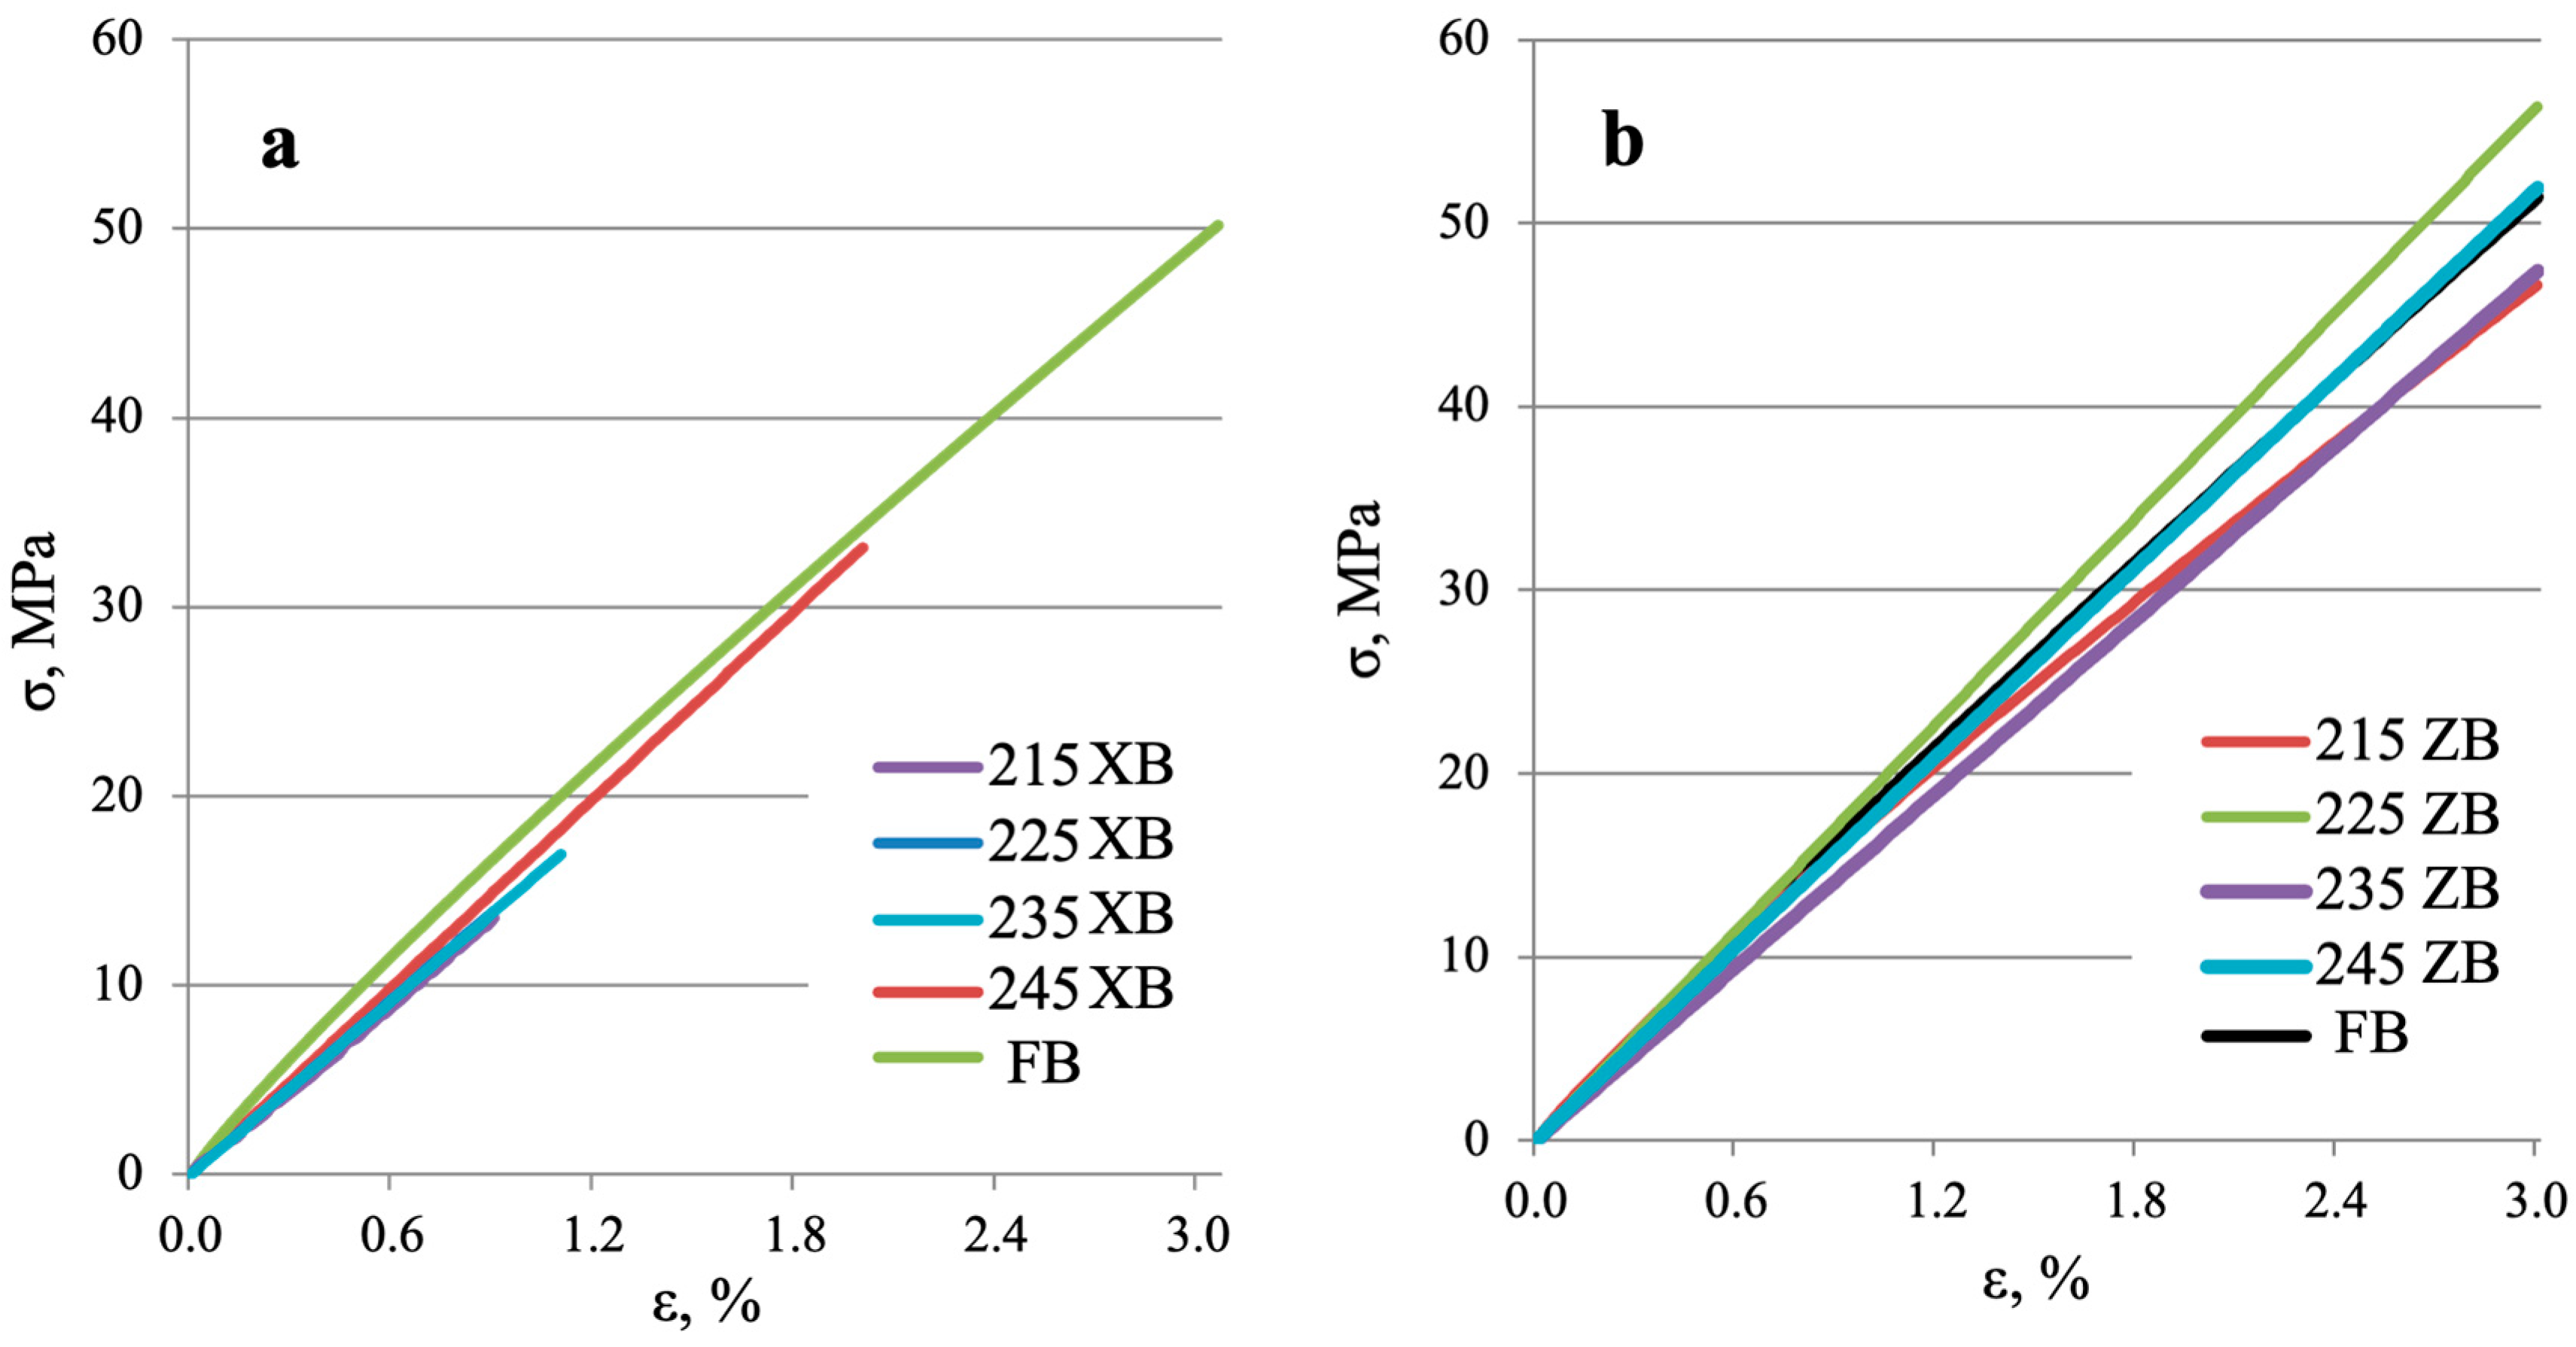
Figure 12 presents the stress–strain curves for the FFF-printed ABS across nozzle temperatures of 215–245 °C. In Figure 12a, the deposited layers are oriented perpendicular to the specimen axis (XB), whereas in Figure 12b, they are parallel to the axis (ZB). Machined (milled) ABS specimens (FB) are included in both panels as reference controls.
The Z orientation (layers ∥ to axis) stress varied from 45 to 55 MPa, depending on the printing temperature, i.e., the best result was achieved at 225 °C with an increase of +22.2% from the 215 °C printing temperature. The results for printing temperatures of 235 and 245 °C were below the best result, however. In general, the influence of temperature was only ±10% about the 50 MPa mean. Across this range, the milled ABS control showed no meaningful advantage over the printed parts. The X orientation (layers ⟂ to axis) stress ranged from 13.8 MPa at 215 °C to 33.5 MPa at 245 °C, corresponding to a +142.8% increase from the minimum to the maximum printing temperature. Here, the milled ABS control secured significantly better mechanical properties in terms of strain and maximum stress values.
Additionally, the measured strain varied by roughly 0.9–2.0%, a +122.2% increase from the lower to the upper value, indicating strong temperature sensitivity. Anisotropy, typical for FFF-printed parts, dominated the mechanical response. In the Z orientation, strength is dominated by interlayer diffusion; a moderate nozzle temperature (~225 °C) appears optimal, likely balancing improved polymer chain interpenetration with minimized residual stress.
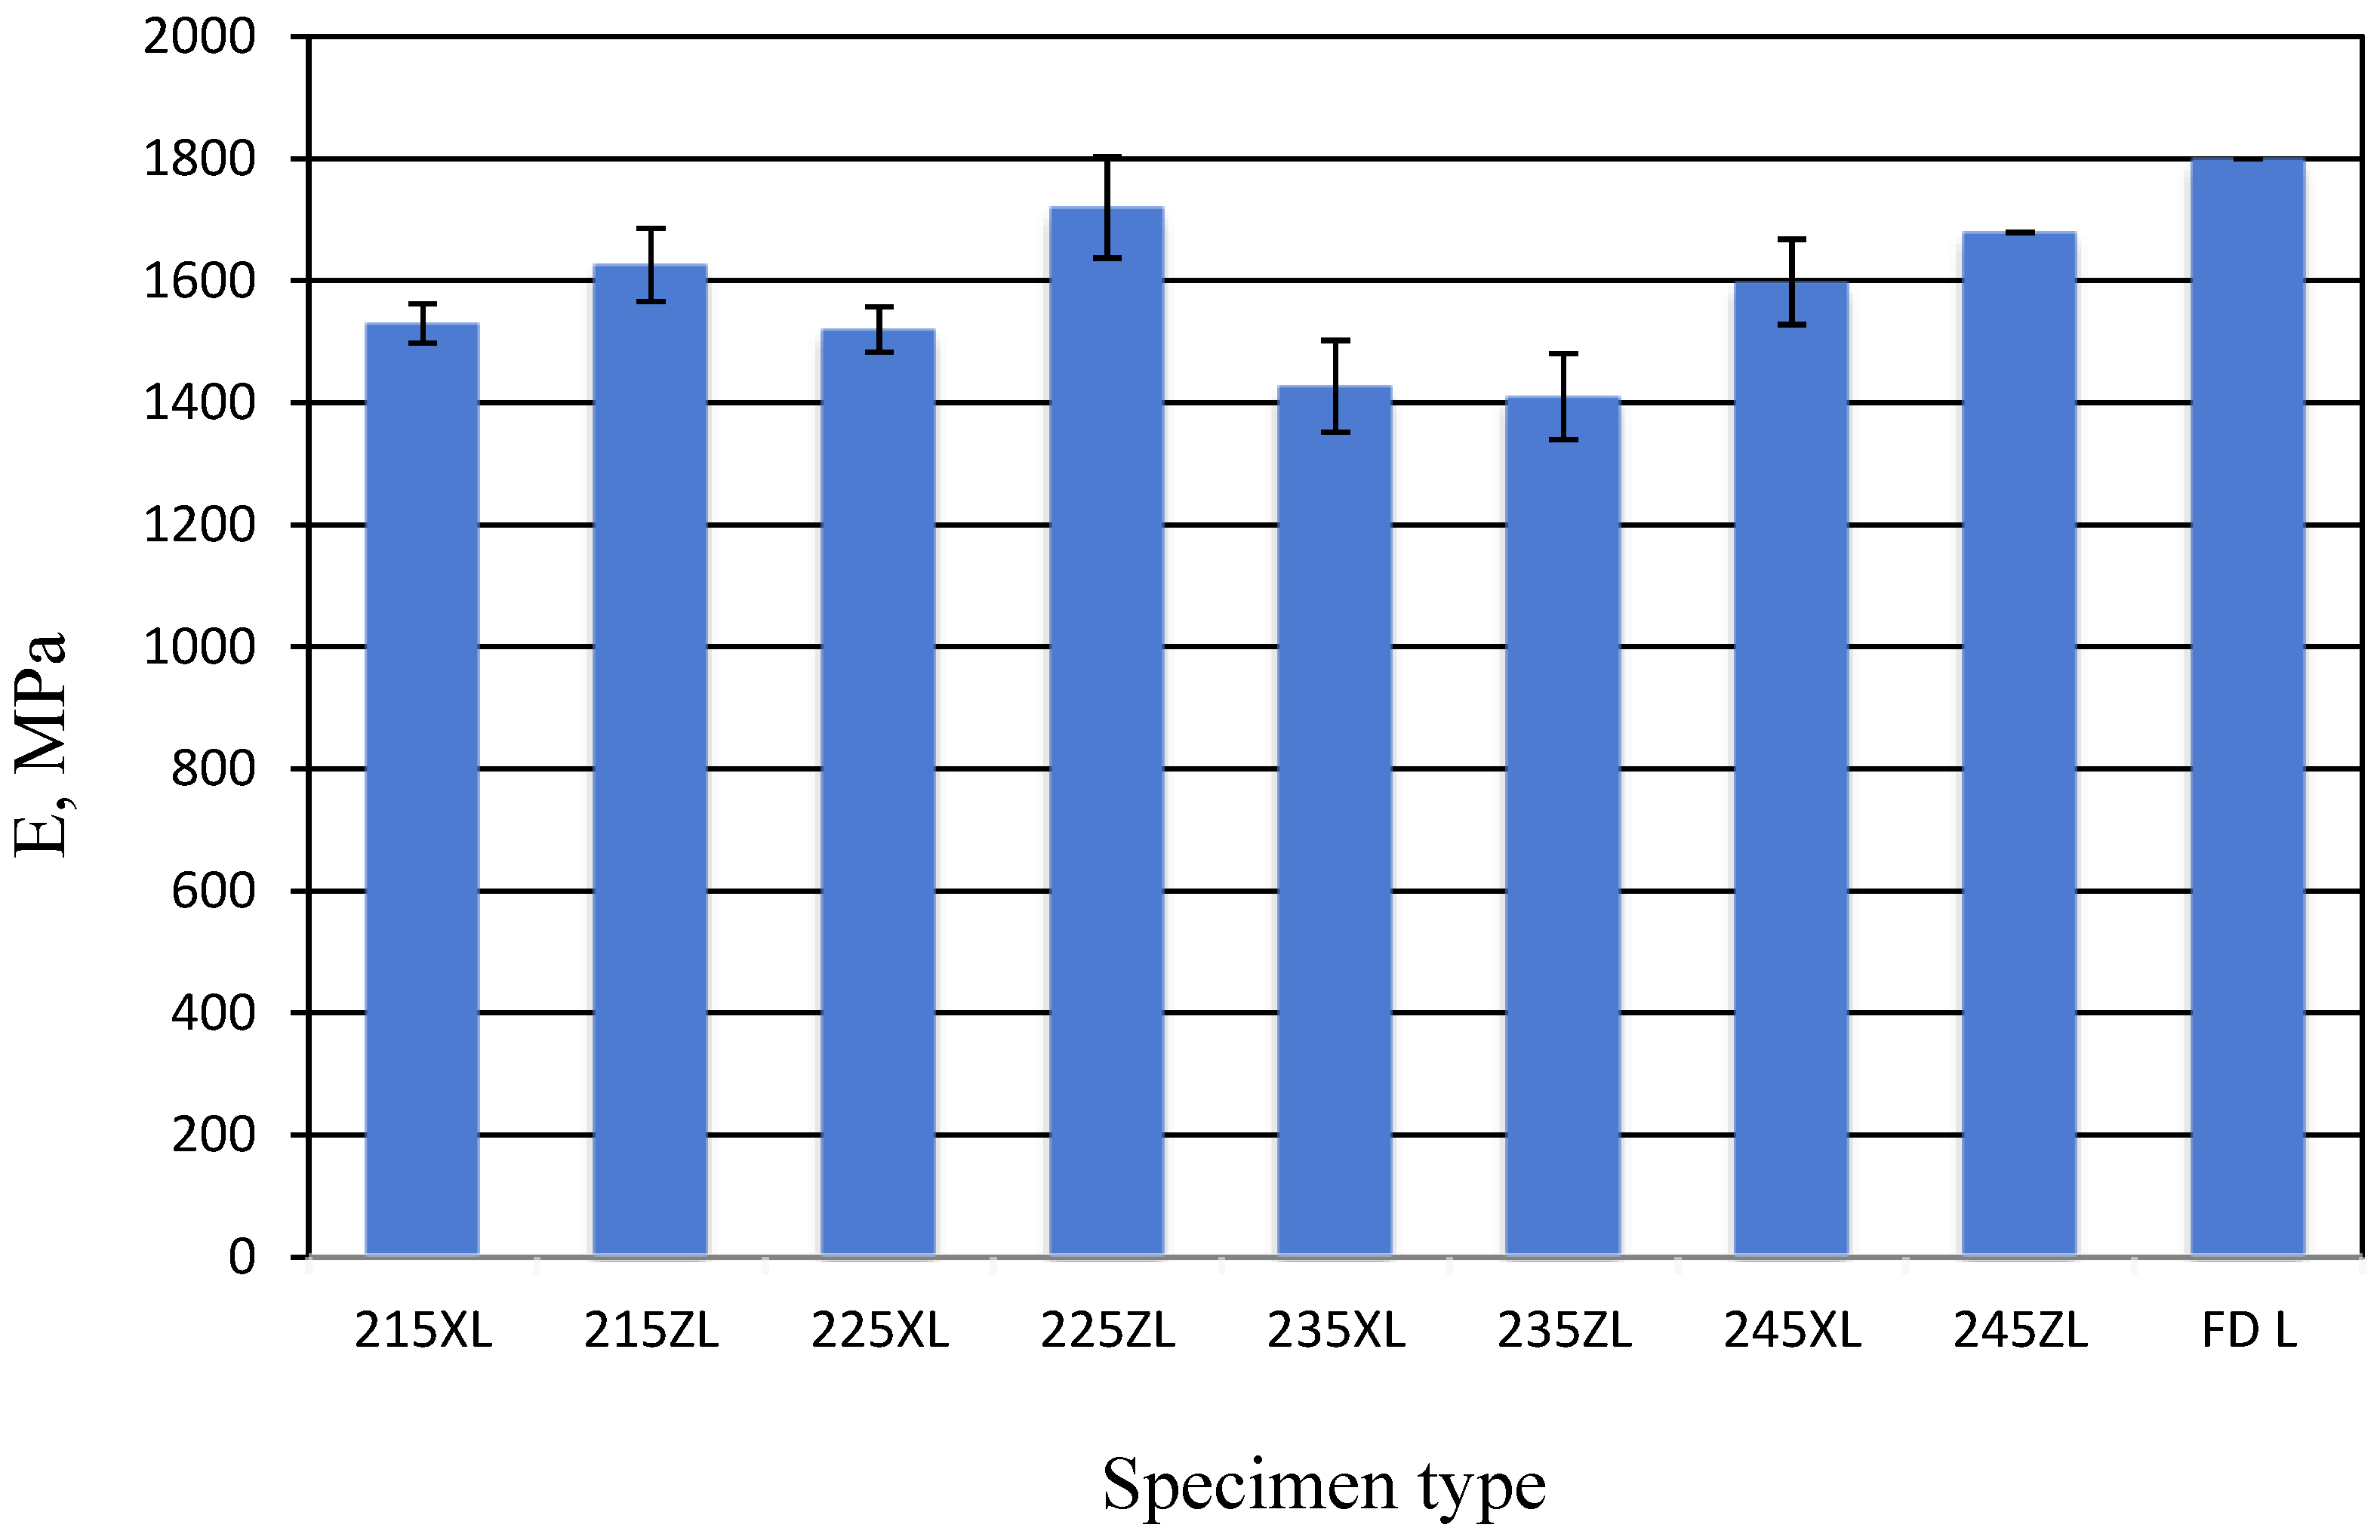
The printing orientation strongly influences the bending response (35–55 MPa; +57.1% from minimum to maximum). The best XB value was 35 MPa at 245 °C, while the best ZB value was 55 MPa at 225 °C. At fixed temperatures, ZB outperforms XB (Table A3, Figure 13): 215 °C: maximum stress +78%, elastic modulus +5.8%; 225 °C: maximum stress +77%, elastic modulus +20%; 235 °C: maximum stress +67%, elastic modulus +6.5%; 245 °C: maximum stress +44%, elastic modulus +48%. These contrasts underscore the dominant role of build orientation: Z-oriented printing provided superior load transfer and stiffness across the whole temperature range, with an optimum near 225 °C for ZB. By contrast, XB achieved its best properties at 245 °C. These trends enable the tuning of processing parameters to target the desired strength–stiffness balance.
Higher nozzle temperatures (up to an optimal point) improved fusion between layers, reducing voids and defects, as evidenced by the XB specimens (+142.8% strength increase from 215 °C to 245 °C).
The printing orientation had the most significant impact on strength (on average, ~70% higher in the ZB than in the XB specimens). The influence on elastic modulus was minor (on average, 8–10% higher in the ZT specimens).
The printing temperature had no significant effect on the ZT specimens. However, the XB specimens were particularly sensitive in the 235–245 °C range. The maximum stresses in 245XB (34.4 MPa) were ~43% higher than in 235XB (19.64 MPa). The elastic modulus in 245XB was also ~4% higher than in the XB specimens at other temperatures (215, 225, 235 °C).
The milled parts were ~22% weaker than the strongest printed parts (215ZL), but up to 71% stronger than the weakest printed parts (225XL).

3.3. Compression Test

The manufacturing orientation also influenced specimen strength (Figure 14). The strongest XC specimen showed average maximum stresses 17% higher than the ZC specimens. The elastic modulus in XC was 38% higher than in the ZC specimens.
The milled specimens were weaker than the XC printed specimens: stresses by 11%, and elastic modulus by 14%.

4. Conclusions

The experimental results demonstrate that printing orientation has a significant impact on mechanical behavior. The specimens printed in ZT, where the layers align with the load direction, consistently showed superior mechanical properties compared to the XT specimens, where the layers are perpendicular to the applied load. The ZT specimens outperformed the XT specimens across all temperatures tested (215 °C, 225 °C, 235 °C, 245 °C) but also exceeded the ultimate tensile strength of the FT specimens. At 245 °C, the ZT samples reached an average ultimate tensile strength of 41.0 MPa, surpassing the FT with 31.12 MPa; however, the FT had a better strain.
Raising the extrusion temperature improved the mechanical properties of the XT specimens. The highest improvements were observed at 245 °C, where the XT specimens reached their maximum strength (18.72 MPa) and elastic modulus (1.912 GPa). The ZT specimens showed less sensitivity to temperature variation. The XT specimens exhibited linear stress–strain behavior up to failure, with the ultimate and fracture strengths nearly identical. The ZT specimens demonstrated plastic deformation prior to fracture. Those specimens achieved the highest elastic modulus (2.05 GPa), exceeding both the XT and FT specimens.
The printing orientation is the dominant factor influencing bending performance. Across all tested conditions, the ZB specimens (layers parallel to the specimen axis) demonstrated superior flexural strength and stiffness compared to the XB specimens (layers perpendicular), with maximum stress advantages ranging from +44% to +78% depending on temperature. Elasticity was markedly greater in the ZB orientation, with strain increasing from ~1% to ~4% at 215 °C (+300%) and higher stress resistance (~60 MPa) compared to XB (~16 MPa; +275%). The printing temperature effects were orientation-dependent: For ZB, the temperature influence was modest (±10% about the mean of ~50 MPa), with the optimum performance at 225 °C (+22.2% over 215 °C). For XB, strength improved significantly with temperature, from 13.8 MPa at 215 °C to 33.5 MPa at 245 °C (+142.8%). The machined (FB) controls offered no significant advantage over the ZB-printed parts but outperformed the XB-printed parts in strength and strain. The compression testing also revealed an orientation effect: the XC specimens outperformed ZC by 17% in strength and 38% in stiffness, while the milled specimens were weaker than XC (−11% in strength, −14% in stiffness). The findings confirm that build orientation optimization—particularly Z-axis alignment—has a more substantial effect on mechanical properties than temperature adjustments alone, enabling targeted tuning of flexural and compressive performance for FFF-printed ABS.
The anisotropic behavior of ABS printed samples is primarily attributed to chain orientation during extrusion, weak interlayer adhesion from limited molecular diffusion, and residual stresses caused by thermal contraction. The multiphase structure of ABS, influenced by shear during deposition, further contributes to directional differences in properties. Additionally, variations in surface energy and wettability between layers affect bonding quality. Together, these physicochemical factors result in distinct mechanical performance along different print directions.
The results of this study are particularly relevant to design engineers working with polymer components in snap-fit assemblies, vibration-damping housings, or load-distributing brackets, where predictable elastic behavior is essential. The findings demonstrate that, with optimized printing parameters, FFF-printed ABS parts can achieve elastic performance comparable to that of milled counterparts, supporting their use in semi-structural applications.

Author Contributions

Conceptualization, D.V., A.R. and I.M.; methodology, D.V., S.T. and L.S.; software, L.S. and D.U.; validation, L.S. and N.K.; formal analysis, L.S., N.K. and R.A.; investigation, L.S., N.K., R.A. and D.V.; resources, L.S. and I.M.; data curation, L.S., N.K. and R.A.; writing—original draft preparation, L.S., D.V., A.R. and I.M.; writing—review and editing, L.S., D.V., A.R. and I.M.; visualization, L.S.; supervision, I.M.; project administration, L.S. and I.M.; funding acquisition, L.S. and I.M. All authors have read and agreed to the published version of the manuscript.

Funding

This research was funded by “Inoprogress”, grant number 02-019-K-0116. The project is co-financed by the European Union.

Data Availability Statement

The original contributions presented in the study are included in this article.

Conflicts of Interest

The authors declare no conflicts of interest.

Appendix A

Table A1. Normal stress at the ultimate tensile strength.
σ (Normal Stress), MPa
Test No.215XT215ZT225XT225ZT235XT235ZT245XT245ZTFT
17.9040.438.9742.538.9541.6817.2341.4431.24
27.1040.178.4742.289.4239.8020.8240.5530.16
38.9639.278.7342.5610.0539.1118.1040.9831.96
σv8.0039.968.7242.469.4740.2018.7241.0031.12
σs0.930.610.290.150.561.331.880.460.91
Ev180520071854195618101978191220501747
Es15.0036.1014.1435.2040.0025.2028.8726.5015.20
σv—arithmetic mean of the stresses; σs—standard deviation of the stresses; Ev—mean elastic modulus; Es—standard deviation of the elastic modulus.
Table A2. Normal stress at the fracture.
σ (Normal Stress at Fracture), MPa
Test No.215XT215ZT225XT225ZT235XT235ZT245XT245ZTFT
17.937.888.9739.798.9536.0817.2338.4920.99
27.131.798.4738.399.4232.1420.8235.5126.40
38.9637.558.7341.4210.0537.7218.137.1326.77
v835.748.7239.849.4735.3118.7237.0424.72
s1.183.41.421.510.622.861.691.490.9
v—an average value of the stresses; s—standard deviation of the stresses.
Table A3. Maximum bending stresses.
Normal Stresses (σ—Maximum Normal Stresses), MPa
Test No.215XB215ZB225XB225ZB235XB235ZB245XB245ZBFB
114.0266.5316.0265.7719.0159.7136.2861.8853
217.0563.9614.9966.7120.2559.3133.5762.9650
313.1965.9013.2063.5119.6760.4333.1660.38-
σv14.7565.4614.7465.3319.6459.8234.3461.7451
σs21.331.421.640.620.51.71.291.9
Ev153016261520172014271410159816791800
Es326037.283.27570.77012170
σv—average value of stresses; σs—standard deviation of stresses; Ev—average elasticity modulus; Es—standard deviation of elasticity modulus.
Table A4. Maximum compression stresses.
Normal Stresses (σ—Maximum Normal Stresses), MPa
Test No.XCZCFC
154.0839.9745.8
250.3644.2347.9
352.3643.144.5
σvg52.24346.1
σs0.930.290.15
Ea175010801500
σvg—arithmetic mean of maximum stresses; σs—standard deviation of stresses; Ea—approximated elastic modulus.

References

  1. Prashar, G.; Vasudev, H.; Bhuddhi, D. Additive Manufacturing: Expanding 3D Printing Horizon in Industry 4.0. Int. J. Interact. Des. Manuf. 2023, 17, 2221–2235. [Google Scholar] [CrossRef]
  2. Zhou, L.; Miller, J.; Vezza, J.; Mayster, M.; Raffay, M.; Justice, Q.; Al Tamimi, Z.; Hansotte, G.; Sunkara, L.D.; Bernat, J. Additive Manufacturing: A Comprehensive Review. Sensors 2024, 24, 2668. [Google Scholar] [CrossRef]
  3. Kaur, G.; Singari, R.M.; Kumar, H. A Review of Fused Filament Fabrication (FFF): Process Parameters and Their Impact on the Tribological Behavior of Polymers (ABS). Mater. Today Proc. 2022, 51, 854–860. [Google Scholar] [CrossRef]
  4. Mazzei Capote, G.A.; Rudolph, N.M.; Osswald, P.V.; Osswald, T.A. Failure Surface Development for ABS Fused Filament Fabrication Parts. Addit. Manuf. 2019, 28, 169–175. [Google Scholar] [CrossRef]
  5. Abbott, A.C.; Tandon, G.P.; Bradford, R.L.; Koerner, H.; Baur, J.W. Process-Structure-Property Effects on ABS Bond Strength in Fused Filament Fabrication. Addit. Manuf. 2018, 19, 29–38. [Google Scholar] [CrossRef]
  6. Rouf, S.; Raina, A.; Irfan Ul Haq, M.; Naveed, N.; Jeganmohan, S.; Farzana Kichloo, A. 3D Printed Parts and Mechanical Properties: Influencing Parameters, Sustainability Aspects, Global Market Scenario, Challenges and Applications. Adv. Ind. Eng. Polym. Res. 2022, 5, 143–158. [Google Scholar] [CrossRef]
  7. Ćwikła, G.; Grabowik, C.; Kalinowski, K.; Paprocka, I.; Ociepka, P. The Influence of Printing Parameters on Selected Mechanical Properties of FDM/FFF 3D-Printed Parts. IOP Conf. Ser. Mater. Sci. Eng. 2017, 227, 012033. [Google Scholar] [CrossRef]
  8. Mushtaq, R.T.; Iqbal, A.; Wang, Y.; Rehman, M.; Petra, M.I. Investigation and Optimization of Effects of 3D Printer Process Parameters on Performance Parameters. Materials 2023, 16, 3392. [Google Scholar] [CrossRef]
  9. Barclift, M.W.; Williams, C.B. Examining variability in the mechanical properties of parts manufactured via polyjet direct 3D printing. In Proceedings of the 23rd Annual International Solid Freeform Fabrication Symposium—An Additive Manufacturing Conference, Austin, TX, USA, 14–16 August 2023. [Google Scholar]
  10. Doshi, M.; Mahale, A.; Singh, S.K.; Deshmukh, S. Printing Parameters and Materials Affecting Mechanical Properties of FDM-3D Printed Parts: Perspective and Prospects. Mater. Today Proc. 2022, 50, 2269–2275. [Google Scholar] [CrossRef]
  11. Asadi-Eydivand, M.; Solati-Hashjin, M.; Farzad, A.; Abu Osman, N.A. Effect of Technical Parameters on Porous Structure and Strength of 3D Printed Calcium Sulfate Prototypes. Robot. Comput. Integr. Manuf. 2016, 37, 57–67. [Google Scholar] [CrossRef]
  12. Lanzotti, A.; Grasso, M.; Staiano, G.; Martorelli, M. The Impact of Process Parameters on Mechanical Properties of Parts Fabricated in PLA with an Open-Source 3-D Printer. Rapid Prototyp. J. 2015, 21, 604–617. [Google Scholar] [CrossRef]
  13. Syrlybayev, D.; Zharylkassyn, B.; Seisekulova, A.; Akhmetov, M.; Perveen, A.; Talamona, D. Optimisation of Strength Properties of FDM Printed Parts—A Critical Review. Polymers 2021, 13, 1587. [Google Scholar] [CrossRef]
  14. Kumar, N.; Jain, P.K.; Tandon, P.; Pandey, P.M. The Effect of Process Parameters on Tensile Behavior of 3D Printed Flexible Parts of Ethylene Vinyl Acetate (EVA). J. Manuf. Process 2018, 35, 317–326. [Google Scholar] [CrossRef]
  15. Chadha, A.; Ul Haq, M.I.; Raina, A.; Singh, R.R.; Penumarti, N.B.; Bishnoi, M.S. Effect of Fused Deposition Modelling Process Parameters on Mechanical Properties of 3D Printed Parts. World J. Eng. 2019, 16, 550–559. [Google Scholar] [CrossRef]
  16. Khaliq, J.; Gurrapu, D.R.; Elfakhri, F. Effects of Infill Line Multiplier and Patterns on Mechanical Properties of Lightweight and Resilient Hollow Section Products Manufactured Using Fused Filament Fabrication. Polymers 2023, 15, 2585. [Google Scholar] [CrossRef] [PubMed]
  17. Rendas, P.; Figueiredo, L.; Cláudio, R.; Vidal, C.; Soares, B. Investigating the Effects of Printing Temperatures and Deposition on the Compressive Properties and Density of 3D Printed Polyetheretherketone. Prog. Addit. Manuf. 2023, 9, 1883–1899. [Google Scholar] [CrossRef]
  18. Shanmugam, V.; Babu, K.; Kannan, G.; Mensah, R.A.; Samantaray, S.K.; Das, O. The Thermal Properties of FDM Printed Polymeric Materials: A Review. Polym. Degrad. Stab. 2024, 228, 110902. [Google Scholar] [CrossRef]
  19. Dziewit, P.; Rajkowski, K.; Płatek, P. Effects of Building Orientation and Raster Angle on the Mechanical Properties of Selected Materials Used in FFF Techniques. Materials 2024, 17, 6076. [Google Scholar] [CrossRef]
  20. Li, Z.; Chang, L. Development of Wear-Resistant Polymeric Materials Using Fused Deposition Modelling (FDM) Technologies: A Review. Lubricants 2025, 13, 98. [Google Scholar] [CrossRef]
  21. Kuznetsov, V.E.; Solonin, A.N.; Urzhumtsev, O.D.; Schilling, R.; Tavitov, A.G. Strength of PLA Components Fabricated with Fused Deposition Technology Using a Desktop 3D Printer as a Function of Geometrical Parameters of the Process. Polymers 2018, 10, 313. [Google Scholar] [CrossRef]
  22. Jackson, B.; Fouladi, K.; Eslami, B. Multi-Parameter Optimization of 3D Printing Condition for Enhanced Quality and Strength. Polymers 2022, 14, 1586. [Google Scholar] [CrossRef]
  23. Mazen, A.; McClanahan, B.; Weaver, J.M. Factors Affecting Ultimate Tensile Strength and Impact Toughness of 3D Printed Parts Using Fractional Factorial Design. Int. J. Adv. Manuf. Technol. 2022, 119, 2639–2651. [Google Scholar] [CrossRef]
  24. Bakhtiari, H.; Aamir, M.; Tolouei-Rad, M. Effect of 3D Printing Parameters on the Fatigue Properties of Parts Manufactured by Fused Filament Fabrication: A Review. Appl. Sci. 2023, 13, 904. [Google Scholar] [CrossRef]
  25. ISO 527-2:1993; Plastics—Determination of Tensile Properties—Part 2: Test Conditions for Moulding and Extrusion Plastics. ISO: Geneva, Switzerland, 2003.
  26. ISO 178:2003; Plastics—Determination of Flexural Properties. ISO: Geneva, Switzerland, 2003.
  27. ISO 604:2002; Plastics—Determination of Compressive Properties. ISO: Geneva, Switzerland, 2002.
Figure 1. Printing directions of the specimen: (a) perpendicular (X) (b) longitudinal (Z).
Coatings 15 00963 g001
Figure 2. (a) Drawing of the tensile specimen: top and side view. (b) 235XT specimen after the experiment.
Coatings 15 00963 g002
Figure 3. (a) Drawing of the bending specimen. (b) Bending test with the 215XL specimen.
Coatings 15 00963 g003
Figure 4. (a) Drawing of the bending specimen. (b) Schematic of the compression experiment with the specimen printed in perpendicular and longitudinal directions.
Coatings 15 00963 g004
Figure 5. Typical stress–strain characteristic of ABS under tensile.
Coatings 15 00963 g005
Figure 6. Three tensile experiments with 3D-printed parts. (a) Normal stresses in specimen 215XT. (b) Results for 215ZT. A line is an approximating curve.
Coatings 15 00963 g006
Figure 7. (a) XT specimens at different barrel temperatures and FT stress dependence on strain. (b) XT specimens at different barrel temperatures and FT approximated stress dependence on strain. (c) ZT specimens at different nozzle temperatures and FT approximated stress dependence on strain.
Coatings 15 00963 g007
Figure 8. Influence of printing orientation on specimen mechanical properties at different printing temperatures: (A). 215 °C; (B). 225 °C; (C). 235 °C; (D). 245 °C.
Coatings 15 00963 g008
Figure 9. Temperature impact on the average ultimate and fracture strengths at the different printing orientations. Orange bars: ultimate strength, blue bars: fracture strength. FT—milled ABS part.
Coatings 15 00963 g009
Figure 10. Elastic moduli comparison: 3D printed parts vs. FT.
Coatings 15 00963 g010
Figure 11. Stress–strain dependencies obtained with the specimens printed in (a) perpendicular direction; (b) longitudinal direction.
Coatings 15 00963 g011
Figure 12. Stress–strain dependencies of specimens printed at different temperatures. (a) Printed in perpendicular direction. (b) Printed in longitudinal direction.
Coatings 15 00963 g012
Figure 13. Elasticity modulus in XB, ZB, and FB samples.
Coatings 15 00963 g013
Figure 14. Stress–strain dependencies obtained from compression tests.
Coatings 15 00963 g014
Table 1. Specimens’ configuration.
Manufacturing Method3D Printing Milling
Temperature, °C215225235245_
OrientationXZXZXZXZ_
Tensile test215XT215ZT225XT225ZT235XT235ZT245XT245ZTFT
Bending test215XB215ZB225XB225ZB235XB235ZB245XB245ZBFB
Compression test--XCZC----FC
Disclaimer/Publisher’s Note: The statements, opinions and data contained in all publications are solely those of the individual author(s) and contributor(s) and not of MDPI and/or the editor(s). MDPI and/or the editor(s) disclaim responsibility for any injury to people or property resulting from any ideas, methods, instructions or products referred to in the content.