Abstract
Newly developed hygrosensitive poly(vinyl alcohol) derivatives comprising grafted poly(N,N-dimethylacrylamide) chains of varied length and graft density are presented. The optical, sensing, and hydration properties of these copolymer thin films prepared by spin-coating were systematically studied. Refractive indices (n), absorption coefficients (k), and thicknesses (d) were calculated via curve fitting of the reflection spectra. Reflectance measurements across a relative humidity range of 5% to 95% were used to evaluate the humidity sensing behavior. Coating swelling exceeding 100% was observed. Hydration levels under high humidity conditions were studied using a quartz crystal microbalance method. This revealed approximately 24% water content in the polymer with the higher grafting density and shorter PDMA chains compared to around 31% in the copolymer with longer PDMA brushes that were loosely grafted The potential application of these copolymers as responsive materials for advanced humidity sensing is discussed. A combined optical and gravimetric approach for characterizing the humidity sensing properties of thin nanosized coatings is demonstrated, providing opportunities for advanced characterization of new functional materials, thus broadly contributing to the state of the art of sensor technologies.
1. Introduction
Research experiments, agricultural productions, industrial processes, and many commercial and industrial applications all heavily rely on the measurement and precise regulation of environmental humidity. Numerous kinds of humidity sensors have been created based on the measurement of different effects and parameters—capacitive [1,2,3,4,5], resistive [5,6,7], optical [8,9,10,11], gravimetric [12,13,14,15], etc. However, the rapidly advancing fields of science and technology demand humidity sensors that are more sensitive, have a larger detecting range, a shorter response and recovery time, and are less expensive than those already available on the market. Moreover, it is also of importance to have a sensor with a small size and a simple operational mechanism. Therefore, a lot of work is being focused into creating extremely sensitive materials and innovative devices to deal with these problems. A sensitive thin film or coating is a key component as its interaction with water molecules determines the overall performance and which carries out the principle of humidity sensing in the majority of devices. Therefore, a lot of research is being focused on studying different sensing materials in order to achieve their optimal performance characteristics. An important aspect of the research is the technological compatibility of the obtained new material with the physical transducer. Thus, it would be a real advantage if a selected material could serve as a sensitive element both for optical and gravimetric sensors, for example.
Such research could provide valuable insights into the design and performance of polymers and other sensitive materials intended for use in optical and gravimetric sensing devices and thus broadly contribute to advanced sensor technologies and their practical implementations in various fields. In this context, we demonstrate an approach of using a homemade experimental setup for combined optical and gravimetric (QCM) testing of the humidity sensing properties of thin nanosized coatings providing opportunities for advanced characterization of new functional materials.
It is worth noting that the QCM is an extremely stable and powerful device due to its high sensitivity to mass changes on a nanogram scale, the fast response–recovery speed, miniature size, and low power consumption. Many studies [16,17,18,19] have proved that it is a promising humidity sensing device and can be an alternative approach for effective humidity detection. It allows real time monitoring of water sorption isotherms using very small amounts of samples.
As a result, findings from optical and gravimetric characterization may be complementary, offering mutually enlightening insights into the processes in sensitive nanoscale materials in conditions of changing environmental humidity levels.
Many materials have been widely explored separately for humidity detection—metal oxides [20,21], nanoparticles [2,22], zeolites [23,24], graphene [25,26], polymers [27,28], etc. Among them, polymers stand out with the noteworthy opportunities which they offer for modifying their properties. In materials research, the ability to control the material’s properties is crucial. Numerous polymer materials have been extensively studied [29,30] using various techniques and methodologies, depending on the field of application. They are traditional but challenging materials because their qualities as sensitive materials can be tuned [31]. Their excellent performance, functionality, and sensing capabilities can be significantly impacted by the ability to add side chemical groups [32], offering opportunity to detect even minimum changes in the environmental conditions both optically and gravimetrically.
In our previous studies [11], we showed that modified PVA based copolymers are suitable for optical sensing of humidity. In the present study, we continued the investigation of PVA based copolymers with newly developed hygrosensitive poly(vinyl alcohol) derivatives comprising grafted poly(N,N-dimethylacrylamide) chains of varied length and graft density, to improve and expand their application possibilities. Investigation on how grafted chains affect their sensing properties and the relative humidity impact on moisture-sensitive copolymer coatings was carried out by using optical and gravimetric detection techniques. Enhancement of sensing behavior by applying this approach is demonstrated and discussed.
2. Materials and Methods
2.1. Synthesis of PVA-Graft-Poly(N,N-dimethylacrylamide)
Poly(vinyl alcohol) (PVA, approx. Mw 10000, 88% hydrolyzed, CAS 9002-89-5), N,N-dimethyacrylamide (DMA, 99%, CAS 2680-03-7), ammonium cerium(IV) nitrate (CAN, ≥ 98.5%, CAS 16774-21-3), nitric acid (HNO3, 70%, CAS 7697-37-2) were purchased from Sigma-Aldrich (St. Louis, MO, USA). Prior to use, the monomer DMA was passed through a column of activated basic alumina for removal of the inhibitor, hydroquinone monomethyl ether, and then blown by nitrogen. Solvents and other reagents of standard laboratory reagent grade were used without additional purification.
Double hydrophilic brush copolymers studied in this work were synthesized by grafting DMA on PVA by means of redox polymerization in aqueous media using deionized water as a solvent and ammonium cerium (IV) nitrate as initiator. The procedure of redox polymerization of DMA in the presence of hydroxyl moiety was already reported in our previous studies [33,34]. In this work PVA was applied as initiating hydroxyl moiety and a series of PVA-g-PDMA copolymers were obtained following the same general procedure after optimization. Briefly, 1 g of PVA was dissolved in 10 mL deionized water and the solution was bubbled with nitrogen for 15 min for oxygen removal. The solution was cooled down to 10 °C and then the predetermined amount of initiator CAN dissolved in 1 N HNO3 was added under vigorous stirring followed by nitrogen bubbling for another 15 min. Finally, the chosen amount of the monomer DMA was added under nitrogen, and the reaction mixture was heated to 35 °C. The polymerization was carried out for 3 h at 35 °C under nitrogen atmosphere. Two brush copolymers were synthesized at monomer-to-PVA-to-initiator molar ratio 1.0:0.23:0.023 and 1.0:0.23:0.012, respectively. The obtained crude copolymer samples were purified by dialysis against deionized water and finally isolated by freeze-drying.
2.2. Copolymer Characterization Methods
2.2.1. Fourier-Transform Infrared Spectroscopy
Fourier-transform infrared spectroscopy (FTIR) analysis was performed using an IRAffinity-1 spectrophotometer (Shimadzu Company, Kyoto, Japan) equipped with a MIRacleTM ATR accessory (diamond crystal; PIKE Technologies, Madison, WI, USA). Copolymer samples were scanned over a wave number range from 4000 to 700 cm−1, performing 50 scans at a resolution of 4 cm−1.
2.2.2. Nuclear Magnetic Resonance
NMR analysis of copolymers was implemented on a Bruker Avance II+ 600 NMR spectrometer in deuterated dimethyl sulfoxide (DMSO-d6) as a solvent. The copolymer compositions were estimated from the integrated proton spectra when comparing the integrals of characteristic signals assigned to PVA and PDMA repeating units.
2.2.3. Dynamic Light Scattering
Dynamic light scattering measurements were performed on a NanoBrook 90Plus PALS instrument (Brookhaven Instruments Corporation, Nashua, NH, USA), Brookhaven Instruments Corporation), equipped with a 35 mW red diode laser (λ = 640 nm). Size measurements were accomplished at a scattering angle of 90° at 25 °C. Aqueous copolymer solutions of concentration 1.25 g/L were analyzed, and each measurement was performed in triplicate.
2.2.4. Thermogravimetric Analysis
Thermogravimetric analysis (TGA) was performed on a TGA-4000 PerkinElmer instrument (PerkinElmer, Waltham, MA, USA), heating the samples in an argon atmosphere at 10 °C/min within the temperature range 40–800 °C.
2.3. Thin Films Deposition
For the deposition of the copolymer coatings, the spin-coating method (WS-650-23 B, Laurel, MS, USA) was used. All samples were rotated at speed of 4000 rpm and time of 60 s using 200 µL of the copolymer solution dropped on precleaned silicon wafer substrate. Post deposition annealing was applied in air for 30 min at 60 °C. Identical coatings were deposited on quartz crystal resonators with gold electrodes and a SiO2 overlayer.
2.4. Characterization of Thin Films
2.4.1. Optical Characterization and Thickness Calculation
First, reflectance spectra of all samples were measured with UV-VIS-NIR (ultraviolet–visible–near infrared) spectrophotometer (Cary 5E, Varian, Australia). Then, optical constants—refractive index n and absorption coefficient k, along with the thickness of the films d—were calculated via the previously developed two-stage nonlinear curve fitting method [35] from the already measured reflectance spectra.
2.4.2. Sensing Properties
In order to evaluate the sensing properties of the coatings a homemade bubbler system was used [36]. Different relative humidity levels were generated by bubbling argon through distilled water maintained at 60 °C and directed to the cell containing the sample. The same bubbling system was used for both optical sensing and gravimetric measurements (Figure 1).
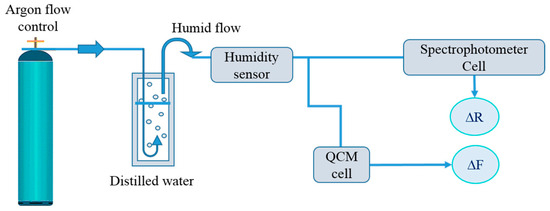
Figure 1.
Set up for measurement of the sensing properties of the thin film/coating samples.
Acoustical Sensing
In order to estimate the hygrosensitive properties of the studied polymers, a technique based on the quartz crystal microbalance was used. Copolymer coatings were deposited on quartz resonators, and their hydration was continuously scanned by means of the openQCM NEXT device. We used SiO2 5 MHz resonators. Both the QCM instrument and the resonators were purchased from Novaetech, Pompei, Italy.
Assuming that the material adsorbed across the resonator’s active area is rigid and uniformly distributed, and that the layer’s mass is small relative to the mass of the quartz crystal, the Sauerbrey equation may be used. It describes a linear relationship between added mass and the induced frequency shift [37]:
where Zq is acoustic impedance of quartz (8.8 × 10⁶ kg m−2s−1), f0 is the fundamental resonance frequency of the quartz crystal (approximately 5 MHz for the used resonators), N is the overtone number, is the frequency shift of the Nth overtone normalized to N and mf is the areal mass (kg m−2). This equation can be used to calculate the mass of the adsorbed material and the analyte molecules. Under the Sauerbrey approximation, the normalized frequency shifts from each overtone should be equal, and the adsorbed mass can be computed directly from (1) by taking the mean of all values derived from .
However, in some cases, due to the rheological and/or surface properties of the applied film the coating of the quartz resonator leads to deviations from the Sauerbrey equation, and varies between the overtones depending on the overtone number. In this case, alternative methods for data analysis are applied [16,17,18,19,38].
According to the relationship (2), the total coating hydrated mass m95% (the mass at humidity level RH = 95%) and its dry mass m5% (the mass measured at RH = 5%) can be used to determine the accumulated water mass mwater and the water content in the coating [16]:
Prior to use, the new resonators were cleaned with water and ethanol. A standard experiment used a homemade bubbler system to initially characterize the bare resonator by using the QCM device with a temperature-controlled module in a dry Ar atmosphere at RH = 5%. Afterwards, the resonator was removed from the QCM and a thin coating was spin-coated onto the surface at a rotation speed of 4000 rpm for 60 s, applying the same procedure as for the formation of polymer coatings on Si substrates. The deposition technique was selected in order to obtain thin evenly distributed coatings over the resonator surface. After the resonator was inserted into the QCM module a homemade bubbler system connected to the QCM cell (Figure 1) was used to evaluate the sorption/desorption of water vapor by the studied polymer films. The films were exposed to continuously increasing/decreasing RH values in the range (5–95%) at constant temperature t = 20 °C.
Optical Sensing Properties
For the recording of the reflectance spectra at different values of relative humidity (RH) in the range from 5% to 95% RH, the samples deposited on the Si-wafer were placed one by one in a quartz cell; this was mounted onto the spectrophotometer to give the possibility to measure spectra at the desired relative humidity. Since a commercially available humidity sensor is integrated in the quartz cell, the dependence of reflectance on relative humidity (R versus RH) can also be derived. For the determination of hysteresis, reflectance spectra were measured for increasing and decreasing RH in the range 5–95% RH. To do this, a fixed wavelength (λmax), preliminarily chosen as the wavelength of the highest humidity responses (ΔRmax), was used. Determination of the wavelength for each sample, along with optical constants and thickness (and its change), was conducted by measurement of the reflectance spectra in the range 320–800 nm at 5% and 95% RH. Spectra were used to calculate the thickness at different humidity levels, from which the change of the thickness ∆d and the relative change of the thickness ∆d/d5% were found:
where d95% and d5% were the thicknesses of the films at dry (RH = 5%) and hydrated (RH = 95%) states.
Different parameters were used in order to compare optical sensing properties and quantify the samples under study—sensitivity S, accuracy ΔRH, and hysteresis H. The following formula was used to determine the thin film’s sensitivity S:
where ΔR is the change of the film’s reflectance in % for humidity levels changing from RH1 to RH2. From the already determined sensitivity S, the next accuracy/resolution (ΔRH) of detection can be estimated. It depends on the sensitivity and measurement accuracy in the signal. The following formula was used for the calculation:
where errR = 0.3% is the experimental error (accuracy) of the reflectance R and S is the sensitivity, calculated from Equation (4).
Unwanted hysteresis, which is manifested as different R values measured at the same humidity levels depending on the history of the humidity, can sometimes occur when RH changes from low to high levels or vice versa. At best, for our sensitive material (copolymer coating), we wanted to achieve the highest detection sensitivity with the lowest possible percentage of hysteresis. So, the percentage of hysteresis (H) was determined by Equation (6):
where Rup and Rdown are reflectance values measured for increasing and decreasing humidity, respectively, ΔR is the reflectance change in the entire humidity range, and Q is the number of points over which the summation is performed.
3. Results
3.1. Characterization of Synthesized PVA-g-PDMA Brush Copolymers
Double hydrophilic brush copolymers, comprising relatively short PVA backbone and grafted PDMA chains, were synthesized and investigated for optical as well as acoustic sensing application. Two copolymers of similar copolymer composition but differing in grafting density and length of grafted PDMA side chains were prepared under environmentally friendly reaction conditions—water as reaction medium and moderate reaction temperature. For this, equal PVA and DMA concentration in the initial reaction mixture was applied while the initiator concentration was changed twofold. The chemical structure of the obtained copolymers is illustrated in Figure 2.

Figure 2.
Schematic illustration of copolymer structure comprising poly(vinyl alcohol) backbone grafted with poly(N,N-dimethyl acrylamide) side chains.
Table 1 summarizes the reaction conditions and the characterization of the obtained copolymers. It can be clearly seen that copolymer yields are high and not significantly dependent on the initiator concentration. As expected, the mole fractions of grafted PDMA brushes in the copolymer composition, calculated from the integrated proton NMR spectra of G1 and G2, are close to the theoretical value set by the feed (Table 1). Consequently, the only difference between the investigated copolymers is the macromolecular architectures—G1 represents the brush copolymer of the higher grafting density and shorter PDMA graft chains, and vice versa for G2.

Table 1.
Grafting reaction conditions.
The chemical composition of G1 and G2 was evaluated by FTIR analysis. In the FTIR spectra of G1 and G2 (Figure 3), strong carbonyl bands at 1616 cm−1 ascribed to the C=O stretching vibrations (amide I) of PDMA segments are well visible. In addition, characteristic peaks at about 1500 cm−1 assigned to the H–C–H bending vibrations of the PDMA methyl groups are also present. In the spectrum of pristine PVA, a broad and strong band observed between 3000–3600 cm−1 is attributed to the stretching vibrations of the O–H bond, indicating the presence of hydroxyl groups. Other characteristic bands include those at 2915–2940 cm−1 for stretching C–H, at 1417 cm−1 for bending CH2, and at 1090 cm−1 for the stretching vibration of the C–O, as well as an additional band at 1734 cm−1 related to C=O stretching for the residual acetate groups. However, all these PVA characteristic bands are hardly detectable in the copolymer spectra due to the complex macromolecular architecture of G1 and G2 and the low PVA fraction in the copolymer composition.
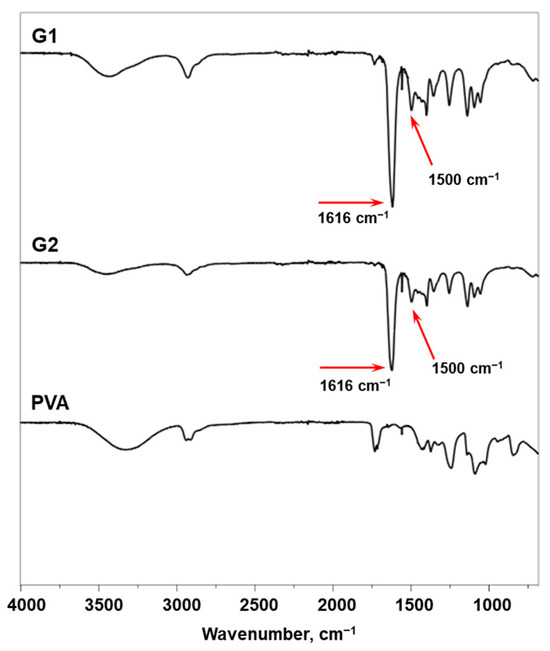
Figure 3.
FTIR spectra of G1 and G2 compared to the spectrum of original PVA.
The data presented in Table 1 clearly indicate that the theoretical chemical compositions of copolymers G1 and G2 are identical. Since the FTIR method analyzes bond vibrations between atoms, no significant differences in the spectra of copolymers with similar compositions are expected. Indeed, the overlaid ATR-FTIR spectra of G1 and G2, shown in Figure 3, are identical and do not reveal any noticeable differences in composition. These results validate the proposed chemical composition and structure of the copolymers.
The chemical structure and composition of G1 and G2 were investigated by means of NMR spectroscopy. The proton NMR spectrum of G1 was compared to those of the original PVA in Figure 4. The proton NMR spectra of G1 and G2 are presented in Figure 4 together with those of pristine PVA. As shown in the spectrum of PVA (Figure 4a), protons of CH2 appear as a multiplet at 1.3–1.5 ppm and those of CH appear at 3.5–3.6 ppm. Protons of OH groups can be seen as three separate peaks at 4.3, 4.5, and 4.7 ppm. In addition, the signals of methyl protons (CH3) in the residual acetate groups appear at 1.9 ppm.
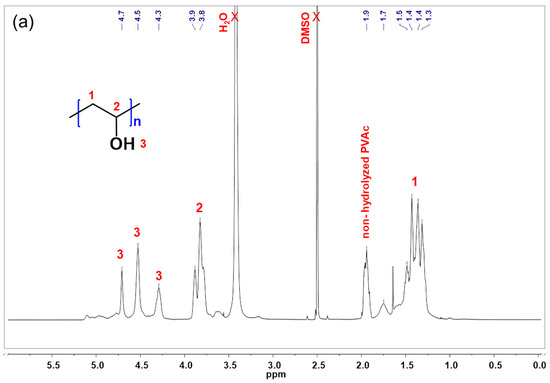
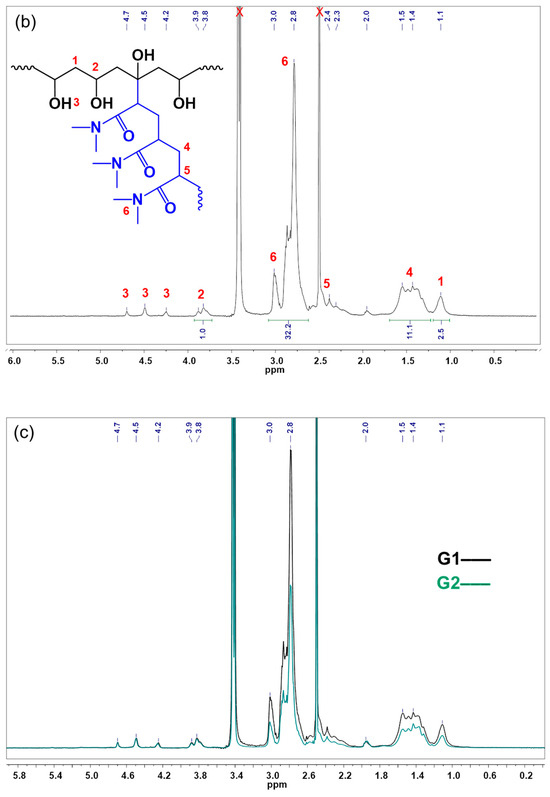
Figure 4.
1H NMR spectra (600 MHz, DMSO-d6) of the following: (a) pristine PVA; (b) G1; and (c) overlaid spectra of G1 and G2.
In the spectrum of G1 (Figure 4b), along with the signals assigned to PVA, protons of the CH3 groups in the grafted PDMA side chains appear at 2.8–3.0 ppm. Signals of the protons of the CH2 and CH groups in PDMA can be seen as a multiplet at 1.2–1.7 ppm and shoulder peaks at 2.3–2.4 ppm. The integrated signals of methyl, methylene, and methine groups in PDMA together with the corresponding methylene and methine groups in PVA were used to estimate the copolymer composition of G1 and G2, expressed as PDMA mole fraction (Table 1).
It was emphasized above, that the copolymer composition of G1 and G2 was the same at the feed. The overlaid proton NMR spectra of G1 and G2 (shown in Figure 4c) confirm that the synthesized brush copolymers have a similar chemical composition and differ in graft density and length of the grafted PDMA side chains only.
The structural complexity of G1 and G2 and the different parameters of its macromolecular architecture affect the copolymer properties both in solution as well as in bulk. As can be seen from the DLS measurement results, listed in Table 1, the dispersity of the brush copolymer aggregates of G1 in aqueous solution is very similar to those of G2. The hydrodynamic diameter (Dh) of G1, however, is much larger, almost double that of G2, which is attributed to the specific macromolecular architecture of densely grafted short PDMA brushes. The much smaller hydrodynamic diameter measured for G2 is explained by the relatively longer PDMA brushes and lower grafting density, resulting in a more compact aggregate structure.
The impact of the grafting density and length of the grafted PDMA brushes is also seen in Figure 5, where the TGA profiles of G1 and G2 are compared. The mass loss of G1, densely grafted with short PDMA brushes, occurs much faster in the initial temperature range up to 150 °C as compared to G2, and is explained by the specific macromolecular assembly of the copolymers. In the next temperature intervals, the decomposition of G1 and G2 occurs simultaneously which could be expected for copolymers of similar composition.
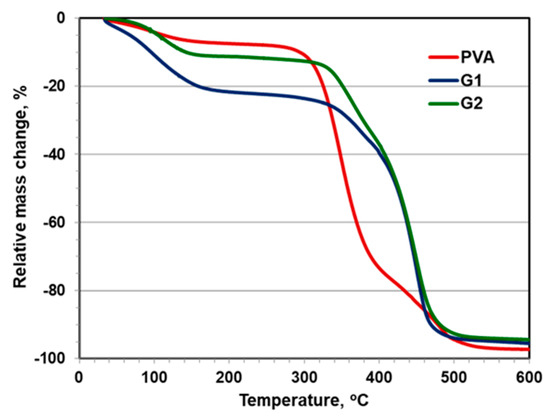
Figure 5.
TGA curves of G1, G2, and original PVA.
3.2. Optical Properties of the Copolymers Thin Film Coating
Purposely, the 2 wt% solution of the copolymers G1 and G2 in water/methanol solvents (volume ratio of 20:80) were prepared and spin-coated on precleaned silicon substrates in order to obtain nanosized coatings/thin films. The films had a smooth surface and were transparent and free of cracks. The reflectance spectra R of the G1 and G2 copolymer films were measured at normal light incidence in the spectral range 320–800 and are presented in Figure 6a. It can be observed that, although the same concentrations of solutions were used for both films, their spectra differ. This indicates that the optical constants and thicknesses of G1 and G2 are also different. To confirm this, the reflectance (R) spectra were used to calculate the refractive index (n), extinction coefficient (k), and film thickness (d) (Table 2). The dispersion curves of n are presented in Figure 6b, while the thickness values, along with the n and k values at a wavelength of 600 nm, are summarized in Table 2.
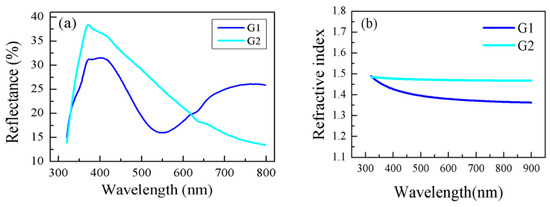
Figure 6.
Reflectance spectra (a) and dispersion curves of refractive index n (b) for G1 and G2 copolymers thin films.

Table 2.
Refractive index (n), extinction coefficient (k), thickness (d) at 5 and 95% RH, absolute and relative change in d, and absolute change in n of the studied copolymer samples G1 and G2 due to exposure from low to high relative humidity (RH).
As seen in Figure 6b, both thin films exhibit normal refractive index dispersion—n decreases with increasing wavelength—which indicates low light absorption in the films. The G2 film has a higher refractive index and lower thickness compared to the G1 film. Since the polymer chain density in G2 is lower, it is more likely that the chains undergo stronger compression during film deposition, resulting in a thinner coating. This increases the packing density and leads to a higher refractive index due to the higher film density. Conversely, the G1 film, with more densely distributed polymer chains, undergoes less compression, leading to a thicker coating. This lowers the packing density and results in a reduced refractive index. It is worth noting that the effective diameter of the polymer aggregates measured in solution is greater for G1 than for G2. This supports our assumption that G2 copolymers undergo stronger compression during film deposition, as smaller particles can be packed more densely.
3.3. Optical Humidity Sensing
The above-described experimental setup was utilized to test the coatings’ sensitivity to varying humidity levels by recording the spectra of the nanosized films at various relative humidity levels. Results for the lowest (RH = 5%) and the highest studied humidity (RH = 95%) levels are shown in Figure 7.
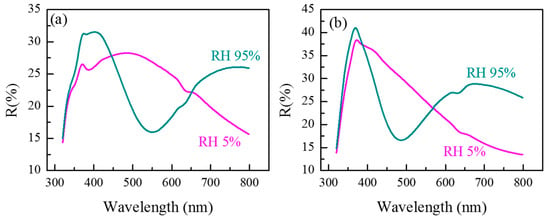
Figure 7.
Reflectance spectra R of the copolymer coatings G1 (a) and G2 (b) measured at humidity levels of 5% and 95% RH.
Each spectrum was used for the determination of refractive index and the thickness of the coatings at the corresponding humidity level, followed by calculation of the absolute change in refractive index and thickness (∆n and ∆d), respectively, and the relative change of the thickness (∆d/d5%). Results are shown in Figure 8 and Table 2.
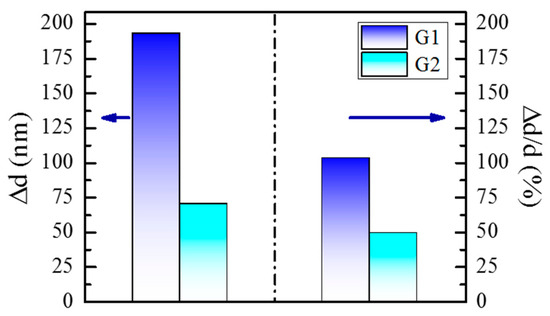
Figure 8.
Change of the thickness ∆d and relative change of the thickness ∆d/d5% of G1 and G2 copolymer coatings when exposed to humidity levels from 5% to 95%.
As can be seen from Figure 7a,b for both copolymer thin films, exposure to different humidity results in a significant change of the R spectra. Based only on the spectral shift and spectra shape change, both copolymers undergo changes in thickness and refractive index as a result of swelling and water absorption. Depending on the amount of adsorbed water from the atmosphere, the response of the two thin films is different. Thin copolymer films change their thickness due to swelling which is mostly pronounced for the copolymer films G1 with a higher grafting density. This can be explained by the fact that as grafting density decreases, brush height may not increase proportionally to polymer length. This result is not surprising as similar findings were shown, for example, by Kang, M., et al. [39]. The authors demonstrated the impact of grafting density on the studied polymer-grafted samples, which is crucial in order to determine particle assembly patterns and behavior. The authors compared variations in the brush height with the number of repeat units for each sample and showed that as the cat-CTA ratio decreases, the brush height increases as a function of polymer chain length, gradually diminishing. As the grafting density decreases, the brush height may not increase proportionally to the polymer length. This means in our case that when densely packed, the grafted chains “support” each other, remain “upright”, and form a thicker layer (G1). When sparsely packed, they “lay down” and, although they may be longer, form a thinner layer (G2).
A relative change in percentage was assessed in relation to the initial film thickness at a humidity level of 5% RH in order to compare the films’ sensing abilities as they differ in thickness. Figure 8 shows the change of the thickness, ∆d, and the relative change of the thickness ∆d/d5% of G1 (dark blue bars) and G2 (turquoise bars) copolymer coatings when exposed to humidity levels from 5% to 95%. It can be seen that the relative change of the thickness of sample G1 is 103% compared to 49% for sample G2. That is, when copolymer G1 is applied in the form of a thin coating, the maximum swelling of the layer results in a little more than 100% increase of d, i.e., the layer doubles its thickness. The relative change in thickness caused by an increase in humidity from the lowest to the highest is nearly 50%, meaning that the change in thickness of sample G2 is precisely half as small. The different behavior, i.e., relative change of d of the layers is due precisely to the difference in the length and density of the brushes of the copolymers, as we demonstrated above.
Likewise, the stronger response of G1 is in line with our previous results for thin films of copolymers based on PVA with different grafting density of methyl (meth)acrylate [34], where we showed that thin films exhibit a swelling mostly pronounced in the films with a higher grafting density.
Additionally, the R-vs.-RH curves in adsorption/desorption regimes are presented in Figure 9. The measurements that show the change in reflectance, depending on the humidity level, revealed that the end of the desorption curve coincides with the beginning of the adsorption curve, which means that the thickness change in the copolymer coatings is reversible. Additional annealing for their recovery is not necessary. However, both samples exhibit hysteresis, which is smaller for G1 (13%) compared to G2 (21%).
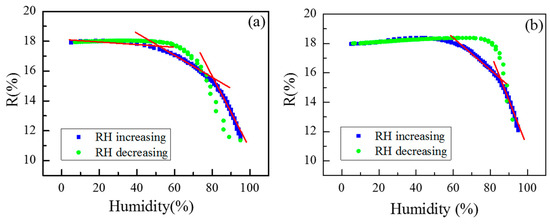
Figure 9.
Reflectance versus relative humidity level of G1 and G2 copolymer coatings when exposed to humidity increasing from 5% to 95% (blue squares) (a) and vice versa—from 95% to 5% RH (green dots). Linear regions are marked with red lines (b).
Figure 9 demonstrates that the G1 sample is suitable for the optical sensing of the relative humidity across the entire humidity range. The R-vs.-RH curve for G1 reveals three linear regions with different slopes, indicating that RH can be measured with varying accuracy depending on the range. In contrast, the G2 film has a narrower dynamic range and is only suitable for humidity sensing at RH levels above 65%. For both polymers, the sensitivity and resolution were calculated, and the values for different RH ranges are shown in Table 3. Although the G2 sample exhibits slightly higher sensitivity than G1, the latter is preferable for optical humidity sensing due to its smaller hysteresis and full dynamic range. Nevertheless, if the application requires measuring very high humidity levels within a narrow range, G2 may be suitable, as it offers very high sensitivity—capable of resolving changes of less than 1% RH.

Table 3.
Percentage of hysteresis (H), dynamic range, sensitivity (S), and accuracy for studied samples G1 and G2.
For each of the chosen humidity levels for both samples, color CIE coordinates were calculated from the measured reflectance spectra (Figure 10), thus giving us a visual idea of the color change of the sample as it passes through the different parts of the investigated humidity range. The color difference should ideally be noticeable to the naked eye without the need for a spectrophotometer to measure the spectrum. With the simplest possible reading by observation alone, this would enable a variety of uses for the developed copolymers in optical color sensors based solely on the colorimetry concept.
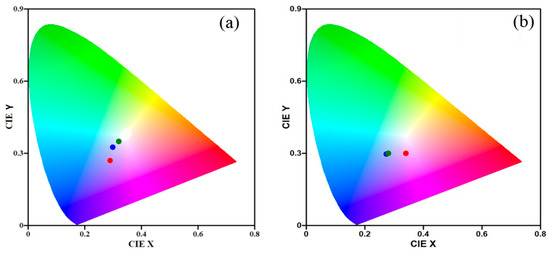
Figure 10.
Calculated color coordinates of thin film samples of G1 (a) and G2 (b) when exposed to a different relative humidity—5% (blue dot), 50% (green dot), and 95% (red dot).
From the change in the color coordinates, it can be seen that for sample G1 the points corresponding to different humidity exhibit different colors. Although the distance between those at humidity levels 5% and 50% RH is small, i.e., the difference in color is not high, it is still distinguishable, and the points do not coincide. At high humidity of 95% RH the color is significantly changed, and the point is at a great distance from the other two. When the thin film of copolymer G2 is positioned at high humidity level 95% RH, it can be seen that the color of the sample is significantly different from the color that the coating has at humidity of 5% and 50% RH. However, in this case, the two coordinates nearly coincide at these two lower humidity levels, meaning that the samples’ colors are nearly identical and thus the primary objective of differentiating them with the naked eye is impossible.
3.4. Acoustic Measurements and Characterization
Figure 11a,b display the frequency data for water vapor sorption/desorption processes for both being deposited on the quartz resonator surface G1 and G2 polymer films, respectively. As already mentioned, the frequency is plotted as the difference between the measured frequency and the frequency of the bare resonator divided by the order of the overtone, thus the different overtones can be compared. We see that changes in RH cause a reversible shift in the measured frequency. Additionally, we can see that the four measured harmonics are close to one another.
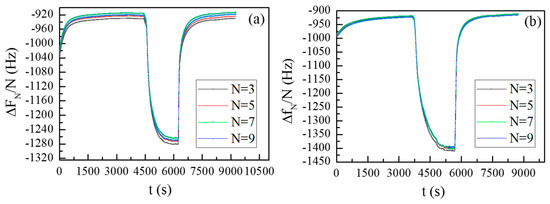
Figure 11.
Frequency changes vs time for different overtones during sorption/desorption processes for G1 (a) and G2 (b) coatings.
This behavior is characteristic of a sample close to the Sauerbrey regime and suggests that the coatings are slightly viscoelastic [19]. In order to evaluate the mass, we used the model for a single viscoelastic film in air [17,19,38]:
where mq is the areal mass density of quartz (kg m−2), and Zf is the acoustic impedance of the film (kg m−2s−1).
We selected this model because in the simplest case, where there are no differences between the normalized frequency shifts of the overtones, this model simplifies to the Sauerbrey model, and if differences arise in more complex viscoelastic cases, (7) gives better accuracy for the mass calculation [16,19]. To assess the water content stored in the polymer matrix, humidity measurements were performed on a bare silica resonator surface following the same experimental procedure as with the polymer coated resonator. Consequently, the resulting water content at RH = 95% accumulated in the polymer with the more closely grafted brushes—G1 was estimated as 23.9%. Conversely, the more loosely grafted but longer PDMA brushes in the case of G2 led to a higher water content of 30.9% stored in the polymer matrix.
The higher absorption capacity of the G2 films can be attributed to their greater density, which implies a higher number of polymer chains per unit volume. This leads to an increased number of active absorption sites. However, the same high density also restricts the film’s ability to swell significantly, resulting in smaller changes in thickness compared to G1 films when exposed to high relative humidity. Thus, the QCM technique was able to detect the impact of the brush architecture on the polymers’ moisture sensing capabilities.
4. Conclusions
Double hydrophilic brush copolymers comprising a relatively short PVA backbone and grafted PDMA chains were successfully synthesized. The possibility, by varying the length and density of the brushes, to control the desired sensing properties of nanosized copolymer coatings when exposed to different humidity levels was proved optically and gravimetrically. Although the G2 sample exhibited slightly higher sensitivity and water content than G1, the latter is preferable for optical humidity sensing due to its smaller hysteresis and full dynamic range.
A possible implementation as a colorimetric humidity sensor that detects changes in the environment based only on a change in color was demonstrated and discussed, and the copolymer with higher grafting density and shorter PDMA graft chains (G1) was shown to be more suitable.
Further efforts will be dedicated to adapt the experimental setup to monitor the sorption/desorption isotherms, assess the stored water content, the humidity induced rheological changes, and the kinetic parameters at various humidity levels.
By means of the presented multimethodological approach, we studied the impact of macromolecular design and proved the efficiency of the grafting method for achieving advanced polymer coatings together with the potential of the newly synthesized poly(vinyl alcohol) derivatives for humidity sensing applications.
Author Contributions
Conceptualization, K.L., T.B. and D.C.; methodology, T.B., D.C., G.A. and K.L.; software, T.B. and K.L.; validation, K.L., G.A., T.B. and D.C.; formal analysis, S.B., M.D., K.P., G.A. and K.L.; investigation, M.D., K.P., S.B., G.A., K.L. and D.C.; resources, K.L., G.A., D.C. and T.B.; data curation, K.L., D.C. and T.B.; writing—original draft preparation, K.L., T.B., G.A. and D.C.; writing—review and editing, K.L., G.A. and T.B.; visualization, K.L., G.A. and D.C.; supervision, K.L. and T.B.; project administration, K.L., T.B. and D.C.; All authors have read and agreed to the published version of the manuscript.
Funding
The authors acknowledge the financial support from the Bulgarian National Science Fund under the Grant No. KP-06-COST/4 under COST Action CA21121 “European Network for the Mechanics of Matter at the Nano-Scale” (MecaNano).
Institutional Review Board Statement
Not applicable.
Informed Consent Statement
Not applicable.
Data Availability Statement
Data are contained within the article.
Acknowledgments
Research equipment of Distributed Research Infrastructure INFRAMAT, part of Bulgarian National Roadmap for Research Infrastructures, supported by Bulgarian Ministry of Education and Science, was used in this investigation. T.B. acknowledges the European Regional Development Fund under the Research Innovation and Digitization for Smart Transformation program 2021–2027 under the Project BG16RFPR002-1.014-0006 National Centre of Excellence Mechatronics and Clean Technologies.
Conflicts of Interest
The authors declare no conflicts of interest. The funders had no role in the design of the study; in the collection, analyses, or interpretation of data; in the writing of the manuscript, or in the decision to publish the results.
References
- Farahani, H.; Wagiran, R.; Hamidon, M.N. Humidity Sensors Principle, Mechanism, and Fabrication Technologies: A Comprehensive Review. Sensors 2014, 14, 7881–7939. [Google Scholar] [CrossRef] [PubMed]
- Ku, C.-A.; Chung, C.-K. Advances in Humidity Nanosensors and Their Application: Review. Sensors 2023, 23, 2328. [Google Scholar] [CrossRef] [PubMed]
- Yu, X.; Ding, X.; Yu, X.; Tang, K.; Chen, Q. A capacitive humidity sensor based on nanodiamond/silver nanoparticles (ND/Ag) nanocomposite with high stability and rapid response for respiratory monitoring. Sens. Actuators: B. Chem. 2024, 416, 136035. [Google Scholar] [CrossRef]
- Jiang, Y.; Wu, L.; Chen, Q.; Li, N.; Tian, J. High-performance capacitive humidity sensor based on flower-like SnS2/Ti3C2 MXene for respiration monitoring and non-contact sensing. Sens. Actuators B Chem. 2025, 426, 137012. [Google Scholar] [CrossRef]
- Najeeb, M.A.; Ahmad, Z.; Shakoor, R.A. Organic Thin-Film Capacitive and Resistive Humidity Sensors: A Focus Review. Adv. Mater. Interfaces 2018, 5, 1800969. [Google Scholar] [CrossRef]
- Su, P.-G.; Wang, C.-S. Novel flexible resistive-type humidity sensor. Sens. Actuators B Chem. 2007, 123, 1071–1076. [Google Scholar] [CrossRef]
- Cho, S.; Lim, S.H.; Oh, J.; Ju, T.; Yang, S.; Kim, H.H.; Kim, Y. Synthesis-in-place of V2O5 nanobelts for wide range humidity detection. Sens. Actuators B. Chem. 2025, 423, 136711. [Google Scholar] [CrossRef]
- Rao, X.; Zhao, L.; Xu, L.; Wang, Y.; Liu, K.; Wang, Y.; Chen, G.Y.; Liu, T.; Wang, Y. Review of Optical Humidity Sensors. Sensors 2021, 21, 8049. [Google Scholar] [CrossRef]
- Novais, S.; Ferreira, M.S.; Pinto, J.L. Relative Humidity Fiber Sensor Based on Multimode Interferometer Coated with Agarose-Gel. Coatings 2018, 8, 453. [Google Scholar] [CrossRef]
- Peng, J.; Zhou, J.; Sun, C.; Liu, Q. Optical Fiber Temperature and Humidity Dual Parameter Sensing Based on Fiber Bragg Gratings and Porous Film. Sensors 2023, 23, 7587. [Google Scholar] [CrossRef]
- Lazarova, K.; Bozhilova, S.; Novakov, C.; Christova, D.; Babeva, T. Amphiphilic Poly(vinyl Alcohol) Copolymers Designed for Optical Sensor Applications—Synthesis and Properties. Coatings 2020, 10, 460. [Google Scholar] [CrossRef]
- Wang, L.; Song, J.; Yu, C. The utilization and advancement of quartz crystal Microbalance (QCM): A mini review. Microchem. J. 2024, 199, 109967. [Google Scholar] [CrossRef]
- Fauzi, F.; Rianjanu, A.; Santoso, I.; Triyana, K. Gas and humidity sensing with quartz crystal microbalance (QCM) coated with graphene-based materialsA mini review. Sens. Actuators A 2021, 330, 112837. [Google Scholar] [CrossRef]
- Yao, Y.; Xue, Y. Impedance analysis of quartz crystal microbalance humidity sensors based on nanodiamond/graphene oxide nanocomposite film. Sens. Actuators B 2015, 211, 52–58. [Google Scholar] [CrossRef]
- King, W.H. Piezoelectric Sorption Detector. Anal. Chem. 1964, 36, 1735–1739. [Google Scholar] [CrossRef]
- Gonzalez-Martinez, J.F.; Znamenskaya Falk, Y.; Björklund, S.; Erkselius, S.; Rehnberg, N.; Sotres, J. Humidity-Induced Phase Transitions of Surfactants Embedded in Latex Coatings Can Drastically Alter Their Water Barrier and Mechanical Properties. Polymers 2018, 10, 284. [Google Scholar] [CrossRef]
- Znamenskaya, Y.; Sotres, J.; Gavryushov, S.; Engblom, J.; Arnebrant, T.; Kocherbitov, V. Water Sorption and Glass Transition of Pig Gastric Mucin Studied by QCM-D. J. Phys. Chem. B 2013, 117, 2554–2563. [Google Scholar] [CrossRef]
- Kelly, S.J.; Genevskiy, V.; Björklund, S.; Gonzalez-Martinez, J.F.; Poeschke, L.; Schröder, M.; Nilius, G.; Tatkov, S.; Kocherbitov, V. Water Sorption and Structural Properties of Human Airway Mucus in Health and Muco-Obstructive Diseases. Biomacromolecules 2024, 25, 1578–1591. [Google Scholar] [CrossRef]
- Macklin, J.; Pfrang, C.; Wady, P.; Liu, W.; Davidson, R.; Milsom, A.; Squires, A. Use of Humidity Controlled Quartz Crystal Microbalance with Simultaneous Grazing Incidence Small Angle X-ray Scattering to Investigate the Self-assembly and Energetics of Lipid Thin Films. Langmuir 2025, 41, 10216–10222. [Google Scholar] [CrossRef]
- Ma, H.; Fang, H.; Wu, W.; Zheng, C.; Wu, L.; Wang, H. A highly transparent humidity sensor with fast response speed based on α-MoO3 thin films. RSC Adv. 2020, 10, 25467–25474. [Google Scholar] [CrossRef]
- Xie, T.; Rahman, A.F.A.; Bakar, A.A.; Arsad, A. Design and Optimization of Metal Oxide-Based Humidity Sensors: A Review on Mechanisms and Material Engineering. J. Clust. Sci. 2025, 36, 148. [Google Scholar] [CrossRef]
- Altammar, K.A. A review on nanoparticles: Characteristics, synthesis, applications, and challenges. Front. Microbiol. 2023, 14, 1155622. [Google Scholar] [CrossRef]
- Gao, Y.-J.; Romolini, G.; Huang, H.; Jin, H.; Saha, R.A.; Ghosh, B.; De Ras, M.; Wang, C.; Steele, J.A.; Debroye, E.; et al. Ultrasensitive turn-on luminescence humidity sensor based on a perovskite/zeolite composite. J. Mater. Chem. C 2022, 10, 12191–12196. [Google Scholar] [CrossRef]
- Stosic, D.; Zholobenko, V. Application of Zeolite-Based Materials for Chemical Sensing of VOCs. Sensors 2025, 25, 1634. [Google Scholar] [CrossRef]
- Nandanapalli, K.R.; Kailasa, S.K.; Lee, S. Graphene oxide-based humidity sensors. Compr. Anal. Chem. 2024, 106, 339–371. [Google Scholar] [CrossRef]
- Laera, A.M.; Cassano, G.; Burresi, E.; Protopapa, M.L.; Penza, M.A. Graphene Oxide Flexible Sensor for Humidity Detection. Eng. Proc. 2023, 48, 44. [Google Scholar] [CrossRef]
- Qian, J.; Tan, R.; Feng, M.; Shen, W.; Lv, D.; Song, W. Humidity Sensing Using Polymers: A Critical Review of Current Technologies and Emerging Trends. Chemosensors 2024, 12, 230. [Google Scholar] [CrossRef]
- Pasalwad, K.A.; Baby, N.; Edjenguele, A.; Sadhasivam, S.; Palanisamy, G.; Magdum, S.; Thangarasu, S.; Oh, T.H. Progress on polymer-based materials and composites for humidity sensor applications: From materials aspects to sensor performances. J. Mater. Chem. A, 2025; advance article. [Google Scholar] [CrossRef]
- Jakubik, W.; Wrotniak, J.; Caliendo, C.; Benetti, M.; Cannata, D.; Notargiacomo, A.; Stolarczyk, A.; Kaźmierczak-Bałata, A. SAW Humidity Sensing with rr-P3HT Polymer Films. Sensors 2024, 24, 3651. [Google Scholar] [CrossRef]
- Guo, Y.; Xi, H.; Gu, Z.; Li, M.; Li, X.; Gao, D. A self-powered PVA-based flexible humidity sensor with humidity-related voltage output for multifunctional applications. Colloids Surf. A Physicochem. Eng. Asp. 2023, 658, 130700. [Google Scholar] [CrossRef]
- Zhang, K.; Lu, S.; Qu, Z.; Feng, X. Tuning the Sensitivity and Dynamic Range of Optical Oxygen Sensing Films by Blending Various Polymer Matrices. Biosensors 2022, 12, 5. [Google Scholar] [CrossRef] [PubMed]
- Oliveira, G.P.; Barboza, B.H.; Batagin-Neto, A. Polyaniline-based gas sensors: DFT study on the effect of side groups. Comput. Theor. Chem. 2022, 1207, 113526. [Google Scholar] [CrossRef]
- Lazarova, K.; Vasileva, M.; Ivanova, S.; Novakov, C.; Christova, D.; Babeva, T. Influence of macromolecular architecture on the optical and humidity sensing properties of poly(N,N-dimethylacrylamide)-based block copolymers. Polymers 2018, 10, 769. [Google Scholar] [CrossRef] [PubMed]
- Bozhilova, S.; Lazarova, K.; Ivanova, S.; Karashanova, D.; Babeva, T.; Christova, D. Colloidal aqueous dispersions of methyl (meth)acrylate-grafted polyvinyl alcohol designed for thin film applications. Coatings 2022, 12, 1882. [Google Scholar] [CrossRef]
- Lazarova, K.; Vasileva, M.; Marinov, G.; Babeva, T. Optical characterization of sol-gel derived Nb2O5 thin films. Opt. Laser Technol. 2014, 58, 114–118. [Google Scholar] [CrossRef]
- Lazarova, K.; Awala, H.; Thomas, S.; Vasileva, M.; Mintova, S.; Babeva, T. Vapor Responsive One-Dimensional Photonic Crystals from Zeolite Nanoparticles and Metal Oxide Films for Optical Sensing. Sensors 2014, 14, 12207–12218. [Google Scholar] [CrossRef]
- Sauerbrey, G. Verwendung von Schwingquarzen zur Wägung dünner Schichten und zur Mikrowägung. Z. Phys. 1959, 155, 206–222. [Google Scholar] [CrossRef]
- Johannsmann, D. Viscoelastic analysis of organic thin films on quartz resonators. Macromol. Chem. Phys. 1999, 200, 501–516. [Google Scholar] [CrossRef]
- Kang, M.; Lin, P.A.; Bunch, J.A.; Lipomi, D.J.; Arya, G.; Cohen, S.M. Impact of Grafting Density on the Assembly and Mechanical Properties of Self-Assembled Metal–Organic Framework Monolayers. J. Am. Chem. Soc. 2025, 147, 6966–6973. [Google Scholar] [CrossRef]
Disclaimer/Publisher’s Note: The statements, opinions and data contained in all publications are solely those of the individual author(s) and contributor(s) and not of MDPI and/or the editor(s). MDPI and/or the editor(s) disclaim responsibility for any injury to people or property resulting from any ideas, methods, instructions or products referred to in the content. |
© 2025 by the authors. Licensee MDPI, Basel, Switzerland. This article is an open access article distributed under the terms and conditions of the Creative Commons Attribution (CC BY) license (https://creativecommons.org/licenses/by/4.0/).