Article

Photocatalytic Performance of 3D-Printed Triply Periodic Minimal Surface Photocatalytic Reactors

1
School of Materials Science and Engineering, North China University of Water Resources and Electric Power, Zhengzhou 450045, China
2
Yellow River Co., Ltd., High-Tech Development Zone, No. 59 Lianhua Street, Zhengzhou 450001, China
*
Author to whom correspondence should be addressed.
Coatings 2025, 15(8), 953; https://doi.org/10.3390/coatings15080953 (registering DOI)
Submission received: 20 July 2025 / Revised: 10 August 2025 / Accepted: 11 August 2025 / Published: 14 August 2025
(This article belongs to the Section Surface Characterization, Deposition and Modification)

Abstract

To overcome poor catalyst recovery and inefficient mass transfer in photocatalytic water treatment, this study presents novel Triply Periodic Minimal Surface (TPMS) photocatalytic reactors (PCRs) fabricated via Stereolithography (SLA) 3D printing. Five TiO2-loaded reactors (Fischer-Radin-Dunn (FRD), Neovius (N), Diamond (D), I-graph Wrapped Package (IWP), Gyroid (G)) with hierarchical porosity were designed. Using methylene blue (MB) as the target pollutant, the photocatalytic degradation performance of TPMS-PCRs is evaluated and Computational Fluid Dynamics (CFD) hydrodynamic simulations are conducted to analyze their flow characteristics under both horizontal and rotational flow fields. The catalytic efficiency of TPMS reactors is influenced not only by pore characteristics, specific surface area, and inter-pore connectivity, but also by the flow velocities on both the reactor surface and within its internal channels. The FRD-type TPMS-PCR loaded with 2.5 wt% TiO2 exhibited optimal photocatalytic performance, achieving 95.36% degradation efficiency under rotational flow within 2.5 h, compared to 88.2% under horizontal flow. Remarkably, after five degradation cycles, its efficiency further improved to 96.7%, demonstrating its excellent stability. The rotational flow field enhanced the average flow velocity by approximately sixfold compared to horizontal flow, with the D-type reactor reaching a maximum surface velocity of 5.3 × 10⁻² m/s.

Graphical Abstract

1. Introduction

A photocatalytic reactor is an integrated reaction device designed based on photocatalytic principles, primarily composed of three core components: an efficient semiconductor photocatalyst (e.g., TiO2, g-C3N4), a light source system, and a reaction interface control unit. Under irradiation by light of specific wavelengths, the catalyst surface generates photoinduced electron-hole pairs, which migrate to the interface and drive redox chain reactions with adsorbed substances. This enables pollutant degradation, energy molecule conversion (e.g., CO2 reduction, organic pollutant oxidation), and organic synthesis processes [1,2,3,4].
Traditional photocatalytic reactors, such as suspended, fixed-bed, and thin-film systems, face significant limitations. For instance, suspended reactors suffer from catalyst recovery difficulties and membrane fouling [5], while fixed-bed reactors exhibit low mass transfer efficiency and catalyst surface passivation [6]. Recent advancements in reactor design, including annular and microstructured fiber reactors, have improved light distribution and fluid dynamics but often involve complex manufacturing processes or high energy consumption [7,8,9,10,11,12,13,14]. (Table 1)
Additive Manufacturing was evaluated as a promising technology for constructing photocatalytic reactors due to its inherent ability to produce complex geometries with high precision and customization. Barbosa et al. [15] investigated the photocatalytic performance of a cylindrical batch reactor containing TiO2 using stereolithography (SLA) 3D printing technology. Grandcolas et al. [16] employed the photocatalytic activity of 3D-printed polyamide structures coated with TiO2 nanoparticles. The best photocatalytic structure showed a 94.1% methylene blue degradation, after 180 min under UV irradiation with 360-degree rotation. Two 3D-printed PLA/TiO2 sinusoidal reactors (baffled/unbaffled) were studied by Zhou et al. [17], which demonstrated stable photocatalytic degradation of MB/PhOH, with baffles enhancing flow-rate resilience.
Triply Periodic Minimal Surfaces (TPMS) offer a unique solution for photocatalytic reactor design due to their high surface-to-volume ratios, tunable porosity, and interconnected pore networks [18]. These features address the limitations of conventional reactors by improving fluid permeability and light penetration while maintaining structural integrity. In this study, we leverage SLA 3D printing to fabricate TPMS-based photocatalytic reactors (TPMS-PCRs) and evaluate their performance under horizontal and rotational flow fields (Figure 1).

2. Materials and Methods

2.1. Materials

The P25 TiO2 nanoparticles were commercially obtained from Shanghai Macklin Biochemical Technology Co., Ltd., Shanghai, China. The transparent photopolymer resin (standard grade) was purchased from Anycubic (Zongwei Cubic Technology Co., Ltd., Shenzhen, China), with a curing wavelength of 405 nm and density of 1.13 g/cm3. After optimizing TiO2 loading (1–2.5 wt%), composites with 2.5 wt% TiO2 nanoparticles were selected for photocatalytic testing, as they exhibited the highest degradation efficiency (see Appendix B.2, Figure A1). The mixture was homogenized under dark conditions at 30 °C in a constant-temperature water bath with 60 min of agitation to ensure uniform dispersion of the nanoparticles.
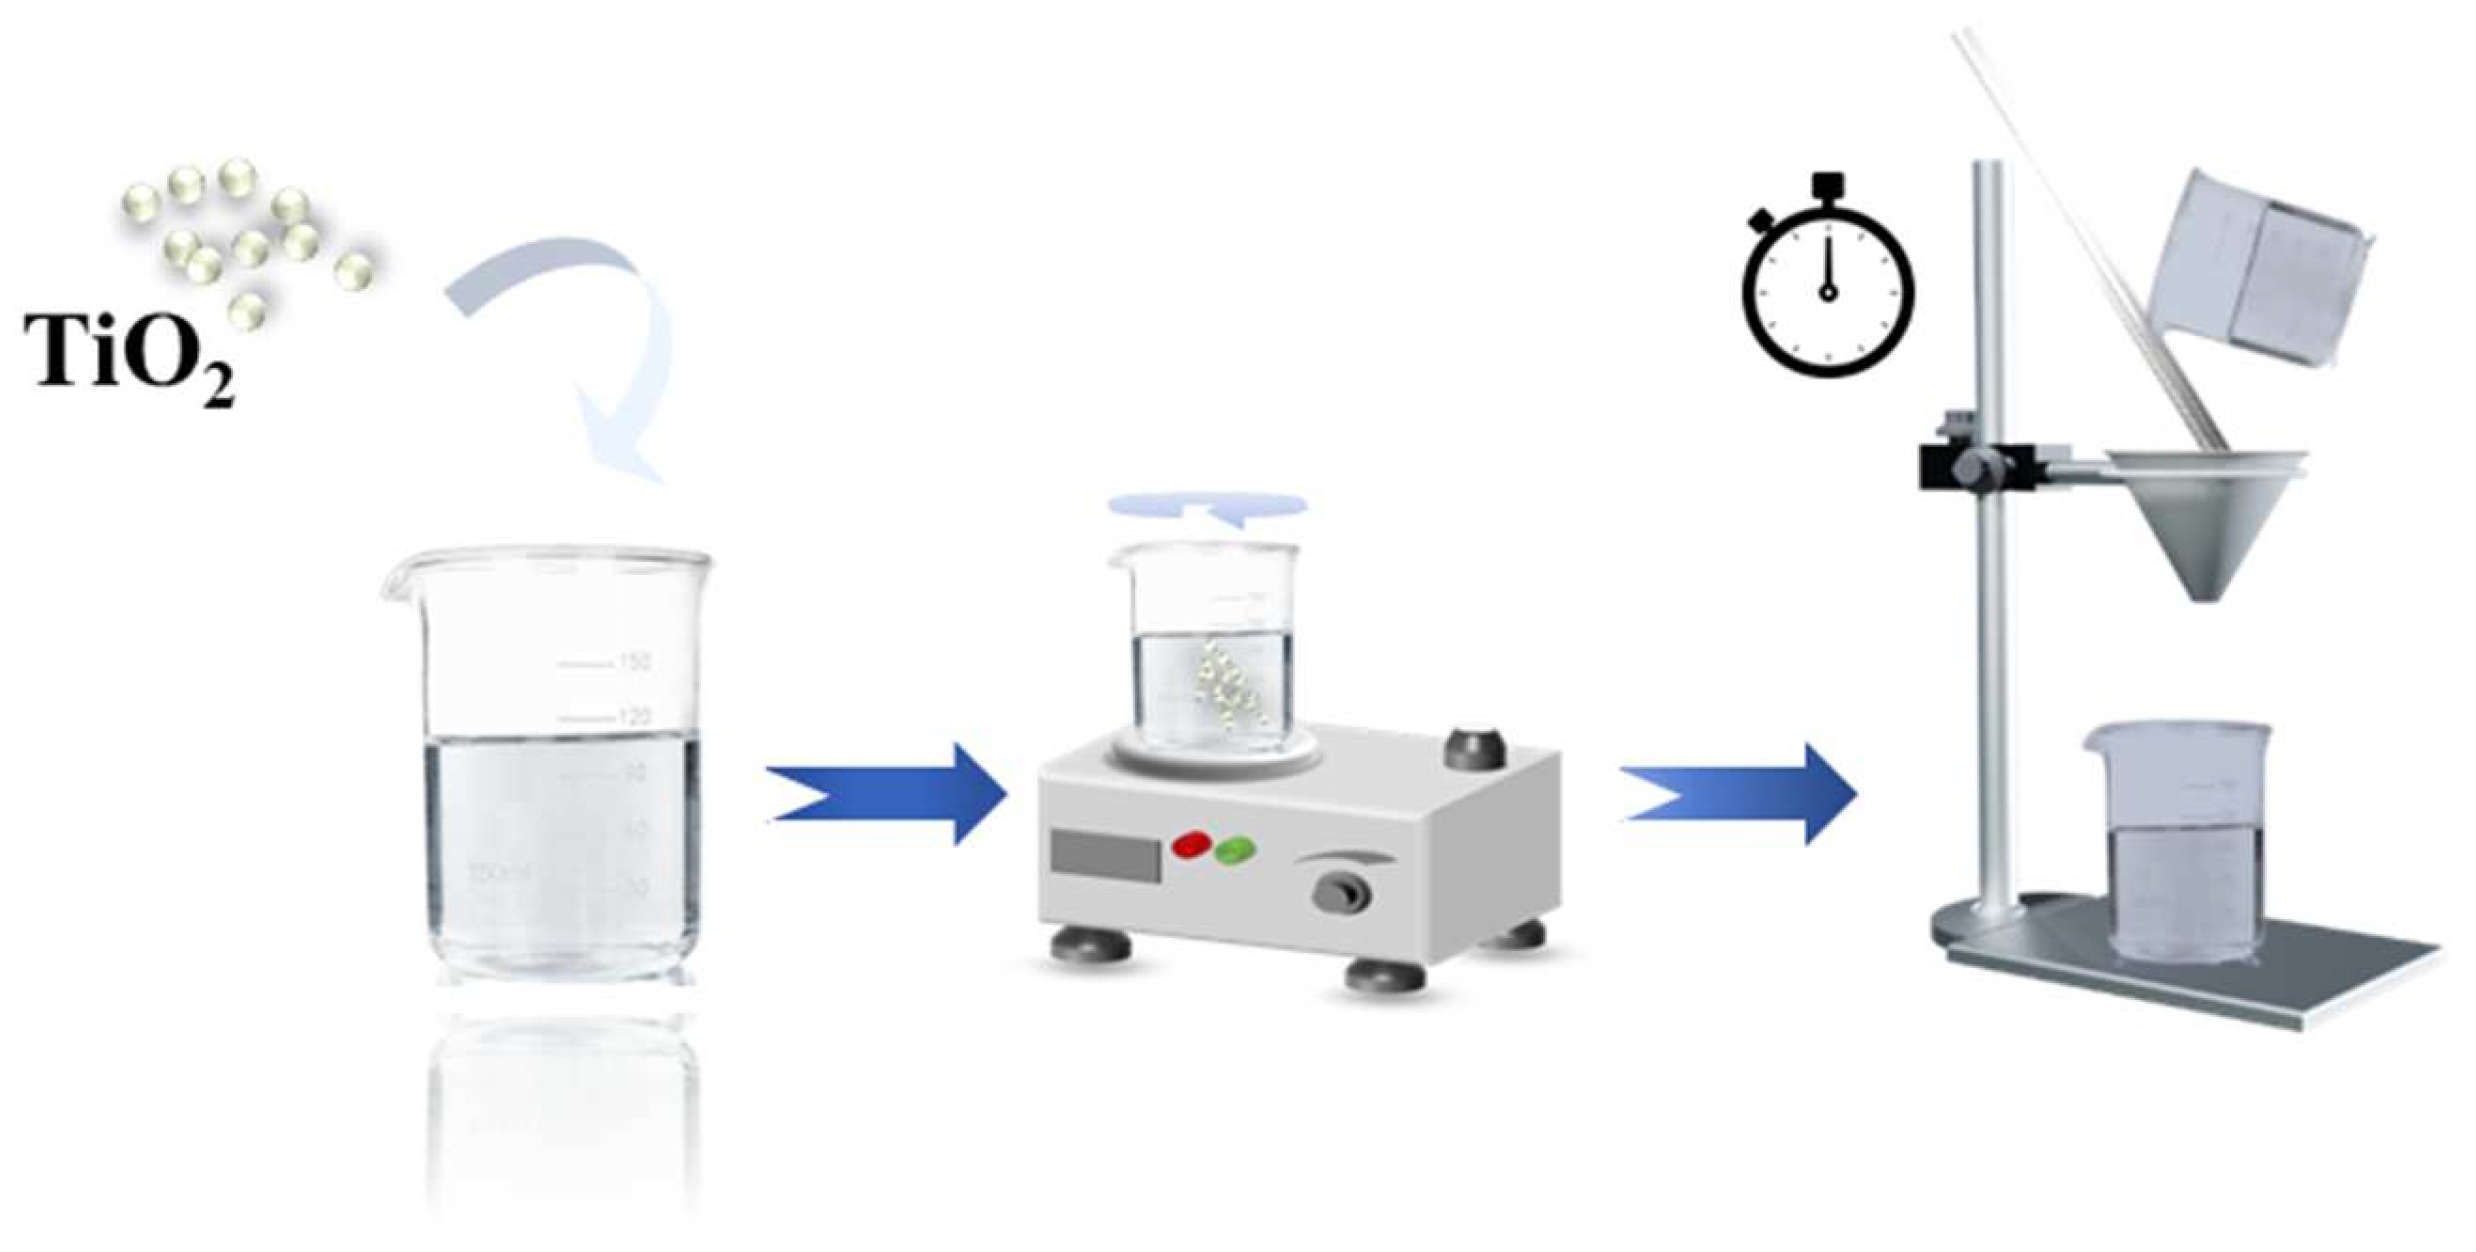
The viscosity of the modified resin was measured according according to Chinese National Standard GB/T 1723 [19]. The test procedure involved the following: (1) completely filling the viscosity cup with the resin; (2) initiating timing when the resin began to flow from the cup; (3) stopping timing when the continuous resin stream broke (Figure 2). This method provided precise viscosity measurements under controlled conditions.
The kinematic viscosity was calculated using Equations (1) and (2):
μ = A × t − B
ν = μ/ρ
where A and B are instrument constants dependent on the viscometer dimensions (A = 1.195 and B = 1.95 for the Tu-4 cup viscometer used in this study), t is the efflux time (s), μ is the dynamic viscosity (mPa·s), ν is the kinematic viscosity (cm2/s), and ρ is the liquid density (g/cm3).
The measured kinematic viscosities were 230 mPa·s for the pure photopolymer resin and 231.45 cm2/s for the 2.5 wt% TiO2/resin composite, both meeting the viscosity requirements for SLA printing.

2.2. Experimental Methods

2.2.1. Fabrication of Triply Periodic Minimal Surface Models

The triply periodic minimal surface (TPMS) models were constructed using Blender software version 4.4. Table 2 lists the mathematical functions for five TPMS types: FRD, N, D, G, and IWP.
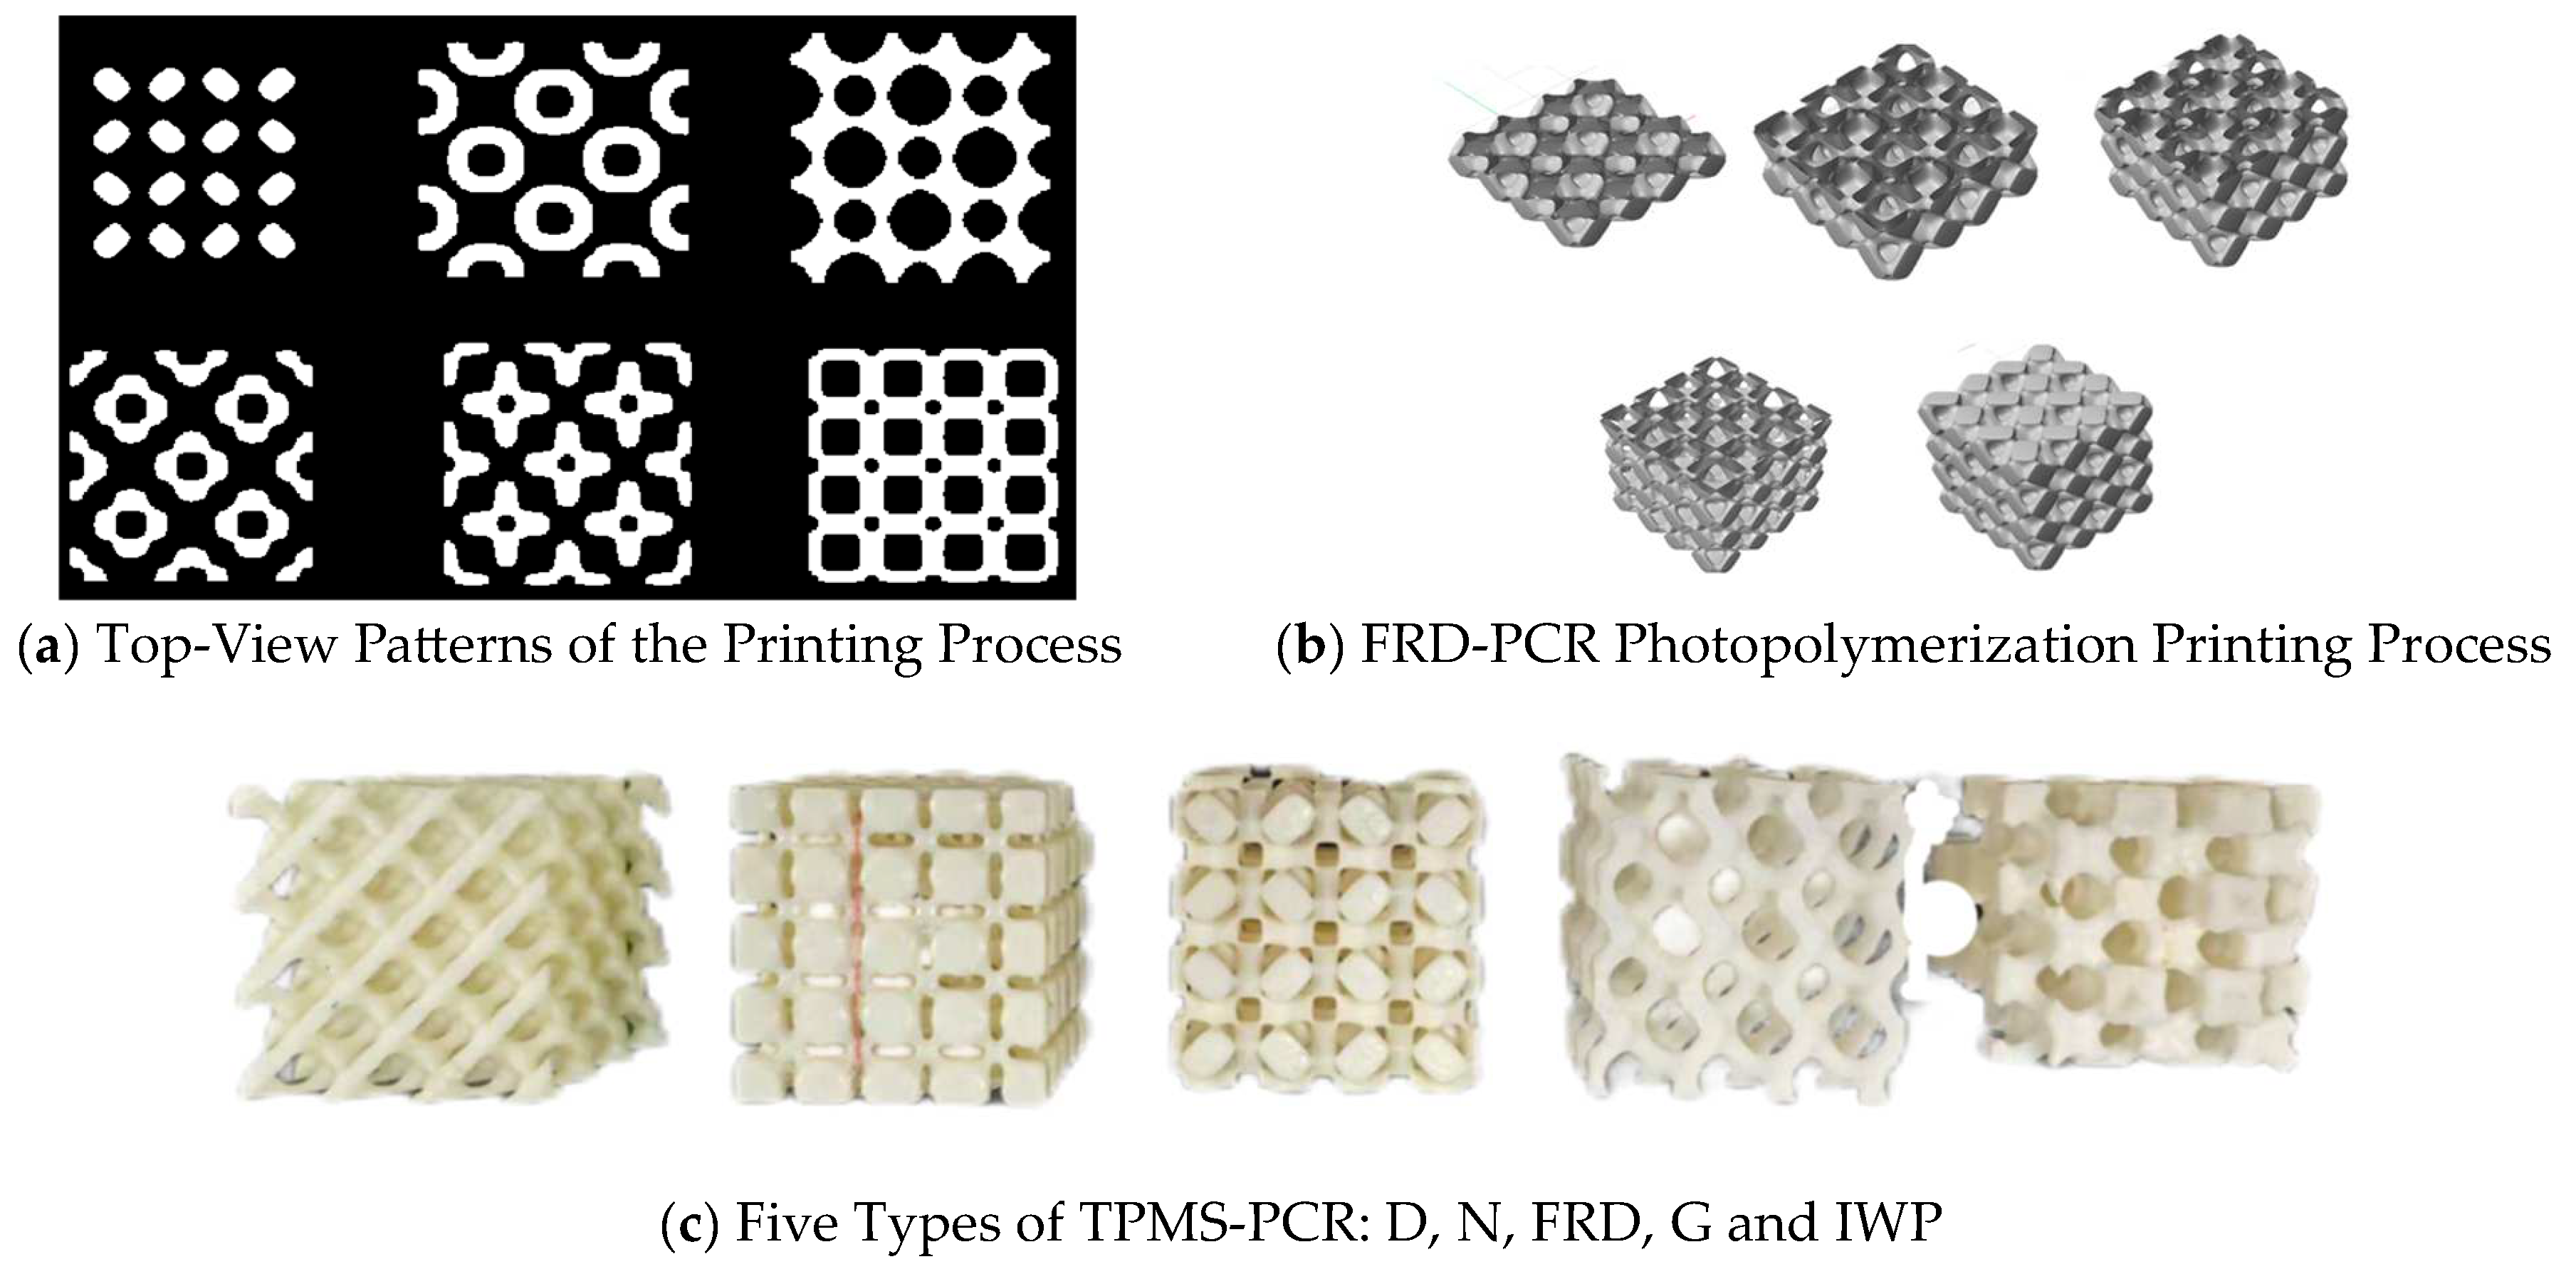
The models were printed using the following slicing parameters: layer thickness of 0.05 mm, bottom layer count of 8, and exposure time ranging from 30 to 60 s. Figure 3 illustrates the printing process and the final printed samples. The slicing parameter configurations employed in the 3D printing process are comprehensively detailed in Table 3.
Table 4 summarizes the main structural parameters of the TPMS models.

2.2.2. Photocatalytic Performance Evaluation Under Controlled Flow Conditions

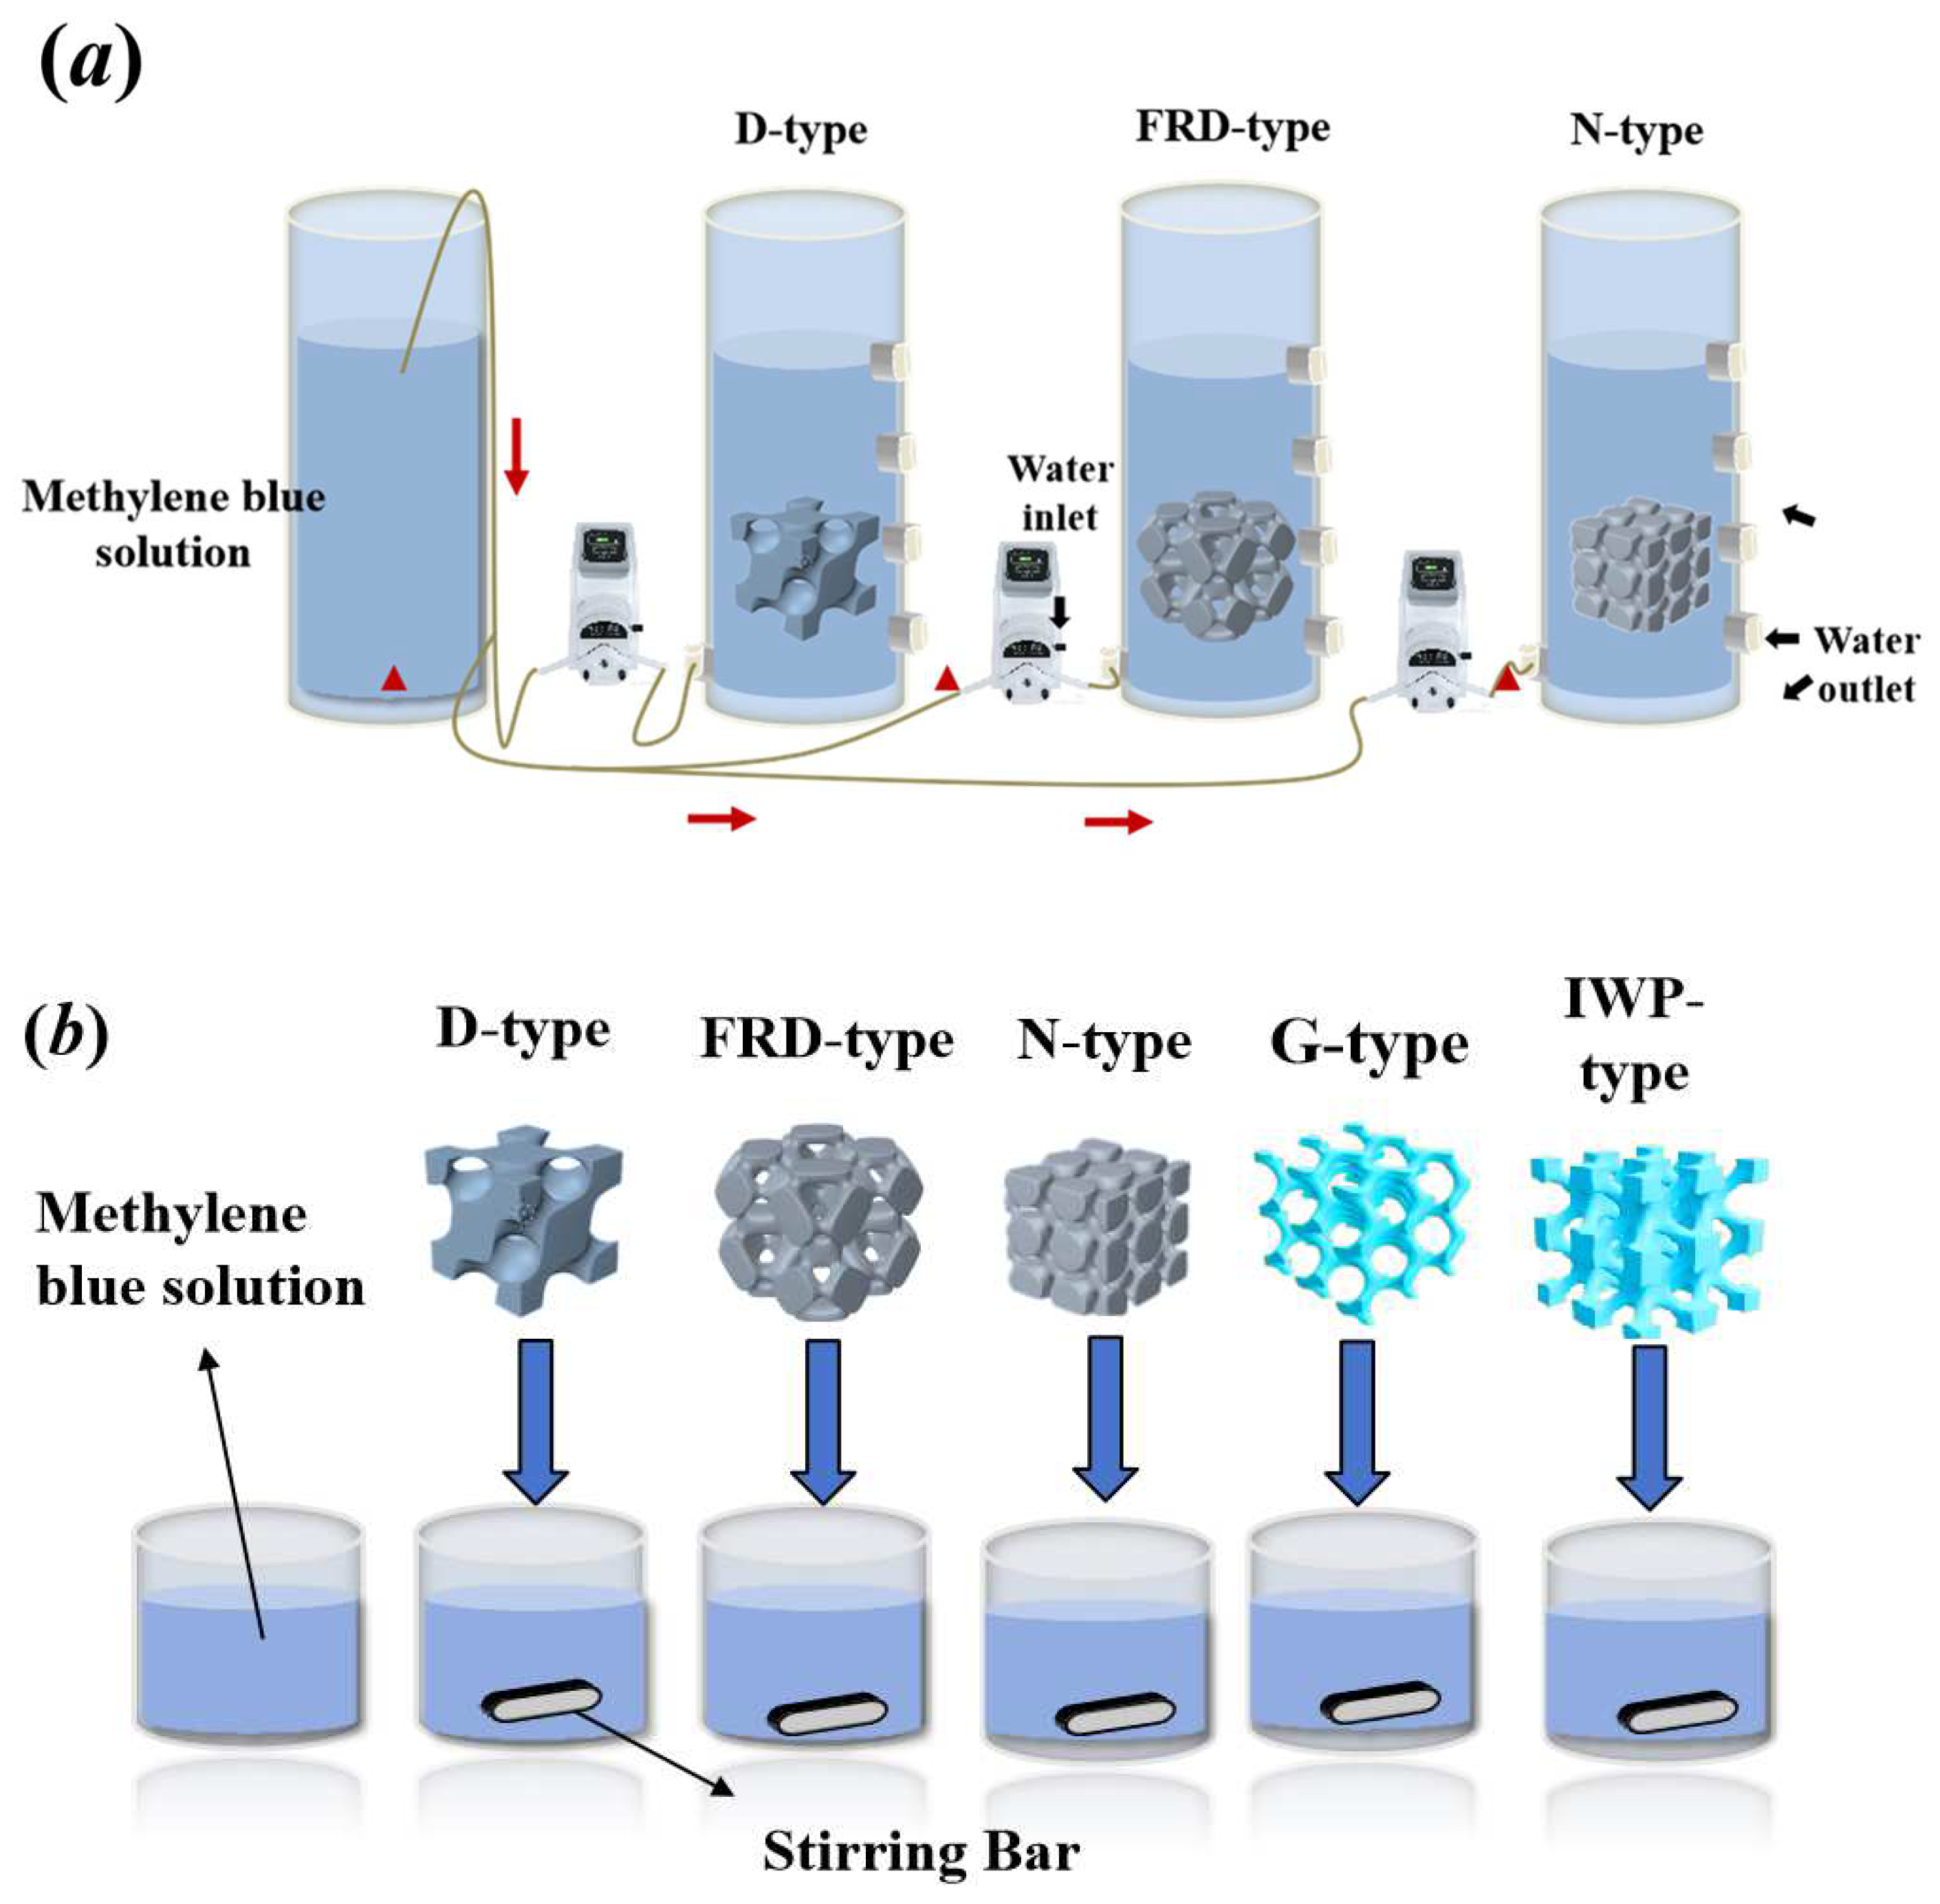
The photocatalytic activity of the TPMS structures was systematically investigated using customized horizontal and rotational flow reactor systems (Figure 4) illuminated by a 500 W mercury lamp (254–700 nm wavelength range) (Bilang Instrument Manufacturing Co., Ltd., Shanghai, China). For horizontal flow testing, 4 × 4 × 4 cm TPMS-PCR specimens were positioned in a cylindrical glass reactor (20 cm height × 11 cm diameter) featuring horizontally aligned inlet/outlet ports (1 cm diameter) located 7 cm above the base and oriented toward the sample center, with methylene blue solution circulating at 500 mL/min via peristaltic pump. The rotational flow configuration employed an 8 cm diameter × 10 cm tall reactor containing the TPMS specimen positioned 3 cm above the base and 2 cm from the light source, where a magnetic stirrer operating at 1200 rad/min generated turbulent flow with average fluid velocities of 0.5 m/s. Both experimental setups maintained consistent sample illumination geometry while enabling distinct hydrodynamic conditions for comparative performance analysis.
The photocatalytic degradation performance of five TPMS-based photochemical reactors (IWP, G, N, D, and FRD) was evaluated using a 0.05 wt% methylene blue solution under both horizontal and rotational flow fields. Prior to illumination, the systems were maintained in complete darkness for 5 h to achieve adsorption equilibrium. Following this dark adaptation period, samples were collected at 30 min intervals, and the degradation progress was monitored by measuring the absorbance at 664 nm using a UV–Vis spectrophotometer (Model A360, Aoyi Instruments, Shanghai, China). The degradation efficiency (η) was calculated according to Equation (3):
η = (1 − At/A0) × 100%
where A0 represents the initial absorbance at 664 nm and At denotes the absorbance at time t.

3. Results and Discussion

3.1. FTIR Characterization of TPMS PCRs

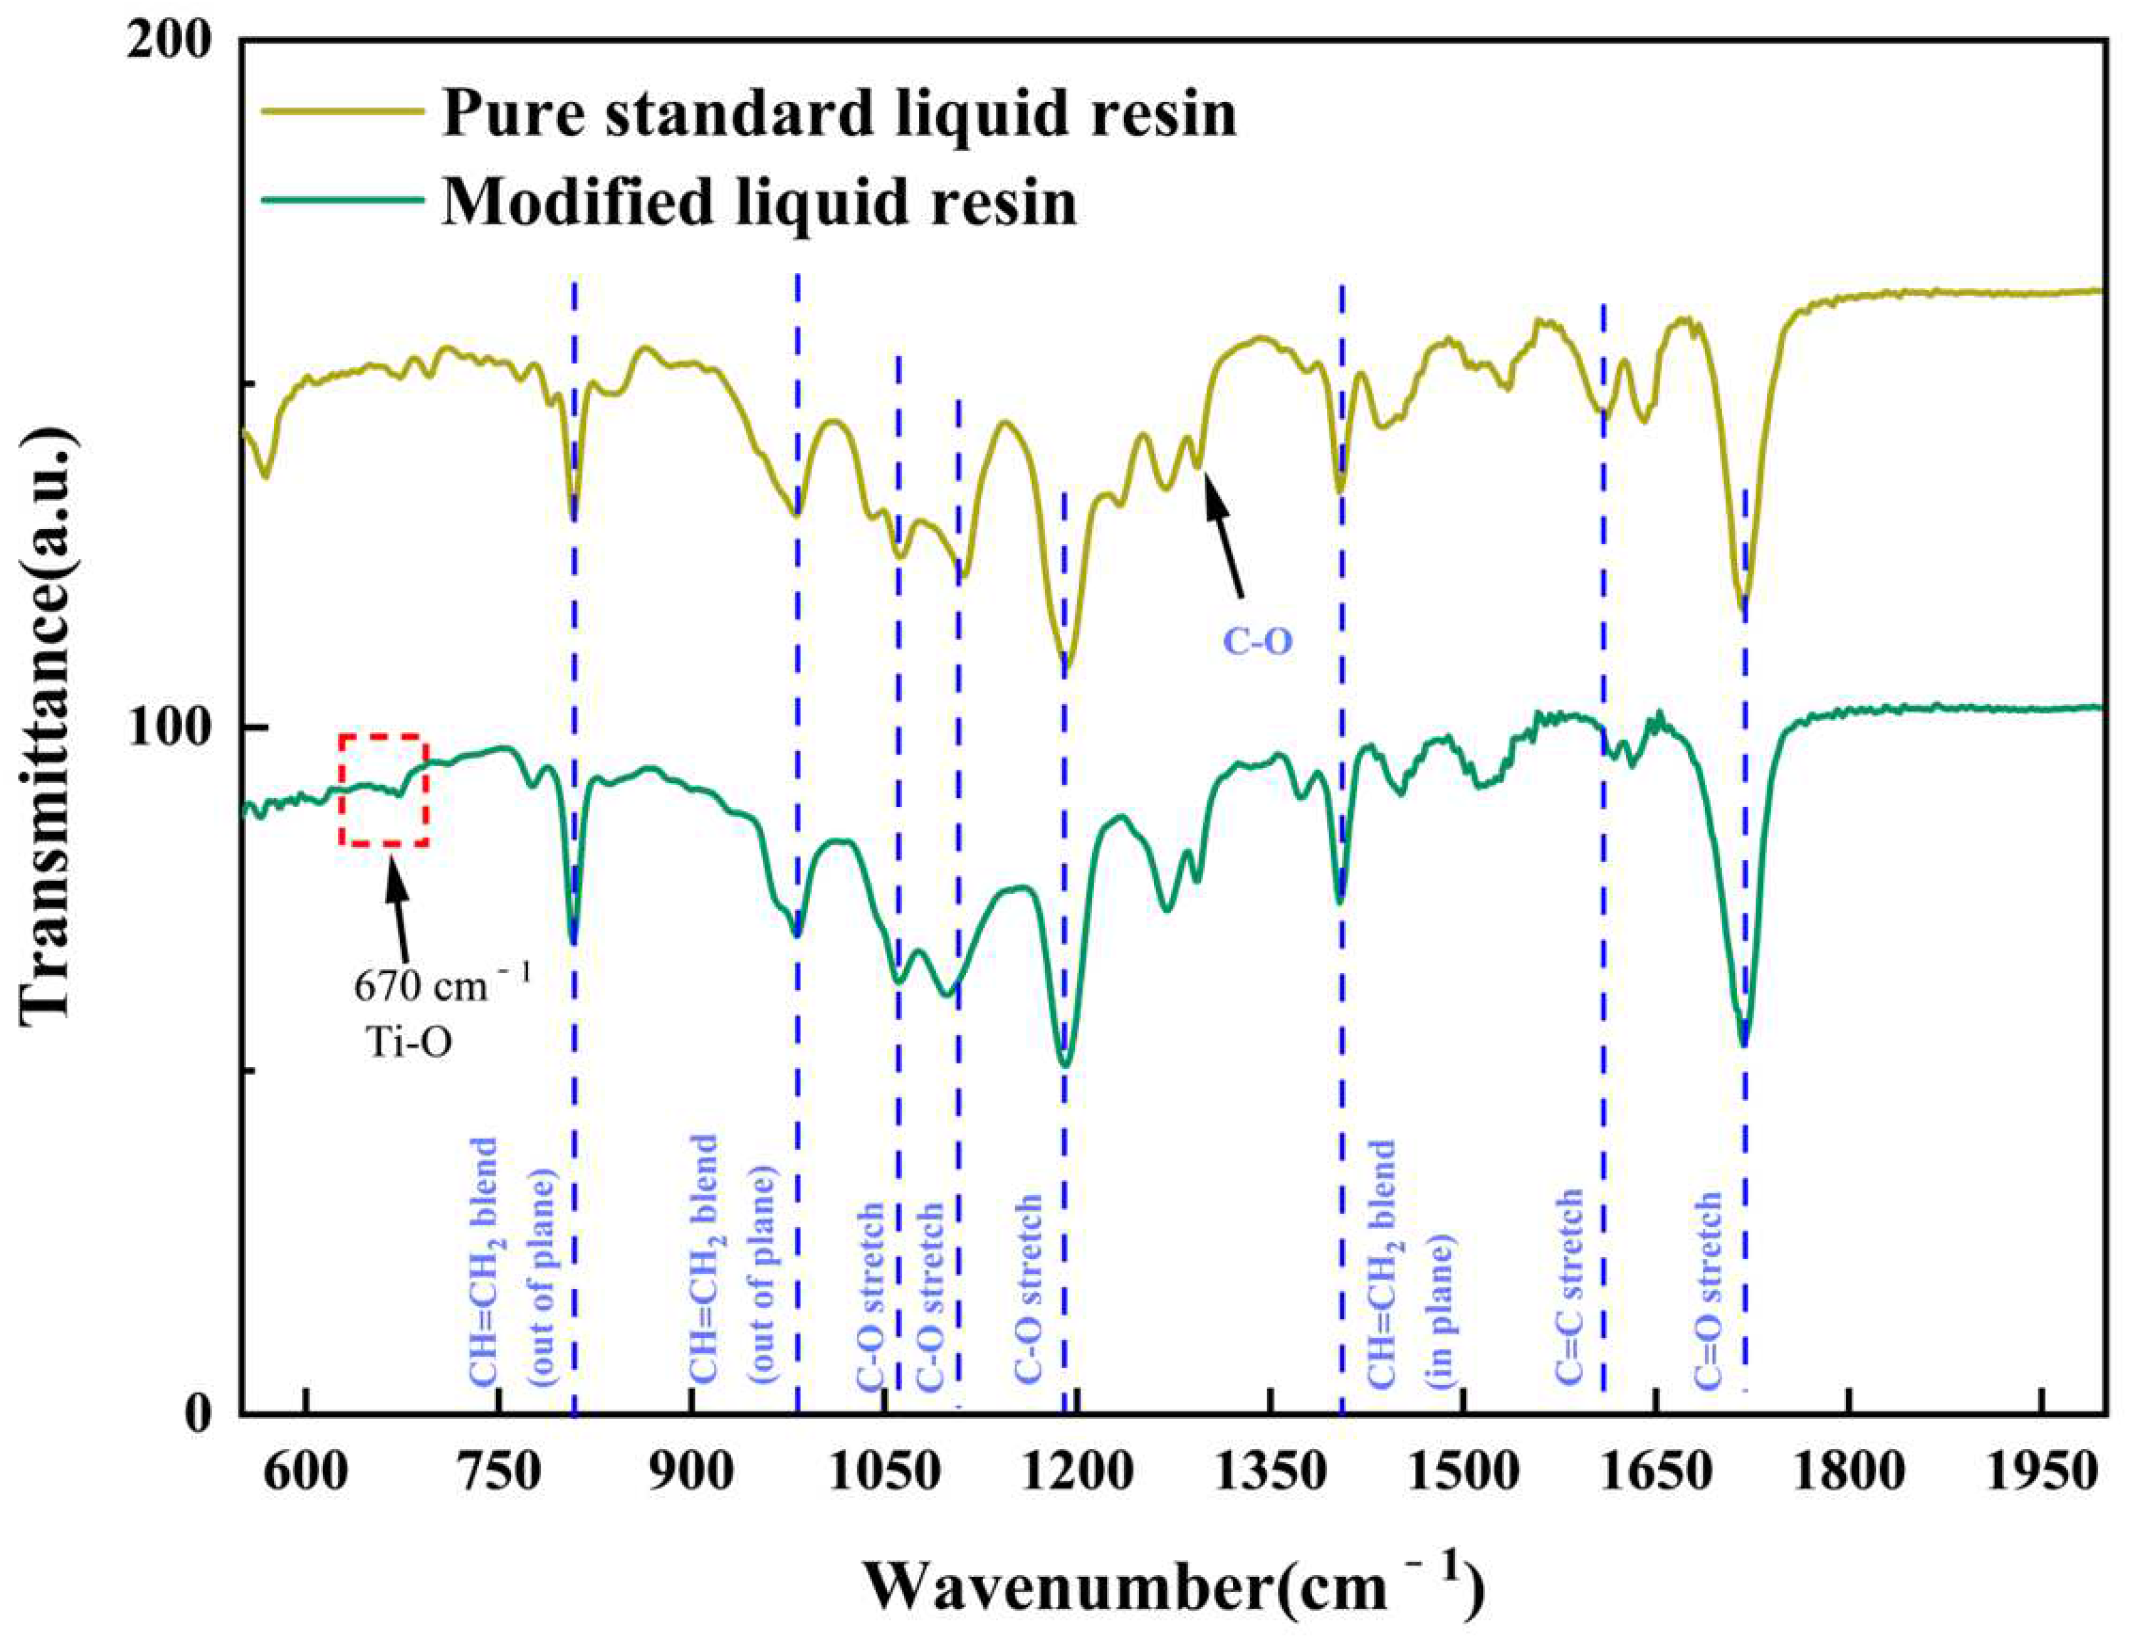
Fourier transform infrared spectroscopy (FTIR) analysis was performed on both pure resin and TiO2/photosensitive resin composites using an FTIR-650S spectrometer (Gangdong Technology Co., Ltd., Tianjin, China). As shown in Figure 5, comparing the FTIR spectra of standard resin and modified resin, both samples exhibited characteristic peaks associated with CH=CH2 bending vibrations (1403 cm−1 for in-plane and 808 cm−1, 981 cm−1 for out-of-plane deformations), which are typical features of acrylate-based polymers. The spectra of both resins showed similar absorption bands at other characteristic positions, including C–O stretching vibrations (1062 cm−1, 1105 cm−1, 1187 cm−1 and 1225 cm−1), C=C stretching (1640 cm−1), and C=O stretching (1727 cm−1). The peak at 670 cm−1 can be attributed to the lattice vibration of TiO2. The peaks in the spectrum primarily originate from the polymer, and the signal from the polymer is too strong, masking the TiO2 signal.

3.2. SEM and EDS Characterization of TPMS PCRs

Surface morphology and elemental composition of three types of 2.5 wt% TiO2/s (FRD, N, and D types) were examined using scanning electron microscopy (SEM) coupled with energy-dispersive X-ray spectroscopy (EDS) (SU8100 and EMAX Evolution, Hitachi High-Tech Corporation, Tokyo, Japan) for TiO2 content verification.
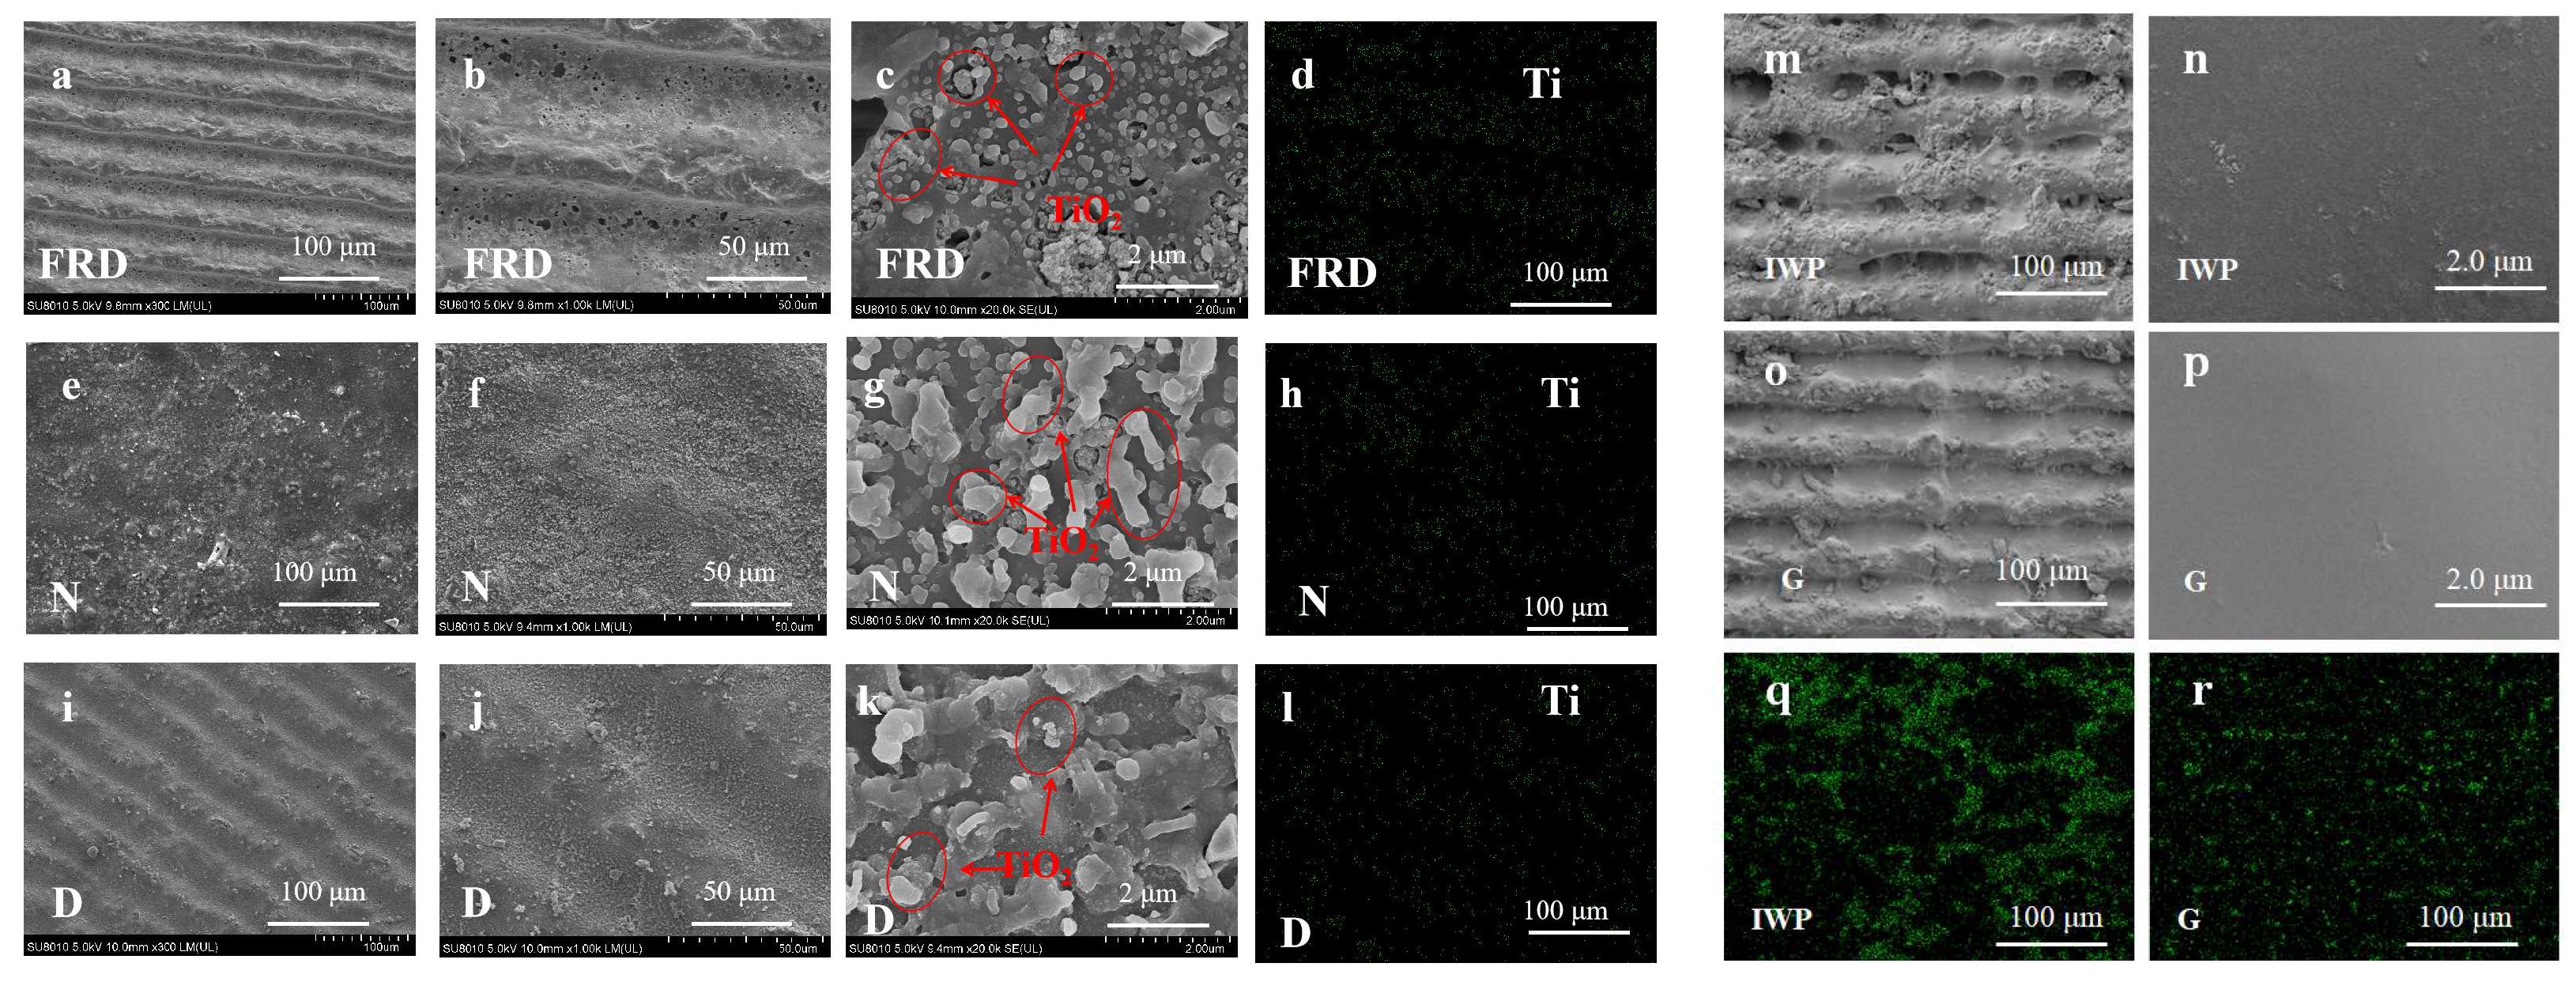
Figure 6 presents SEM micrographs and corresponding Ti-EDS elemental mapping of the PCR surfaces. The SEM images taken along the printing direction reveal characteristic step-like morphological patterns with well-defined periodicity (Figure 6a,i,m,o). In contrast, this stepped morphology is conspicuously absent in Figure 6e due to the orthogonal sampling orientation relative to the printing direction. Comparative surface roughness analysis of Figure 6b,f,j,n,p demonstrates significant variations among different PCR architectures despite identical TiO2 loading concentrations, with FRD and N-type surfaces exhibiting markedly higher roughness compared to other variants. EDS elemental mapping indicates that titanium is uniformly distributed at the macroscopic scale. Therefore, higher magnification SEM observations (Figure 6c,g,k) reveal two distinct TiO2 nanoparticle configurations: (1) particles encapsulated within discrete resin matrix cavities; (2) particles directly exposed at pore surfaces, indicating scale-dependent distribution characteristics at the microscale localization.
As shown in Table 5, quantitative EDS mapping of FRD, N, D, IWP, and G-PCRs indicated homogeneous titanium distribution with consistent content 2.50 wt%, matching the nominal loading concentration (see Appendix B.3, Figure A2). ImageJ (version 1.8.0.112, National Institutes of Health, Bethesda, MD, USA) analysis of SEM micrographs further determined the average TiO2 particle diameter to be around 25–30 nm.

3.3. Photocatalytic Performance Evaluation of SLA-Printed TPMS PCR

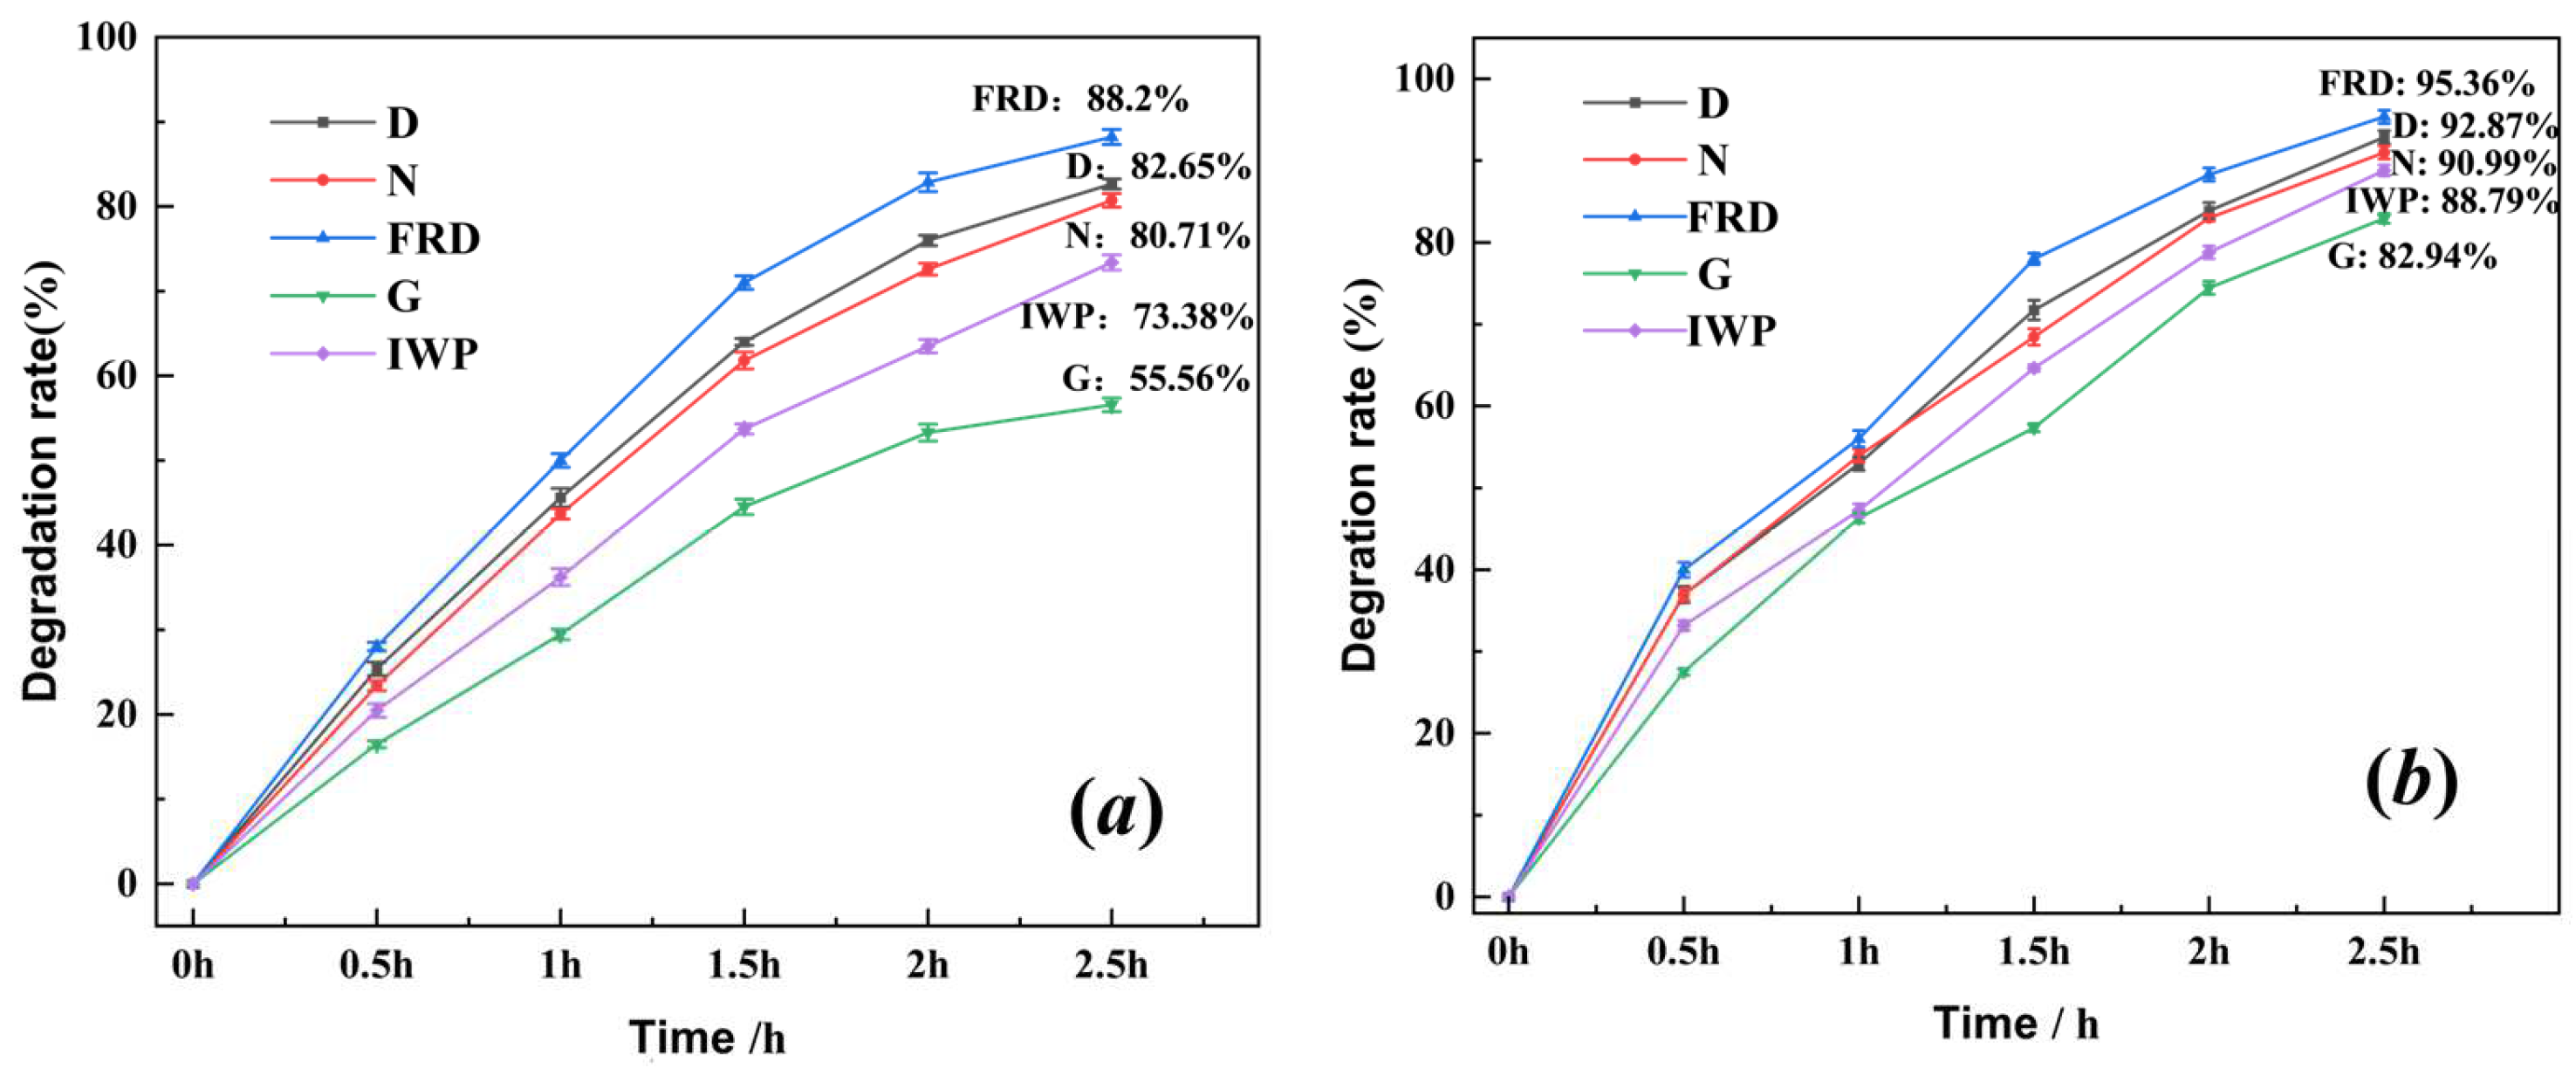
Figure 7 presents the photocatalytic reaction efficiency under mercury lamp irradiation. Comparative analysis reveals that the rotational flow field exhibits superior adsorption and photocatalytic degradation performance compared to the horizontal flow field. Among all tested configurations, the FRD-PCR demonstrates the highest photocatalytic activity in both flow fields. Specifically, under rotational flow conditions, the FRD-PCR achieves an exceptional degradation efficiency of 95.36% within 2.5 h, significantly outperforming the G-type minimal surface reactor (82.94%). The photocatalytic degradation efficiency follows the descending order: FRD > D > N > IWP > G, which correlates well with the corresponding surface areas: N (276.15 cm2) > FRD (252.83 cm2) > D (186.90 cm2) > IWP (172.66 cm2) > G (112.39 cm2). The inferior performance of the G-type reactor can be attributed to its substantially smaller surface area.
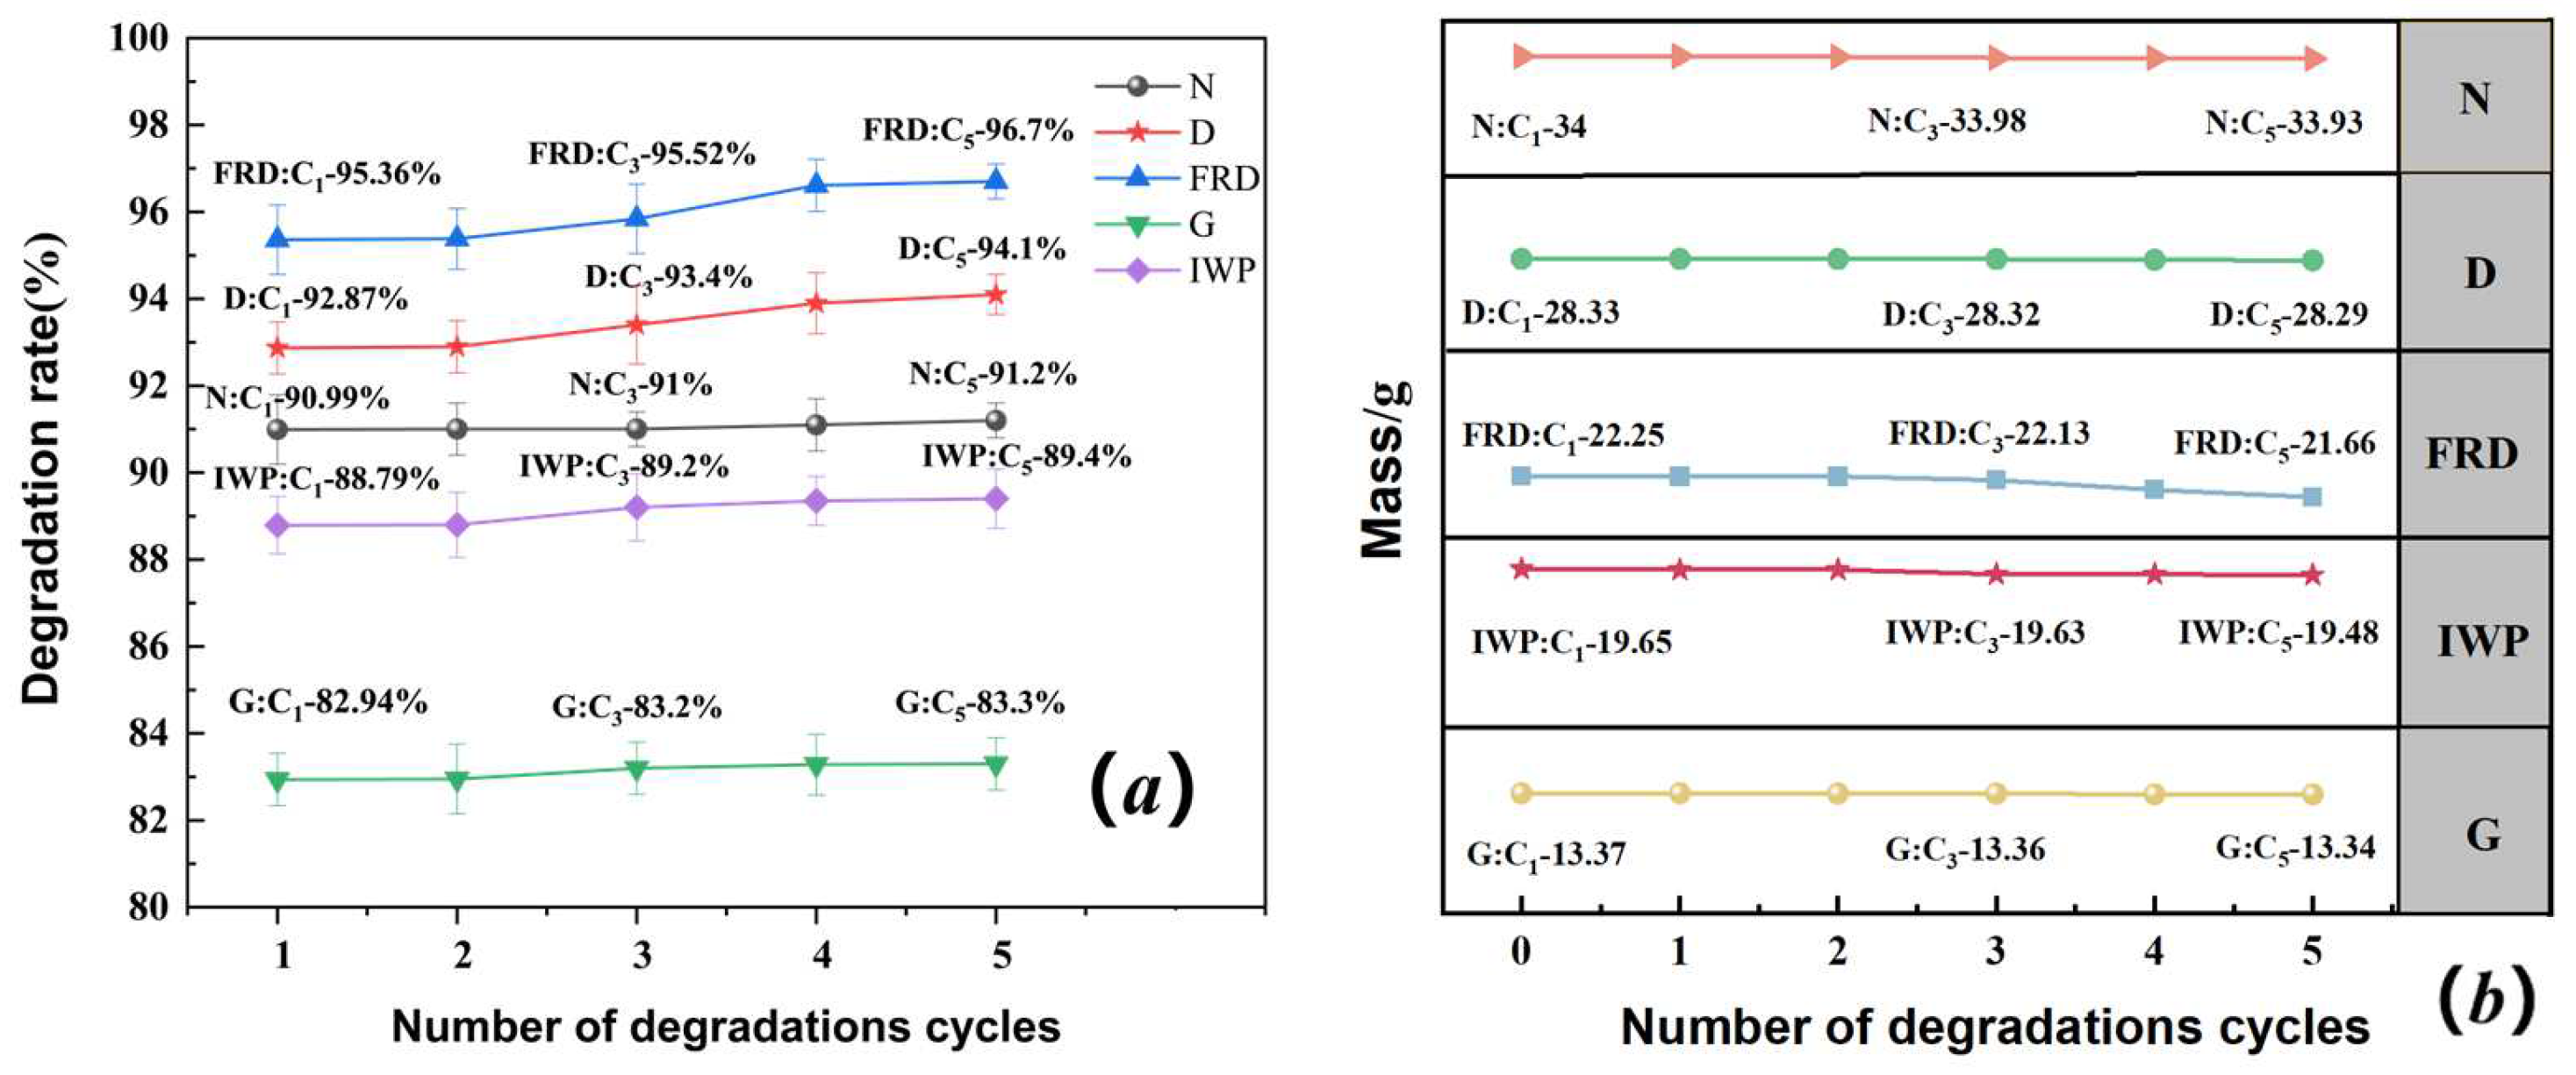
As illustrated in Figure 8a, the photocatalytic degradation efficiency of the minimal surface reactors exhibits a progressive enhancement with increasing cycle numbers. Remarkably, the FRD-type reactor reaches a peak degradation rate of 96.7% after five cycles. Complementary data in Figure 8b demonstrate a consistent mass reduction for all porous surface reactors (D, N, FRD, G, and IWP) with successive degradation cycles, with the FRD-type reactor showing the most pronounced mass loss. This observation suggests that structural modifications may occur during cycling, potentially exposing additional active sites and thereby improving catalytic performance. To investigate this hypothesis, we conducted scanning electron microscopy (SEM) to characterize the surface morphology of cycled reactors.
Quantitative analysis by inductively coupled plasma optical emission spectrometry (ICP-OES) indicated minimal titanium leaching after five operational cycles, with concentrations measured at 0.68 ± 0.03 μg/L for FRD-PCR and 0.59 ± 0.02 μg/L for D-PCR systems. These results confirm the stable immobilization of TiO2 photocatalysts within the reactor matrices. Furthermore, macroscopic and microscopic examinations revealed preserved structural integrity across all TPMS architectures, with no detectable surface deterioration or compromise in mechanical performance.
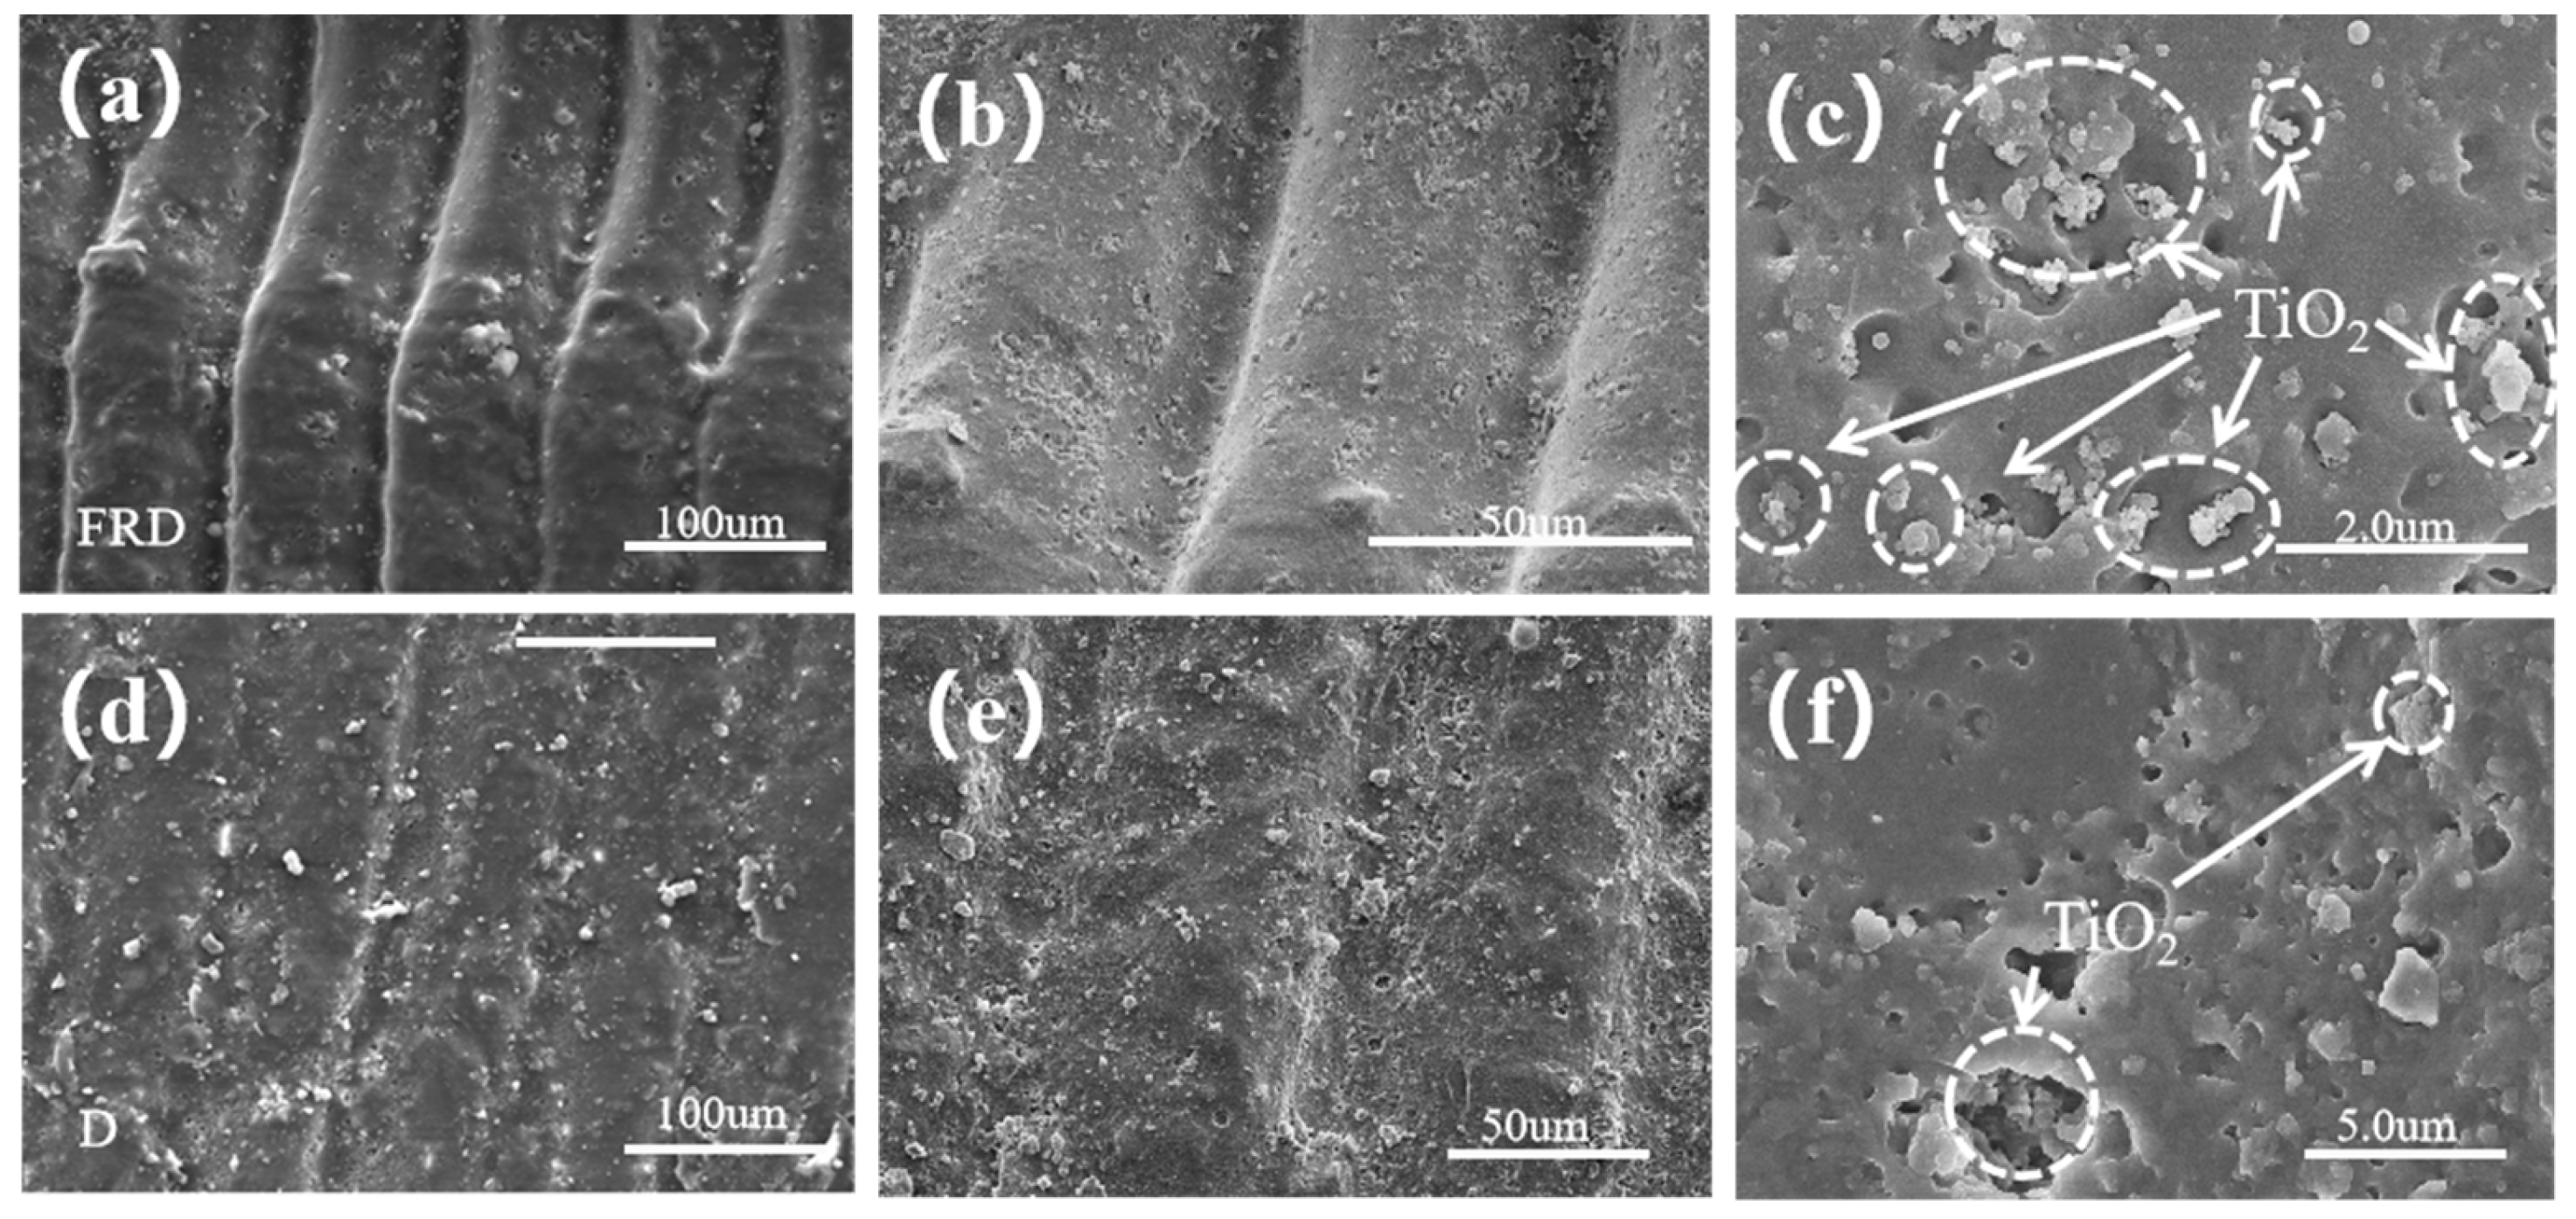
To investigate the mechanism behind the enhanced catalytic performance of PCRs with increasing reaction cycles, scanning electron microscopy (SEM) and elemental analysis were performed on FRD-PCR and D-PCR samples after five catalytic cycles. Figure 9a–f presents the SEM images of these cycled reactors. Comparative analysis between Figure 9a,d and Figure 6a,i reveals significantly roughened surfaces with localized shrinkage in both reactors after five photocatalytic cycles. This morphological evolution increases the reactor-solution contact area, thereby enhancing adsorption and degradation capabilities. Figure 9b,e compared with Figure 6b,i demonstrate the formation of numerous micropores along the 3D-printing direction, where partial resin degradation or displacement has exposed additional TiO2 nanoparticles. The modified resin, having undergone prolonged SLA UV curing followed by high-power mercury lamp irradiation during five photocatalytic cycles, exhibited localized over-curing effects leading to brittle fracture and shrinkage-induced pore formation. These structural modifications effectively increase the active surface area. Furthermore, comparison with Figure 6c,k shows interconnection between previously isolated TiO2-embedded pores, indicating that TiO2 not only catalyzes pollutant degradation but also induces partial resin decomposition between nanoparticles. This process exposes more active TiO2 sites while increasing local TiO2 concentration, ultimately improving both catalytic efficiency and recyclability of the reactors.

3.4. CFD Hydrodynamic Simulation Analysis of Degradation Process in TPMS PCRs

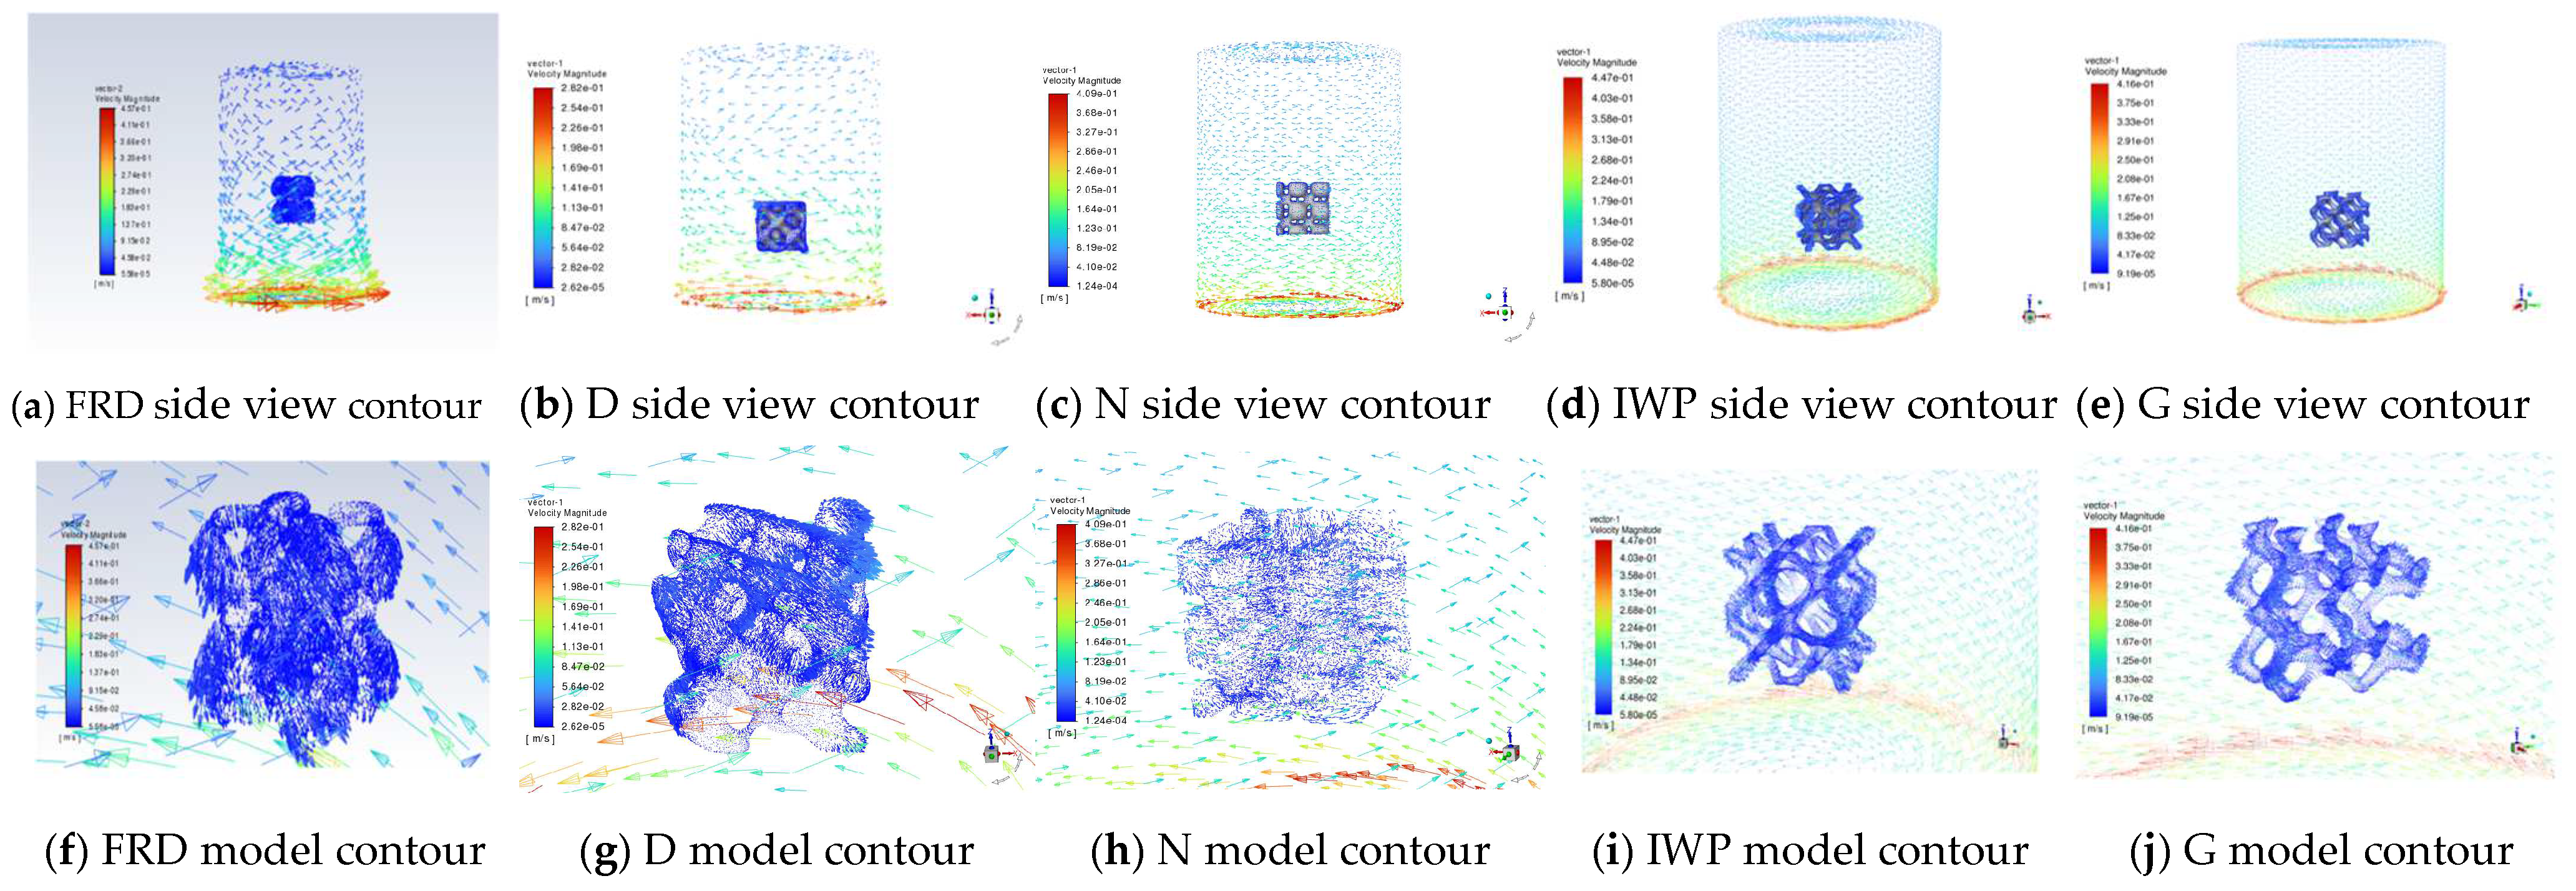
Horizontal flow represents laminar-dominated conditions (500 mL/min), while rotational flow generates turbulent mixing (1200 rad/min). To investigate the flow velocity variations in TPMS PCRs under both horizontal and rotational flow fields, we performed computational fluid dynamic (CFD) simulations using steady-state calculations with the Realizable k-ε turbulence model. The governing equations, numerical methods, and convergence analysis of CFD are described in Appendix A. Enhanced wall functions (EWFs) were employed for near-wall treatment. The Fluent simulation results for the flow velocity variations during methylene blue degradation in both flow fields are presented in Table 6.
Analysis of the data presented in Table 6 reveals several key hydrodynamic characteristics of the TPMS−PCRs. The reactor geometry significantly influences velocity distribution. Under identical rotational speeds, different models exhibit distinct surface and internal flow velocities in both horizontal and rotational flow fields. Velocity attenuation along the depth direction shows model-dependent characteristics. For all five TPMS−PCRs, surface velocities exceed internal velocities, with consistent velocity decay observed with increasing depth. Flow field type determines the flow characteristics of TPMS−CPRs. Rotational flow fields demonstrate consistently higher velocities than horizontal flow fields. In horizontal flow fields, surface velocity distribution remains relatively uniform. The FRD model shows the highest velocity (6.5 × 10⁻³ m/s), likely due to its flow-channel deflector design that reduces turbulence generation. In rotational fields, its velocity decreases to 5.11 × 10⁻² m/s, possibly because centrifugal forces compromise the flow channel efficiency. Significant variations exist in surface velocities within rotational flow fields, with Model D achieving the highest velocity (5.3 × 10⁻² m/s) and Model N the lowest (0.76 × 10⁻² m/s).
The trace diagrams reveal that in the rotational flow field, both side regions at the beaker bottom appear red, indicating higher velocities in these areas. Combined with the top-view contours in Figure 10f–j, pale white regions are observed inside the models, demonstrating velocity reduction with increasing depth as momentum converts to other energy forms according to the conservation of energy principle. Figure 10 further shows that turbulent flow predominantly occurs in central regions, while laminar flow appears along the middle sidewalls. The horizontal flow field exhibits lower energy dissipation compared to the rotational field, where energy concentrates at the surface with significant internal dissipation.
Regarding photocatalytic performance, the solution velocity decreases progressively with increasing depth inside the TMPS-PCRs. Liquid traces indicate that FRD, D, and IWP models maintain higher internal flow velocities, suggesting more frequent contact with reactor surfaces per unit time and consequently higher photocatalytic degradation rates. The N-PCR demonstrates the lowest surface velocity but largest surface area, making it suitable for degradation under low-flow, light-limited conditions.
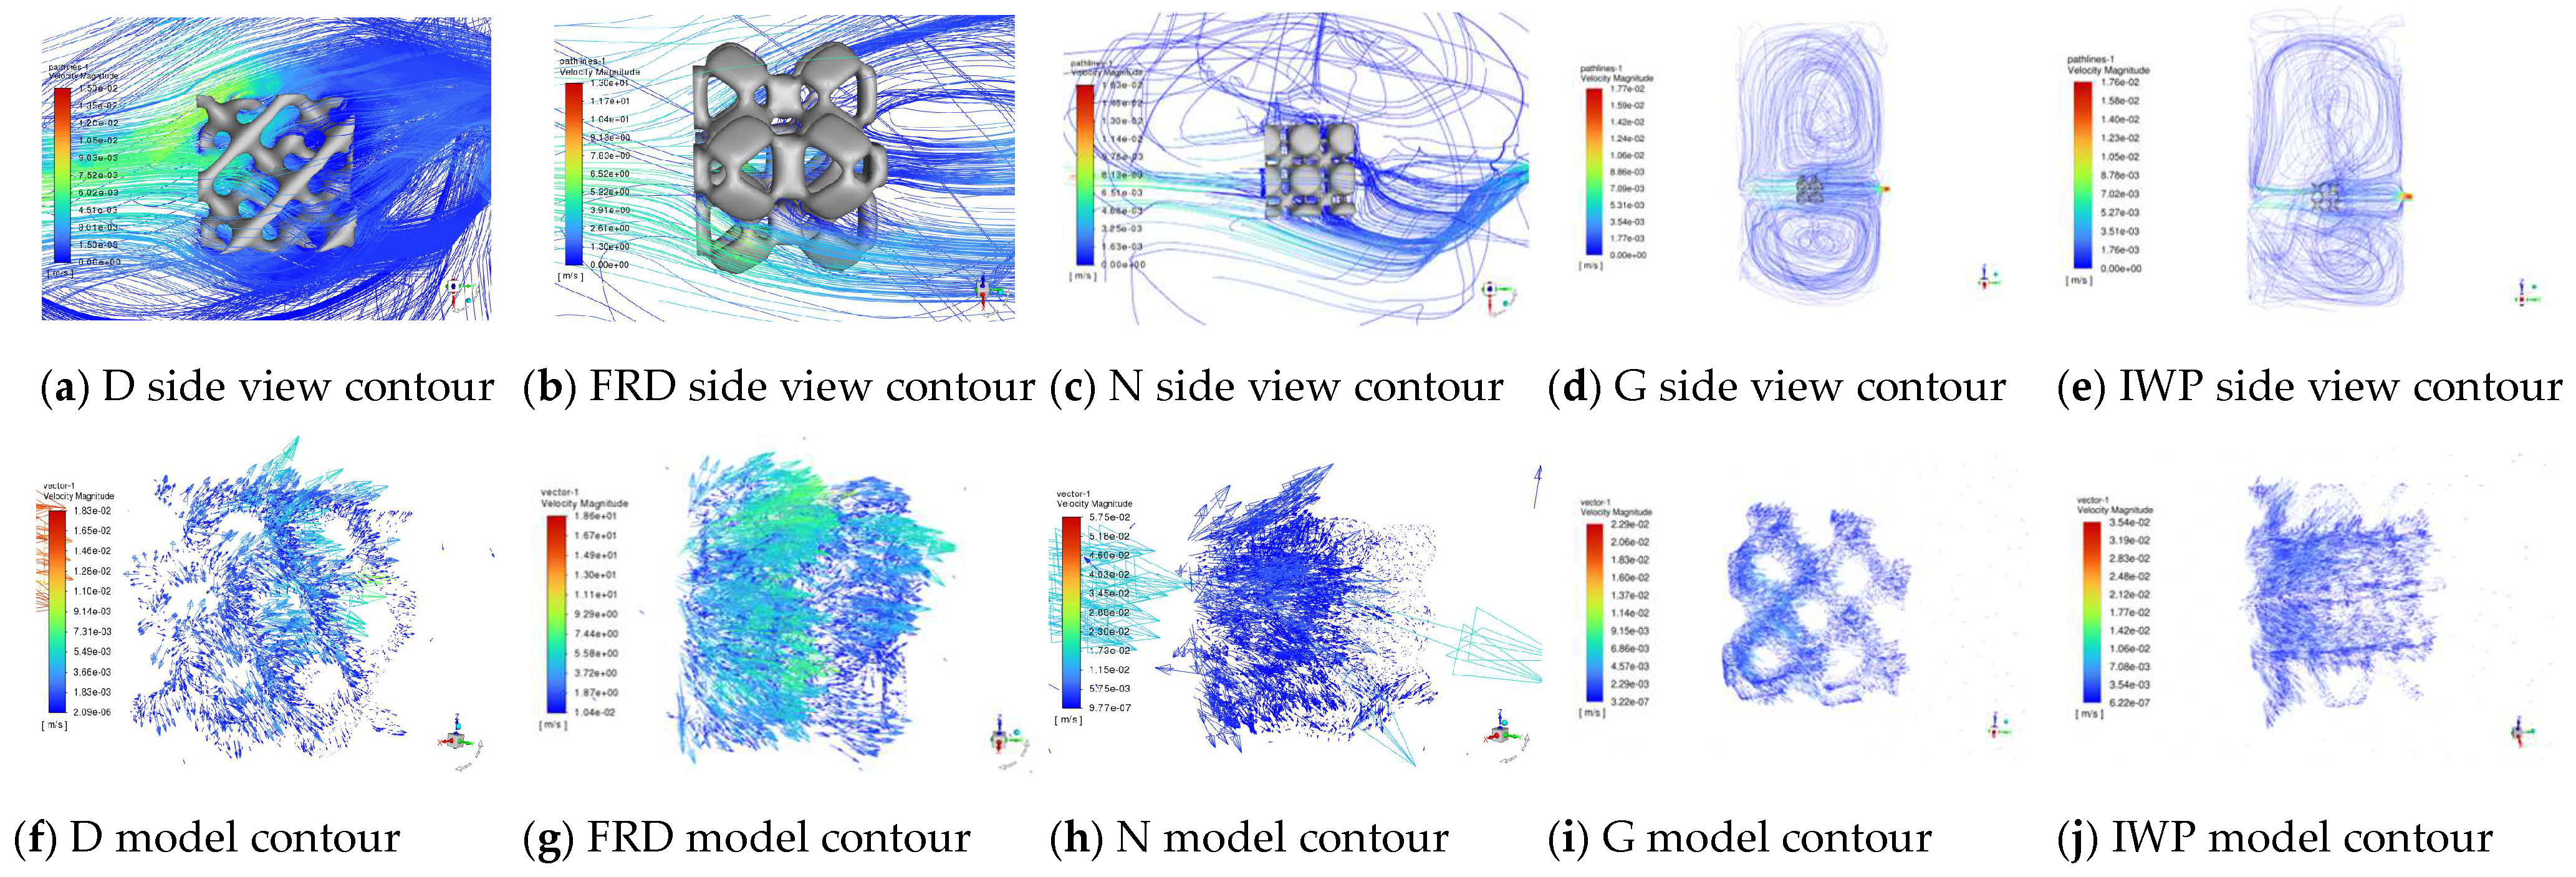
The horizontal flow field contours in Figure 11 illustrate the flow path entering through left-side pores and exiting through right-side pores. While laminar flow occurs between the pore channels, turbulent flow dominates elsewhere. Higher velocities surround the inlet region, contrasting with lower outlet velocities, indicating gradual conversion of kinetic energy to other forms. All five TMPS-PCRs show higher surface velocities near the inlet and lower velocities on the opposite side. Comparative analysis of photocatalytic degradation performance reveals significant correlations with surface characteristics and internal structures. The performance characteristics of the five TMPS models are summarized in Table 7.

4. Conclusions

This study demonstrates the successful fabrication of TiO2-loaded TPMS photocatalytic reactors (TPMS-PCRs) via SLA 3D printing, showcasing their superior performance in methylene blue degradation under controlled flow conditions.
  • Structural Optimization: The FRD-type TPMS-PCR exhibited the highest photocatalytic efficiency (95.36% in 2.5 h under rotational flow), attributed to its balanced surface area (252.83 cm2), hierarchical porosity, and optimized flow-channel design.
  • Flow Field Dominance: Rotational flow fields enhanced degradation efficiency by approximately sixfold compared to horizontal flow, with the D-type reactor achieving the highest surface velocity (5.3 × 10⁻² m/s).
  • Performance Correlation: Photocatalytic efficiency followed FRD > D > N > IWP > G, directly linked to pore connectivity, specific surface area, and hydrodynamic characteristics.
  • Cyclic Stability: The FRD reactor maintained 96.7% efficiency after five cycles, with SEM revealing surface roughening and TiO2 exposure as key mechanisms for improved recyclability.
  • CFD Insights: Model-specific velocity attenuation (surface > internal) and flow field type (rotational > horizontal) critically determined mass transfer and catalytic activity.
These results highlight TPMS-PCRs as promising solutions for scalable water treatment, combining geometric tunability, efficient mass transfer, and long-term stability. While methylene blue served as a representative model pollutant in this study, future work should explore reactor scalability and degradation efficacy across diverse contaminants (e.g., phenols, RhB) to further validate broad applicability.

Author Contributions

Conceptualization, X.C. (Xi Chen) and C.Z.; methodology, X.C. (Xiao Chen); software, Q.C.; writing—original draft preparation, Q.C.; writing—review and editing, N.L. All authors have read and agreed to the published version of the manuscript.

Funding

This research was funded by 2023 Henan Province Research-Oriented Teaching Reform Research and Practice Project:” Construction and Practice of a Dual-Wing, Multi-Element Research-Based Teaching Model for Cultivating Innovative Materials Science Talents”.

Institutional Review Board Statement

Not applicable.

Informed Consent Statement

Not applicable.

Data Availability Statement

The original contributions presented in this study are included in the article. Further inquiries can be directed to the corresponding author.

Acknowledgments

During the preparation of this manuscript, DeepSeek was utilized for text refinement. The authors have thoroughly reviewed and edited all AI-generated content and assume full responsibility for the publication.

Conflicts of Interest

Author Qi Chen was employed by the company Yellow River Co., Ltd. The remaining authors declare that the research was conducted in the absence of any commercial or financial relationships that could be construed as a potential conflict of interest.

Abbreviations

The following abbreviations are used in this manuscript:
TPMSTriply Periodic Minimal Surface
PCRPhotocatalytic Reactors

Appendix A

Appendix A.1. Governing Equations and Numerical Methods

The computational model employed in this thesis adopts steady-state calculations with the Realizable k-ε solver, utilizing the ‘Enhanced Wall Function (EWF)’ for near-wall treatment. Here is an introduction to the fundamental equations governing the fluid simulation.

Appendix A.1.1. Governing Equations and Steady-State Assumption

The Navier–Stokes equations (steady-state form) are presented below, omitting the transient term, describing momentum conservation while accounting for inertial forces, pressure gradients, viscous forces, and body forces. The equations exhibit elliptic (low-speed flow) or parabolic (high-speed flow) characteristics, requiring global iterative solutions, as shown in Equation (A1). The continuity equation is given in Equation (A2), and the energy equation (optional for heat transfer analysis) is presented in Equation (A3).
ρ ( u t + u u ) = p + μ 2 u + f
𝛻 · ρ u = 0
𝛻 · ρ u h = 𝛻 · k 𝛻 T + S h
Under steady-state conditions, the enthalpy transport equals the sum of heat conduction and source terms, where h is specific enthalpy, k is thermal conductivity, and Sh is the heat source.

Appendix A.1.2. Core Equations of the Realizable k-ε Model

1. Core Equations of the Realizable k-ε Model
(1) Turbulent Kinetic Energy (k) Equation:
The k-equation is the core governing equation in turbulence models, describing the transport and dissipation of turbulent kinetic energy, commonly used in RANS (Reynolds-Averaged Navier–Stokes) simulations such as the k-ε model. The transport equation for turbulent kinetic energy (k) is expressed in Equation (A4)
ρ k t + ρ u i k x j = x j μ + μ t σ k k x j + P k ρ ε + S k
The left-hand terms consist of the transient (unsteady) term and convective term, describing the accumulation and transport of turbulent kinetic energy. The right-hand terms include the following: the diffusion term involving molecular and turbulent viscosity effects, where σk is the turbulent Prandtl number; the production term representing turbulence generation from mean velocity gradients; the dissipation term quantifying energy conversion to heat via viscous effects; and the source term accounting for additional influences like buoyancy or rotation.
This equation represents energy conservation by balancing turbulence production, diffusion, dissipation, and external sources. It assumes isotropic turbulence, with dissipation rate ε determined through a separate transport equation in the k-ε model. Turbulent viscosity μt couples k and ε, while standard empirical coefficients include Cμ (viscosity coefficient), σk (Prandtl number), and Cε (dissipation rate coefficient).
(2) Turbulent Viscosity
A key parameter in turbulence models linking Reynolds stresses to mean velocity gradients, with varying formulations across models. In the standard k-ε model, turbulent viscosity is expressed as Equation (A5):
μ t = ρ C μ k 2 ε  
where ρ is fluid density (kg/m3), Cμ is a dimensionless constant (typically 0.09), k is turbulent kinetic energy (m2/s2), and ε is dissipation rate (m2/s3).

Appendix A.2. Convergence Analysis

CFD convergence analysis is a critical process in computational fluid dynamics for evaluating whether numerical simulation results reach a stable and reliable state. Its primary objective is to ensure that the computational results no longer vary significantly with iterations while satisfying physical conservation laws. Convergence corresponds to the process where residuals (the deviation between computed and theoretical solutions) progressively approach stable values. When residuals fall below preset thresholds and key physical quantities (e.g., velocity, pressure) cease to change with iterations, the solution is considered converged. Convergence is fundamental to the reliability of CFD simulations. Failure to converge may lead to violations of energy, momentum, or mass conservation, resulting in deviations from true physical behavior.
Residuals measure the deviation between discretized numerical solutions and theoretical solutions, quantifying errors at each iteration. The continuity equation residual is given by (A6):
R c o n t i n u i t y = c e l l s p t + 𝛻 · ρ u
where ρ is fluid density (kg/m3), characterizing mass distribution; t is time (s), the independent variable in dynamic processes; u is the velocity vector field (m/s), representing directional fluid motion; and ∇ is the divergence operator, describing spatial flow characteristics.
In Fluent numerical simulations, the convergence criteria are set as follows: the residual threshold for the continuity equation is set to 1 × 10⁻⁶, while the residual thresholds for velocity components (x/y/z-velocity), turbulent kinetic energy (k), and turbulent dissipation rate (ε) are all set to 1 × 10⁻³. The solution is considered converged when residuals for all governing equations fall below their respective thresholds. Notably, the convergence criterion for the continuity equation must be more stringent (three orders of magnitude lower than that for the momentum equations) because it directly determines the numerical accuracy of mass conservation. In contrast, the momentum equations and turbulence model parameters allow slightly relaxed convergence conditions (1 × 10⁻³) to balance computational efficiency with solution stability. Additionally, to prevent premature termination due to local convergence, the calculation must continue for at least 300 iterations after the residuals reach a plateau to ensure global convergence of the solution.

Appendix B

Appendix B.1. Stereolithographic Fabrication of TPMS-PCRs with Varied TiO2

The mass fractions of nano-titanium dioxide in the modified photosensitive resin were 1 wt%, 1.5 wt%, 2 wt%, and 2.5 wt%, respectively. To prevent nanoparticle aggregation, the mixed resin was sonicated for 60 min in a constant-temperature water bath at 30 °C to ensure uniform dispersion of TiO2 powder. All preparation steps were conducted under light-free conditions, with Parafilm sealing the beaker containing modified resin to isolate air. The stereolithography printing was performed according to the parameters listed in Table A1.
Table A1. Slicing parameter settings.
ParameterPure Resin1 wt% TiO2/Resin1.5 wt% TiO2/Resin2 wt% TiO2/Resin2.5 wt% TiO2/Resin
Layer thickness (mm)0.050.050.050.050.05
Normal exposure time (s)33333
Light-off delay (s)22222
Bottom exposure time (s)3030406060
Bottom layers68888
Anti-aliasing level11111
Z-lift height (mm)1010101010
Z-lift speed (mm/s)44444
Z-retract speed (mm/s)44444

Appendix B.2. Photocatalytic Degradation Performance of TPMS-PCRs with Varied TiO2 Loadings
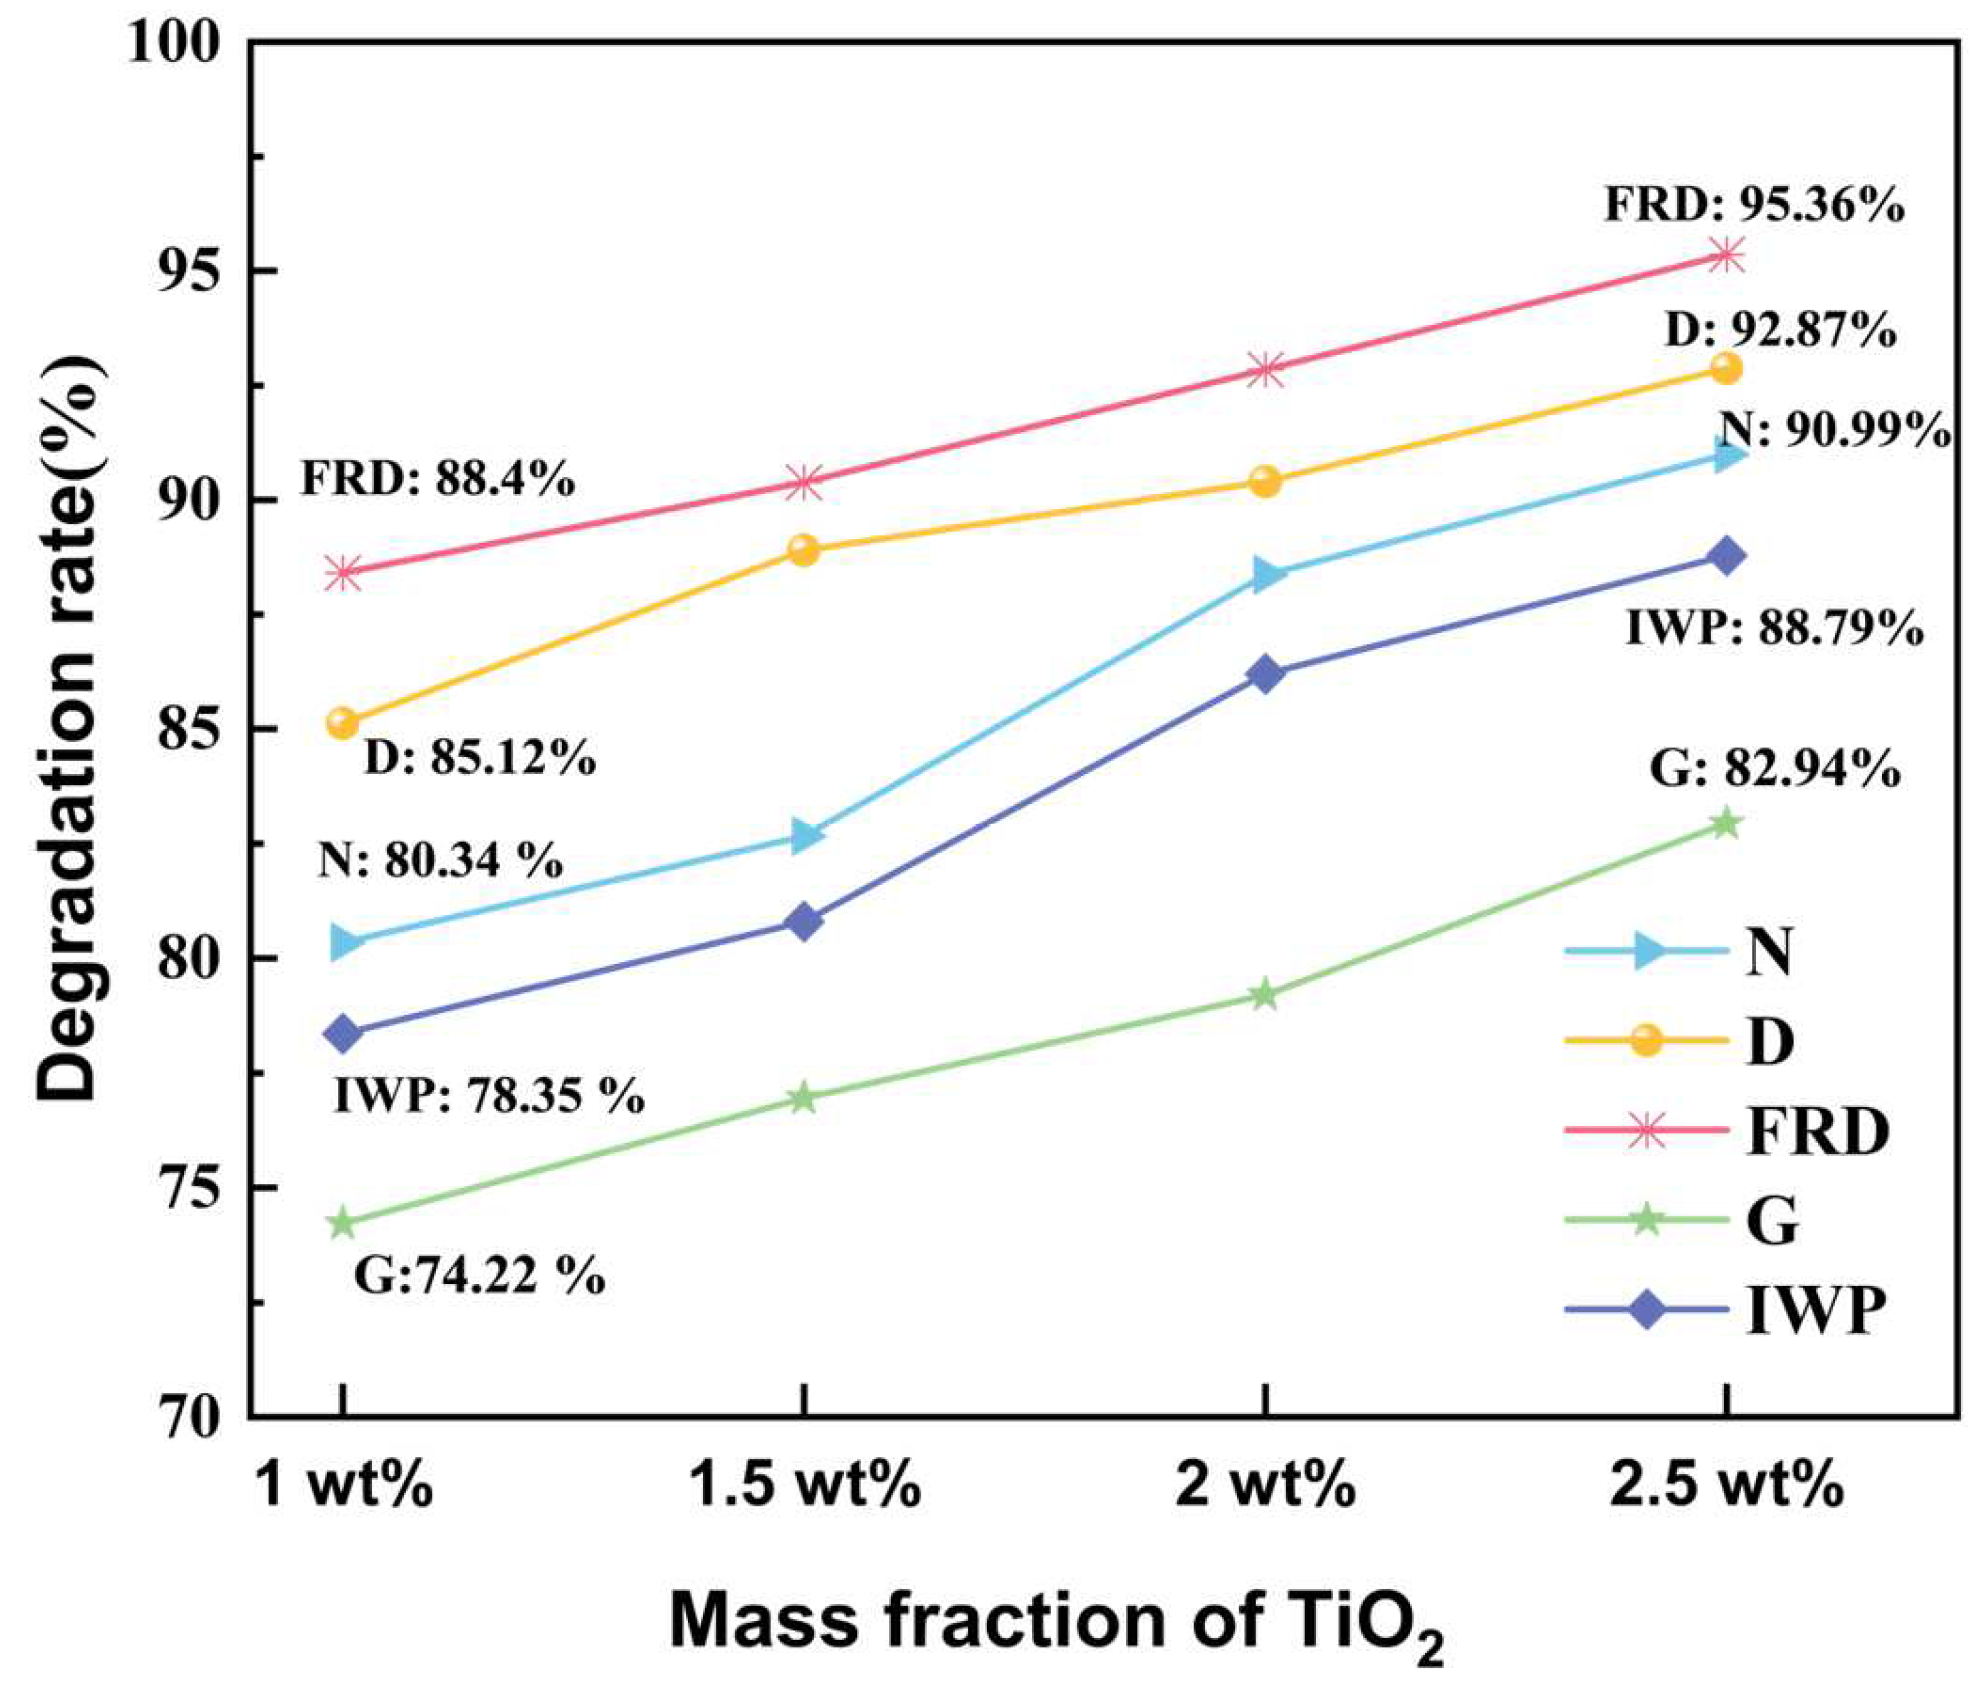
The photocatalytic degradation performance of methylene blue by reactors with different TiO2 loadings was tested over 2.5 h, as shown in Figure A1. The photocatalytic efficiency of the reactors consistently improved with increasing TiO2 loading.
Figure A1. The photocatalytic degradation of reactors with different TiO2 loadings.
Coatings 15 00953 g0a1

Appendix B.3. The EDS Analyses of N, D, FRD, G, and IWP TPMS-PCRs

The content of Ti element in N, D, FRD, G, and IWP TPMS-PCRs was tested using EDS, as shown in Figure A2.
Figure A2. The EDS analyses of N, D, FRD, G, and IWP TPMS-PCRs (ae).
Coatings 15 00953 g0a2

References

  1. Zondag, S.D.; Mazzarella, D.; Noël, T. Scale-Up of Photochemical Reactions: Transitioning from Lab Scale to Industrial Production. Annu. Rev. Chem. Biomol. Eng. 2023, 14, 283–300. [Google Scholar] [CrossRef] [PubMed]
  2. Iqbal, M.A.; Akram, S.; Khalid, S.; Lal, B.; Hassan, S.U.; Ashraf, R.; Kezembayeva, G.; Mushtaq, M.; Chinibayeva, N.; Hosseini-Bandegharaei, A. Advanced photocatalysis as a viable and sustainable wastewater treatment process: A comprehensive review. Environ. Res. 2024, 253, 118947. [Google Scholar] [CrossRef] [PubMed]
  3. Koe, W.S.; Lee, J.W.; Chong, W.C.; Pang, Y.L.; Sim, L.C. An overview of photocatalytic degradation: Photocatalysts, mechanisms, and development of photocatalytic membrane. Environ. Sci. Pollut. Res. 2019, 27, 2522–2565. [Google Scholar] [CrossRef]
  4. Chen, X.; Zhang, C.; Tong, Y.; Wang, X.; Chen, X.; Yang, Y.; Liu, J.; Chen, Q.; Li, N. Preparation of high-strength ceramsite from coal gangue, fly ash, and steel slag. RSC Adv. 2025, 15, 4332–4341. [Google Scholar] [CrossRef]
  5. Pham, D.C.; Cao, T.M.D.; Nguyen, M.C.; Nguyen, V.H.; Bui, V.H.; Nguyen, T.T.T. Integrating Photocatalysis and Microfiltration for Methylene Blue Degradation: Kinetics and Cost Estimation. Chem. Eng. Technol. 2022, 45, 1748–1758. [Google Scholar] [CrossRef]
  6. Rentz, R.; Widerlund, A.; Viklander, M.; Öhlander, B. Impact of Urban Stormwater on Sediment Quality in an Enclosed Bay of the Lule River, Northern Sweden. Water Air Soil Pollut. 2010, 218, 651–666. [Google Scholar] [CrossRef]
  7. Liu, K.; Xu, X.; Xu, J.; Fang, X.; Liu, L.; Wang, X. The distributions of alkaline earth metal oxides and their promotional effects on Ni/CeO2 for CO2 methanation. J. CO2 Util. 2020, 38, 113–124. [Google Scholar] [CrossRef]
  8. Li, Y.; Ma, Y.; Li, K.; Chen, S.; Yue, D. Photocatalytic Reactor as a Bridge to Link the Commercialization of Photocatalyst in Water and Air Purification. Catalysts 2022, 12, 724. [Google Scholar] [CrossRef]
  9. Jahn, K.; Bokor, N. Solving the inverse problem of high numerical aperture focusing using vector Slepian harmonics and vector Slepian multipole fields. Opt. Commun. 2013, 288, 13–16. [Google Scholar] [CrossRef]
  10. Malinowski, S.; Presečki, I.; Jajčinović, I.; Brnardić, I.; Mandić, V.; Grčić, I. Intensification of Dihydroxybenzenes Degradation over Immobilized TiO2 Based Photocatalysts under Simulated Solar Light. Appl. Sci. 2020, 10, 7571. [Google Scholar] [CrossRef]
  11. Jiang, Z.; Li, K.; Jia, J. Recent Developments of Light-Harvesting Excitation, Macroscope Transfer and Multi-Stage Utilization of Photogenerated Electrons in Rotating Disk Photocatalytic Reactor. Processes 2023, 11, 838. [Google Scholar] [CrossRef]
  12. Gonçalves, A.G.; Órfão, J.J.; Pereira, M.F.R. Ozonation of bezafibrate over ceria and ceria supported on carbon materials. Environ. Technol. 2014, 36, 776–785. [Google Scholar] [CrossRef] [PubMed]
  13. Xu, Z.; Zhu, Q.; Xi, X.; Xing, M.; Zhang, J. Z-scheme CdS/WO3 on a carbon cloth enabling effective hydrogen evolution. Front. Energy 2021, 15, 678–686. [Google Scholar] [CrossRef]
  14. Molinari, R.; Lavorato, C.; Argurio, P. The Evolution of Photocatalytic Membrane Reactors over the Last 20 Years: A State of the Art Perspective. Catalysts 2021, 11, 775. [Google Scholar] [CrossRef]
  15. Barbosa, I.S.O.; Manrique, Y.A.; Paiva, D.; Faria, J.L.; Santos, R.J.; Silva, C.G. Efficient photocatalytic reactors via 3D printing: SLA fabrication and TiO2 hybrid materials. RSC Adv. 2025, 15, 2275–2286. [Google Scholar] [CrossRef]
  16. Grandcolas, M.; Lind, A. 3D-printed polyamide structures coated with TiO2 nanoparticles, towards a 360-degree rotating photocatalytic reactor. Mater. Lett. 2022, 307. [Google Scholar] [CrossRef]
  17. Farías, J.J.; Lizondo-Aranda, P.; Thomas, A.H.; Lhiaubet-Vallet, V.; Dántola, M.L. Pterin-lysine photoadduct: A potential candidate for photoallergy. Photochem. Photobiol. Sci. 2022, 21, 1647–1657. [Google Scholar] [CrossRef] [PubMed]
  18. Han, L.; Che, S. An Overview of Materials with Triply Periodic Minimal Surfaces and Related Geometry: From Biological Structures to Self-Assembled Systems. Adv. Mater. 2018, 30, e1705708. [Google Scholar] [CrossRef] [PubMed]
  19. GB/T 1723-1993; Method for Determination of Viscosity of Coatings. The General Administration of Quality Supervision, Inspectionand Quarantine (AQSIQ) of the People’s Republic of China: Beijing, China, 1993.
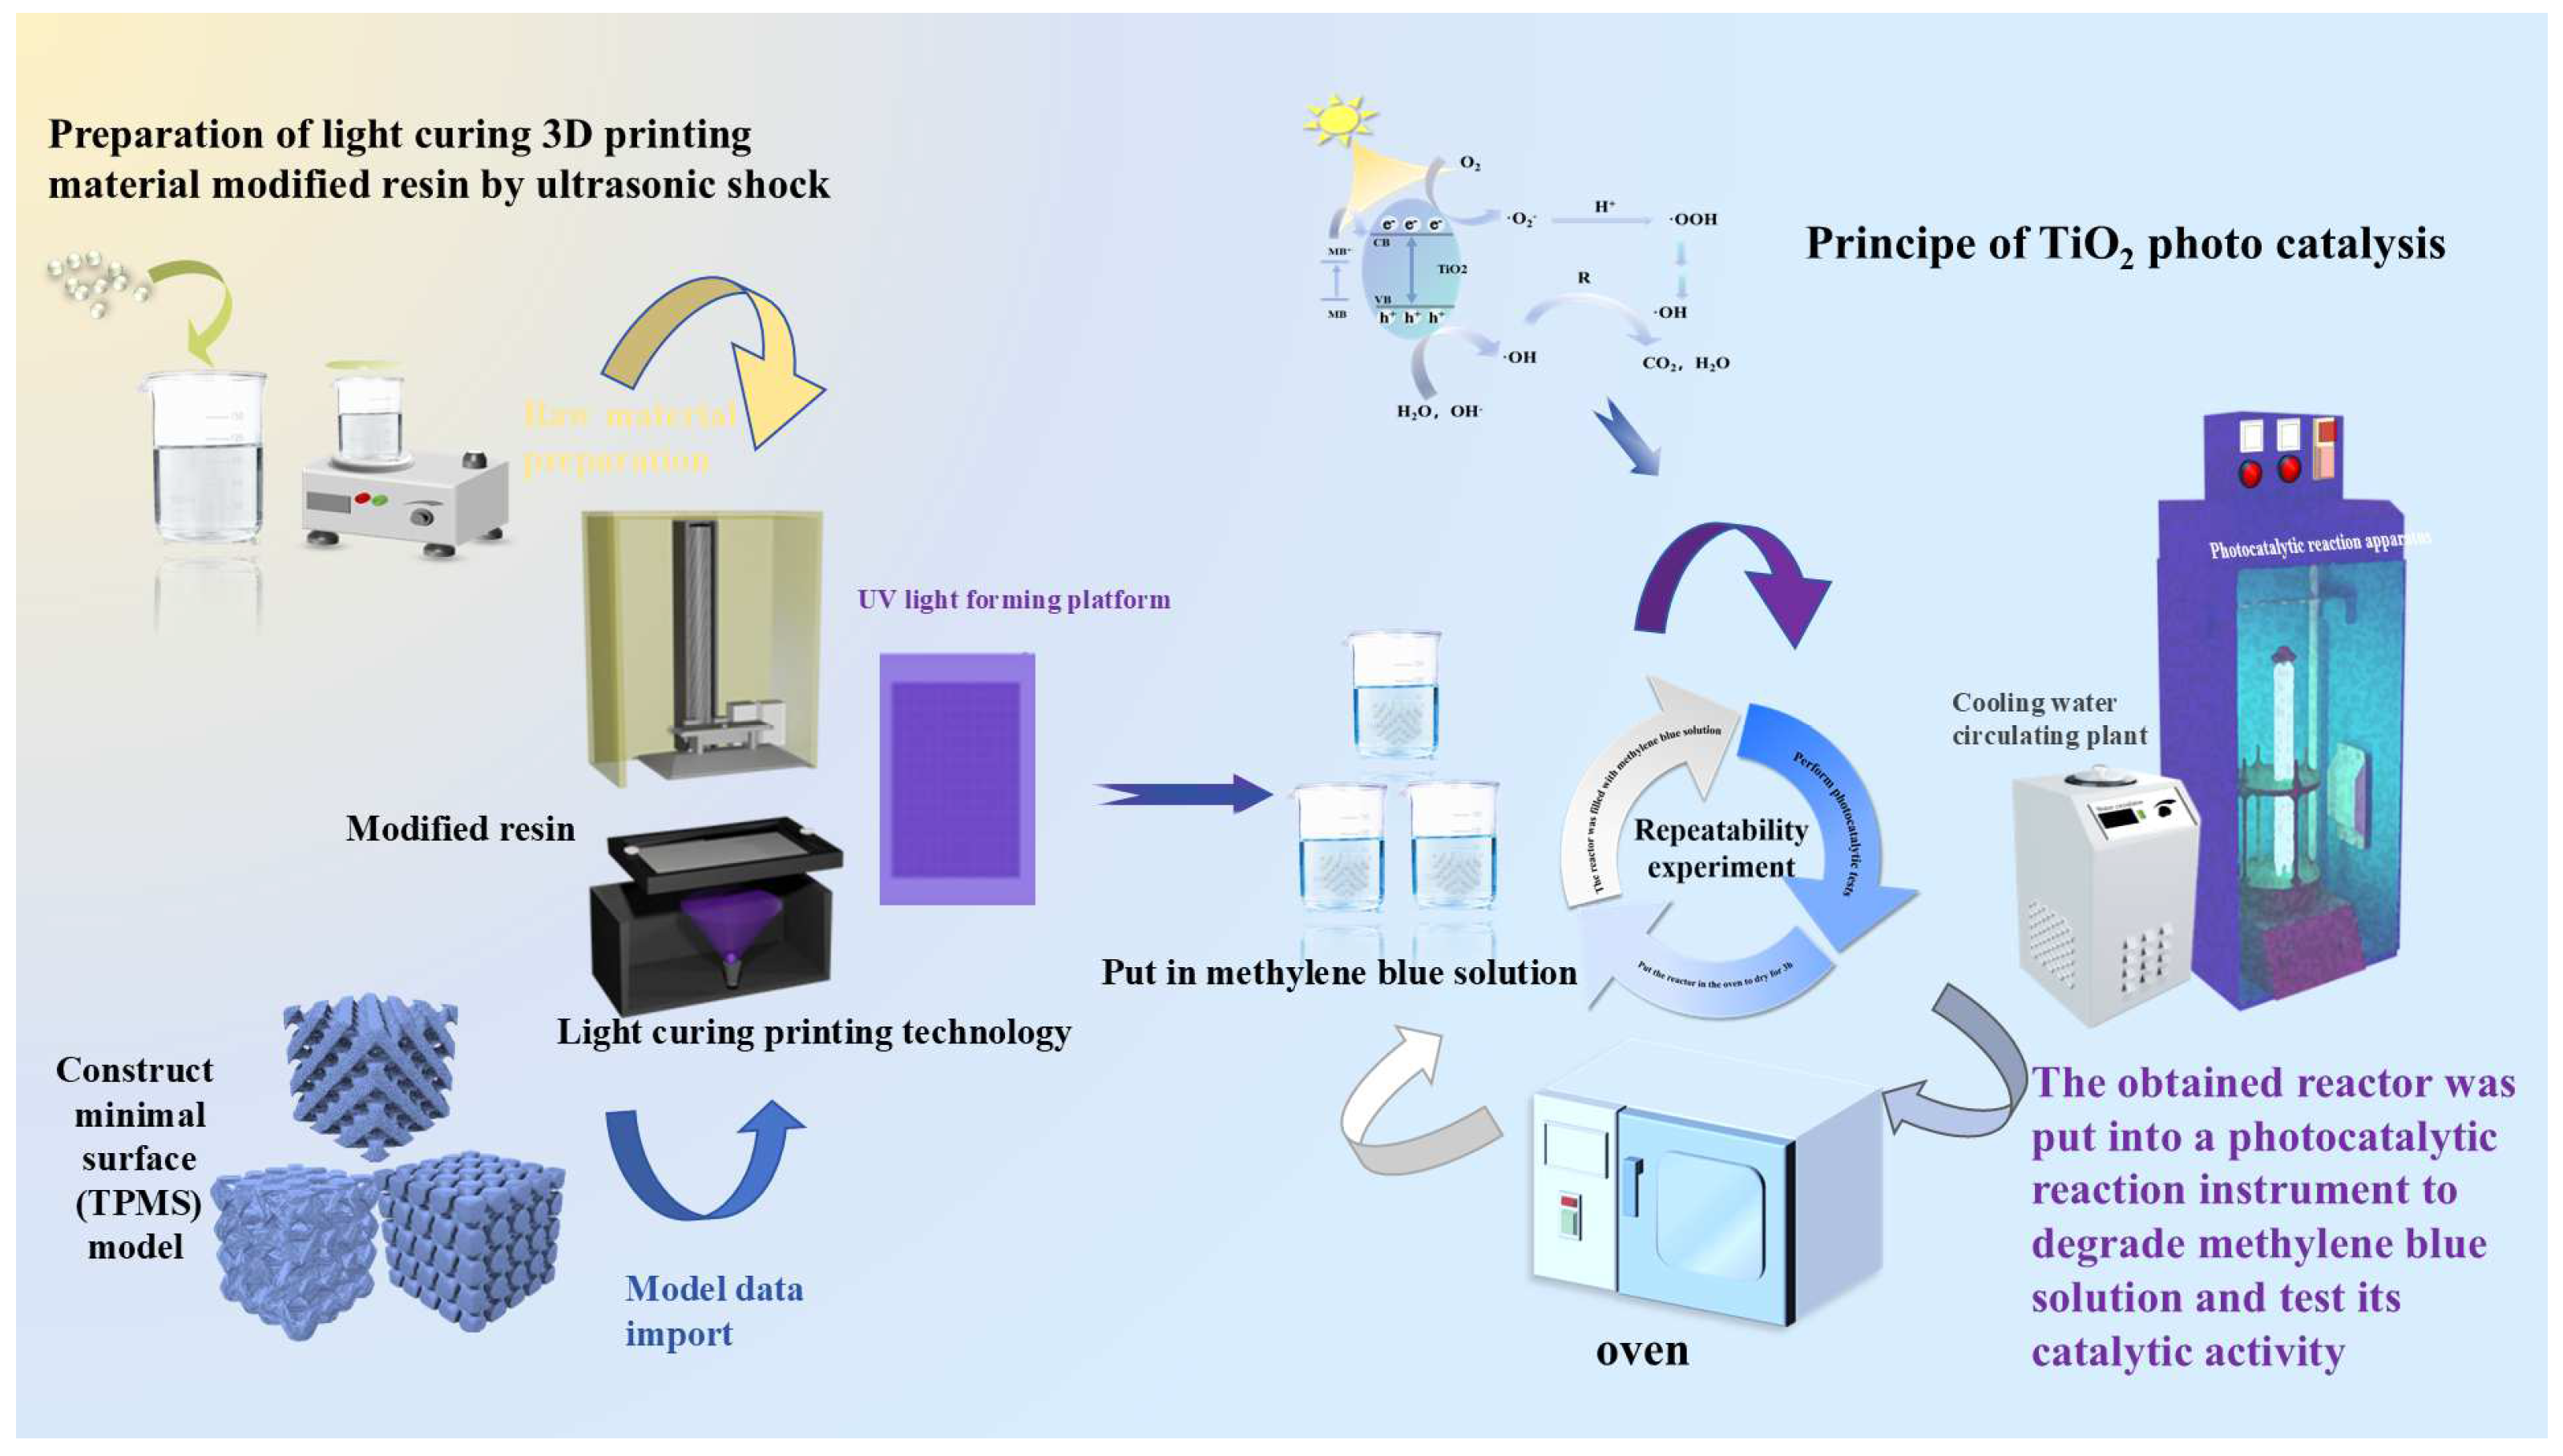
Figure 1. Fabrication process (via SLA 3D printing) and photocatalytic evaluation protocol of TPMS reactors.
Coatings 15 00953 g001
Figure 2. Schematic of the viscosity test apparatus.
Coatings 15 00953 g002
Figure 3. SLA printing process and obtained TPMS-PCR specimens.
Coatings 15 00953 g003
Figure 4. Schematic diagrams of (a) horizontal flow field and (b) rotational flow field.
Coatings 15 00953 g004
Figure 5. FTIR of pure standard resin and modified resin.
Coatings 15 00953 g005
Figure 6. SEM images of FRD-PCR surfaces along the printing direction (ac); N-PCR surfaces perpendicular to the printing direction (eg); D-PCR surfaces along the printing direction (ik); IWP-PCR surfaces along the printing direction (m,n); G-PCR surfaces along the printing direction (o,p) and corresponding EDS elemental mapping of Ti distribution in FRD, N, D, IWP and G-PCRs, respectively (d,h,l,q,r).
Coatings 15 00953 g006
Figure 7. Photocatalytic degradation performance of TiO2/photosensitive resin-printed TPMS-PCRs under horizontal (a) and rotational flow (b) fields.
Coatings 15 00953 g007
Figure 8. Cyclic degradation efficiency (a) and mass variation over five cycles in the rotational flow field (b) of TiO2/photosensitive resin-printed TPMS-PCR.
Coatings 15 00953 g008
Figure 9. Surface morphology evolution after five degradation cycles: (ac) FRD-PCR (printing-direction view) and (df) D-PCR (cross-printing-direction view) by SEM analysis.
Coatings 15 00953 g009
Figure 10. Velocity contour plots of rotational flow fields for FRD, D, N, IWP, and G models. (ae): side view cotour; (fj): model cotour.
Coatings 15 00953 g010
Figure 11. Velocity contour plots of horizontal flow fields for FRD, D, N, IWP, and G models. (ae): side view cotour; (fj): model cotour.
Coatings 15 00953 g011
Table 1. Types of photocatalytic reactors and their advantages/disadvantages.
Reactor TypeAdvantagesDisadvantagesReferences
Suspended reactorNanoscale catalyst layer enhances light absorptionMembrane fouling during long-term operation requiring frequent cleaning[5]
Fixed-bed reactorImmobilized catalysts minimize loss with operational stabilityLow mass transfer efficiency and catalyst surface passivation[6]
Thin-film reactorUltra-thin (nanoscale) catalyst layer improves light utilizationProne to membrane fouling during prolonged operation[7]
Annular reactorLarge photocatalytic surface area; CFD-optimizable flow patterns suitable for continuous operationPotential non-uniform light distribution requiring complex hydrodynamic control[8]
Microstructured fiber reactorUniform light distribution with low energy lossComplex fabrication process[9]
Flat-plate reactorSimple structure for easy maintenance; ideal for lab-scale studiesLimited reaction volume and shallow light penetration depth[10]
Rotating disk reactorEnhanced mass transfer via forced convectionHigh energy consumption[11]
Fluidized-bed reactorExcellent particle suspension and mass transfer; suitable for high-turbidity waterCatalyst loss requiring replenishment; high energy input[12]
Tubular reactorSuitable for continuous processingSignificant scale-up effects and clogging risks[13]
Hollow fiber membrane reactorReduces secondary pollutionRequires regular cleaning and maintenance[14]
Table 2. Mathematical functions of FRD-, N-, D-, G-, and IWP-type TPMS.
TPMSMathematical Function
FRDF(x,y,z) = cos(ωxx)cos(ωyy)cos(ωzz) + cos(2ωxx)cos(2ωyy)cos(2ωzz) − cos(2ωxx)
cos(2ωyy) − cos(2ωyx)cos(2ωzy) − cos(2ωxx)cos(2ωzz) = C
DF(x,y,z) = cos(ωxx)cos(ωyy)cos(ωzz) − sin(ωxx)sin(ωyy)sin(ωzz) = C
NF(x,y,z) = 3[cos(ωxx) + cos(ωyy) + cos(ωzz)] + 4cos(ωxx)cos(ωyy)cos(ωzz) = C
GF(x,y,z) = sin(ωxx)cos(ωyy) + sin(ωzz)cos(ωxx) + sin(ωyy)cos(ωzz) = C
IWP2 × [cos(ωxx)cos(ωyy) + cos(ωyy)cos(ωzz) + cos(ωzz)cos(ωxx) − [cos(2ωxx) + cos(2ωyy) + cos(2ωzz)] = C
Table 3. Slicing parameter settings in the 3D printing process.
ParameterPure Photosensitive Resin2.5 wt% TiO2/Resin
Layer thickness (mm)0.050.05
Normal exposure time (s)3.03.0
Light-off time (s)2.02.0
Bottom exposure time (s)30.060.0
Bottom layer count68
Anti-aliasing level11
Z-axis lift height (mm)10.010.0
Z-axis lift speed (mm/s)4.04.0
Z-axis retract speed (mm/s)4.04.0
Table 4. Structural parameters of TPMS architectures.
TPMS TypeDimensions (mm)Volume (cm3)Surface Area (cm2)Porosity (%)Specific Surface Area (cm2/cm3)
N4 × 4 × 428.01276.1578.0214.17
D4 × 4 × 413.19186.9053.329.86
FRD4 × 4 × 420.28252.8366.2012.47
G4 × 4 × 46.27112.3989.5617.94
IWP4 × 4 × 414.93172.6675.1211.57
Table 5. Ti content and average size of TiO2 in different TPMS PCRs.
TPMS TypeTi Content (wt%)Avgerage Size of TiO2 (nm)
N2.5228.2 ± 1.5
D2.6026.7 ± 2.1
FRD2.2325.8 ± 1.8
G2.3824.5 ± 1.1
IWP2.2729.8 ± 2.6
Table 6. CFD flow velocity analysis data.
TPMS TypeHorizontal Flow FieldRotational Flow Field
Surface Velocity (10−3 m/s)Internal Velocity
(10−3 m/s)
Surface Velocity (10−3 m/s)Internal Velocity (10−3 m/s)
N3.71.51.960.76
D4.51.785.32.5
FRD6.54.655.112.21
IWP4.93.183.72.1
G4.52.53.661.98
Table 7. Performance comparison and recommended applications of TPMS-PCRs.
TPMS TypeVelocities in Horizontal Flow FieldVelocities in Rotational Flow FieldOptimal Flow ConditionsRecommended Applications
FRDHighest surface (6.5 × 10⁻³ m/s) and internal (4.65 × 10⁻³ m/s) velocitiesSignificant velocity reduction at surface (5.11→2.21 × 10⁻² m/s)High-turbulenceIndustrial wastewater treatment;
High-flow recirculation systems;
Processes requiring frequent catalyst-surface contact
DRelatively high surface velocity (4.5 × 10⁻³ m/s)Notable internal velocity decrease (5.3→2.5 × 10⁻² m/s)Moderate-high turbulenceMedium-scale water treatment;
Scenarios requiring high surface flow velocity
IWPBalanced velocity distribution (surface: 4.9→3.18 × 10⁻³ m/s)Maintains relatively stable internal flow (3.7→2.1 × 10⁻² m/s)Stable flowContinuous flow systems;
Applications needing consistent internal flow
GModerate surface velocity (4.5→2.5 × 10⁻³ m/s)Minimal internal velocity attenuation (3.66→1.98 × 10⁻² m/s)Low-flowLaboratory-scale reactions;
Low-energy systems;
Light-limited conditions
NLow energy dissipation (3.7→1.5 × 10⁻³ m/s)Relatively small internal velocity reduction (1.96→0.76 × 10⁻² m/s)Static/low-flowBatch processing;
Small-volume degradation;
High-surface-area applications
Disclaimer/Publisher’s Note: The statements, opinions and data contained in all publications are solely those of the individual author(s) and contributor(s) and not of MDPI and/or the editor(s). MDPI and/or the editor(s) disclaim responsibility for any injury to people or property resulting from any ideas, methods, instructions or products referred to in the content.