Article

Experimental Study on Static Ice Adhesion Characteristics of Wind Turbine Blade Surfaces After Sand Erosion

1
College of Mechanical and Electrical Engineering, Hebei Normal University of Science and Technology, Qinhuangdao 066000, China
2
Hebei Technology Innovation Center of Photovoltaic Module Manufacturing Equipment, Hebei Normal University of Science and Technology, Qinhuangdao 066000, China
3
School of Metallurgy and Energy, North China University of Science and Technology, Tangshan 063210, China
*
Author to whom correspondence should be addressed.
Coatings 2025, 15(8), 955; https://doi.org/10.3390/coatings15080955
Submission received: 15 July 2025 / Revised: 9 August 2025 / Accepted: 12 August 2025 / Published: 15 August 2025

Abstract

To investigate how sand erosion impacts the anti-icing performance of wind turbine blade surfaces, this study experimentally examines the individual and interactive effects of four key factors—the freezing temperature, separation temperature, surface roughness of eroded blade coatings, and loading rate on ice adhesion properties.The results from single-factor analyses reveal that the ice adhesion strength increases linearly with decreasing separation temperature. A more nuanced relationship emerges when considering the freezing temperature relative to the separation temperature: when the freezing temperature exceeds the separation temperature, the adhesion strength rises linearly as the separation temperature drops; conversely, when the freezing temperature is lower than the separation temperature, the adhesion strength decreases linearly with falling separation temperature. Higher loading rates correlate with reduced ice adhesion, while increased surface roughness induced by sand erosion leads to greater adhesion strength. Orthogonal array testing demonstrates the hierarchy of these factors’ influence on post-erosion ice adhesion, as follows: separation temperature > loading rate > freezing temperature > surface roughness of sand-eroded coatings. Notably, the separation temperature and loading rate exert the most significant effects. Furthermore, a regression equation for ice adhesion strength is established based on orthogonal test results, which can effectively predict ice adhesion strength under untested parameter combinations. These findings provide critical foundational data and a reliable theoretical tool to inform the development and optimization of practical de-icing systems in engineering applications.

Graphical Abstract

1. Introduction

Against the backdrop of the accelerated global energy transition toward low-carbon solutions, wind energy has emerged as a cornerstone of sustainable energy development due to its abundance and clean, pollution-free attributes [1,2,3]. Wind turbines operating in the long term in field environments face extreme climatic conditions [4], including high winds [5], lightning [6,7], wind–sand erosion [8,9,10], and subzero temperatures [11,12,13]. While vast cold regions offer advantages for wind energy generation due to the higher air density and wind speeds in these locations [14], ice accretion on blades represents a particularly severe challenges in cold-humid zones [15]. Ice formation degrades the aerodynamic profiles of turbine blades, reducing their power output [16,17]. Severe icing events may trigger complete turbine shutdowns [7], causing widespread grid instability. Concurrently, ice-induced weight gain and imbalanced vibration [7,18], impose substantial fatigue loads on tower bases and nacelle hubs [19]. These critical issues underscore the imperative for de-icing technology research.
The essence of wind turbine de-icing lies in disrupting ice-substrate interactions through physical, chemical, or thermodynamic means [20], enabling safe and efficient ice-turbine separation. Ice adhesion primarily originates from mechanical interlocking (the embedment of ice onto surface with microscale roughness) and intermolecular forces (van der Waals forces, and hydrogen bonding) [21]. Understanding the ice adhesion properties at the blade interface is pivotal for developing deicing systems, as this informs the selection of de-icing methods and technical pathways based on the quantitative characteristics of adhesive strength. Understanding these properties also enable the structural parameters of mechanical, thermal, and hydrodynamic de-icing devices to be optimized, validates the de-icing efficacy and reliability under extreme operating condition simulations, and underpins the formulation of industry standards and optimized design practices [22,23]. Consequently, extensive research has been conducted: Mu et al. systematically analyzed the ice adhesion strength under varying salt concentrations, ambient temperatures, and wind speeds via wind tunnel tests [24]; Piscitelli et al. focused on measuring ice adhesion measurement with superhydrophobic coatings [25]; Shi experimentally investigated the icing and adhesion characteristics of NACA0018 and S809 airfoils, quantifying the wind speed’s effects on the ice adhesion strength [26]; and Shen et al. performed systematic experiments using an icing wind tunnel and a custom adhesion measurement apparatus to quantify the impacts of the temperature, material, airfoil geometry, and angle of attack on ice accretion patterns and adhesion performance [27]. However, under real-world conditions, painted blade surfaces subjected to prolonged wind–sand erosion develop minute pits, protrusions, and scratches [28]. Zou et al. Samples with high roughness were prepared using sandblasting technology. It was found that compared with the rougher sandblasted surfaces, the smoother sample surfaces at the time of reception had lower ice adhesion strength [29]. Hassan et al. used a forced vibration method of a cantilever composite beam at 10.0 Hz was used to study the interfacial fracture at the gold–ice interface. Low-cost strain gauges were used instead of the piezoelectric PVDF sensors employed in other reported studies for adhesion strength measurements. It was found that increasing surface roughness leads to higher interfacial bonding strength [30]. Schulz et al. used finite element method tools to analyze the stress state at the ice-substrate interface under different loading conditions, aiming to gain an in-depth understanding of stress distribution. It was found that stress and peeling stress concentrations occur at the points where stress is transmitted through the interface. Ice under rapid loading has lower strength because ice reacts in a more brittle manner [31]. Sivakumar et al. experimentally evaluated the ice adhesion on aluminum and polyurethane with three different surface roughnesses and two different surface sizes, and found that surface roughness significantly increased the adhesion [32]. Aoyama et al. studied the influence of the arithmetic mean height and arithmetic mean gradient of solid surfaces on the adhesive shear strength between pure ice and copper plates. It was found from the geometric model that the gradient is more important than the adhesion height, because the area expansion rate and force components depend on the gradient [33]. These features alter the intrinsic adhesion strength through mechanical interlocking during ice formation. Quantitative studies in this domain remain scarce. Specifically, this study aims to clarify: the individual and interactive effects of key factors such as freezing temperature, separation temperature, surface roughness caused by sand erosion, and strain rate on the ice adhesion strength of wind turbine blade surfaces after sand erosion, as well as the quantitative characteristics of these effects. The quantitative research results can provide critical foundational reference data for the development of deicing systems, helping to optimize the structural parameters of deicing devices, select appropriate deicing principles and technical pathways, and provide data support for verifying the deicing efficacy and reliability under extreme operating conditions.
In this study, we first fabricated wind turbine blade test specimens with polyurethane primer and topcoat using a spin-coating apparatus. These specimens were then subjected to sand erosion via a custom-built wind–sand erosion simulation setup, with varying erosion durations, to obtain samples with different surface roughness ( R a ) values. Subsequently, static tangential ice adhesion tests were conducted to examine the effects of key factors—freezing temperature, separation temperature, loading rate, and sand erosion-induced surface roughness—on ice adhesion properties. Through both single-factor analyses and multi-factor coupling experiments (orthogonal array tests), we quantitatively characterized the static ice adhesion characteristics of sand-eroded wind turbine blade surfaces, aiming to provide critical foundational data for the development of practical de-icing systems in engineering applications.

2. Test Devices and Methods

2.1. Coating Preparation

Wind turbines operate for long periods of time in field environments exposed to weathering effects, necessitating protective coatings; these come into contact with ice that forms on wind turbine surfaces. To replicate this process, specimens for ice adhesion testing were prepared using the spin-coating apparatus shown in Figure 1. The apparatus consists of a support base, a high-speed motor, and a specimen fixture. Before spin-coating, the test piece was installed and fixed on the test piece fixing device, and a commercial wind turbine coating was dripped onto the center test piece using a dropper; During spin-coating, the high-speed motor rotated the fixed parts of the test piece, using centrifugal force to evenly spread the coating; During the coating preparation process, the laboratory indoor environment was selected, with an indoor temperature of 25 °C and an environmental humidity of 35%. After spin-coating, the test piece was placed in a drying oven (model 202-00S) for curing, with a curing time of 24 h and a drying temperature of 65 °C. The coating thickness was measured using a coating thickness gauge to form a film layer similar to that of a wind turbine blade coating on the surface of the test piece. This process forms coating films on specimens that simulate wind turbine blade coatings, facilitating related performance studies. In this research, 30   mm × 30   mm × 1   mm , stainless steel 304 specimens substituted wind turbine blades fabricated from glass-fiber-reinforced polymer composites, with a 200   μ m thick polyurethane primer and 40   μ m thick polyurethane topcoat onto specimen surfaces. The rationale for this selection lies in the fact that during actual wind turbine icing, the ice layer primarily interacts with the protective coating on the blade surface. Thus, the core factor influencing ice adhesion strength is the performance of the coating rather than the substrate itself. When the same thickness of dedicated wind turbine protective coating is applied via spin coating, both 304 stainless steel and GFRP substrates can accurately characterize ice adhesion properties. Additionally, the coating thickness gauge utilized in this experiment is exclusively compatible with metal substrates, and 304 stainless steel facilitates precise control over the thickness of the spin-coated coating. For these reasons, 304 stainless steel specimens were chosen as substitutes for GFRP-based wind turbine blades.

2.2. Sand Erosion Wear Simulation Device

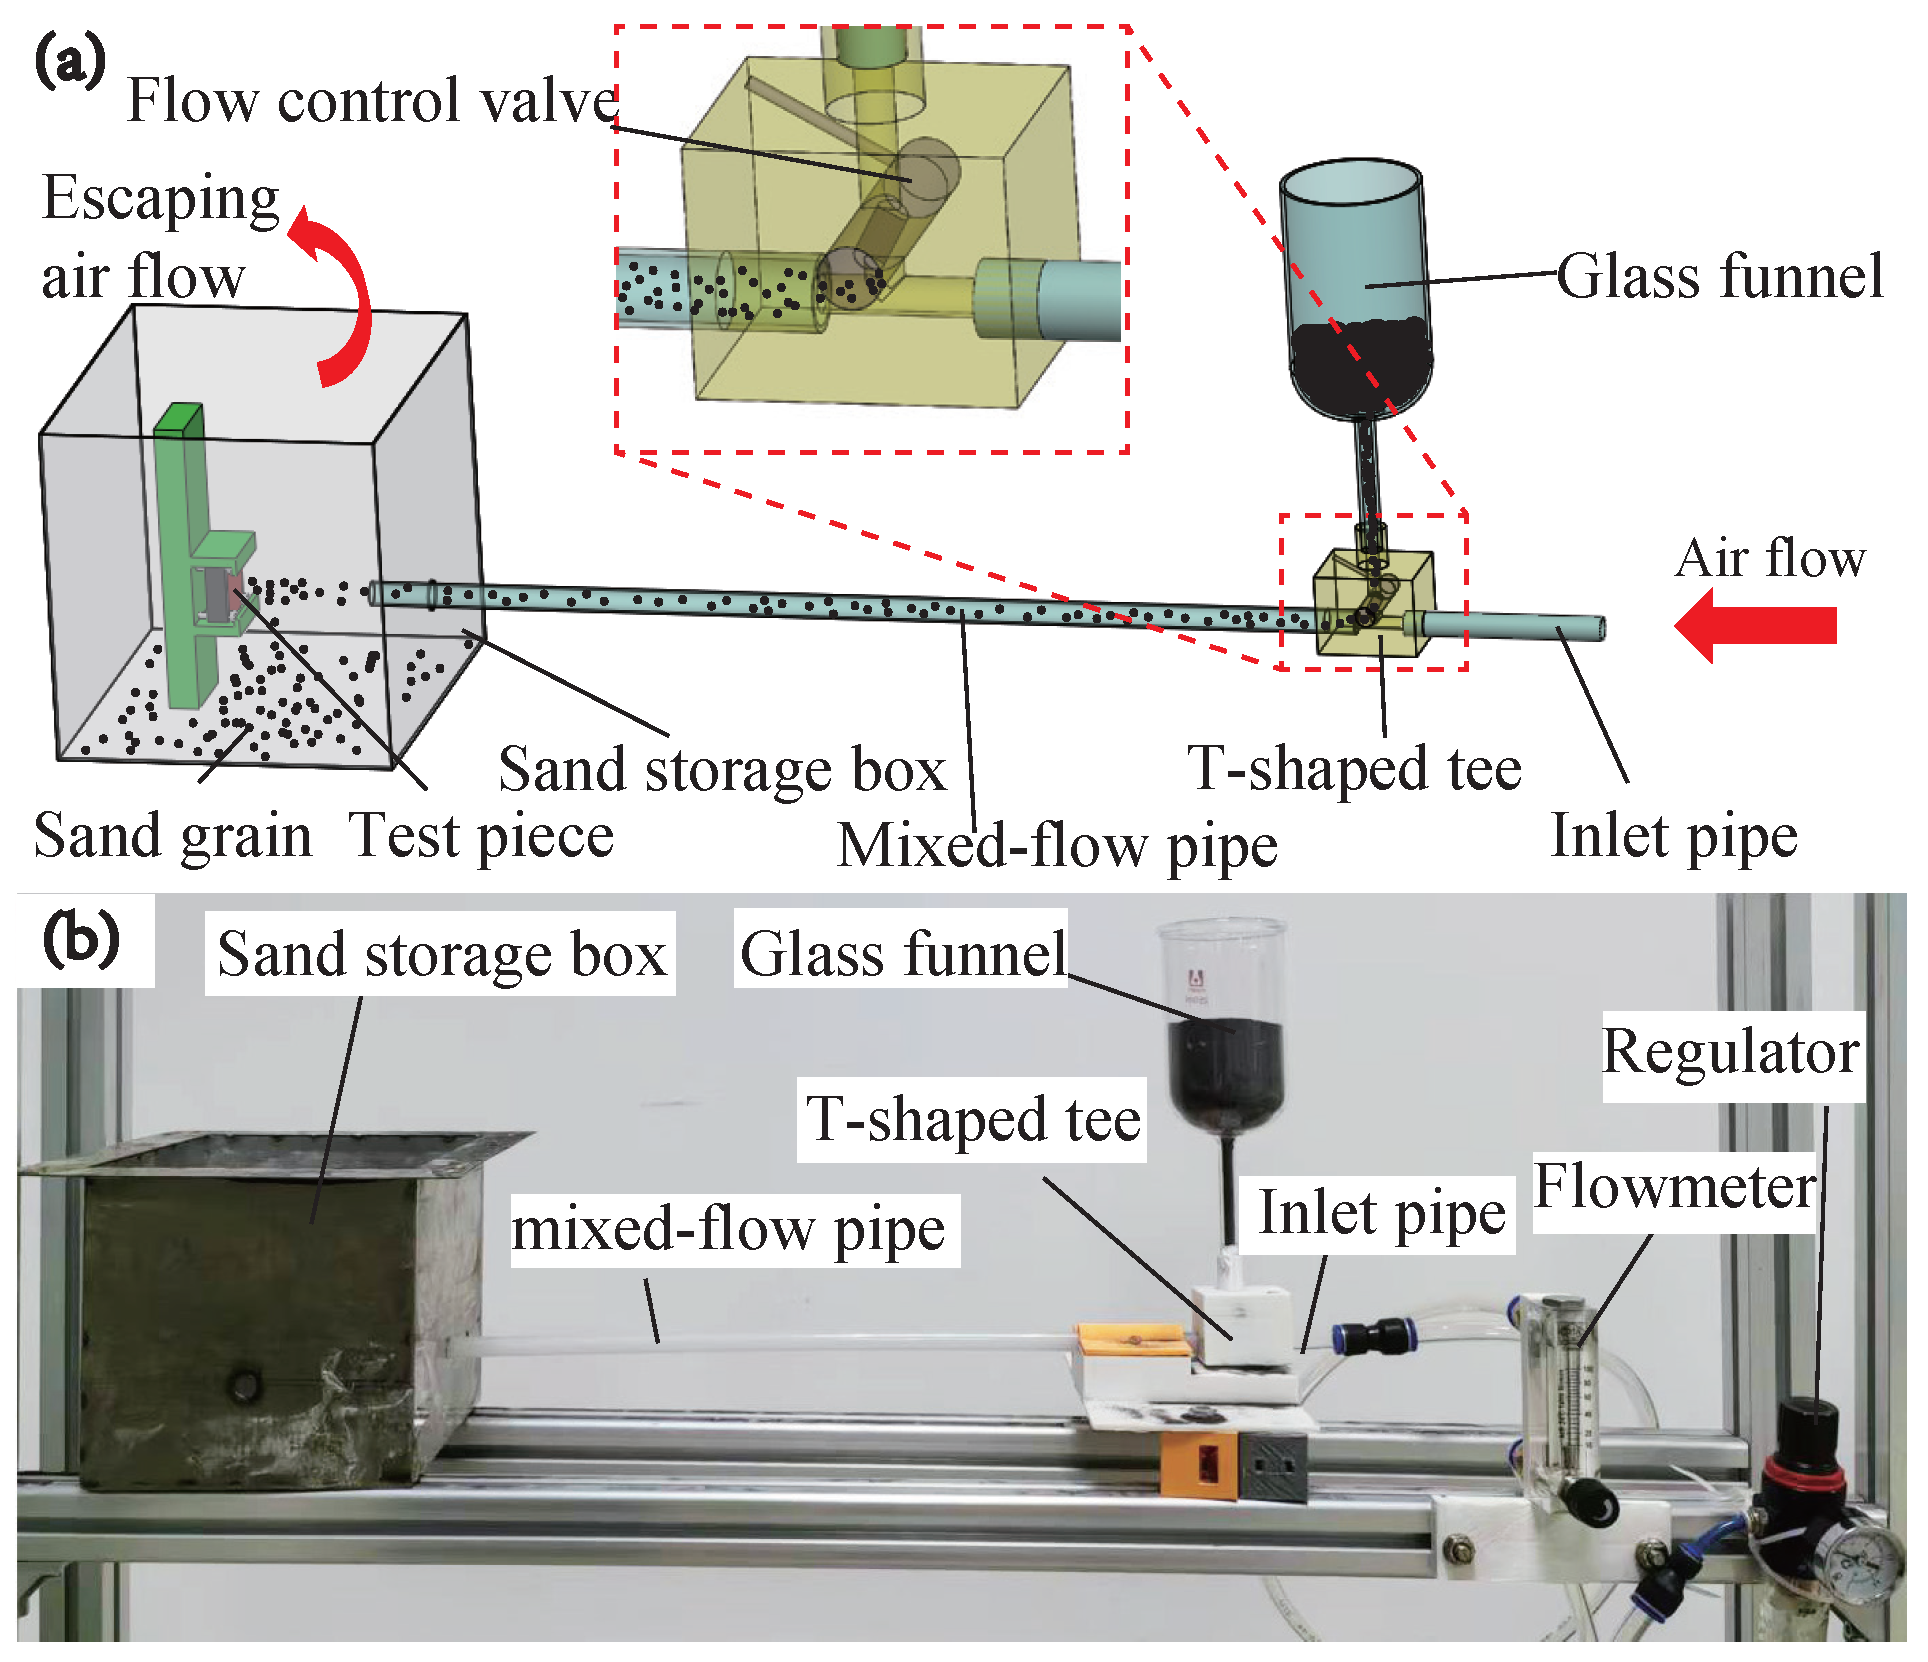
To obtain specimens with varying surface roughnesses after wind–sand erosion, erosion tests were conducted on the spin-coated specimens using the wind-sand erosion simulation apparatus shown in Figure 2. The procedure was as follows: A glass funnel containing test sand particles was connected vertically to the vertical section of a T-shaped tee. Sand particles fell into the vertical section of the T-shaped tee under gravity. By adjusting the rotation angle of the flow control valve on the vertical pipe, the quantity of sand was regulated. air of an adjustable flow rate and pressure entered the horizontal section of the T-shaped tee pipe. This airflow carried sand particles through the horizontal outlet into a mixed flow tube. Particles were accelerated within the tube before impacting the vertically mounted specimens to achieve erosion. Employing gravity, the post-impact sand particles fell into a collection sandbox by gravity while loss of air flow was lost through the sandbox’s opening.
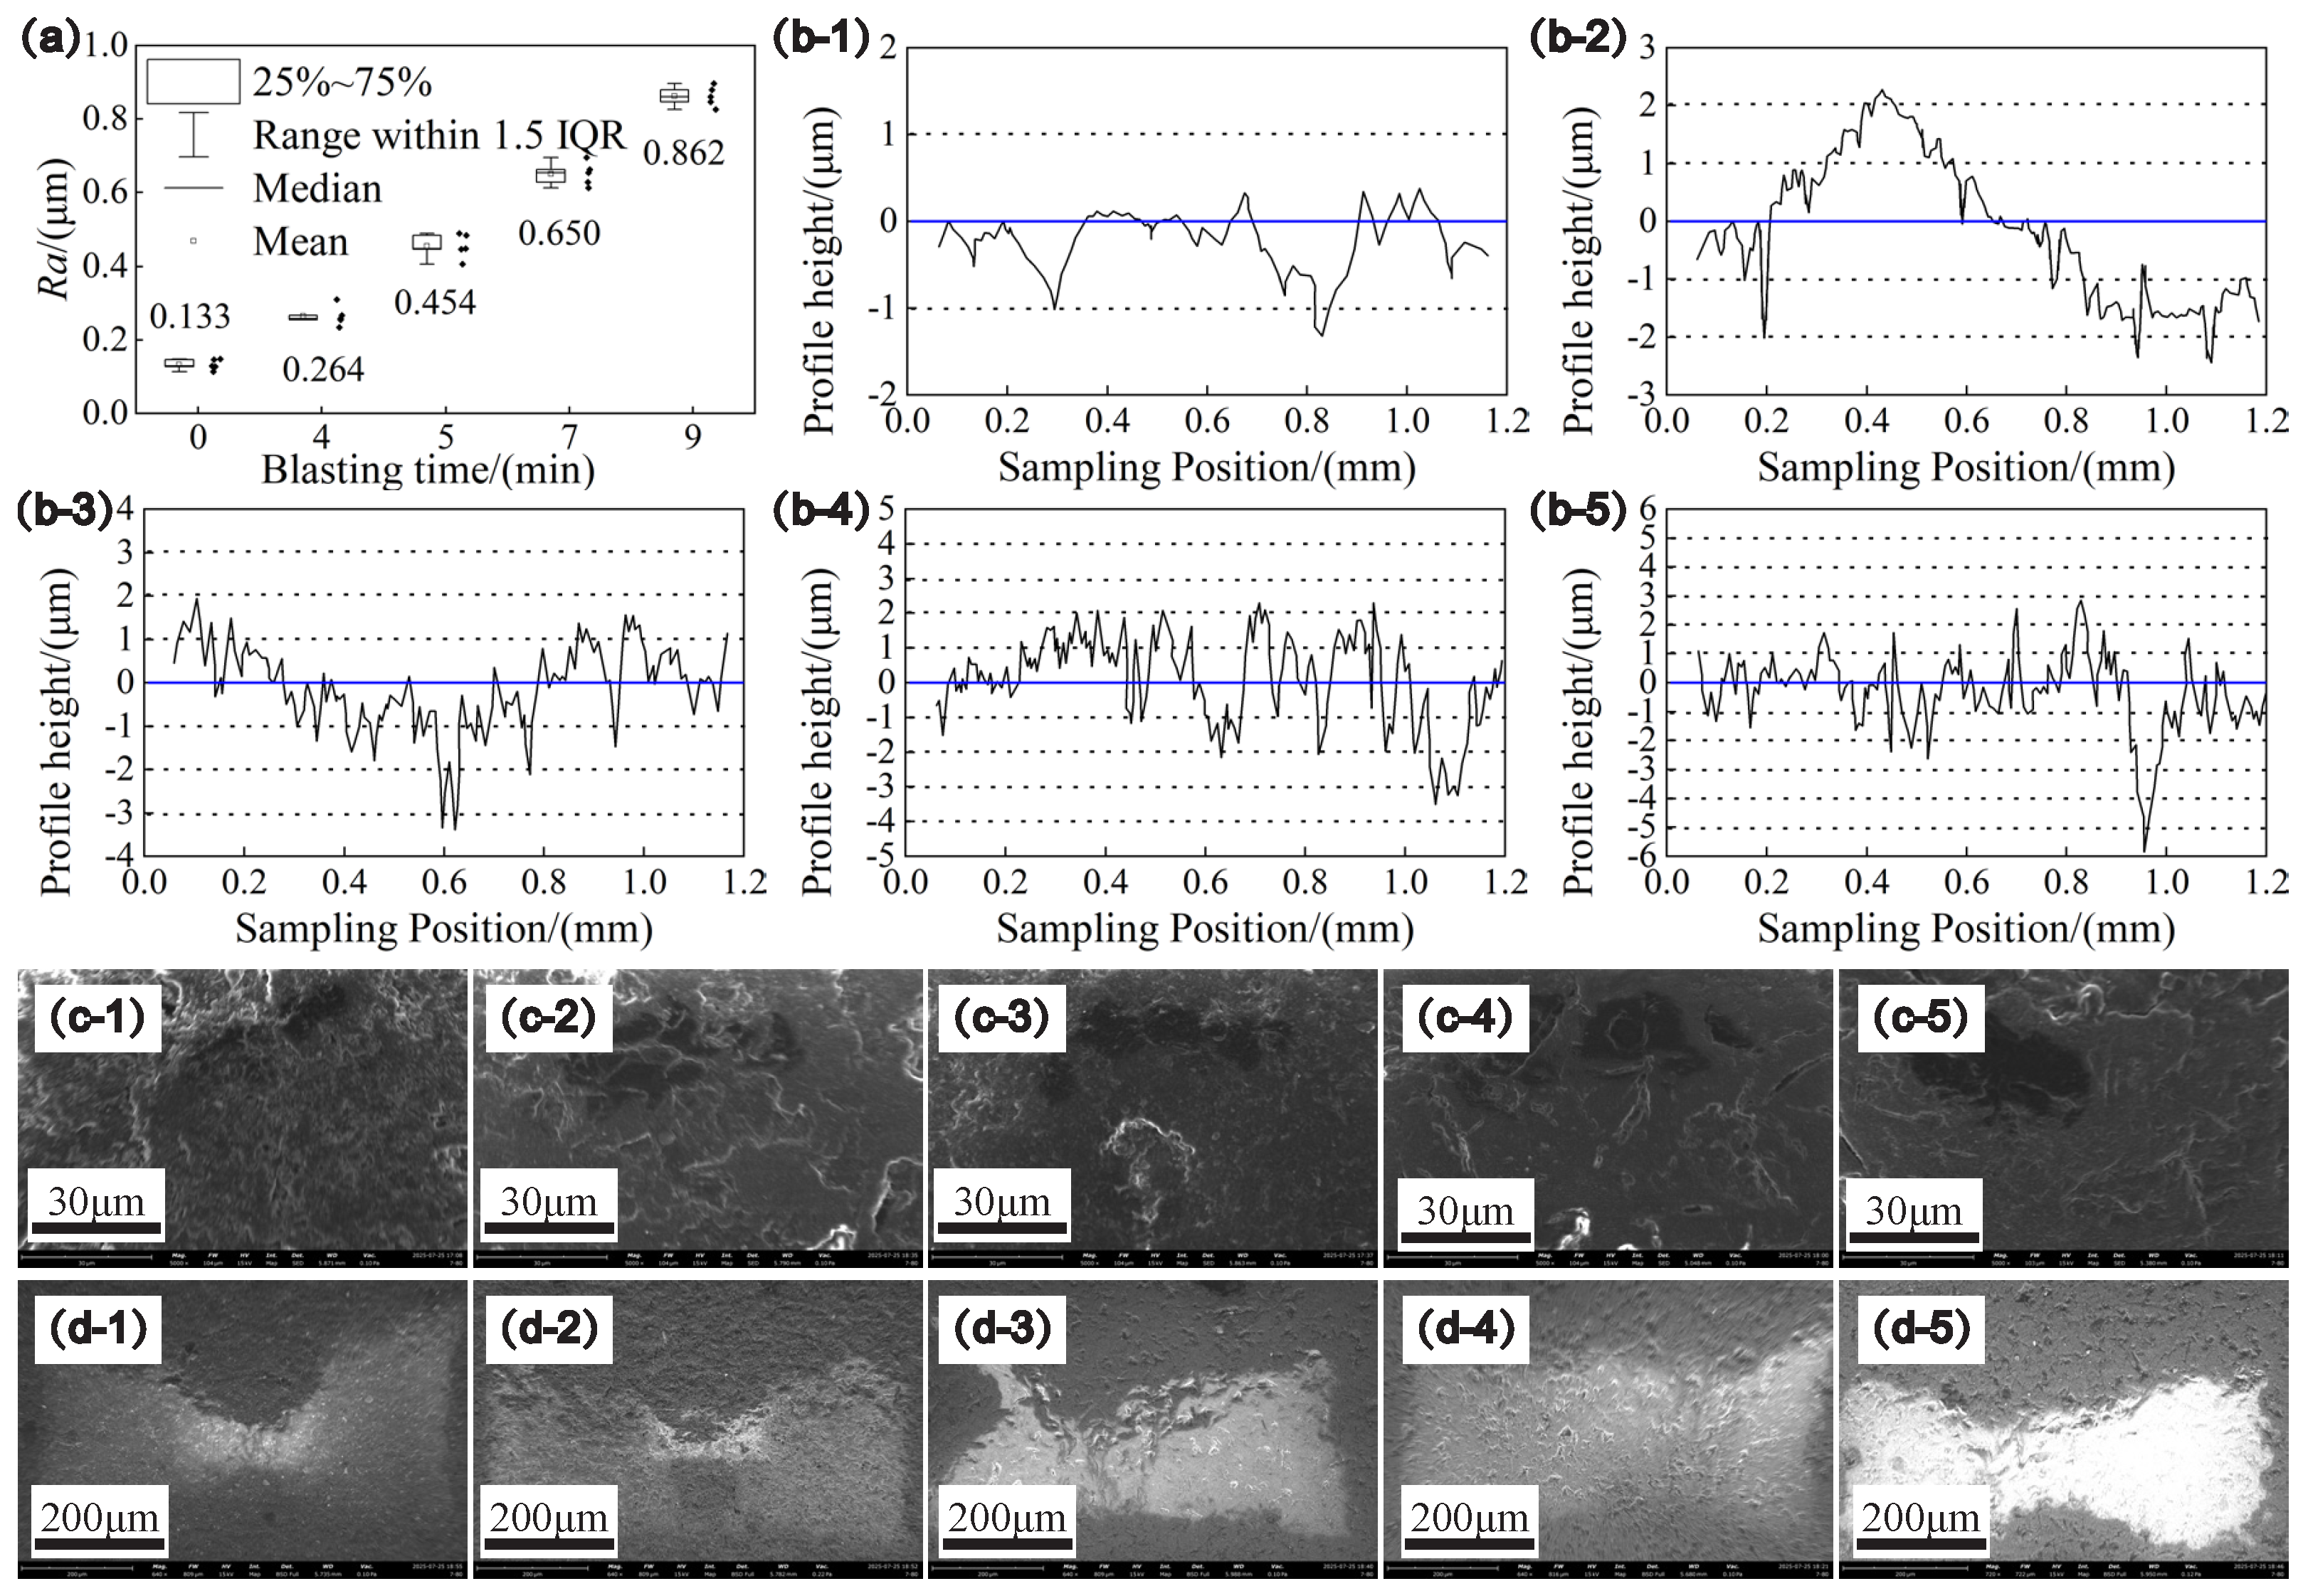
In this study, 0.25–0.35 mm test sand particles were selected to conduct erosion tests on spin-coated specimens under an impact airflow velocity of 12 m/s and sandblasting rate of 0.517 g/s. Specimens with progressively increasing surface roughness R a were obtained after applying varying erosion durations. Surface roughness measurements were conducted using a roughness tester (TR200), with which five random points within a 10 mm diameter central area were measured, and the average of the results was given as the final R a value. Five repeated tests were performed for each R a level. Figure 3 illustrates the distribution law of surface roughness for test pieces under varying erosion times. Figure 3a statistically presents roughness R a data corresponding to different erosion durations via box plots, revealing the discreteness and central tendency of roughness during the erosion process. As the erosion time increases, the average value of R a gradually rises from R a = 0.133   μ m , and the interquartile range (IQR) expands, reflecting the aggravation of differences in surface undulations. Through this calibration, test pieces with R a values of 0.2, 0.4, 0.6, and 0.8 were obtained for subsequent experimental research. The contour curves in Figure 3(b-1–b-5) correspond to typical test results with R a = 0.1 ,   0.2 ,   0.4 ,   0.6 ,   0.8   μ m . The fluctuation amplitude of the curves increases significantly with the increase in R a , demonstrating the shaping effect of sandblasting erosion on the surface micro-profile. When the R a value is low, the surface is relatively flat; when the R a value is high, due to the continuous impact and cutting of the abrasive, deeper and more irregular peak–valley structures are formed. The SEM images in Figure 3(c-1–c-5,d-1–d-5) confirm this change from the microscopic morphology: when the R a value is low, only fine scratches and shallow pits remain on the surface. After the erosion time is prolonged and the R a value increases, the mechanical action of the abrasive causes more dense pits and gullies to appear on the surface of the paint layer. Even local coatings may crack and peel off due to impact stress, revealing that sandblasting gradually constructs a rough structure over time through the mechanism of “abrasive kinetic energy impact-surface material peeling/plastic deformation”.

2.3. Method for Testing Tangential Adhesive Force of Ice Coating

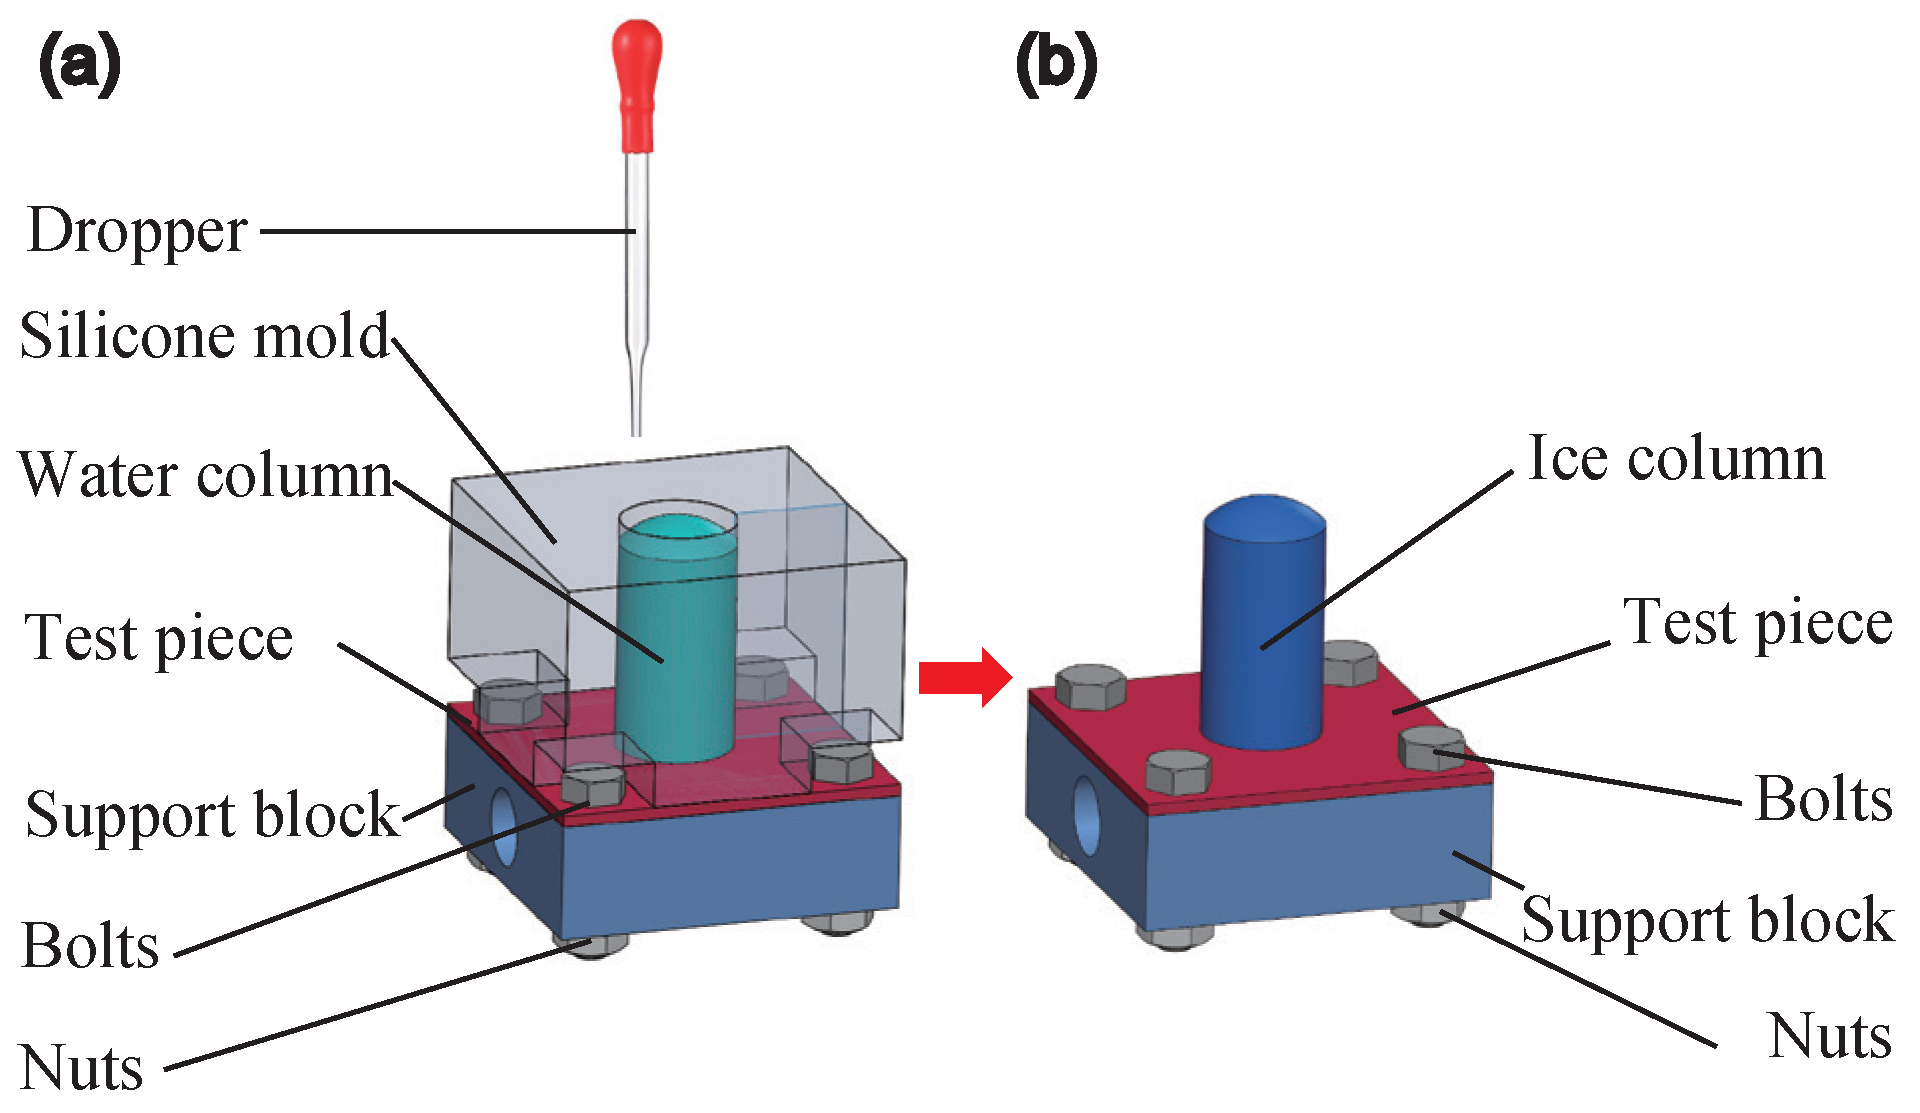
For ice adhesion testing, frozen specimens were prepared using the method illustrated in Figure 4. The test piece was secured to the fixed block with fastening bolts and nuts. A silicone block with a cylindrical cavity was positioned onto the test piece. The sample was pre-cooled in a low-temperature chamber to the target freezing temperature T 0 . Distilled water at 25 °C as injected into the cavity using a dropper. After the water completely froze at T 0 , the silicone block was removed to obtain a frozen ice cylinder–plate specimen. The resulting cylindrical ice measuring ϕ 10   mm × 20   mm .
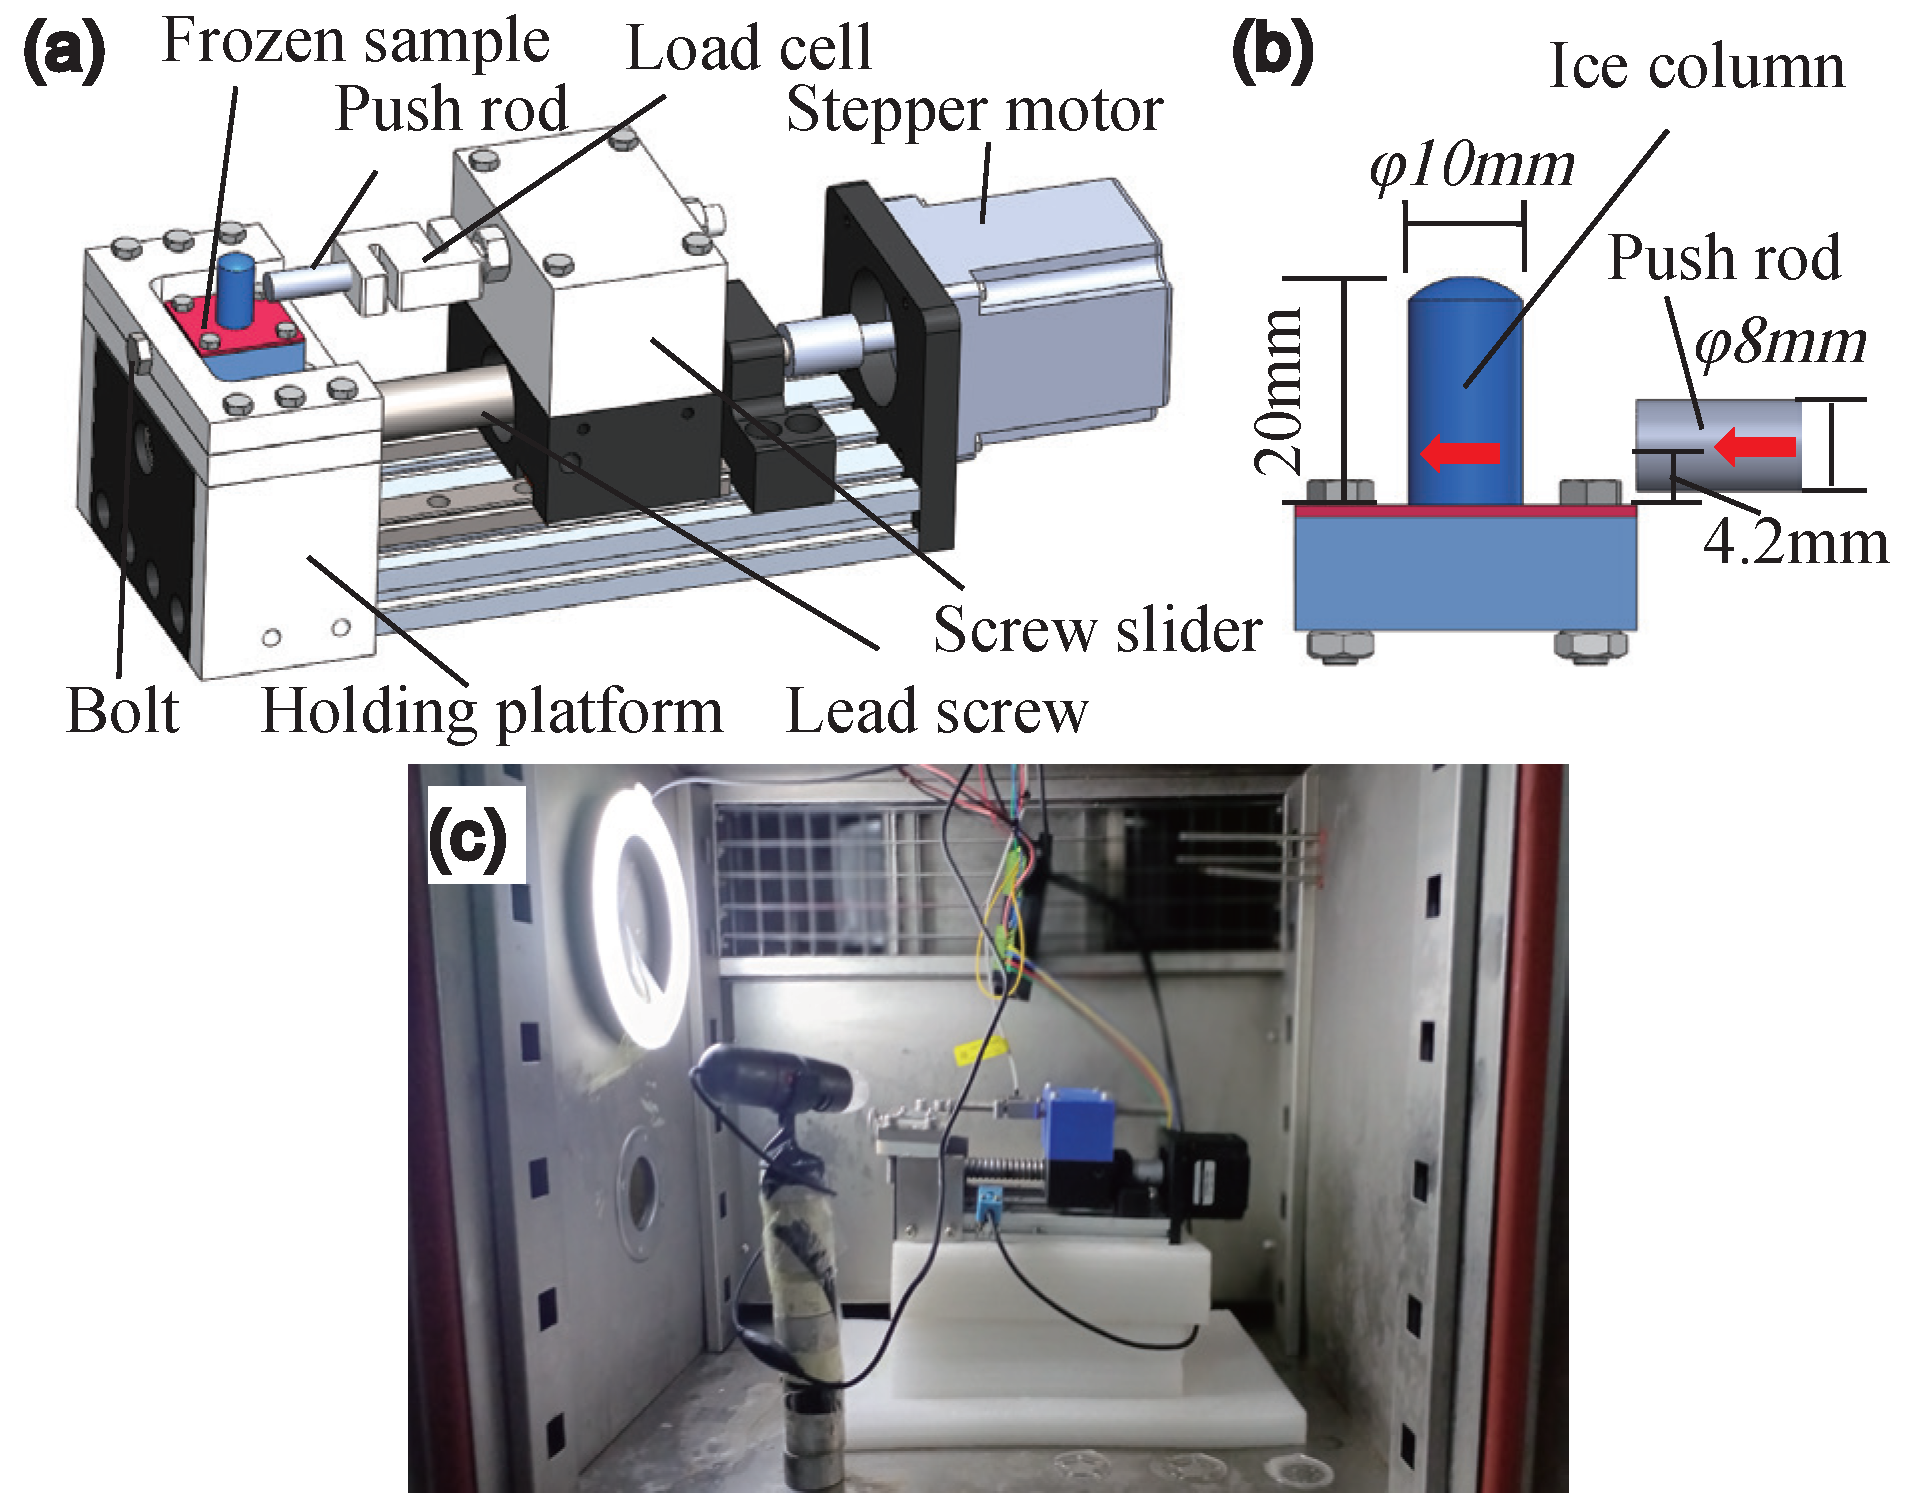
The ice adhesion strength was tested using a quasi-static method as shown in Figure 5. The frozen specimen was secured to a fixed platform using fastening bolts. During testing, a stepper motor drove a traverse sled horizontally along linear rails. A dynamometer mounted on the sled was connected to a pusher rod. As the sled advanced, the rod pushed the cylindrical ice tangentially off the plate component at the push rod speed v, The dynamometer recorded the real-time force applied to the ice during de-icing. The pusher rod measured ϕ 8   mm in diameter, with its center line positioned 4.2 mm from the plate surface. The entire experimental system was housed within a low-temperature chamber set to the separation temperature T 1 , or was placed in the chamber at least one hour before testing to ensure the thermal equilibrium of both the ice and plate. The de-icing process was simultaneously recorded on video. When the contact area between the ice and plate is A and the measured force is Fτ, tangential adhesion strength satisfies Equation (1):
τ = F τ A

3. Results and Analysis

3.1. Influence of Separation Temperature T 1 on Ice Adhesion Strength

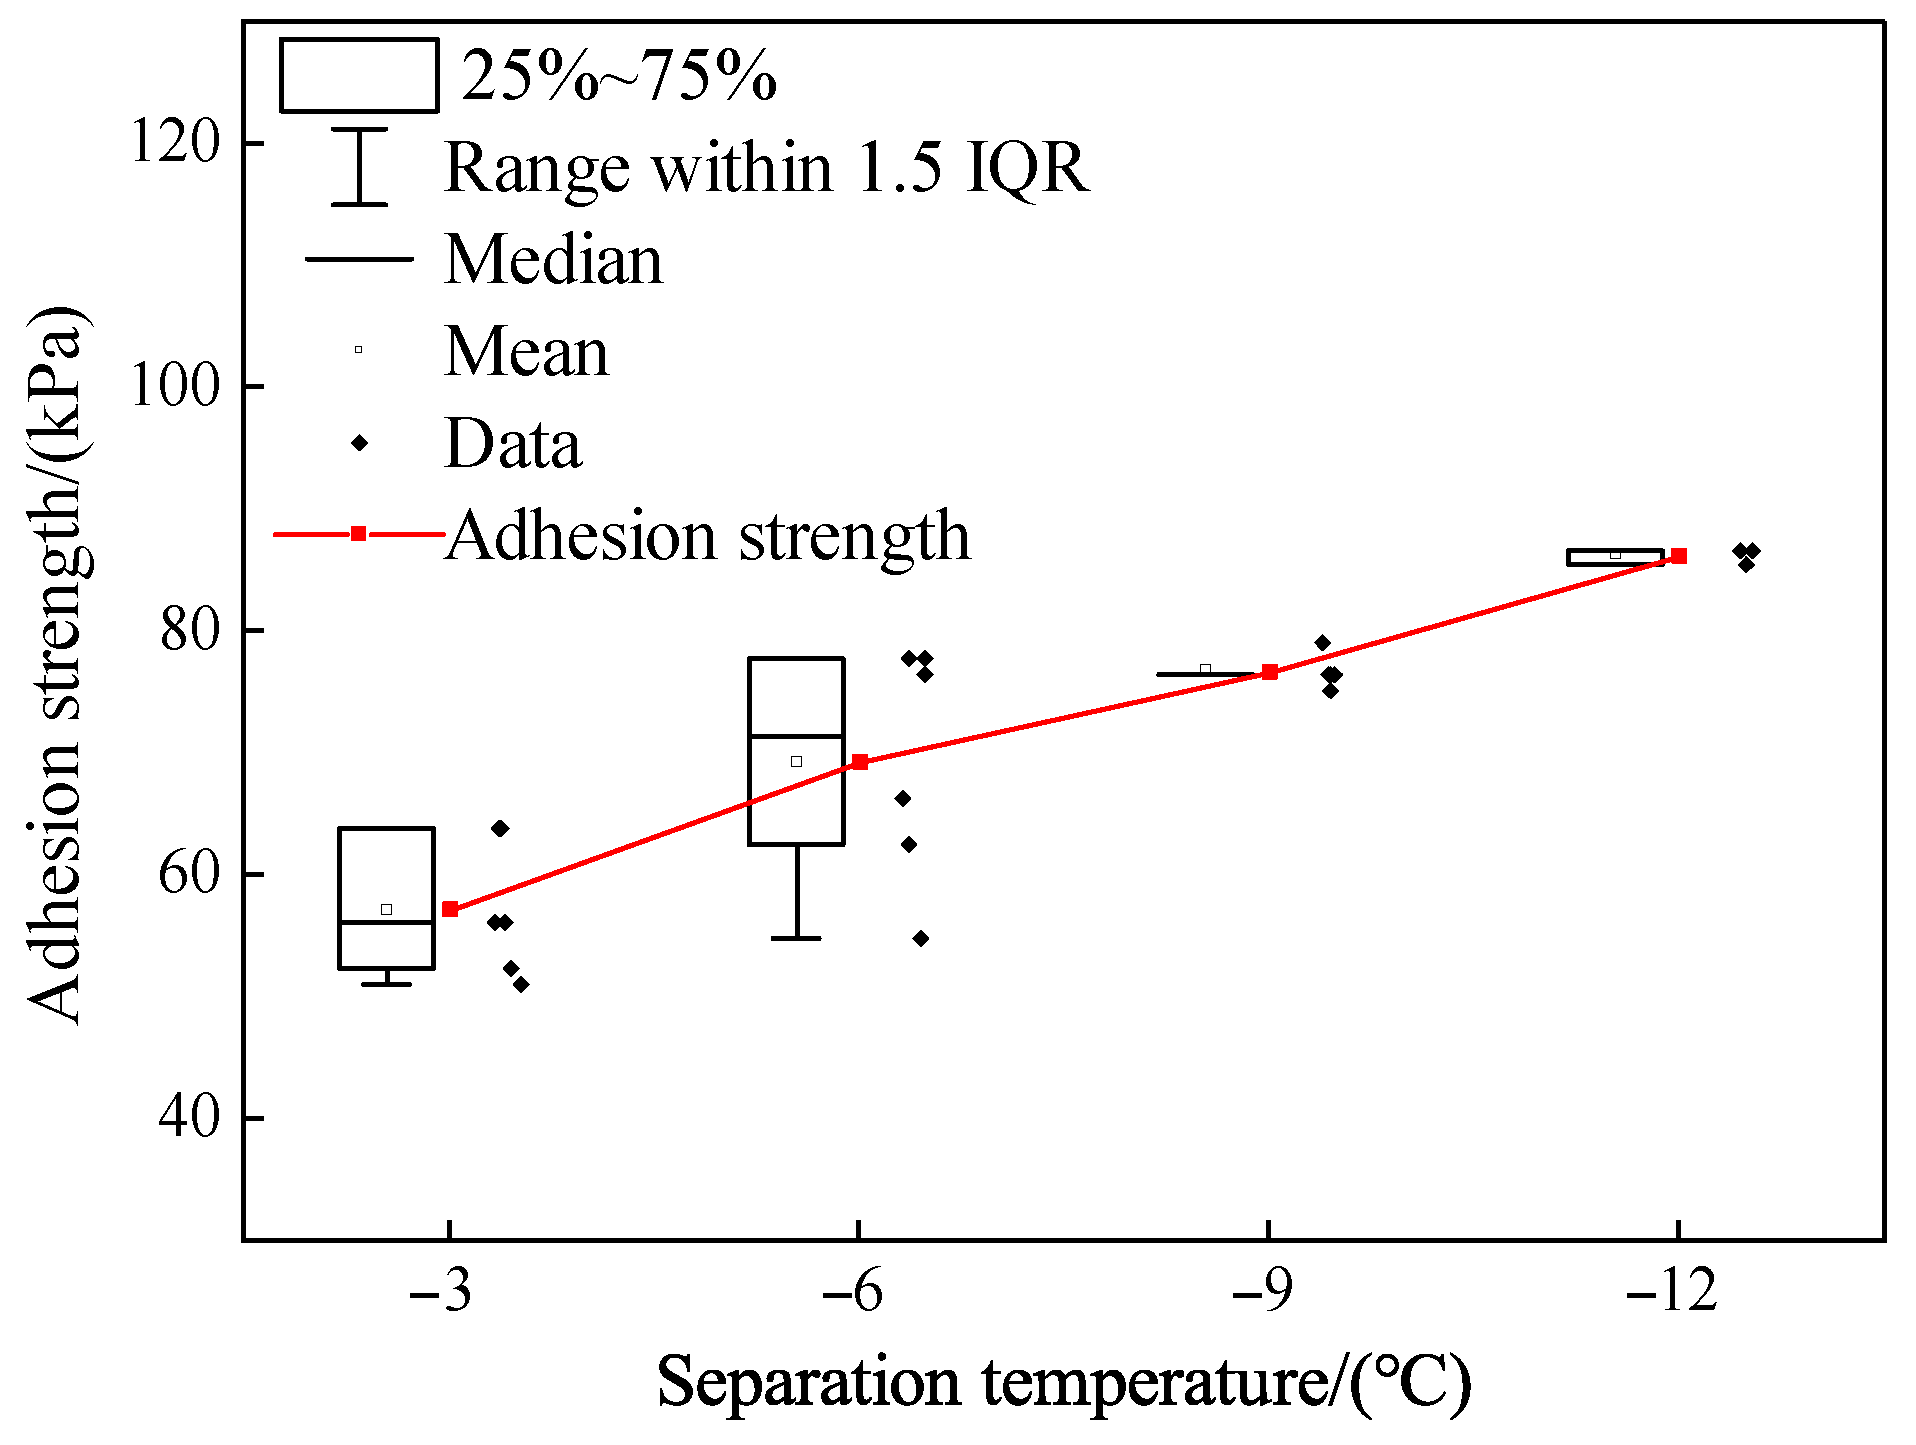
Investigating the effect of the separation temperature T 1 on the ice adhesion strength τ elucidates the challenge of ice detachment in varying low-temperature environments. Tests were conducted with T 1 was set to −3 °C, −6 °C, −9 °C, and −12 °C, with the following fixed parameters: freezing temperature T 0 = −9 °C, loading rate v = 1 mm/s, and specimen surface roughness R a = 0.264   μ m . Figure 6 illustrates the relationship between T 1 and τ . As the separation temperature decreased, the ice adhesion strength increased monotonically, consistent with existing studies [21,24,34]. Lower temperatures facilitate denser crystalline structures at ice–substrate interfaces, enhancing the interfacial molecular interactions and thereby strengthening adhesion.

3.2. Influence of Freezing Temperature T 0 on Ice Adhesion Strength

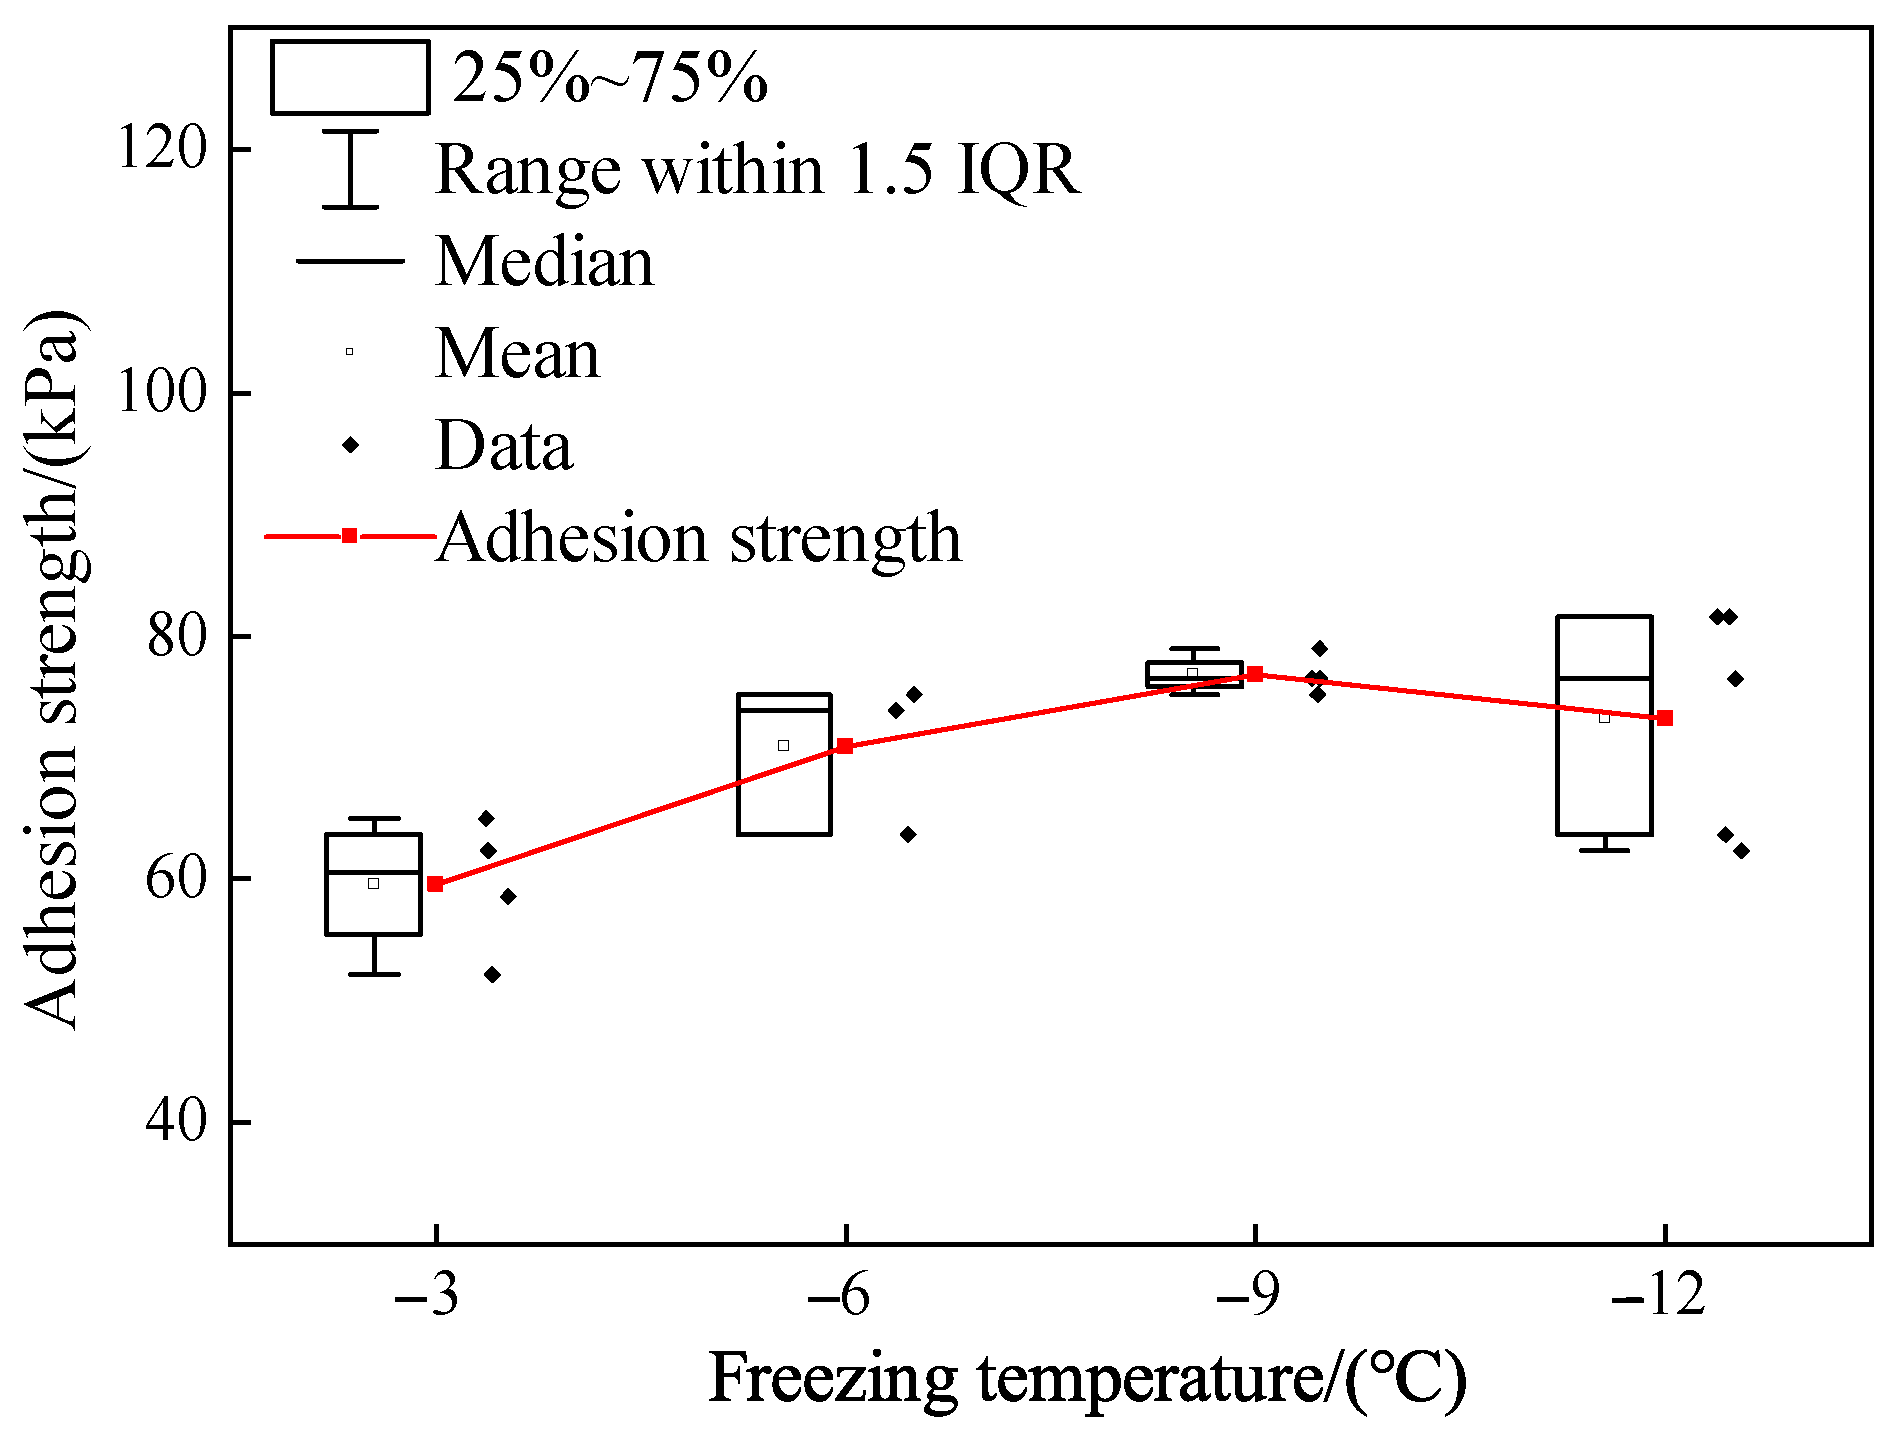
Measuring the effect of freezing temperature T 0 on the ice adhesion strength τ is significant as it enables an exploration of the variation law of the ice adhesion strength after water droplets impinge on wind turbine blades and freeze under different low-temperature conditions. Tests were conducted at T 0 = −3 °C, −6 °C, −9 °C, and −12 °C, with the following fixed parameters: separation temperature T 1 = −9 °C, loading rate v = 1 mm/s, and specimen surface roughness R a = 0.264   μ m . The relationship between T 0 and τ is shown in Figure 7. The ice adhesion strength exhibited an initial increase followed by a decrease as the freezing temperature declined, peaking at −9 °C. Since T 1 was fixed at −9 °C in this single-factor test, When T 1 < T 0 , the adhesion strength increased monotonically (with a mechanism identical to that described in Section 2.1). When T 1 > T 0 , differential thermal expansion at the ice–substrate interface induced partial bond failure and ice cracking, reducing the adhesion strength. This phenomenon underscores the coupling effect between freezing and separation temperatures [20,21].

3.3. Influence of Loading Rate on Ice Adhesion Strength

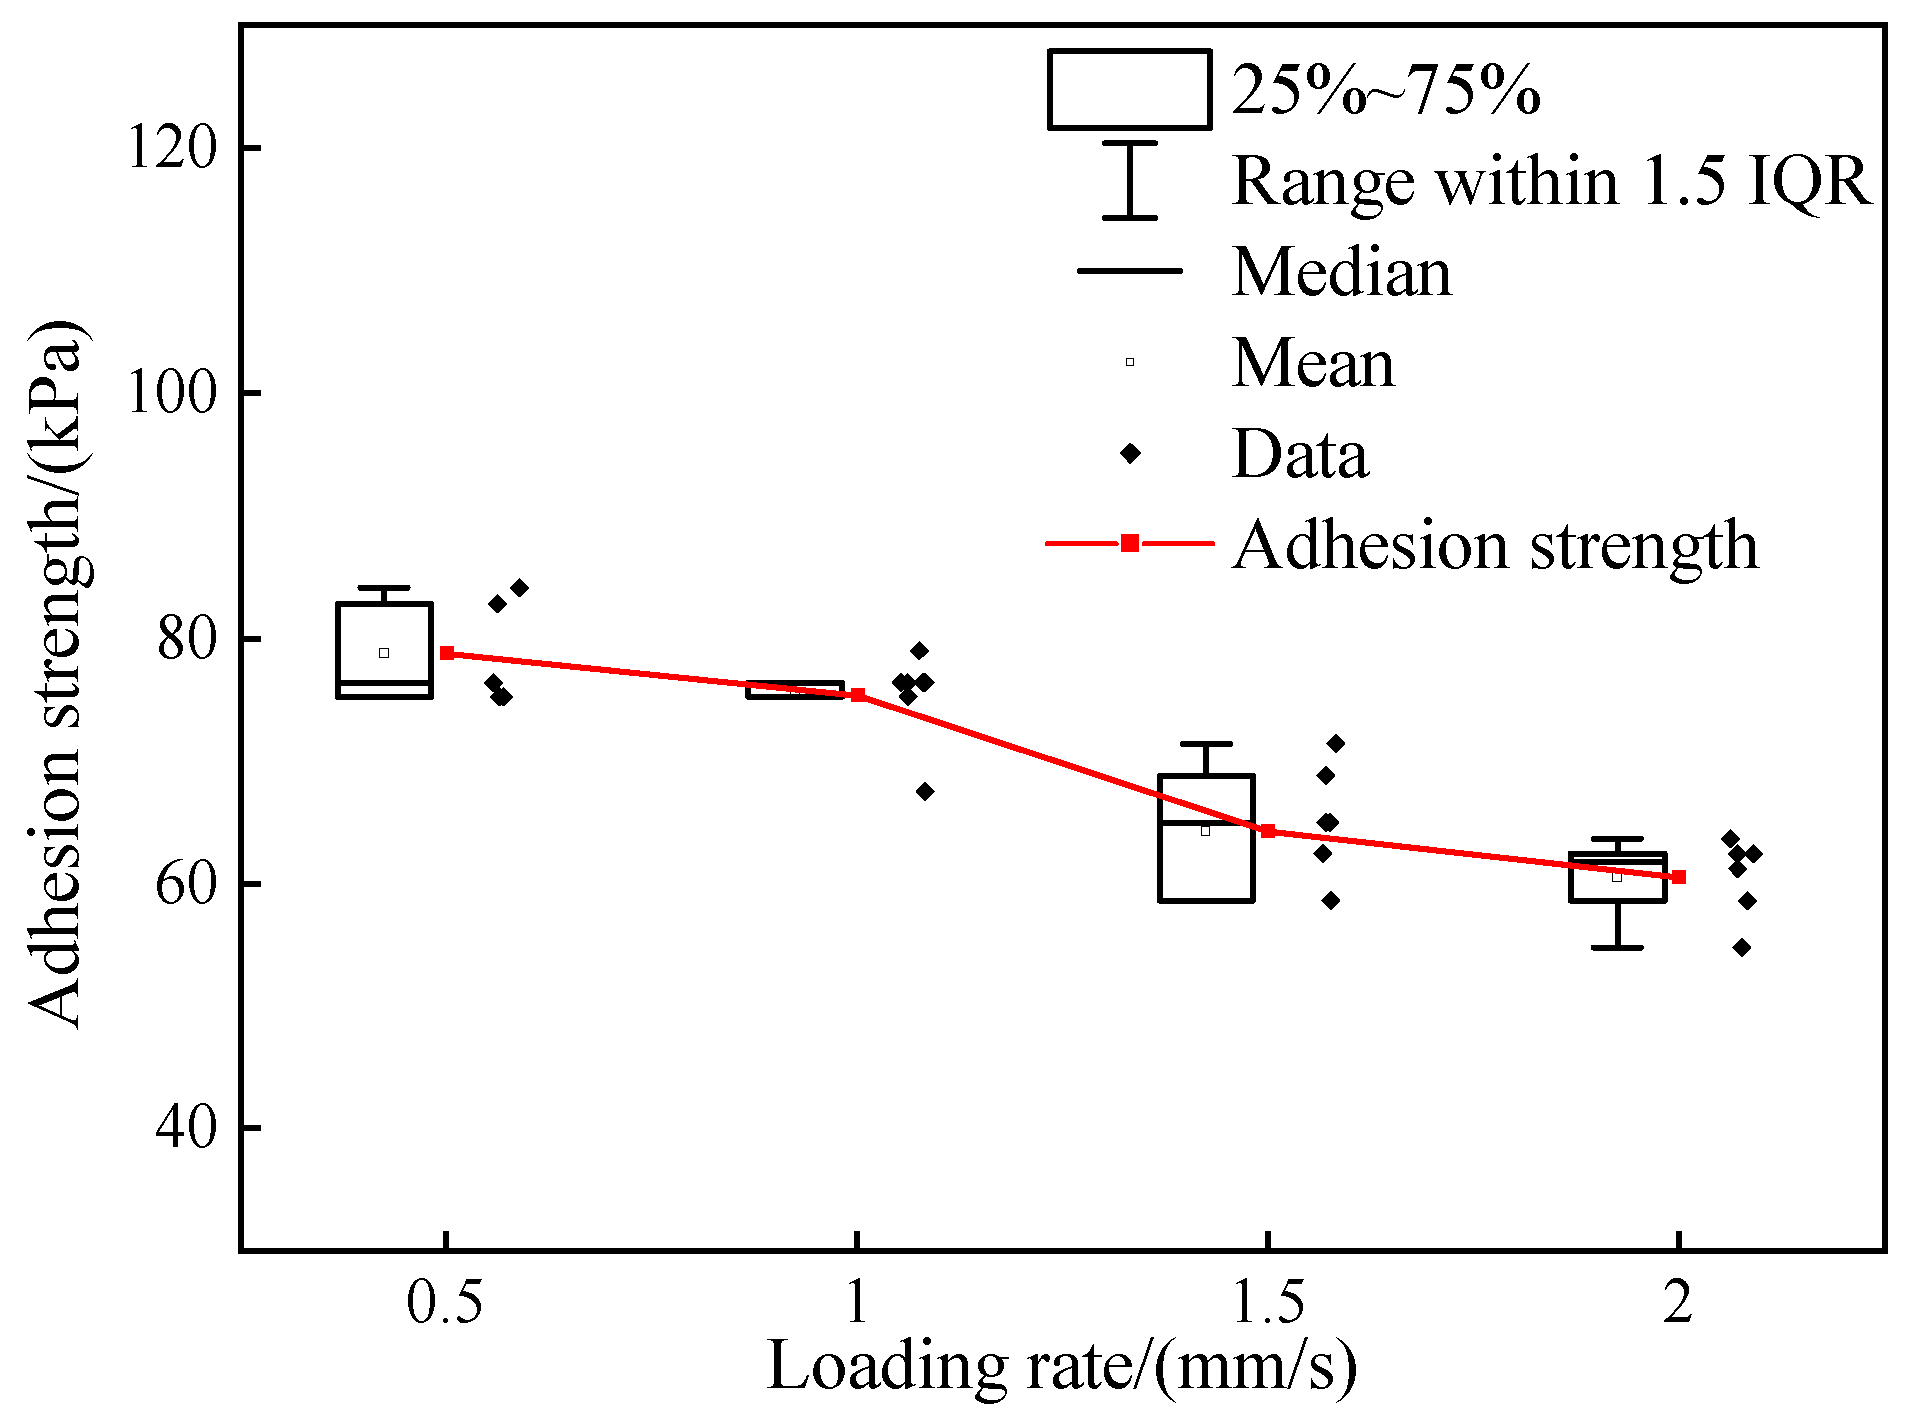
Investigating the effect of the loading rate on the ice adhesion strength τ elucidates the challenges of ice detachment under varying loading rates. Here, the loading rate is characterized by the push rod speed v, the tests conducted in this study employed v = 0.5 mm/s, 1.0 mm/s, 1.5 mm/s, and 2.0 mm/s with the following fixed parameters: separation temperature T 1 = −9 °C, freezing temperature T 0 = −9 °C, and specimen surface roughness R a = 0.264   μ m . As shown in Figure 8, the ice adhesion strength decreased with increasing push rod speed (i.e., higher loading rate). This reduction occurs because the wind–sand-eroded surfaces develop irregular interfaces that concentrate stress. At higher loading rates, the intermolecular bonds at the ice–substrate interfaces break before their full development. These mechanisms prevent effective interfacial bonding establishment, manifesting macroscopically as reduced adhesion strength [35].

3.4. Influence of Roughness R a on Ice Adhesion Strength

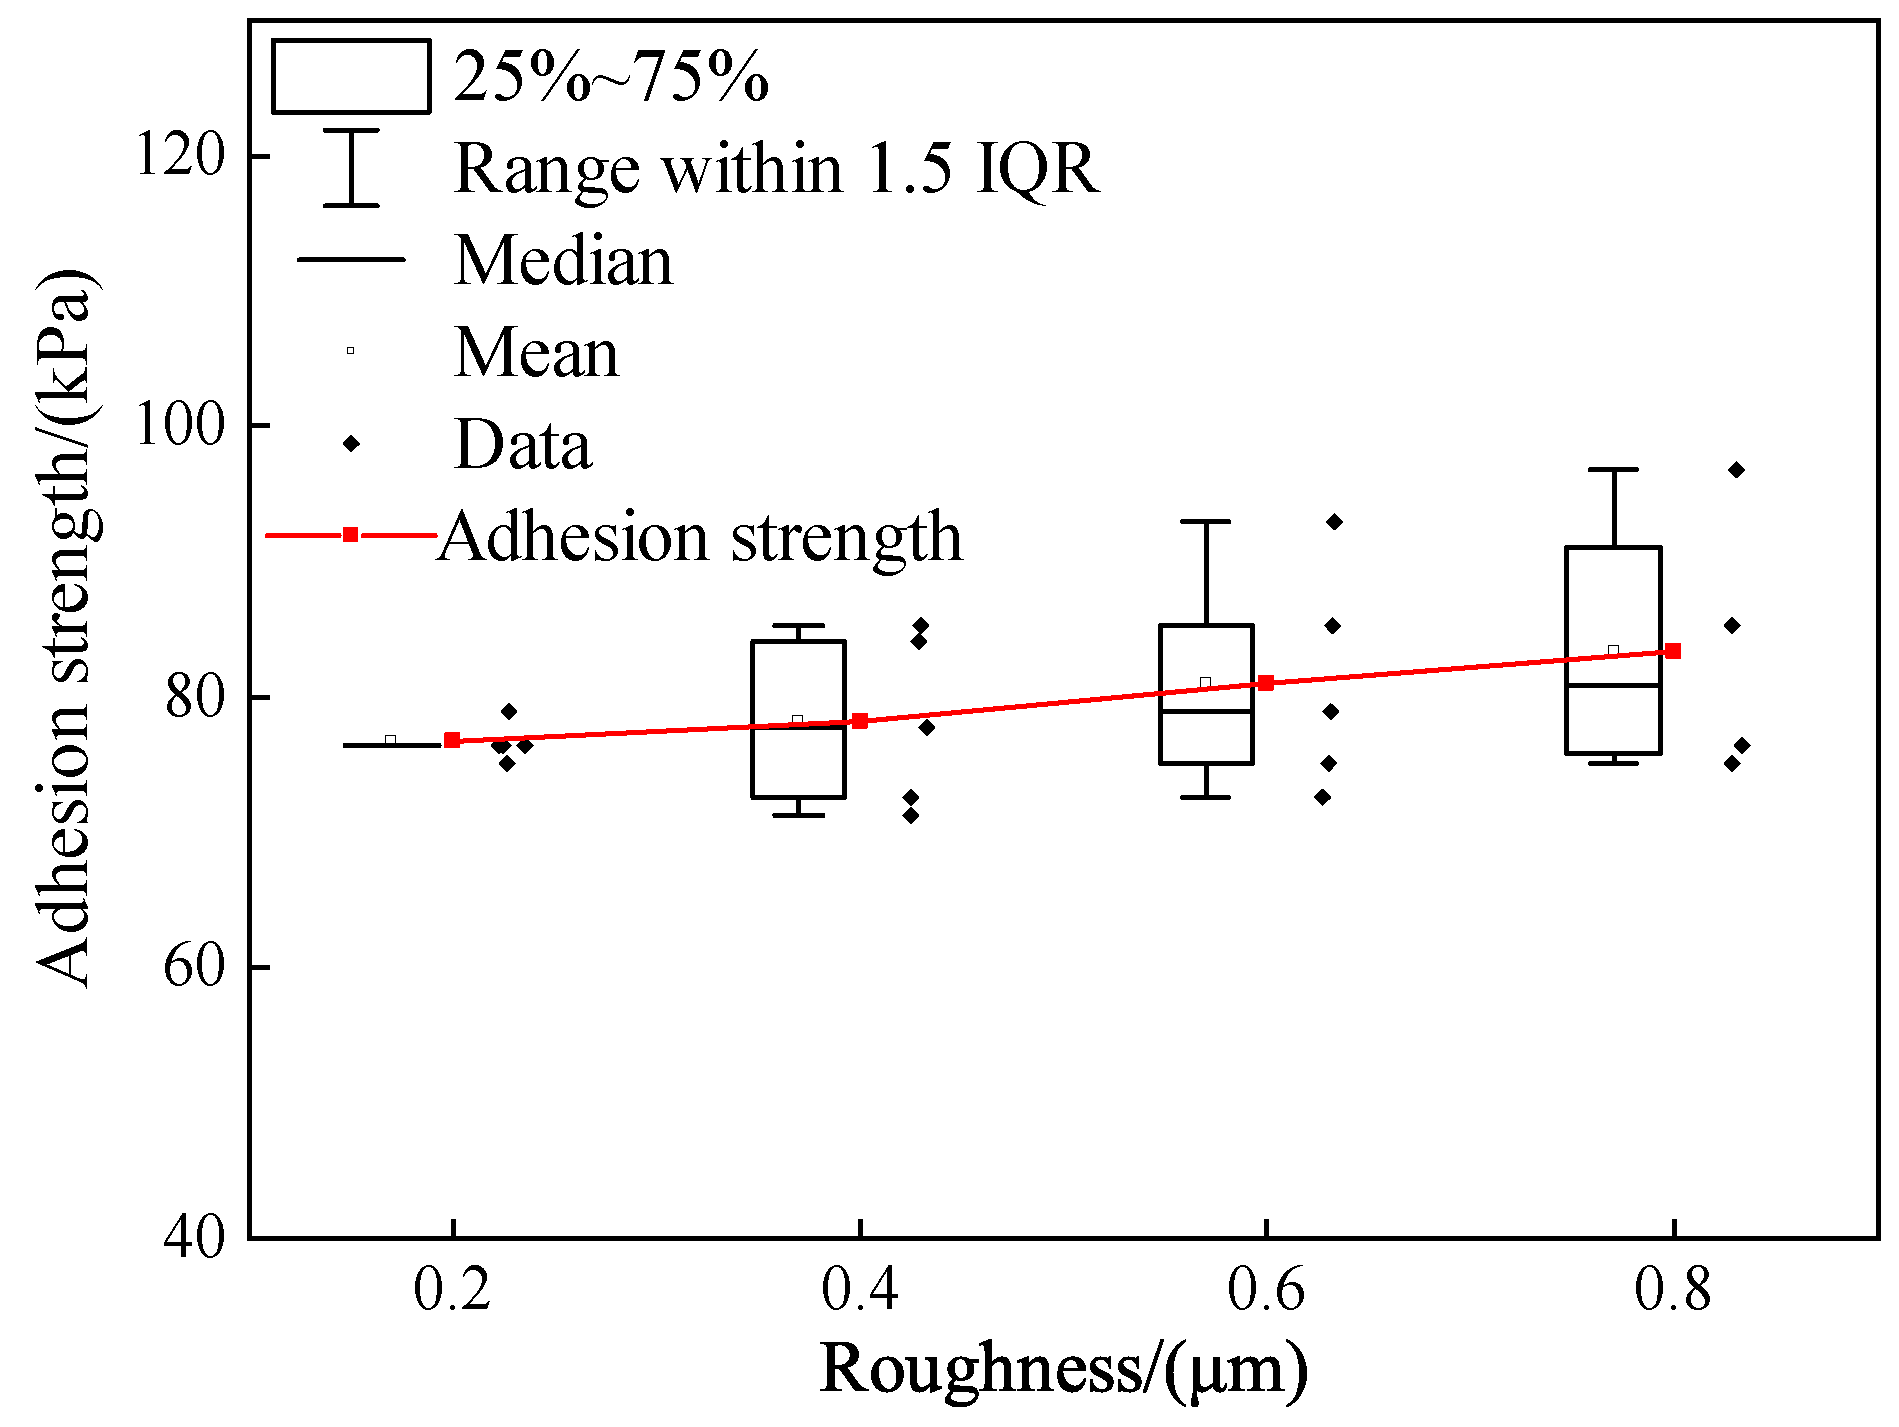
Investigating the effect of the surface roughness R a on the ice adhesion strength τ enables the elucidates of the impact of wind-sand erosion-induced roughness on ice detachment from wind turbine blades. In this study, we employed R a values of 0.264   μ m , 0.454   μ m , 0.650   μ m , and 0.862   μ m (many scholars have studied the effect of this blade surface roughness on the performance of wind turbines) [36] in our tests with the following fixed parameters: separation temperature T 1 = −9 °C, freezing temperature T 0 = −9 °C, and loading rate v = 1 mm/s. As shown in Figure 9, the ice adhesion strength increased with rising surface roughness, consistent with the findings of existing studies [37]. This enhancement occurs because the increased roughness enlarges the actual contact area between the ice and substrate beyond the apparent contact area, while simultaneously enabling mechanical interlocking when ice embeds into surface asperities during freezing, significantly strengthening the interfacial adhesion [38].

3.5. Coupling Effects on Ice Adhesion Strength

To investigate the coupled effects of the separation temperature T 1 , freezing temperature T 0 , loading rate v, and roughness R a on the adhesion strength between ice and wind turbine blades, an orthogonal array test design using the L16 (45) orthogonal table was adopted. Four levels were selected for each factor, with the adhesion strength (Y) as the evaluation index. The experimental factors, levels, orthogonal test design, and results are shown in Table 1 and Table 2. Table 2 presents the results of the range analysis table of the orthogonal test, where K i (i = 1, 2, 3, 4) represents the mean value for each level, and R is the difference between the maximum and minimum K i values of a factor. A larger R value indicates a more significant influence of the factor on the adhesion strength. As shown in the table, R A = 19.900, R B = 6.525, R C = 11.950, and R D = 4.000. Therefore, the order of influence of each factor on the adhesion strength is as follows: separation temperature > loading rate > freezing temperature > paint surface roughness.
The results of the variance analysis on the influence of various factors on adhesion strength are shown in Table 3. In hypothesis testing, a smaller significance p-value indicates a more significant influence of the factor on the result. The physical meaning of the p-value is: the probability of observing the current experimental result under the assumption that the factor has no influence on the result. A smaller p-value means a lower probability of the coincidence that extreme results occur while the factor has no influence. Therefore, we can be more confident that the factor has a real impact on the result, that is, the significance is stronger. In this study, the p-value of the separation temperature is 0.005 (less than 0.01), indicating that its influence on the adhesion strength reaches an extremely significant level in statistics. The order of significance of each factor judged by the p-values is: separation temperature (0.005) > loading rate (0.021) > freezing temperature (0.086) > roughness (0.257). The results of variance analysis and range analysis mutually verify each other and show a consistent trend.
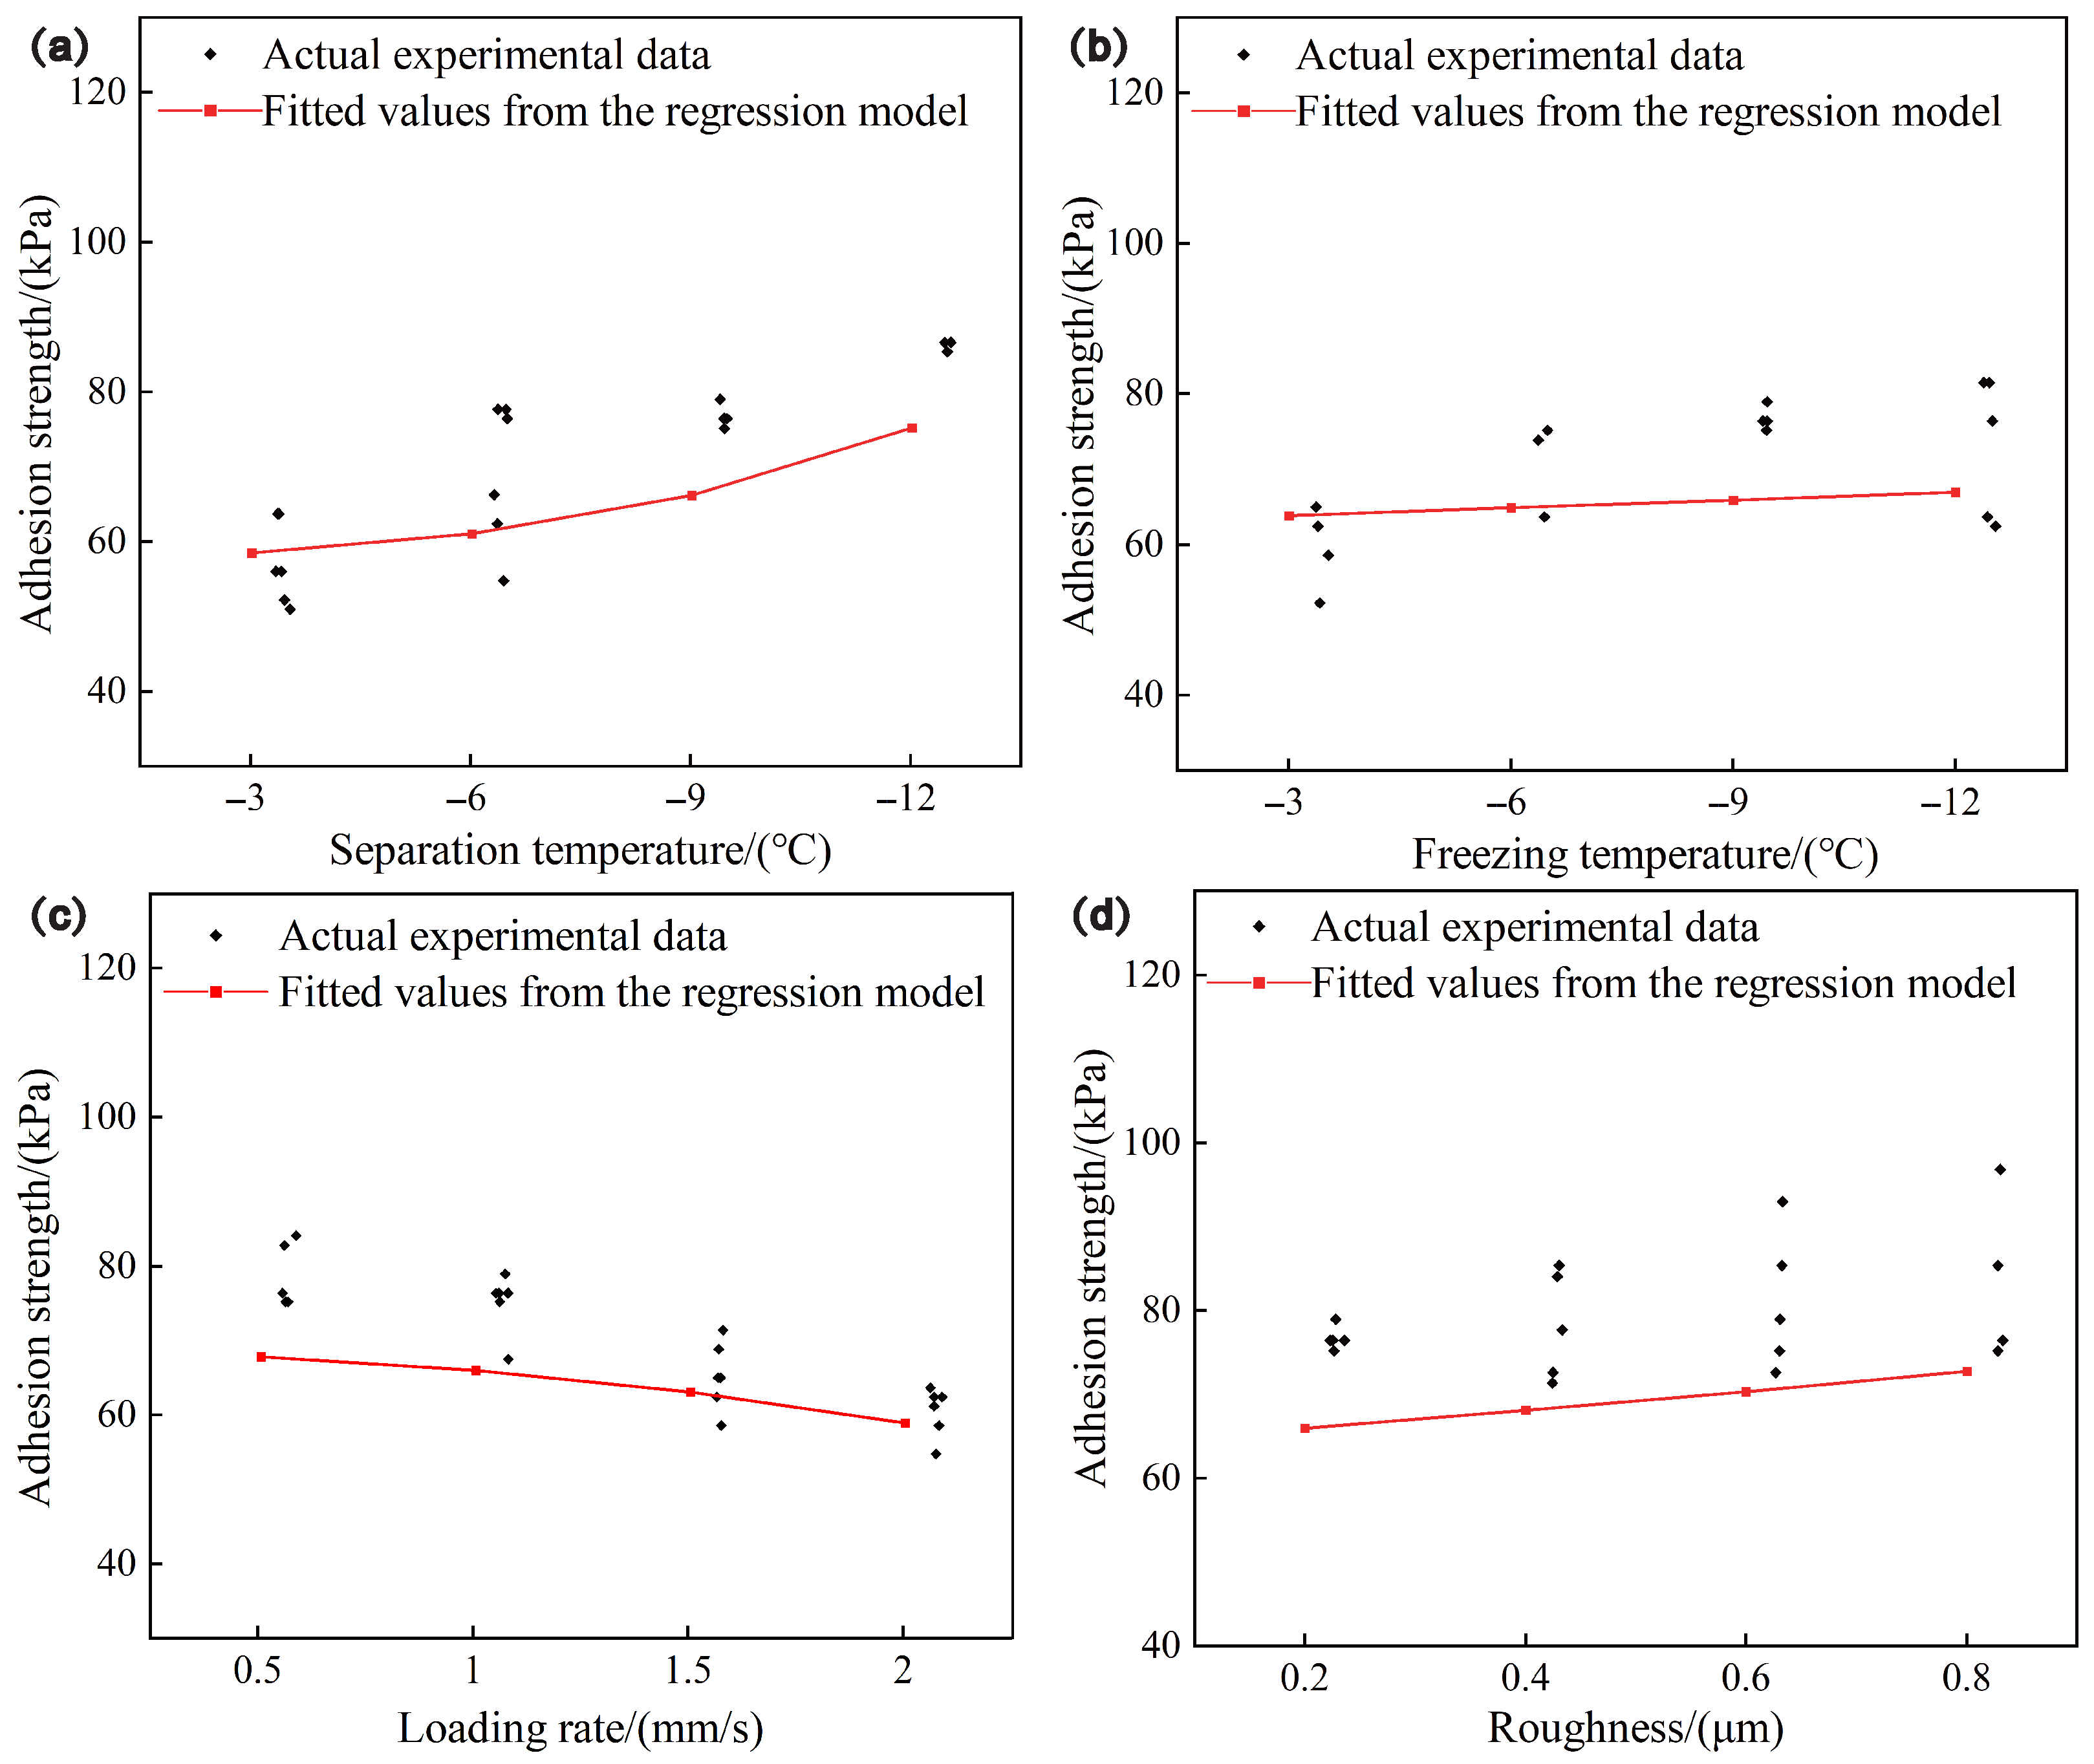
In exploring the establishment of a predictive model for ice adhesion strength, it should be noted that while this study has quantitatively measured the adhesion strength under limited test conditions and clarified the influence weights of various factors, the development of deicing systems will inevitably encounter parameter combinations beyond the scope of existing tests. To address this issue, a regression equation for ice adhesion strength was fitted based on the orthogonal test results. The equation is as follows:
T = 59.395 0.008 x 1 3 + 0.001 x 1 x 2 2.362 x 3 2 + 0.140 x 1 x 2 x 4
Among them, x 1 represents the separation temperature, x 2 represents the freezing temperature, x 3 represents the loading rate, and x 4 represents the roughness. By selecting the results of the single—factor experiment as the verification data for the multiple regression model, Figure 10 is a comparison chart of the measured values and regression-fitted values of the adhesion strength. It can be seen from the figure that the measured values and fitted values of the adhesion strength match well. This equation can effectively predict the ice adhesion strength under untested parameter combinations, providing a reliable theoretical tool for the development and optimization of deicing systems in engineering practice.

4. Conclusions

In this study, we have investigated the influence laws of the separation temperature, freezing temperature, loading rate, and surface roughness on the static ice adhesion characteristics of wind turbine blade surfaces after sand erosion. The obtained data can directly provide crucial fundamental data support for the development of practical de-icing systems in the engineering field. The main conclusions of this paper are as follows:
(1)
As the separation temperature decreases, the ice adhesion strength increases linearly. When the freezing temperature exceeds the separation temperature, the adhesion strength increases linearly with the decreasing in the separation temperature; when the freezing temperature is lower than the separation temperature, the adhesion strength decreases linearly as the separation temperature drops. An increase in the loading rate leads to a decrease in the ice adhesion strength, while an increase in the surface roughness after sand erosion results in increased ice adhesion strength.
(2)
The orthogonal experiments have shown that the order of influence of various factors on the ice adhesion force is as follows separation temperature > loading rate > freezing temperature > surface roughness. Here, the first two factors exerting the most significant impacts.
(3)
A regression equation for ice adhesion strength was established based on the orthogonal test results, which can effectively predict the ice adhesion strength under untested parameter combinations. The good agreement between the measured values from single-factor experiments and the fitted values from the regression model verifies its reliability, providing a theoretical tool for the development and optimization of de-icing systems in engineering practice.

Author Contributions

Conceptualization, L.S., S.W. and L.Z.; formal analysis, S.W.; data curation, H.C.; writing—original draft preparation, H.C. and S.W.; writing—review and editing, L.S., X.K. and S.W.; funding acquisition, L.Z. All authors have read and agreed to the published version of the manuscript.

Funding

This research was supported by guiding local scientific and technological development by the central government (216Z1806G) and the Youth Preliminary Research Foudation of Metallurgical and Energy College (RN20244136).

Institutional Review Board Statement

Not applicable.

Informed Consent Statement

Not applicable.

Data Availability Statement

The original contributions presented in the study are included in this article.

Conflicts of Interest

The authors declare no conflicts of interest.

References

  1. Chehouri, A.; Younes, R.; Ilinca, A.; Perron, J. Review of performance optimization techniques applied to wind turbines. Appl. Energy 2015, 142, 361–388. [Google Scholar] [CrossRef]
  2. Jung, C.; Schindler, D. Changing wind speed distributions under future global climate. Energy Convers. Manag. 2019, 198, 111841. [Google Scholar] [CrossRef]
  3. Cherp, A.; Vinichenko, V.; Tosun, J.; Gordon, J.A.; Jewell, J. National growth dynamics of wind and solar power compared to the growth required for global climate targets. Nat. Energy 2021, 6, 742–754. [Google Scholar] [CrossRef]
  4. Douvi, E.; Douvi, D. Aerodynamic Characteristics of Wind Turbines Operating under Hazard Environmental Conditions: A Review. Energies 2023, 16, 7681. [Google Scholar] [CrossRef]
  5. Lee, K.-C.; Chau, S.-W. Extreme Wind Loading Prediction of a 2MW Horizontal-Axis Wind Turbine. In Proceedings of the Second Conference of Global Chinese Scholars on Hydrodynamics, Wuxi, China, 20–23 November 2016; Published on Available via ResearchGate (Berlin, Germany). Available online: https://www.researchgate.net/publication/369185059_Extreme_Wind_Loading_Prediction_of_a_2MW_Horizontal-Axis_Wind_Turbine (accessed on 9 July 2025).
  6. Yang, N.; Jiang, W.; Jin, C.; Zhang, S.; Hou, W. Numerical simulation of the effect of atmospheric condition on the lightning strike for wind turbine. Front. Earth Sci. 2023, 10, 1123747. [Google Scholar] [CrossRef]
  7. Zhang, Z.; Zhang, H.; Zhang, X.; Hu, Q.; Jiang, X. A Review of Wind Turbine Icing and Anti/De-Icing Technologies. Energies 2024, 17, 2805. [Google Scholar] [CrossRef]
  8. Castorrini, A.; Corsini, A.; Rispoli, F.; Venturini, P.; Takizawa, K.; Tezduyar, T.E. Computational analysis of performance deterioration of a wind turbine blade strip subjected to environmental erosion. Comput. Mech. 2019, 64, 1133–1153. [Google Scholar] [CrossRef]
  9. Keegan, M.H.; Nash, D.H.; Stack, M.M. On erosion issues associated with the leading edge of wind turbine blades. J. Phys. D Appl. Phys. 2013, 46, 383001. [Google Scholar] [CrossRef]
  10. Abu El-Maaty, A.E.; Abdallah, H.K.; Kotb, M.A.; Ben-Mansour, R.; Alatawi, E.S. Numerical investigation of sand erosion rate in a horizontal axis wind turbine. Heliyon 2024, 10, e27676. [Google Scholar] [CrossRef]
  11. Gao, L.; Hu, H. Wind turbine icing characteristics and icing-induced power losses to utility-scale wind turbines. Proc. Natl. Acad. Sci. USA 2021, 118, e2111461118. [Google Scholar] [CrossRef] [PubMed]
  12. Yang, W.; Zhao, H.; Zhang, Y.; Wang, Y.; Chang, J. Quantitative Modeling of Effects of Extreme Low Temperature on Wind Turbine Blade Performance Based on Nonlinear Random-Coefficient Regression Model. IEEE Access 2023, 11, 8804–88058. [Google Scholar] [CrossRef]
  13. Godfrey, M.; Siederer, O.; Zekonyte, J.; Barbaros, I.; Wood, R. The effect of temperature on the erosion of polyurethane coatings for wind turbine leading edge protection. Wear 2021, 476, 203720. [Google Scholar] [CrossRef]
  14. Shu, L.; Li, H.; Hu, Q.; Jiang, X.; Qiu, G.; McClure, G.; Yang, H. Study of ice accretion feature and power characteristics of wind turbines at natural icing environment. Cold Reg. Sci. Technol. 2018, 147, 45–54. [Google Scholar] [CrossRef]
  15. Li, M.; Zhang, W.; Liu, J.; Chen, J.; Wang, Y. Risk Assessment and Value of Action Analysis for Icing Conditions of Wind Turbines Close to Highways. Energies 2019, 12, 2653. [Google Scholar] [CrossRef]
  16. Yang, X.; Bai, X.; Cao, H. Influence analysis of rime icing on aerodynamic performance and output power of offshore floating wind turbine. Ocean Eng. 2022, 258, 111725. [Google Scholar] [CrossRef]
  17. Lamraoui, F.; Fortin, G.; Benoit, R.; Perron, J.; Masson, C. Atmospheric icing impact on wind turbine production. Cold Reg. Sci. Technol. 2014, 100, 36–49. [Google Scholar] [CrossRef]
  18. Han, Y.; Lei, Z.; Dong, Y.; Wang, Q.; Li, H.; Feng, F. The Icing Characteristics of a 1.5 MW Wind Turbine Blade and Its Influence on the Blade Mechanical Properties. Coatings 2024, 14, 242. [Google Scholar] [CrossRef]
  19. Lehtomäki, V.; Rissanen, S.; Wadham-Gagnon, M.; Sandel, K.; Moser, W.; Jacob, D. Fatigue loads of iced turbines: Two case studies. J. Wind Eng. Ind. Aerodyn. 2016, 158, 37–50. [Google Scholar] [CrossRef]
  20. Makkonen, L. Ice Adhesion —Theory, Measurements and Countermeasures. J. Adhes. Sci. Technol. 2012, 26, 413–445. [Google Scholar] [CrossRef]
  21. Janjua, Z.A. The influence of freezing and ambient temperature on the adhesion strength of ice. Cold Reg. Sci. Technol. 2017, 140, 14–19. [Google Scholar] [CrossRef]
  22. Quayson-Sackey, E.; Nyantekyi-Kwakye, B.; Ayetor, G.K. Technological advancements for anti-icing and de-icing offshore wind turbine blades. Cold Reg. Sci. Technol. 2025, 231, 104400. [Google Scholar] [CrossRef]
  23. Madi, E.; Pope, K.; Huang, W.; Iqbal, T. A review of integrating ice detection and mitigation for wind turbine blades. Renew. Sustain. Energy Rev. 2019, 103, 269–281. [Google Scholar] [CrossRef]
  24. Mu, Z.; Li, Y.; Guo, W.; Shen, H.; Tagawa, K. An Experimental Study on Adhesion Strength of Offshore Atmospheric Icing on a Wind Turbine Blade Airfoil. Coatings 2023, 13, 164. [Google Scholar] [CrossRef]
  25. Piscitelli, F.; Fanciullo, M.; Sarcinella, A.; Costantini, M.; Frigione, M. Icephobic Properties of Superhydrophobic Coatings Developed for Aeronautical Applications. Coatings 2025, 15, 621. [Google Scholar] [CrossRef]
  26. Zhang, W.; Li, J.; Wang, H.; Zhao, Y. Icing and Adhesive Characteristics of Iced Airfoils Under Rime Ice Conditions. Coatings 2025, 15, 606. [Google Scholar] [CrossRef]
  27. Shen, H.; Li, Y.; Guo, W.; Zhang, F.; Feng, F.; Mu, Z. An experimental study of ice adhesion on wind turbine blades: Effects of materials, airfoils and attack angles. Appl. Therm. Eng. 2025, 273, 126546. [Google Scholar] [CrossRef]
  28. Wang, J.; Gao, J.; Zhang, Y.; Cui, H. Analysis of the Sand Erosion Effect and Wear Mechanism of Wind Turbine Blade Coating. Energies 2024, 17, 413. [Google Scholar] [CrossRef]
  29. Zou, M.; Beckford, S.; Wei, R.; Ellis, C.; Hatton, G.; Miller, M.A. Effects of surface roughness and energy on ice adhesion strength. Appl. Surf. Sci. 2011, 257, 3786–3792. [Google Scholar] [CrossRef]
  30. Hassan, M.F.; Lee, H.P.; Lim, S.P. The variation of ice adhesion strength with substrate surface roughness. Meas. Sci. Technol. 2010, 21, 075701. [Google Scholar] [CrossRef]
  31. Schulz, M.; Sinapius, M. Evaluation of Different Ice Adhesion Tests for Mechanical Deicing Systems. In Proceedings of the SAE 2015 International Conference on Icing of Aircraft, Engines, and Structures, Prague, Czech Republic, 22–25 June 2015. SAE Technical Paper Proceedings; ISSN 0148-7191 (Print), 2688-3627 (Electronic). [Google Scholar] [CrossRef]
  32. Sivakumar, G.; Sundararajan, S. The effect of surface roughness, stiffness, and size on ice adhesion. Cold Reg. Sci. Technol. 2024, 225, 104271. [Google Scholar] [CrossRef]
  33. Aoyama, T.; Ishikawa, M.; Hira, T.; Ukigai, K. Effect of Surface Roughness on Adhesive Shear Strength between Pure Ice and a Solid Surface. Trans. Jpn. Soc. Refrig. Air Cond. Eng. 2006, 23, 273–281. [Google Scholar] [CrossRef]
  34. Kraj, A.G.; Bibeau, E.L. Measurement method and results of ice adhesion force on the curved surface of a wind turbine blade. Renew. Energy 2010, 35, 741–746. [Google Scholar] [CrossRef]
  35. Jiang, X.; Lin, Y.; Xuan, X.; Zhuo, Y.; Wu, J.; He, J.; Du, X.; Zhang, Z.; Li, T. Stiffening surface lowers ice adhesion strength by stress concentration sites. Colloids Surfaces A Physicochem. Eng. Asp. 2023, 666, 131334. [Google Scholar] [CrossRef]
  36. Kelly, J.; Vogel, C.; Willden, R. Impact and mitigation of blade surface roughness effects on wind turbine performance. Wind Energy 2022, 25, 660–677. [Google Scholar] [CrossRef]
  37. Bharathidasan, T.; Kumar, S.V.; Bobji, M.S.; Chakradhar, R.P.S.; Basu, B.J. Effect of wettability and surface roughness on ice-adhesion strength of hydrophilic, hydrophobic and superhydrophobic surfaces. Appl. Surf. Sci. 2014, 314, 241–250. [Google Scholar] [CrossRef]
  38. Memon, H.; Liu, J.; De Focatiis, D.S.A.; Choi, K.-s.; Hou, X. Intrinsic dependence of ice adhesion strength on surface roughness. Surf. Coatings Technol. 2020, 385, 125382. [Google Scholar] [CrossRef]
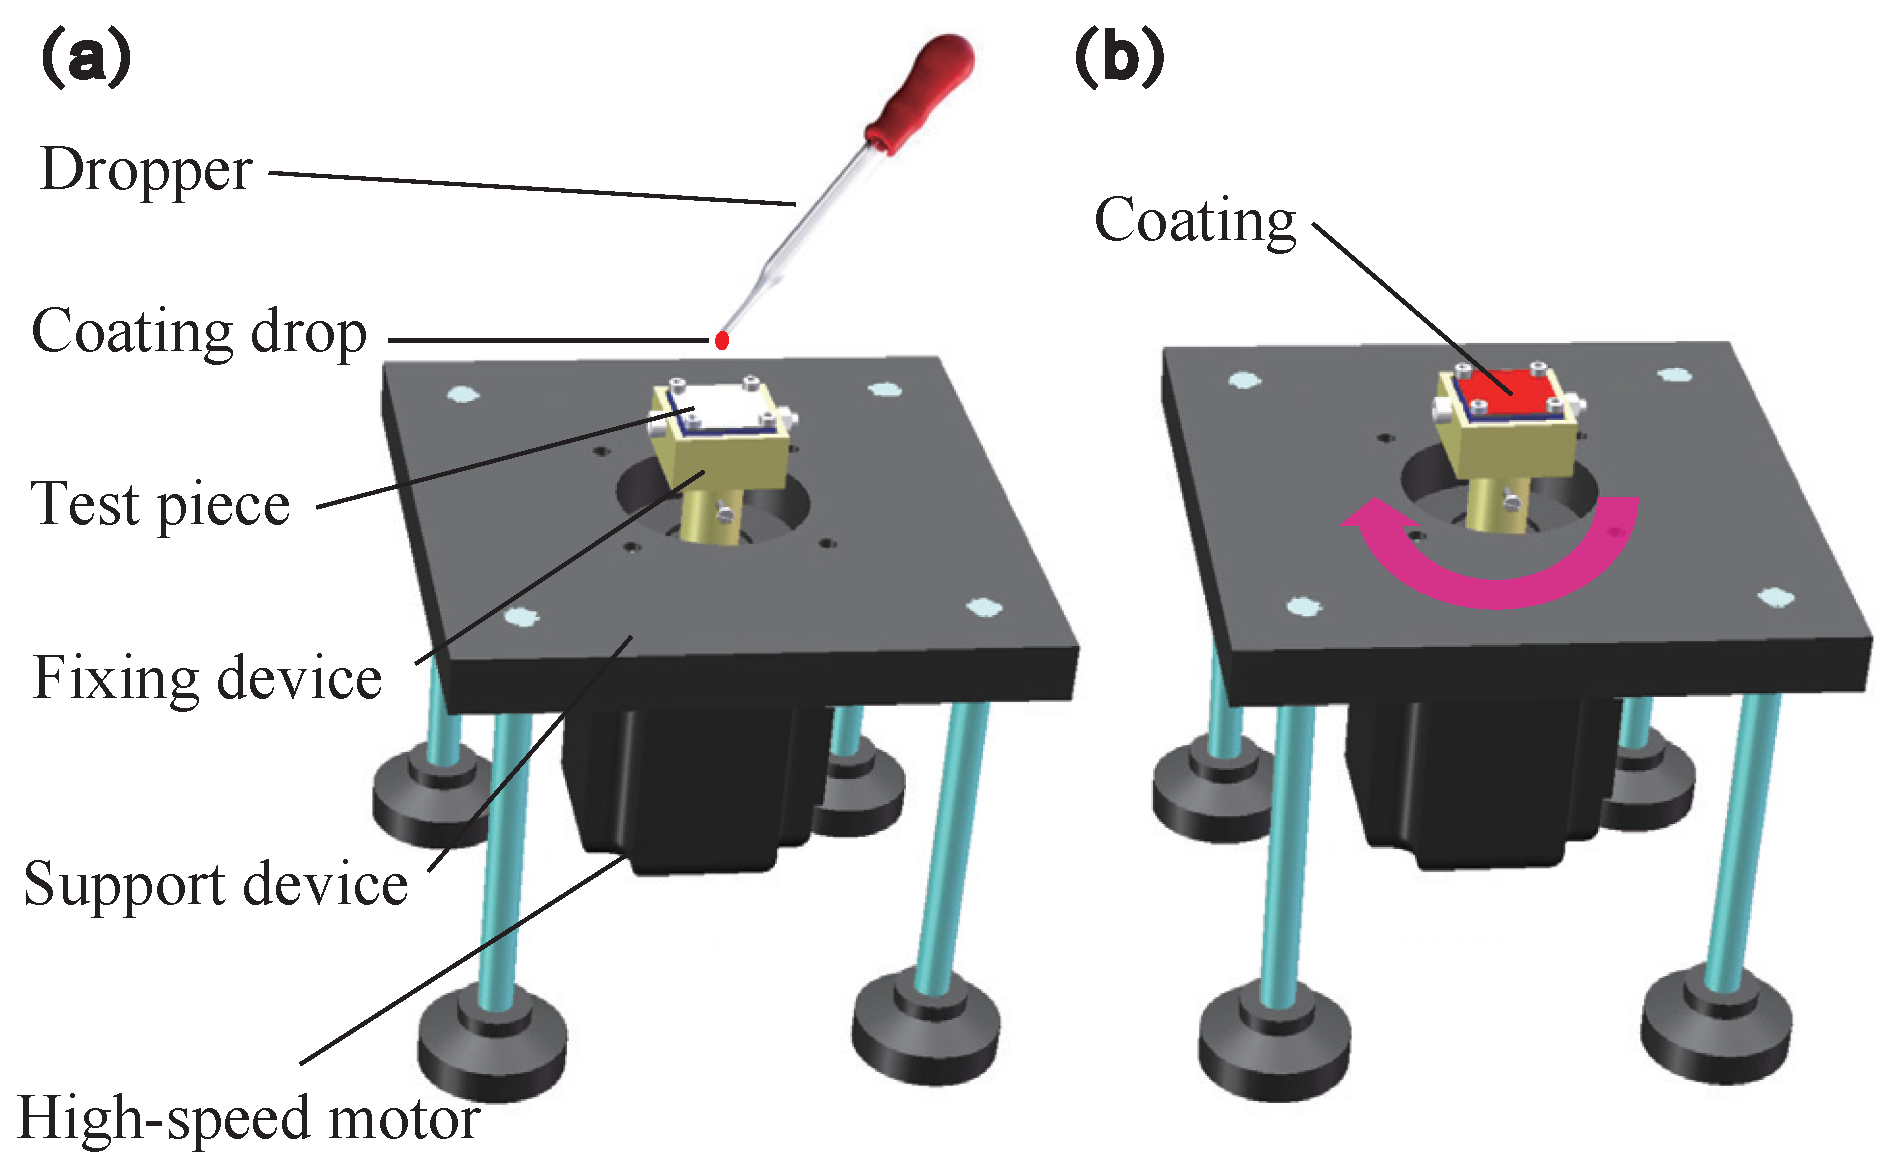
Figure 1. Preparation of coating by spin-coating method: (a) before spin coating; (b) after spin coating.
Coatings 15 00955 g001
Figure 2. The wind–sand erosion simulation apparatus: (a) schematic diagram translation; (b) physical object diagram.
Coatings 15 00955 g002
Figure 3. Surface roughness characteristics of test pieces under sandblasting erosion: (a) box plot of roughness data at different erosion durations; (b-1b-5) contour curves of typical test results with different R a values; (c-1c-5) and (d-1d-5) SEM images of surface microscopic morphology.
Coatings 15 00955 g003
Figure 4. Method of preparing frozen sample: (a) sample before freezing; (b) sample after freezing.
Coatings 15 00955 g004
Figure 5. Quasi-static method testing apparatus for tangential adhesion strength of icing: (a) ice pushing mechanism; (b) position for pushing; (c) physical image.
Coatings 15 00955 g005
Figure 6. Influence of separation temperature on ice adhesion strength.
Coatings 15 00955 g006
Figure 7. Influence of freezing temperature on ice adhesion strength.
Coatings 15 00955 g007
Figure 8. Test of influence of loading rate on ice coating adhesion strength.
Coatings 15 00955 g008
Figure 9. Influence of roughness on ice adhesion strength.
Coatings 15 00955 g009
Figure 10. Comparison between actual experimental data and fitted values from the regression model. (a) Adhesion strength at different separation temperature; (b) Adhesion strength at different freezing temperature; (c) Adhesion strength at different loading rate; (d) Adhesion strength at different roughness.
Coatings 15 00955 g010
Table 1. Factor levels.
FactorLevel 1Level 2Level 3Level 4
Separation temperature A / C −3−6−9−12
Freezing temperature B / C −3−6−9−12
Loading rate C / ( mm / s ) 0.511.52
Roughness D / μ m 0.2640.4540.6500.862
Table 2. Orthogonal experimental design.
No.Separation Temperature A/°CFreezing Temperature B/°CLoading Rate C/(mm/s)Roughness D/μmAdhesion Strength (Y)/(kPa)
1−3−30.50.26461.2
2−3−610.45454.8
3−3−91.50.65057.3
4−3−1220.86253.5
5−6−310.65061.2
6−6−60.50.86263.7
7−6−920.26454.8
8−6−121.50.45462.4
9−9−31.50.86263.7
10−9−620.65058.6
11−9−90.50.45472.6
12−9−1210.26466.2
13−12−320.45470.1
14−12−61.50.26466.2
15−12−910.86282.8
16−12−120.50.65087.3
K 1 56.70064.05071.20062.100
K 2 60.52560.82566.25064.975
K 3 65.27566.87562.40066.100
K 4 76.60067.35059.25065.925
R19.9006.52511.9504.000
Table 3. Variance analysis table.
FactorSum of SquaresDegree of FreedomMean SquareFSignificance (p)
Corrected Model1361.65512113.47119.0020.017
Intercept67,132.810167,132.81011,241.888<0.001
Separation Temperature893.3953297.79849.8690.005
Freezing Temperature108.675336.2256.0660.086
Loading rate318.4903106.16317.7780.021
Roughness41.095313.6982.2940.257
Error17.91535.972
Total68,512.38016
Corrected Total1379.57015
R 2 = 0.987 (adjusted R 2 = 0.935 )
Disclaimer/Publisher’s Note: The statements, opinions and data contained in all publications are solely those of the individual author(s) and contributor(s) and not of MDPI and/or the editor(s). MDPI and/or the editor(s) disclaim responsibility for any injury to people or property resulting from any ideas, methods, instructions or products referred to in the content.