Abstract
In response to the escalating climate crisis, reducing greenhouse gas emissions (GHG) has become a top priority for both the public and private sectors. The pavement industry plays a key role in this transition, offering innovative technologies that minimize environmental impacts without compromising performance. Among these, the incorporation of recycled tire rubber and warm-mix asphalt (WMA) additives represents a promising strategy to reduce energy consumption and resource depletion in road construction. This study conducts a comparative life cycle assessment (LCA) to evaluate the environmental performance of an asphalt pavement incorporating recycled rubber and a WMA additive—referred to as R-W asphalt—against a conventional hot-mix asphalt (HMA) pavement. The analysis follows the ISO 14040/44 standards, covering material production, transport, construction, and maintenance. Two service-life scenarios are considered: one assuming equivalent durability and another with a five-year extension for the R-W pavement. The results demonstrate environmental impact reductions of up to 57%, with average savings ranging from 32% to 52% across key impact categories such as climate change, land use, and resource use. These benefits are primarily attributed to lower production temperatures and extended maintenance intervals. The findings underscore the potential of R-W asphalt as a cleaner engineering solution aligned with circular economy principles and climate mitigation goals.
1. Introduction
Road pavements are essential infrastructure elements designed to ensure safe, comfortable, and efficient travel. Beyond their structural and functional roles, pavements are increasingly scrutinized for their environmental impacts, particularly in the context of growing global concerns over climate change and sustainable development. Governments and industries are progressively adopting strategies to reduce greenhouse gas (GHG) emissions and conserve natural resources across all sectors, including road construction and maintenance.
Over recent decades, the pavement industry has responded by developing environmentally friendly technologies focused on reducing energy consumption, minimizing raw material use, and promoting the reuse of waste materials. Among these, the incorporation of crumb rubber derived from end-of-life tires (ELTs) into asphalt mixtures has gained traction as a sustainable solution. This approach not only diverts waste from landfills but also enhances pavement performance. Rubberized asphalt has been shown to improve resistance to cracking and fatigue, reduce traffic noise, lower maintenance needs, and extend pavement service life [1,2].
Despite these advantages, rubber-modified mixtures typically require higher production and compaction temperatures than conventional hot-mix asphalt (HMA), leading to increased energy consumption and emissions [3]. To address this, warm-mix asphalt (WMA) technology has emerged as a viable alternative. WMA enables the production of asphalt at significantly lower temperatures—typically 20–40 °C lower—thereby reducing the energy demand and associated emissions [4]. Additional benefits include improved working conditions, enhanced worker safety, and increased haul distances.
Combining WMA additives with crumb rubber offers the potential to harness the performance benefits of rubberized asphalt while mitigating the environmental drawbacks of elevated production temperatures. Although several laboratory studies have explored this combination [5,6] comprehensive evaluations of their environmental implications are still limited.
Life cycle assessment (LCA) has become the standard methodology for assessing the environmental impacts of road pavements, accounting for all stages from raw material extraction to construction, maintenance, and end of life. While a growing body of research is applying LCA to sustainable asphalt technologies—evaluating rubber-modified mixtures [7,8] and lower-temperature production processes [9,10,11]—few studies focus specifically on WMA technologies in combination with rubber [12,13,14,15]
Moreover, many studies omit maintenance stages, despite evidence that rubberized pavements exhibit superior durability and require less frequent rehabilitation [16] and they often simplify this phase significantly [17]. Maintenance and rehabilitation involve complex, multi-step processes that are difficult to predict accurately. Despite advancements in pavement engineering that allow for the more sophisticated modeling of these activities, such detail is rarely reflected in most LCA frameworks. This study addresses this gap by explicitly incorporating detailed maintenance operations throughout the pavement life cycle, providing a more realistic and robust assessment of long-term environmental impacts.
Table 1 provides a comparative overview of key LCA studies on rubberized asphalt pavements. It highlights differences in functional units (FUs), system boundaries, warm-mix incorporation, and maintenance treatment modeling. Unlike most prior studies—which have focused on cradle-to-gate or cradle-to-site assessments and often omitted the maintenance phase—this work adopts a cradle-to-grave perspective with full maintenance modeling and annualized results based on a functional unit of 1 m2·year. This level of comprehensiveness is especially relevant in evaluating the long-term benefits of dry-processed rubberized warm-mix asphalt (referred to here as R-W asphalt) under real-world maintenance schedules in a Spanish context.

Table 1.
Comparison of previous LCA studies on rubberized asphalt pavements and the present study.
Furthermore, the present LCA goes a step further by comparing two distinct lifespan scenarios—one assuming equal durability and another reflecting the extended service life of the R-W pavement. This dual-scenario approach provides a more comprehensive and policy-relevant evaluation of the long-term environmental impacts, addressing a major methodological gap in current LCA applications within the pavement sector.
Additionally, to the authors’ knowledge, this is the first case study in Spain that jointly assesses the environmental performance of dry-process rubber asphalt with WMA additives while explicitly modeling full maintenance operations over the pavement’s service life.
Unlike most LCAs for rubberized asphalt, the R-W asphalt evaluated in this study uses a dry process, where crumb rubber is introduced directly into the mixer alongside the aggregates. This approach avoids the need to blend rubber into bitumen beforehand (as in the wet process), simplifying the production logistics while reducing plant energy consumption. Few prior LCA studies have addressed this specific combination of dry rubber and WMA additives. This integrated approach allows for a more realistic and policy-relevant comparison of the long-term sustainability impacts between conventional and modified asphalt technologies.
Therefore, this study aims to quantify and compare the environmental performance of a road pavement incorporating recycled tire rubber and a WMA additive against a conventional asphalt pavement. Using LCA, the analysis encompasses not only material production and construction but also surface treatments and milling operations during the use phase, to provide a comprehensive assessment of this innovative pavement solution.
2. Methodology
This study adopts the internationally recognized LCA methodology, structured according to the four standardized phases defined in ISO 14040 and ISO 14044 [18,19]. These phases ensure methodological consistency, transparency, and comparability with other LCA-based studies in the fields of sustainable infrastructure and materials science. The four main stages are (1) goal and scope definition, (2) life cycle inventory (LCI) analysis, (3) life cycle impact assessment (LCIA), and (4) interpretation.
(1) Goal and Scope Definition: In this initial phase, the objectives of the study are clearly defined, including the intended application, the reasons for carrying out the assessment, and the intended audience. The system boundaries, functional unit, and comparison scenarios are also established to ensure that the results are relevant, interpretable, and aligned with the study’s purpose.
(2) Life Cycle Inventory (LCI) Analysis: This phase involves the systematic collection and quantification of data on energy inputs, raw material use, emissions, and waste flows associated with each stage of the pavement life cycle. Data sources include both primary data from asphalt producers and secondary data from commercial databases (e.g., Ecoinvent), ensuring the comprehensive representation of the processes involved.
(3) Life Cycle Impact Assessment (LCIA): In this stage, the inventory data are translated into potential environmental impacts using characterization models. The International Reference Life Cycle Data System (ILCD) 2011 Midpoint+ method is applied to assess multiple impact categories—such as climate change, ozone depletion, eutrophication, acidification, toxicity, and resource use—thereby enabling a multidimensional evaluation of the environmental performance of each pavement alternative.
(4) Interpretation: The final phase involves the critical analysis of the results to identify key contributors (‘hotspots’), assess trade-offs among impact categories, and verify the robustness of the conclusions. Sensitivity analyses are also performed to evaluate how changes in key parameters (e.g., service life, transport distances, rubber content) affect the overall outcome, thus enhancing the credibility and decision-making relevance of the findings.
By following these four structured phases, the study ensures methodological rigor and alignment with best practices in LCA, providing a scientifically sound basis for evaluating the environmental sustainability of incorporating recycled rubber and warm-mix additives into asphalt pavement design.
2.1. Goal and Scope
The objective of this LCA is to quantify and compare the environmental impacts associated with two asphalt pavement alternatives: a conventional HMA pavement (conventional road) and an innovative mixture incorporating recycled rubber and a WMA additive (R-W road). The comparison focuses on the environmental benefits of integrating crumb rubber from ELTs and WMA additives, while keeping the structural design constant across both alternatives.
2.1.1. Functional Unit
The FU is 1 m2 of pavement per year of service (m2·year), allowing for an annualized environmental comparison between alternatives with different service lives.
2.1.2. System Boundaries
The system boundary includes all processes from raw material extraction to pavement construction and maintenance operations over the analysis period. Specifically, the following stages are considered: the extraction and transport of raw materials; the production of bitumen, aggregates, rubber powder, and WMA additives; asphalt mixture production and transport to site; pavement construction (placement and compaction); and surface treatments and rehabilitation (slurry seals, milling, and replacement). End-of-life disposal is excluded, assuming similar conditions for both scenarios. The LCA system boundary diagram of this study is presented in Figure 1.
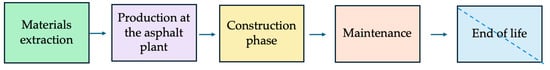
Figure 1.
LCA system boundary diagram.
2.1.3. Impact Assessment Categories, Models, and Indicators
Environmental impact categories represent various forms of environmental damage as a result of resource consumption and emissions. This study uses the ILCD 2011 Midpoint methodology, developed by the European Commission, as the characterization model. The method includes midpoint impact categories such as climate change, acidification, eutrophication, human toxicity, resource depletion, and others, allowing for a comprehensive and standardized evaluation of the environmental burdens.
2.1.4. Interpretation Criteria, Assumptions, and Value Judgments
Following the impact assessment, the results are systematically interpreted to identify significant environmental aspects, evaluate model uncertainties, and derive practical recommendations. Interpretation also considers study limitations, assumptions (e.g., technological equivalency), and value choices that may influence the outcomes. These include allocation rules, system boundaries, and data sources. Particular attention is given to the most impactful stages and materials, helping to identify opportunities for improvement.
2.1.5. Data Quality Requirements
The quality of data is a critical factor influencing the reliability and robustness of an LCA. For this case study, primary data—obtained directly from the asphalt plant—are used wherever possible, particularly for the production stage. However, for upstream processes such as raw material extraction, refining, and the manufacturing of intermediate products, secondary data from recognized sources are employed. These include the time period (2022–2024) and geographical scope (Spain), as well as the primary industrial data obtained from asphalt producers and the specific version and modules of the Ecoinvent database (v3.6) used for upstream processes, such as bitumen production, aggregate extraction, energy systems, and transport. All datasets were evaluated based on criteria such as temporal, geographical, and technological representativeness.
2.1.6. Lifespan Assumptions
Two service life scenarios were assessed to reflect uncertainty in long-term performance.
Scenario 1: Equal Service Life Assumption. In this scenario, both the conventional and R-W pavements are assumed to have the same total service life of 15 years. However, the timing and frequency of maintenance differ. The conventional pavement undergoes milling and resurfacing at multiple points during its lifespan—specifically, at years 10, 13, and 15—depending on the maintenance scenario analyzed. In contrast, the R-W pavement is assumed to require only a single milling operation at year 15, with no intermediate treatments. This scenario provides a conservative comparison in which durability is held constant, but differences in maintenance frequency are still considered.
Scenario 2: Extended Maintenance Interval for R-W Pavement. In this scenario, the R-W pavement is assumed to require no maintenance interventions until year 15, reflecting its improved durability. In contrast, the conventional pavement receives a surface treatment at year 8 or 10, followed by milling at years 10, 13, or 15. This setup allows for a comparative assessment of the environmental impacts when the R-W system delays maintenance operations over a typical 15-year service period.
The 15-year design basis for the milling of the R-W pavement is based on documented evidence from previous studies and practical experience with rubberized asphalt, which demonstrate its enhanced durability and resistance to cracking and fatigue compared to conventional HMA. These performance improvements, supported by the literature (e.g., [1,2,16]), allow the R-W surface layer to remain serviceable without intermediate interventions until year 15. This assumption is also aligned with typical design practices in Spain for high-performance surface courses and was applied to reflect the realistic service life extension achievable with rubberized warm-mix technology.
The maintenance frequency and treatment types are defined according to these assumptions and shown in Figure 2.
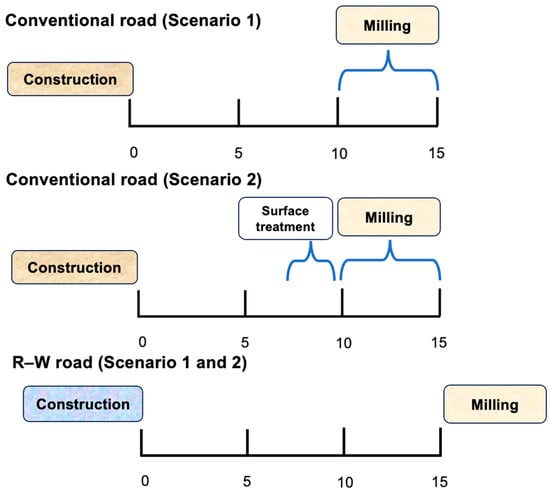
Figure 2.
Maintenance strategies assumed for the conventional road and R-W road alternatives.
The results were then normalized to an FU of 1 m2·year to allow a fair comparison of the environmental performance on an annualized basis. The extended-lifespan scenario highlights the potential environmental co-benefits of improved durability and a reduced maintenance frequency.
2.2. Life Cycle Inventory
The inventory phase involved collecting and quantifying all material and energy flows associated with each pavement system. Primary (site-specific) data were collected directly from Spanish asphalt producers and contractors through surveys and operational records, covering aspects such as fuel consumption, plant energy use, production temperatures, and transport logistics. This data collection posed several challenges, primarily due to the limited availability of site-specific industrial data. This required collaboration with companies that are often unwilling to disclose proprietary information.
For upstream processes (bitumen, aggregates, electricity, and fuel refining), secondary data were sourced from the Ecoinvent v3.6 database. Ecoinvent, a widely recognized and peer-reviewed LCA database, ensures transparent, consistent, and geographically representative datasets for energy systems, material production, transport, and waste management. This combined approach guarantees that the inventory reflects both actual industrial operations and robust background data for upstream processes.
A description of each section for both road types, the designation of each asphalt mixture evaluated, and the temperature production, as well as the bitumen, rubber, and aggregate content, are presented in Figure 3.
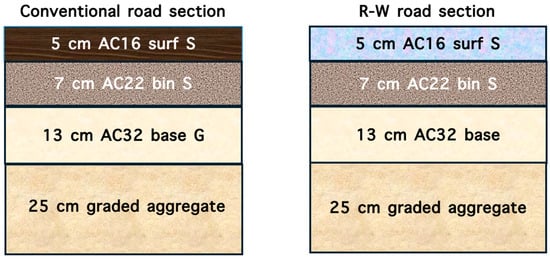
Figure 3.
Section types estimated for the conventional and R-W roads.
It can be observed that each road alternative consists of a four-layer structure: a surface course (AC16 surf S), a binder course (AC22 bin S), a base layer (AC32 base G), and a sub-base of unbound graded aggregates.
The layer compositions are not identical. While both pavement structures share the same binder, base, and sub-base layers, the surface course differs: the conventional road uses standard HMA, whereas the R-W road incorporates a surface layer containing 10% recycled rubber and a warm-mix additive.
Hence, the conventional road uses standard HMA in all asphalt layers produced at 170 °C (without any additives or rubber content). In contrast, the R-W road incorporates a surface course produced at a temperature of 140 °C.
The underlying layers remain identical in both alternatives in terms of material proportions and mixing temperatures. This design ensures structural comparability while allowing for a focused environmental analysis of the modified surface mixture.
Inventory components included the production of asphalt mixtures (base, intermediate, surface), material transport (40 km average), construction and maintenance operations, and energy inputs for equipment used in milling, sweeping, sealing, and compaction.
Bitumen production includes crude oil extraction, transport, and refining. The process is energy-intensive, involving distillation, partial oxidation, and the blending of additives for emulsified or modified bitumen. Emissions include CO2, CH4, SO2, non-methane volatile organic compounds (NMVOCs), and asphalt vapors. Aggregate production involves blasting, extraction, transport, crushing, and screening. These steps require substantial energy input (diesel and electricity) and emit GHGs and particulate matter. At the asphalt plant, diesel is the main energy source used during the mixing process, influencing both the thermal efficiency and the overall environmental impact of production. Energy consumption is directly linked to the mixing temperature, which significantly influences the environmental profile of each mixture.
The construction involved, firstly, the production of the asphalt mixtures (for the surface, intermediate, and base layers) at the asphalt plant and their transport to the working site, as well as its later extension and compaction. The same paving, compaction, and equipment procedures are used. The only variation occurs during the asphalt production phase, where 10% recycled rubber and a warm-mix additive are incorporated into the surface layer, allowing for a reduced mixing temperature (140 °C vs. 170 °C). Once produced, the material is handled and placed on-site using the same standard construction practices as conventional mixtures.
We also included the production and extension of the different and necessary coatings and their corresponding transport to the site. In general, for the transport, an average distance of 40 km was taken. For each operation, the corresponding machinery energy consumption has been considered. For the surface treatment, a slurry has been considered with its corresponding materials, manufacturing, transport, and machine energy consumption. Regarding milling and replacement operations, the total surface layer was removed. The milling, sweeping, and transport of the asphalt waste generated were considered, as well as the production of the replacement asphalt, its transport to the work site, and the extension and compaction of the corresponding tack coats. The energy for the milling and a sweeper machine to remove the surface layer were included. In general, materials and energy consumption for manufacturing and transport have been considered.
2.3. Life Cycle Assessment
Environmental impacts were assessed using the ILCD 2011 Midpoint+ method, implemented through the SimaPro software version v9.6.1. SimaPro is a widely used professional LCA tool that complies with the ISO 14040/14044 standards and enables the modeling and calculation of environmental impacts across multiple life cycle stages. It incorporates established databases such as Ecoinvent and supports impact assessment methods like ILCD 2011 Midpoint+, which was applied in this study to ensure methodological consistency and reliable results.
The method includes sixteen impact categories, such as climate change, fossil resource depletion, particulate matter formation, acidification, and toxicity. Each category aggregates environmental mechanisms to provide interpretable results at the midpoint level.
Once the inventories were compiled, the environmental results for all processes and stages were obtained based on the selected impact categories. As per ISO 14040, the impact category is the class representing environmental issues of concern, to which life cycle inventory analysis results may be assigned. In other words, an impact category combines multiple factors that have the same impact on the environment into a single environmental effect.
2.4. Interpretation
Results from the LCIA were interpreted to identify key contributors, trade-offs, and the potential environmental benefits of the R-W road system. A sensitivity analysis was conducted to assess the robustness of the findings under variations in rubber content, transport distance, and pavement lifespan.
3. Results and Discussion
3.1. Environmental Impacts of Each Road per Scenario
Table 2 presents the disaggregated environmental impact results per square meter of pavement for both the conventional road and R-W alternative. The impacts are broken down by life cycle phase—construction, milling, and surface treatment—allowing for a detailed comparison of the relative contributions of each stage. The data were normalized to a functional unit of 1 m2 to facilitate direct comparison. As illustrated, the construction phase dominates the overall environmental burden for both pavement types, particularly in categories such as climate change, energy use, and land occupation. The R-W pavement demonstrates slightly lower total impacts in most categories, largely due to the reduced milling energy and fewer maintenance interventions. These results serve as a foundation for the more aggregated comparisons presented in Table 3 and Table 4.
Table 2.
Results of environmental impacts for both roads per m2.
Table 3.
Total environmental impact results of the conventional road (m2·year).
Table 4.
Total environmental impact results of the R-W road (m2·year) for Scenarios 1 and 2.
3.2. Environmental Impacts of Each Road per Scenario with Different Lifespan Assumptions
Table 3 and Table 4 present the normalized life cycle impact results for both pavement alternatives, using a functional unit of 1 m2·year. Table 3 shows the total environmental impacts of the conventional road across multiple service life scenarios—10, 13, and 15 years—under both maintenance strategies (Scenarios 1 and 2).
In contrast, Table 4 reports the corresponding results for the R-W road, which is assumed to undergo a single rehabilitation step at year 15 in both scenarios. The results cover a comprehensive set of midpoint impact categories based on the ILCD 2011 methodology, allowing for a detailed comparison of emissions, resource use, and human and ecological health burdens between the alternatives. These tables provide the basis for quantifying the environmental advantages of the R-W pavement system under equivalent and extended maintenance assumptions.
3.3. Environmental Impact Reduction by Impact Category
Figure 4 and Figure 5 illustrate the percentage reductions in environmental impacts achieved by the R-W road compared to the conventional pavement for each ILCD 2011 midpoint impact category. The results are presented for three different time horizons, 10, 13, and 15 years, reflecting the service-life scenarios assessed in Table 3 and Table 4.
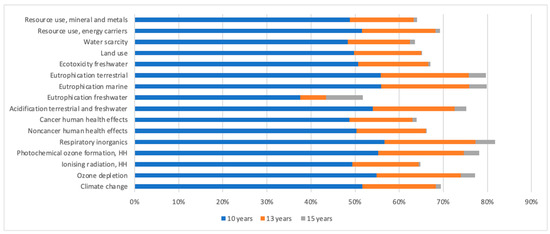
Figure 4.
Percentage reductions per ILCD midpoint category, Scenario 1, FU = 1 m2·year.
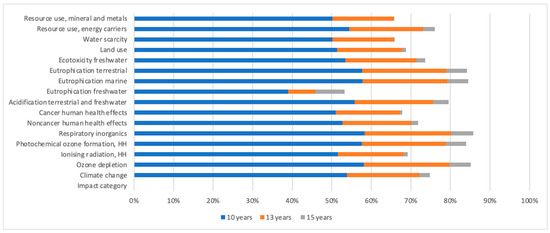
Figure 5.
Percentage reductions per ILCD midpoint category, Scenario 2, FU = 1 m2·year.
Figure 4 corresponds to Scenario 1, where both pavements are assumed to have the same total lifespan but differ in their maintenance frequency and intervention timing. Figure 5 represents Scenario 2, which assumes an extended service life for the R-W pavement, allowing for delayed maintenance (milling only at year 15).
Across both scenarios, the R-W alternative demonstrates consistent environmental advantages across all categories. In Scenario 1 (Figure 4), the average reduction ranges from approximately 30% to 55%, depending on the category and time frame. The most significant benefits are observed in climate change, resource use (energy carriers), and respiratory inorganics, indicating that the lower production temperature and reduced maintenance requirements of the R-W mixture lead to tangible environmental savings—even under conservative assumptions.
Therefore, even under the more conservative scenarios—where both pavements are assumed to have equivalent durability—the R-W road demonstrates meaningful reductions in environmental burdens. Moreover, when the extended-lifespan scenario is considered, these benefits become even more pronounced.
This consistency across scenarios strengthens the overall conclusion that the use of recycled rubber and warm-mix asphalt additives not only enhances the technical performance of the pavement but also delivers robust and sustained environmental advantages, making it a strategically sound choice in the context of sustainable infrastructure planning.
3.4. Contribution of Construction and Maintenance Phases to Environmental Impacts
Figure 6 and Figure 7 show the percentage contributions of each life cycle phase—construction, milling, and surface treatment—to the total environmental impacts for the conventional and R-W pavement alternatives, respectively. The results are presented across all midpoint impact categories and help to identify the most influential stages in the life cycle of each pavement type.
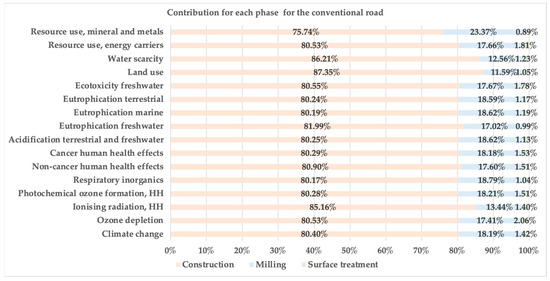
Figure 6.
Contributions of each life cycle phase to the total environmental impacts of the conventional road.
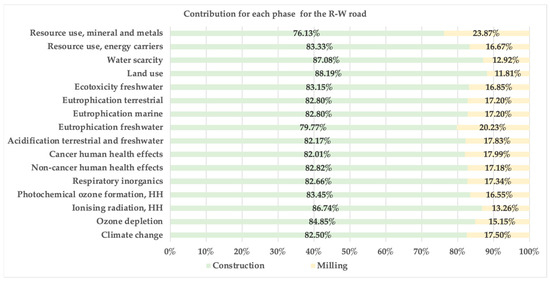
Figure 7.
Contributions of each life cycle phase to the total environmental impacts of the R-W road.
In both cases, the construction phase dominates the environmental profile, contributing between 75% and 88% of the total impacts in most categories. This is primarily due to the energy-intensive processes involved in asphalt production, particularly the use of bitumen and fuel combustion during mixing and paving.
For the conventional pavement (Figure 6), the milling phase contributes significantly to several categories, including resource use (minerals and metals) and climate change, accounting for up to 23% of the impact. Surface treatment, in contrast, shows a minimal contribution across all categories (generally under 2%), confirming its low environmental relevance.
In the R-W pavement (Figure 7), the contribution of milling is slightly lower, as expected due to the delayed intervention timing (only at year 15). While construction still dominates, the reduced milling frequency leads to lower overall impact shares from maintenance, particularly in categories sensitive to energy and fuel use, such as photochemical ozone formation, climate change, and ionizing radiation.
These findings highlight that early-stage interventions—such as optimizing asphalt production and incorporating recycled materials—offer the greatest environmental leverage. They also emphasize the importance of durable pavement designs that reduce the need for frequent maintenance.
Compared to the previous studies summarized in Table 1, the R-W pavement analyzed here shows substantially higher environmental gains. For example, our results indicate up to a 57% reduction in total emissions, whereas Cao et al. (2019) [7] achieved only ~20% reductions despite using warm-mix and rubberized mixtures, and Farina et al. [8] reported reductions below 15% in cradle-to-gate analyses. This highlights that the combination of warm-mix additives, rubber via dry process, and extended maintenance intervals delivers superior life cycle performance compared to other documented approaches.
3.5. Contribution of Construction and Maintenance Phases to Environmental Impacts
Figure 6 and Figure 7 illustrate the phase-wise distribution of environmental impacts for the conventional and R-W pavement alternatives, respectively. These figures disaggregate the total life cycle impacts by stage—namely construction, maintenance (milling), and surface treatment—providing valuable insights into the relative contributions of each phase.
In both pavement systems, the construction phase emerges as the predominant contributor to the overall environmental footprint, representing between 75% and 88% of the total impacts across most categories. This dominance is largely attributed to the high energy and material demands associated with the production of asphalt mixtures, particularly the consumption of bitumen and the energy used in asphalt plants, as well as the transport of raw materials to the construction site.
By contrast, the contribution of maintenance activities—including surface treatments and milling operations—is comparatively limited. Surface treatments in particular account for less than 2% of the total impacts, highlighting their minimal influence within the overall life cycle. Although milling operations have a slightly higher environmental burden, their relative impact remains modest compared to initial construction.
These results emphasize the importance of targeting emissions and resource use during the early stages of the pavement life cycle—particularly asphalt production and material transport—when aiming to reduce the environmental footprint of road infrastructure. They also reinforce the environmental value of durable pavement designs, such as the R-W system, which can delay or reduce the frequency of maintenance interventions.
3.6. Contribution of Individual Materials and Processes to Environmental Impacts
Figure 8 and Figure 9 show the disaggregated contributions of specific materials and processes to the total environmental impacts for the conventional and R-W road systems, respectively. The results are expressed as relative percentages across the ILCD 2011 midpoint categories, allowing the identification of key environmental hotspots throughout the life cycle.
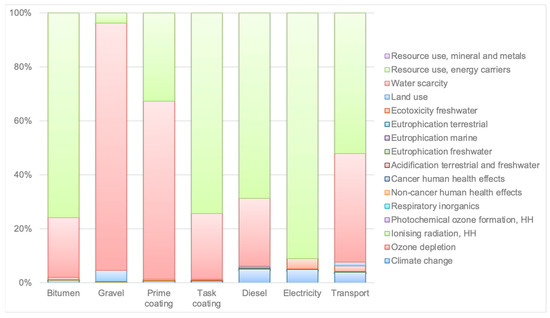
Figure 8.
Relative contributions of individual materials and processes to the total environmental impacts of the conventional pavement system.
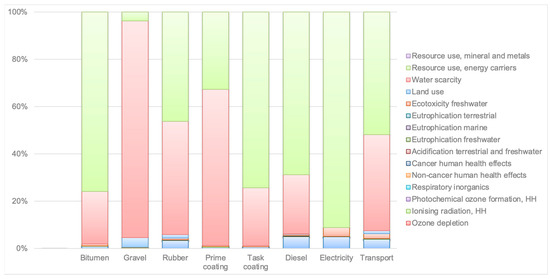
Figure 9.
Relative contributions of individual materials and processes to the total environmental impacts of the R-W pavement system.
In both pavement alternatives, bitumen and diesel consumption emerge as the dominant contributors to several impact categories, particularly climate change, human toxicity, and resource depletion. This is consistent with their energy-intensive production processes and high carbon intensity. For the conventional pavement (Figure 8), bitumen, gravel, and diesel account for a substantial share of the impacts in categories such as land use, water scarcity, and acidification.
In the R-W pavement (Figure 9), the addition of crumb rubber introduces a modest but visible contribution across multiple categories. While rubber slightly increases the impact in areas like ecotoxicity freshwater and resource use (minerals and metals), its inclusion enables lower production temperatures, which ultimately reduces the impacts associated with diesel and electricity use.
Notably, transport and electricity show a limited relative influence in both systems, although their impacts become more noticeable in categories sensitive to fuel combustion and energy generation, such as photochemical ozone formation or ionizing radiation.
These material-level insights complement the phase-based analysis presented earlier, emphasizing that targeted substitutions—such as replacing virgin inputs with recycled materials or using additives that enable energy savings—can yield significant environmental benefits.
To validate the robustness of these findings, a sensitivity analysis was performed by varying key parameters such as the rubber content in the mix (its variation will not change previous mechanical performance assumptions), average transport distances, and assumed pavement lifespan. The analysis confirmed that the R-W pavement consistently outperformed the conventional alternative under all tested conditions. Even in scenarios with reduced rubber content or conservative durability assumptions, the R-W solution retained its environmental advantage across most impact categories, demonstrating the resilience and scalability of this sustainable design approach.
4. Conclusions
This study employed a cradle-to-gate-plus-maintenance life cycle assessment (LCA) to evaluate the environmental performance of a conventional hot-mix asphalt (HMA) pavement in comparison with an alternative solution using rubberized warm-mix asphalt (R-W). The innovative design incorporates end-of-life tire (ELT) rubber via the dry process and a warm-mix asphalt additive that enables lower production temperatures. Two maintenance scenarios were assessed: Scenario 1 assumed an equal service life for both pavement types (10 years), while Scenario 2 extended the R-W surface layer’s lifespan to 15 years, based on empirical evidence of improved durability.
When environmental impacts were normalized to the FU of 1 m2·year, the R-W pavement exhibited reductions across all ILCD 2011 midpoint impact categories. Under the conservative scenario assuming equal durability, the average reductions ranged from 38% to 52%, with the most significant savings observed in climate change and land use categories. In the extended-lifespan scenario, the environmental benefits became even more pronounced, with reductions reaching up to 57%. Even in the least favorable category—freshwater eutrophication—the R-W alternative achieved a notable reduction of 32%. These consistent improvements highlight the environmental advantage of combining rubberized asphalt with warm-mix additives, especially when an extended service life is considered.
Phase-wise analysis revealed that the construction phase—dominated by material production and paving activities—accounted for between 75% and 88% of the total life-cycle impacts. In contrast, surface treatments contributed less than 2%, indicating that early-stage interventions, such as reducing the asphalt mixing temperatures, incorporating recycled inputs, and using alternative binders, offer the greatest environmental leverage.
The ‘hotspot’ analysis further identified bitumen production and diesel combustion as the principal contributors to greenhouse gas emissions and toxicity-related categories. Additionally, gravel extraction emerged as a key driver of land use change and freshwater eutrophication. These findings underscore the need for multi-indicator assessments when evaluating pavement technologies, as no single impact category adequately captures the full spectrum of environmental burdens.
The robustness of these conclusions was confirmed through a sensitivity analysis. Variations in rubber content, haul distances, and the established pavement lifespans (different scenarios) all showed that the R-W solution maintained its environmental advantages under a range of plausible conditions. This resilience highlights the low-risk nature of adopting rubberized warm-mix asphalt, especially for public agencies aiming to meet decarbonization targets.
In summary, this research demonstrates that a technically mature and scalable pavement alternative—based on recycled rubber and warm-mix technology—can deliver substantial environmental benefits over conventional HMA. Adoption at scale could contribute meaningfully to climate mitigation strategies, resource efficiency, and circular economy goals, while enhancing the long-term sustainability of road infrastructure.
In light of these findings, several practice- and policy-oriented recommendations emerge. The promotion of low-temperature, recycled-content asphalt mixes should be prioritized, as they effectively reduce energy consumption and the use of virgin materials without compromising pavement performance. Targeting emissions from the construction phase—where most environmental impacts occur—through the use of cleaner binders, alternative fuels, and on-site renewable energy sources will further enhance sustainability outcomes. Moreover, pavement durability should be formally recognized and incentivized via performance-based specifications, given that longer-lasting surfaces significantly reduce environmental burdens.
Finally, integrating LCA into public procurement processes is essential to identify environmental hotspots accurately and avoid shifting impacts across categories, thereby ensuring more comprehensive and responsible infrastructure planning.
Author Contributions
Conceptualization, A.M.R.-A.; Data curation, A.M.R.-A. and D.G.; Formal analysis, A.M.R.-A. and D.G.; Funding acquisition, A.M.R.-A.; Investigation, A.M.R.-A. and D.G.; Methodology, A.M.R.-A. and D.G.; Project administration, A.M.R.-A.; Resources, A.M.R.-A.; Software, D.G.; Supervision, A.M.R.-A.; Validation, A.M.R.-A.; Visualization, A.M.R.-A.; Writing—original draft, A.M.R.-A.; Writing—review and editing, A.M.R.-A. All authors have read and agreed to the published version of the manuscript.
Funding
This research was funded by Centro para el Desarrollo Tecnológico Industrial (CDTI), Grant No. IDI-20220471.
Institutional Review Board Statement
Not applicable.
Informed Consent Statement
Not applicable.
Data Availability Statement
Data are contained within the article.
Conflicts of Interest
The authors declare no conflicts of interest. The funders had no role in the design of the study; in the collection, analyses, or interpretation of the data; in the writing of the manuscript; or in the decision to publish the results.
Abbreviations
The following abbreviations are used in this manuscript:
| CTUh | Comparative Toxic Unit for Humans |
| CTUe | Comparative Toxic Unit for Ecosystems |
| EF | Environmental Footprint |
| ELTs | End-of-Life Tires |
| FU | Functional Unit |
| GHG | Greenhouse Gas |
| HH | Human Health |
| HMA | Hot-Mix Asphalt |
| ILCD | International Reference Life Cycle Data System |
| ISO | International Organization for Standardization |
| LCA | Life Cycle Assessment |
| LCI | Life Cycle Inventory |
| LCIA | Life Cycle Impact Assessment |
| RAP | Reclaimed Asphalt Pavement |
| R-W | Rubberized Warm-Mix Asphalt |
| WMA | Warm-Mix Asphalt |
References
- Lo Presti, D. Recycled Tyre Rubber Modified Bitumens for road asphalt mixtures: A literature review. Constr. Build. Mater. 2013, 49, 863–881. [Google Scholar] [CrossRef]
- Neto, S.A.D.; Farias, M.M.; Pais, J.C.; Pereira, P.A.; Sousa, J.B. Influence of Crumb Rubber and Digestion Time on the Asphalt Rubber Binders. Road Mater. Pavement Des. 2006, 7, 131–148. [Google Scholar] [CrossRef]
- Picado-Santos, L.G.; Capitão, S.D.; Neves, J.M. Crumb rubber asphalt mixtures: A literature review. Constr. Build. Mater. 2020, 247, 118577. [Google Scholar] [CrossRef]
- Eltwati, A.; Hainin, M.R.; Tarhuni, F.; Jusli, E.; Alamri, M. Effect of waste engine oil and warm mix additive on the physical, rheological, and short-term aging attributes of Styrene–Butadiene Rubber-modified asphalt binders. Case Stud. Constr. Mater. 2024, 21, e03433. [Google Scholar] [CrossRef]
- Bazoobandi, P.; Mousavi, S.R.; Karimi, F.; Karimi, H.R.; Ghasri, M.; Aliha, M. Cracking resistance of crumb rubber modified green asphalt mixtures, using calcium carbonate nanoparticles and two by-product wax-based warm mix additives. Constr. Build. Mater. 2024, 424, 135848. [Google Scholar] [CrossRef]
- Liu, Z.; Li, C.; Hu, X.; Wang, L. Finite element simulation of crack propagation behaviour of warm-mix steel slag crumb rubber-modified asphalt mixture. Constr. Build. Mater. 2025, 462, 140007. [Google Scholar] [CrossRef]
- Cao, R.; Leng, Z.; Li, D.; Zou, F. Comparative life cycle assessment of three types of crumb rubber modified asphalt under different system boundaries. Resour. Conserv. Recycl. 2025, 212, 107922. [Google Scholar] [CrossRef]
- Farina, A.; Zanetti, M.C.; Santagata, E.; Blengini, G.A. Life cycle assessment applied to bituminous mixtures containing recycled materials: Crumb rubber and reclaimed asphalt pavement. Resour. Conserv. Recycl. 2017, 117, 204–212. [Google Scholar] [CrossRef]
- Giani, M.I.; Dotelli, G.; Brandini, N.; Zampori, L. Comparative life cycle assessment of asphalt pavements using reclaimed asphalt, warm mix technology and cold in-place recycling. Resour. Conserv. Recycl. 2015, 104, 224–238. [Google Scholar] [CrossRef]
- Zhu, S.; Qin, X.; Xu, Z.; Xing, M. Life cycle assessment of energy consumption and carbon emissions of a green maintenance material for asphalt pavement: Warm mix OUFC-5. J. Clean. Prod. 2023, 428, 139481. [Google Scholar] [CrossRef]
- Vidal, R.; Moliner, E.; Martínez, G.; Rubio, M.C. Life cycle assessment of hot mix asphalt and zeolite-based warm mix asphalt with reclaimed asphalt pavement. Resour. Conserv. Recycl. 2013, 74, 101–114. [Google Scholar] [CrossRef]
- Sesay, T.; You, Q.; Chuan, J.; Qiao, H.; Zhang, H.; Tian, S. High and intermediate temperature performance of warm asphalt rubber containing conventional warm mix additives and novel chemical surfactant. Constr. Build. Mater. 2023, 394, 132214. [Google Scholar] [CrossRef]
- Rodríguez-Alloza, A.M.; Malik, A.; Lenzen, M.; Gallego, J. Hybrid input–output life cycle assessment of warm mix asphalt mixtures. J. Clean. Prod. 2015, 90, 171–182. [Google Scholar] [CrossRef]
- Zhao, W.; Yang, Q. Life cycle assessment and multi-index performance evaluation of semi-flexible pavement after composite modification by using fly ash, rubber particles, warm mixing asphalt and recycled asphalt pavement. Constr. Build. Mater. 2022, 364, 129945. [Google Scholar] [CrossRef]
- Cao, R.; Leng, Z.; Yu, H.; Hsu, S.-C. Comparative life cycle assessment of warm mix technologies in asphalt rubber pavements with uncertainty analysis. Resour. Conserv. Recycl. 2019, 147, 137–144. [Google Scholar] [CrossRef]
- Picado-Santos, L.G.; Capitão, S.D.; Dias, J.F. Crumb rubber asphalt mixtures by dry process: Assessment after eight years of use on a low/medium trafficked pavement. Constr. Build. Mater. 2019, 215, 9–21. [Google Scholar] [CrossRef]
- Santero, N.J.; Masanet, E.; Horvath, A. Life-cycle assessment of pavements. Part I: Critical review. Resour. Conserv. Recycl. 2011, 55, 801–809. [Google Scholar] [CrossRef]
- ISO 14040; Environmental Management—Life Cycle Assessment—Principles and Framework. International Organization for Standardization: Geneva, Switzerland, 2006.
- ISO 14044; Environmental Management—Life Cycle Assessment—Requirements and Guidelines. International Organization for Standardization: Geneva, Switzerland, 2006.
Disclaimer/Publisher’s Note: The statements, opinions and data contained in all publications are solely those of the individual author(s) and contributor(s) and not of MDPI and/or the editor(s). MDPI and/or the editor(s) disclaim responsibility for any injury to people or property resulting from any ideas, methods, instructions or products referred to in the content. |
© 2025 by the authors. Licensee MDPI, Basel, Switzerland. This article is an open access article distributed under the terms and conditions of the Creative Commons Attribution (CC BY) license (https://creativecommons.org/licenses/by/4.0/).