

Influence of Aluminum Alloy Substrate Temperature on Microstructure and Corrosion Resistance of Cr/Ti Bilayer Coatings
 ,
,  , ,
, ,
Abstract
1. Introduction
2. Materials and Methods
2.1. Coating Preparation
2.2. Characterization and Performance Testing
3. Results
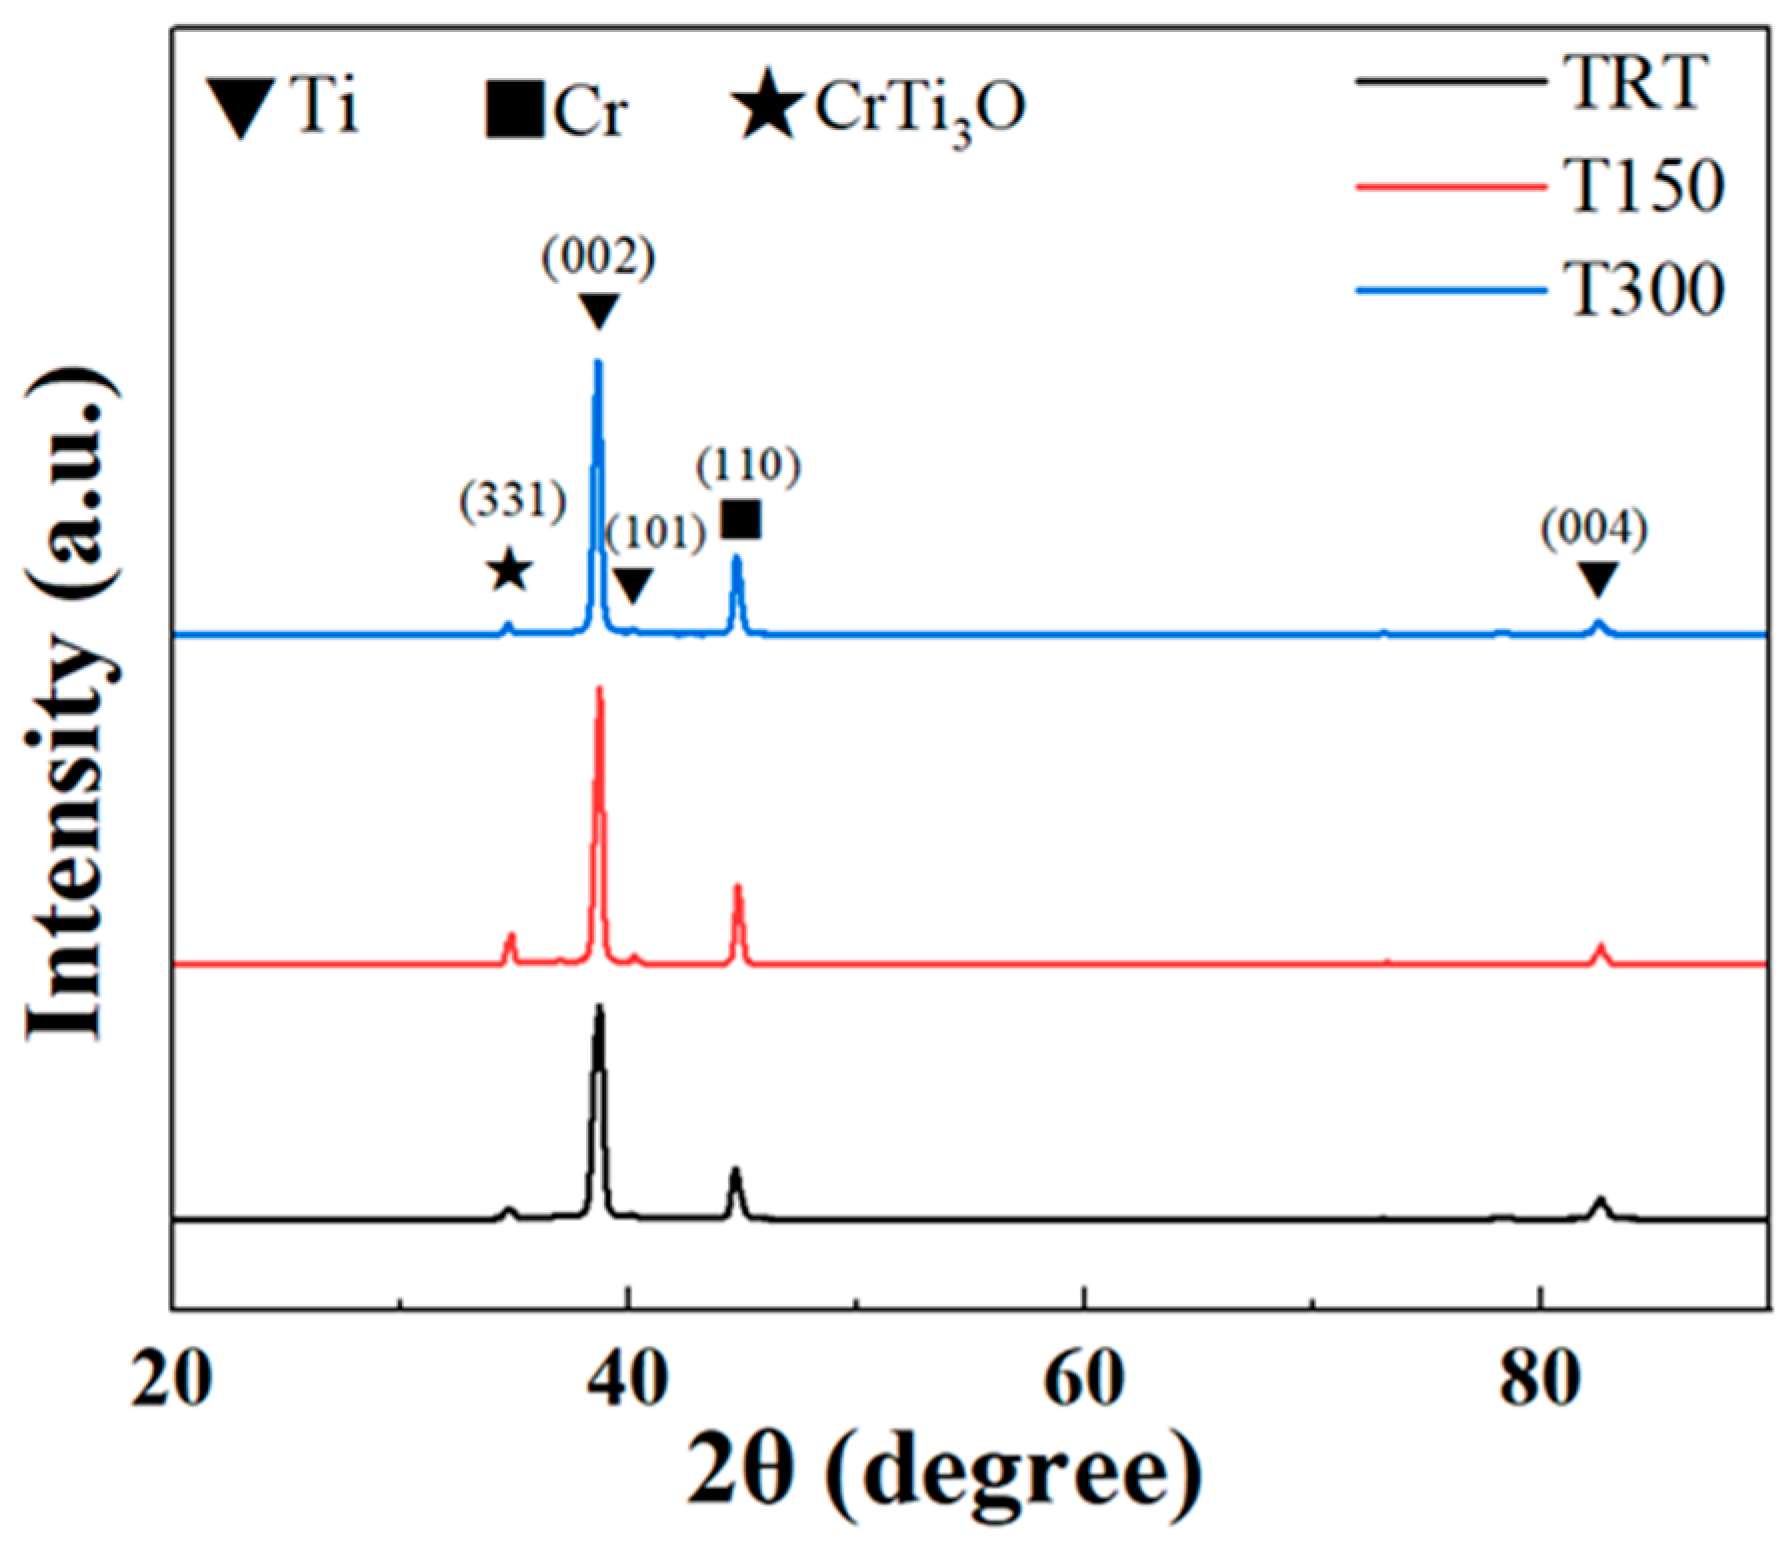
3.1. XRD Analysis
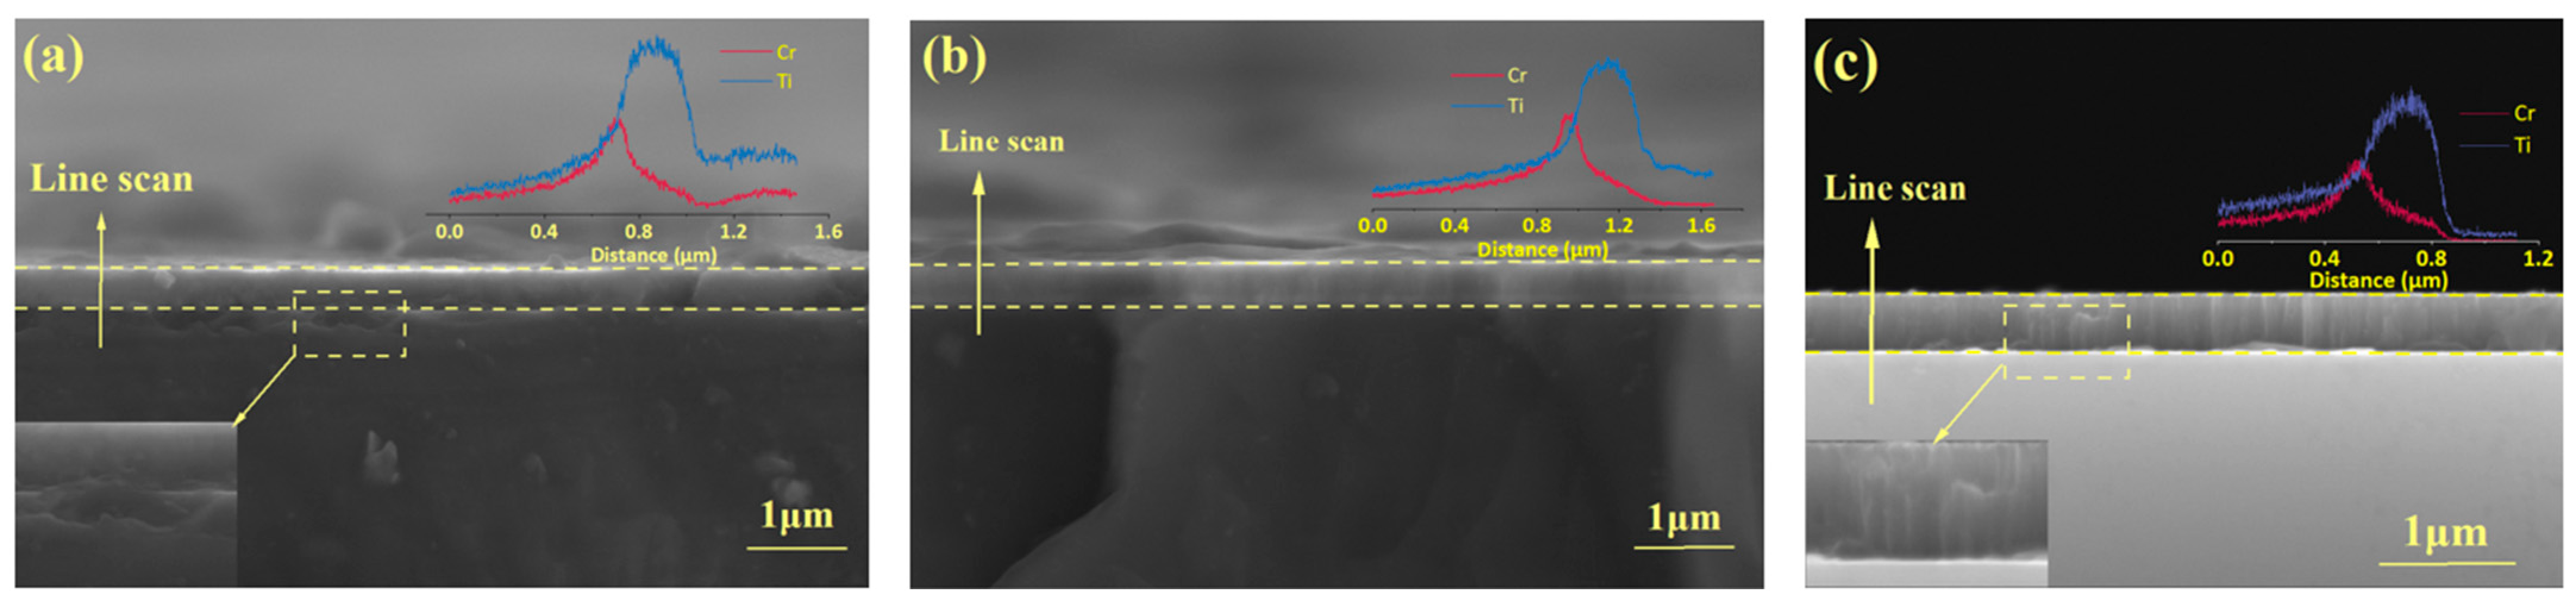
3.2. Microstructural and Compositional Analysis
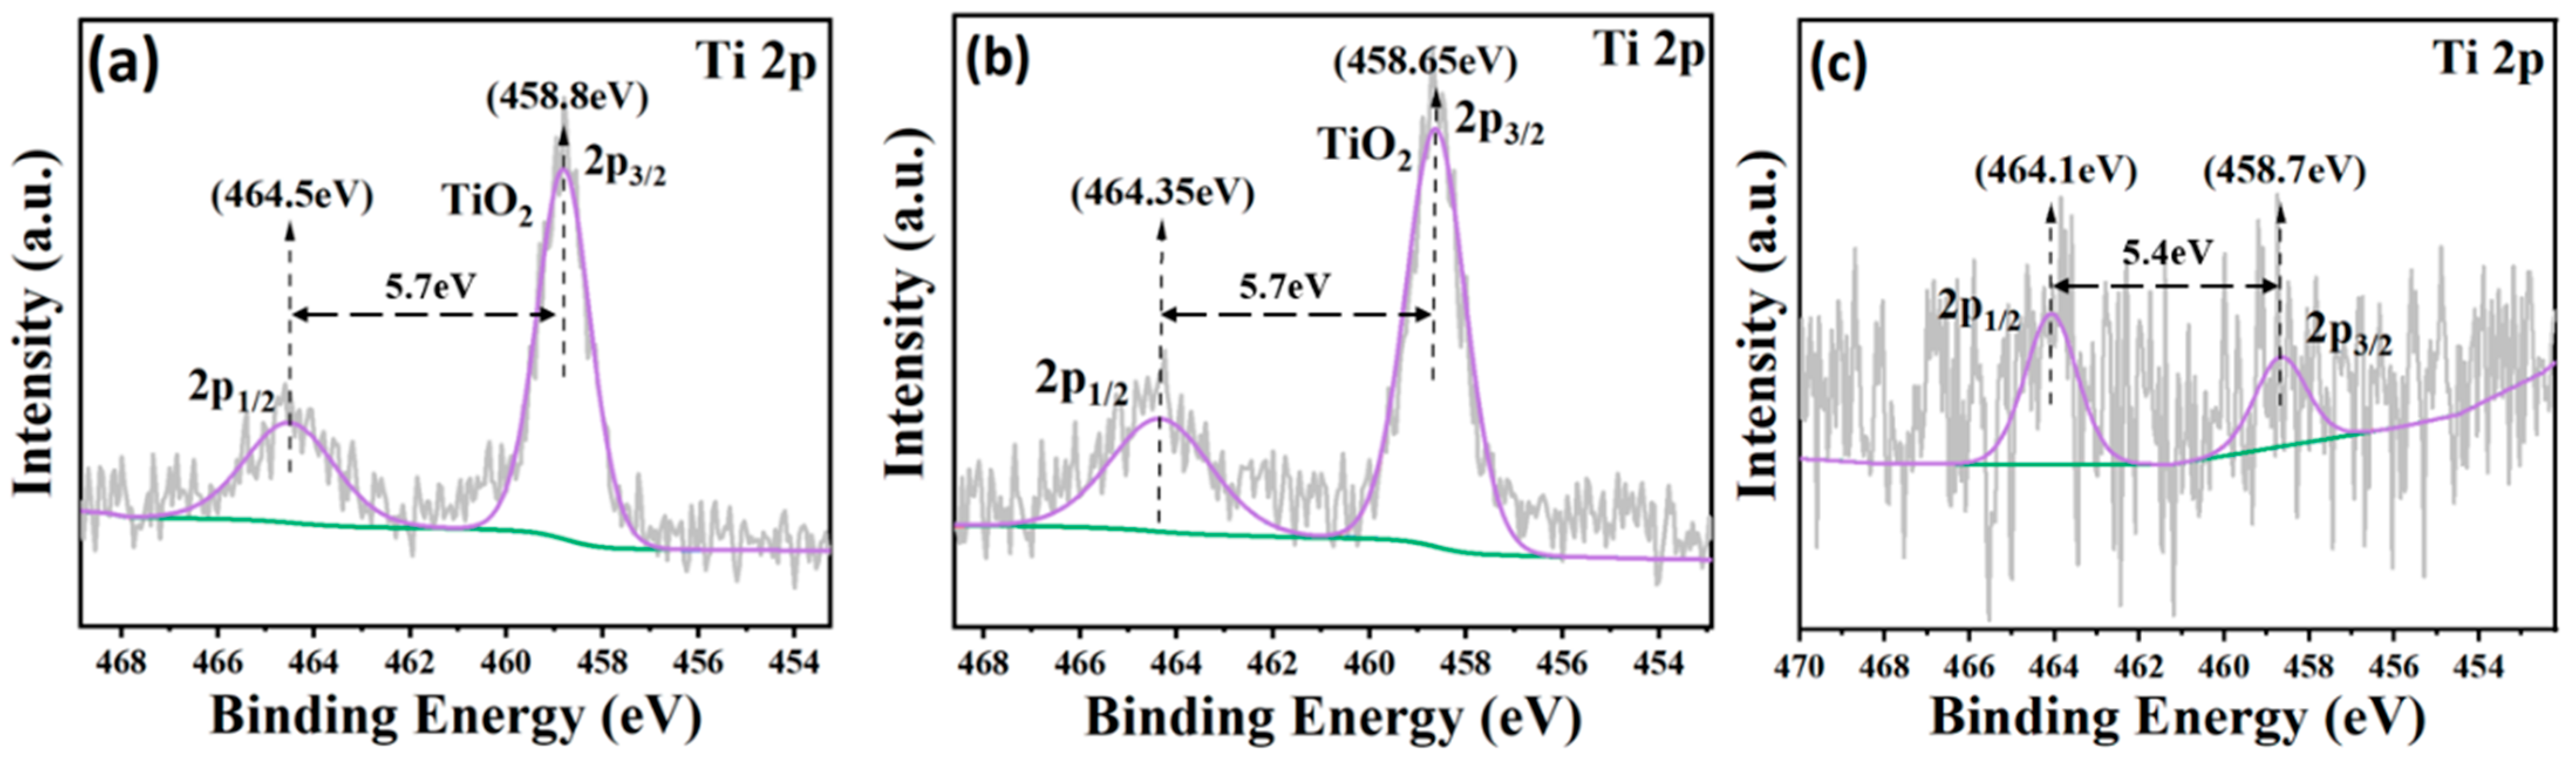
3.3. XPS Analysis
3.4. Hardness Testing
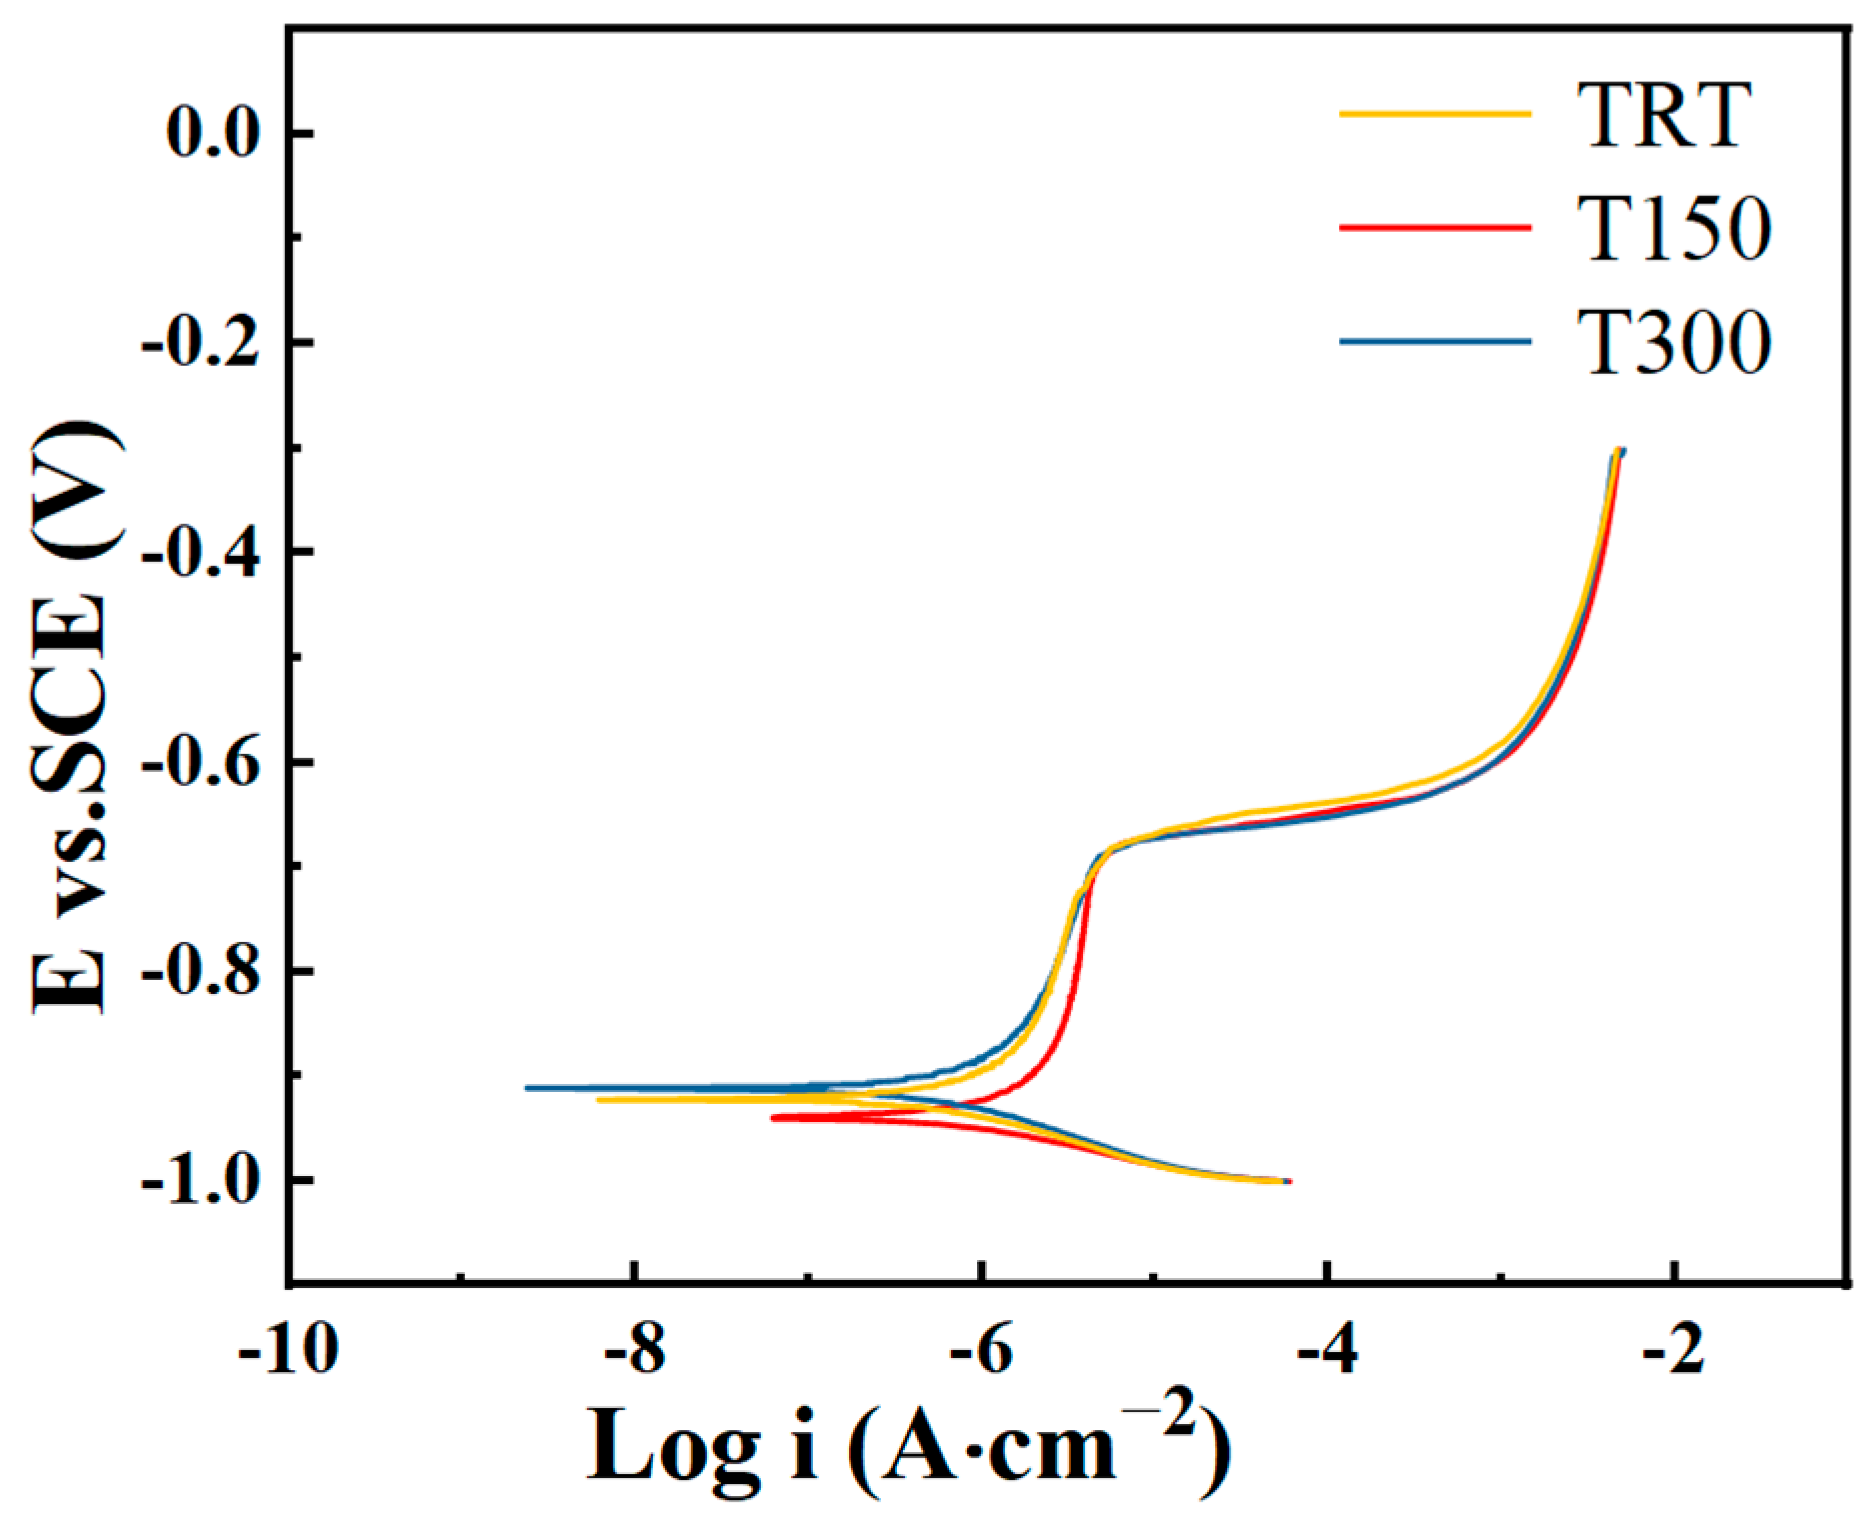
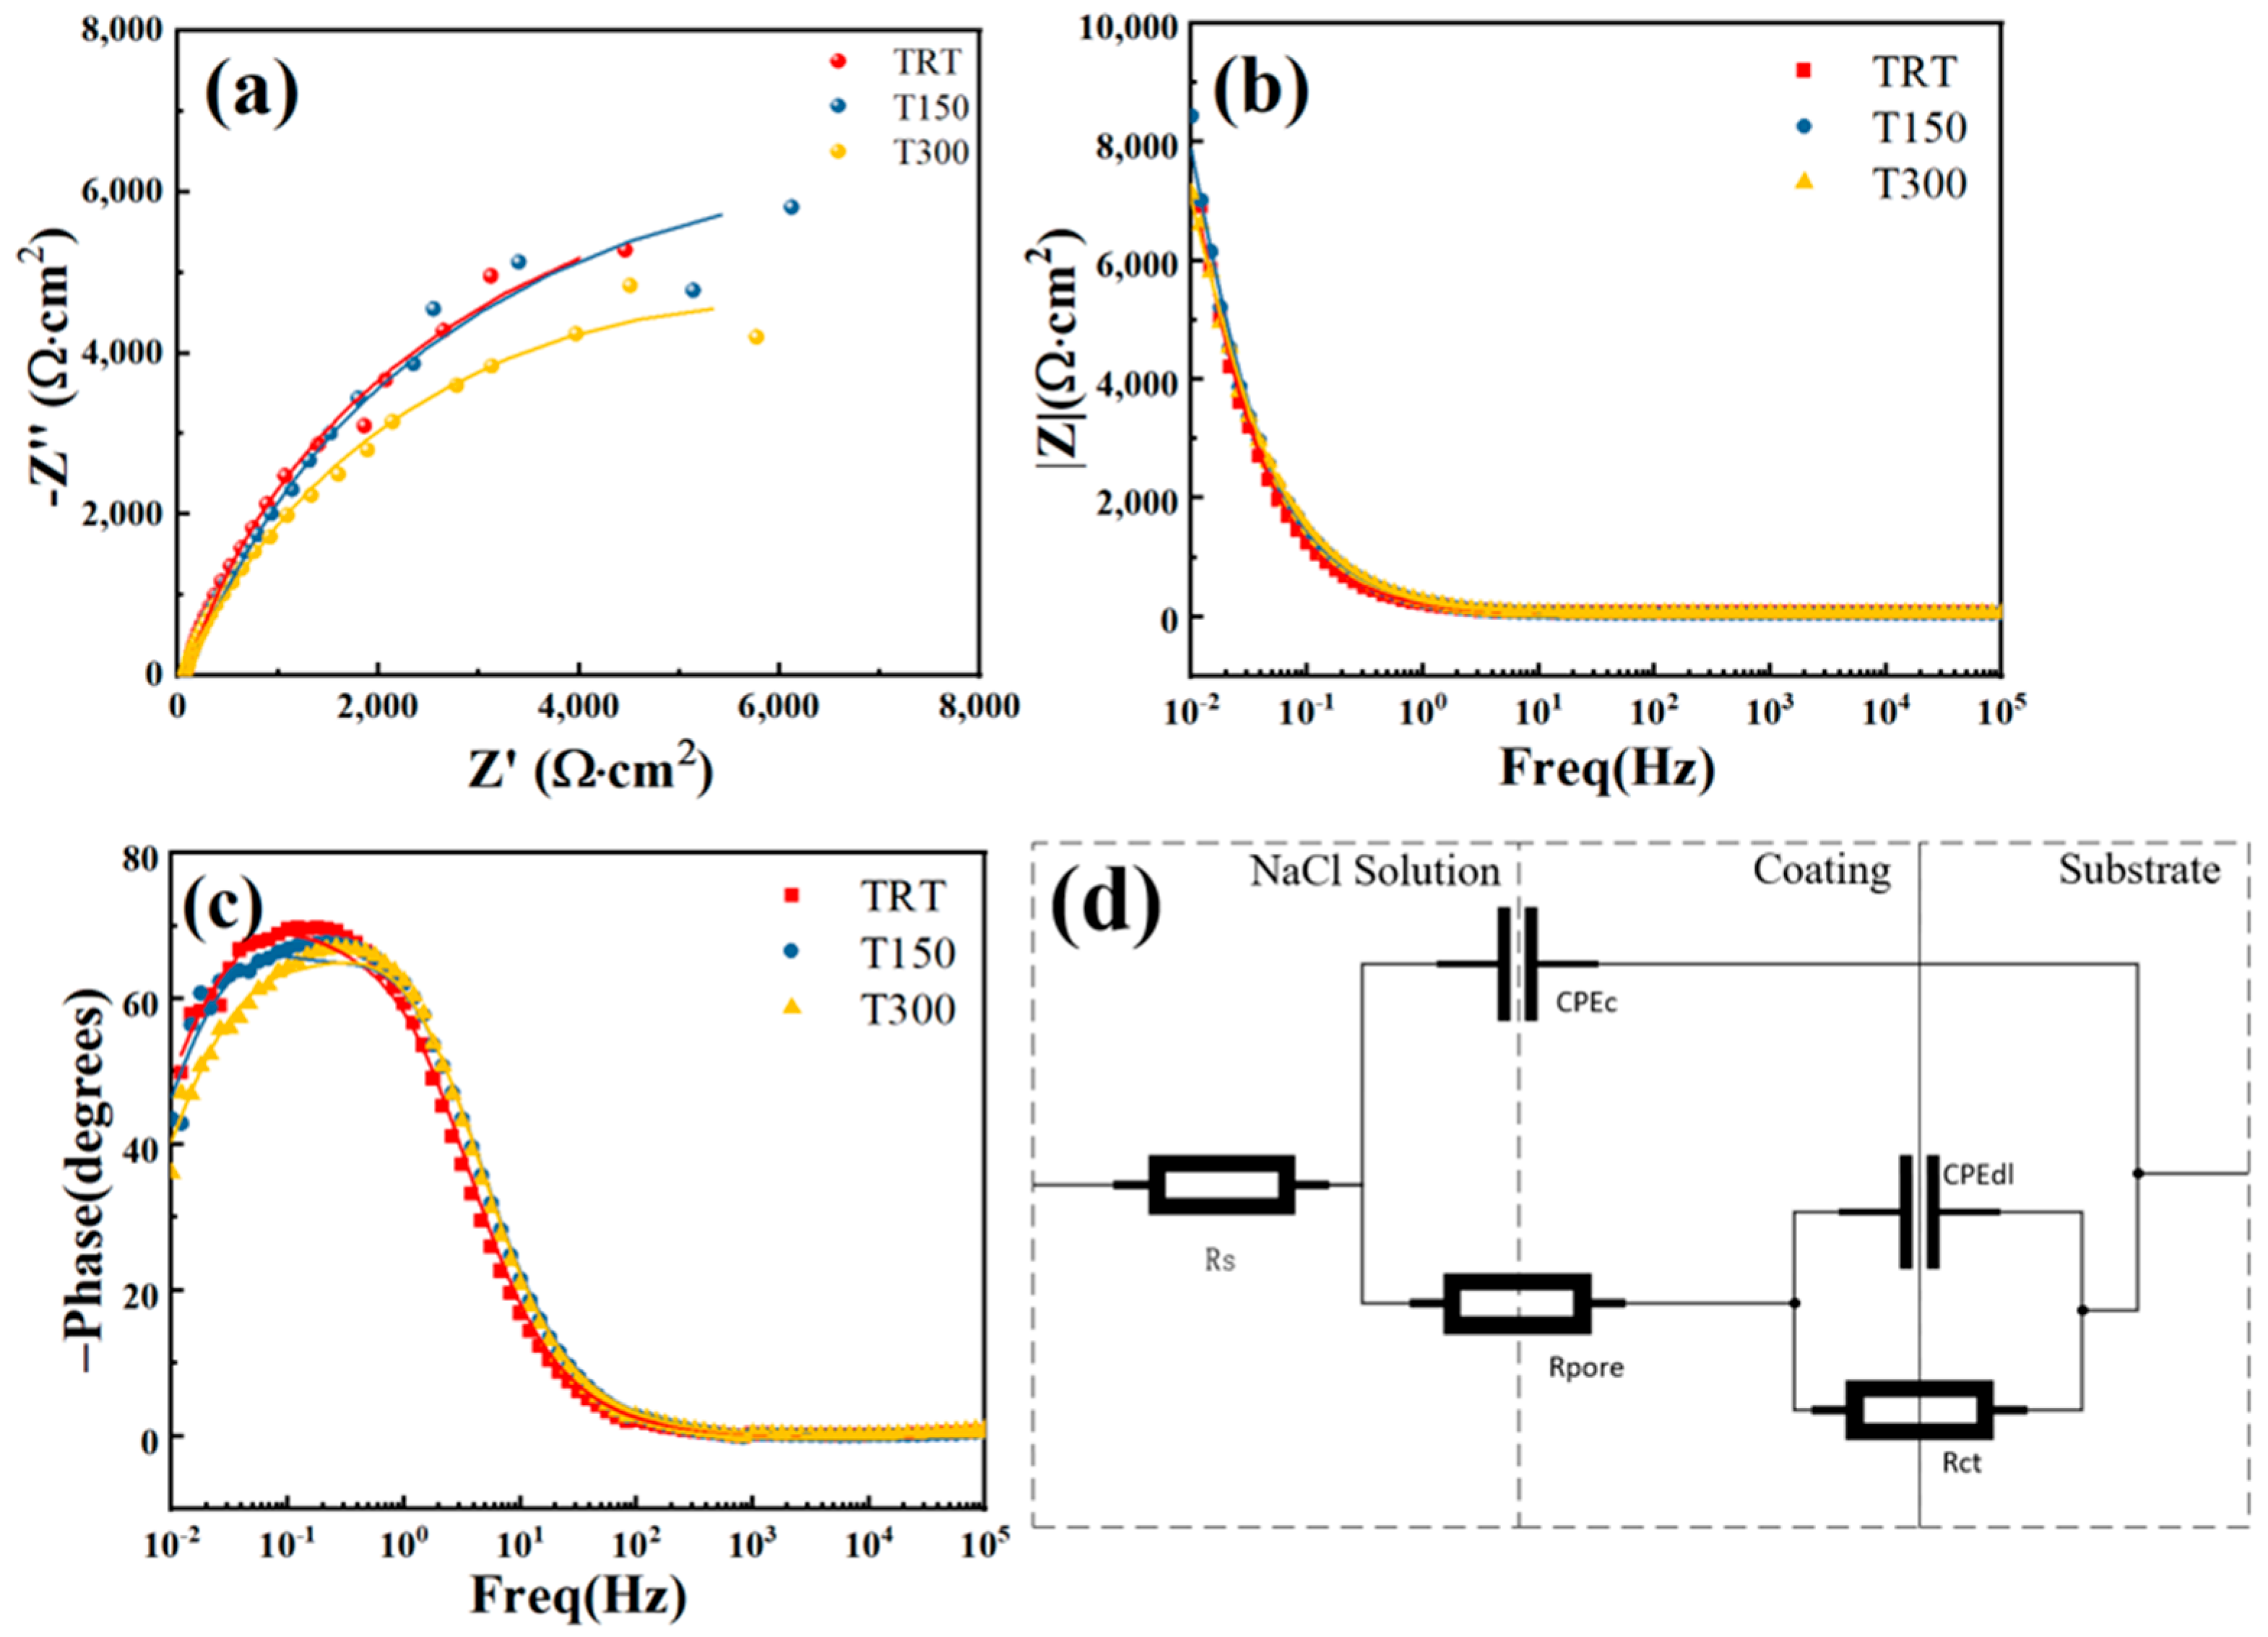
3.5. Electrochemical Testing
4. Discussion
5. Conclusions
- (1)
- Stability of phase structure: In the range of substrate temperature from room temperature to 300 °C, the Cr/Ti bilayer coatings deposited by magnetron sputtering all have Cr (110) and Ti (002) as the main phases.
- (2)
- Passivation film behavior: The titanium layer always forms a passivation film composed mainly of TiO2, which is the basis for the coating’s excellent corrosion resistance. The partial reduction reaction of TiO2 at 300 °C is correlated with the decrease in the electrochemical impedance value of the T300 coating.
- (3)
- The regulatory mechanism of substrate temperature on corrosion resistance: Within the temperature range of room temperature to 150 °C, the increase in pore density is the primary cause of the elevated corrosion rate; within the temperature range of 150 °C to 300 °C, the decrease in grain boundary density becomes the primary cause of the reduced corrosion rate. However, changing the passivation film composition from TiO2 to Ti2O3 or TiO reduces the electrochemical impedance.
- (4)
- There is a positive correlation between hardness values and substrate temperature: the higher the substrate temperature, the lower the stress level at the interface, the lower the defect density, and the higher the hardness value of the coating.
- (5)
- Coating properties: The TRT coating had a polarization resistance of 7.17 × 10⁴ Ω·cm2, a charge transfer resistance of 12,400 Ω·cm2, and a corrosion current density of 2.47 × 10⁻⁷ A·cm−2. The corrosion current density is two orders of magnitude lower than that of the 7050-aluminum alloy substrate, demonstrating excellent corrosion resistance.
Author Contributions
Funding
Institutional Review Board Statement
Informed Consent Statement
Data Availability Statement
Conflicts of Interest
References
- Moreto, J.A.; Marino, C.E.B.; Bose Filho, W.W.; Rocha, L.A.; Fernandes, J.C.S. SVET, SKP and EIS study of the corrosion behaviour of high strength Al and Al-Li alloys used in aircraft fabrication. Corros. Sci. 2014, 84, 30–41. [Google Scholar] [CrossRef]
- Dagdag, O.; Berisha, A.; Mehmeti, V.; Haldhar, R.; Berdimurodov, E.; Hamed, O.; Jodeh, S.; Lgaz, H.; Sherif, E.-S.M.; Ebenso, E.E. Epoxy coating as effective anti-corrosive polymeric material for aluminum alloys: Formulation, electrochemical and computational approaches. J. Mol. Liq. 2022, 346. [Google Scholar] [CrossRef]
- Merten, B.J.E.; Battocchi, D.; Bierwagen, G.P. Aluminum alloy 2024-T3 protection by magnesium-rich primer with chromate-free metal salts. Prog. Org. Coatings 2015, 78, 446–454. [Google Scholar] [CrossRef]
- Szklarska-Smialowska, Z. Pitting corrosion of aluminum. Corros. Sci. 1999, 41, 1743–1767. [Google Scholar] [CrossRef]
- Liew, Y.; Örnek, C.; Pan, J.; Thierry, D.; Wijesinghe, S.; Blackwood, D.J. Towards understanding micro-galvanic activities in localised corrosion of AA2099 aluminium alloy. Electrochimica Acta 2021, 392, 1390056. [Google Scholar] [CrossRef]
- Zhang, J.-J.; He, T.; Du, X.-Y.; Alexer, V.; Song, M.; Chen, X.-L.; Li, J. Effect of pre-heat treatment and subsequent ECAP-CU on microstructure and corrosion behavior of 7075 Al alloy fasteners. J. Central South Univ. 2025, 45, 1–21. [Google Scholar] [CrossRef]
- Li, J.; He, T.; Du, X.-Y.; Vereschaka, A.; Zhang, J.-J. Regulating hardness homogeneity and corrosion resistance of Al-Zn-Mg-Cu alloy via ECAP combined with inter-pass aging. Mater. Charact. 2024, 218, 114489. [Google Scholar] [CrossRef]
- Zhang, F.; Ju, P.; Pan, M.; Zhang, D.; Huang, Y.; Li, G.; Li, X. Self-healing mechanisms in smart protective coatings: A review. Corros. Sci. 2018, 144, 74–88. [Google Scholar] [CrossRef]
- Habibiyan, A.; Ramezanzadeh, B.; Mahdavian, M.; Bahlakeh, G.; Kasaeian, M. Rational assembly of mussel-inspired polydopamine (PDA)-Zn (II) complex nanospheres on graphene oxide framework tailored for robust self-healing anti-corrosion coatings application. Chem. Eng. J. 2020, 391, 123630. [Google Scholar] [CrossRef]
- Huang, Y.; Deng, L.; Ju, P.; Huang, L.; Qian, H.; Zhang, D.; Li, X.; Terryn, H.A.; Mol, J.M.C. Triple-Action Self-Healing Protective Coatings Based on Shape Memory Polymers Containing Dual-Function Microspheres. ACS Appl. Mater. Interfaces 2018, 10, 23369–23379. [Google Scholar] [CrossRef]
- Cai, G.; Xiao, S.; Deng, C.; Jiang, D.; Zhang, X.; Dong, Z. CeO2 grafted carbon nanotube via polydopamine wrapping to enhance corrosion barrier of polyurethane coating. Corros. Sci. 2021, 178, 109014. [Google Scholar] [CrossRef]
- Ma, L.; Ren, C.; Wang, J.; Liu, T.; Yang, H.; Wang, Y.; Huang, Y.; Zhang, D. Self-reporting coatings for autonomous detection of coating damage and metal corrosion: A review. Chem. Eng. J. 2021, 421, 127854. [Google Scholar] [CrossRef]
- Capelossi, V.; Poelman, M.; Recloux, I.; Hernandez, R.; de Melo, H.; Olivier, M. Corrosion protection of clad 2024 aluminum alloy anodized in tartaric-sulfuric acid bath and protected with hybrid sol–gel coating. Electrochimica Acta 2014, 124, 69–79. [Google Scholar] [CrossRef]
- Recloux, I.; Mouanga, M.; Druart, M.-E.; Paint, Y.; Olivier, M.-G. Silica mesoporous thin films as containers for benzotriazole for corrosion protection of 2024 aluminium alloys. Appl. Surf. Sci. 2015, 346, 124–133. [Google Scholar] [CrossRef]
- Zhang, F.; Yan, M. Microstructure and mechanical properties of multiphase layer formed during depositing Ti film followed by plasma nitriding on 2024 aluminum alloy. Appl. Surf. Sci. 2014, 301, 410–417. [Google Scholar] [CrossRef]
- Živković, L.; Popić, J.; Jegdić, B.; Dohčević-Mitrović, Z.; Bajat, J.; Mišković-Stanković, V. Corrosion study of ceria coatings on AA6060 aluminum alloy obtained by cathodic electrodeposition: Effect of deposition potential. Surf. Coatings Technol. 2014, 240, 327–335. [Google Scholar] [CrossRef]
- Lv, J.; Yue, Q.-X.; Ding, R.; Li, W.-H.; Wang, X.; Gui, T.-J.; Zhao, X.-D. Intelligent anti-corrosion and corrosion detection coatings based on layered supramolecules intercalated by fluorescent off-on probes. J. Taiwan Inst. Chem. Eng. 2021, 118, 309–324. [Google Scholar] [CrossRef]
- Bera, S.; Rout, T.; Udayabhanu, G.; Narayan, R. Water-based & eco-friendly epoxy-silane hybrid coating for enhanced corrosion protection & adhesion on galvanized steel. Prog. Org. Coatings 2016, 101, 24–44. [Google Scholar] [CrossRef]
- Lin, Y.; Chen, R.; Zhang, Y.; Lin, Z.; Liu, Q.; Liu, J.; Wang, Y.; Gao, L.; Wang, J. Sandwich-like polyvinyl alcohol (PVA) grafted graphene: A solid-inhibitors container for long term self-healing coatings. Chem. Eng. J. 2020, 383, 123203. [Google Scholar] [CrossRef]
- Xue, N.; Li, W.; Shao, L.; Chen, Y.; Wu, Y.; Luo, M.; Sajjad, K.; Dai, S.; Zhu, L. Characterization of monolayer and single-pass pure Cu coatings applied to 6061 T6 Al alloy and AZ31B Mg alloy substrates using high-pressure cold spray technology. J. Mater. Res. Technol. 2025, 36, 252–271. [Google Scholar] [CrossRef]
- Mahton, Y.; Kamde, M.A.; Saha, P. Influence of Cu addition on the microstructure, and corrosion behavior of electroless Ni-Cu-P coating on squeeze-cast Al-Cu-Mg alloy. Surf. Coatings Technol. 2024, 494, 131544. [Google Scholar] [CrossRef]
- Li, Y.; Shi, Y. Microhardness, wear resistance, and corrosion resistance of AlxCrFeCoNiCu high-entropy alloy coatings on aluminum by laser cladding. Opt. Laser Technol. 2021, 134, 106632. [Google Scholar] [CrossRef]
- Ye, T.; Ma, J.; Jia, Z.; Li, T.; Liu, W.; Yu, W. Microstructure, mechanical properties and low-temperature tribological behavior of Cr/Cr-W/W-DLC/DLC multilayer coatings on 5A06 Al alloy. J. Mater. Res. Technol. 2022, 18, 810–819. [Google Scholar] [CrossRef]
- Li, C.; Li, G.; Lü, W.; Deng, J.; Song, Z.; Wang, Q. Effect of carbon content on the structure and mechanical properties of (TiAlTaCrZr)CN high entropy alloy carbonitride coatings prepared by magnetron sputtering. Ceram. Int. 2025, 51, 11499–11508. [Google Scholar] [CrossRef]
- Yang, X.; Du, Y.; Du, H.; Tang, Z. Tribocorrosion behavior of magnetron-sputtered MoS2-TiCr composite coatings. Ceram. Int. 2025. [Google Scholar] [CrossRef]
- Arnell, R.; Kelly, P. Recent advances in magnetron sputtering. Surf. Coatings Technol. 1999, 112, 170–176. [Google Scholar] [CrossRef]
- Liang, S.-C.; Chang, Z.-C.; Tsai, D.-C.; Lin, Y.-C.; Sung, H.-S.; Deng, M.-J.; Shieu, F.-S. Effects of substrate temperature on the structure and mechanical properties of (TiVCrZrHf)N coatings. Appl. Surf. Sci. 2011, 257, 7709–7713. [Google Scholar] [CrossRef]
- Pershin, V.; Lufitha, M.; Chandra, S.; Mostaghimi, J. Effect of Substrate Temperature on Adhesion Strength of Plasma-Sprayed Nickel Coatings. J. Therm. Spray Technol. 2003, 12, 370–376. [Google Scholar] [CrossRef]
- Lai, C.-H.; Tsai, M.-H.; Lin, S.-J.; Yeh, J.-W. Influence of substrate temperature on structure and mechanical, properties of multi-element (AlCrTaTiZr)N coatings. Surf. Coatings Technol. 2007, 201, 6993–6998. [Google Scholar] [CrossRef]
- Khakzadian, J.; Hosseini, S.; Madar, K.Z. The effect of the substrate temperature on the microstructure properties of the NiCrAl coating in cathodic arc deposition. Surf. Coatings Technol. 2018, 337, 342–348. [Google Scholar] [CrossRef]
- Shi, W.; Peng, J.; Xu, Z.; Shen, Q.; Wang, C. Effect of Power on Structural and Mechanical Properties of DC Magnetron Sputtered Cr Coatings. Metals 2023, 13, 691. [Google Scholar] [CrossRef]
- Kaim, P.; Lukaszkowicz, K.; Szindler, M.; Szindler, M.M.; Basiaga, M.; Hajduk, B. The Influence of Magnetron Sputtering Process Temperature on ZnO Thin-Film Properties. Coatings 2021, 11, 1507. [Google Scholar] [CrossRef]
- Jiang, X.; Guo, R.; Jiang, S. Evaluation of self-healing ability of Ce–V conversion coating on AZ31 magnesium alloy. J. Magnes. Alloy. 2016, 4, 230–241. [Google Scholar] [CrossRef]
- Li, H.; Sun, P.; Cheng, D.; Liu, Z. Effects of deposition temperature on structure, residual stress and corrosion behavior of Cr/TiN/Ti/TiN films. Ceram. Int. 2021, 47, 34909–34917. [Google Scholar] [CrossRef]
- Biesinger, M.C.; Payne, B.P.; Grosvenor, A.P.; Lau, L.W.M.; Gerson, A.R.; Smart, R.S.C. Resolving surface chemical states in XPS analysis of first row transition metals, oxides and hydroxides: Cr, Mn, Fe, Co and Ni. Appl. Surf. Sci. 2011, 257, 2717–2730. [Google Scholar] [CrossRef]
- Bahrami, A.; Delgado, A.; Onofre, C.; Muhl, S.; Rodil, S.E. Structure, mechanical properties and corrosion re-sistance of amorphous Ti-Cr-O coatings. Surf. Coat. Technol. 2019, 374, 690–699. [Google Scholar] [CrossRef]
- Oktay, S.; Kahraman, Z.; Urgen, M.; Kazmanli, K. XPS investigations of tribolayers formed on TiN and (Ti,Re)N coatings. Appl. Surf. Sci. 2015, 328, 255–261. [Google Scholar] [CrossRef]
- Manurung, P.; Putri, Y.; Simanjuntak, W.; Low, I. Synthesis and characterisation of chemical bath deposited TiO2 thin-films. Ceram. Int. 2013, 39, 255–259. [Google Scholar] [CrossRef]
- Shi, X.; Xu, L.; Wang, Q. Porous TiO2 film prepared by micro-arc oxidation and its electrochemical behaviors in Hank’s solution. Surf. Coatings Technol. 2010, 205, 1730–1735. [Google Scholar] [CrossRef]
- Tu, Y.; Li, J.; Yuan, Y.; Zhao, J.; Hameed, A.; Yan, C.; Chen, H.; Lan, R.; Cheng, B.; Wang, P. Thickness mod-ulation influenced mechanical properties of TiN/(CrVTaTiW) Nx multilayer coatings. Ceram. Int. 2024, 50, 53007–53014. [Google Scholar] [CrossRef]
- Mei, F.; Zhijian, Z.; Yang, Y.; Xiaoliang, L.; Jiangxiong, G.; Tiechui, Y.; Jianguo, L. Microstructure, mechanical, tribological, and oxidizing properties of AlCrSiN/AlCrVN/AlCrNbN multilayer coatings with different modulated thicknesses. Ceram. Int. 2022, 48, 32973–32985. [Google Scholar] [CrossRef]
- Kim, G.; Lee, S.; Hahn, J.; Lee, B.; Han, J.; Lee, J. Effects of the thickness of Ti buffer layer on the mechanical properties of TiN coatings. Surf. Coatings Technol. 2003, 171, 83–90. [Google Scholar] [CrossRef]
- Cao, H.; Qi, F.; Ouyang, X.; Zhao, N.; Zhou, Y.; Li, B.; Luo, W.; Liao, B.; Luo, J. Effect of Ti Transition Layer Thickness on the Structure, Mechanical and Adhesion Properties of Ti-DLC Coatings on Aluminum Alloys. Materials 2018, 11, 1742. [Google Scholar] [CrossRef]
- Wu, G.; Li, L.; Sun, M.; Wang, Y.; Luo, F.; Zhang, Q.; Liu, R.; Chen, Z.; Yao, J. Microstructural evolution and biological properties of PEO coating on SLM-prepared NiTi alloy. Surf. Coatings Technol. 2022, 452, 129065. [Google Scholar] [CrossRef]
- Wu, L.; Ding, X.; Zheng, Z.; Tang, A.; Zhang, G.; Atrens, A.; Pan, F. Doublely-doped Mg-Al-Ce-V2O74- LDH composite film on magnesium alloy AZ31 for anticorrosion. J. Mater. Sci. Technol. 2021, 64, 66–72. [Google Scholar] [CrossRef]
- He, T.; Valery, Z.; Vereschaka, A.; Keshin, A.; Huo, Y.; Milovich, F.; Sotova, C.; Seleznev, A. Influence of niobium and hafnium doping on the wear and corrosion resistance of coatings based on ZrN. J. Mater. Res. Technol. 2023, 27, 6386–6399. [Google Scholar] [CrossRef]
- Chen, K.; He, T.; Du, X.; Vereschaka, A.; Sotova, C.; Ding, Y.; Li, J. Corrosion Resistance of Ti/Cr Gradient Modulation Period Nanomultilayer Coatings Prepared by Magnetron Sputtering on 7050 Aluminum Alloy. Inorganics 2025, 13, 242. [Google Scholar] [CrossRef]
- Molaei, M.; Fattah-alhosseini, A.; Nouri, M.; Mahmoodi, P.; Navard, S.H.; Nourian, A. Enhancing cytocom-patibility, antibacterial activity and corrosion resistance of PEO coatings on titanium using incorporated ZrO2 nanopar-ticles. Surf. Interfaces. 2022, 30, 101967. [Google Scholar] [CrossRef]
- Tao, H.; Zhylinski, V.; Vereschaka, A.; Chayeuski, V.; Yuanming, H.; Milovich, F.; Sotova, C.; Seleznev, A.; Salychits, O. Comparison of the Mechanical Properties and Corrosion Resistance of the Cr-CrN, Ti-TiN, Zr-ZrN, and Mo-MoN Coatings. Coatings 2023, 13, 750. [Google Scholar] [CrossRef]
- Ren, C.; Huang, Y.; Hao, W.; Zhang, D.; Luo, X.; Ma, L.; Wang, J.; Chowwanonthapunya, T.; Dong, C.; Li, X. Multi-action self-healing coatings with simultaneous recovery of corrosion resistance and adhesion strength. J. Mater. Sci. Technol. 2022, 101, 18–27. [Google Scholar] [CrossRef]
- Ma, L.; Xu, D.; Wu, S.; Guo, X.; Liu, T.; Wei, M.; Wang, J.; Chen, Z.; Zhang, D. Polyurethane coatings with corrosion inhibition and color-fluorescence damage reporting properties based on APhen-grafted carbon dots. Corros. Sci. 2024, 232, 112038. [Google Scholar] [CrossRef]
- Cai, M.; Fan, X.; Yan, H.; Li, Y.; Song, S.; Li, W.; Li, H.; Lu, Z.; Zhu, M. In situ assemble Ti3C2Tx MXene@MgAl-LDH heterostructure towards anticorrosion and antiwear application. Chem. Eng. J. 2021, 419, 130050. [Google Scholar] [CrossRef]
- Yeganeh, M.; Asadi, N.; Omidi, M.; Mahdavian, M. An investigation on the corrosion behavior of the epoxy coating embedded with mesoporous silica nanocontainer loaded by sulfamethazine inhibitor. Prog. Org. Coatings 2019, 128, 75–81. [Google Scholar] [CrossRef]
- Chen, Z.; Wang, J.; Lu, L.; Chowwanonthapunya, T.; Chen, W.; Li, Z.; Ma, L.; Zhang, D. Corrosion-oriented self-healing coating based on ZnMg MOF for efficient corrosion protection of aluminum alloy via in-situ LDH film formation. Chem. Eng. J. 2024, 500, 156898. [Google Scholar] [CrossRef]
- Lin, C.; Duh, J. Electrochemical impedance spectroscopy (EIS) study on corrosion performance of CrAlSiN coated steels in 3.5 wt.% NaCl solution. Surf. Coatings Technol. 2009, 204, 784–787. [Google Scholar] [CrossRef]
- Jung, H.; Alfantazi, A. An electrochemical impedance spectroscopy and polarization study of nanocrystalline Co and Co–P alloy in 0.1 M H2SO4 solution. Electrochim. Acta 2006, 51, 1806–1814. [Google Scholar] [CrossRef]
- Moradighadi, N.; Nesic, S.; Tribollet, B. Identifying the dominant electrochemical reaction in electrochemical impedance spectroscopy. Electrochim. Acta 2021, 400, 139460. [Google Scholar] [CrossRef]
- Diethelm, S.; Closset, A.; Van Herle, J.; Nisancioglu, K. Determination of Chemical Diffusion and Surface Exchange Coefficients of Oxygen by Electrochemical Impedance Spectroscopy. J. Electrochem. Soc. 2002, 149, E424–E432. [Google Scholar] [CrossRef]
- Cruz-Manzo, S.; Chen, R.; Rama, P. Study of current distribution and oxygen diffusion in the fuel cell cathode catalyst layer through electrochemical impedance spectroscopy. Int. J. Hydrogen Energy 2013, 38, 1702–1713. [Google Scholar] [CrossRef]
- King, F.; Litke, C.; Quinn, M.; LeNeveu, D. The measurement and prediction of the corrosion potential of copper in chloride solutions as a function of oxygen concentration and mass-transfer coefficient. Corros. Sci. 1995, 37, 833–851. [Google Scholar] [CrossRef]
- Doi, K.; Hiromoto, S.; Katayama, H.; Akiyama, E. Effects of Oxygen Pressure and Chloride Ion Concentration on Corrosion of Iron in Mortar Exposed to Pressurized Humid Oxygen Gas. J. Electrochem. Soc. 2018, 165, C582–C589. [Google Scholar] [CrossRef]
- Li, J.; He, T.; Du, X.-Y.; Vereschaka, A. Enhancing the corrosion resistance of high-strength Al-Zn-Mg-Cu alloys after equal channel angular pressing by developing retrogression and re-aging strategies. Corros. Sci. 2025, 246, 112736. [Google Scholar] [CrossRef]
- Xu, F.; Luo, L.; Xiong, L.; Liu, Y. Microstructure and corrosion behavior of ALD Al2O3 film on AZ31 magnesium alloy with different surface roughness. J. Magnes. Alloy. 2020, 8, 480–492. [Google Scholar] [CrossRef]
- Gou, J.; Sun, M.; Ma, X.; Tang, G.; Zhang, Y. Effects of temperature and pH value on the morphology and corrosion resistance of titanium-containing conversion coating. Appl. Surf. Sci. Adv. 2021, 3, 100060. [Google Scholar] [CrossRef]
- Penney, D.J.; Sullivan, J.H.; Worsley, D.A. Investigation into the effects of metallic coating thickness on the corrosion properties of Zn–Al alloy galvanising coatings. Corros. Sci. 2007, 49, 1321–1339. [Google Scholar] [CrossRef]
- Guilemany, J.; Fernández, J.; Delgado, J.; Benedetti, A.; Climent, F. Effects of thickness coating on the electrochemical behaviour of thermal spray Cr3C2–NiCr coatings. Surf. Coatings Technol. 2002, 153, 107–113. [Google Scholar] [CrossRef]
- Zheng, L.; Li, H.; Hashmi, M.; Chen, C.; Zhang, Y.; Zeng, M. Evolution of microstructure and strengthening of 7050 Al alloy by ECAP combined with heat-treatment. J. Mech. Work. Technol. 2006, 171, 100–107. [Google Scholar] [CrossRef]
- Arabgol, Z.; Vidaller, M.V.; Assadi, H.; Gärtner, F.; Klassen, T. Influence of thermal properties and temper-ature of substrate on the quality of cold-sprayed deposits. Acta Mater. 2017, 127, 287–301. [Google Scholar] [CrossRef]


| Deposition Parameters | |
|---|---|
| Base pressure (Pa) | 8.0 × 10⁻⁴ |
| Etching time (min) | 10 |
| Deposition temperature (°C) | RT, 150 °C, 300 °C |
| Ar flow (sccm) | 100 |
| Working pressure (Pa) | 0.15 |
| Rotary Table Rotation Speed (rpm) | 10 |
| Cr target power (W) | 130 |
| Cr sputtering time (min) | 30 |
| Ti target power (W) | 250 |
| Ti sputtering time (min) | 90 |
| Samples | Cr | Ti | Impurities |
|---|---|---|---|
| TRT | 32.5 | 61.7 | 5.8 |
| T150 | 35.0 | 61.1 | 3.9 |
| T300 | 33.3 | 61.6 | 5.1 |
| Samples | Ecorr (V vs. SCE) | Icorr (A·cm−2) | βa (mV·dec−1) | −βc (mV·dec−1) | Rp (Ω·cm2) |
|---|---|---|---|---|---|
| TRT | −0.931 | 2.47 × 10⁻⁷ | 220 | 50 | 7.17 × 10⁴ |
| T150 | −0.951 | 1.44 × 10⁻⁶ | 296 | 40 | 1.06 × 10⁴ |
| T300 | −0.922 | 7.59 × 10⁻⁷ | 192 | 54 | 2.41 × 10⁴ |
| Samples | Rs /(Ω·cm2) | CPEc /(F·cm−2) | nc | Rpore /(Ω·cm2) | CPEdl /(F·cm−2) | ndl | Rct /(Ω·cm2) |
|---|---|---|---|---|---|---|---|
| TRT | 69.8 | 9.86 × 10⁻⁴ | 0.897 | 2020 | 3.37 × 10⁻⁴ | 0.852 | 12,400 |
| T150 | 67.1 | 8.18 × 10⁻⁴ | 0.89 | 2610 | 4.56 × 10⁻⁴ | 0.896 | 11,900 |
| T300 | 69.3 | 7.92 × 10⁻⁴ | 0.896 | 2490 | 4.83 × 10⁻⁴ | 0.806 | 9140 |
Disclaimer/Publisher’s Note: The statements, opinions and data contained in all publications are solely those of the individual author(s) and contributor(s) and not of MDPI and/or the editor(s). MDPI and/or the editor(s) disclaim responsibility for any injury to people or property resulting from any ideas, methods, instructions or products referred to in the content. |
© 2025 by the authors. Licensee MDPI, Basel, Switzerland. This article is an open access article distributed under the terms and conditions of the Creative Commons Attribution (CC BY) license (https://creativecommons.org/licenses/by/4.0/).
Share and Cite
Wang, Y.; He, T.; Du, X.; Vereschaka, A.; Sotova, C.; Ding, Y.; Chen, K.; Li, J.; He, P. Influence of Aluminum Alloy Substrate Temperature on Microstructure and Corrosion Resistance of Cr/Ti Bilayer Coatings. Coatings 2025, 15, 891. https://doi.org/10.3390/coatings15080891
Wang Y, He T, Du X, Vereschaka A, Sotova C, Ding Y, Chen K, Li J, He P. Influence of Aluminum Alloy Substrate Temperature on Microstructure and Corrosion Resistance of Cr/Ti Bilayer Coatings. Coatings. 2025; 15(8):891. https://doi.org/10.3390/coatings15080891
Chicago/Turabian StyleWang, Yuqi, Tao He, Xiangyang Du, Alexey Vereschaka, Catherine Sotova, Yang Ding, Kang Chen, Jian Li, and Peiyu He. 2025. "Influence of Aluminum Alloy Substrate Temperature on Microstructure and Corrosion Resistance of Cr/Ti Bilayer Coatings" Coatings 15, no. 8: 891. https://doi.org/10.3390/coatings15080891
APA StyleWang, Y., He, T., Du, X., Vereschaka, A., Sotova, C., Ding, Y., Chen, K., Li, J., & He, P. (2025). Influence of Aluminum Alloy Substrate Temperature on Microstructure and Corrosion Resistance of Cr/Ti Bilayer Coatings. Coatings, 15(8), 891. https://doi.org/10.3390/coatings15080891