Article

Studies on the Coating Formation and Structure Property for Plasma Electrolytic Oxidation of AZ31 Magnesium Alloy

Hubei Provincial Key Laboratory of Green Materials of Light Industry, College of Materials and Chemical Engineering, Hubei University of Technology, Wuhan 430068, China
*
Author to whom correspondence should be addressed.
Coatings 2025, 15(7), 846; https://doi.org/10.3390/coatings15070846 (registering DOI)
Submission received: 11 June 2025 / Revised: 7 July 2025 / Accepted: 17 July 2025 / Published: 19 July 2025
(This article belongs to the Section Plasma Coatings, Surfaces & Interfaces)

Abstract

Plasma electrolytic oxidation (PEO) is an advanced electrochemical surface treatment technology. It can effectively improve the corrosion resistance of magnesium and its alloys. This paper aims to form protective PEO coatings on an AZ31 substrate with different electrolytes, while monitoring the micro-discharge evolution by noise intensity and morphology analysis. By setting the PEO parameters and monitoring process characteristics, such as current density, spark appearance, and noise intensity, it was deduced that the PEO process consists of the following three stages: anodic oxidation, spark discharge, and micro-arc discharge. The PEO oxide coating formed on the AZ31 alloy exhibits various irregular volcano-like structures. Oxygen species are uniformly distributed along the coating cross-section. Phosphorus species tend to be enriched inwards to the coating/magnesium substrate interface, while aluminum piles up towards the surface region. Surface roughness of the PEO coating formed in the silicate-based electrolyte was the lowest in an arithmetic average height (Sa) of 0.76 μm. Electrochemical analysis indicated that the corrosion current density of the PEO coating decreased by about two orders of magnitude compared to that of untreated blank AZ31 substrate, while, at the same time, the open-circuit potential shifted significantly to the positive direction. The corrosion current density of the 10 min/400 V coating was 1.415 × 10⁻⁶ A/cm2, approximately 17% lower than that of the 2 min/400 V coating (1.738 × 10⁻⁶ A/cm2). For a fixed 10 min treatment, the longer the PEO duration time, the lower the corrosion current density. Finally, the tested potentiodynamic polarization curve reveals the impact of different types of PEO electrolytes and different durations of PEO treatment on the corrosion resistance of the oxide coating surface.

1. Introduction

Among metallic materials, magnesium is one of the lightest structural metals due to its exceptionally low density, approximately 1.738 g/cm3, which is about half that of aluminum and one-third that of titanium. Owing to this lightweight characteristic, magnesium and its alloys are widely utilized in sectors such as the aerospace, automotive, and electronics industries [1,2,3,4]. However, magnesium is an active metal, readily reacting with oxygen to form magnesium oxide, which demonstrates poor corrosion resistance, especially in humid or saline environments [5].
Plasma electrolytic oxidation (PEO) [6], also known as micro-arc oxidation (MAO), is a surface treatment technology that can generate high-hardness and dense ceramic coatings on aluminum, magnesium, titanium, and other valve metals. Oxide coatings are generated on these metals through various micro-discharge effects, thermal diffusion, and chemical–physical processes [7,8]. During the process of plasma electrolytic oxidation (PEO), acoustic emission is one of the typical physical phenomena triggered by micro-discharges (noise spark). Boinet [9,10] demonstrated that the acoustic emission technique is an effective evaluation method for in situ monitoring of the PEO process on the AM60 magnesium alloy. Bao [11] utilizes acoustic emission monitoring to elucidate the discharge mechanism and characterize the stage dividing based on acoustic emission signals and spectra. Optical emission spectroscopy (OES) can be used as another in situ monitoring method for the PEO process. Wang [12] and Yang [13] recorded the evolution of the OES spectral line intensities. Dunleavy [14] measured the OES for single discharge during the PEO process. The other type of micro-discharge, i.e., “soft spark”, can be understood with a phenomenological viewpoint, which relates the voltage drop and active zone emerging in the formed anodic coating under the conditions of a high electric field [15,16]. Still, micro-discharge could be used as effective tool for electrochemical polishing, which shows the core effect during the field of plasma electrolysis [17,18].
PEO can be used as a starting base for further coating systems, such as layered double hydroxide and/or sol–gel integration [19,20]. During the PEO treatment process, the characteristics of micro-arc discharge under different voltage conditions were evaluated, using a simultaneous recording method involving noise monitoring, ammeter readings, and spark photography. The influence of various electrolytes on the appearance of oxide coatings was analyzed. Additionally, the morphology, composition, and corrosion resistance of the coating layers were examined through a combination of optical microscopy (OM), scanning electron microscopy (SEM), 3D profilometry, X-ray diffraction (XRD), X-ray photoelectron spectroscopy (XPS), and electrochemical workstation techniques.

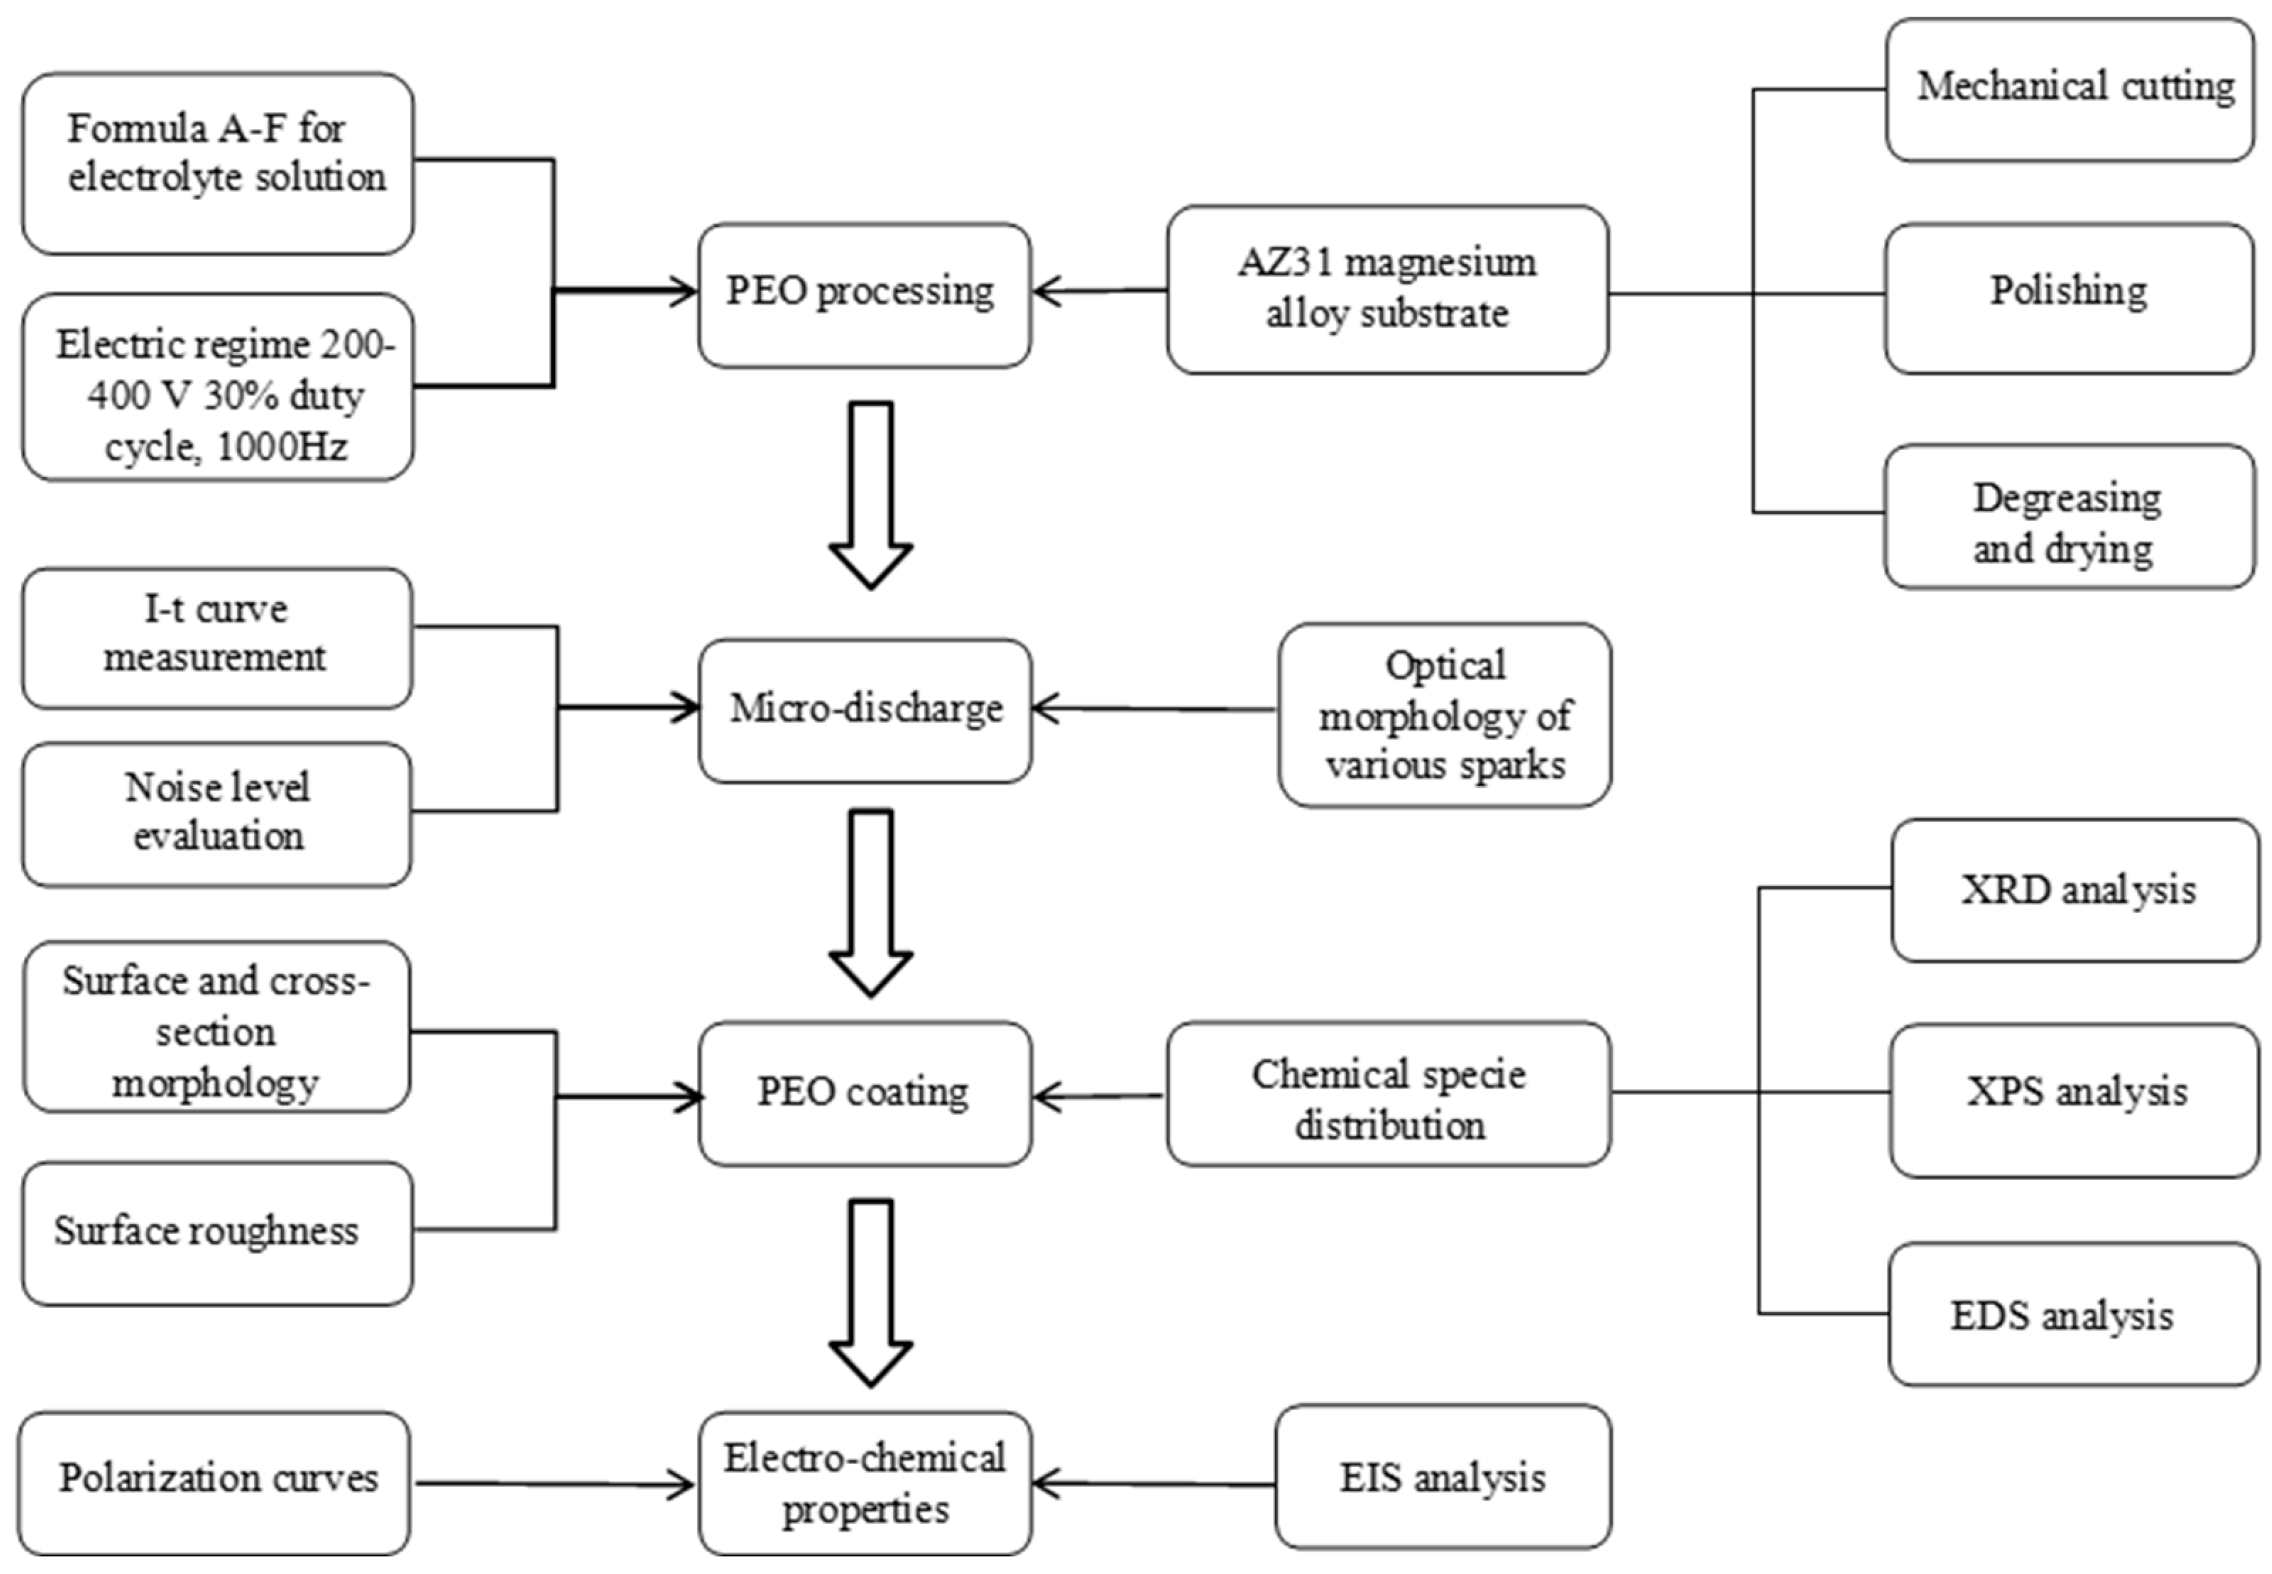
2. Materials and Methods

The chemical composition of the AZ31 magnesium alloy is shown in Table 1. The magnesium alloy plate was uniformly cut into 50 × 30 × 2 mm3 samples and polished sequentially using 400#, 800#, 1500#, and 2000# sandpaper. Then, the samples were rinsed with distilled water, degreased with ethanol, and ultrasonically cleaned (KQ3200B, Kunshan Ultrasonic Instrument Co., Ltd., Kunshan, China).
The electrolyte consisted of sodium silicate, sodium hydroxide, sodium phosphate, and sodium aluminate. The compositions of the six electrolyte formulas are presented in Table 2. The PEO electrolyte is prepared from high-purity chemicals.
PEO was conducted in a 2 L glass container equipped with magnetic stirring (RH basic 2, IKA Instrument Equipment Co., Ltd., Guangzhou, China). The power supply was a 20 kW electrical source with bipolar pulse (MAO-20D, Chang’an University, Xi’an, China). The voltage range for PEO was between 200 V and 400 V. PEO treatment was conducted under pulsed constant voltage conditions with a frequency of 1000 Hz and a duty cycle of 30%.
The current changes during PEO were recorded with a current meter (CM2100-OWON, China). The samples formed under various conditions were recorded with a camera (SONY ZV-E10). The noise recording device utilized was the iPhone 15 Pro, with the monophonic recording mode. The recorded files were processed with the AU (Adobe Audition) software version 2021.
The microstructure and morphology of the surface coating were studied using an optical microscope (Olympus GX51) and a scanning electron microscope (TESCAN MIRA LMS from the Czech Republic). A GT-K0 optical profilometer (BRUKER) was employed to obtain the three-dimensional surface topography and surface roughness. The tested sites were selected randomly at least three times for each PEO sample. The phase composition of the PEO coatings was analyzed using X-ray diffraction (Rigaku SmartLab SE from Japan).
Potentiodynamic polarization was performed with electrochemical workstation (CHI660E, Shanghai Chenhua Instrument Co., Ltd., Shanghai, China). The experiment utilized AZ31 magnesium alloy as the working electrode, a saturated calomel electrode as the reference electrode, and a platinum sheet as the counter electrode in a three-electrode cell. The electrolyte was a 3.5 wt.% sodium chloride solution. The scanning rate was 1 mV/s. The scanning potential window was from −1.75 V to −0.25 V (relative to OCP). Electrochemical impedance spectroscopy (EIS) was performed with an impedance measurement unit (IM6e, Rhineland-Palatinate, Germany) over a frequency range from 10,000 to 0.01 Hz, with a voltage amplitude of 5 mV, in a 3.5 wt.% sodium chloride solution.
Figure 1 shows the overall schematic representation for the process of plasma electrolytic oxidation and evaluation of the formed coatings in structure and properties. Micro-discharge is the core character of the PEO process. Its various effects, such as optical and electrochemical, can have a great influence on coating growth. In this investigation, its color and size evolution, noise level, and current density were recorded in real time.

3. Results and Discussions

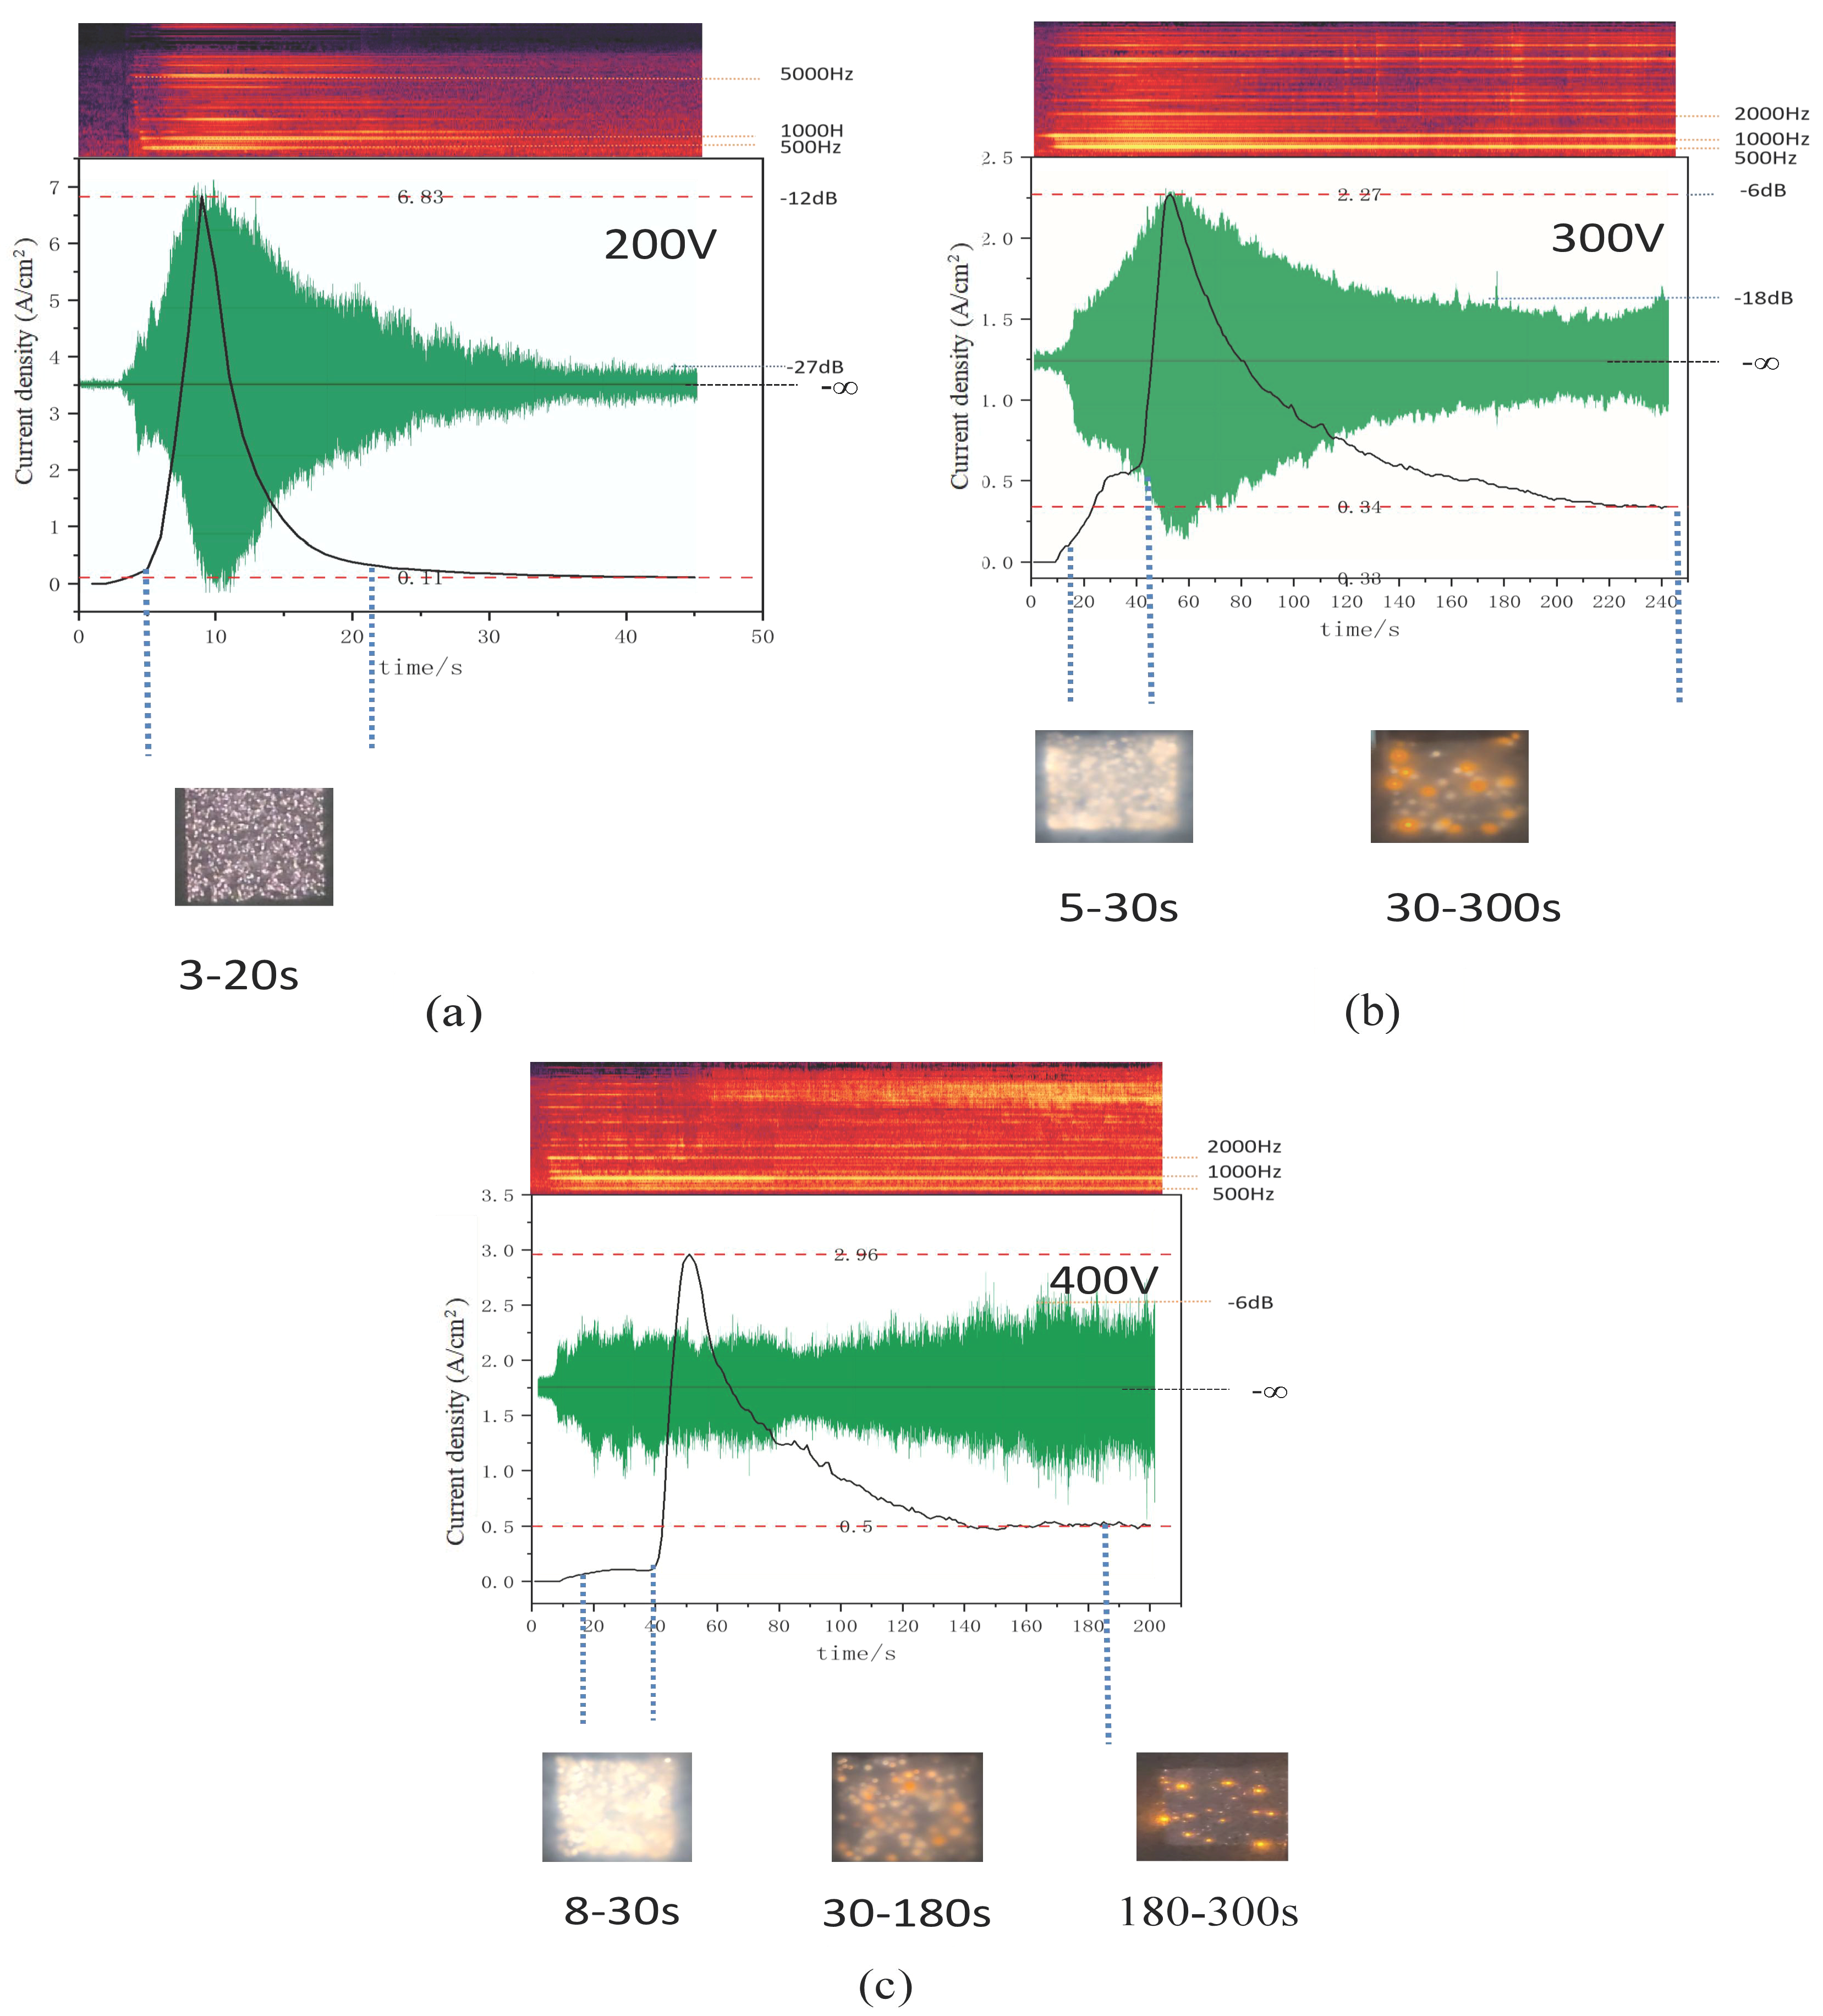
3.1. Monitoring of the PEO Process for AZ31

The plasma electrolytic oxidation (PEO) process of the AZ31 magnesium alloy is invariably accompanied by spark growth and gas release [14], with the intensity of these phenomena varying with the processing voltage and time. The PEO electrolyte employed corresponds to the formula E listed in Table 2. Figure 2 shows the electric current–time for the PEO process.
During the PEO process, the plasma discharge state accompanied by high voltage and high temperature is applied to the anode substrate surface in an alkaline electrolyte, resulting in the formation of an inorganic layer with excellent adhesion strength. The formation of this inorganic coating is intertwined with a series of simultaneous events, categorized as acoustic emission and as sonochemistry.
Figure 2 shows the noise frequency distribution for micro-sparks, and shows the distribution of noise frequency. During the phase of increasing processing voltage (prior to 30 s), anodic oxidation occurs on the surface of the magnesium alloy, leading to a rapid rise in current. When the voltage exceeds the breakdown voltage of the oxide coating, the process transitions into the micro-arc oxidation stage. The current reaches its peak after the processing voltage stabilizes and then rapidly decreases and stabilizes within a certain current range over the next 30 s. The magnitude of this stable current is related to the final stabilized voltage; higher voltages correspond to larger stable current values. As observed from the noise map, the greater the voltage, the higher the noise intensity, corresponding to variations in current magnitude.
In Figure 2a, the sparks persist for about 20 s, characterized by fine, white sparks accompanied by slight noise, with no noticeable bubbles generated. After 20 s, the noise diminishes and spark vanishes gradually. In Figure 2b, the sparks appears brighter and denser during the first 30 s, producing numerous bubbles and a mildly piercing noise. Subsequently, the spark color rapidly shifts to orange, their number and density decrease, and larger sparks persist with noise until the 300 s PEO process is completed. In Figure 2c, the sparks emit intense white light and a sharp, piercing noise within the first 30 s, generating a significant amount of bubbles. Between 30 and 180 s, the sparks exhibit a mix of yellow and white. After 180 s, the white sparks disappear, the number of large yellow sparks decreases, and the noise continues to increase.

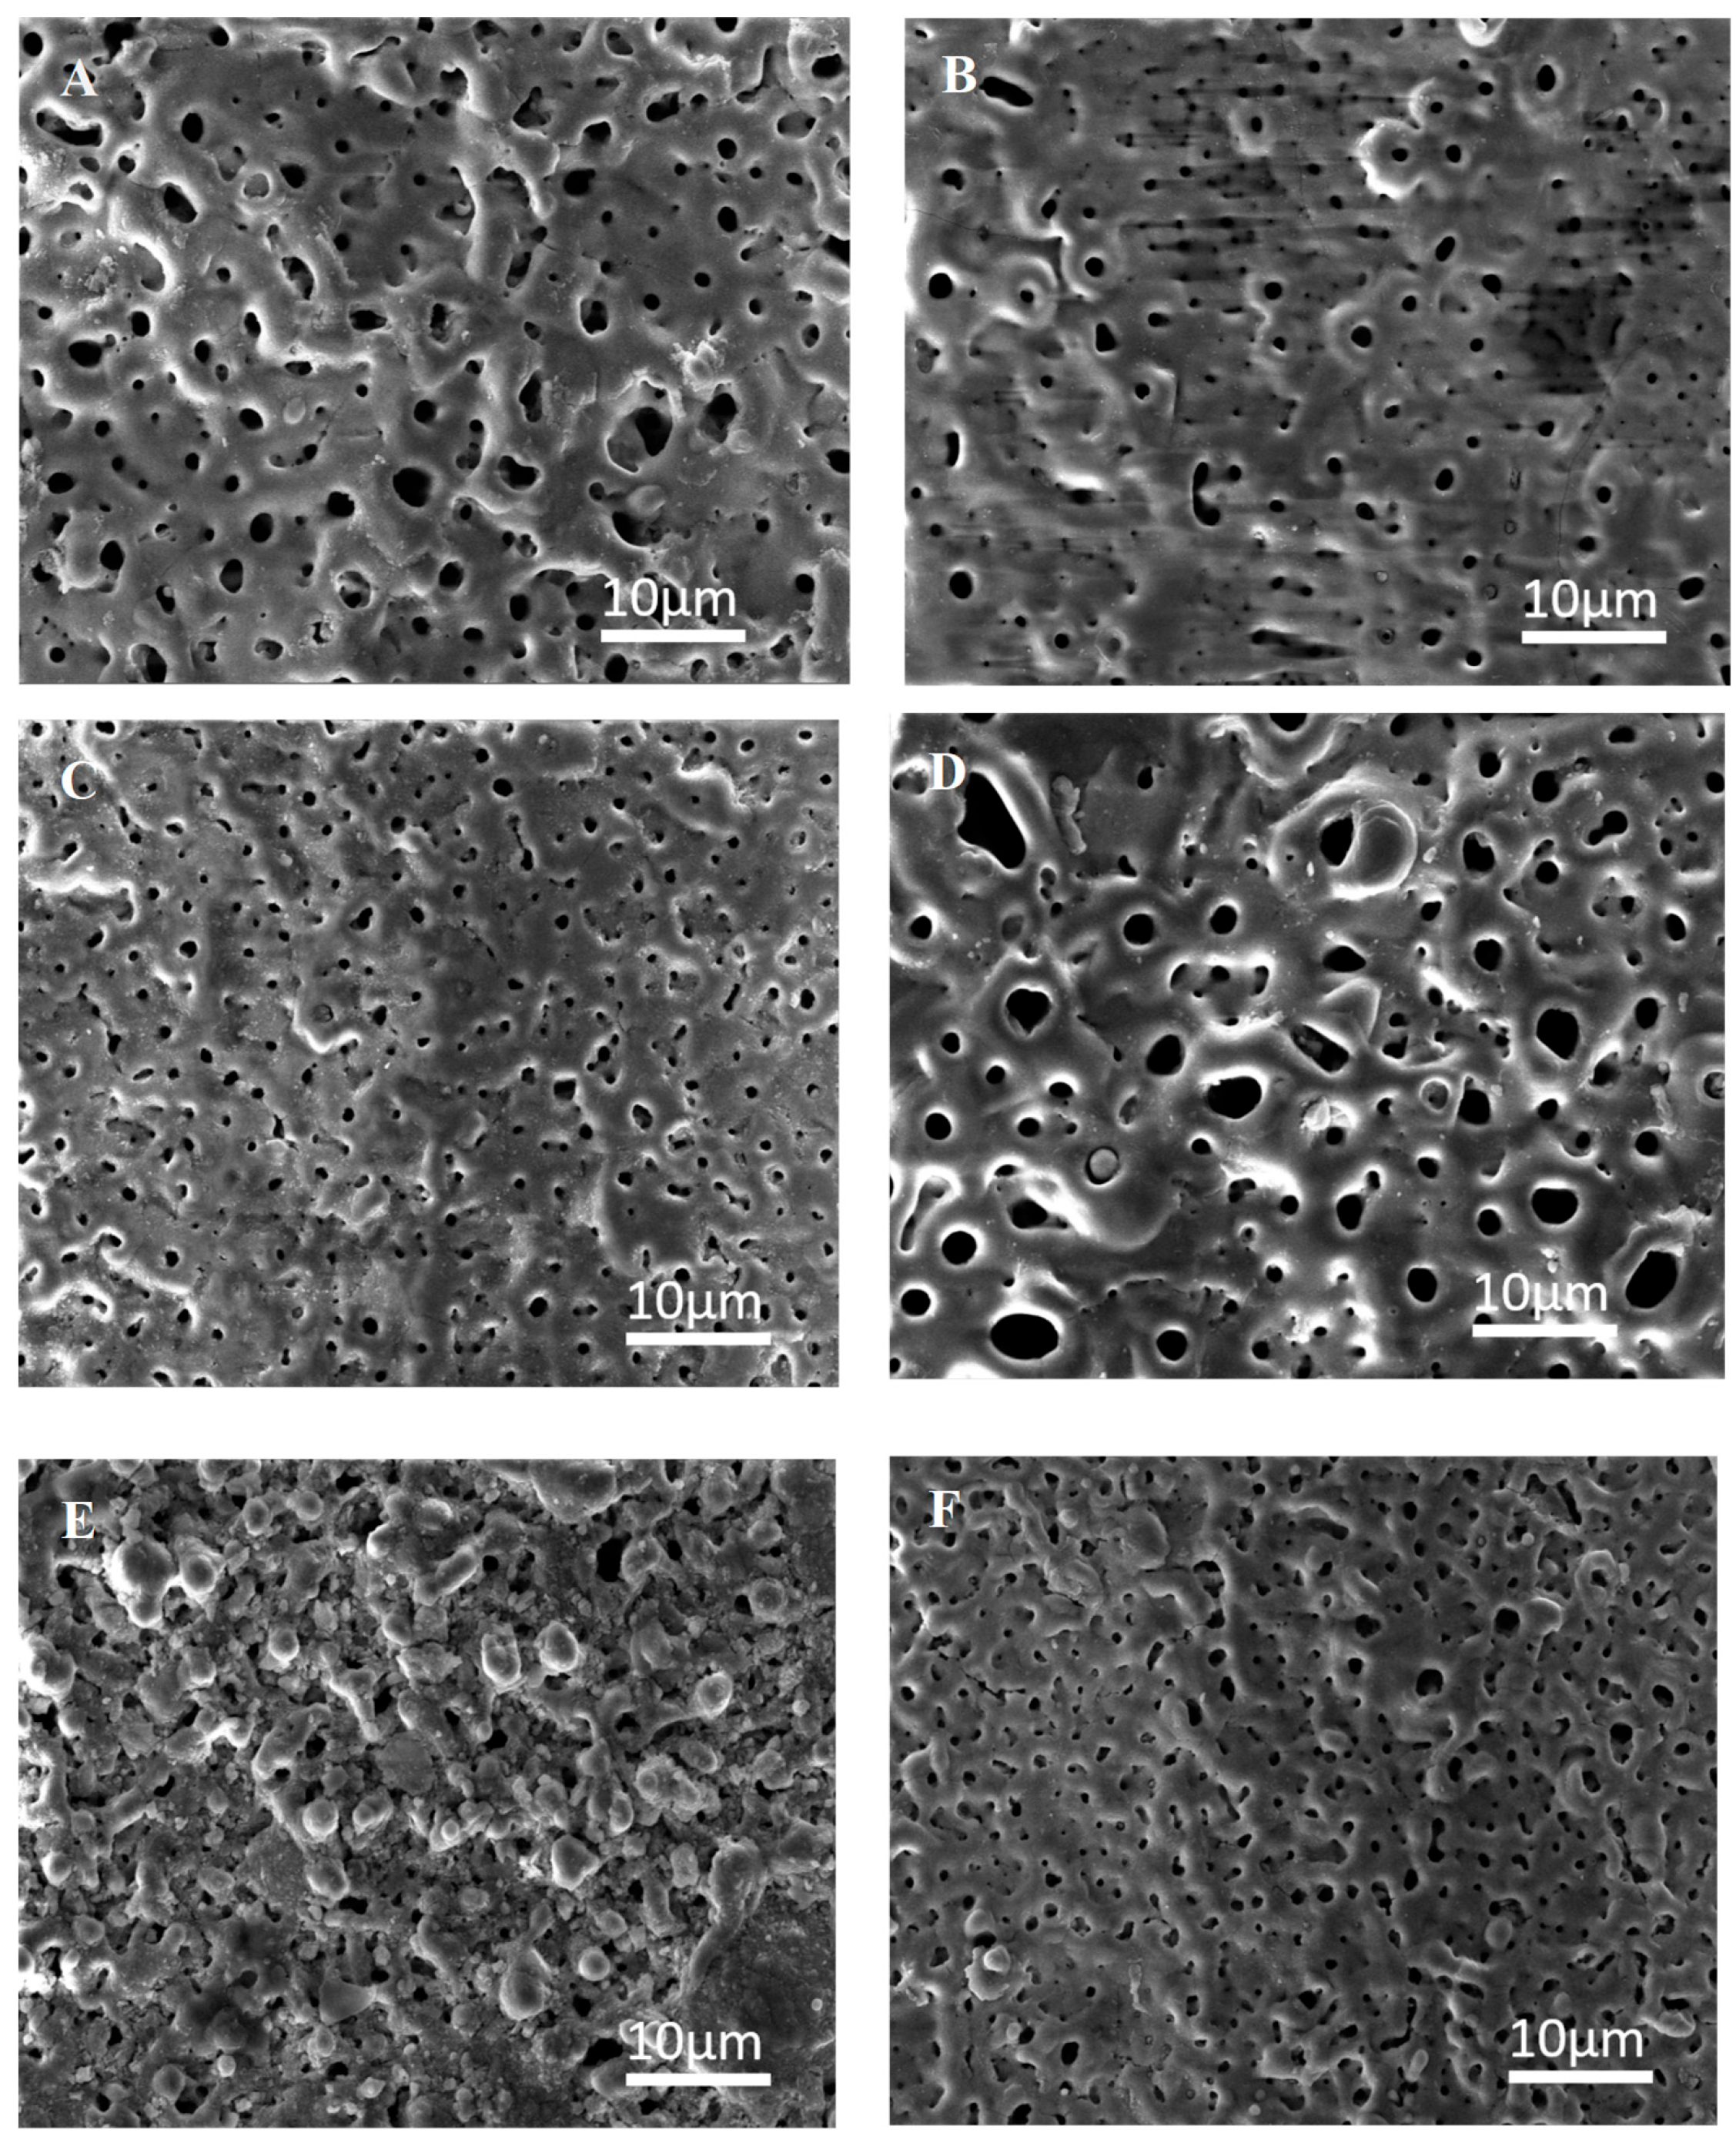
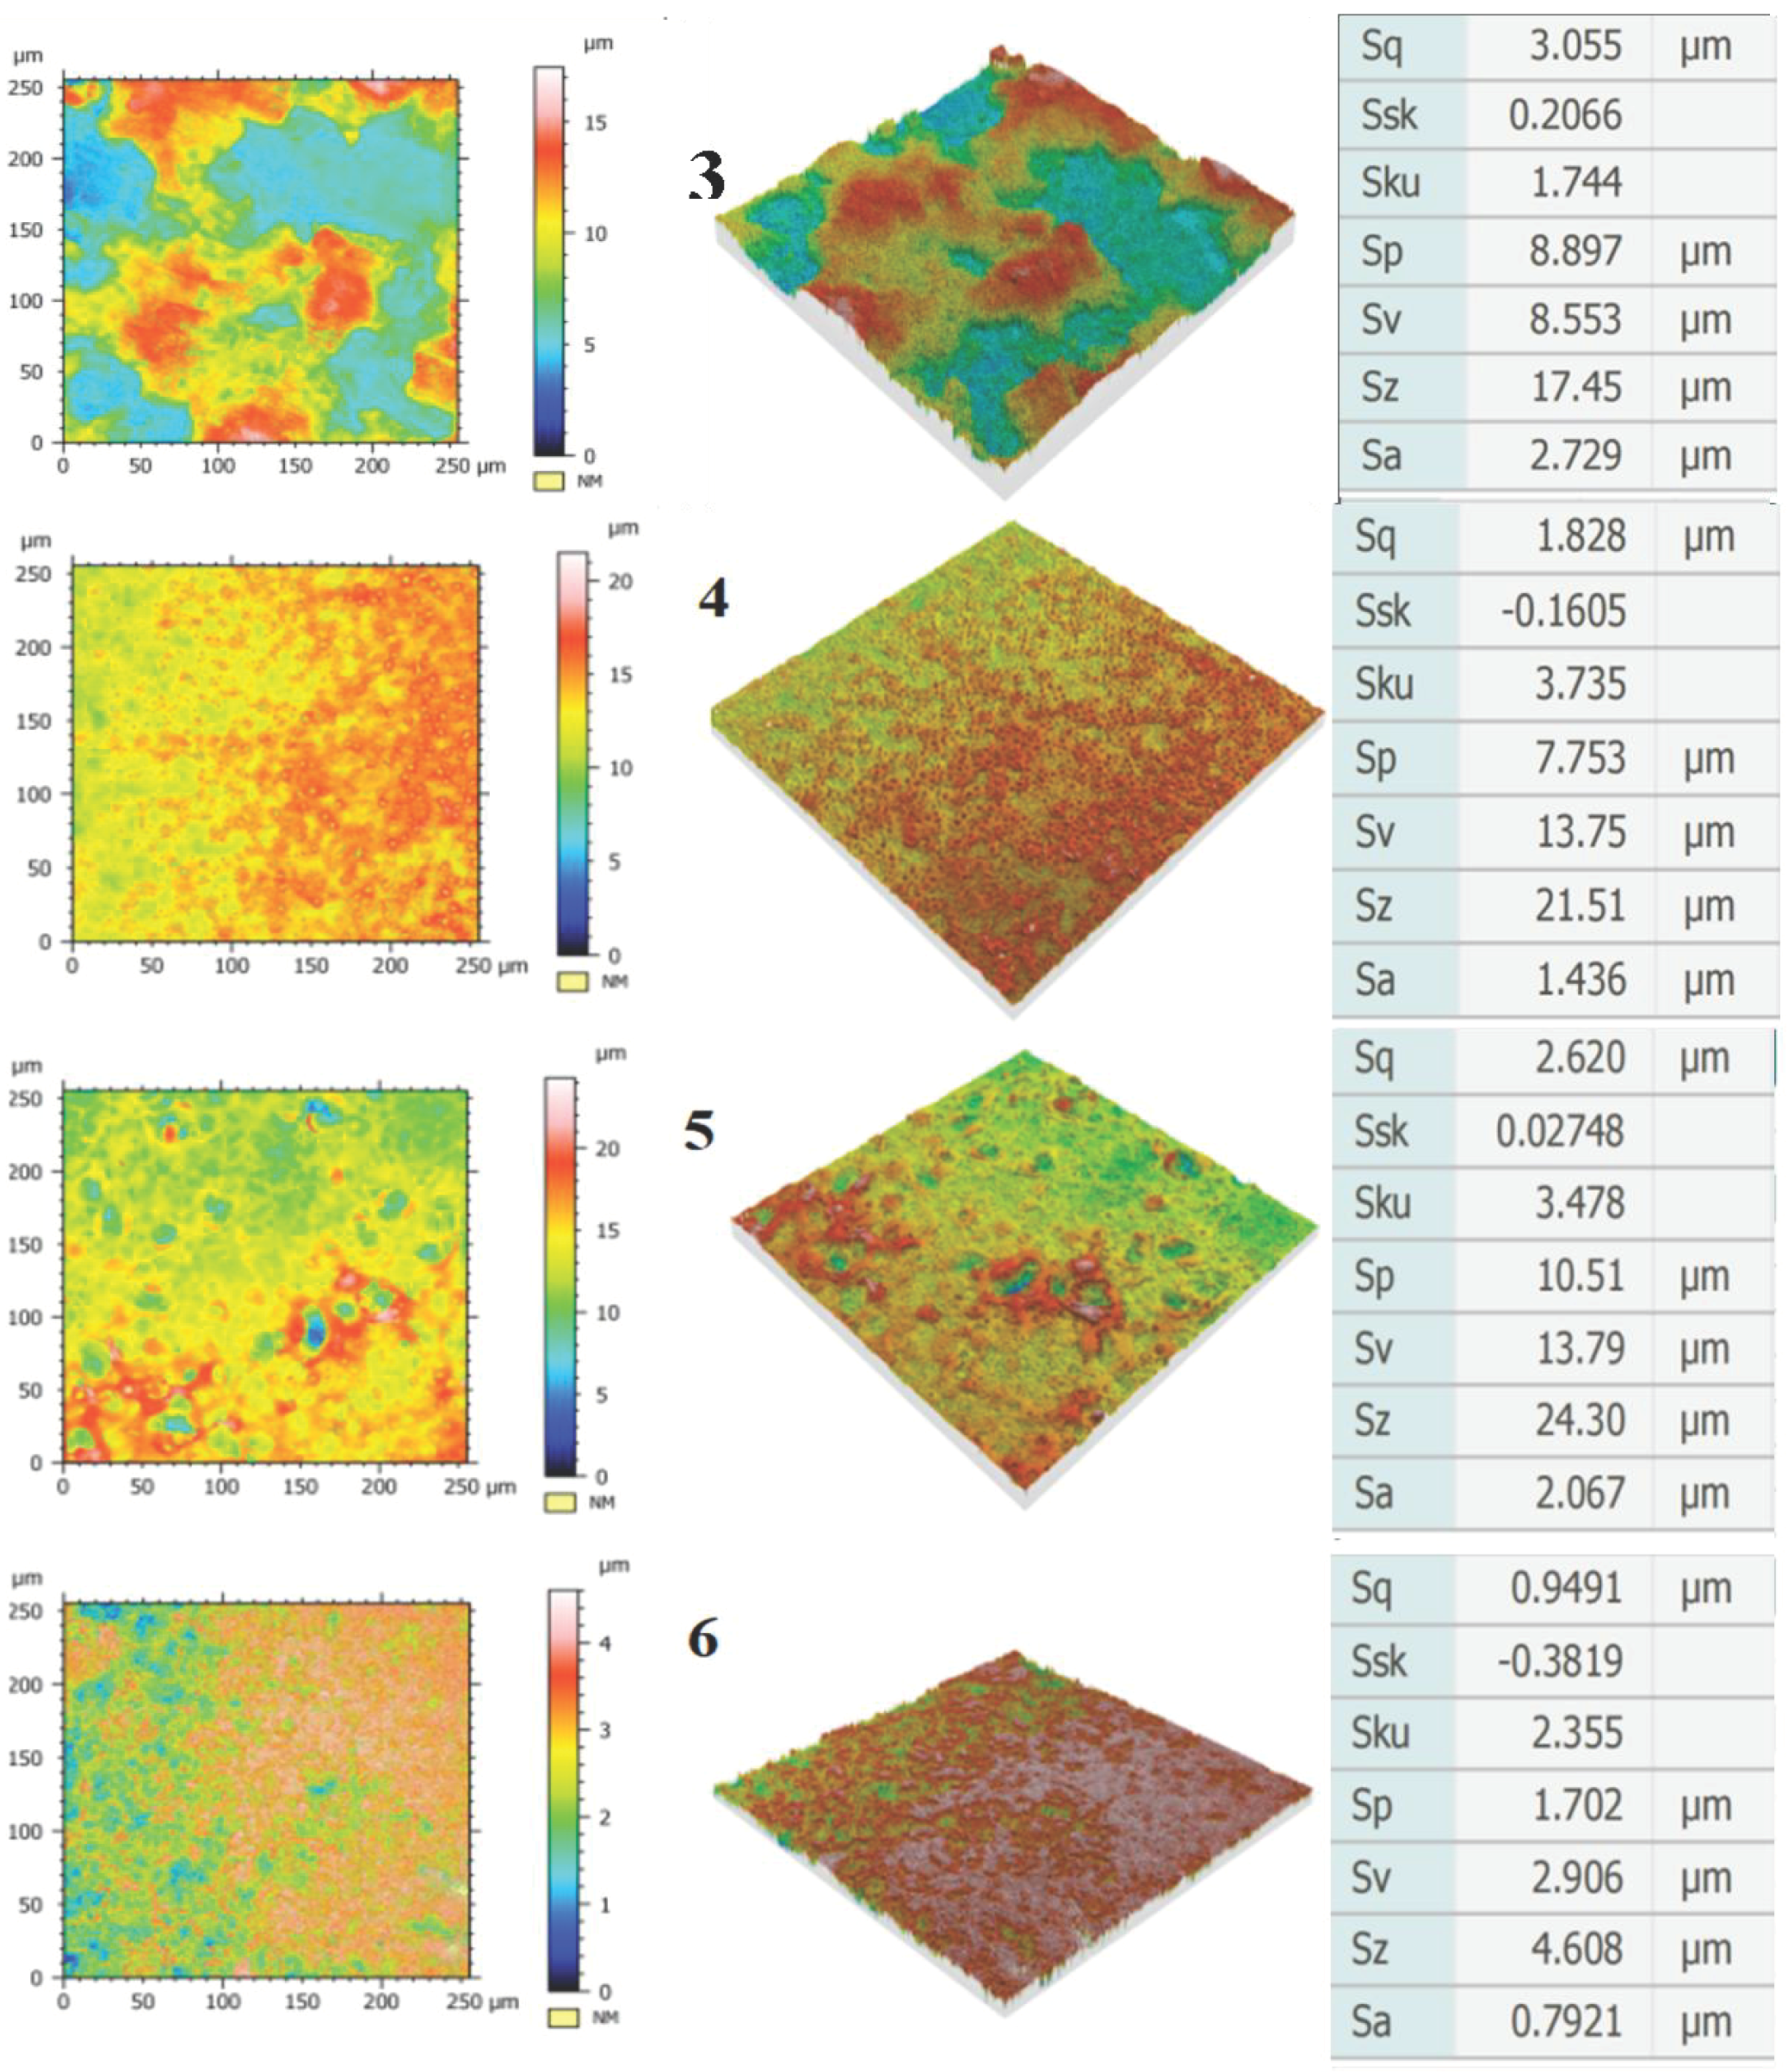
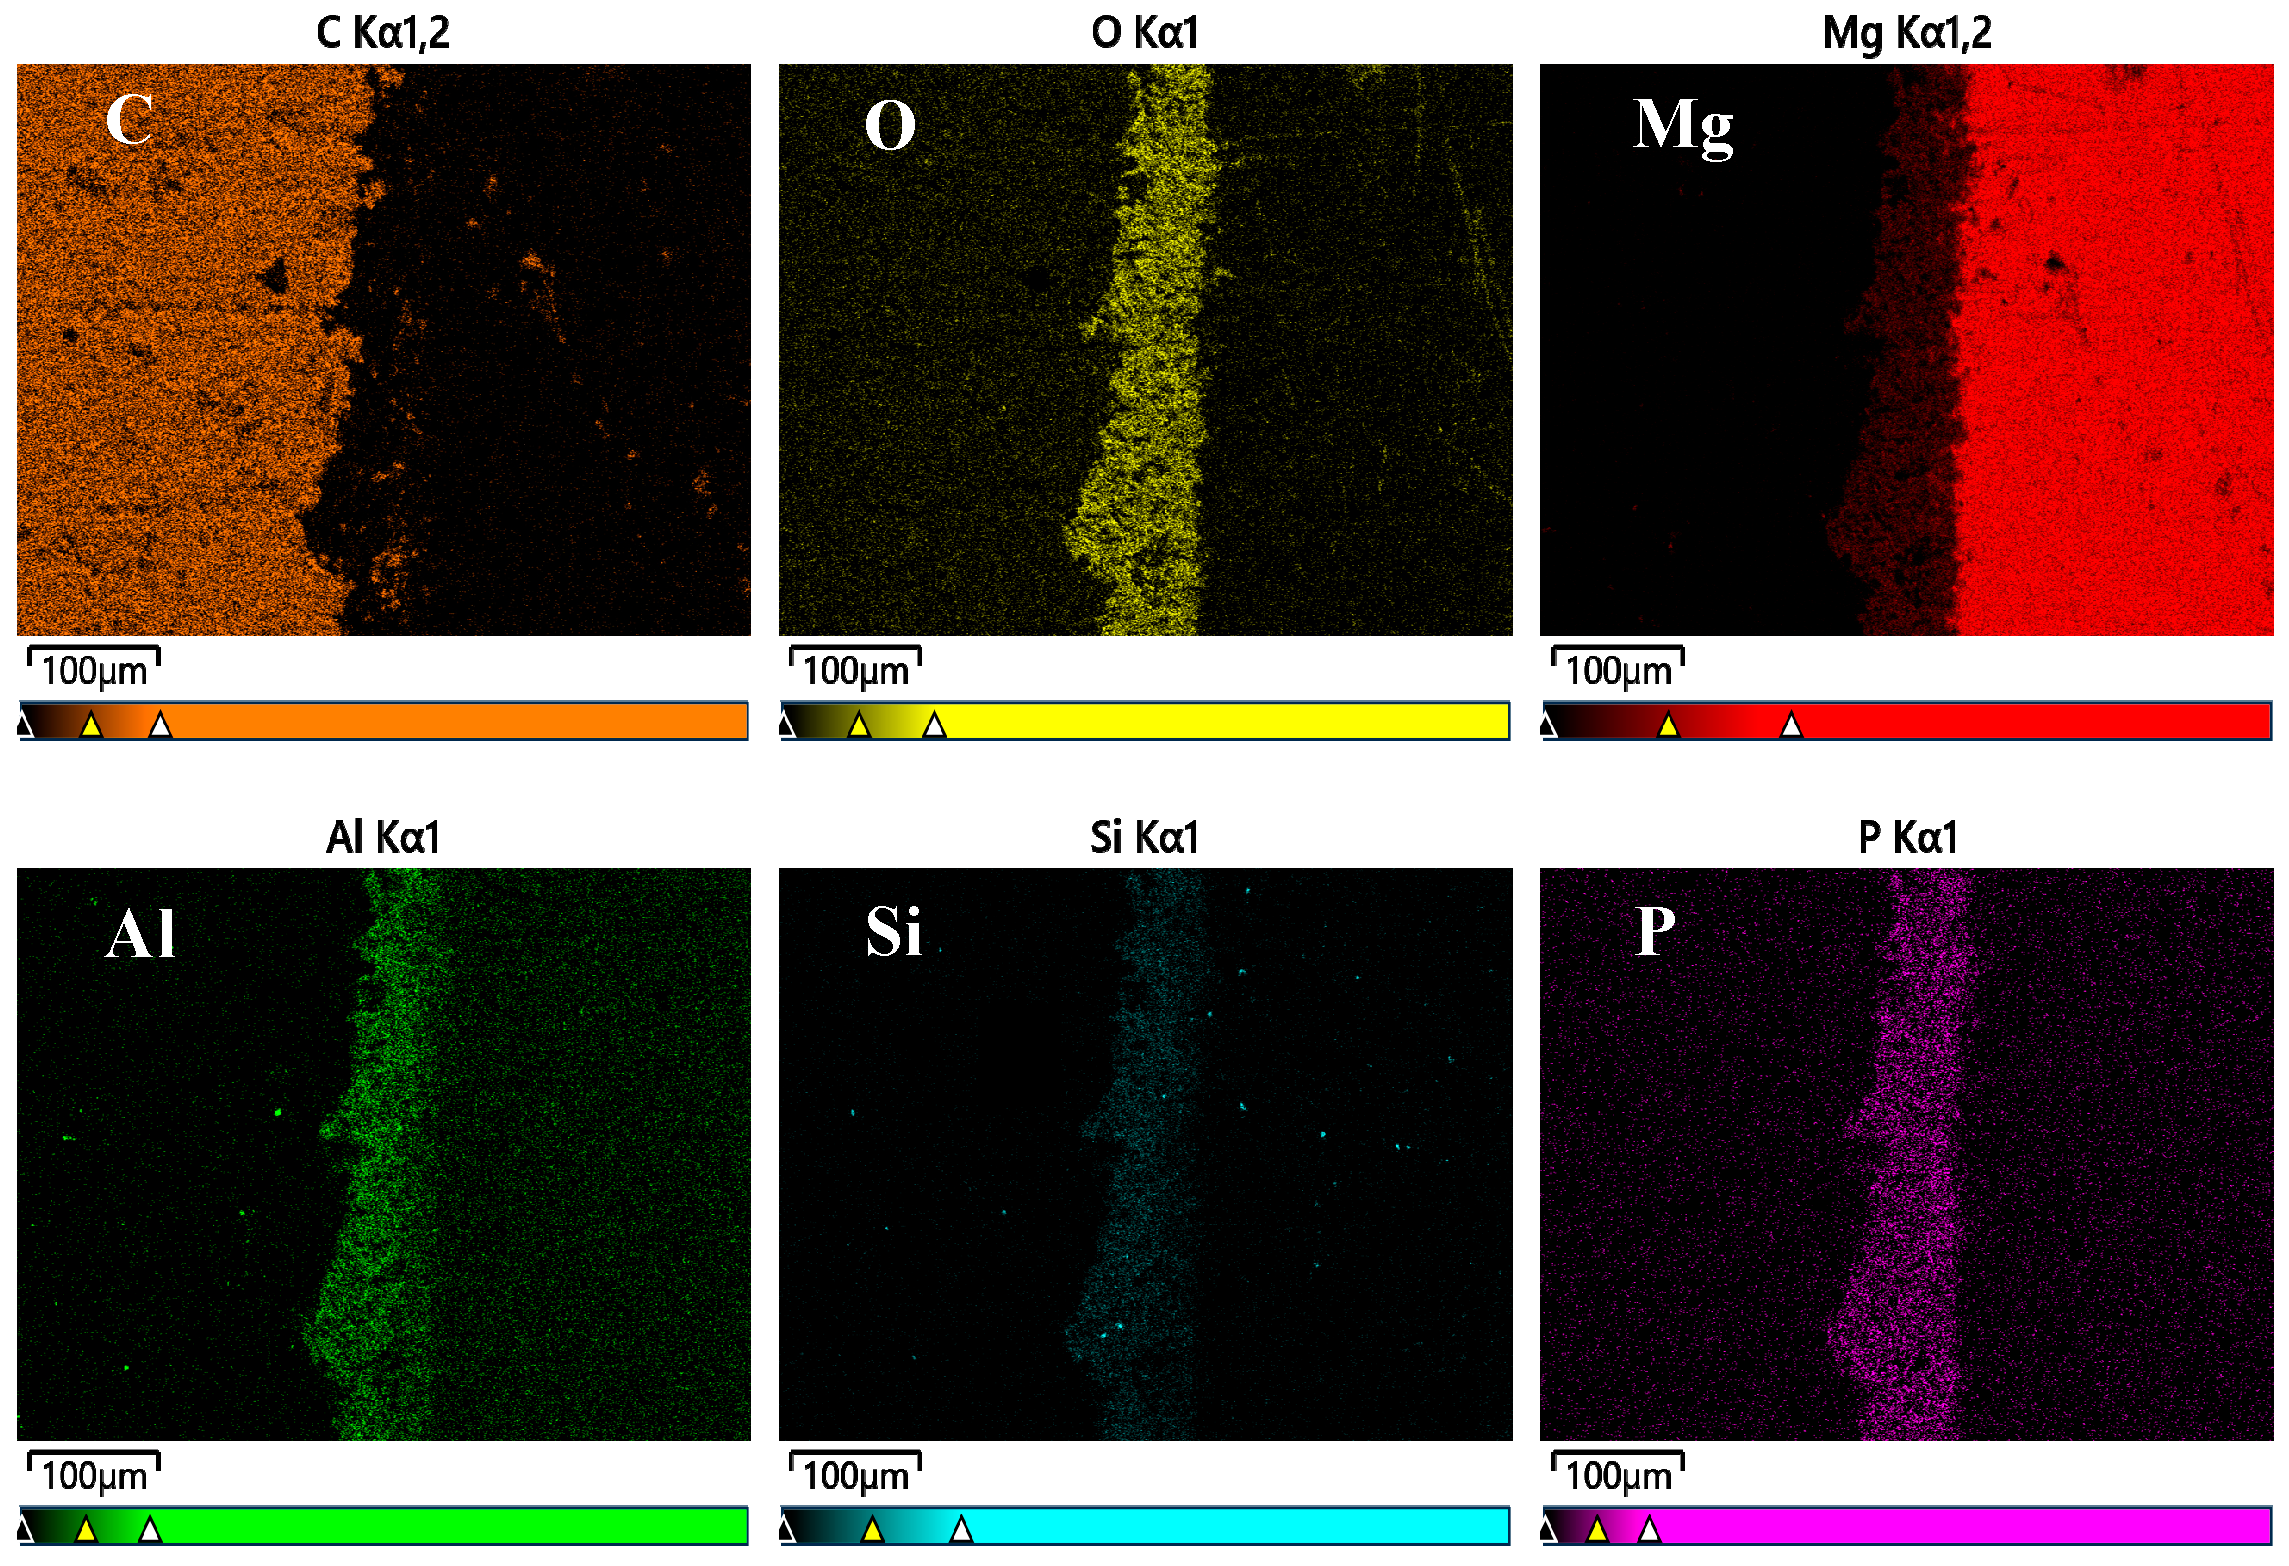
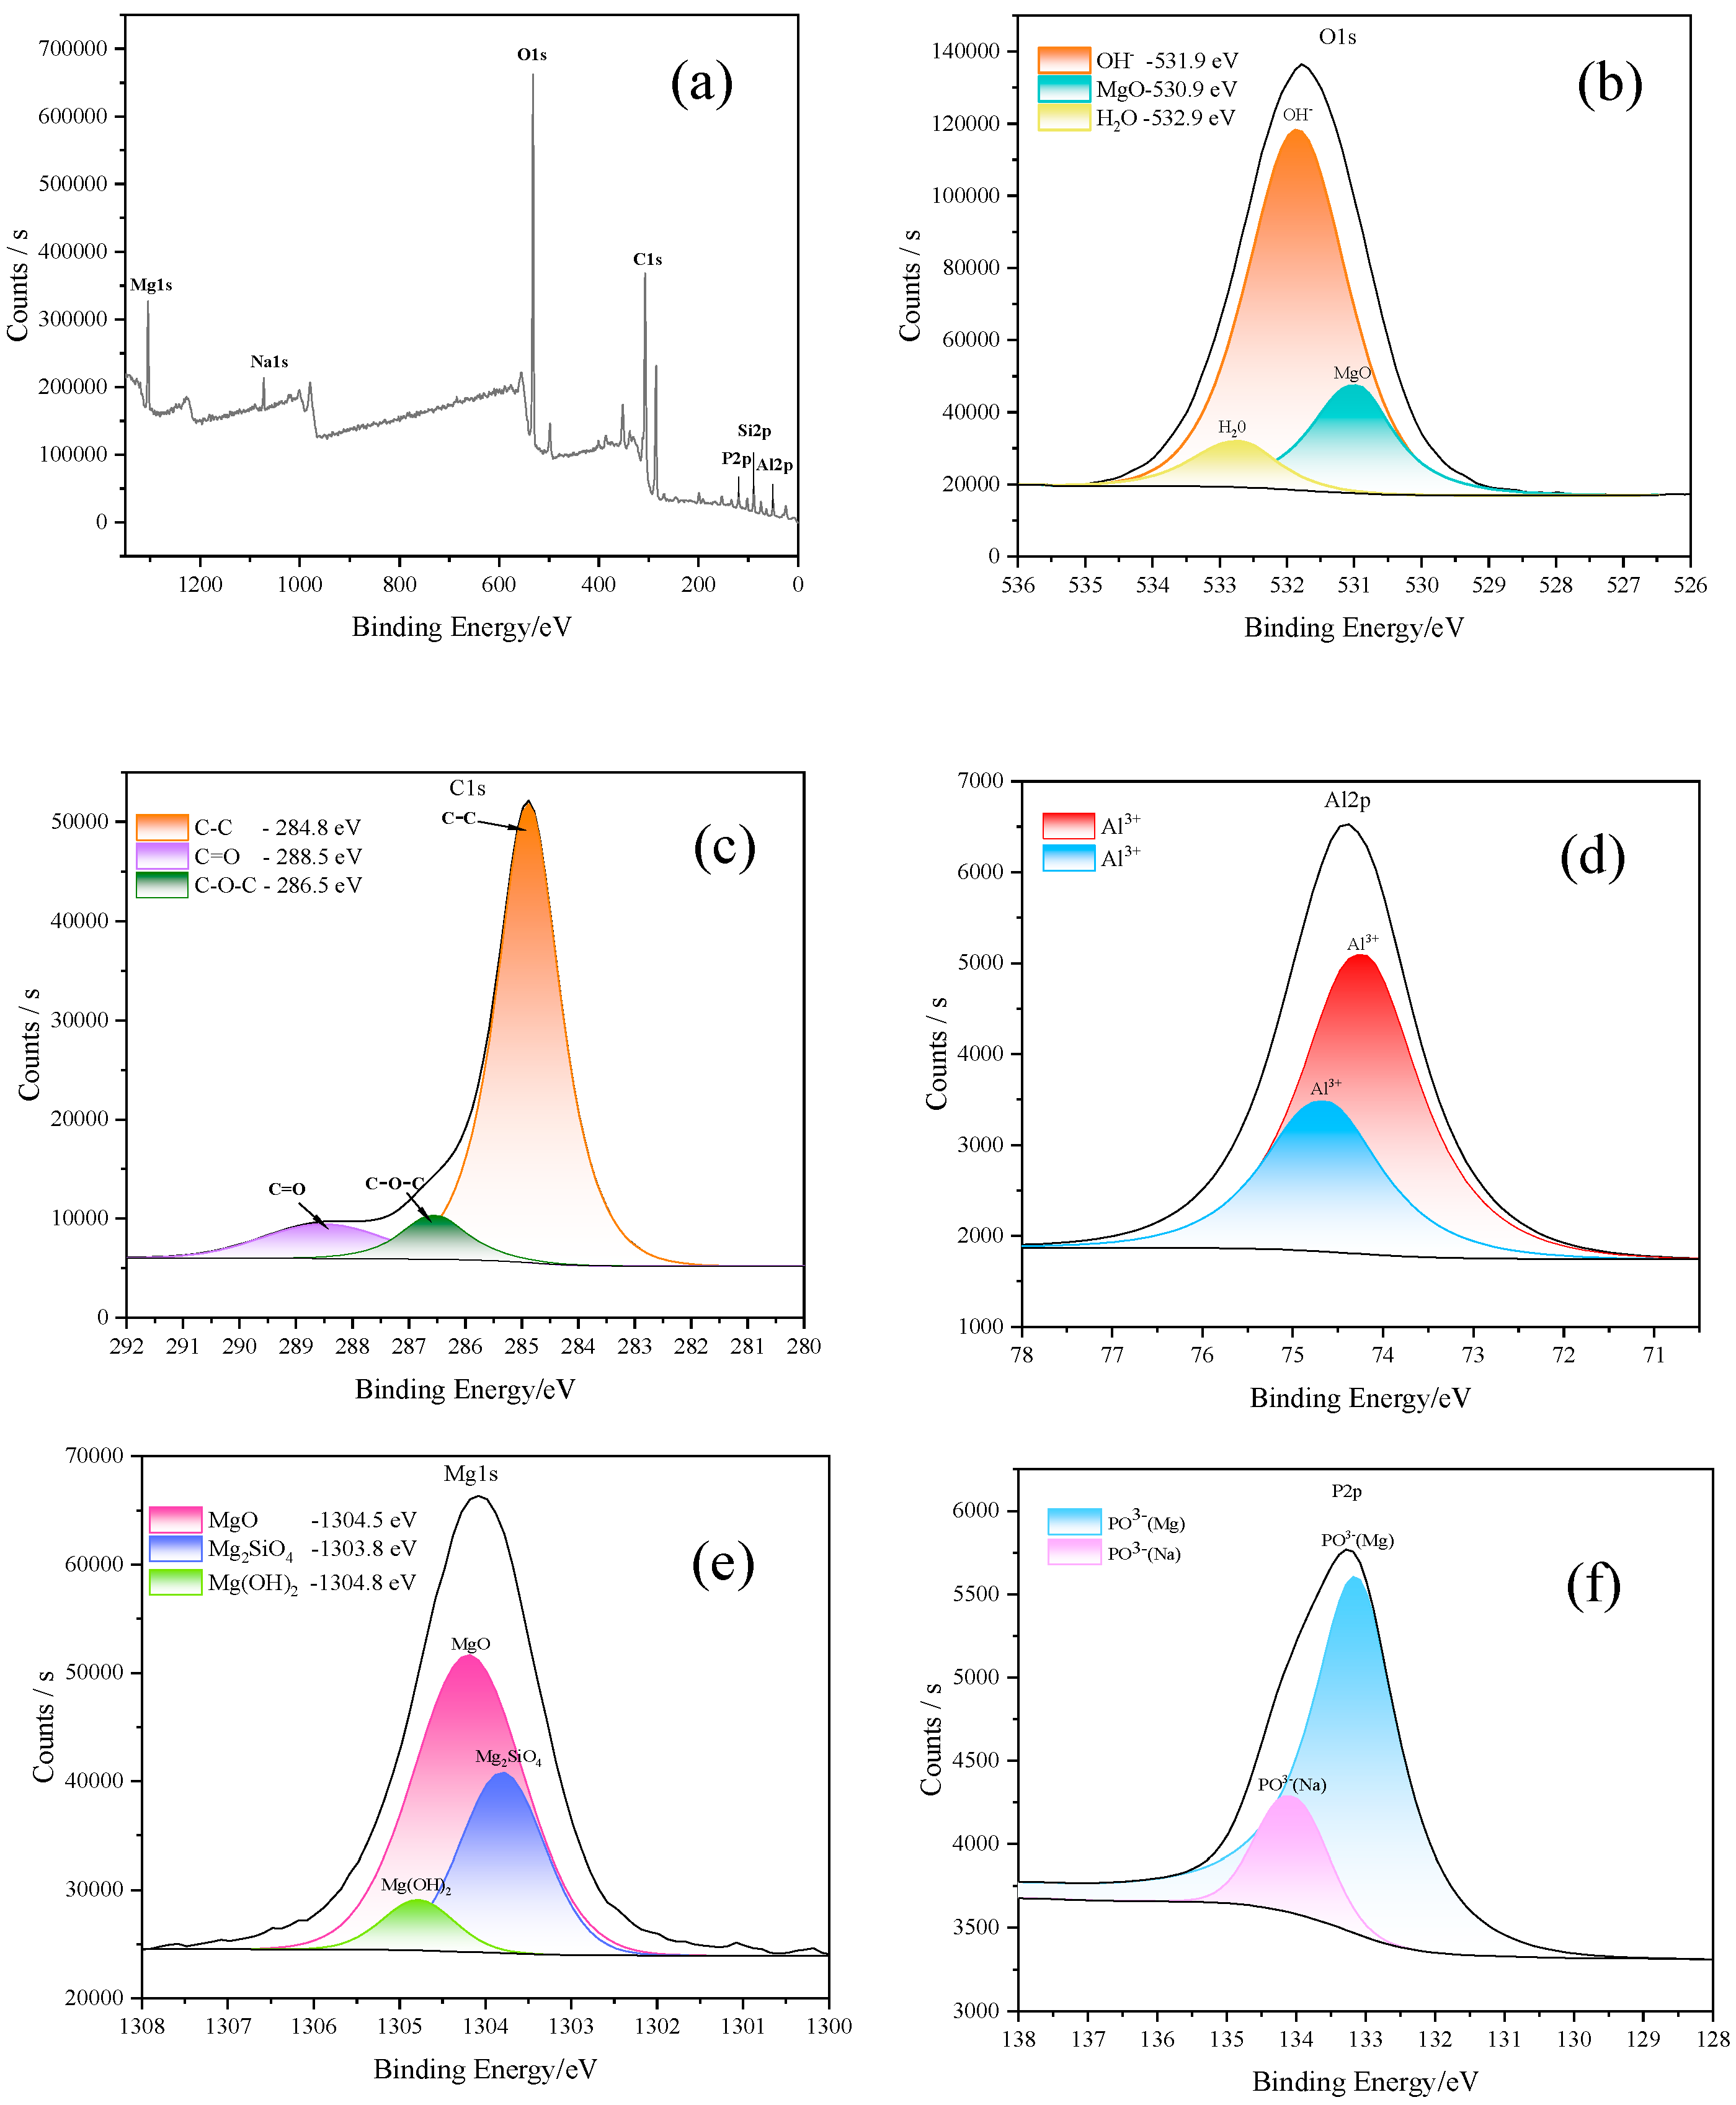
3.2. Characteristics of PEO Coating

The electrolyte solution employed siliconate, sodium phosphate; the composition of the electrolyte used for PEO processing is detailed in Table 2. The AZ31 alloy was subjected to PEO treatment using six different electrolytes. The processing voltage was applied using a stepwise increasing method: 200 V for 300 s, followed by 300 V for 300 s, and finally 400 V for 600 s.
Figure 3 and Figure 4 show the coating morphology formed in the different electrolytes. Formula A consists of single silicate, featuring a relatively smooth surface with smaller crater pores, and without significant cracks. Formula B is a phosphate solution. The surface texture of the oxide coating is uniform, and there are no obvious cracks, which improves the corrosion resistance of the substrate. Macroscopically, it exhibits the largest and most distinct crater aperture among the six solutions, which is associated with the thinner phosphate coating. The current intensity of the phosphate solution is lower. The oxide coating will grow at the same rate as the corrosion rate becomes faster, limiting further thickness increase. Formula C involves a sodium aluminate solution. The surface treated with PEO exhibits a rougher texture, with poorer uniformity and integrity. There are numerous surface protrusions, primarily irregular-shaped grains formed within the oxide coating during maintenance discharge under high temperatures. This unevenness can negatively impact corrosion resistance, needing the addition of other components to improve the formula. In contrast, formula D incorporates sodium hydroxide alongside the silicate, creating a more alkaline environment for the solution and enhancing its conductivity. Consequently, during PEO treatment, a higher electric intensity is achieved, which increases the intensity of the spark discharge. The surface exhibits distinct crater pores. It exhibits a low porosity and large pore size. Most of the craters are open. The composition formula E incorporates both silicate and phosphate additives, resulting in moderate surface uniformity. The addition of phosphate, in conjunction with silicate, promotes the formation of composite coatings such as magnesium silicate and magnesium phosphate, which reduces micro-pores and cracks. When silicate, sodium hydroxide, and sodium aluminate were added simultaneously in formula F, the surface smoothness and uniformity significantly improved compared to the effect of a single sodium aluminate solution. However, certain localized regions with noticeably lower brightness remained, standing in stark contrast to the surrounding areas. This phenomenon might be related to the precipitate (aluminum hydroxide) formed in the solution due to the addition of aluminate. This phenomenon may be attributed to the formation of aluminum hydroxide precipitates in the solution, induced by the addition of aluminate.
Figure 5 shows the roughness test of the surface coating layers of the six samples. The arithmetic average height of surface roughness is denoted by Sa. It represents the average value of the height deviations of the measured surface points.
As shown in Figure 5, the lowest roughness is observed in formula A, with a positive Ssk, indicating a tendency for protrusions. The single silicate solution contributes the most to the roughness of the oxide coating. Formula B shows a slight increase in roughness, with a negative Ssk, indicating a tendency for recesses. Since the pores in the phosphate coating layer are not covered by molten material, the pores are clearly visible, and the depth of the pores can be clearly captured. The difference in roughness mainly comes from the maximum valley depth (Sv). The surface of formula C is extremely rough, as consistently observed under the electron microscope. Although the maximum peak height (Sp) and the maximum valley depth (Sv) are not significantly different from formula B, the range and density of the uneven surface are much greater. The roughness of formula D is level with B, and from the model diagram, it can be clearly seen that it has pore characteristics similar to the optical microscope morphology. It is evident that the addition of sodium hydroxide to silicate increases the pore size of the coating layer, but the roughness slightly increases. Formula E is the result of the combined action of phosphate and silicate, with a roughness that is higher than both formula A and B, indicating that the formation of composite coating layers significantly affects the surface roughness. Formula F, with the addition of meta-aluminate on the basis of formula D, significantly improves roughness, with both the maximum peak and maximum depression at a very low level.
Figure 6 shows the cross-section of the PEO coating formed on the AZ31 magnesium alloy with a mixed electrolyte containing Na2SiO3, NaOH, Na3PO4, and NaAlO2. The yellow areas indicate regions with oxygen, clearly revealing the oxide coating portion. Oxygen species are uniformly distributed within the coating layer. The estimated thickness of the coating is over 50 μm. The red highlighted area represents the magnesium alloy matrix, while the magnesium content in the oxide coating is lower, appearing as a dark red region, similar in distribution to oxygen. The green aluminum element region clearly shows an increasing concentration from the barrier layer to the porous surface layer, which can be attributed to aluminum ions participating in the PEO process only at higher processing voltages. As the reaction progresses and the coating thickness increases, the aluminum content becomes higher closer to the coating surface. The blue silicon element is present in low concentrations within the coating, primarily because silicon is only found in Mg2SiO3 within the oxide coating. The purple region represents the distribution of phosphorus content, which is slightly higher near the substrate compared to the surface of the coating. Phosphate at low voltage (below 200 V) can fully participate in the growth of the oxide coating. As the reaction progresses, the concentration of phosphate ions in the solution decreases accordingly, resulting in the highest phosphorus content near the barrier layer.
The XRD patterns of the surface coatings formed on the AZ31 alloy after PEO treatment in electrolytes with varying silicate concentrations are shown in Figure 7. The PEO coatings primarily consist of Mg, MgO, and MgSiO3 phases. During the PRO process, the magnesium alloys undergo micro-regional melting under the instantaneous high temperature and pressure generated by micro-discharges. These molten regions diffuse through the discharge channels. In the presence of the electrolyte’s quenching effect, they rapidly combine with oxygen atoms adsorbed on the magnesium alloy surface to form and deposit MgO. SiO32− reacts with Mg2+ and O2− to form MgSiO3. During the PEO process, the high voltage induces local electrical breakdown on the substrate surface, activating the surface material and initiating discharge reactions. Within the substrate, magnesium combines with oxygen to form magnesium oxide (MgO), which constitutes the primary component of the coating. Additionally, alloying elements such as aluminum and zinc may also participate in the reactions, resulting in the formation of corresponding oxides or their incorporation into the oxide coating. Consequently, the composition of the oxide coating is not only derived from substances in the electrolyte but also includes components from the substrate material.
Figure 8 presents the XPS spectra of the oxide layer formed on AZ31 alloy following PEO at 400 V for 10 min in an electrolyte system containing phosphates, silicates, and sodium aluminate. The spectra include peaks for Mg1s, O1s, Al2p, P2p, and C1s. All spectra are normalized with respect to the C1s peak at 284.8 eV. The comprehensive spectrum indicates that the surface of the studied sample after PEO is primarily composed of Mg, O, and C, while the remaining components involve the presence of elements such as Si, Na, Al, and P. The Mg1s spectrum exhibits three peaks, with one around 1303 eV falling within the lower binding energy range, indicating the presence of residual, incompletely oxidized magnesium metal on the surface. The range between 1303 and 1304 eV is primarily attributed to MgO. Near 1305 eV, the peak is predominantly composed of magnesium oxide in higher oxidation states. When magnesium forms other oxides or reacts with water, it may produce magnesium hydroxide (Mg(OH)2) or magnesium silicate (Mg2SiO4). The higher binding energies of these compounds reflect the state of magnesium in higher oxidation states. The O1s spectrum comprises three peaks located at 531.9 eV (i), 530.9 eV (ii), and 532.9 eV (iii). Peak a originates from the double-bonded oxygen associated with magnesium oxide. Peak b corresponds to oxygen in hydroxyl groups. The final peak (c) represents the adsorption of oxygen in water. Additionally, the spectrum indicates that Al and P exist only as trace elements, confirming that trivalent aluminum and phosphate compounds are present in minimal amounts on the oxide coating surface.

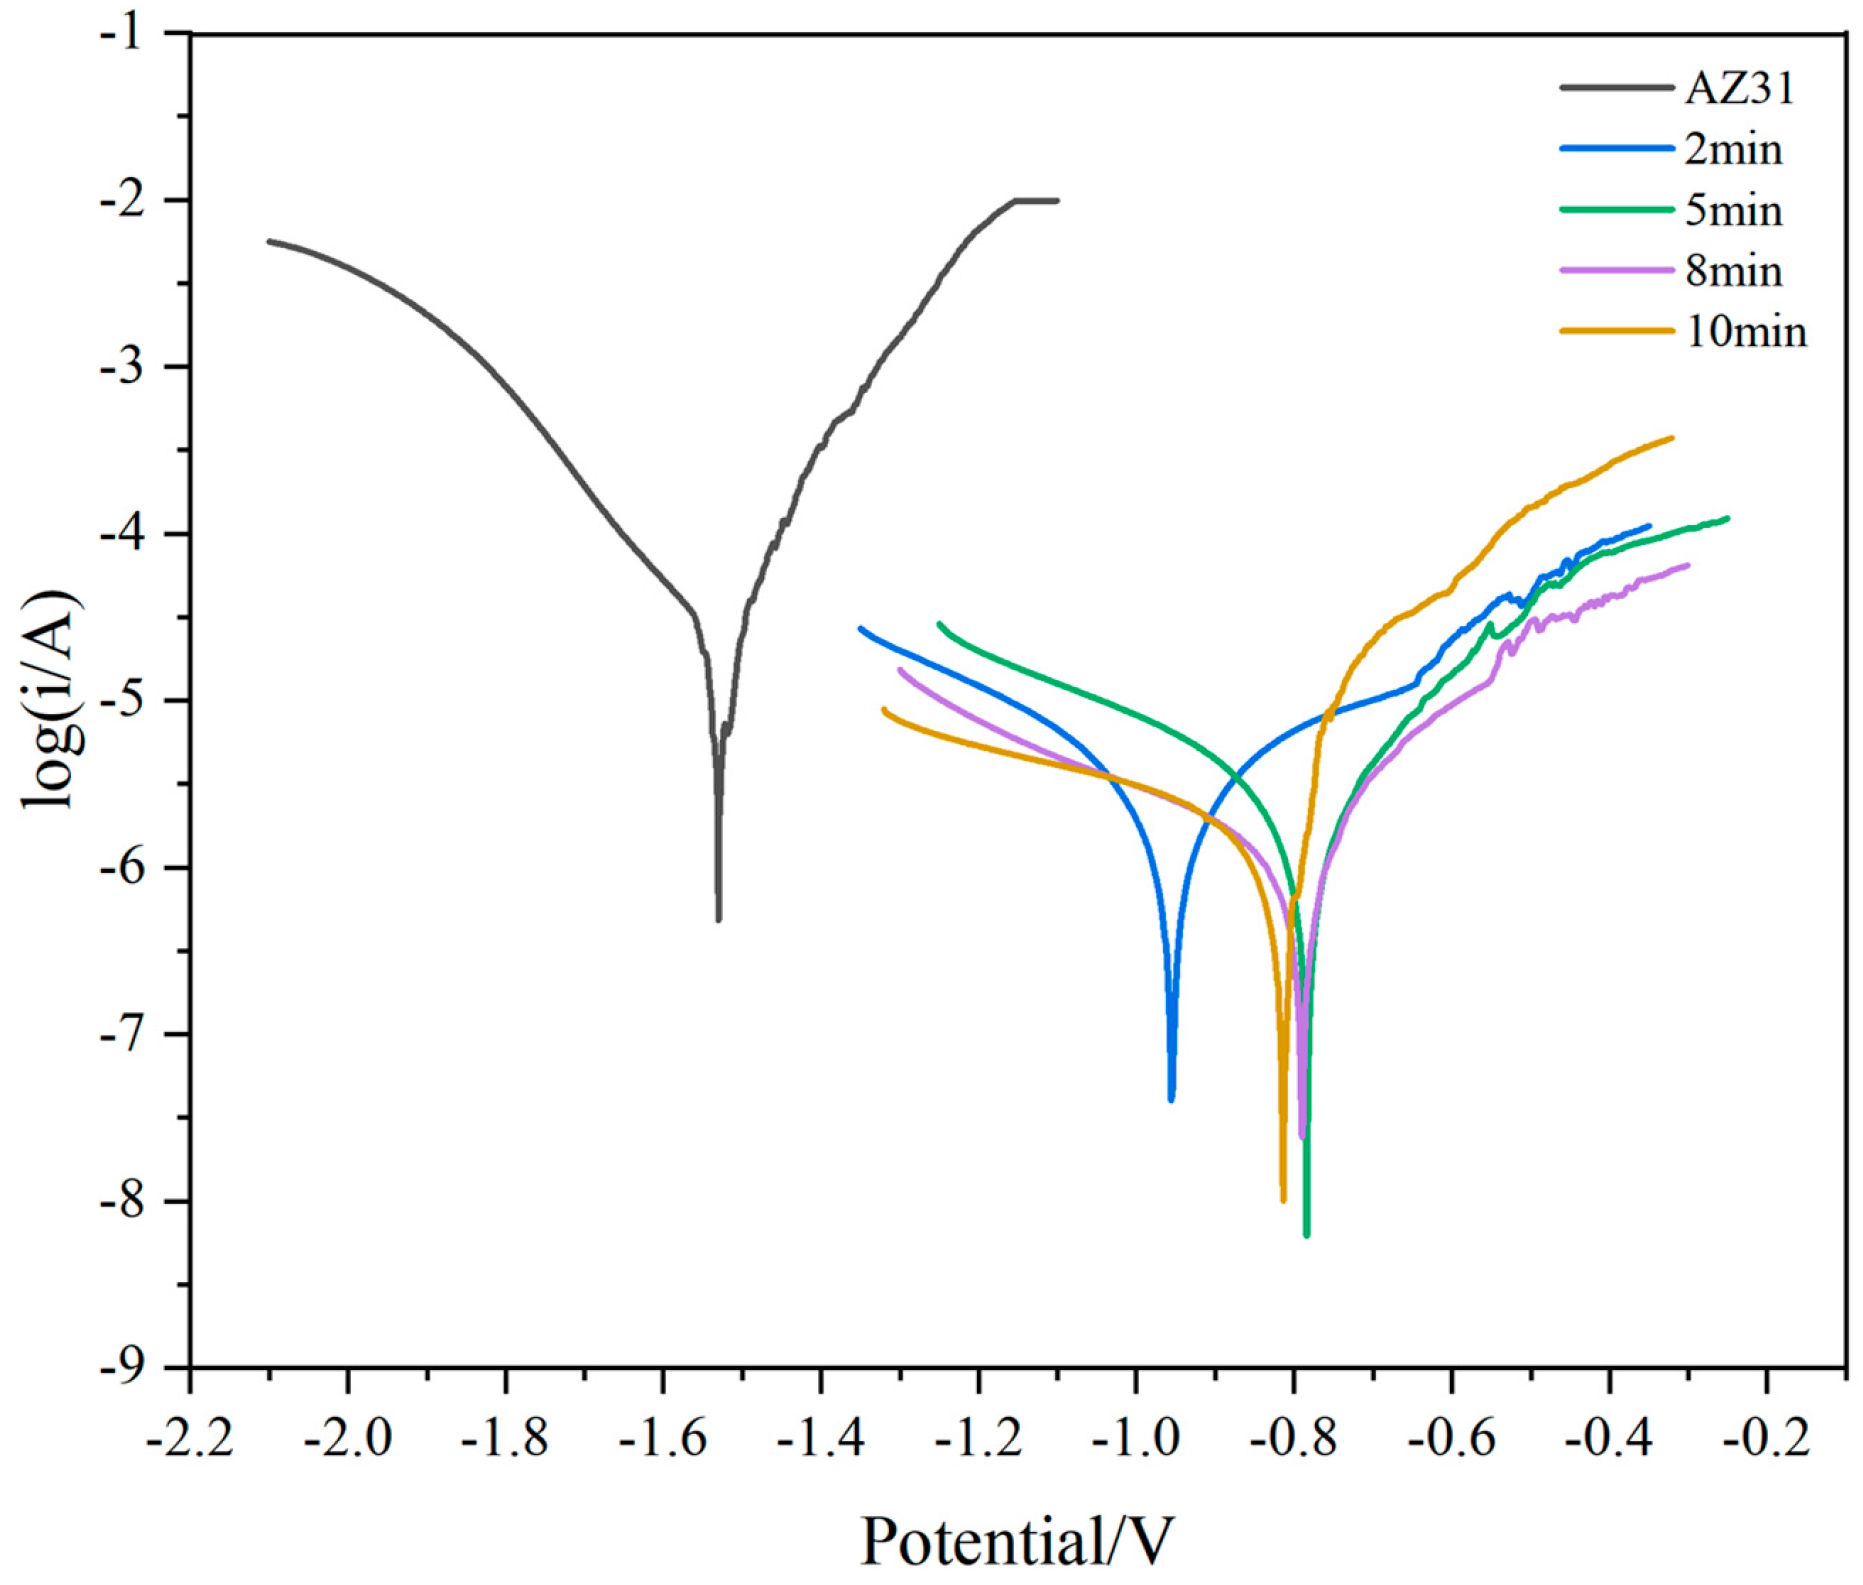
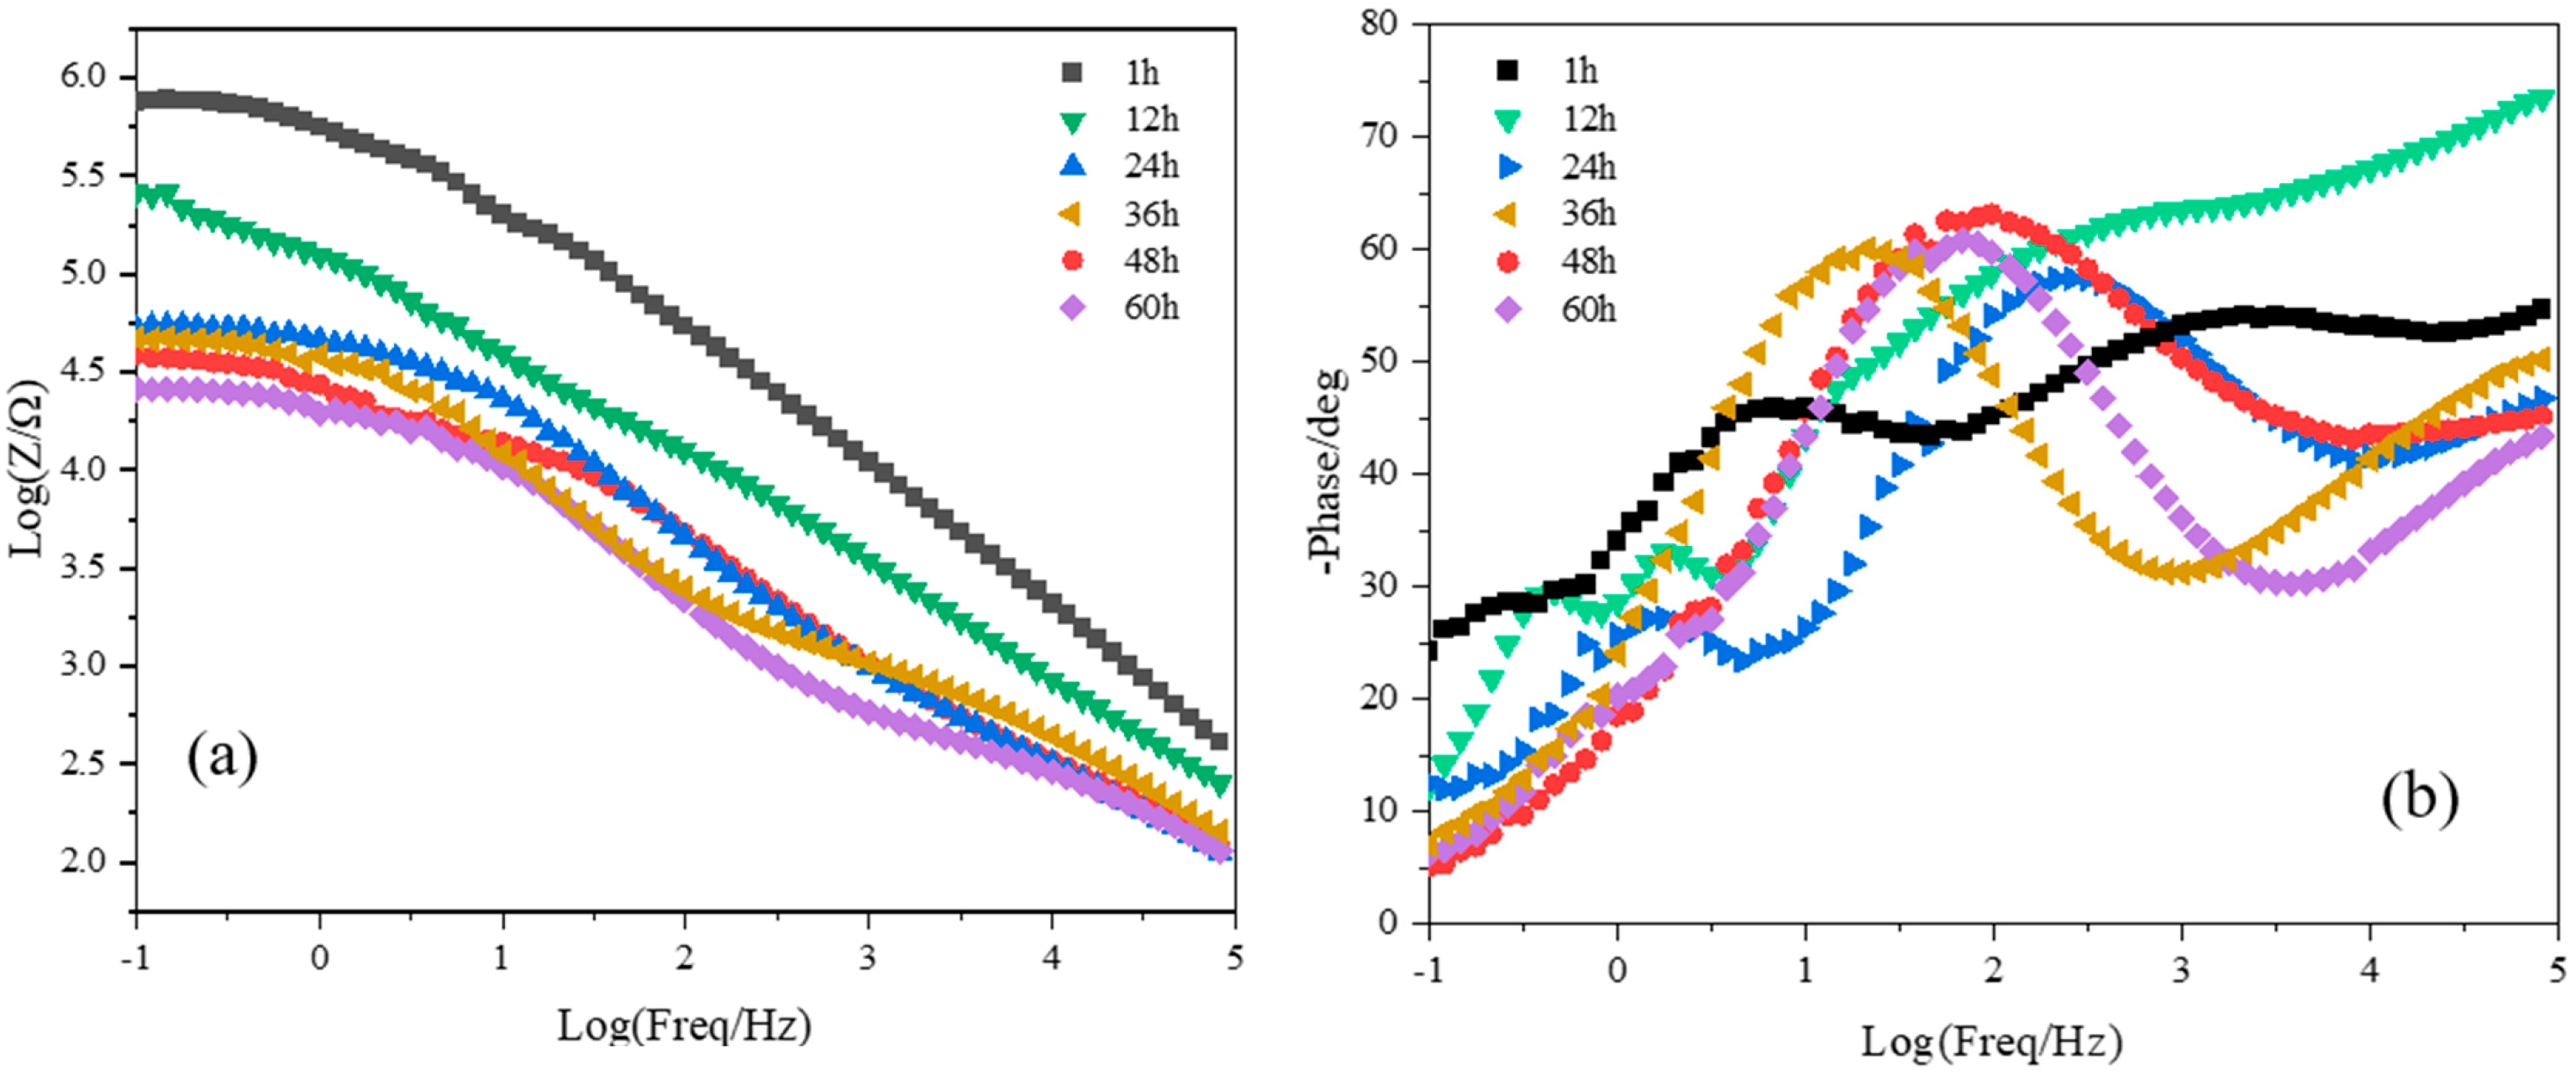
3.3. Corrosion Resistance of PEO Coating

Simultaneously, the corrosion resistance of the coating layer is influenced by various microstructural characteristics, including the coating’s compactness, defects, composition, and thickness. The AZ31 magnesium alloy is composed of the α-Mg phase and the β-Mg17Al12 phase, where Mg17Al12 is an intermetallic compound formed by Mg and Al. Due to the difference in electrode potentials between Mg and Al, the ignition voltage during the same micro-arc oxidation process will differ for Mg and Al, leading to selective ignition of the micro-arc oxidation reaction in areas with different element concentrations within the alloy matrix. However, the presence of the Mg17Al12 phase does not disrupt the continuity of the coating layer; This alternating discharge phenomenon contributes to the improvement in the coating-forming properties, resulting in good continuity and integrity of the coating layer [21,22,23,24,25].
The polarization curves of the coating layers are shown in Figure 9. Table 3 lists the corresponding fitting results. It is observed that compared with the AZ31 matrix, the corrosion potential Ecorr of the micro-arc oxidation treatment moves in the positive direction. The polarization resistance Rp increases by two orders of magnitude, and the corrosion current density Icorr decreases by one order of magnitude. This indicates that micro-arc oxidation can significantly enhance the corrosion resistance of magnesium alloys. Additionally, by comparison, it can be observed that the magnitude of the corrosion current decreases with the increase in PEO time. Under the conditions of 400 V, the longer the processing time (not more than ten minute limit), the better the corrosion resistance and the thicker the PEO coating.
Bode plots are widely employed in electrochemical impedance spectroscopy (EIS) to illustrate the impedance behavior of a system across a range of frequencies. By logarithmically plotting the impedance magnitude (|Z|) and phase angle versus frequency, their linear relations can be obtained.
Figure 10a presents the evolution of the EIS response for PEO coating formed in a silicate-based electrolyte, immersed in 3.5 wt.% NaCl solution and monitored continuously over a period of 60 h at 25 °C. In the magnitude–frequency plot, the impedance at the low-frequency limit is typically considered as the polarization resistance (Rp). The low-frequency impedance follows the following trend: |Z|initial < |Z|1h < |Z|12h < |Z|24h < |Z|36h < |Z|48h < |Z|60h, indicating a gradual decline in corrosion resistance with increasing immersion time.
The phase–frequency plot in Figure 10b reveals the phase relationship between voltage and current at various frequencies. Initially, three distinct phase peaks appear in the low-, mid-, and high-frequency regions. After 12 and 24 h of immersion, only two peaks remain, and at 36, 48, and 60 h, the response is characterized by a single peak. This evolution suggests the formation of corrosion products (such as oxides or hydroxides) on the surface, which progressively alter the interfacial reaction kinetics. As the corrosion layer thickens, it may suppress the charge transfer process at the electrode interface, causing the disappearance of the corresponding phase peak.
In porous electrode systems, changes in pore structure during immersion can also influence the impedance response. A simplification of the interfacial reaction due to the evolution of the pore geometry may lead to the merging of multiple peaks into a single one, further reflecting the transformation of the electrochemical behavior over time.

3.4. Discussion on the Mechanism of PEO

Based on the analysis results from XRD and XPS, it can be inferred that the AZ31 alloy undergoes an electrolytic plasma reaction within the electrolyte, shown as follows:
Mg + 2H2O → Mg(OH)2 + H2
Mg(OH)2 + SiO32− → MgSiO3 + H2O
3Mg2+ + 2PO43- → Mg3(PO4)2
Mg2+ + O2− → MgO
2AlO2 + 3Mg(OH)2 → MgAl2O4 + 6H2O
Reactions (1) and (2) would proceed in a silicate-based PEO process. The reaction products, such as MgSiO3, MgO, and H2, can be formed under the conditions of micro-discharge events. The phosphate-based PEO process generates reaction products such as Mg3(PO4)2, as shown by Reaction 3. In the mixed silicate–phosphate-based PEO process, MgAl2O4 could be formed, as shown in Reactions (4) and (5) [26].

4. Conclusions

The AZ31 magnesium alloy was processed by PEO methods with six types of electrolyte composition in this investigation. The acoustic emission, color, and morphology characteristics of the micro-discharge were recorded with the transforming electric current density. Generally, the PEO coatings have improved the corrosion resistance of the AZ31 base. The summarized results are described below.
The curve of current density–time shows a tendency for the former to increase and then decrease, with a similar transition for the acoustic emission intensity of noise spark. Three PEO sub-stages can be divided based on the transition points of current density and noise level: anodization, sparking, and micro-arc discharge.
Electrolyte composition can regulate the pore size and structure. The surface morphology of the PEO oxide coating in phosphate electrolyte is the smoothest, while the sodium aluminate is the most irregular and rough. The distribution for aluminum species tends to be on the outer layer of the PEO coating. Meanwhile, the sites for phosphorous species tend to be in the inner layer. The PEO coating formed in silicate electrolyte solution consists of MgSiO3 and MgO.
The corrosion resistance of PEO coating is closely related to the processing voltage, duration time, and electrolyte bath recipe. For the 400 V constant processing voltage, the longer duration time can bring a better corrosion resistance. The Formula F electrolyte (NaSiO3-Na3PO4-NaAlO2) demonstrates the best anti-corrosion performance. The corrosion density of the 10 min–400 V (1.415 × 10⁻⁶ A/cm2) decreased about 17% compared with that of the 2 min–400 V PEO coating (1.738 × 10⁻⁶ A/cm2).

Author Contributions

Y.Y.: Investigation, original draft, Writing-review & editing. L.W.: Funding acquisition. Z.B.: Supervision. X.H.: Supervision. All authors have read and agreed to the published version of the manuscript.

Funding

This work was funded by the National Natural Science Foundation of China (No. 50901033).

Institutional Review Board Statement

Not applicable.

Informed Consent Statement

Not applicable.

Data Availability Statement

No new data were created or analyzed in this study.

Conflicts of Interest

The authors declare no conflict of interest.

References

  1. Orlov, D.; Ralston, K.D.; Birbilis, N.; Estrin, Y. Enhanced corrosion resistance of Mg alloy ZK60 after processing by integrated extrusion and equal channel angular pressing. Acta Mater. 2011, 59, 6176–6186. [Google Scholar] [CrossRef]
  2. Lin, M.C.; Tsai, C.Y.; Uan, J.Y. Electrochemical behaviour and corrosion performance of Mg–Li–Al–Zn anodes with high Al composition. Corros. Sci. 2009, 51, 2463–2472. [Google Scholar] [CrossRef]
  3. Song, J.F.; She, J.; Chen, D.L.; Pan, F.S. Latest research advances on magnesium and magnesium alloys worldwide. J. Magnes. Alloys 2020, 8, 1–41. [Google Scholar] [CrossRef]
  4. Zhang, X.; Li, Y.J.; Zhang, K.; Wang, C.S.; Li, H.W.; Ma, M.L.; Zhang, B.D. Corrosion and electrochemical behavior of Mg–Y alloys in 3.5% NaCl solution. Trans. Nonferrous Met. Soc. China 2013, 23, 1226–1236. [Google Scholar] [CrossRef]
  5. Ma, Y.; Hu, H.; Northwood, D.; Nie, X. Optimization of the electrolytic plasma oxidation processes for corrosion protection of magnesium alloy AM50 using the Taguchi method. J. Mater. Process. Technol. 2007, 182, 58–64. [Google Scholar] [CrossRef]
  6. Song, D.; Jing, X.; Wang, J.; Lu, S.; Yang, P.; Wang, Y.; Zhang, M. Microwave-assisted synthesis of lanthanum conversion coating on Mg-Li alloy and its corrosion resistance. Corros. Sci. 2011, 53, 3651–3656. [Google Scholar] [CrossRef]
  7. Kaseem, M.; Fatimah, S.; Nashrah, N.; Ko, Y.G. Recent progress in surface modification of metals coated by plasma electrolytic oxidation: Principle, structure, and performance. Prog. Mater. Sci. 2021, 117, 100735. [Google Scholar] [CrossRef]
  8. Bordbar-Khiabani, A.; Yarmand, B.; Sharifi-Asl, S.; Mozafari, M. Improved corrosion performance of biodegradable magnesium in simulated inflammatory condition via drug-loaded plasma electrolytic oxidation coatings. Mater. Chem. Phys. 2019, 239, 122003. [Google Scholar] [CrossRef]
  9. Boinet, M.; Verdier, S.; Maximovitch, S.; Dalard, F. Application of acoustic emission technique for in situ study of plasma anodising. NDTE Int. 2004, 37, 213–219. [Google Scholar] [CrossRef]
  10. Boinet, M.; Verdier, S.; Maximovitch, S.; Dalard, F. Plasma electrolytic oxidation of AM60 magnesium alloy: Monitoring by acoustic emission technique. Electrochemical properties of coatings. Surf. Coat. Technol. 2005, 199, 141–149. [Google Scholar] [CrossRef]
  11. Bao, F.; Li, F.; Bashkov, O.; Wang, Z.; Sund, L. Stage division and discharge mechanism characterization of micro-arc oxidation based on acoustic emission. Surf. Coat. Technol. 2025, 502, 131964. [Google Scholar] [CrossRef]
  12. Wang, L.; Chen, L.; Yan, Z.; Fu, W. Optical emission spectroscopy studies of discharge mechanism and plasma characteristics during plasma electrolytic oxidation of magnesium in different electrolytes. Surf. Coat. Technol. 2010, 205, 1651–1658. [Google Scholar] [CrossRef]
  13. Yang, X.; Chen, L.; Qu, Y.; Liu, R.; Wei, K.; Xue, W. Optical emission spectroscopy of plasma electrolytic oxidation process on 7075 aluminum alloy. Surf. Coat. Technol. 2017, 324, 18–25. [Google Scholar] [CrossRef]
  14. Dunleavy, C.S. Development of Quantitative Techniques for the Study of Discharge Events During Plasma Electrolytic Oxidation Processes. Ph.D. Thesis, Department of Materials Science and Metallurgy, University of Cambridge, Cambridge, UK, 2010. [Google Scholar]
  15. Rogov, A.B.; Yerokhin, A.; Matthews, A. The Role of Cathodic Current in Plasma Electrolytic Oxidation of Aluminum: Phenomenological Concepts of the “Soft Sparking” Mode. Langmuir 2017, 33, 11059–11069. [Google Scholar] [CrossRef] [PubMed]
  16. Kamil, M.P.; Kaseem, M.; Ko, Y.G. Soft plasma electrolysis with complex ions for optimizing electrochemical performance. Sci. Rep. 2017, 7, 44458. [Google Scholar] [CrossRef] [PubMed]
  17. Ji, G.; Ma, L.; Wu, L. Effect of the gas layer evolution on electrolytic plasma polishing of stainless steel. Sci. Rep. 2024, 14, 22099. [Google Scholar] [CrossRef] [PubMed]
  18. Wang, J.; Sun, H.; Yang, D.; Ji, G.; Duan, H.; Xiang, Y. Local surface smoothness on TC4 alloy during microbubbles flow electrolytic plasma polishing: Prototype rig, phenomena, and mechanism. Int. J. Adv. Manuf. Technol. 2024, 134, 1879–1892. [Google Scholar] [CrossRef]
  19. Nikoomanzari, E.; Fattah-alhosseini, A. Maximizing the potential applications of plasma electrolytic oxidation coatings produced on Mg-based alloys in anti-corrosion, antibacterial, and photocatalytic targeting through harnessing the LDH/PEO dual structure. J. Magnes. Alloys 2024, 12, 2674–2694. [Google Scholar] [CrossRef]
  20. Sisarwal, V.; Dong, S.; Toh, R.J.; Gamaleldin, K.; Kulkarni, S.; Li, H.; Cole, I.S.; Dong, J.; Chen, X. Plasma electrolytic oxidation upon Mg alloys: Fundamentals, state-of-the-art progress and challenges. In Conversion Coatings for Magnesium and Its Alloys; Saji, V.S., Narayanan, T.S.N.S., Chen, X., Eds.; Springer: Berlin/Heidelberg, Germany, 2022; pp. 445–465. [Google Scholar]
  21. Zozulin, A.J.; Bartak, D.E. Anodized coatings for magnesium alloys. Met. Finish. 1994, 29, 39–44. [Google Scholar]
  22. Liu, B.; Zhang, P.L.; Wang, J.Q.; Zhang, D.; Zhou, J.F.; Yang, S.R. AZ91D Micro-arc oxidation behavior of magnesium alloys in different electrolyte systems. J. Shanghai Jiao Tong Univ. 2010, 44, 16–20. [Google Scholar]
  23. Wang, S.; Yan, F.Y. Preparation of light green ceramic film by microarc oxidation of magnesium alloy. Nonferrous Met. Eng. 2014, 4, 36–38. [Google Scholar]
  24. Luo, H.H.; Cai, Q.Z.; Wei, B.C. AZ91D Optimization of microarc oxidation process parameters for magnesium alloy. Spec. Cast. Nonferrous Alloys 2007, 27, 554–556. [Google Scholar]
  25. Xue, W.B.; Lai, Y.C.; Deng, Z.W.; Chen, R.Y.; Liu, G. The properties of coating formed by microplasma oxidation on magnesium alloy. Mater. Sci. Technol. 1997, 5, 89–92. [Google Scholar]
  26. Wang, Y.; Huang, Z.; Yan, Q.; Liu, C.; Liu, P.; Zhang, Y.; Guo, C.; Jian, G.; Shen, D. Corrosion behaviors and effects of corrosion products of plasma electrolytic oxidation coated AZ31 magnesium alloy under the salt spray corrosion test. Appl. Surf. Sci. 2016, 378, 435–442. [Google Scholar] [CrossRef]
Figure 1. Schematic representation for the formation, structure, and property evaluation of PEO coating formed on AZ31 magnesium alloy.
Coatings 15 00846 g001
Figure 2. Current–time curves along with corresponding sound intensity curves and frequency distribution graphs within the electrolyte of Na3PO4-Na2SiO3, under three distinct voltages: (a) 200 V, (b) 300 V, and (c) 400 V.
Coatings 15 00846 g002
Figure 3. PEO coating morphology formed on AZ31 magnesium alloy with different electrolyte solution (optical microscope). Formula (A): 30 g/L Na2SiO3; formula (B): 30 g/L Na3PO4; formula (C): 12 g/L NaAlO2; formula (D): 15 g/L Na2SiO3, 7.5 g/L NaOH; formula (E): 15 g/L Na2SiO3, 15 g/L Na3PO4; formula (F): 10 g/L Na2SiO3, 5 g/L NaOH, 4 g/L NaAlO2.
Coatings 15 00846 g003
Figure 4. PEO coating morphology formed on AZ31 magnesium alloy with different electrolyte solution (scanning electron microscope). Formula (A): 30 g/L Na2SiO3; formula (B): 30 g/L Na3PO4; formula (C): 12 g/L NaAlO2; formula (D): 15 g/L Na2SiO3, 7.5 g/L NaOH; formula (E): 15 g/L Na2SiO3, 15 g/L Na3PO4; formula (F): 10 g/L Na2SiO3, 5 g/L NaOH, 4 g/L NaAlO2.
Coatings 15 00846 g004
Figure 5. Surface roughness of PEO coating formed in different electrolyte solution A-B: (1) formula A: 30 g/L Na2SiO3; (2) formula B: 30 g/L Na3PO4. (3) formula C: 12 g/L NaAlO2; (4) formula D: 15 g/L Na2SiO3, 7.5 g/L NaOH; (5) formula E: 15 g/L Na2SiO3, 15 g/L Na3PO4; (6) formula F: 10 g/L Na2SiO3, 5 g/L NaOH, 4 g/L NaAlO2.
Coatings 15 00846 g005aCoatings 15 00846 g005b
Figure 6. Composition distribution of O, Mg, Al, Si, and P along the cross-section of PEO coating.
Coatings 15 00846 g006
Figure 7. XRD analysis result for PEO coatings formed within 5, 2, 10 min.
Coatings 15 00846 g007
Figure 8. XPS Spectral analysis of AZ31 oxide layer: (a) full spectrum; (b) O1s; (c) C1s; (d) Al2p; (e) Mg1s; (f) P.
Coatings 15 00846 g008
Figure 9. The polarization curves of the PEO coatings formed on AZ31 magnesium alloy with different processing times.
Coatings 15 00846 g009
Figure 10. Bode plots of AZ31 coatings immersed in NaCl solution for varying durations: (a) phase angle versus frequency; (b) |Z| versus frequency.
Coatings 15 00846 g010
Table 1. Chemical composition of AZ31 magnesium alloy (wt.%).
AlZnMnSiCuCaMg
2.9%1.1%0.3%0.07%0.01%0.04%Margin
Table 2. PEO electrolyte composition (g/L).
FormulaNaSiO3NaOHNa3PO4NaAlO2
A30000
B00300
C00012
D157.500
E150150
F10504
Table 3. The fitting results of polarization curves for PEO coatings.
SampleOCP/VEcorr/VIcorr/(A/cm2)
Initial−1.604−1.52472.712 × 10−5
400 V–2 min−0.951−0.9421.738 × 10−6
400 V–5 min−0.8239−0.7991.601 × 10−6
400 V–8 min−0.8205−0.7931.172 × 10−6
400 V–10 min−0.8041−0.8251.415 × 10−6
Disclaimer/Publisher’s Note: The statements, opinions and data contained in all publications are solely those of the individual author(s) and contributor(s) and not of MDPI and/or the editor(s). MDPI and/or the editor(s) disclaim responsibility for any injury to people or property resulting from any ideas, methods, instructions or products referred to in the content.

