Article

Experimental Study on Two Types of Novel Prefabricated Counterfort Retaining Wall: Performance Characteristics and Earth Pressure Reduction Effect of Geogrids

1
School of Civil Engineering, Chongqing Jiaotong University, Chongqing 400074, China
2
China Railway Changjiang Transport Design Group Co., Ltd., Chongqing 401121, China
3
College of Water Conservancy and Hydropower Engineering, Hohai University, Nanjing 210098, China
4
School of Materials Science and Engineering, Chongqing Jiaotong University, Chongqing 400074, China
*
Author to whom correspondence should be addressed.
Coatings 2025, 15(7), 841; https://doi.org/10.3390/coatings15070841
Submission received: 12 June 2025 / Revised: 13 July 2025 / Accepted: 14 July 2025 / Published: 18 July 2025
(This article belongs to the Special Issue Novel Cleaner Materials for Pavements)

Abstract

Conventional cast-in-place counterfort retaining walls, while widely used to support the fill body in geotechnical engineering cases, suffer from extended construction cycles and environmental impacts that constrain their usage more widely. In this study, in order to overcome these limitations, the performance of two types of innovative prefabricated counterfort retaining wall system—a monolithic design and a modular design—was investigated through physical modeling. The results reveal that failure mechanisms are fundamentally governed by the distribution of stress at the connection interfaces. The monolithic system, with fewer connections, concentrates stress and is more vulnerable to cracking at the primary joints. In contrast, the modular system disperses loads across numerous connections, reducing localized stress. Critically, this analysis identified a construction-dependent failure mode: incomplete contact between the foundation and the base slab induces severe bending moments that can lead to catastrophic failure. Furthermore, this study shows that complex stress states due to backfill failure can induce detrimental tensile forces on the wall structure. To address this, a composite soil material–wall structure system incorporating geogrid reinforcement was developed. This system significantly enhances the backfill’s bearing capacity and mitigates adverse loading. Based on the comprehensive analysis of settlement and structural performance, the optimal configuration involves concentrating geogrid layers in the upper third of section of the backfill, with sparser distribution below.

1. Introduction

Retaining walls are critical structures used for maintaining the stability of soil and rock slopes in civil engineering applications, including transportation, municipal, and hydraulic projects [1,2,3]. Conventionally, these walls are constructed using cast-in-place concrete. Among these, cantilever retaining walls are frequently employed due to their high structural integrity and mature construction technology. However, the limitations of cast-in-place methods—such as extended construction periods, high labor dependency, and significant environmental impact—are increasingly at odds with the modern demands for sustainable and green development. Consequently, prefabricated structures have emerged as a promising alternative, offering advantages in construction efficiency, sustainability, and environmental friendliness [4,5,6,7,8]. The simple and lightweight nature of panel-based retaining wall designs makes them particularly suitable for prefabrication [9].
In roadway applications, prefabricated retaining walls are subjected to traffic-induced vibrations, which can degrade the integrity of structural connections and the surrounding backfill [10]. Indeed, the mechanical behavior of the backfill itself—governed by complex factors like particle gradation and shear characteristics—poses a significant challenge to stability [11,12]. Therefore, reinforcing the backfill is essential to ensure the long-term stability and operational performance of these walls. The recent advancements in soil improvement, such as Microbially Induced and Enzyme-Induced Calcium Carbonate Precipitation (MICP/EICP), have shown promise in enhancing the mechanical properties and bearing capacity of soils in an environmentally compatible manner [13,14]. Concurrently, the use of geogrids as a geosynthetic reinforcement within the backfill has been proven to reduce soil deformation and mitigate stress concentration on the wall structure [15,16,17]. The integration of geogrids with prefabricated retaining walls is a natural progression, as many existing geogrid-reinforced systems already utilize precast components [18,19,20].
Previous research has explored various facets of prefabricated retaining walls. For instance, Wang et al. [21] introduced a novel prefabricated green ecological retaining wall, investigating its stress characteristics through full-scale testing and numerical simulation. Tiwary et al. [22] used three-dimensional finite element analysis to demonstrate that precast concrete retaining walls exhibit less stress and deflection compared to cast-in-place cantilever and gravity walls. Farhat and Issa [23] developed a new prefabricated wall design that reduced concrete consumption by 57% and significantly improved construction efficiency. Lu and Wu [24]. showed that prestressed precast concrete walls possess superior self-recovery capabilities and seismic performance over the traditional reinforced concrete walls. Ferdous et al. [25] investigated the flexural performance of concrete-filled GFRP modular walls, identifying them as a viable alternative to the traditional systems. Similarly, Javadi et al. [26] confirmed that T-shaped precast segmental walls can provide sufficient strength and stiffness for accelerated construction schedules.
Despite these advancements, the existing literature has primarily focused on the development of novel prefabricated systems. While advanced predictive models are being developed for complex material failure phenomena in other civil engineering contexts, such as asphalt fracturing [27], a standardized design methodology is lacking, and the cracking mechanisms at critical connection joints remain poorly understood. Furthermore, there is a significant research gap concerning the complex soil–structure interaction and the overall performance of composite systems that combine prefabricated walls with reinforced soil. This study aims to address these deficiencies. We first consolidate existing design and analysis methods to propose a systematic calculation framework. Subsequently, we investigate the structural behavior and joint failure mechanisms of two distinct prefabricated retaining wall designs through physical model testing. Finally, we introduce geogrid reinforcement into the backfill to study how different geogrid layouts affect the performance of the integrated prefabricated retaining wall system.

2. Introduction to Prefabricated Buttress Retaining Wall Structures

Prefabricated counterfort retaining walls are designed in numerous structural configurations, each exhibiting distinct mechanical behaviors and requiring tailored analytical methods. This study investigates the force characteristics and failure modes of two principal designs: monolithic and modular.

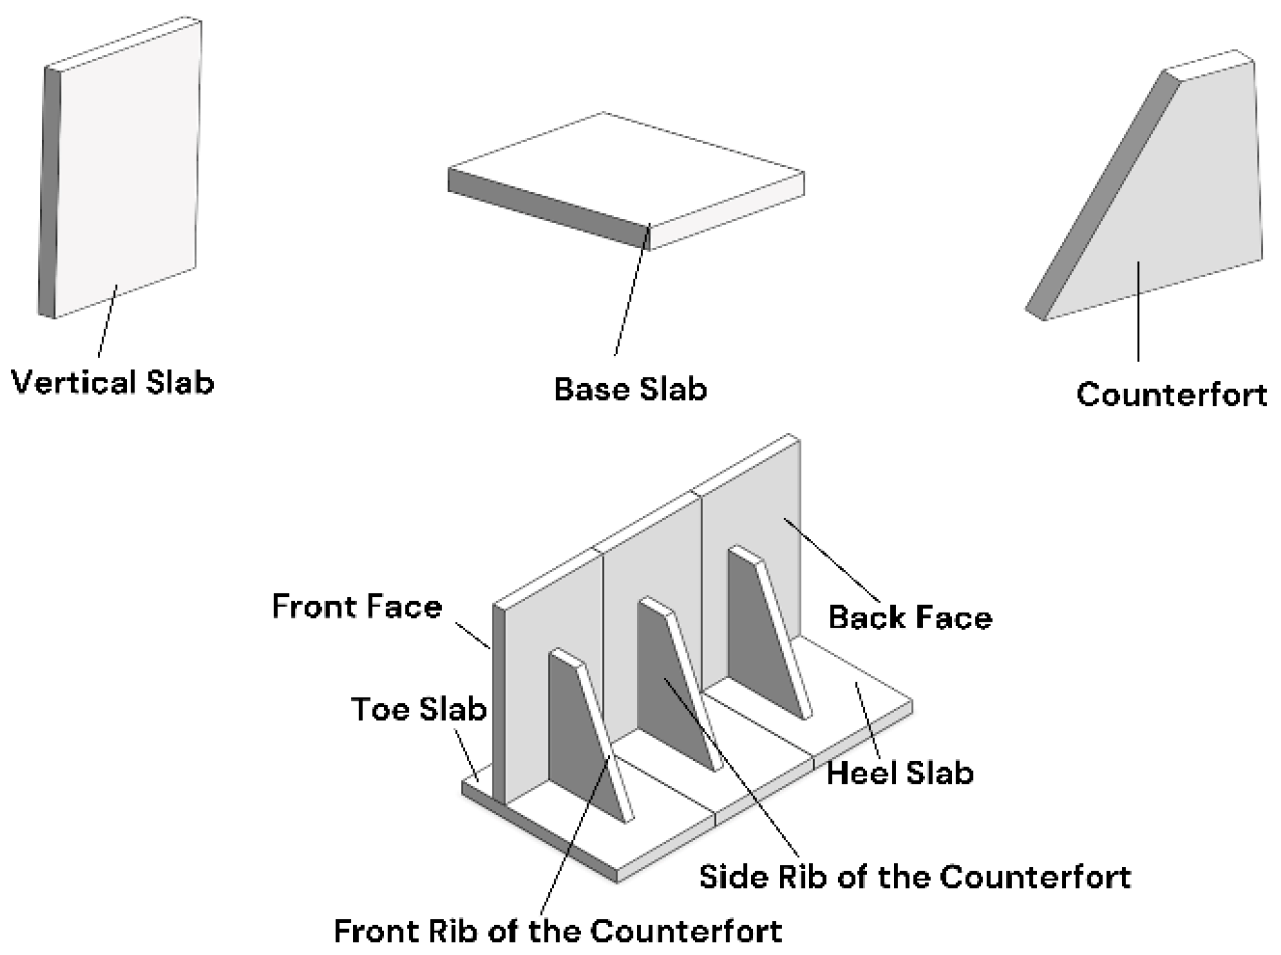
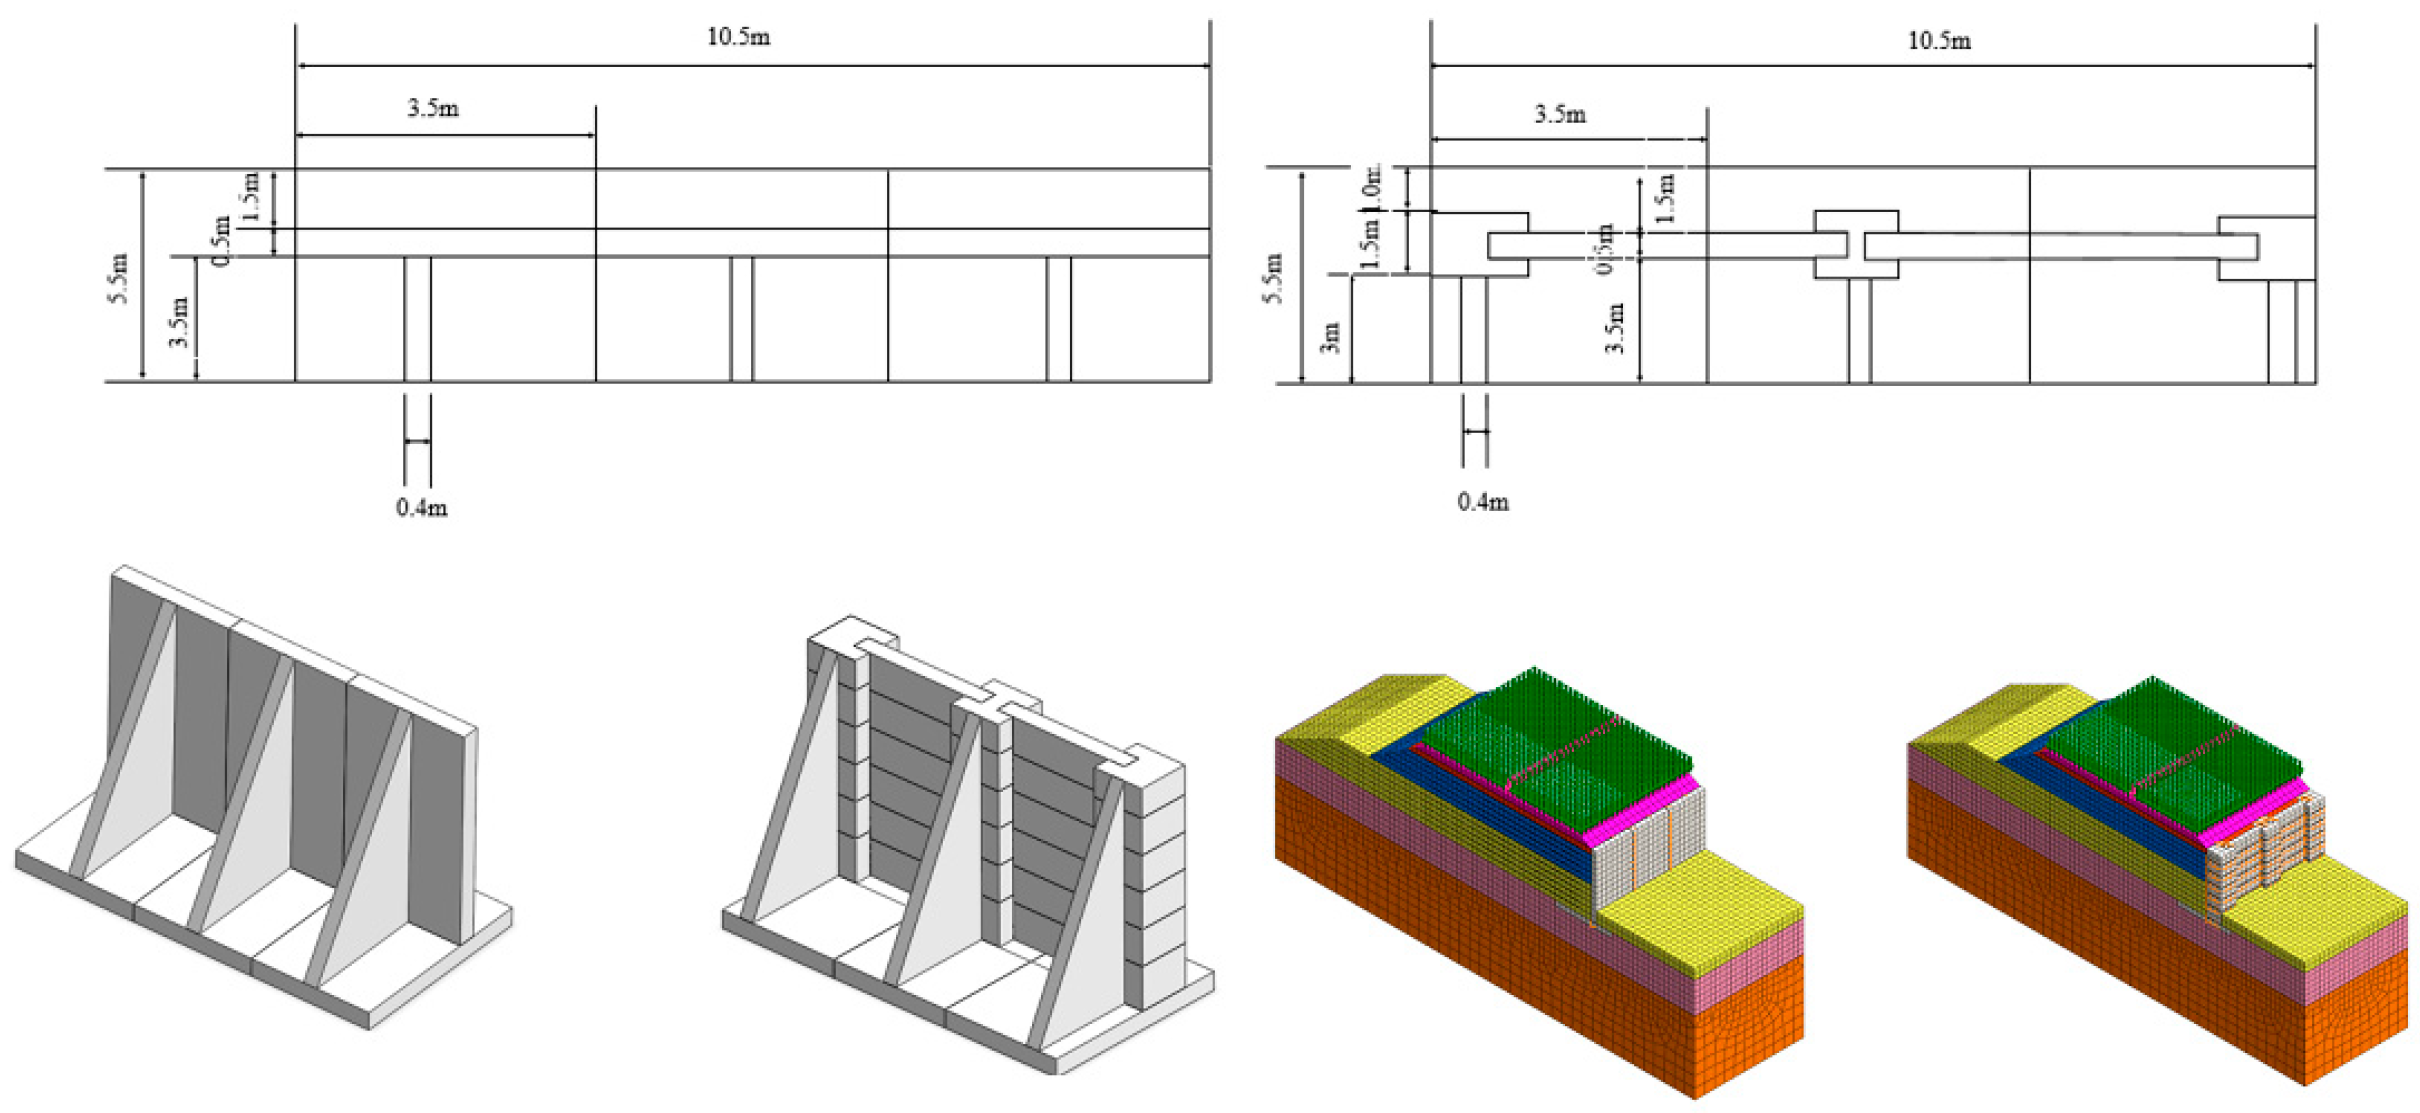
2.1. The Monolithic Prefabricated Counterfort Design

The monolithic prefabricated counterfort retaining wall depicted in Figure 1 shares its fundamental geometry with its cast-in-place counterpart. Its defining feature, however, is that it is not built as a single pour, but is assembled from individual precast elements: the stem, the base, and the counterforts themselves.
This approach yields superior structural integrity due to the limited number of joints, leading to a more reliable performance under load. The main drawback, however, is a matter of scale. For taller walls, the individual prefabricated components are exceptionally large and heavy, which complicates logistics and installation. Consequently, the practical advantages of prefabrication are diminished as the scale of the structure grows. Accordingly, our analysis was deliberately focused on the system’s most critical connection interface, as its performance governs the structural integrity of the entire wall. Fortifying this single weakest link is therefore sufficient to ensure the stability of the complete system.

2.2. Modular Prefabricated Counterfort Retaining Wall

The modular prefabricated counterfort retaining wall is structurally distinct from its cast-in-place counterpart. As depicted in Figure 2, it is assembled from four principal types of precast component: uprights, horizontal panel elements, a base slab, and counterforts.
The system employs two different upright profiles: rectangular end uprights featuring a single groove, and I section intermediate uprights with grooves on both sides. The soil-retaining face of the wall is not a single slab, but is instead formed by stacking the horizontal panel elements, the ends of which are inserted into the uprights’ grooves. While the panels themselves are not directly interconnected, robust connections are established between the adjacent uprights and between the uprights and the base slab.
This configuration creates a coherent and efficient load path. The vertical uprights bear the lateral earth pressure transferred from the panel elements. At each upright, a counterfort acts in tension to restrain the member. The uprights are further anchored to the base slab, which is in turn stabilized by the mass of the backfill material above it. This integrated system effectively mitigates the stresses on the uprights. For enhanced structural integrity, the horizontal joints between panels are staggered relative to the panel-upright interfaces.
The primary advantage of this modular design is its high degree of prefabrication. For taller retaining walls, breaking down the massive structure into smaller, manageable components significantly reduces the logistical and construction complexities, fully realizing the benefits of off-site manufacturing. Conversely, its main drawbacks are a comparative reduction in overall structural integrity and the introduction of numerous potential planes of weakness at the connection interfaces.

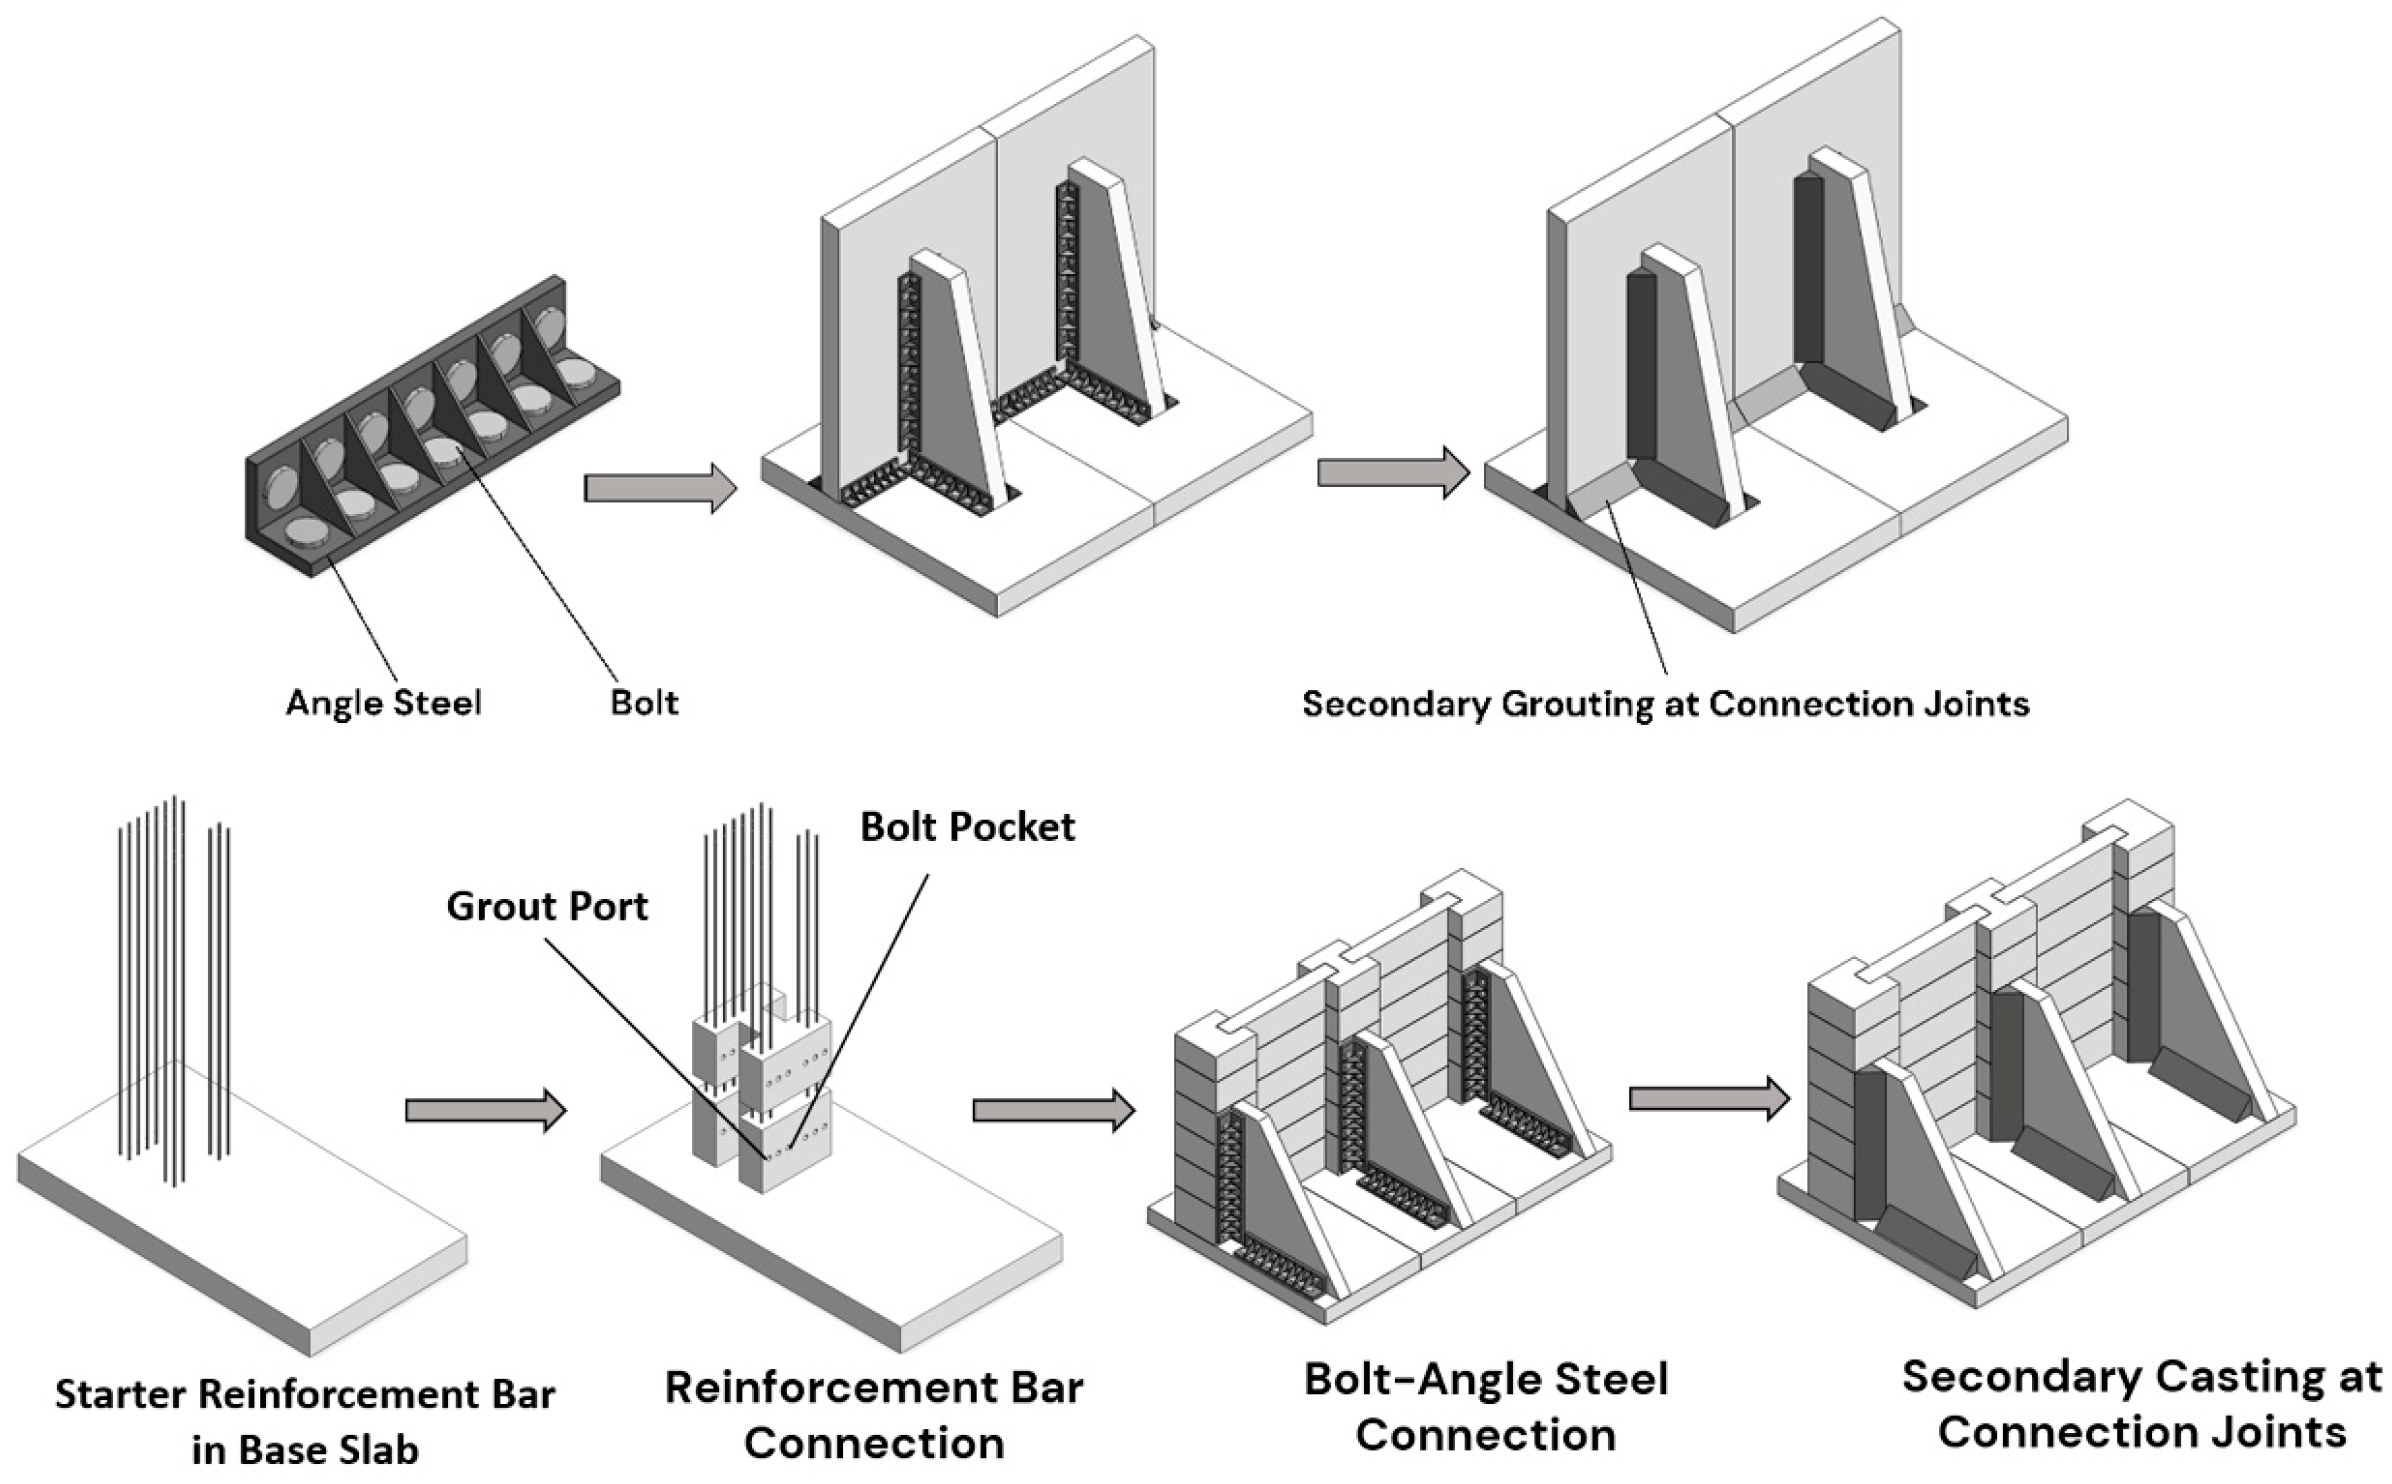
2.3. Connection Methods for Prefabricated Counterfort Retaining Walls

A diverse range of connection methods can be employed for prefabricated counterfort retaining walls, including welding, bolted angle brackets, and grouted rebar couplers. The choice of connection method critically influences the overall structural performance, contributing to the design versatility of these systems. The connection strategies for the monolithic and modular designs discussed previously are outlined below.
For a monolithic prefabricated counterfort retaining wall, practical considerations often favor a unified connection strategy to simplify design and construction. For example, bolted angle brackets can be employed to join the three primary components: the vertical stem, the base slab, and the counterforts. As illustrated in Figure 3, these steel connections are subsequently encased in a secondary concrete pour, a process which both integrates the joint and protects the steel components from corrosion.
Conversely, the modular design, with its greater number of distinct interfaces, often necessitates a hybrid approach using multiple connection types to meet the structural demands. For instance (Figure 3), reinforcing bars can form primary structural joints, such as those between adjacent uprights and between the uprights and the base slab. In this approach, starter bars are typically left projecting from the base slab to be inserted into pre-formed ducts in the uprights; the connection is then completed by injecting high-strength grout to fill the annular space. Concurrently, bolted angle brackets may be used for other critical connections, like attaching the counterforts to the uprights and the base slab. The specific combination of methods can, of course, be tailored to site-specific conditions and the overall design requirements.

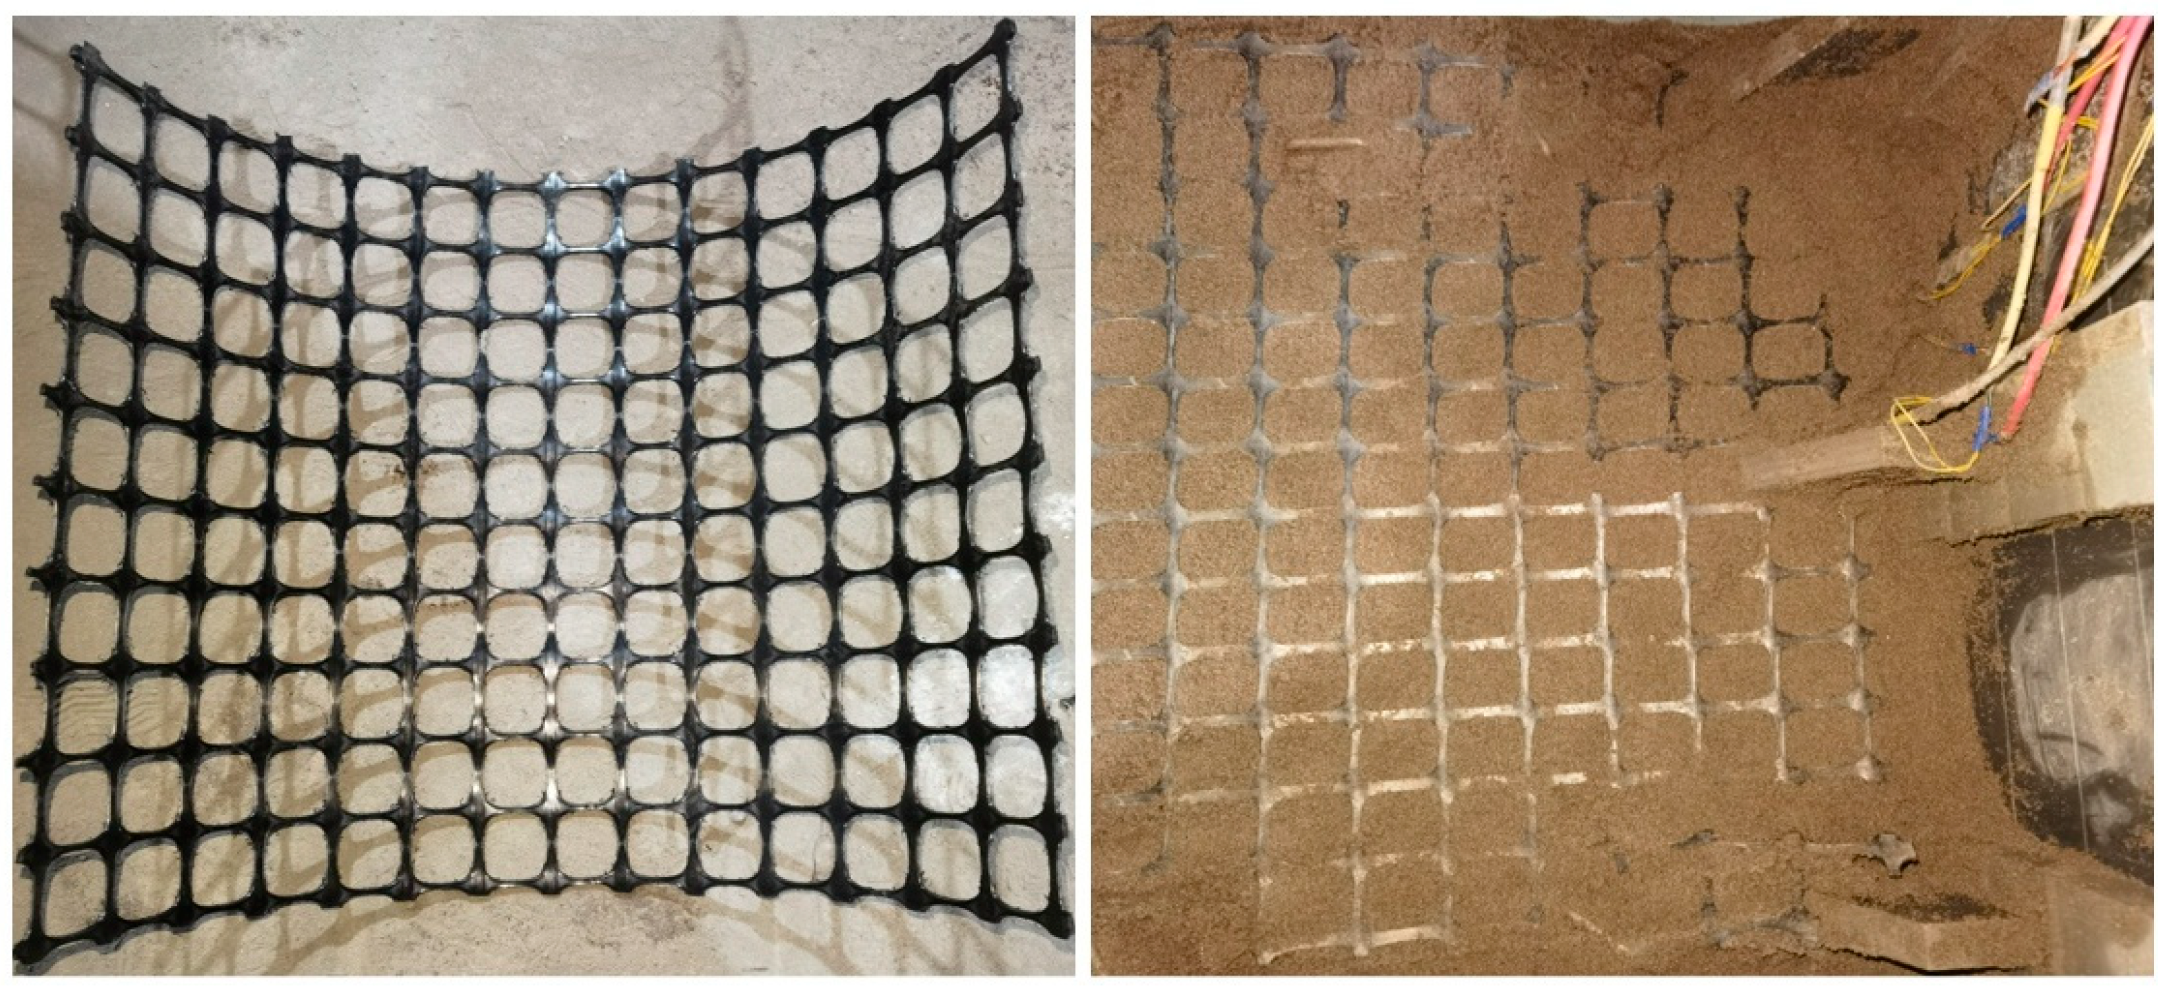
2.4. Geogrid Material

The geogrid employed in this study is a biaxially oriented polypropylene material, featuring a regular, grid-like aperture structure, as depicted in Figure 4. The specimens measured 37 cm in length and 47 cm in width, with a nominal thickness of 4 mm.

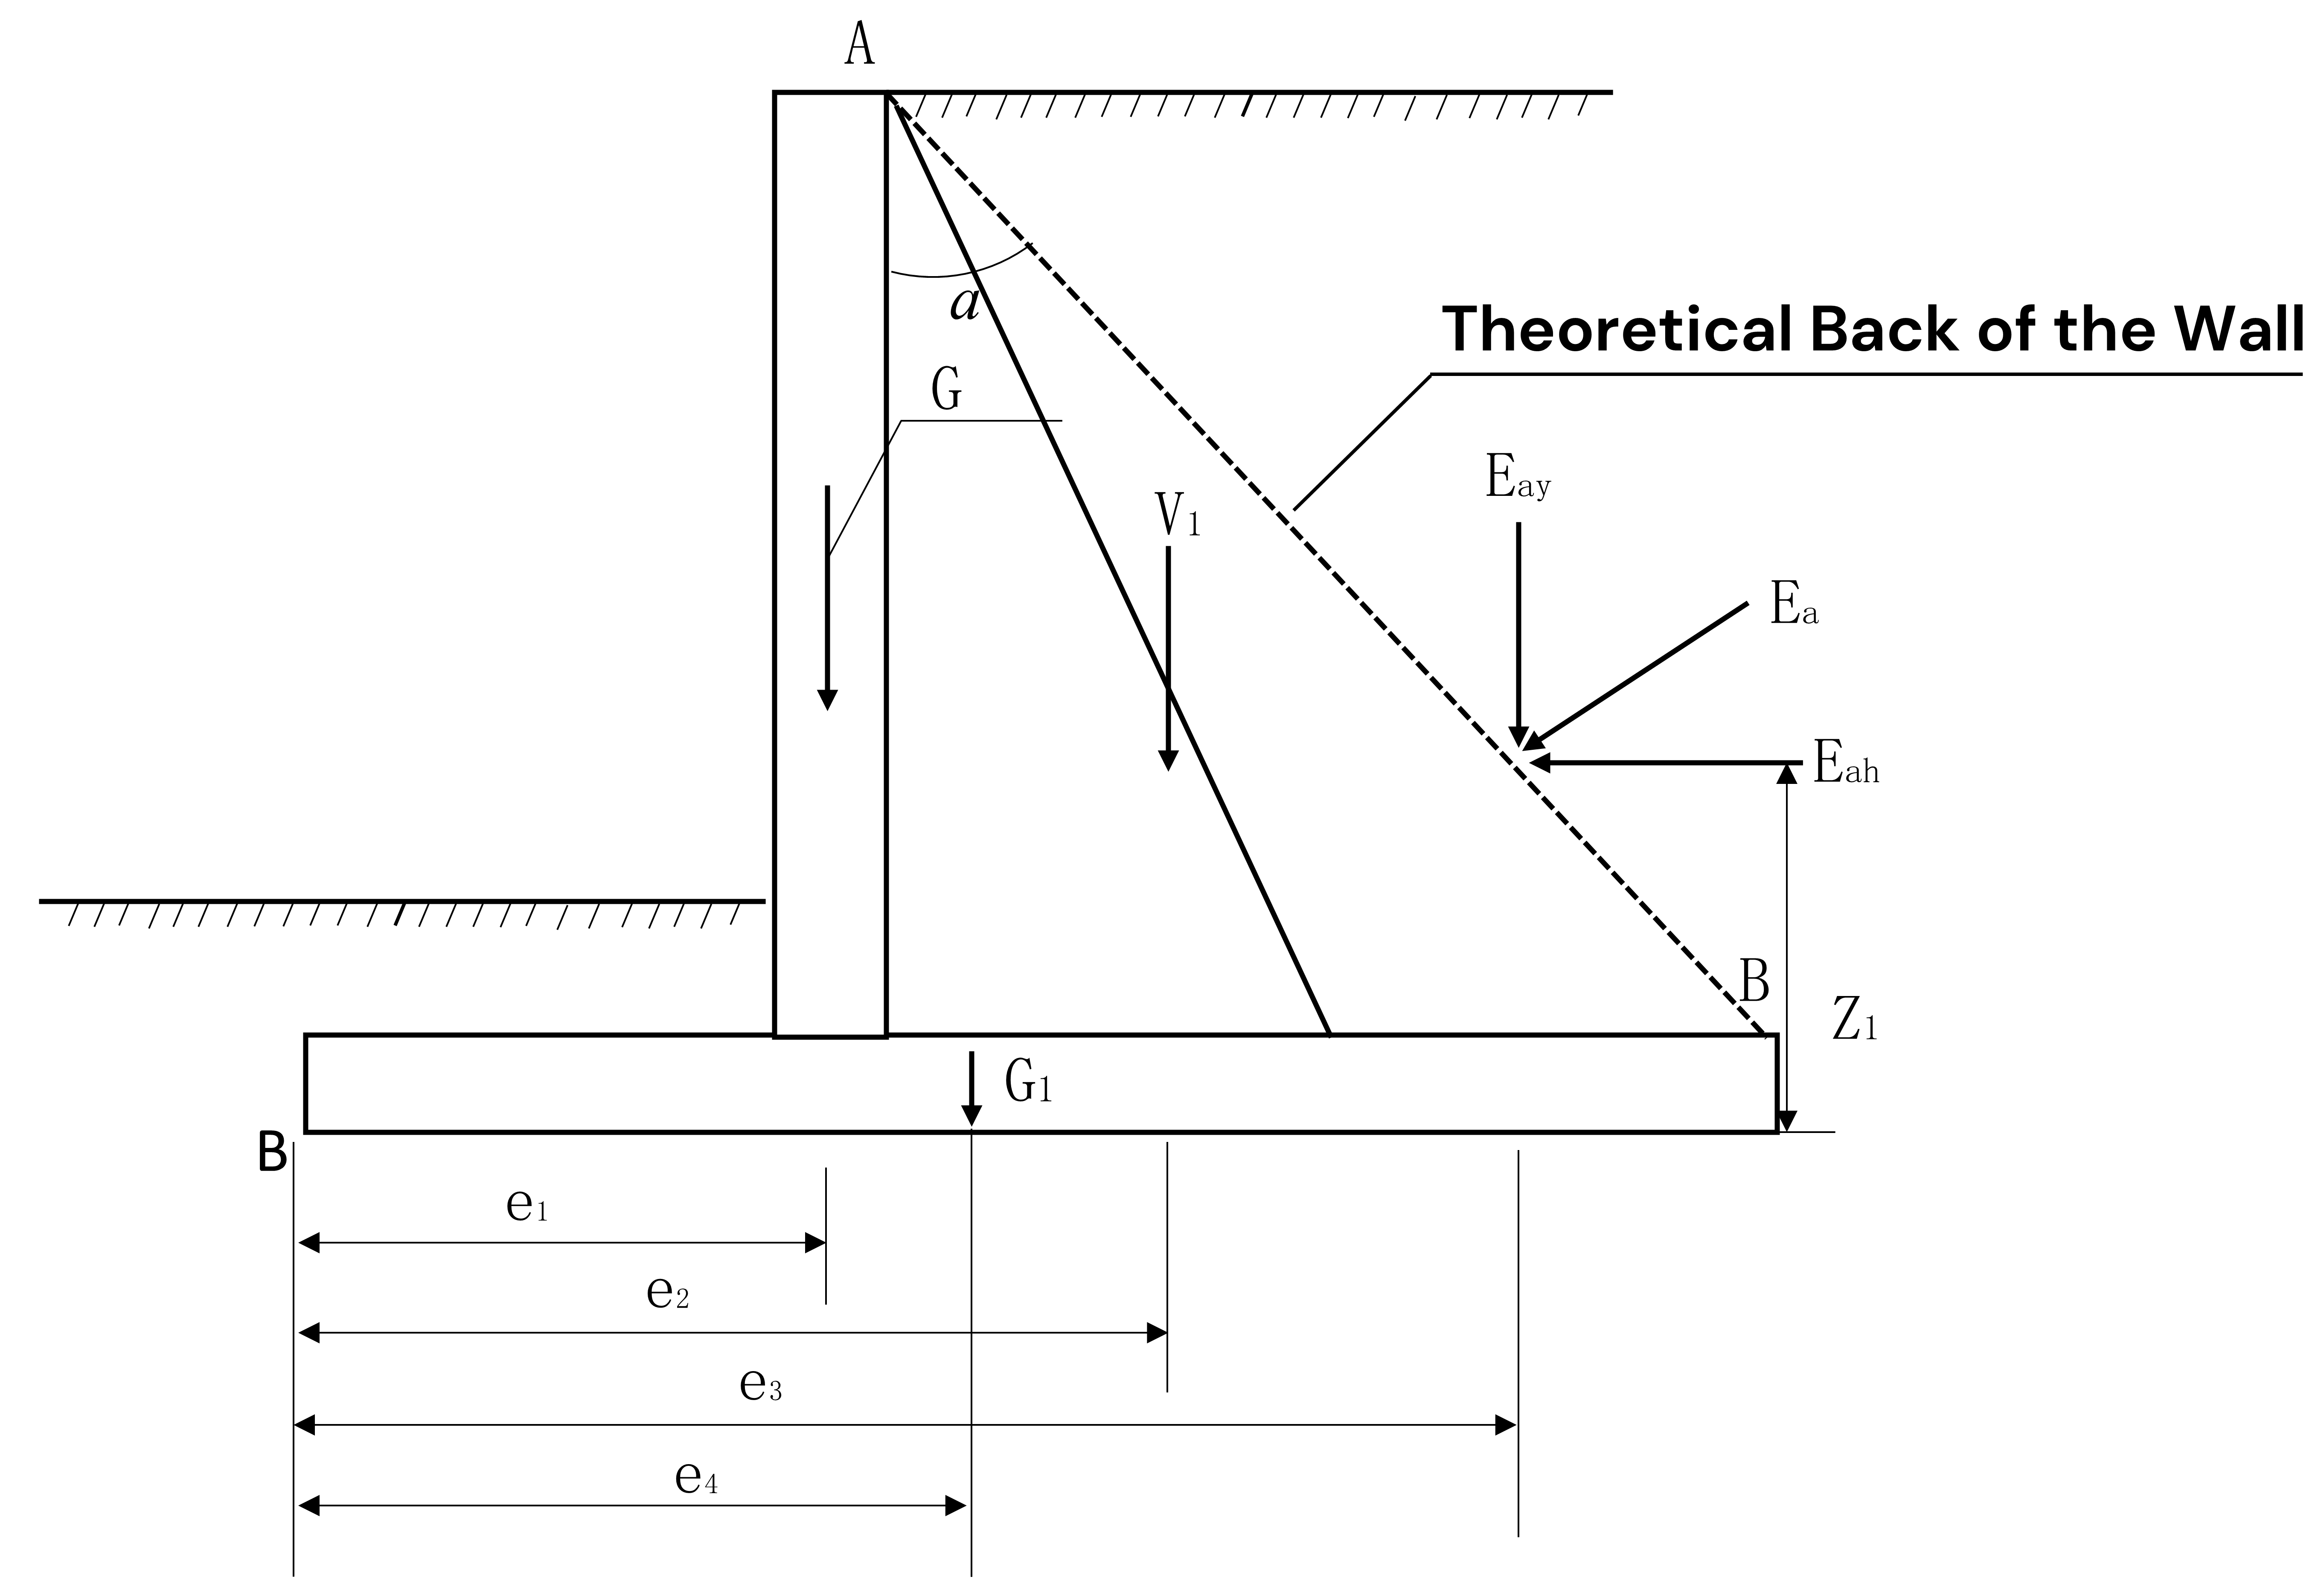
3. Design Methodology

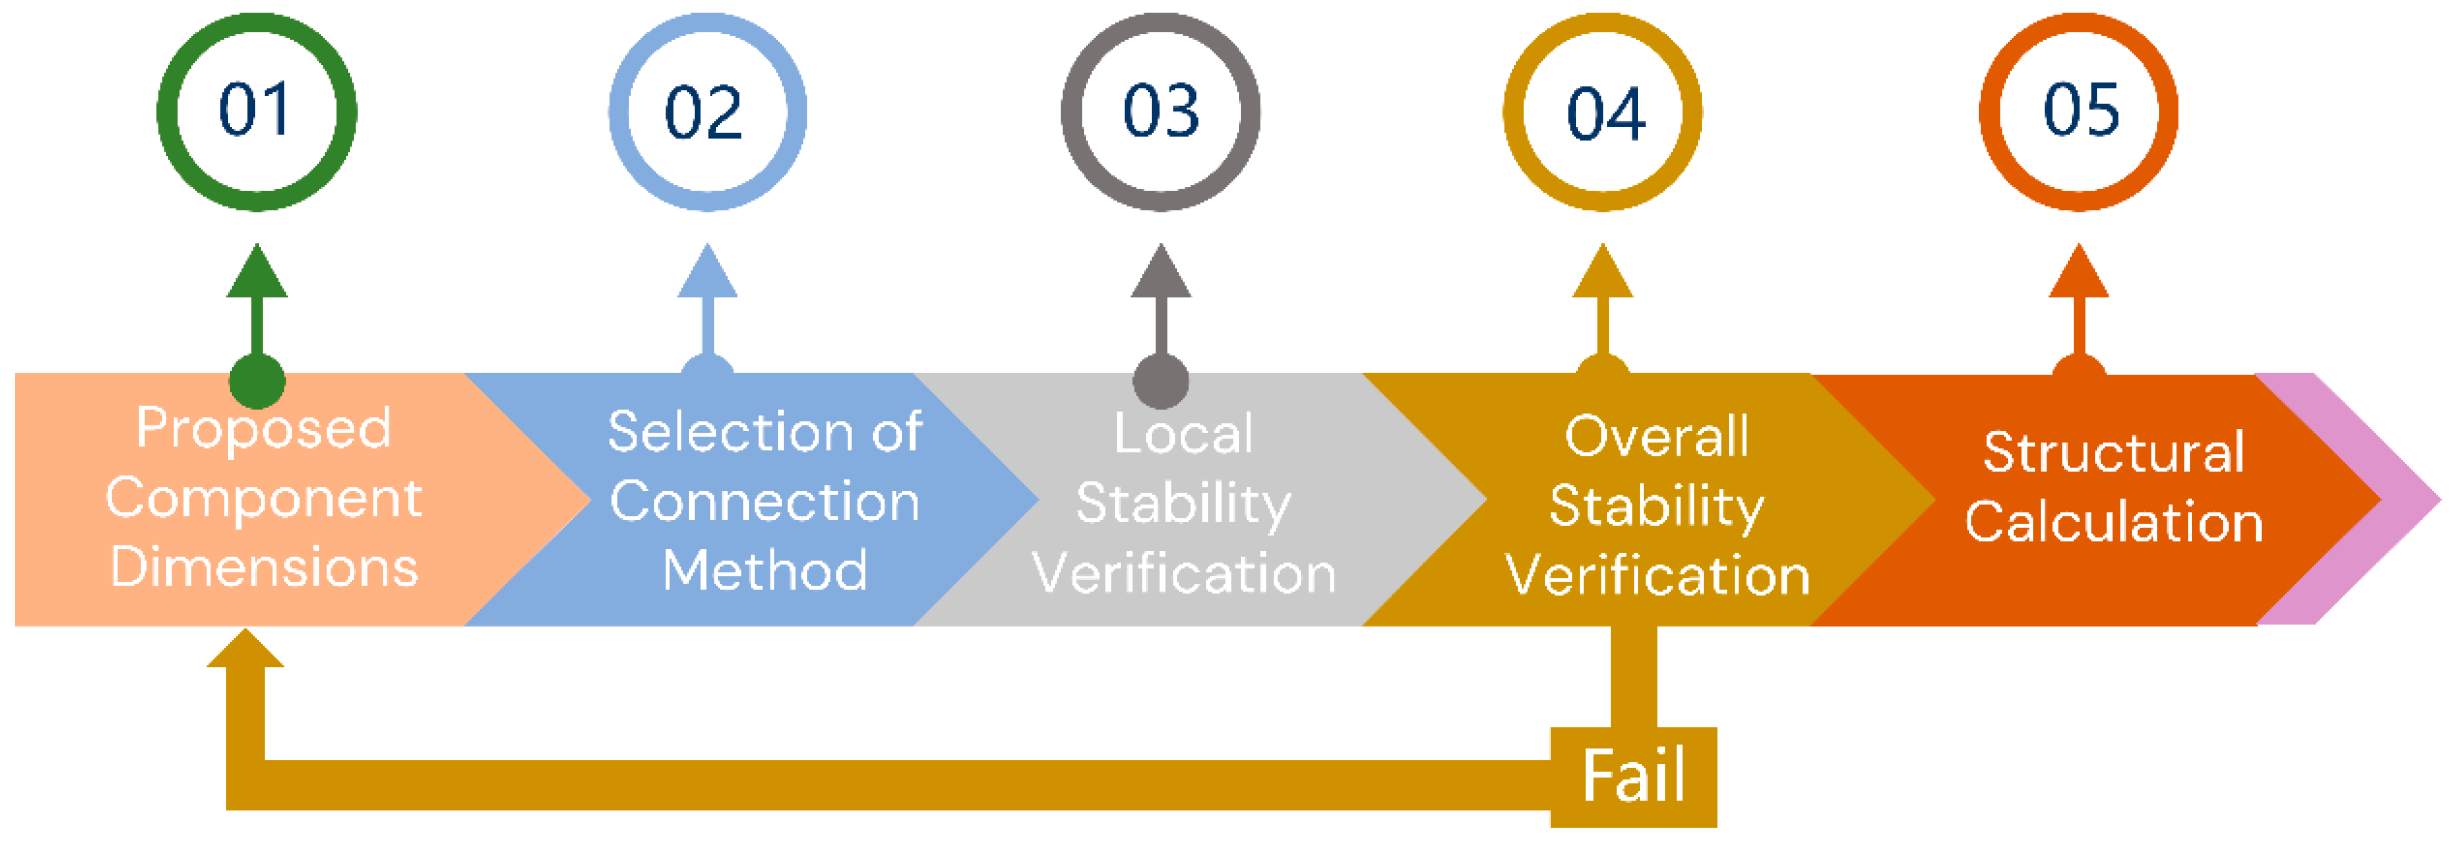
3.1. Analytical Procedure

The design methodology for prefabricated counterfort retaining walls extends beyond that of the conventional cast-in-place systems. While both types require global stability analysis and structural calculations, the segmented nature of prefabricated walls introduces a critical third requirement: the local stability verification of component interfaces.
This local analysis assesses the integrity of the connections between the precast components. The specific calculation methods are entirely dependent on the chosen selection of connection method—for example, evaluating a grouted coupler differs fundamentally from analyzing a bolted bracket. Consequently, each connection must be analyzed in accordance with the relevant technical literature and established engineering codes.
Once the local stability of all the connections is confirmed, the entire prefabricated assembly can be conceptually treated as a single, monolithic entity. At this point, the Overall Stability Verification and the final structural calculation can proceed, employing the same established methods used for an equivalent cast-in-place wall. This hierarchical approach—ensuring local integrity before analyzing the global system—is fundamental to the design. The complete workflow is summarized in the flowchart in Figure 5.

3.2. Sliding Stability Verification

For a standard cast-in-place counterfort wall, stability calculations are straightforward. Because the cross-section is uniform along its length, a single 1 m segment is usually analyzed as a representative of the entire structure. This same unit section approach can be applied directly to the monolithic prefabricated design, as it shares the same uniform geometry.
The modular design, however, presents a challenge to this simplified approach. Its primary components—the uprights and the infill panels—have different widths, meaning a single representative cross-section cannot be defined. Instead, the stability of the entire wall must be analyzed as a whole. This requires calculating the soil pressures and self-weights for the uprights and panels separately, since the virtual wall back they form is not a single, continuous plane.
To address this complexity, we modified the conventional formula for sliding resistance. The result is a new governing equation for sliding stability, shown in Equation (1), capable of handling both the monolithic and modular prefabricated designs. To ensure a conservative design for the most unfavorable conditions, passive earth pressure in front of the wall was intentionally excluded from this calculation.
K s = V μ H = [ ( G + E a y + V 1 ) l + ( G + E a y + V 1 ) l + G 1 ( l + l ) ] μ E a h l + E a h l 1 . 3
E a h —horizontal earth pressure behind uprights (kN); the value is 0 when uprights are absent.
E a h —horizontal earth pressure behind vertical slabs (kN).
E a y —vertical earth pressure behind uprights (kN); the value is 0 when uprights are absent.
E a y —vertical earth pressure behind vertical slabs (kN).
V 1 —self-weight of backfill behind uprights (kN); the value is 0 when uprights are absent.
V 1 —self-weight of backfill behind vertical slabs (kN).
G —self-weight of uprights (kN); the value is 0 when uprights are absent.
G —self-weight of vertical slabs (kN).
G 1 —self-weight of base slab (kN).
l —longitudinal length of uprights (m); the value is 0 when uprights are absent.
l —longitudinal length of vertical slabs (m).

3.3. Overturning Stability Verification

The analytical approach for overturning stability follows the same logic as that for sliding. The monolithic design is therefore assessed using a representative unit section, while the modular design requires the analysis of the entire structure (Figure 6).
To accommodate this distinction, we developed a corresponding formula for overturning resistance, presented as Equation (2). Following the same conservative approach as before, passive earth pressure in front of the wall was again intentionally omitted from the calculation.
K t = M b M b = [ ( G e 1 + V 1 e 2 + E a y e 3 ) l + ( G e 1 + V 1 e 2 + E a y e 3 ) l + G 1 e 4 ( l + l ) ] μ E a h l Z 1 + E a h l Z 1 1 . 5
e 1 , e 1 —moment arms of self-weight of uprights and vertical slabs about point B (kN·m); the value is 0 when uprights are absent.
e 2 , e 2 —moment arms of self-weight of backfill behind uprights and vertical slabs about point B (kN·m); the value is 0 when uprights are absent.
e 3 , e 3 —moment arms of vertical earth pressure behind uprights and vertical slabs about point B (kN·m); the value is 0 when uprights are absent.
e 4 —moment arm of self-weight of base slab about point B (kN·m).
Z 1 —moment arm of horizontal earth pressure behind uprights about point B (kN·m); the value is 0 when uprights are absent.
Z 1 —moment arm of horizontal earth pressure behind vertical slabs about point B (kN·m).

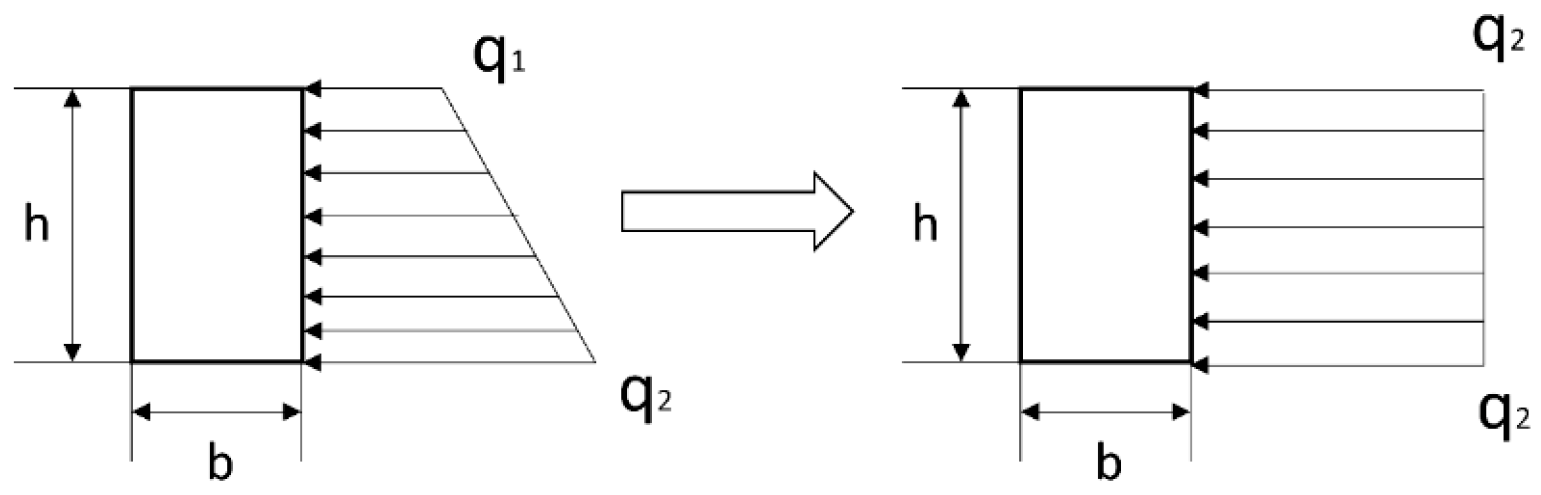
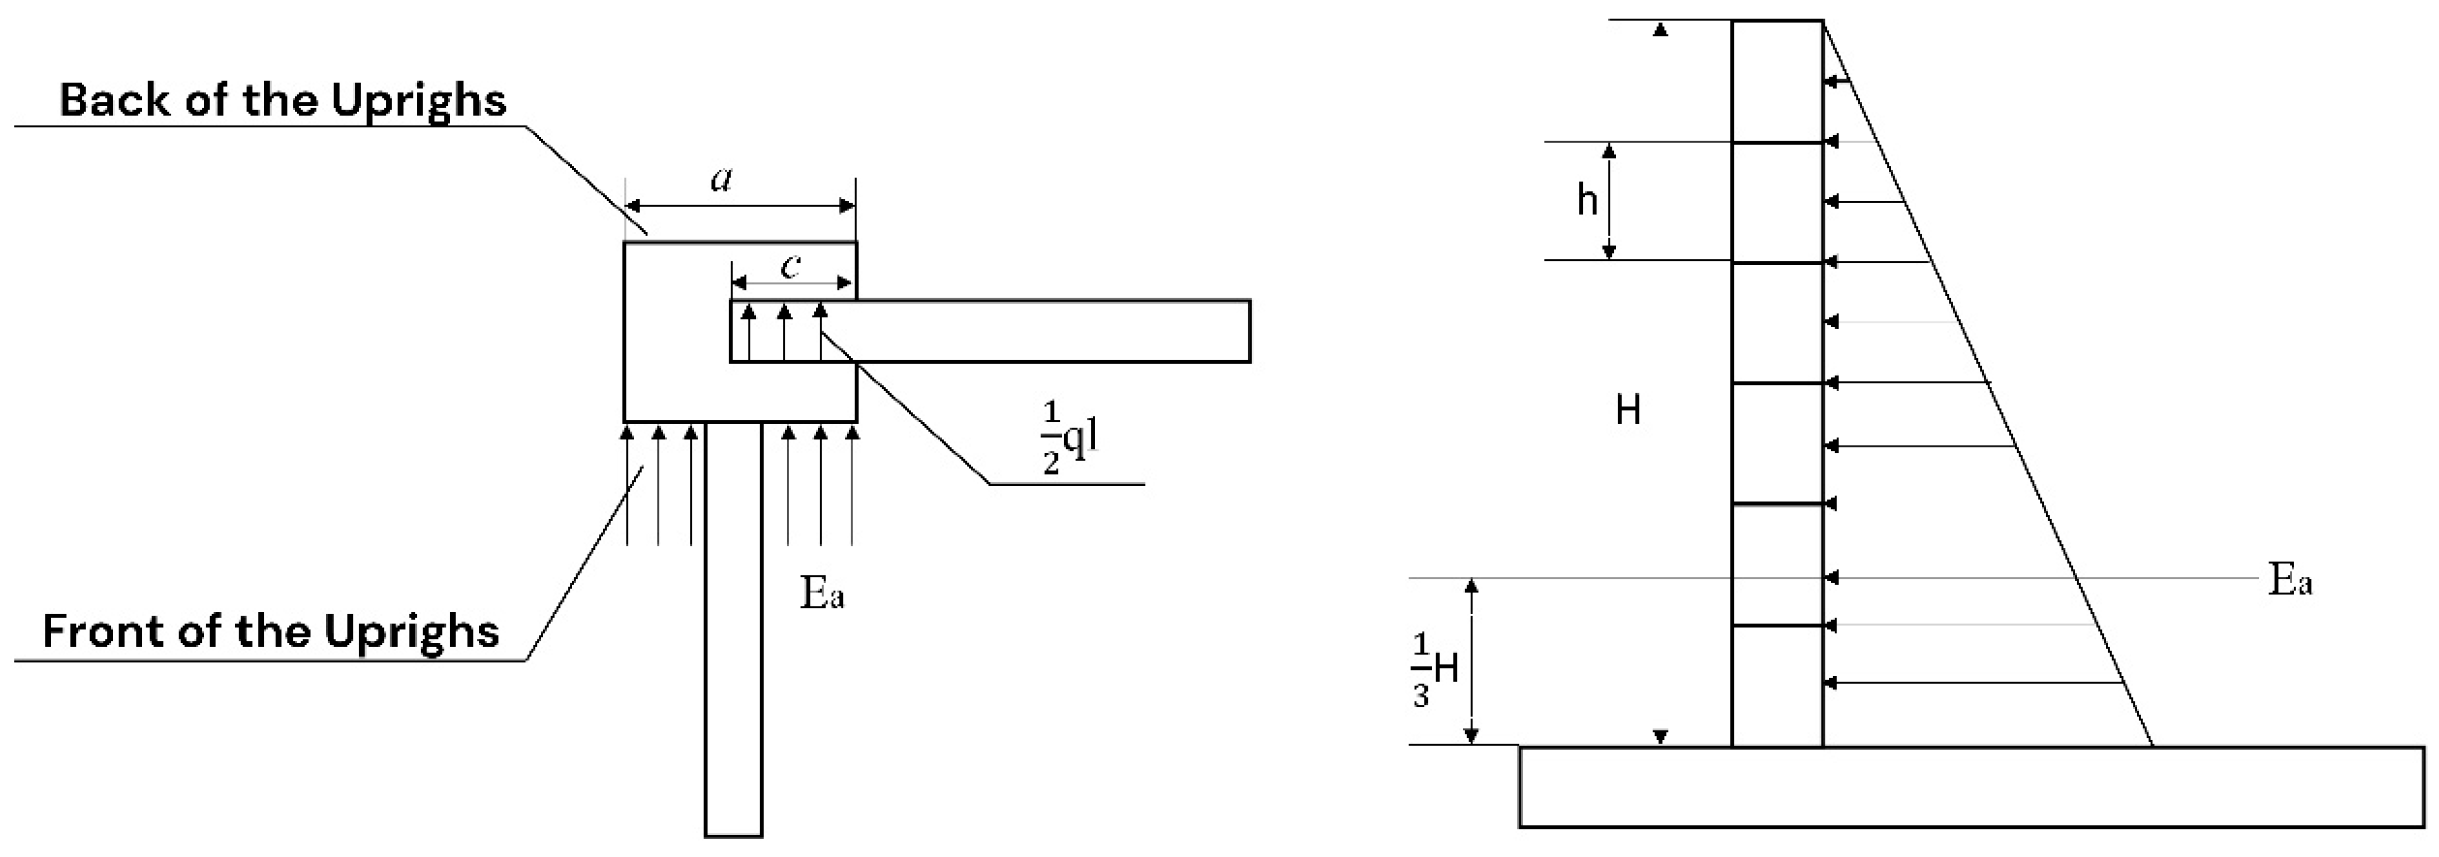
3.4. Foundation and Structural Analysis

The analysis of the foundation bearing pressure is consistent for both the designs. Since the base slabs for both the monolithic and modular walls are simple rectangular sections, the foundation stress can be checked using the standard unit section method, identical to that for a cast-in-place wall.
For the structural calculation of the monolithic wall, assembly is treated as a single, integrated process equivalent to a cast-in-place system. This assumption is valid because local stability verification (Section 2.1) has already confirmed the structural integrity of the connections.
The modular wall, in contrast, requires a component-based approach. While its base slab and counterforts can be analyzed in the same manner as their monolithic counterparts, the uprights and the infill panels are distinct structural elements and must be calculated separately.
(1)
Internal Force Calculation for the Vertical Slabs
The vertical face of the modular wall is constructed from stacked vertical slabs. For the purpose of structural analysis, each slab is modeled as a simply supported beam spanning between the uprights, as illustrated in Figure 7. This model accounts for the trapezoidal earth pressure load acting on each slab.
① To achieve a simplified yet conservative calculation, analysis focuses on the most critical internal force. The governing shear force is therefore taken as the maximum value, which occurs at the beam supports. This value is calculated using Equation (3).
V = 1 2 q 2 l
V —shear force on the unit beam (kN);
q 2 —external load at the bottom of unit beam (kN/m);
l —the longitudinal length of the unit beam (m).
② Similarly, the governing bending moment is taken as the maximum value, which occurs at the mid-span of the beam. Its calculation is given by Equation (4).
M = q 2 l 2 8
M —bending moment of unit beam (kN·m).
(2)
Internal Force Calculation for the Uprights
The structural analysis of the uprights must account for two primary loads: (i) direct earth pressure acting on the rear face of the uprights, and (ii) concentrated shear reactions transmitted from the vertical slabs they support.
Although the magnitude of these slab reactions varies with depth, a simplified and conservative approach is adopted for the design calculation. A single, maximum shear reaction value is used to represent the load from the slabs. As depicted in the analytical model (Figure 8), the forces acting on the front and rear faces of the embedded portion of the uprights are analyzed separately. The governing calculations are detailed in Equations (5)–(8).
① Front of the Uprights
V = E a · a
M = E a a 3 H
② Back of the Uprights
V = E a · a + q max l 2 · c
M = E a · a · H 3 + q max l 2 · c · H 2
c —length of unit beam insertion into upright groove (m);
a —longitudinal length of upright (m).

4. Experimental Methodology

4.1. Scaled-Down Model Design

Conventional counterfort retaining walls, whether monolithic or prefabricated, are constructed from reinforced concrete. However, fabricating and testing small-scale concrete models presents significant practical challenges. Therefore, PVC was selected as the model material for this study. This choice was based on PVC’s high strength, ease of fabrication, and its established ability to simulate the essential deformational characteristics of concrete in scaled-down structural applications.
This study investigated two distinct prefabricated counterfort retaining wall designs: a monolithic type and a modular type. The full-scale prototype for both the designs stands 6.0 m high, with the vertical slabs, the base slabs, the uprights, and the counterforts having thicknesses of 0.5 m, 0.5 m, 1.5 m, and 0.4 m, respectively (Figure 9a). The overall stability of these prototype dimensions was first verified analytically according to standard design equations.
The selection of an appropriate geometric similarity constant, c l , involves a critical trade-off between ensuring model fidelity (which is compromised if the model is too small) and managing the practical constraints of fabrication, cost, and laboratory space (which become challenging if the model is too large). Considering the available laboratory facilities, instrumentation, and PVC material properties, a geometric similarity constant of c l = 20 was adopted. Consequently, all linear dimensions of the prototypes were scaled down by a factor of 20.
A key advantage of PVC is that its elastic modulus closely approximates that of C30 concrete, allowing for it to accurately model the prototype’s deformational behavior. With the geometric similarity constant established c l = 20, the similarity constant for the material’s elastic modulus c E was selected as the primary controlling parameter for the model’s mechanical properties. Given that the elastic modulus of the prototype C30 concrete is E P = 3 × 10 4 MPa and that of the model PVC material is E m = 3 × 10 3 MPa, the resulting similarity constant for elastic modulus is c E = E P / E m = 10. The similarity constants for all other primary physical factors were derived from these fundamental ratios and are summarized in Table 1 and Table 2.
In the scaled-down model test of the counterfort retaining wall, the thicknesses of the vertical slab and the base slab were scaled according to the principle of equivalent bending stiffness. This approach adheres to the criterion E P I P = E m I m , where E P and E m are the elastic moduli of the prototype and model materials, respectively, and I P and I m represent their corresponding moments of inertia. The scaling relation for the bending stiffness of the wall components, c E I , is therefore derived as follows:
c E I = c E × c I
c σ = c E
c σ = c X ¯
Combining these relations leads to this deduction:
c E = c X ¯ = c γ × c l
c I = c l 4
c E I = c E × c I = c γ × c l × c l 4 = c γ × c l 5
c γ = 1
Combining these relations leads to this deduction:
c E I = c l 5
where c E I and c I are the similarity constants for bending stiffness and moment of inertia, respectively.
The resulting final dimensions for the scaled-down monolithic and modular models are detailed in Figure 9b and c, respectively.

4.2. Geotechnical Properties of the Backfill Material

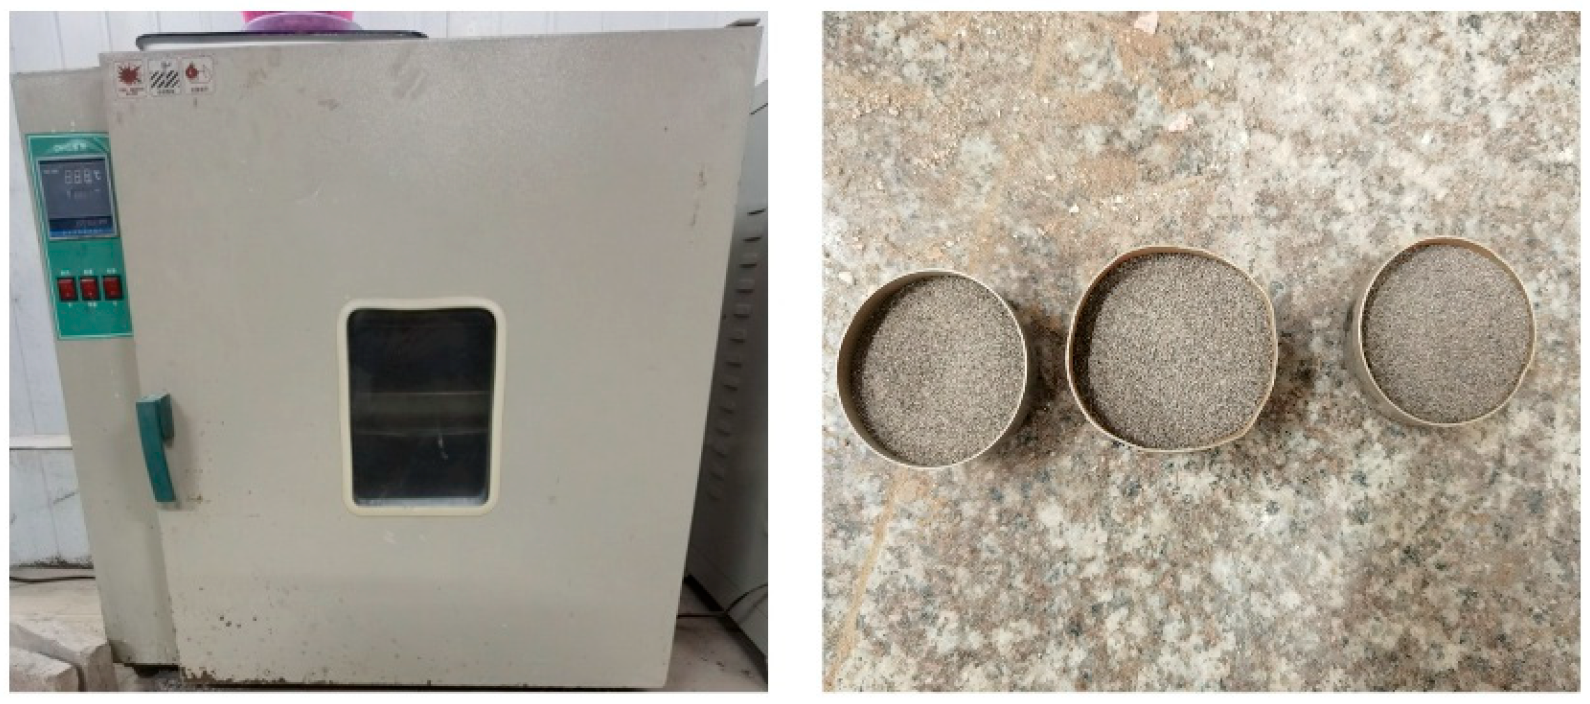
4.2.1. Moisture Content Determination

Quartz sand was selected as the backfill material for the model tests. Its natural moisture content was determined using the standard oven-drying method. To ensure the accuracy of the results, determination was performed in triplicate. The average of these three parallel measurements was then adopted as the definitive natural moisture content for subsequent calculations. The masses of the sand specimens before and after oven-drying are presented in Table 3. The natural moisture content, ω , was calculated using the following equation:
ω = ( m 0 m d 1 ) × 100
where ω is the natural moisture content, m 0 is the mass of the moist sand specimen, and m d is the mass of the oven-dried sand specimen (Figure 10).

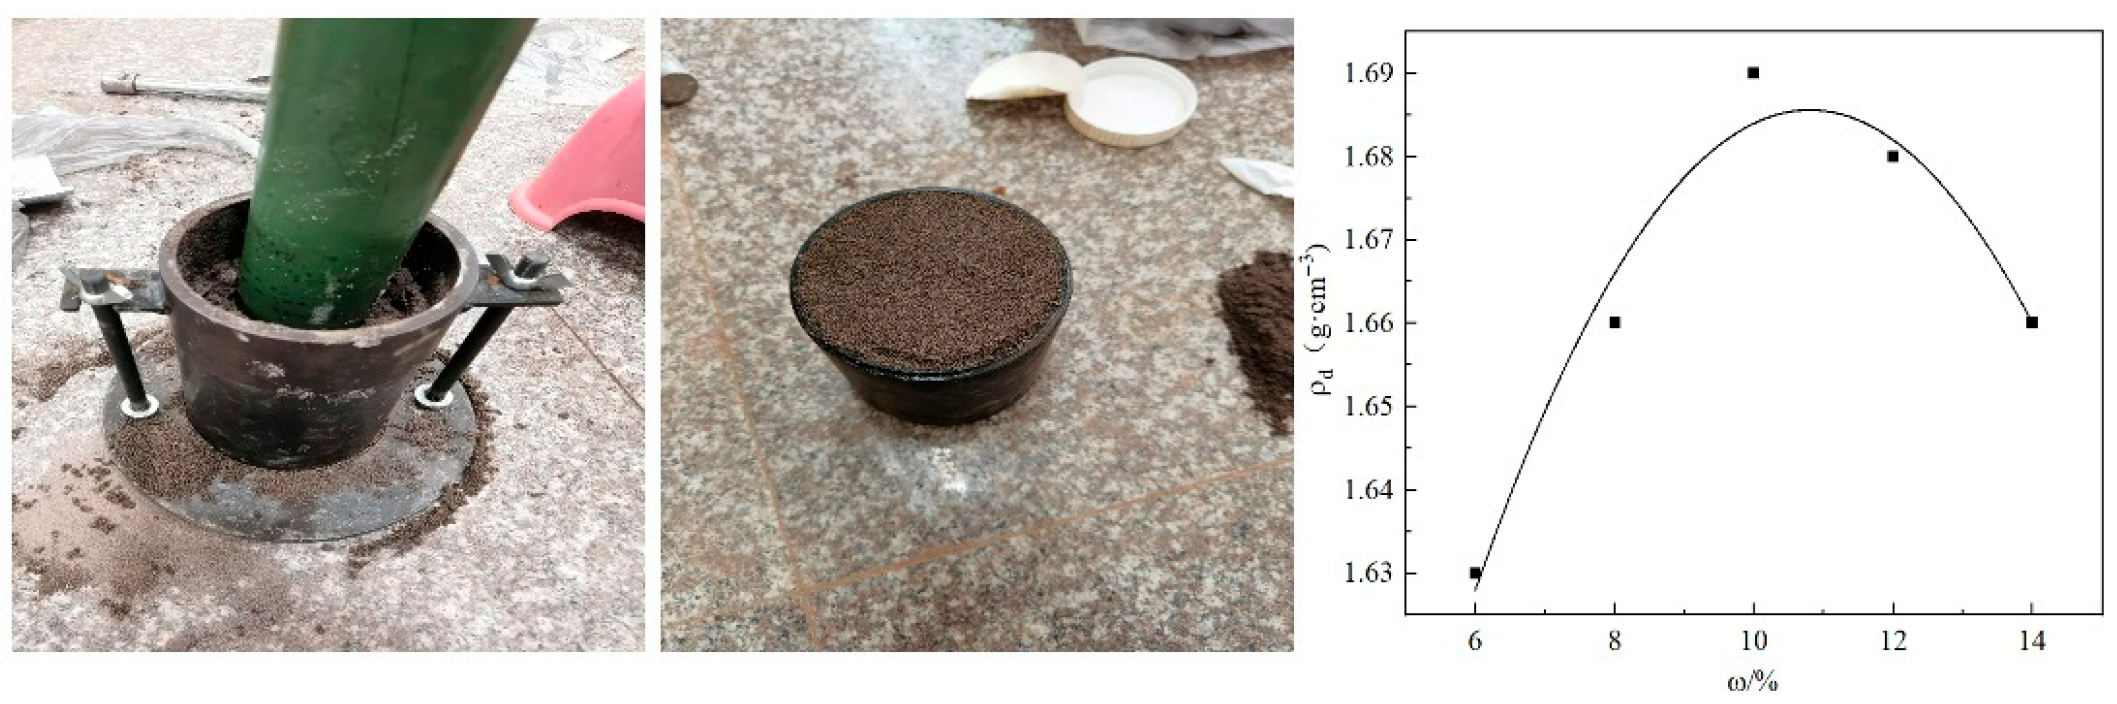
4.2.2. Standard Proctor Compaction Test

A standard Proctor compaction test was conducted to determine the optimum moisture content (OMC) and maximum dry density (MDD) of quartz sand. The procedure involved preparing five specimens at varying target moisture contents, with the required amount of water for each calculated based on the sand’s natural moisture content. Each specimen was subsequently compacted in layers within a standard mold.
Following compaction, the bulk density of each specimen was measured. A representative sample was then extracted from the compacted material to determine its actual moisture content, which enabled the calculation of the corresponding dry density. Finally, a compaction curve was generated by plotting the dry density (ordinate) against the moisture content (abscissa). The peak of this curve identified the material’s maximum dry density (MDD) and its corresponding optimum moisture content (OMC).
Based on the compaction test results, a curve of dry density versus moisture content was plotted, and subsequently fitted with a quadratic function, as shown in Figure 11. From the vertex of the resulting parabola, the optimum moisture content (OMC, ω o ) was determined to be 10.8%, and the corresponding maximum dry density (MDD, ρ d m a x ) was 1.686 g/cm3.
In engineering practice, soil exhibits distinct properties on the wet and dry sides of the optimum. Consequently, the target moisture content for compaction is typically specified within a range of ω o ± 2%. Accordingly, a moisture content ( ω ) of 10.0% was selected for the placement of the quartz sand backfill in the model tests. This value was used to control the degree of compaction during the experiments. At this moisture content, the corresponding bulk density ( ρ ) of quartz sand was 1.86 g/cm3.

4.2.3. Direct Shear Test

To determine the shear strength parameters of quartz sand at the target moisture content ( ω = 10%), a series of consolidated undrained (CU) direct shear tests was conducted using a strain-controlled apparatus (Figure 12).
The cohesion (c) and the angle of internal friction ( φ ) were determined from the Mohr–Coulomb failure envelope, which was established by plotting peak shear strength against the corresponding normal stress for each test. Linear regression was applied to these data points to define the envelope. From this analysis, cohesion (c) was obtained from the intercept of the failure envelope on the shear stress axis, and the angle of internal friction ( φ ) was determined from the inclination of the envelope. The resulting values were c = 20.56 kPa and φ = 22.27°.

4.3. Simulation of Prefabricated Connections

In practice, the components of prefabricated retaining walls are joined using discrete point connections, such as bolts or reinforcing bars. These connections concentrate load transfer at specific locations rather than distributing it continuously along the joint. To replicate this fundamental principle of discrete connectivity in the scaled-down models, a specialized PVC adhesive was employed.
The adhesive was applied not as a continuous bead, but as a series of individual droplets using a syringe. Each adhesive droplet was intended to function as an analogue to a single bolt or rebar, thereby simulating the point-wise transfer of forces between the structural elements. A key procedural step was taken to maintain the integrity of these point connections; to prevent the adhesive from spreading under pressure and forming a continuous bond, the droplets were allowed to partially cure before the components were joined.
Schematic diagrams of the two resulting assembled structures, the monolithic and modular types, are shown in Figure 13.

4.4. Measurement and Loading System

The experimental program was designed to monitor four key performance aspects: earth pressure distribution, horizontal wall displacement, component strain, and the ultimate failure mode. To this end, an array of sensors was deployed. Earth pressures were measured using ten miniature earth pressure cells strategically installed on the monolithic wall model to capture the pressure profiles on the vertical slab, the base slab, and the counterfort. Horizontal displacements were monitored using high-precision dial gauges (0–10 mm range, 0.1 mm resolution) secured with magnetic bases; for the modular wall, gauges were applied to both the slabs and the uprights to capture any differential movement. To measure incremental strains, electrical resistance strain gauges were used. Specifically, four gauges were installed on both the vertical slabs and the uprights, arranged in a vertical array at 7.5 cm intervals from the base upwards, as the interaction between these components is the primary structural difference between the designs. The loading system depicted in Figure 14 comprises a hydraulic jack, a steel reaction beam, a pressure sensor (load cell), and a rigid loading plate. The reaction beam was securely bolted to the main test frame, and the hydraulic jack was positioned to exert an upward force against it. This action generated an equal and opposite downward reaction force, which was transmitted through the pressure sensor and the loading plate to apply a uniform surcharge to the backfill. The magnitude of the applied load was continuously monitored via the calibrated output from the pressure sensor.
The strain data was acquired and processed using a dynamic signal acquisition system. Each strain gauge was wired into the system to form a quarter-bridge circuit. Prior to the commencement of loading, all channels were balanced to establish a zero-strain baseline, effectively calibrating the initial state. Throughout the experiment, the system continuously sampled the electrical signals at a frequency sufficient to ensure the high-resolution capture of both the gradual strain evolution under increasing surcharge and any rapid, localized changes. The acquisition software then converted the raw voltage output from the bridge circuits into microstrain ( μ ε ) in real time.

4.5. Scope and Validation of the Experimental Program

The experimental program was designed for a direct comparison of the failure mechanisms and load transfer behaviors in the monolithic and modular wall designs. The logistical complexity inherent to large-scale physical modeling necessitated a focused strategy: executing a single, yet highly detailed and meticulously controlled, experiment for each configuration. This approach yielded a rich, internally consistent dataset from the extensive sensor array. Critically, the key phenomena observed in the physical tests were directly corroborated by the validated numerical simulations, confirming the robustness of the findings.

5. Results and Analysis
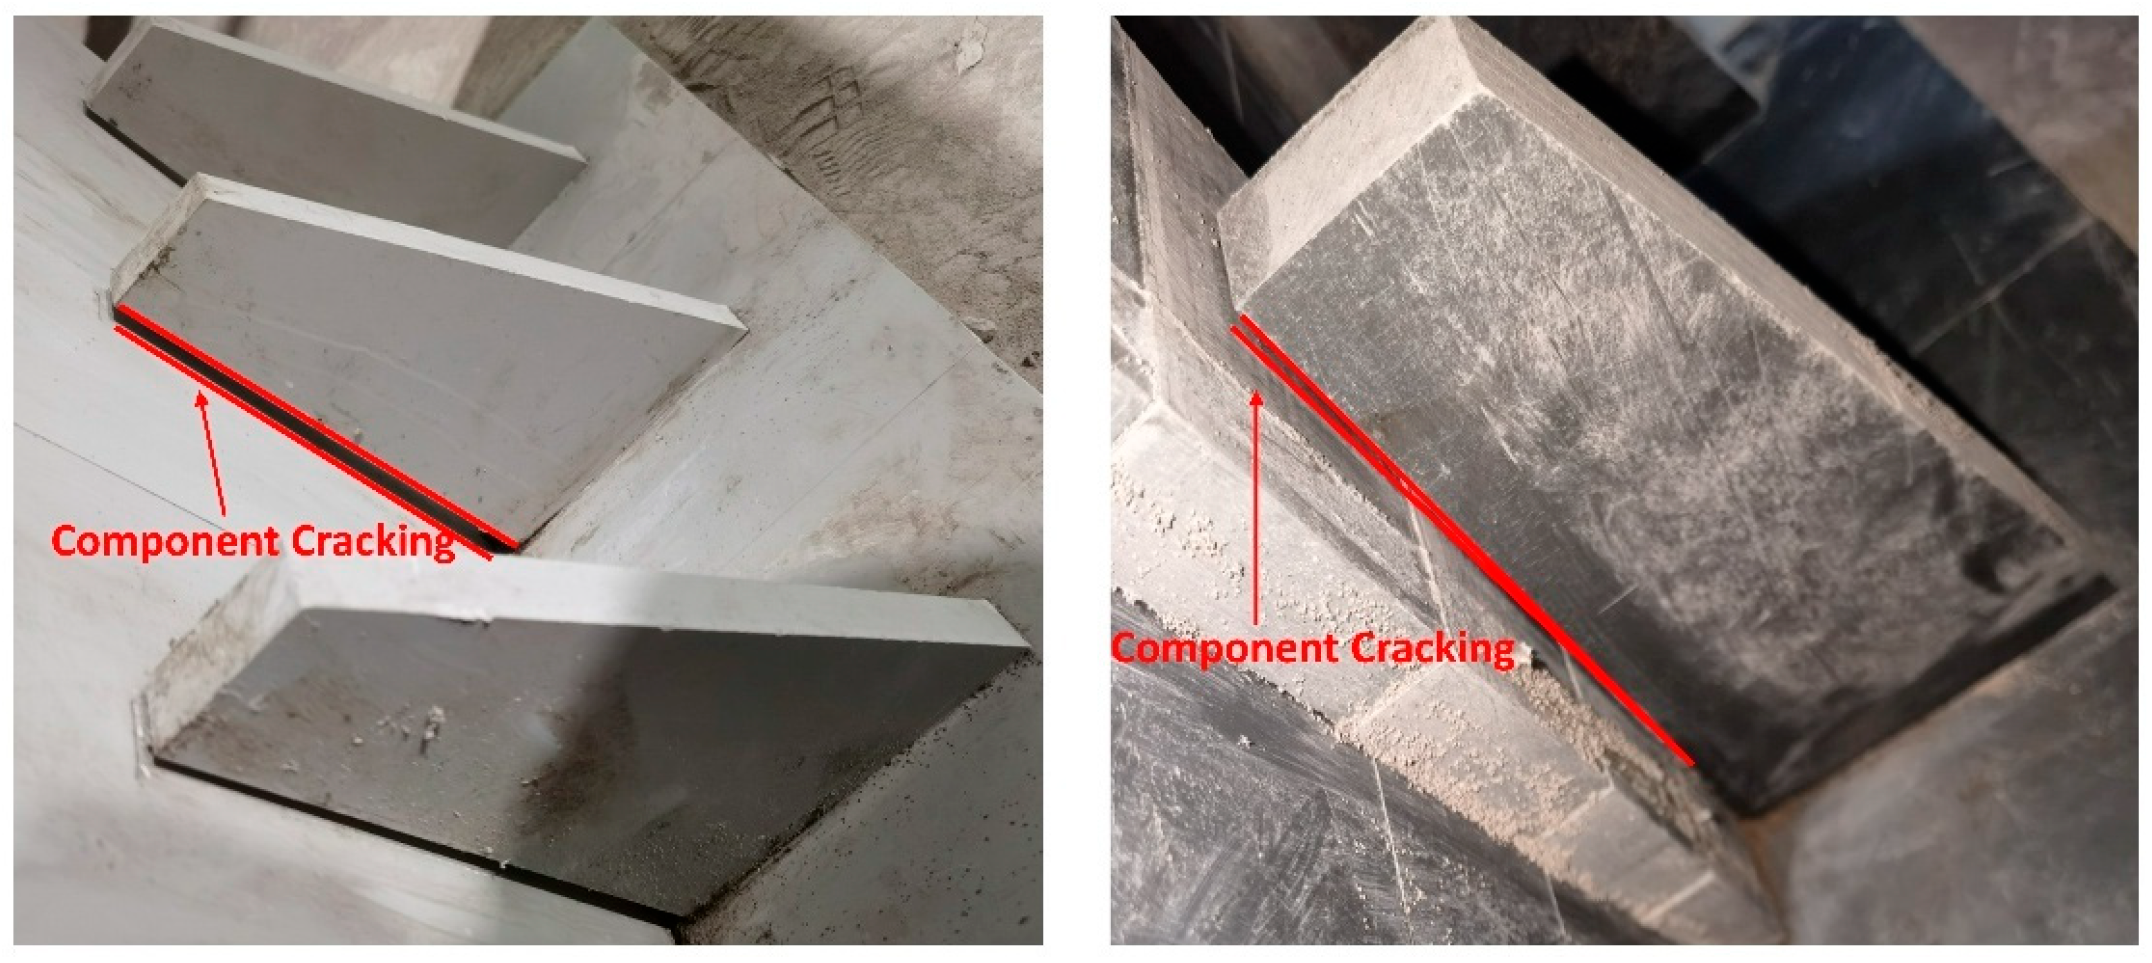
5.1. Failure Modes

To investigate the ultimate failure modes, the surcharge load was increased to 288.8 kPa. At this load, distinct failure mechanisms were observed for the monolithic and modular wall types, as shown in Figure 15.
The initial failure in both the models manifested as a progressive, top-down fracture at the junction between the primary vertical elements and the counterfort. This failure pattern is attributed to the fact that the upper portions of the vertical slab (in the monolithic design) and the uprights (in the modular design) act as cantilevers. Without any forward support, this is where earth pressure induces the highest bending moments, concentrating stress at the connection to the counterfort. As the lower sections of the wall are supported by retained soil, failure naturally initiated at the top and propagated downwards.
Following this initial event, the two designs exhibited divergent secondary failure behaviors. In the monolithic wall, the primary fracture between the counterfort and the vertical slab was followed by a secondary failure at the joint between the vertical slab and the base slab. This was observed as significant movement and loosening, indicating that the entire load from the slab was now being transferred to this single, critical connection. In contrast, the failure of the modular wall was localized, occurring predominantly at the joint between the central upright and the counterfort, with much less stress on the adjacent uprights. Crucially, the connections between the individual uprights and their joints with the base slab remained fully intact, with no observable cracking or movement.

5.2. Analysis of Internal Forces

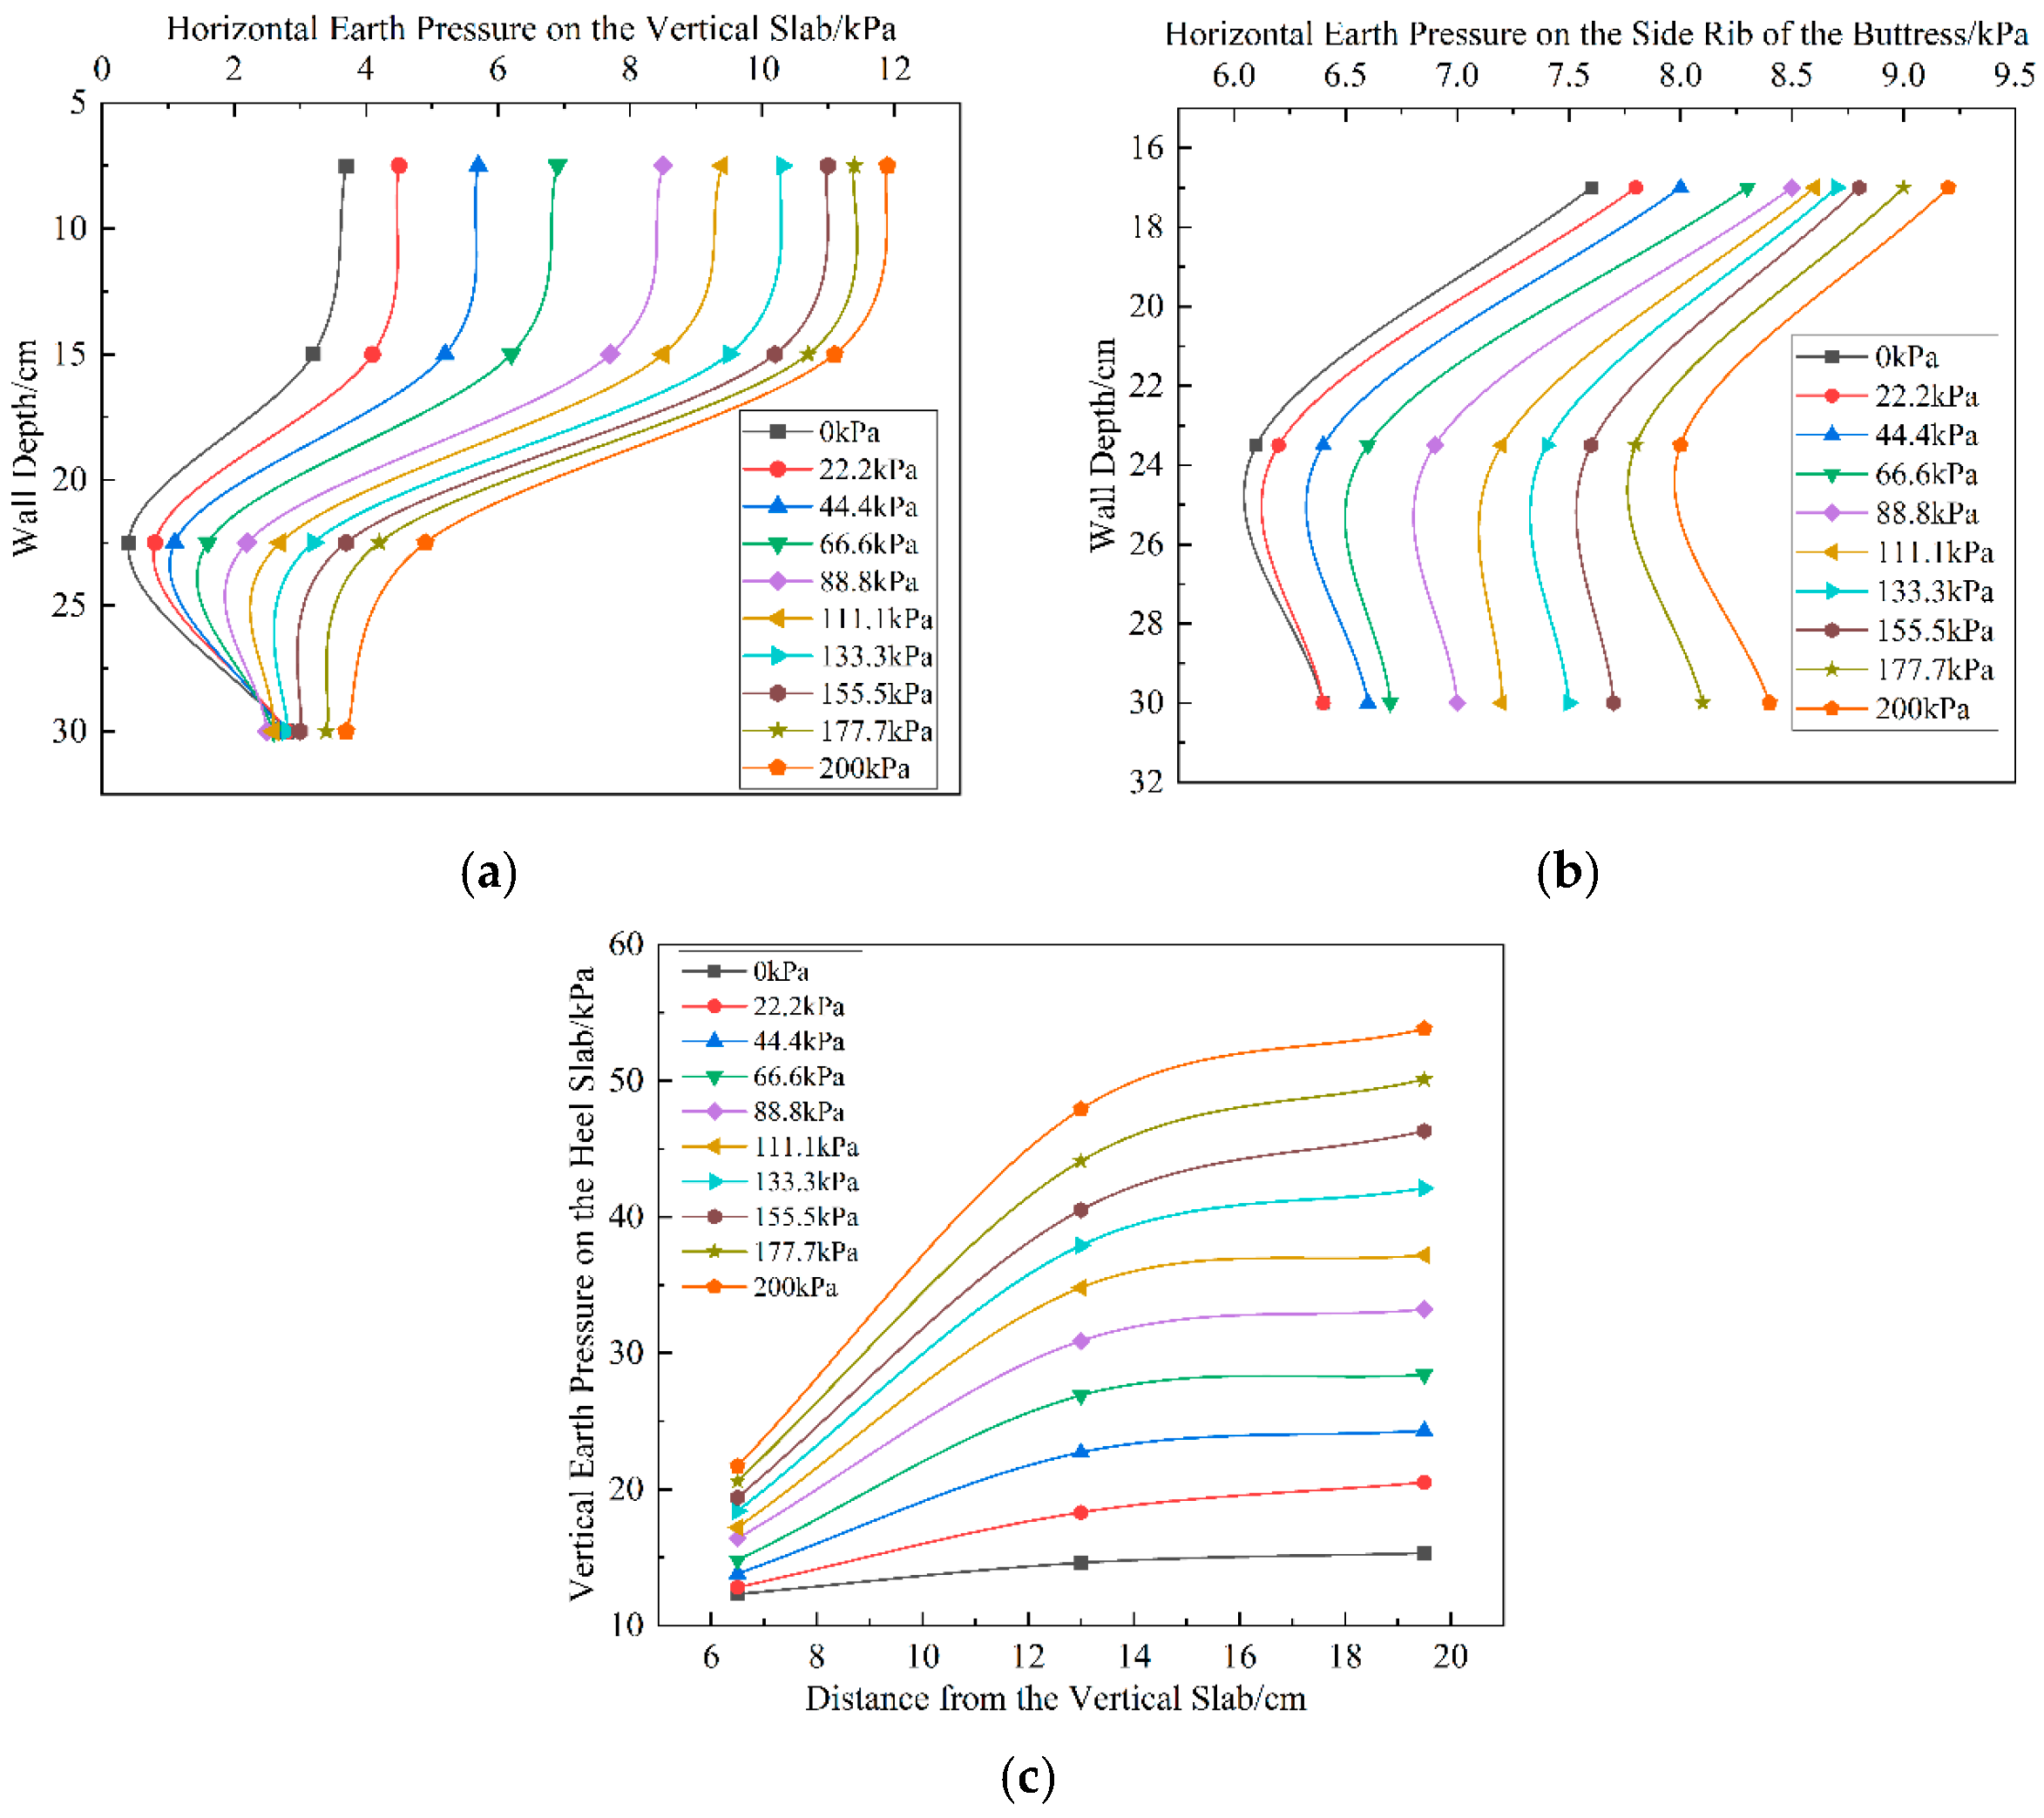
5.2.1. Earth Pressure Analysis

The distribution of earth pressure under various load conditions provides a quantitative explanation for the observed failure mechanisms.
Figure 16a illustrates horizontal earth pressure distribution on the vertical slab as a function of depth. The pressure profile is distinctly non-linear, peaking near the top of the wall (at a depth of 7.5 cm) before decreasing. This pressure concentration is a direct result of the upper portion of the slab acting as an unsupported cantilever. The high bending stress this induces at the slab–counterfort connection directly corroborates the failure mode identified in Section 4.1, where fractures initiated at this very location. This finding suggests a critical design consideration: the connection between the counterfort and the vertical elements must be substantially reinforced.
Horizontal earth pressure acting on the sides of the counterfort, shown in Figure 16b, follows a different pattern and is of a much lower magnitude. Because the counterfort is laterally confined by soil on both sides, it does not develop the high bending stresses seen in the main slab. This bilateral support explains the absence of any lateral cracking or distress at the counterfort joints during the failure test.
Figure 16c shows the vertical pressure distribution on the base slab. Here, the pressure increases with distance from the wall stem, reaching its maximum at the heel’s outer edge. Notably, the magnitude of this vertical pressure is significantly higher than horizontal earth pressure on the vertical slab, indicating that the base slab is subjected to a greater overall load. However, unlike the cantilevered top of the wall, the base slab is continuously supported by the foundation subgrade. This subgrade reaction effectively counteracts the applied load, reducing net stress on the counterfort-to-base-slab connection. This explains why this joint remained intact even at ultimate failure. The primary design implication here is not for the joint, but for the base slab itself, which must possess adequate reinforcement to resist these high vertical pressures.

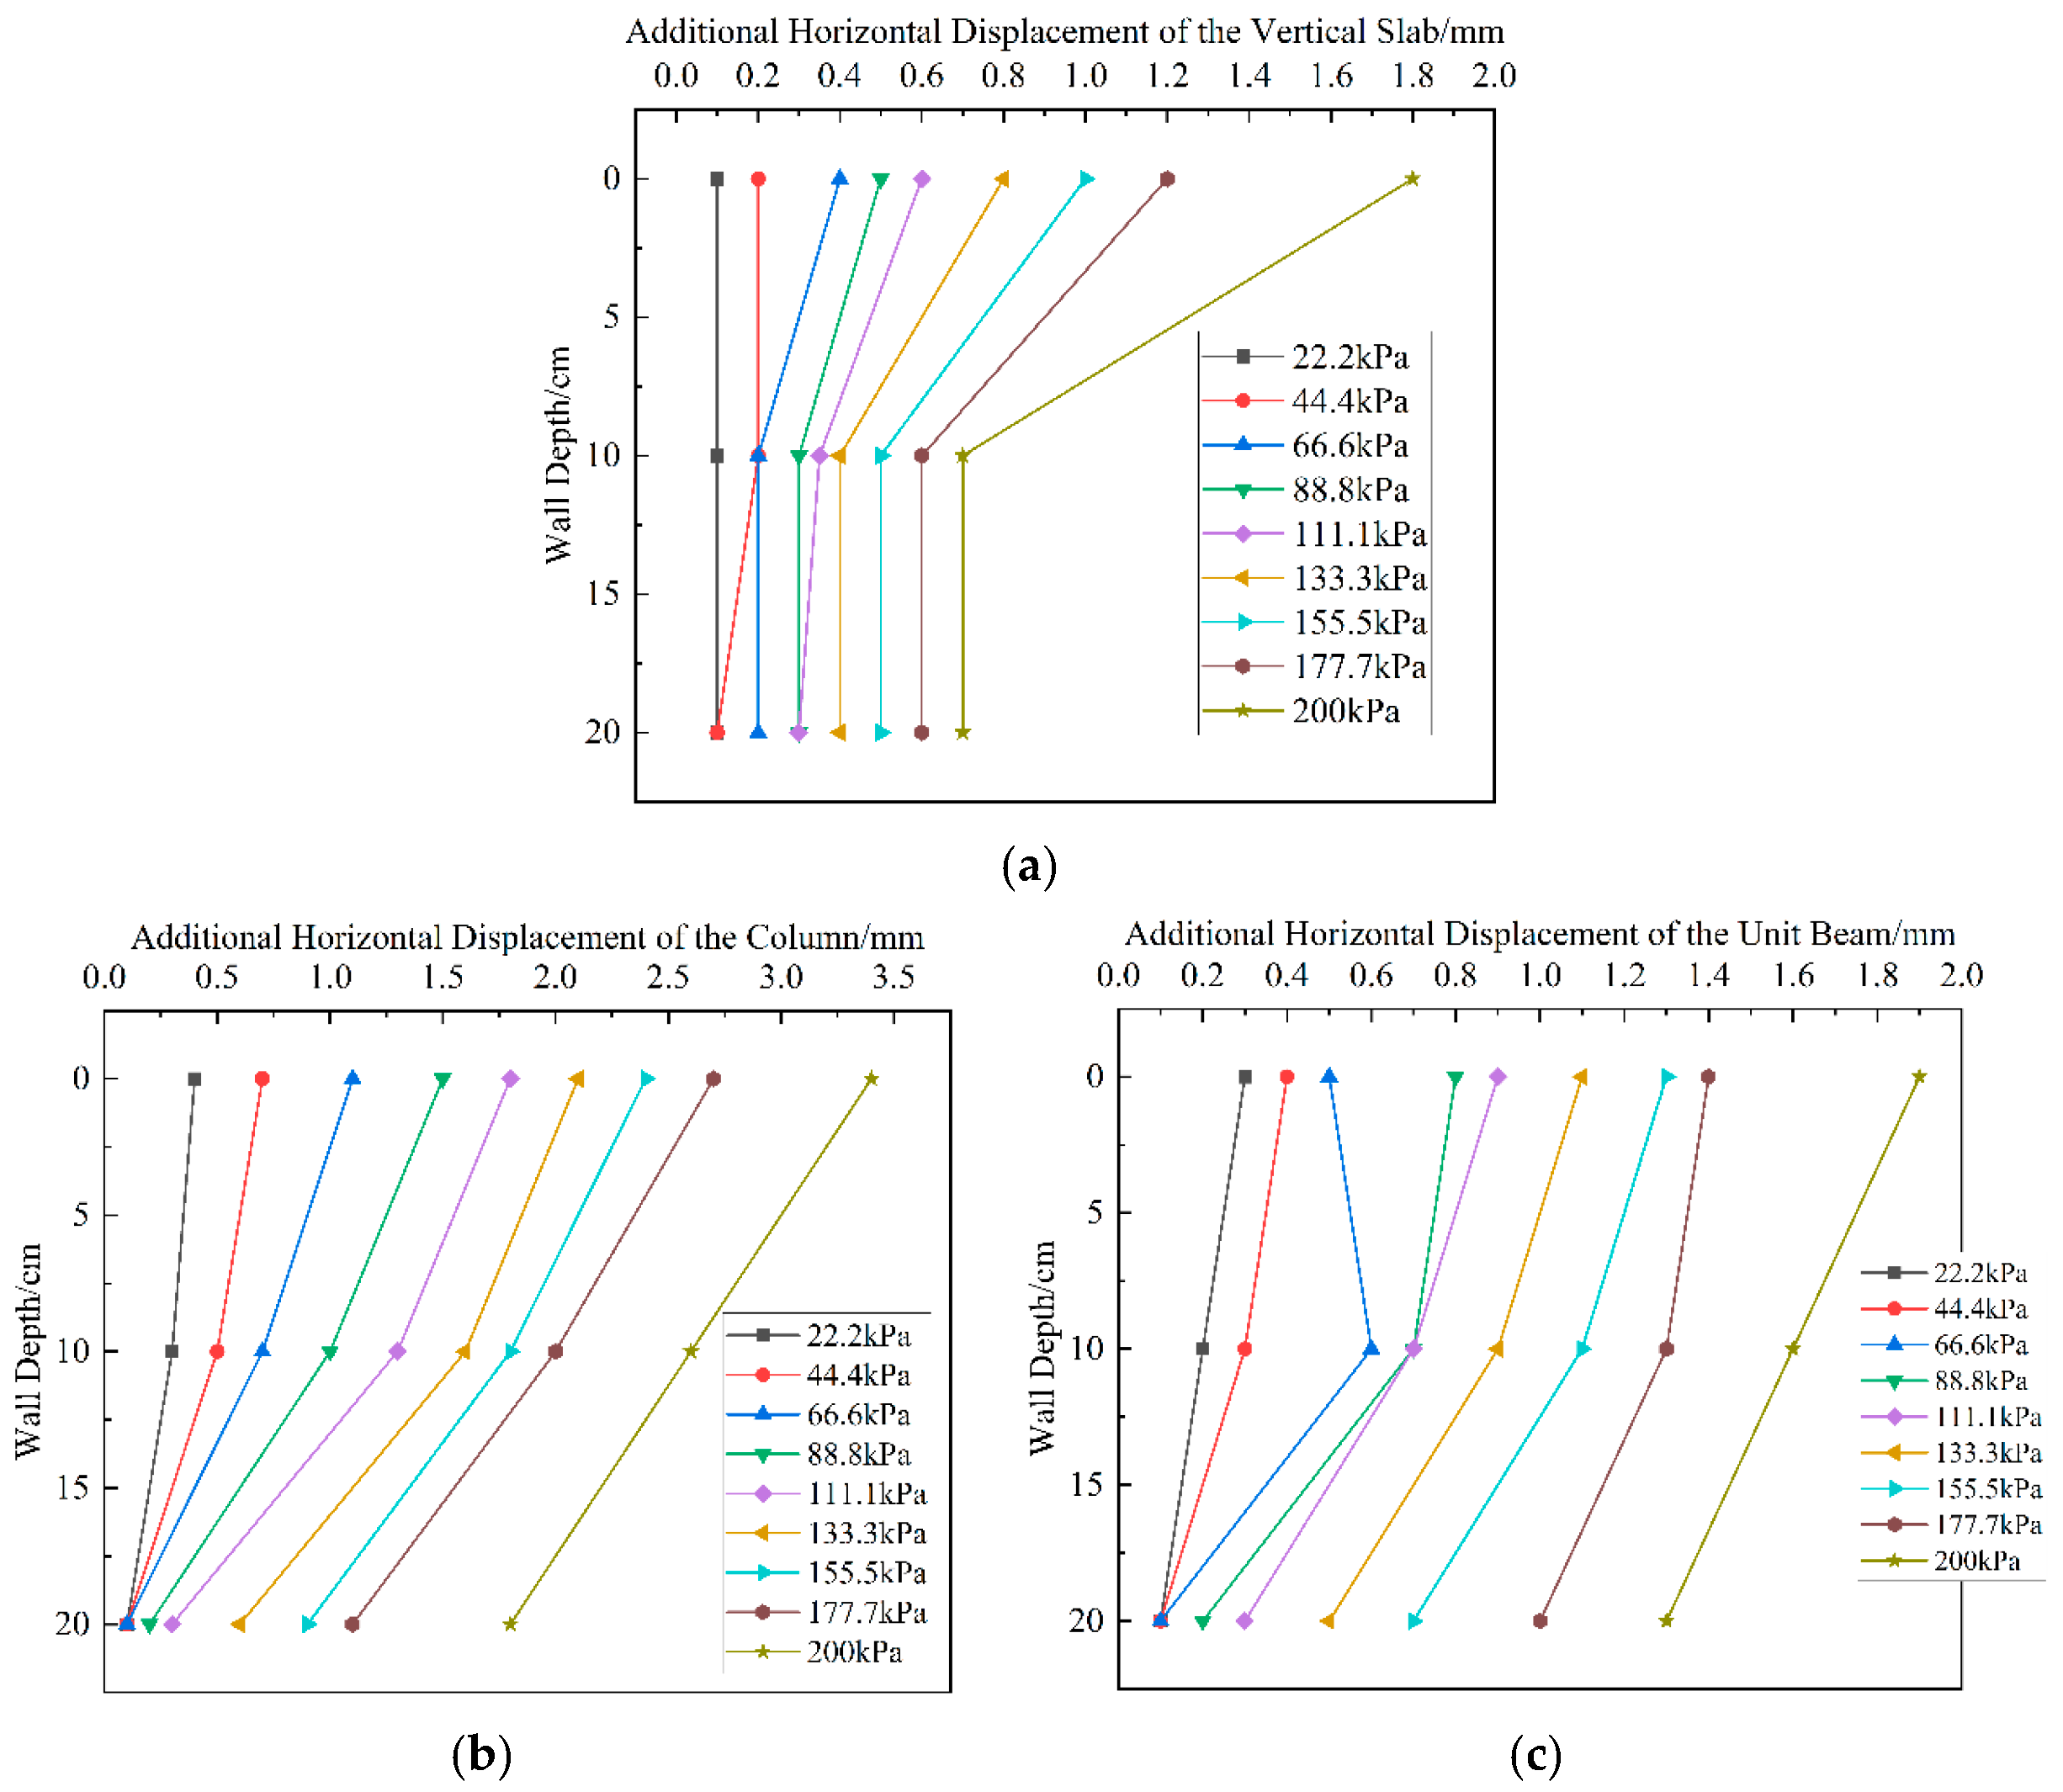
5.2.2. Additional Horizontal Displacement Analysis

The measured Additional Horizontal Displacement under load provides further insight into the distinct structural behaviors of the two designs.
Figure 17a presents the profile of Additional Horizontal Displacement for the monolithic wall’s vertical slab. The displacement is the greatest at the top and diminishes towards the base, a pattern characteristic of a structure undergoing cantilever-like rotation. This behavior is a direct consequence of the loading conditions; the upper, unsupported portion of the slab is pushed outward, while the lower portion is restrained by the counterfort and soil in front of the wall. This significant top-level displacement confirms that the slab–counterfort connection is subjected to high tensile forces, a finding that corroborates the initial failure mode identified in Section 4.1.
The displacement patterns for the modular wall presented in Figure 17b,c reveal a more complex interaction. While the overall trend of maximum displacement at the top remains, the uprights exhibit nearly twice the amount of Additional Horizontal Displacement of the facing panels under identical loading. This is because each upright must resist not only direct earth pressure, but also the cumulative load transferred from the adjacent facing panels.
This leads to a critical insight into the performance trade-offs. The overall Additional Horizontal Displacement of the modular system’s components is greater than that of the monolithic wall, indicating that the segmented structure is inherently more flexible. This flexibility, however, allows for effective load distribution. The forces are shared across numerous joints, preventing the severe stress concentrations that were observed in the monolithic design. Consequently, despite the larger displacements and the large cumulative forces on the uprights, the individual connections in the modular wall did not fail. The monolithic wall, while stiffer, concentrates its entire load path onto a few critical connections, making it more vulnerable to progressive failure once a single joint is compromised.

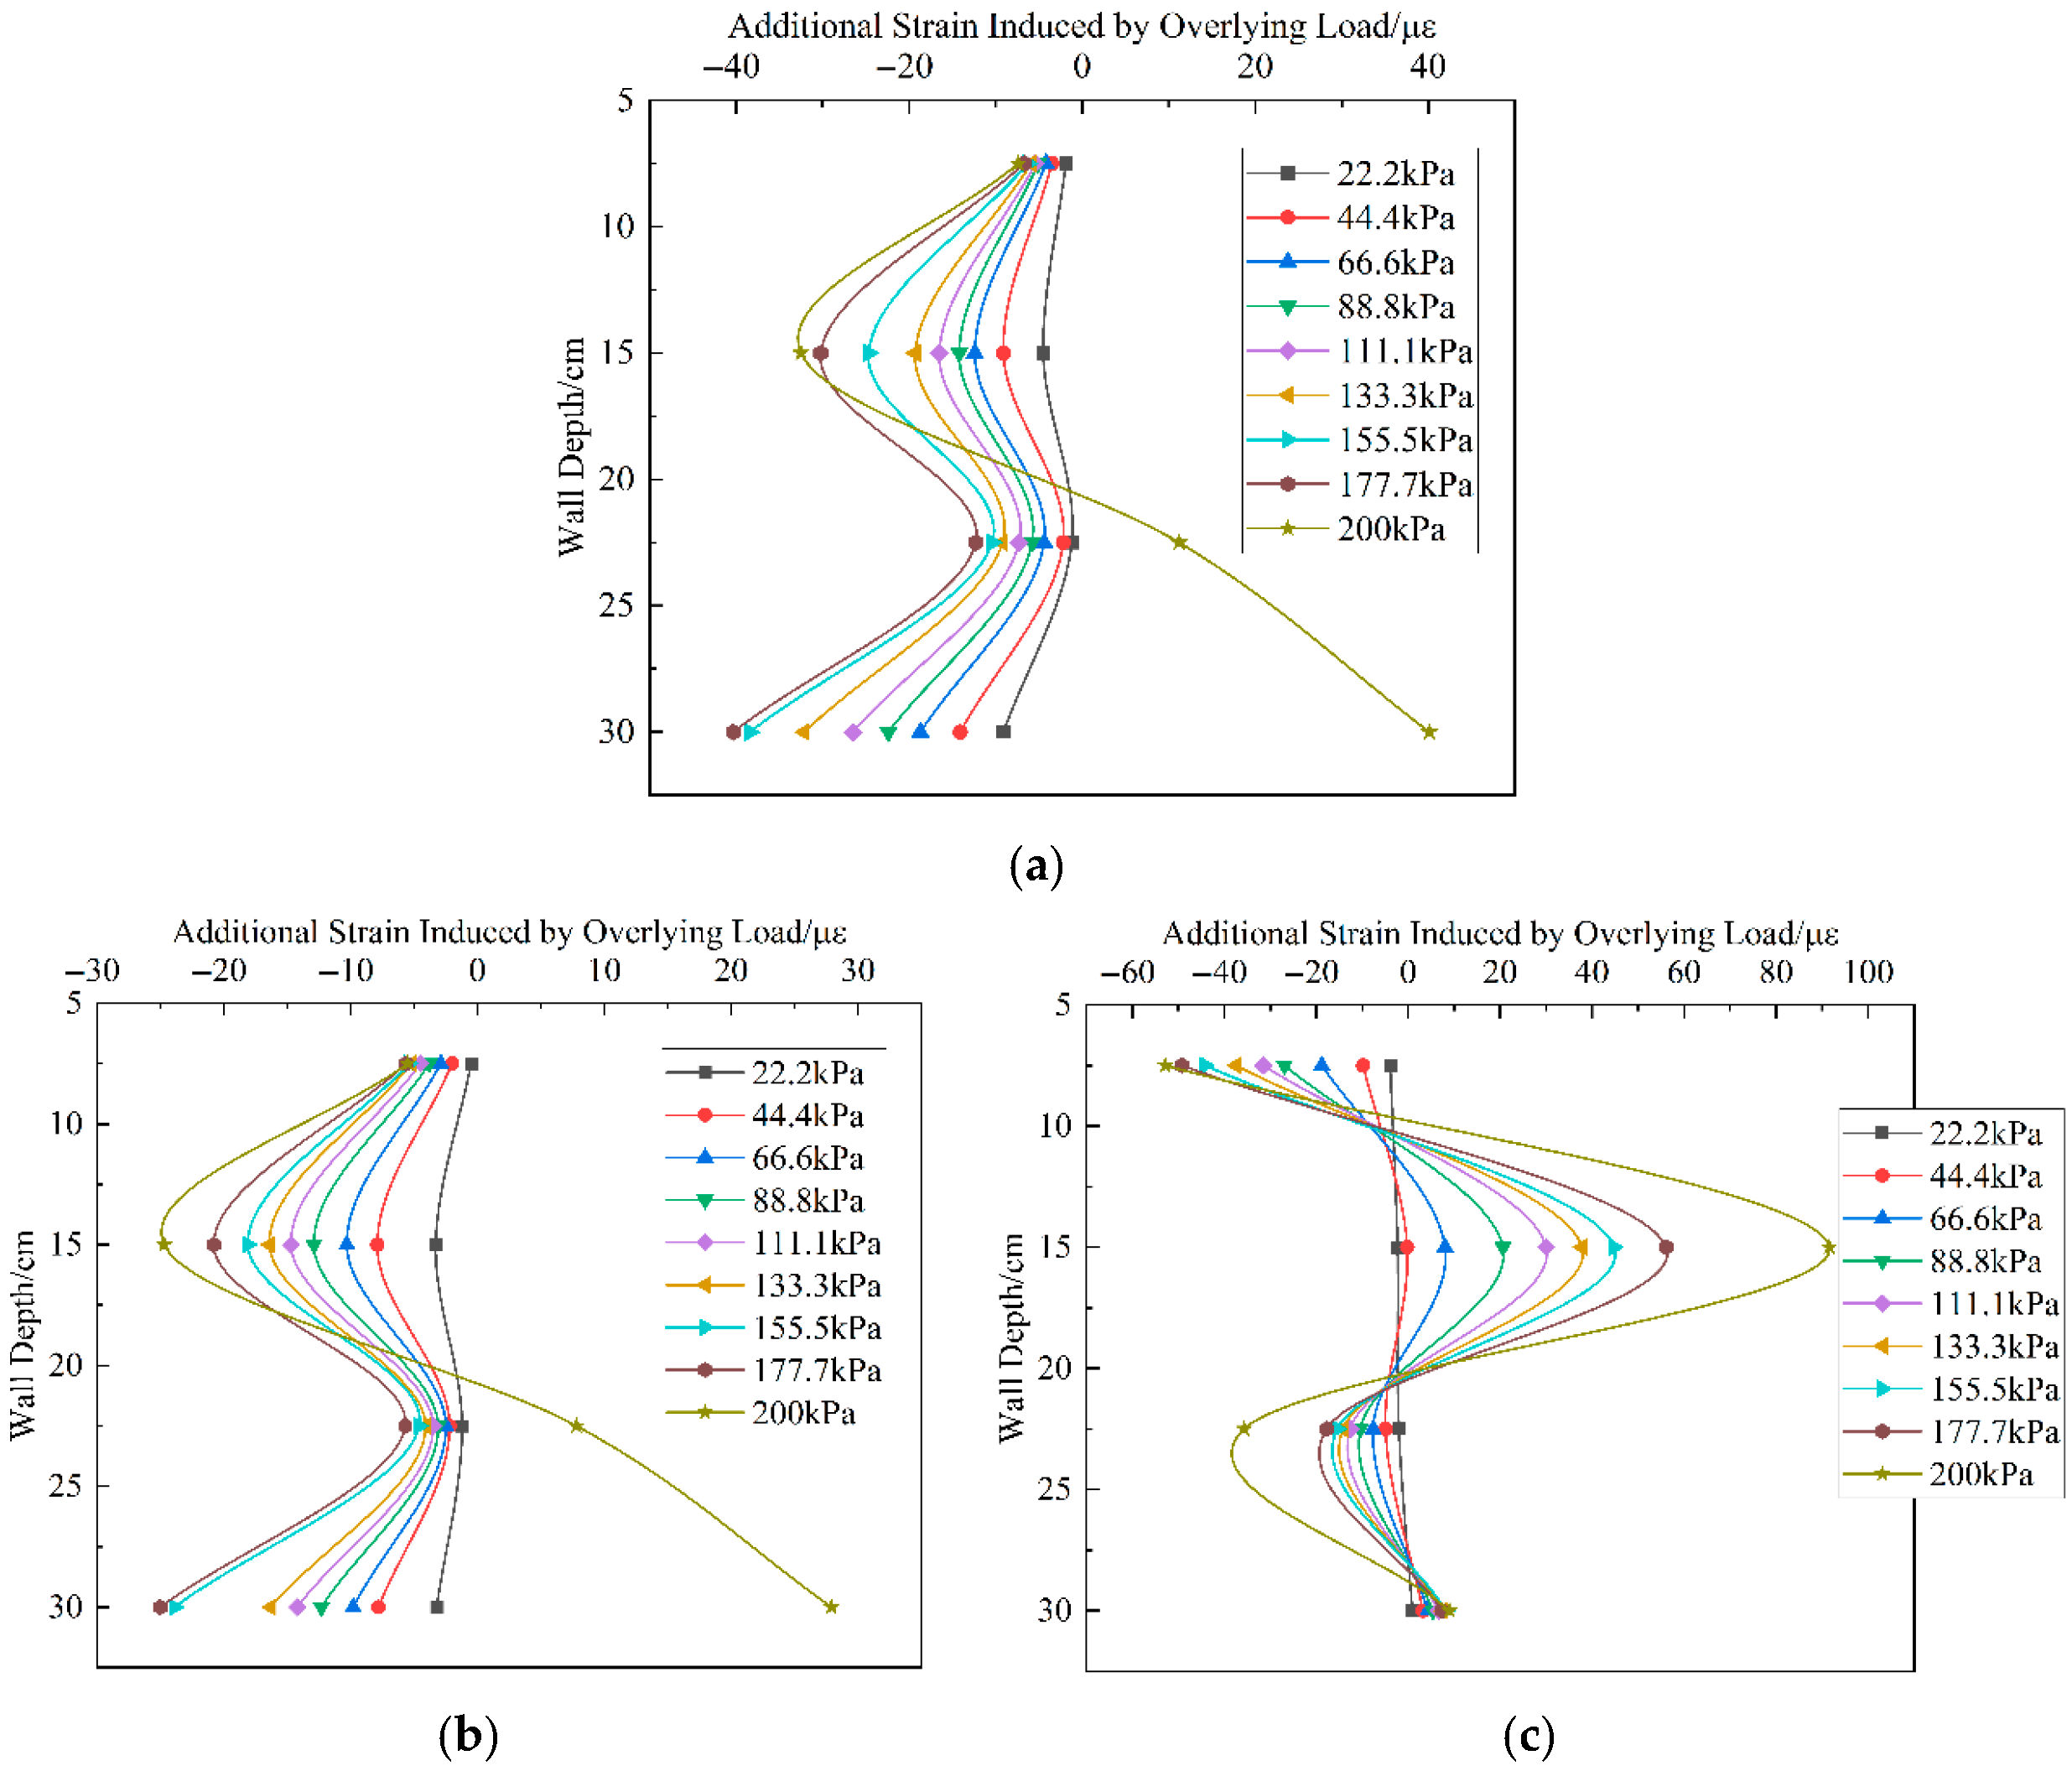
5.2.3. Additional Strain Analysis

The analysis of the Additional Strain data (Figure 18), where negative and positive values denote compression and tension, respectively, reveals the distinct internal stress states of the wall components.
Additional Strain in the monolithic wall’s slab (Figure 18a) is concentrated in the middle and lower regions. While the amount of displacement is the greatest at the top (Section 5.2.2), the slab’s ability to move freely there results in relatively less strain. Conversely, in the middle region, the counterfort resists displacement, converting this force into significant localized deformation, and thus high-level compressive strain. A similar effect occurs at the base, where restraint is provided by passive earth pressure from the soil in front of the wall. Critically, at the 200 kPa load—coinciding with the onset of internal backfill failure—the strain in these regions reverses to become tensile. This indicates a shift from simple compression to a more complex and unfavorable stress state within the slab as the backfill loses its predictable character.
Figure 18b shows Additional Strain in the modular wall’s facing panels. While the overall distribution is similar to the monolithic slab (more strain in the middle and lower sections), the magnitudes are consistently lower. This is a direct consequence of the wall’s segmented nature. Each panel functions as an independent element, so deformation is not propagated to the adjacent units. This contrasts with the monolithic slab, which deforms as a single, continuous entity, resulting in higher overall strain. Although tensile strains also appear at the 200 kPa load, their magnitude is lower than in the monolithic design, further highlighting the benefits of a discontinuous structure.
The Additional Strain profile for the modular wall’s uprights (Figure 18c) is markedly different, exhibiting an alternating pattern of tensile and compressive strain with depth. This complex response is attributed to the upright’s geometry; it protrudes into the backfill relative to the panels, and the central connection to the counterfort induces localized bending moments. The vulnerability of this component is underscored by its response at 200 kPa. Upon backfill failure, the amount of tensile strain at the 15 cm depth nearly doubles, demonstrating that the uprights are inherently more susceptible to high tensile stress, particularly in off-normal conditions.

5.3. Influence of Geogrid Reinforcement

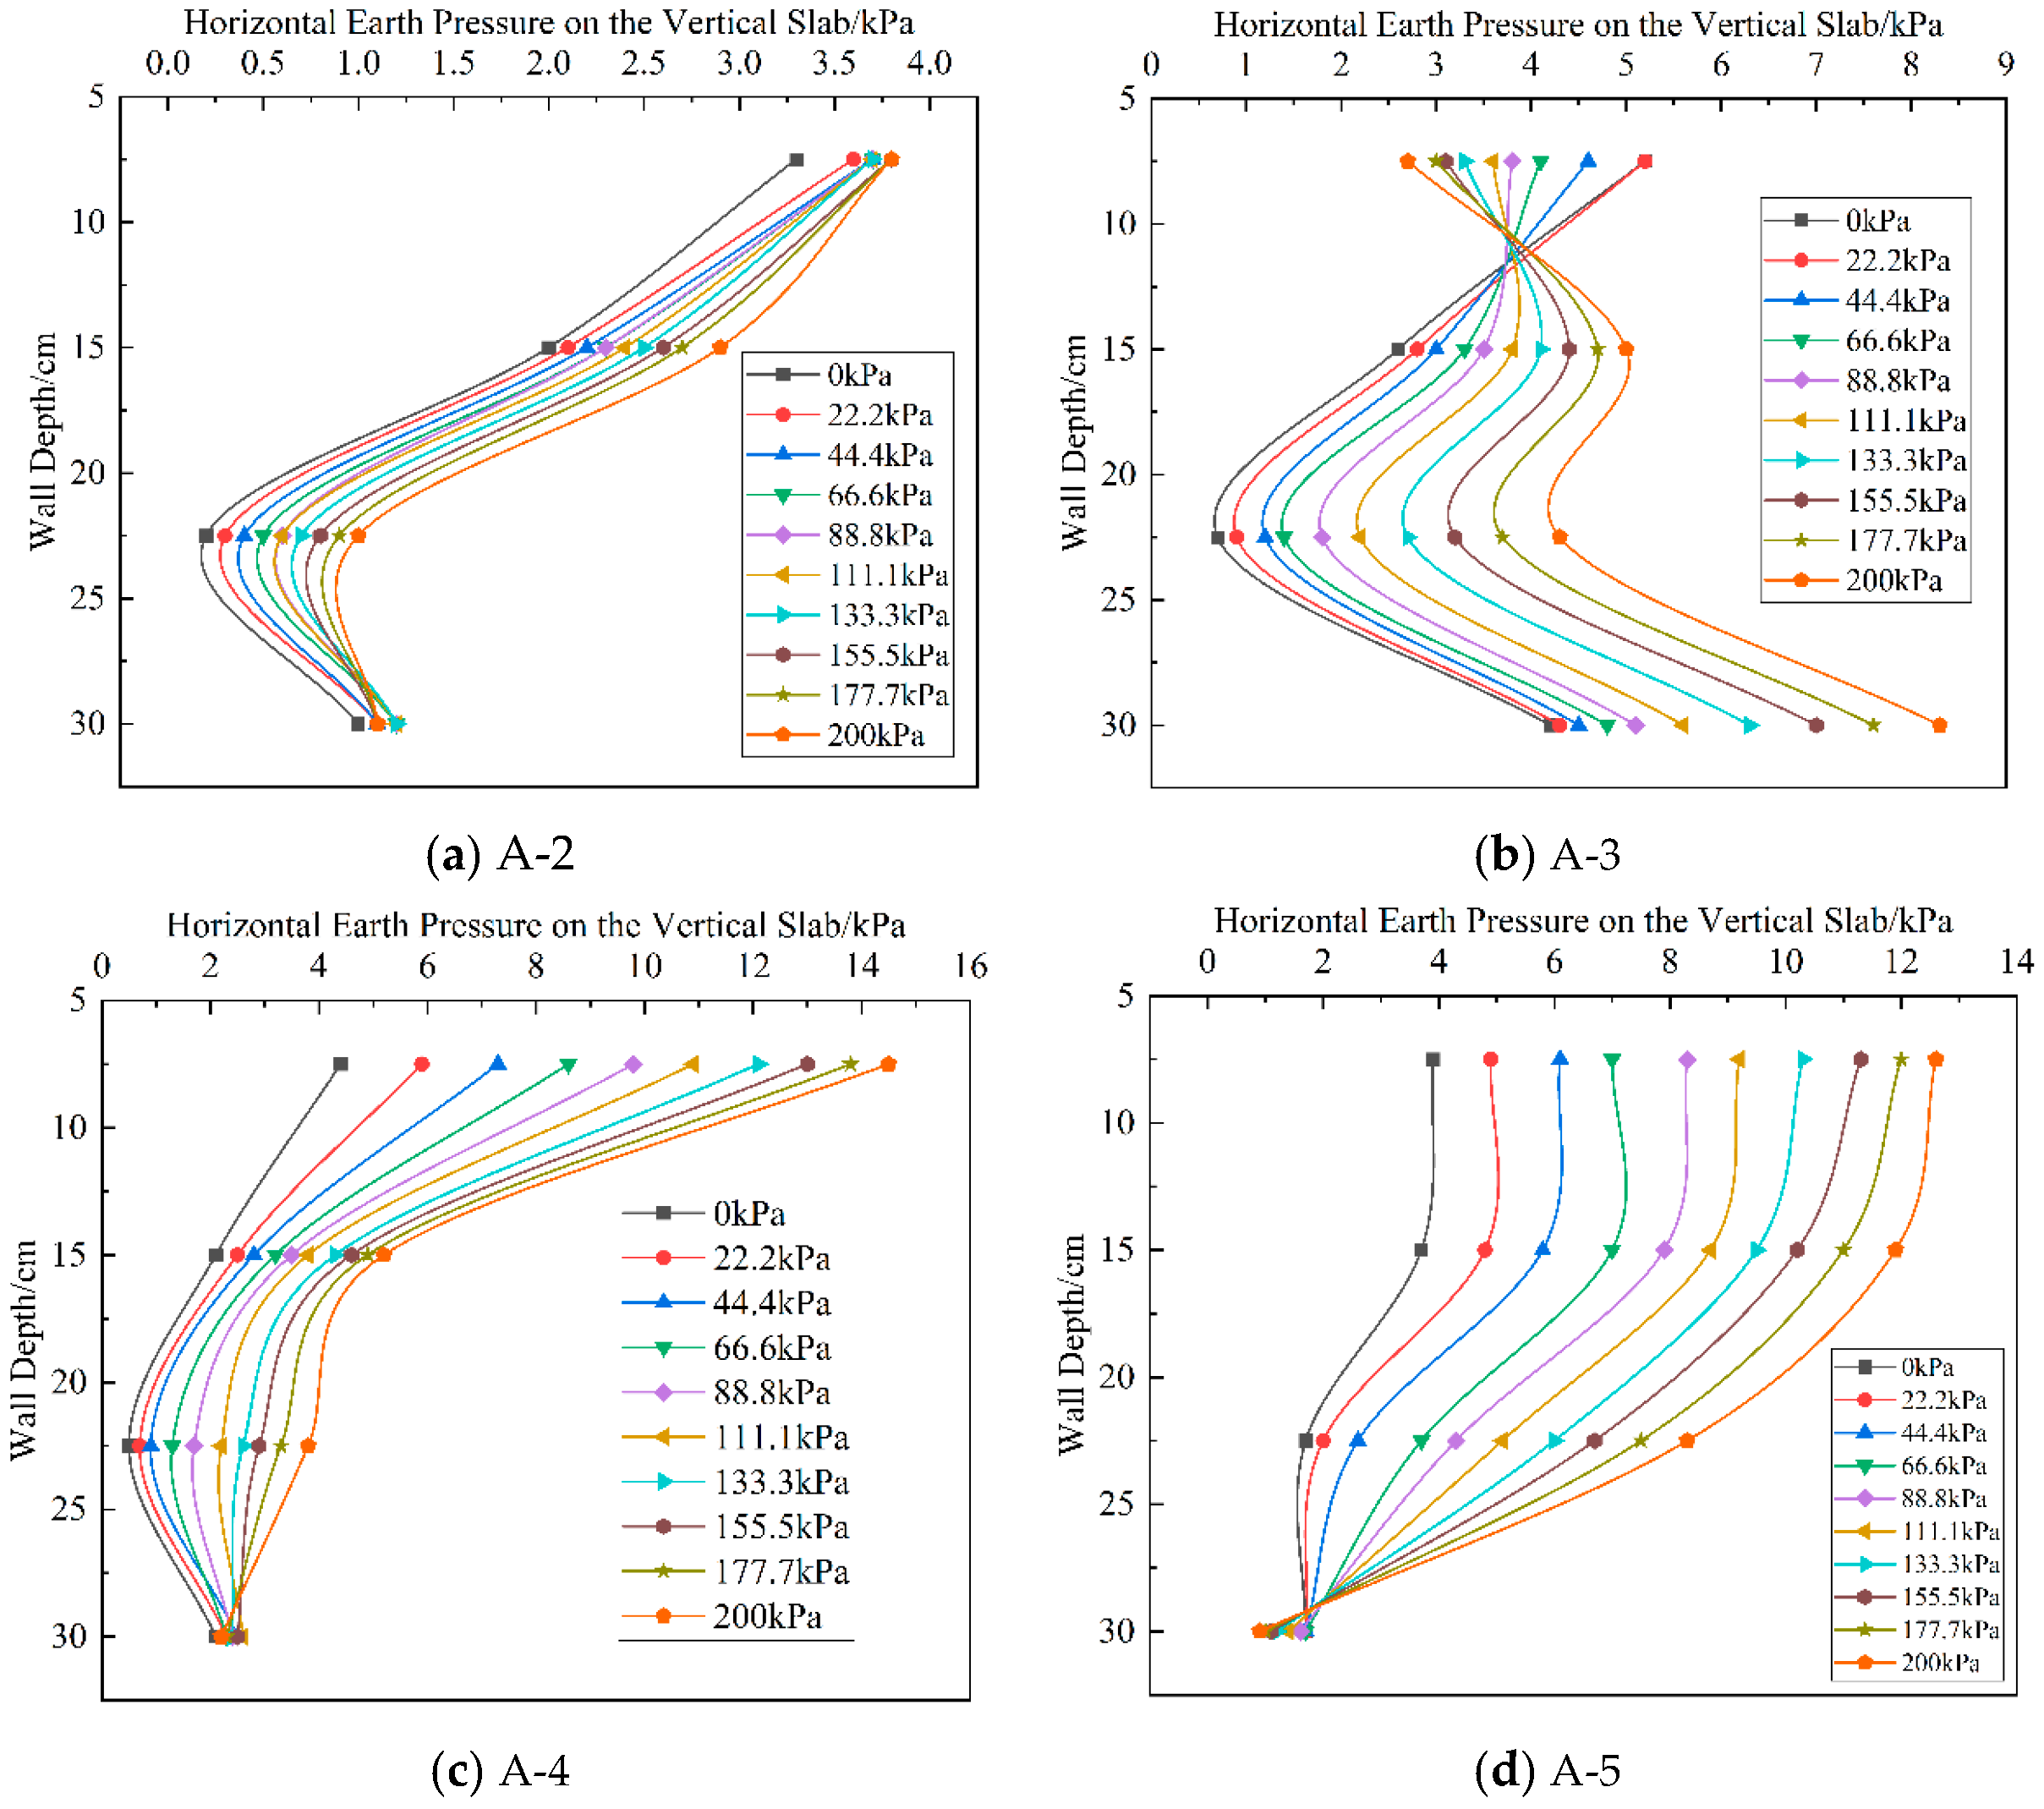
5.3.1. Geogrid Reinforcement Configurations

To systematically evaluate the influence of geogrid reinforcement on wall performance, a series of controlled experiments was conducted. The total height of the retained backfill was 30 cm. The unreinforced wall served as the control case (designated A-1). Four distinct geogrid reinforcement scenarios were then tested against this baseline, as summarized in Table 4.
The experimental cases were designed as follows:
(1)
Case A-2 (Uniform Distribution): A dense reinforcement layout consisting of nine geogrid layers, uniformly spaced at 3 cm intervals throughout the entire height of the backfill.
(2)
Case A-3 (Upper Zone Reinforcement): Three geogrid layers were concentrated in the upper third of the backfill at depths of 3 cm, 6 cm, and 9 cm.
(3)
Case A-4 (Middle Zone Reinforcement): Three geogrid layers were concentrated in the middle third of the backfill at depths of 12 cm, 15 cm, and 18 cm.
(4)
Case A-5 (Lower Zone Reinforcement): Three geogrid layers were concentrated in the lower third of the backfill at depths of 21 cm, 24 cm, and 27 cm.

5.3.2. Analysis of Structural Performance with Geogrid Reinforcement

The preceding analysis established that the wall’s performance is governed by the horizontal earth pressure profile and the stability of the backfill. This section, therefore, evaluates how the different geogrid reinforcement schemes (Figure 19) alter these critical factors, with the unreinforced case (A-1) serving as the control.
Case A-2 (Uniform Reinforcement): The uniform, dense reinforcement in Case A-2 (Figure 19a) dramatically reduces the magnitude of the horizontal earth pressure across all the depths compared to that of the control. While the general shape of the pressure profile is preserved—with the peak pressure remaining near the top of the wall (7.5 cm depth)—the peak magnitude is substantially suppressed. This result provides clear evidence that the geogrid effectively confines the backfill, creating a composite soil–geogrid mass that exerts significantly less lateral force on the structure.
Case A-3 (Upper Zone Reinforcement): Targeting the reinforcement to the upper zone (Figure 19b) fundamentally alters the pressure distribution. The geogrid effectively confines the soil in the upper, cantilevered portion of the wall, leading to a significant reduction in pressure in this critical area. Consequently, the peak pressure is redistributed to the unreinforced lower portion of the backfill. Although this increases pressure at the base, the overall structural effect is highly beneficial. By shifting the load away from the unsupported upper section to the well-supported lower section (which is buttressed by passive soil pressure), this configuration significantly reduces the bending moment at the critical slab–counterfort connection.
Case A-4 (Middle Zone Reinforcement): In contrast, reinforcement in the middle zone (Figure 19c) proves to be counterproductive. The geogrid layers act as a barrier, impeding the natural downward diffusion of surcharge-induced pressure. This causes the pressure to become concentrated in the unreinforced zone above the geogrid, resulting in a peak pressure at the top of the wall that is even higher than in the unreinforced control case. While pressures in the lower zone are reduced, this comes at the cost of amplifying the load on the most vulnerable, cantilevered portion of the slab. This configuration therefore exacerbates the primary failure mechanism.
Case A-5 (Lower Zone Reinforcement): Placing the reinforcement only in the lower zone (Figure 19d) has a negligible positive impact. While it successfully reduces pressure near the base, it fails to influence pressure distribution in the upper and middle zones. The peak pressure remains concentrated at the top of the wall, meaning this configuration does not address the critical stresses on the slab–counterfort connection. Consequently, its overall benefit to the wall’s stability is minimal.
In summary, this analysis demonstrates that the efficacy of geogrid reinforcement is entirely dependent on its strategic placement. The primary structural vulnerability is the high bending moment at the upper slab–counterfort connection caused by pressure concentration on the cantilevered portion of the wall. Therefore, the optimal reinforcement strategy (demonstrated by Case A-3) is to concentrate the geogrid layers within this upper, critical zone. Spreading the reinforcement uniformly (A-2) is effective, but less efficient, while placing it in the middle (A-4) or lower (A-5) zones is either detrimental or ineffective. The key design principle derived from these results is that the reinforcement must be placed where it can directly counteract the highest structural stresses.

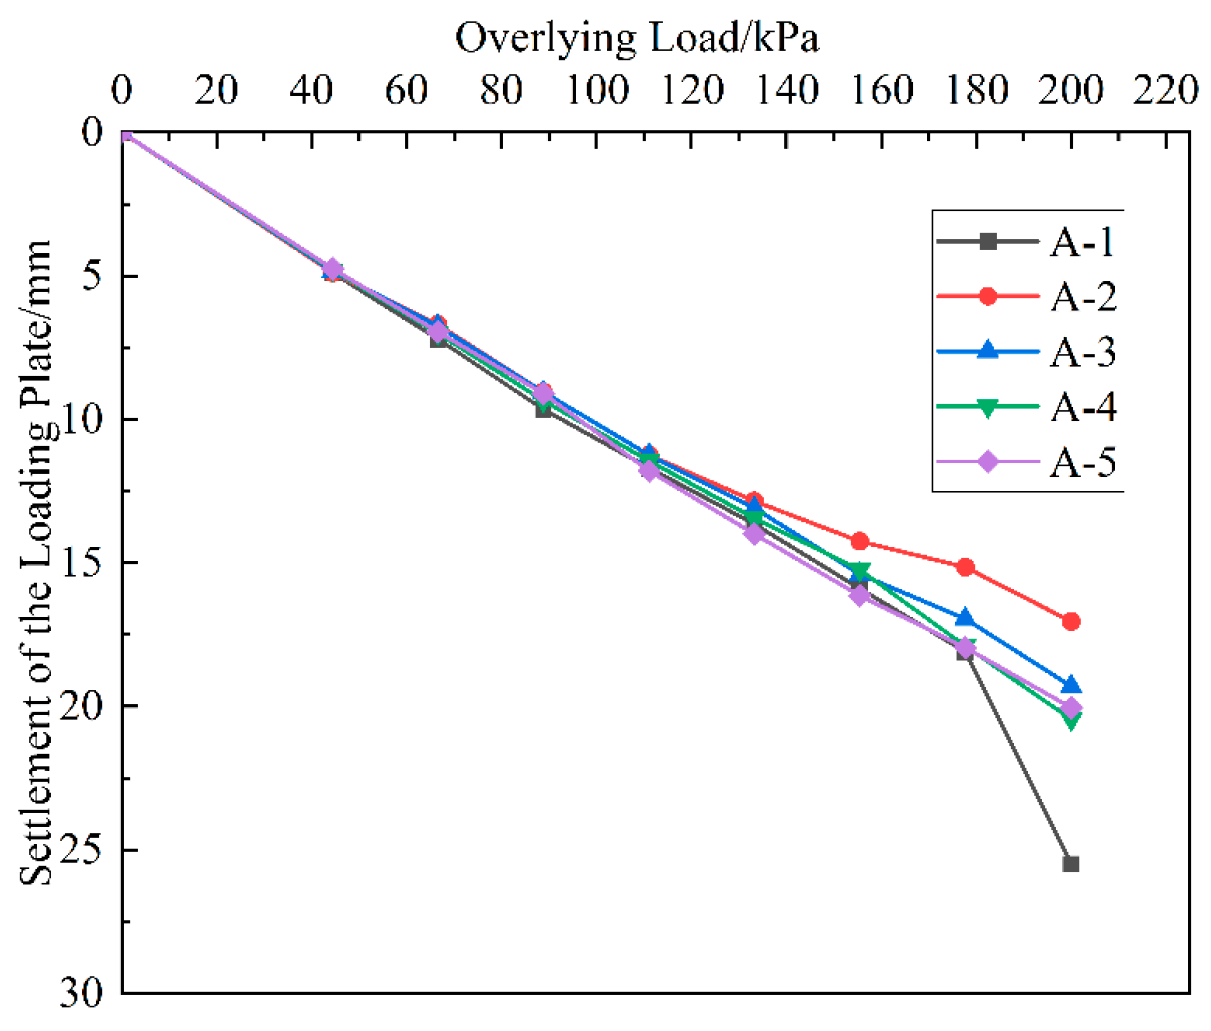
5.3.3. Analysis of Backfill Settlement

The settlement of the loading plate, representing the overall vertical compression of the backfill, has been plotted against the applied surcharge in Figure 20. The data reveal that while the settlement behaviors are similar across all the cases at low stress levels, the performance benefits of geogrid reinforcement become highly pronounced as the load increases.
For the unreinforced control, Case A-1, the settlement–load curve exhibits two distinct phases. Initially, it shows a near-linear elastic response, where settlement increases proportionally with surcharge. This is followed by a second phase initiated at approximately 200 kPa, at which point the backfill undergoes plastic yielding, evidenced by an abrupt increase in the settlement of the loading plate. Crucially, this indicates that the observed failure is a geotechnical one, originating in the backfill, rather than a structural failure of the prefabricated counterfort retaining wall itself.
Case A-2 (uniform reinforcement) provided the benchmark for performance, exhibiting substantially less settlement than all the other configurations, particularly in the critical 160–200 kPa range. This is because the dense, uniform geogrid distribution enhances the bearing capacity of the entire backfill mass, effectively suppressing the formation and propagation of internal plastic zones and thus improving global stability.
Cases A-3, A-4, and A-5 all successfully prevented the abrupt, large-scale settlement observed in the unreinforced control case (A-1), demonstrating that even localized reinforcement can arrest the development of a general failure plane. Among these, Case A-3 (Upper Zone Reinforcement) was clearly the most effective. By confining the soil directly beneath the applied load where stresses are highest, it most efficiently limited the downward propagation of pressure and minimized total settlement compared to that of reinforcement in the middle and lower zones. From the perspective of controlling vertical deformation, reinforcing the upper third of the backfill is the superior strategy.

5.4. Finite Element Analysis

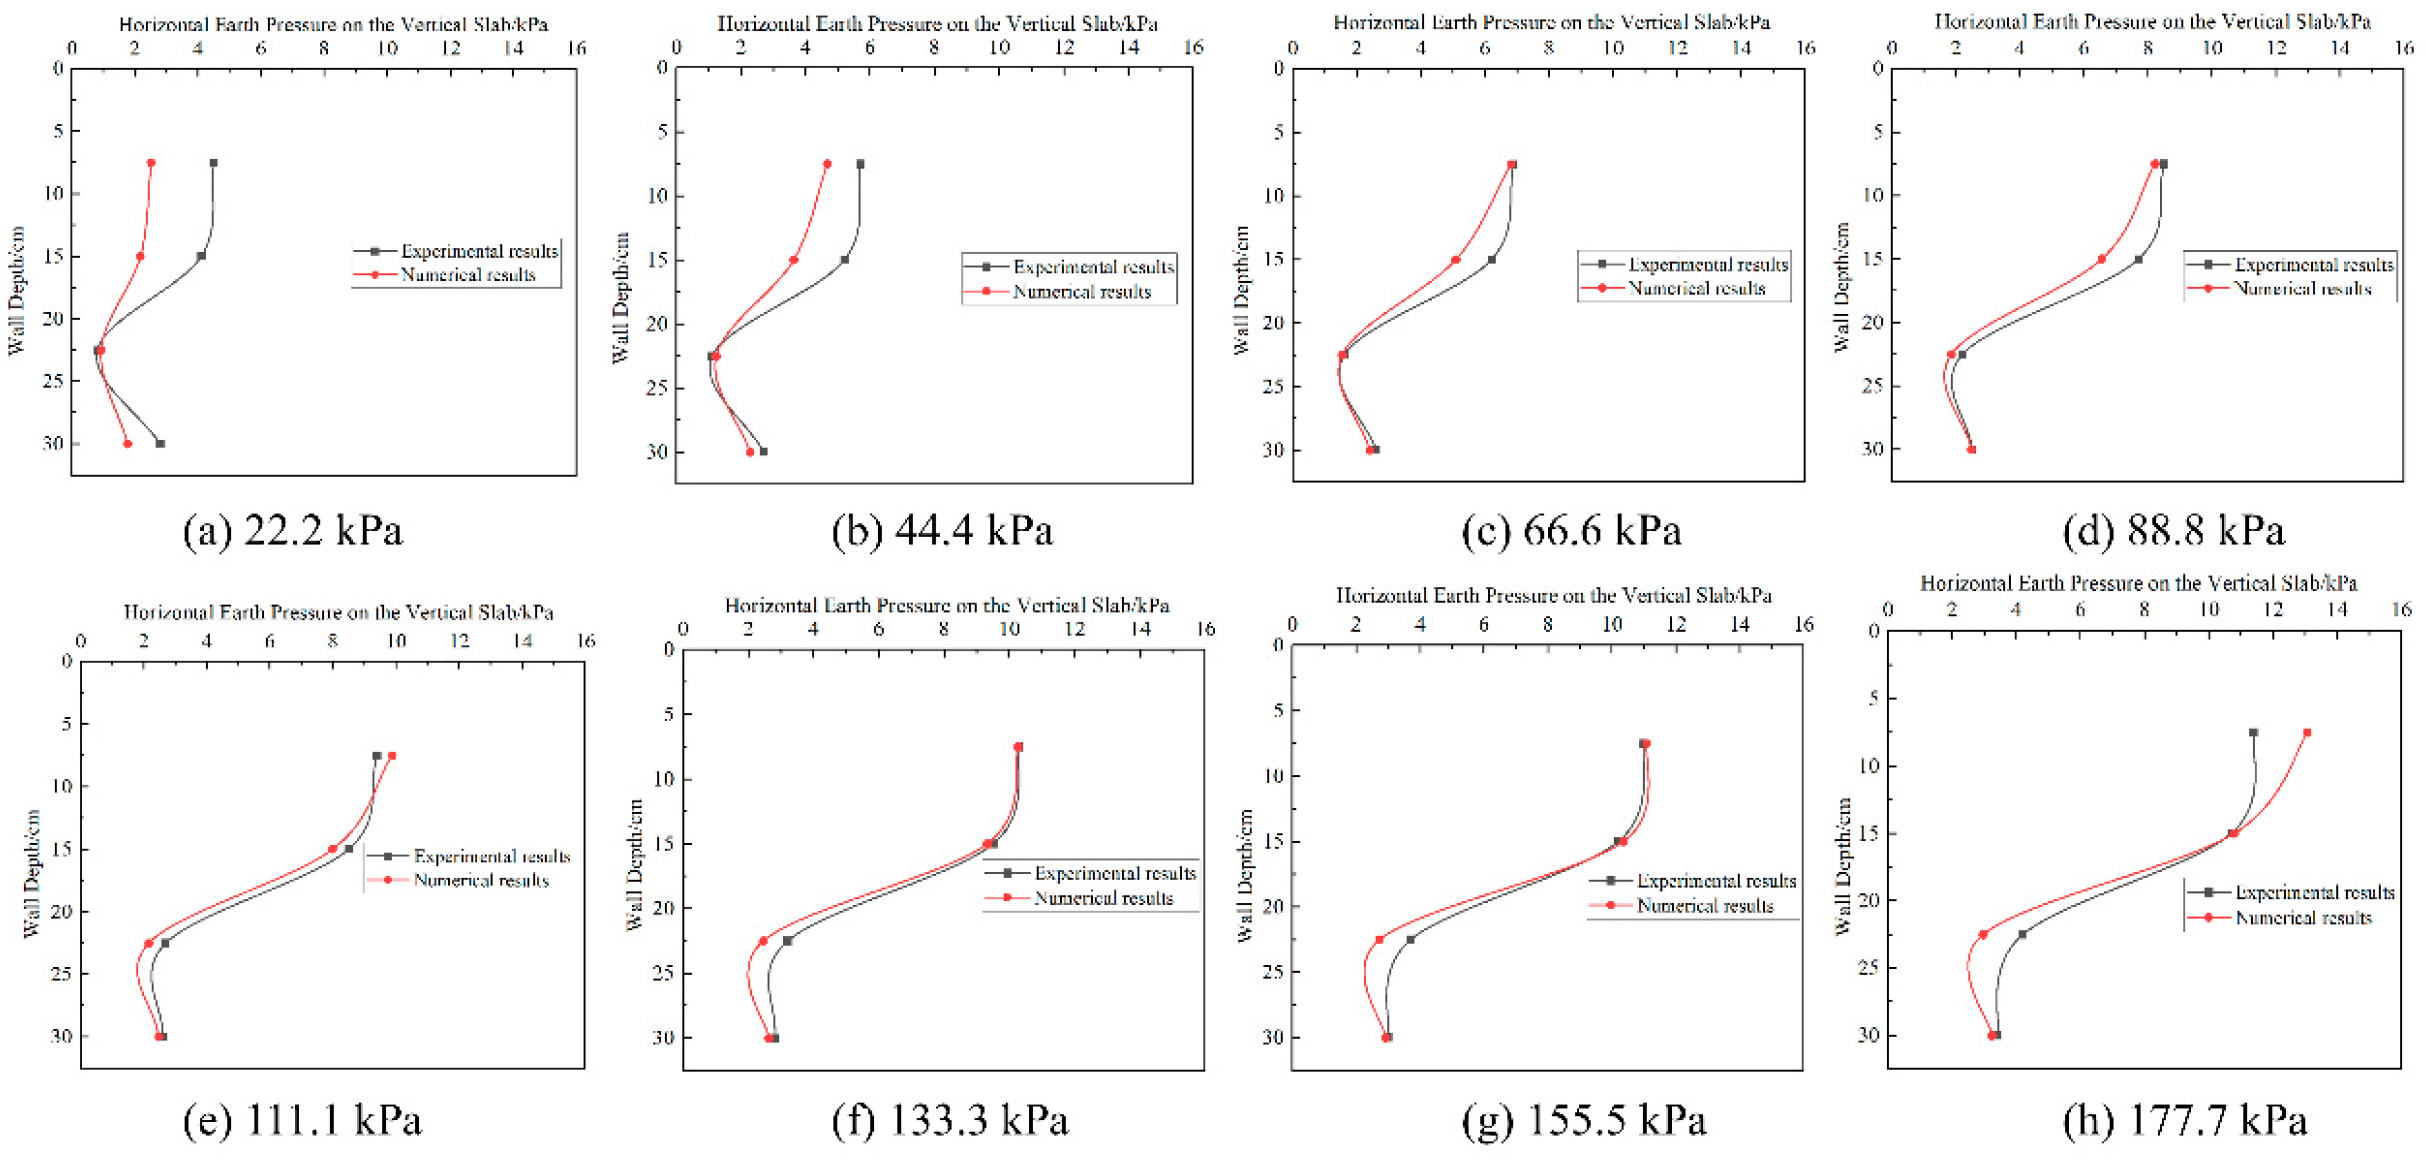
5.4.1. Validation of the Experimental Results

To validate the results from the physical model test, a corresponding 1:1 numerical model was developed using the finite element software Midas GTS N 2022X, replicating the exact dimensions and material parameters (Figure 21). A comparison was then made between the horizontal earth pressures on the vertical slab measured in the experiment and those predicted by the numerical simulation to assess the level of agreement.
In the model, the retaining wall was composed of distinct prefabricated PVC panels. To represent the mechanical behavior at the joints between these components, interface elements were utilized. The material properties and the interface parameters used in the numerical analysis are summarized in the Table 5 below.
Figure 22 present a comparison between the horizontal earth pressures on the vertical slab measured in the physical model test and those predicted by the numerical simulation under various surcharge loads.
The results show strong agreement in the distribution profiles of earth pressure. In both the experimental measurements and the numerical predictions, the pressure profile is non-linear, increasing with depth to a peak value at approximately 7.5 cm from the top of the wall before decreasing. Furthermore, the absolute magnitudes of the measured and predicted pressures are in close alignment, with only minor discrepancies.
This strong correlation, both in trend and in value, confirms that the numerical model accurately reproduces the behavior observed in the physical experiment. These findings therefore validate the reliability of the experimental data and establish the feasibility of the adopted numerical methodology for further analysis.

5.4.2. Full-Scale Structural Analysis

To investigate the structural performance and stress distribution at the key connection interfaces of the two prefabricated counterfort retaining wall designs under realistic engineering conditions, full-scale numerical analysis was performed. Prototypes for both the monolithic and modular walls were modeled with a total height of 6.0 m and a base slab thickness of 0.5 m.
For the modular retaining wall, the geometry was specifically defined as follows: the bottom upright height was set to 1.2 m, the top upright to 0.8 m, and all the intermediate uprights to a uniform height of 1.0 m. The modular beams also had a uniform height of 1.0 m. All other geometric dimensions were kept identical to those of the finite element model presented in Figure 23, and the material parameters used were as specified in Table 6.
Figure 24a provides a schematic diagram of the component interfaces for both the monolithic and modular prefabricated counterfort retaining walls. The results for the horizontal stress at these interfaces are presented in Figure 24b,c.
As shown in Figure 24b, the horizontal stress at the upright–upright interfaces of the modular retaining wall initially decreases, and then increases with depth. The level of stress is notably higher at Interface 1 and Interface 5. The elevated stress at Interface 1 is attributed to its close proximity to the surcharge load, where the resulting horizontal thrust induces significant compressive action between the uprights. For the lower interfaces, a critical load transfer mechanism is at play: each modular beam transfers the horizontal earth pressure it sustains to both the upper and lower uprights. Therefore, despite the uprights being structurally independent units, the modular beams create a continuous load path. This mechanism allows for earth pressure acting on the upper beams to be transmitted downwards, leading to a progressive increase in stress with depth and resulting in the relatively high stress observed at Interface 5.
Interface 6, the joint between the uprights and the base slab, exhibits a different behavior. Lacking a connecting element like a modular beam, this interface is mechanically isolated. Consequently, the horizontal stresses from the upper sections cannot be effectively transferred into the base slab, leading to a significant stress concentration at Interface 6. This causes the amount of stress to increase dramatically, reaching a level far exceeding that of Interfaces 1–5. For the monolithic retaining wall, only a single interface between the vertical slab and the base slab (Interface 6) exists; hence, the stress values at Interfaces 1–5 are zero. With fewer interfaces to distribute the load, all earth pressure exerted on the vertical slab is transferred directly to the base, resulting in a substantial stress concentration at Interface 6. Therefore, for both the wall designs, the interface at the very bottom sustains markedly higher horizontal stress than any other interface.
Figure 24c illustrates the horizontal interface stress between the counterforts and the vertical slabs (for the monolithic wall) or uprights (for the modular wall) as a function of depth. It is immediately apparent that the magnitude of stress at these counterfort interfaces is significantly higher than the stresses observed at the other structural joints (slab–base, upright–upright, and upright–base). This indicates a higher propensity for cracking to initiate at the counterfort connections. Both the wall types exhibit a similar stress distribution pattern: higher stresses at the top and bottom, with lower values in the middle. This is because the upper portion of the vertical slab is subjected to high earth pressure, while lacking intermediate support, creating a cantilevered action that produces a forward-tilting tendency. The counterforts provide a critical restraining tensile force to counteract this movement, resulting in high interface stresses.
In the monolithic wall, the stress at the base of the counterfort-slab interface is substantially higher than elsewhere. This is because the total external load on the vertical slab is shared primarily between just two locations: the counterfort–slab interface and the slab–base connection. This leads to a large tensile force concentration in the counterfort at its base connection. In contrast, for the modular wall, the interface stress at the base of the counterfort is lower than at the top and significantly lower than its monolithic counterpart. This distinct difference arises because the multiple interfaces of the modular design allow for the more effective distribution of external loads, preventing severe stress concentrations. As a result, while the stress at Interface 6 is comparable for both the designs, the modular wall maintains stability with only ~200 kPa of stress at its counterfort–upright interface, whereas the monolithic wall requires over 700 kPa at the same location to remain stable.
From the perspective of interface stress analysis, the monolithic retaining wall experiences significant stress concentration at the counterfort–slab interface. This makes it more susceptible to initial cracking at this location under identical loading conditions. Once the counterfort–slab connection is compromised, the entire remaining load must be resisted by the slab–base interface, making it highly prone to subsequent failure. This predicted failure sequence is fully consistent with the failure modes observed in the preceding scaled model tests.

5.5. Scalability of Core Findings

The primary objective of this study was not to quantify performance across all conditions, but to identify the critical failure mechanisms inherent to each structural design. As validated by the numerical model, these critical failure points are consistently located at specific structural junctions, namely the interface between the counterfort and the vertical slab, and the connection to the uprights. Crucially, the location of these points is an intrinsic feature of the wall’s geometry, independent of the overall scale. Variations in soil properties or surcharge loads, in turn, alter only the magnitude of the external forces, not the fundamental manner in which the structure concentrates stress at these specific locations. This confirms that the core findings on the comparative failure modes, which are tied to these inherent weak points, are fundamentally robust and generalizable.

6. Conclusions

This research provides the systematic analysis of the structural behavior of prefabricated counterfort retaining walls, defining a new design workflow and identifying critical failure modes through laboratory modeling. By integrating geogrid reinforcement, this study further establishes an optimized composite retaining system. The principal conclusions are as follows:
  • A two-stage design methodology is required for prefabricated systems. First, the structural integrity of the specific connection details must be verified through local stability calculations. Once qualified, the entire wall can be simplified into a structurally equivalent model for global stability analysis, potentially using established methods for cast-in-place walls if the geometries are analogous, or requiring bespoke analysis if they are not.
  • The structural configuration directly governs failure vulnerability. The monolithic design concentrates stress at a few critical connection points, making the slab–counterfort interface highly susceptible to failure. In contrast, the modular design distributes loads across numerous connection interfaces, reducing the stress concentration at any single point and improving overall robustness.
  • The most critical structural component is the connection between the counterfort and the upper portion of the wall facing. This area behaves as an unsupported cantilever, making it highly vulnerable to bending forces from horizontal earth pressure. Conversely, while the vertical pressures on the heel slab are immense, the connection stresses at the base are comparatively low, provided the slab is in full contact with the foundation subgrade.
  • The onset of backfill failure induces a complex stress state that can cause detrimental tensile forces on the wall facing, a phenomenon particularly pronounced in the slender, protruding uprights of the modular system. The implementation of geogrid reinforcement is essential to create a composite soil–structure system that enhances the backfill’s bearing capacity and prevents this adverse loading condition. Based on the comprehensive analysis of both structural stresses and backfill settlement, the optimal reinforcement strategy is to concentrate geogrid layers in the upper third of the backfill, where they most effectively counteract the primary failure mechanisms of the wall system.

Author Contributions

Conceptualization, Y.F. and J.W.; Methodology, A.L., Y.F., J.W. and S.H.; Software, A.L.; Validation, A.L.; Formal analysis, A.L., D.L., J.W., S.W. and S.H.; Investigation, H.L.; Resources, D.L. and J.W.; Data curation, A.L., S.W. and H.L.; Writing—original draft, A.L.; Writing—review & editing, A.L., Y.F. and J.W.; Visualization, A.L.; Supervision, D.L., J.W., S.W., H.L. and S.H.; Project administration, Y.F. and J.W.; Funding acquisition, Y.F. All authors have read and agreed to the published version of the manuscript.

Funding

This work was supported by the Water Conservancy Technology Project of Chongqing Municipal (Grant No. CQSLK-2023006) and the National Natural Science Foundation of China (Grant No. 52378327) and the Natural Science Foundation Project Chongqing Municipal (Grant No. CSTB2022NSCQMSX0263) and the Guangxi Young Elite Scientist Sponsorship Program (Grant No. GXYESS2025092).

Institutional Review Board Statement

Not applicable.

Informed Consent Statement

Not applicable.

Data Availability Statement

The data presented in this study are available on request from the corresponding author.

Conflicts of Interest

Author Yutao Feng was employed by the company China Railway Changjiang Transport Design Group Co., Ltd. The remaining authors declare that the research was conducted in the absence of any commercial or financial relationships that could be construed as a potential conflict of interest.

References

  1. Xu, Q. Investigation of stability alarming for retaining wall structures with damage. Shock. Vib. 2017, 2017, 4691947. [Google Scholar] [CrossRef]
  2. Ma, X.; Liu, Y.; Hao, Z.; Wang, X.; Yang, Y. Study on stress and deformation characteristics of existing-new two-stage cantilever retaining wall. PLoS ONE 2024, 19, e0296330. [Google Scholar] [CrossRef]
  3. Yang, M.; Wang, Y.; Xiao, S.; Guo, H.; Dong, J. Mechanical characteristics of counterfort-relief shelf composite retaining wall. Environ. Earth Sci. 2024, 83, 23. [Google Scholar] [CrossRef]
  4. Ferdous, W.; Bai, Y.; Ngo, T.D.; Manalo, A.; Mendis, P. New advancements, challenges and opportunities of multi-storey modular buildings—A state-of-the-art review. Eng. Struct. 2019, 183, 883–893. [Google Scholar] [CrossRef]
  5. Lu, Z.; Fan, Q.; Tian, W.; Li, J. Seismic performance analysis of steel frame installed with prefabricated external walls and new connection type. J. Build. Eng. 2024, 84, 108471. [Google Scholar] [CrossRef]
  6. Chen, J.; Xu, C.; El Naggar, H.M.; Du, X. Study on seismic performance and index limits quantification for prefabricated subway station structures. Soil Dyn. Earthq. Eng. 2022, 162, 107460. [Google Scholar] [CrossRef]
  7. Chen, J.; Xu, C.; El Naggar, H.M.; Du, X. Comparative study on seismic performance of prefabricated and cast-in-place underground structures under different site conditions. Soil Dyn. Earthq. Eng. 2023, 171, 107998. [Google Scholar] [CrossRef]
  8. Yang, X.; Lin, F. Research on prefabricated metro station structure and key assembly technologies. Tunn. Undergr. Space Technol. 2024, 153, 106029. [Google Scholar] [CrossRef]
  9. Zhao, N.; Xu, Y.; Xiang, S.; Song, Y. Pressure distribution lawon vertical plate of cellular-counterfort retaining structure. Alex. Eng. J. 2022, 61, 3735–3745. [Google Scholar] [CrossRef]
  10. Qu, L.; Li, X.; Kouroussis, G.; Zhao, X.; Peng, Y.; Yang, C.; Ding, X.; Connolly, D. Vertical Dynamic Impedance for Piles in Radially Weakened Soil. Int. J. Numer. Anal. Methods Geomech. 2025, 49, 2620–2633. [Google Scholar]
  11. Qiu, Z.; Liu, Y.; Meng, Q.; Li, Y.; Guo, W.; Cao, T. Study on the synergistic evolution of shape and size during particle breakage. Powder Technol. 2025, 465, 121343. [Google Scholar] [CrossRef]
  12. Qiu, Z.; Meng, Q.; Liu, Y.; Ma, A. Influence of stone content, relative density, and gradation on shear dilatancy characteristics of rock–soil mixtures. Mar. Georesources Geotechnol. 2025, 1–16. [Google Scholar] [CrossRef]
  13. Fu, T.; Saracho, A.C.; Haigh, S.K. Microbially induced carbonate precipitation (MICP) for soil strengthening: A comprehensive review. Biogeotechnics 2023, 1, 100002. [Google Scholar] [CrossRef]
  14. Zhang, J.; Yin, Y.; Shi, W.; Bian, H.; Shi, L.; Wu, L.; Han, Z.; Zheng, J.; He, X. Strength and uniformity of EICP-treated sand under multi-factor coupling effects. Biogeotechnics 2023, 1, 100007. [Google Scholar] [CrossRef]
  15. Jacobs, F.; Ruiken, A.; Ziegler, M. Investigation of kinematic behavior and earth pressure development of geogrid reinforced soil walls. Transp. Geotech. 2016, 8, 57–68. [Google Scholar] [CrossRef]
  16. Liu, Y.; Zhao, Y.; Zhang, D.; Liu, Z. The long-term mechanical performance of geogrid-reinforced soil retaining walls under cyclic footing loading. Case Stud. Constr. Mater. 2022, 17, e01642. [Google Scholar] [CrossRef]
  17. Johari, A.; Maroufi, M. System reliability analysis of geogrid reinforced retaining wall using random finite element method. Transp. Geotech. 2024, 48, 101316. [Google Scholar] [CrossRef]
  18. Yang, G.; Zhao, Y.; Wang, Z.; Wang, H. Performance of back-to-back geogrid reinforced soil retaining walls for railways during service. Transp. Res. Rec. 2021, 2675, 1115–1125. [Google Scholar] [CrossRef]
  19. Viswanadham, B.V.S.; Razeghi, H.R.; Mamaghanian, J.; Manikumar, C.H.S.G. Centrifuge model study on geogrid reinforced soil walls with marginal backfills with and without chimney sand drain. Geotext. Geomembr. 2017, 45, 430–446. [Google Scholar] [CrossRef]
  20. Cai, X.; Li, S.; Xu, H.; Jing, L.; Huang, X.; Zhu, C. Shaking table study on the seismic performance of geogrid reinforced soil retaining walls. Adv. Civ. Eng. 2021, 2021, 6668713. [Google Scholar] [CrossRef]
  21. Wang, X.; Li, X.; Zhu, C.; Diao, H.; Wang, K.; Huang, T.; Tu, J.; Que, Y. Full-Scale Experimental Study on Prefabricated Greening Ecological Retaining Walls. Sustainability 2022, 14, 11841. [Google Scholar] [CrossRef]
  22. Tiwary, A.K.; Bhatia, S.; Singh, S.; Chohan, J.S.; Kumar, R.; Sharma, S.; Chattopadhyaya, S.; Rajkumar, S. Performance comparison and critical finite element based experimental analysis of various forms of reinforcement retaining structural system. Math. Probl. Eng. 2022, 2022, 4434679. [Google Scholar] [CrossRef]
  23. Farhat, M.; Issa, M. Design principles of totally prefabricated counterfort retaining wall system compared with existing cast-in-place concrete structures. PCI J. 2017, 62, 89–106. [Google Scholar] [CrossRef]
  24. Lu, X.; Wu, H. Study on seismic performance of prestressed precast concrete walls through cyclic lateral loading test. Mag. Concr. Res. 2017, 69, 878–891. [Google Scholar] [CrossRef]
  25. Ferdous, W.; Almutairi, A.D.; Huang, Y.; Bai, Y. Short-term flexural behaviour of concrete filled pultruded GFRP cellular and tubular sections with pin-eye connections for modular retaining wall construction. Compos. Struct. 2018, 206, 1–10. [Google Scholar] [CrossRef]
  26. Javadi, M.; Hassanli, R.; Rahman, M.M.; Karim, M.R. Experimental study on cyclic behavior of post-tensioned segmental retaining walls (PSRWs). Eng. Struct. 2021, 229, 111619. [Google Scholar] [CrossRef]
  27. Ling, H.; Wang, X.; Lv, C.; Sun, Z.; Liu, L.; Wang, J. Predicting the fracture load of asphalt concrete under TPB test using POA-optimized machine learning methods. Constr. Build. Mater. 2025, 470, 140580. [Google Scholar] [CrossRef]
Figure 1. Schematic of monolithic prefabricated counterfort retaining wall.
Coatings 15 00841 g001
Figure 2. Schematic of modular prefabricated counterfort retaining wall.
Coatings 15 00841 g002
Figure 3. Schematic diagram of two connection methods for prefabricated counterfort retaining walls.
Coatings 15 00841 g003
Figure 4. Schematic diagram of geogrid.
Coatings 15 00841 g004
Figure 5. Method flowchart.
Coatings 15 00841 g005
Figure 6. Schematic diagram of stability calculation.
Coatings 15 00841 g006
Figure 7. Analytical model for horizontal panel elements.
Coatings 15 00841 g007
Figure 8. Schematic diagram of upright structure calculation.
Coatings 15 00841 g008
Figure 9. Prototype dimensions of prefabricated counterfort retaining walls. (a) Prototype dimensions of the monolithic and modular retaining walls. (b) Dimensions of the scaled monolithic model. (c) Dimensions of the scaled modular model.
Coatings 15 00841 g009aCoatings 15 00841 g009bCoatings 15 00841 g009c
Figure 10. Oven-drying of specimens.
Coatings 15 00841 g010
Figure 11. The standard Proctor compaction test.
Coatings 15 00841 g011
Figure 12. Direct shear test. Experimental procedure and typical results.
Coatings 15 00841 g012
Figure 13. Connection methods and models of prefabricated counterfort retaining walls.
Coatings 15 00841 g013
Figure 14. Schematic diagram of measurement and loading systems.
Coatings 15 00841 g014
Figure 15. Photographs of failure modes.
Coatings 15 00841 g015
Figure 16. Results of earth pressure tests. (a) Earth pressure on vertical slab. (b) Earth pressure on the counterfort. (c) Earth pressure on the base slab.
Coatings 15 00841 g016
Figure 17. Test results of Additional Horizontal Displacement. (a) Displacement on the vertical slab. (b) Displacement on the upright. (c) Displacement on the unit beam.
Coatings 15 00841 g017
Figure 18. Test results of Additional Strain. (a) Strain on the vertical slab. (b) Strain on the unit beam. (c) Strain on the upright.
Coatings 15 00841 g018
Figure 19. Test results for earth pressure on the vertical slab.
Coatings 15 00841 g019
Figure 20. Settlement of fill materials.
Coatings 15 00841 g020
Figure 21. Validation of physical model test by numerical simulation.
Coatings 15 00841 g021
Figure 22. Validation of numerical model against experimental data.
Coatings 15 00841 g022
Figure 23. Numerical model of full-scale prefabricated counterfort retaining wall.
Coatings 15 00841 g023
Figure 24. Distribution of horizontal interface stress for two retaining wall designs. (a) Definition of the component interfaces. (b) Interface stress between the base slab and the vertical components (slab and upright). (c) Interface stress between the counterfort and the vertical components (slab and upright).
Coatings 15 00841 g024
Table 1. Common similarity relations for static–elastic model.
CategoryPhysical QuantityDimensionSimilarity Relation
Material PropertiesStress ( σ ) F L 2 c σ = c E
Strain ( ε )—— c ε = 1
Elastic Modulus (E) F L 2 c E
Poisson’s Ratio ( μ )—— c μ = 1
Mass Density ( ρ ) F T 2 L 4 c ρ = c E / c l
Geometric PropertiesLength (l)L c l
Linear Displacement (x)L c x = c l
Area (A) L 2 c A = c l 2
Moment of Inertia (I) L 4 c I = c l 4
LoadingConcentrated Load (F)F c F = c E c l 2
Line Load (q) F L 1 c q = c E c l
Area Load (p) F L 2 c p = c E
Moment (M)FL c M = c E c l 3
Table 2. Key scaling parameters for experiment.
ParameterGeometric ScaleElastic ModulusUnit WeightStressLinear DisplacementArea Load
Similarity Constant c l c E c γ c σ c x c p
Similarity Ratio20101102010
Table 3. Test results for natural moisture content determination.
Specimen NumberConditionMass of Container + Sand (g)Mass of Container (g)Mass of Sands (g)Moisture Content (%)Average Moisture Content (%)
1Before oven-drying66.319.4156.900.710.68
After oven-drying65.919.4156.50
2Before oven-drying84.7011.3073.400.69
After oven-drying84.2011.3072.90
3Before oven-drying69.148.9260.220.65
After oven-drying68.758.9259.83
Table 4. Geogrid installation plan.
Case NumberCase Name
A-1No geogrid installed
A-29 layers of geogrid evenly distributed
A-33 layers of geogrid installed in the upper part of the fill material
A-43 layers of geogrid installed in the middle part of the fill material
A-53 layers of geogrid installed in the lower part of the fill material
Table 5. Design parameters of scaled physical model.
Component γ , kN/m3Cohesion, c, kPaAngle of Internal Friction, φ , ° Normal   Stiffness ,   K n Shear   Stiffness ,   K t
Retaining Wall16————————
Backfill18.620.5622.27————
Interface Elements——————1.27 × 1081.15 × 107
Table 6. Material properties of prototype.
ComponentUnit Weight, γ , kN/m3Cohesion, c, kPaAngle of Internal Friction, φ , ° Normal   Stiffness ,   K n Shear   Stiffness ,   K t
Retaining Wall24————————
Reinforcement Layer23————————
Pavement25————————
Weathered Rock Layer2310037————
Foundation Soil202030————
Subgrade20040————
Roadbed21035————
Interface Element——————1.41 × 1091.28 × 108
Disclaimer/Publisher’s Note: The statements, opinions and data contained in all publications are solely those of the individual author(s) and contributor(s) and not of MDPI and/or the editor(s). MDPI and/or the editor(s) disclaim responsibility for any injury to people or property resulting from any ideas, methods, instructions or products referred to in the content.

