Abstract
GTD 111 has been employed in first-stage blades in different gas turbines. The study of microstructural evolution is essential for the lifetime assessment and development of turbine blades. The microstructural stability of a 130 MW gas turbine first-stage blade at 800 °C was studied. The microstructure’s evolution was analyzed using scanning electron microscopy (SEM), transmission electron microscopy (TEM), and thermodynamic calculation. As thermal exposure time increases, the shape of γ′ precipitates changes from square to spherical. During thermal exposure, MC particles formed and coarsened along the grain boundaries, and primary MC carbide decomposed into the η phase and M23C6. The stability of MC carbide at the grain boundaries was lower than that within the grains. MC carbide precipitated at the grain boundaries tends to grow along the boundaries and eventually forms elongated carbide. High-resolution transmission electron microscopy (HRTEM) images indicate that the orientation of the γ′ precipitate changes during the coarsening process. The GTD 111 alloy can be deformed through dislocation shearing at 800 °C. The hardness value initially increases, then decreases with further exposure, which is related to the reduced precipitation strengthening by γ′ precipitates and the reduction in the hardness of the γ matrix.
1. Introduction
Cast Ni-based superalloys are crucial materials for industrial gas turbine blades. Gas turbine blades, especially first-stage turbine blades, are exposed to high temperature, stress, and corrosive environments, leading to microstructural and performance degradation [1,2,3,4], such as γ′ phase coarsening, MC carbide decomposition, and the precipitation of detrimental phases. The γ′ precipitate is the primary strengthening phase in Ni-based superalloys, and alterations in its morphology, size, and content significantly influence the alloy’s performance. Creep strength is reduced by the coarsening and dissolution of the γ′ phase at elevated temperatures [5,6]. The primary MC carbide is a thermodynamically metastable phase and decomposes into M23C6 carbide during service conditions [7]. MC and M23C6 carbides are (Nb,Ti)C-type and Cr23C6-type carbides, respectively [8]. MC is rich in transition metals, such as Nb and Ti elements. The common metal elements in M23C6 are transition metals such as Cr, Mo, and W. The substitution of Ti with Cr in MC is thermodynamically favorable and induces the formation of M23C6 carbides [9]. M23C6 carbide can also precipitate at the grain boundaries at high temperatures, which would reduce the bonding force of the grain boundaries and be harmful to mechanical properties [10,11]. Additionally, the η phase (hexagonal D024 structure) can form around MC carbide [12]. The key factor for η phase formation is Ti enrichment. Ö. Özgün et al. [13] investigated the influence of aging on the fracture toughness of the Ni-625 superalloy, indicating that the precipitation of carbides is one of the reasons for the decrease in fracture toughness. Previous studies have shown that the deformation mechanism of Ni-based alloys varies with the size of γ′ particles. L. Gao et al. [14] found that the dominant deformation mechanism changes from Orawan bypassing to dislocation shearing with the size of the γ′ precipitates increasing. However, Y.S. Wu et al. [15] reported a contrasting result in the GH984G alloy. Notably, the deformation temperatures are different in the aforementioned references, so the contrasting conclusions are likely due to temperature differences [16]. However, all these research results were based on laboratory-fabricated specimens, with a notable scarcity of experiments employing samples derived from gas turbine blades. It is important to consider that microstructure stability is crucial to the service performance and life of gas turbine blades. The microstructure evolution of gas turbine blades may differ from that in laboratory-fabricated specimens. Therefore, it is of great significance to investigate the microstructure evolution of commercial gas turbine blades.
This study investigated the microstructural stability of samples from a 130 MW gas turbine first-stage blade under thermal exposure at 800 °C, and the influence of long-term exposure was analyzed through a combination of experiments and thermodynamic calculation. The results may provide valuable insights for assessing the blade’s service performance and lifespan, as well as for structural optimization.
2. Methodology
A 130 MW gas turbine first-stage blade was selected for this study. Previous fluid calculations indicate that the average temperature of the pressure surface and suction surface during service is 818 °C. Therefore, the thermal exposure temperature in this study is set at 800 °C. The blade used in the present study was cast from the Ni-based superalloy GTD 111 (Cannon-Muskegon, Muskegon, MI, USA). Samples with a size of 20 mm × 10 mm × 10 mm were wire-cut from the middle part of the airfoil. The specimens were thermal-exposed at 800 °C in a calibrated resistance furnace and then air-cooled to room temperature. The chemical composition was determined by the Thermo ARL-ARL 4460 Optical Emission Spectrometer (Thermo Fisher Scientific, Waltham, MA, USA), as shown in Table 1.

Table 1.
The chemical constituents of the sample (wt.%).
The samples were thermally exposed at 800 °C for different times (500 h, 1600 h, and 3000 h) in a preheated resistance furnace. The microstructures were characterized by a Zeiss Sigma 500 SEM (Zeiss, Jena, Germany) in the back-scattered electron (BSE) mode, operating at 20 kV. Energy-dispersive spectroscopy (EDS) was adopted to analyze the constituents. SEM samples were ground with SiC paper and polished with diamond paste; then chemical etching (50 g copper sulfate, 160 mL hydrochloric acid, 10 mL sulfuric acid, and 200 mL distilled water) was conducted. Phase compositions were detected by X-ray diffraction (XRD). Thermo-Calc 2022b was also adopted to calculate the phase compositions of GTD 111, and the Thermo-Calc database used in this study is TCNI8. The XHVT-10Z (Shanghai Shangcai Testermachine Co., Ltd., Shanghai, China) intelligent digital display Vickers hardness tester was employed to measure material hardness. The Vickers hardness test operated on the principle of elastic and plastic deformation in materials. During testing, a diamond indenter was pressed into the material surface under a 2000 N load. By precisely controlling and measuring the indentation size, the tester indirectly evaluates the material’s Vickers hardness. TEM observation was conducted on a Talos F200X G2 TEM (Thermo Fisher Scientific, Waltham, MA, USA) operating at 200 kV. The disks used for TEM analysis were polished by twin-jet electropolishing at 30 V and −30 °C.
3. Results and Discussion
3.1. Microstructural Characteristics Before Exposure
The optical micrograph (Figure 1a) reveals a clear dendritic structure. Irregular precipitates were mainly distributed in interdendritic regions and within the grains. Additionally, γ + γ′ eutectic areas were observed along the grain boundaries (Figure 1b) and between the dendrites, which is due to solidification segregation. During solidification, certain alloying elements (such as Cr, Co, W, and Mo) tend to become enriched in the dendrite cores, while some others accumulate in the remaining melt. γ + γ′ eutectic areas are formed when the composition and temperature of the melt approach the eutectic point. The EDS results (Table 2) reveal that the bulk precipitates are MC carbide, with sizes ranging from 4 to 32 μm. Due to the difference in the elastic modulus between MC carbide and the matrix [17], cracks may occur during the startup and shutdown of the gas turbine. From the magnified image (upper left corner of Figure 1b), a few fine precipitates disperse along the grain boundaries, which are M23C6 carbide [2]. From the results of R. Hu’s research [18], interfacial energy and grain boundary character have great influence on M23C6 precipitation, while M23C6 carbide only forms at the grain boundaries with large angles due to high interfacial energy.
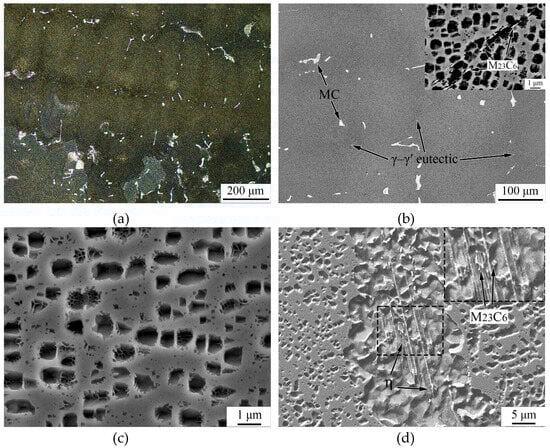
Figure 1.
Microstructure of sample before exposure. (a) Optical micrograph, (b) SEM-BSE micrograph showing distribution of MC and grain boundary, (c) morphology of γ′ precipitates, (d) morphologies of γ–γ′ eutectic areas.
Table 2.
EDS results of carbides in microstructure (wt.%).
The cubic primary γ′ precipitates (~0.63 μm) and fine spherical secondary γ′ precipitates are distributed within the γ matrix (Figure 1c). As shown in Figure 1d, the needle-like phase was observed within the γ–γ′ eutectic area. B.G. Choi’s [2] research revealed that this phase is η (Ni3Ti), and the orientation relationship between the η phase and γ matrix is {0001}η//{111}γ and <11
0>η//<1
0>γ [19,20]. Small precipitates appear next to the η phase. The EDS results indicate that these precipitates are M23C6 carbide. According to K.L. Hou’s study [20], M23C6 carbide is produced by the reaction of γ→M23C6 + η during over-aging at 900 °C. In this study, the cooling hole coating was prepared by chemical vapor deposition (CVD), with the Al infiltration temperature ranging from 950 to 1000 °C [21]. Therefore, the η phase observed in the eutectic region likely formed during the preparation of the Al infiltration layer.
3.2. Phase Composition After Exposure
Figure 2 illustrates the microstructure evolution after thermal exposure at 800 °C for 500 h, 1600 h, and 3000 h. The size and morphology of the grains, as well as the morphology of the primary MC carbide, show no significant changes after exposure. After exposure for 500 h, MC carbide chains (bright-contrast particles) appear along the grain boundaries, as indicated by the arrows (Figure 2a). As exposure time increased, these particles continue to coarsen and connect with each other, eventually forming elongated carbides along the grain boundaries after exposure for 1600 h, with lengths of several tens of micrometers (Figure 2a,b). Such MC carbide along grain boundaries also appeared during the aging process in the 740H superalloy [22] and a new wrought γ2032-hardened Ni-based superalloy [23]. The distribution and morphology of MC carbide significantly impact performance, such as tensile and creep strength [23,24,25]. Large MC carbide could hinder dislocation movement and cause stress concentration, leading to crack formation and reducing mechanical properties [26].
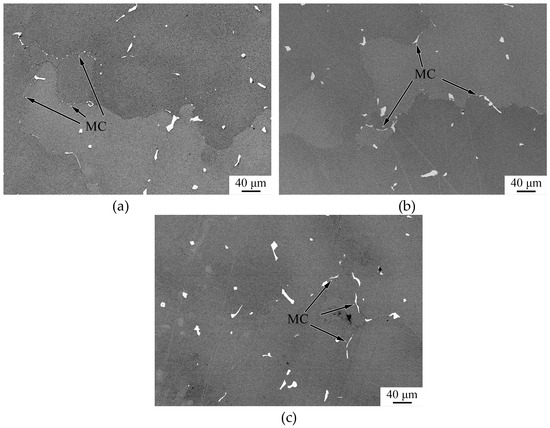
Figure 2.
SEM-BSE images of the samples after exposure: MC particles formed and coarsened at the grain boundaries, eventually connecting with each other. Images at (a) 500 h, (b) 1600 h, and (c) 3000 h.
3.3. Evolution of γ′ Precipitates
Since GTD 111 is primarily strengthened by γ′ precipitation, the high-temperature thermal stability of the γ′ phase is crucial for service life. After exposure for 500 h, the primary γ′ precipitates still maintain their cubic shape, but the sizes of the primary γ′ precipitates increased (Figure 3). The average size of the primary γ′ phase increased from 0.63 μm to 0.70 μm. When the thermal exposure time reached 1600 h (Figure 3b) and 3000 h (Figure 3c), the cubic γ′ precipitates became spherical, with average sizes of 0.83 μm and 0.89 μm, respectively. During the calculation of the average size, more than 100 primary γ′ precipitates were randomly selected. As shown in Figure 3b, the secondary γ′ precipitates near the primary γ′ precipitates dissolved, while those farther away underwent coarsening and aggregation. During the coarsening process, γ′-forming elements (such as Al and Ti) diffused into the γ′ precipitates, while γ-forming elements diffused into the surrounding γ matrix, causing the secondary γ′ particles around the primary γ′ precipitates to become unstable and dissolve. Figure 4 shows the mean diameter of primary γ′ after exposure.
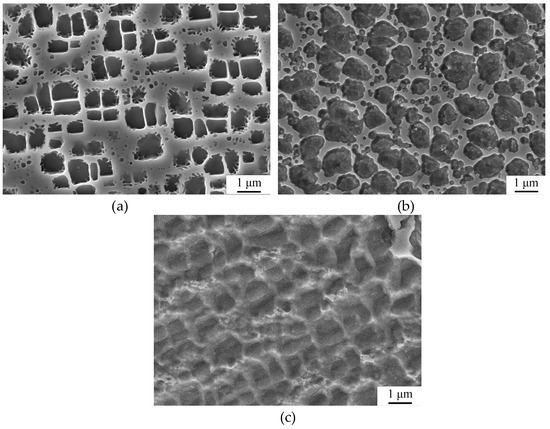
Figure 3.
SEM images of γ′ particles after exposure at 800 °C: (a) 500 h; (b) 1600 h; (c) 3000 h. The shape of the γ′ precipitates changed from square to spherical during exposure.
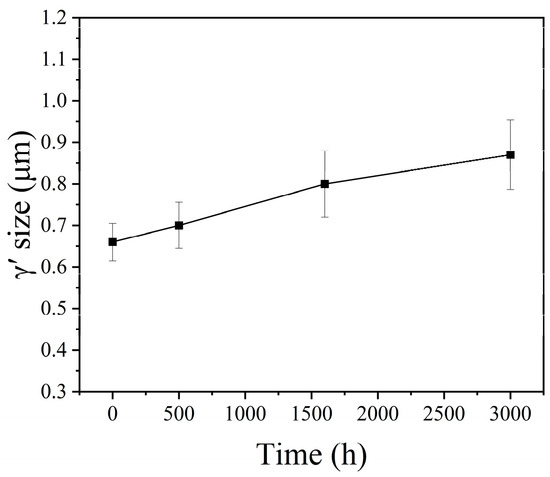
Figure 4.
The mean diameter of primary γ′ after exposure.
Figure 5a shows an HRTEM image of the γ/γ′ interface after exposure for 1600 h. The Fast Fourier transform (FFT) of Figure 5a (upper right corner) indicates that the HRTEM image was recorded along the [110]γ//[110]γ′ zone axis. Figure 5b,c present the FFT images of area I and area II in Figure 5a, respectively. Compared to Figure 5c, the diffraction spots corresponding to the (1
0)γ and (001)γ lattice planes in Figure 5b have disappeared, indicating that area I is the γ matrix and area II is the γ′ precipitate. The γ′ phase is an L12 structure and has a cube–cube orientation relationship with the γ matrix. No distinct interface can be distinguished between the γ matrix and the γ′ precipitate, attributed to their similar lattice parameters [27].

Figure 5.
TEM characterization of γ/γ′ interface: (a) HRTEM graph. (b) and (c) are FFT images of area I and area II in (a), respectively.
Figure 6a presents another HRTEM image of the γ/γ′ interface, where the white dashed line represents the interface. The area to the left of the dashed line corresponds to the γ′ precipitate, while the area to the right corresponds to the γ matrix. Figure 6b shows the FFT image of 6a; the diffraction spots of the γ matrix and γ′ precipitate do not completely overlap, suggesting that the orientation of the γ′ precipitate was altered during the coarsening process. Measurements indicate that the orientation difference between (2
2)γ and (2
2)γ′ is 1.7°.
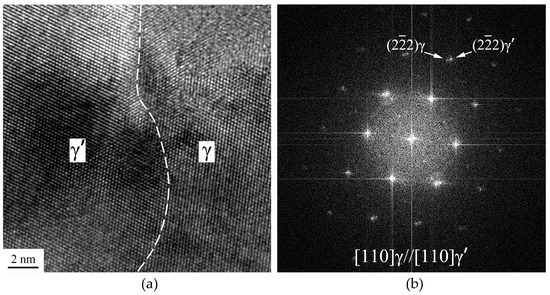
Figure 6.
(a) HRTEM image; (b) FFT image of (a), indicating that orientation of γ′ precipitate was altered during coarsening process.
3.4. Evolution of MC Carbide During Exposure
After exposure to 800 °C, MC carbide became unstable. As shown in Figure 7, a darker region appears around MC carbide, with a thin darker layer forming at its boundaries. The EDS results indicate that the darker layer is the η phase, which contains higher amounts of Ni (Table 3). The MC carbides in Figure 7a,b are all located within the grains.
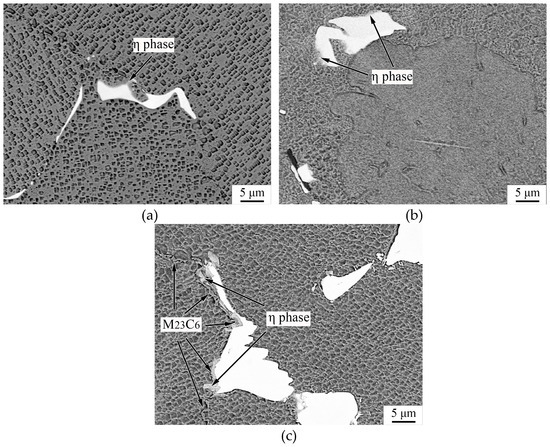
Figure 7.
SEM-BSE images of MC carbide after thermal exposure at 800 °C; M23C6 carbide and η phase are distributed at boundaries of MC carbide. Images at (a) 500 h, (b) 1600 h, and (c) 3000 h.
Table 3.
EDS results of η phase in Figure 7c (wt.%).
After thermal exposure for 3000 h, the amount of η phase did not significantly increase, indicating that the stability of primary MC within the grains is relatively good. However, the primary MC located at the grain boundaries is not as stable as that within the grains. After 3000 h of thermal exposure, the amount of η phase produced from MC carbide was significantly higher at the grain boundaries than within the grains. This is due to the higher element diffusion at the grain boundaries. During the decomposition, the Ti, C, Ta, and W elements from the MC carbide diffuse into the matrix, while the Cr, Ni, and Al elements from the matrix diffuse into the MC carbide region. In addition to the η phase, M23C6 carbides also appear around the MC carbide. It is worth noting that both M23C6 carbide and the η phase are distributed at the boundaries of MC carbide, while no M23C6 carbide or η phase is found inside the MC carbide. Therefore, the γ phase or γ′ phase should also have been involved in the decomposition of the MC carbide. As indicated by a previous study [28], the decomposition may be described by the phase transformation γ + MC → η + M23C6.
Based on the main components of the GTD 111 alloy, the phase composition within the temperature range of 400 °C to 1000 °C was obtained using thermodynamic calculation methods. At 800 °C, the alloy consists of γ, γ′, M23C6, and η (Figure 8), with their contents being 0.482, 0.478, 0.022, and 0.018, respectively. According to the calculation, MC carbide is unstable in the temperature range of 883.0 °C to 1000.9 °C and will decompose into M23C6. At temperatures below 883.0 °C, MC carbide will completely decompose into the M23C6 phase and η phase. Choi’s study [2] found that MC carbide can completely decompose into the η phase and M23C6 at 871 °C and 927 °C. When the temperature increases to 982 °C, the η phase disappears, and MC carbide decomposes into M23C6 carbide. These results suggest that the stable temperature range for the η phase should be higher than the calculated results. Figure 2c and Figure 7c show that a significant amount of MC carbide still remains after 3000 h of exposure (about 12%), indicating that equilibrium has not been reached.
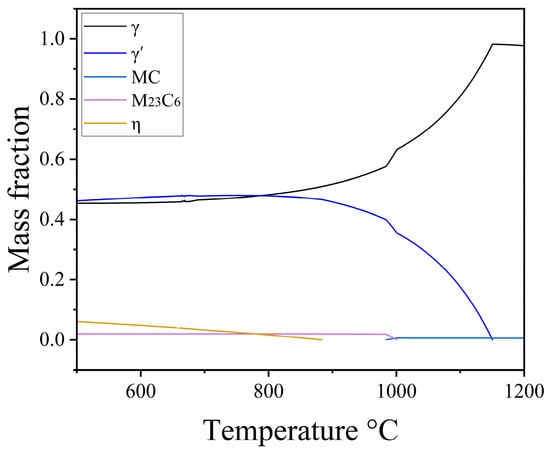
Figure 8.
Phase composition of GTD 111 alloy.
3.5. Dislocation Distribution
Figure 9a,b illustrate the dislocation distributions after exposure for 1600 h and 3000 h, respectively. Dislocations are primarily distributed within the γ matrix, and limited dislocations are observed in γ′ precipitate particles, as pointed out in Figure 9 (the arrows). Therefore, the GTD 111 alloy can be deformed through dislocation shearing at 800 °C. C.H. Chu [29] investigated the deformation mechanisms of a Co-Ni-based superalloy at different temperatures. The results reveal that the deformation mechanism would change from dislocation and stacking fault shearing to dislocation pileups and climbing in the γ phase as the deformation temperature increases.
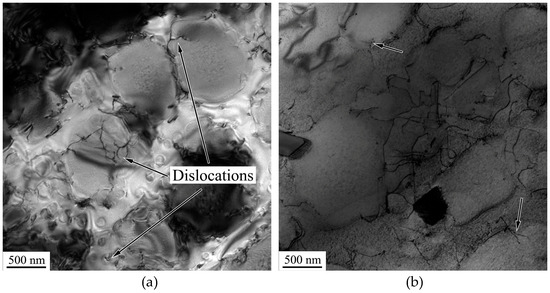
Figure 9.
(a) and (b) show dislocation distribution in samples after thermal exposure for 1600 h and 3000 h, respectively.
3.6. Hardness
The variation in Vickers hardness (HV) due to exposure was investigated through hardness tests. As shown in Figure 10, the hardness value initially increases as exposure time is increased up to 500 h, then continuously decreases with further exposure. J.H. Oh’s [30] study revealed that the strength of superalloys increases with the size of γ′ precipitates until reaching a critical diameter. In the present study, the average size of the primary γ′ precipitate in the sample after exposure for 500 h is approximately 0.7 μm (Figure 3a). On one hand, the formation and growth of M23C6 carbide and the η phase reduce the content of solid solution strengthening elements (such as Cr and Al) in the γ phase, leading to a decrease in the hardness of the γ matrix. On the other hand, the growth of the η phase increases the concentration of other elements (such as Ti) in the matrix, resulting in an increase in the hardness of the γ matrix. Therefore, the initial increase in hardness may be attributed to precipitation strengthening by γ′ precipitates, while the subsequent decrease in hardness is likely due to the reduced precipitation strengthening by γ′ precipitates and the reduction in the hardness of the γ matrix.
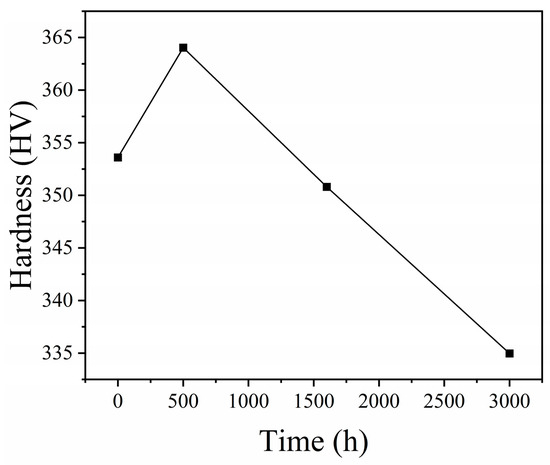
Figure 10.
Variation in HV after thermal exposure at 800 °C.
4. Conclusions
In this study, the microstructure evolution behavior of a 130 MW gas turbine first-stage blade at 800 °C was investigated. The results may be helpful for the assessment of the blade’s service performance and life, as well as structure optimization. The main results are summarized as follows:
- (1)
- As exposure time increases, cubic γ′ precipitates changes become spherical in shape, and their size increases from the initial 0.63 μm to 0.89 μm after 3000 h.
- (2)
- During thermal exposure, MC particles formed and coarsened along the grain boundaries, and primary MC carbide decomposed into M23C6 and the η phase. MC located at the grain boundaries is not as stable as that within the grains.
- (3)
- The orientation of the γ′ precipitate was altered during the coarsening process. The GTD 111 alloy can be deformed through dislocation shearing at 800 °C.
- (4)
- The hardness value initially increases as exposure time increases, then continuously decreases with further exposure, which is related to the reduced precipitation strengthening by γ′ precipitates and the reduction in the hardness of the γ matrix.
Author Contributions
Formal analysis, X.W. and Y.C.; Investigation, X.W. and Y.C.; Methodology, Y.Z. (Yang Zhou) and J.W.; Resources, Y.Z. (Yang Zhou); Supervision, J.W.; Validation, Z.L. and Y.Z. (Yuzhu Zhao); Writing—original draft, X.W.; Writing—review and editing, X.W., Y.C., Y.Z. (Yang Zhou), Z.L., Y.Z. (Yuzhu Zhao), and J.W. All authors have read and agreed to the published version of the manuscript.
Funding
This research was funded by the Zhejiang Provincial Postdoctoral Science Foundation (299342) and Young Elite Scientists Sponsorship Program by CSEE (CSEE-YESS-2023003).
Institutional Review Board Statement
Not applicable.
Informed Consent Statement
Not applicable.
Data Availability Statement
Data are contained within the article.
Conflicts of Interest
Authors Xuyang Wang, Ze Li and Yuzhu Zhao were employed by the company Huadian Electric Power Research Institute Co., Ltd. The remaining authors declare that the research was conducted in the absence of any commercial or financial relationships that could be construed as a potential conflict of interest.
Abbreviations
The following abbreviations are used in this manuscript:
| HRTEM | High-resolution electron microscopy |
| SEM | Scanning electron microscopy |
| BSE | Back-scattered electron |
| EDS | Energy-dispersive spectroscopy |
| XRD | X-ray diffraction |
| TEM | Transmission electron microscopy |
| LSW | Lifshitz–Slyozov–Wagner |
| FFT | Fast Fourier transform |
References
- Pan, Y.M.; Zhang, L.F.; Huang, Z.W.; Jiang, L. Coarsening behavior of γ′ precipitates of single crystal Ni-based superalloys during long-term exposure. Mater. Lett. 2019, 241, 210–213. [Google Scholar] [CrossRef]
- Choi, B.G.; Kim, I.S.; Kim, D.H.; Jo, C.Y. Temperature dependence of MC decomposition behavior in Ni-base superalloy GTD 111. Mat. Sci. Eng. A 2008, 478, 329–335. [Google Scholar] [CrossRef]
- Sun, W.; Qin, X.Z.; Guo, J.T.; Lou, L.H.; Zhou, L.Z. Microstructure stability and mechanical properties of a new low cost hot-corrosion resistant Ni–Fe–Cr based superalloy during long-term thermal exposure. Mater. Des. 2015, 69, 70–80. [Google Scholar] [CrossRef]
- Ruan, J.J.; Ueshima, N.; Oikwa, K. Phase transformations and grain growth behaviors in superalloy 718. J. Alloys Compd. 2018, 737, 83–91. [Google Scholar] [CrossRef]
- Shingledecker, J.P.; Evans, N.D.; Pharr, G.M. Influences of composition and grain size on creep–rupture behavior of Inconel® alloy 740. Mat. Sci. Eng. A 2013, 578, 277–286. [Google Scholar] [CrossRef]
- Evans, N.D.; Maziasz, P.J.; Swindeman, R.W.; Smith, G.D. Microstructure and phase stability in INCONEL alloy 740 during creep. Scr. Mater. 2004, 51, 503–507. [Google Scholar] [CrossRef]
- Ferreri, C.N.; Vogel, C.S.; Knezevic, M. Determining volume fractions of γ, γ′, γ″, δ, and MC-carbide phases in Inconel 718 as a function of its processing history using an advanced neutron diffraction procedure. Mat. Sci. Eng. A 2020, 781, 139228. [Google Scholar] [CrossRef]
- Zhao, S.Q.; Xie, X.S.; Smith, G.D.; Patel, S.J. Research and Improvement on structure stability and corrosion resistance of nickel-base superalloy INCONEL alloy 740. Mater. Des. 2006, 27, 1120–1127. [Google Scholar] [CrossRef]
- Song, X.Q.; Wang, Y.X.; Zhao, X.X.; Zhang, J.; Li, Y.; Wang, Y.F.; Chen, Z. Analysis of carbide transformation in MC-M23C6 and its effect on mechanical properties of Ni-based superalloy. J. Alloys Compd. 2022, 91, 164959. [Google Scholar] [CrossRef]
- Gao, S.; Hou, J.S.; Guo, Y.A.; Zhou, L.Z. Phase precipitation behavior and tensile properties of as-cast Ni-based superalloy during heat treatment. Trans. Nonferrous Met. Soc. China 2018, 28, 1735–1744. [Google Scholar] [CrossRef]
- Hou, K.L.; Wang, M.; Ou, M.Q.; Li, H.Z.; Hao, X.C.; Ma, Y.C.; Liu, K. Effects of microstructure evolution on the deformation mechanisms and tensile properties of a new Ni-base superalloy during aging at 800 °C. J. Mater. Sci. Technol. 2021, 68, 40–52. [Google Scholar] [CrossRef]
- Jahangiri, M.R.; Arabi, H.; Boutorabi, S.M.A. Investigation on the dissolution of η phase in a cast Ni-based superalloy. Int. J. Min. Met. Mater. 2013, 20, 42–48. [Google Scholar] [CrossRef]
- Özgün, Ö.; Yılmaz, R.; Gülsoy, Ö.H.; Fındık, F. The effect of aging treatment on the fracture toughness and impact strength of injection molded Ni-625 superalloy parts. Mater. Charact. 2015, 108, 8–15. [Google Scholar] [CrossRef]
- Gao, L.; Song, C.Q.; Zhu, H.; Zheng, B.Y.; Liu, X.L.; Wu, Y.D.; Hui, X.D. Microstructural Stability and Mechanical Properties of a Novel Weldable Ni-based Superalloy during Thermal Exposure at 800 °C. J. Mater. Eng. Perform. 2025. [Google Scholar] [CrossRef]
- Wu, Y.S.; Qin, X.Z.; Wang, C.S.; Zhou, L.Z. Microstructural evolution and its influence on the impact toughness of GH984G alloy during long-term thermal exposure. J. Mater. Sci. Technol. 2021, 60, 61–69. [Google Scholar] [CrossRef]
- Chen, J.J.; Wang, S.L.; Lai, K.W.; Sang, P.; Qin, Q.Q.; Li, Y.S. Rafting and redissolution of γʹ phase in Ni–Al alloy under external stress. Heliyon 2023, 9, e23093. [Google Scholar] [CrossRef]
- Jiang, H.; Xiang, X.M.; Dong, J.X. The morphology and characteristics evolution of MC carbide during homogenization in hard-to-deform superalloy GH4975. J. Alloys Compd. 2022, 929, 167086. [Google Scholar] [CrossRef]
- Hu, R.; Bai, G.H.; Li, J.S.; Zhang, J.Q.; Zhang, T.B.; Fu, H.Z. Precipitation behavior of grain boundary M23C6 and its effect on tensileproperties of Ni–Cr–W based superalloy properties of Ni–Cr–W based superalloy. Mater. Sci. Eng. A 2012, 548, 83–88. [Google Scholar] [CrossRef]
- Hu, X.B.; Guo, X.W.; Wang, Y.J.; Hou, J.S.; Qin, X.Z.; Zhou, L.Z.; Liu, J.F.; Ma, X.L. Microstructural characterization of the η-Ni3(Ti, Al) phase in a long-term-aged Ni-based superalloy. Philos. Mag. Lett. 2017, 97, 442–449. [Google Scholar] [CrossRef]
- Hou, K.; Ou, M.; Xing, W.; Ma, G.; Hao, X.; Wang, M.; Ma, Y. The formation of η-Ni3Ti phase microstructure in a cast nickel-based superalloy with high Ti/Al ratio. J. Mater. Res. Technol. 2024, 29, 764–778. [Google Scholar] [CrossRef]
- Zhou, Y.; Xie, F.; Cheng, L.F.; Xu, H.; Wang, X.Y.; Yu, D.Q. Optimize Design and Manufacture of 130MW Gas Turbine First Stage Blade. In Proceedings of the 2022 IEEE 6th Conference on Energy Internet and Energy System Integration, Chengdu, China, 11–13 November 2022; pp. 2749–2754. [Google Scholar]
- Jiang, H.; Dong, J.X.; Zhang, M.C. The phase decomposition with related element interaction and redistribution during long term aging of 740H superalloy. J. Alloys Compd. 2019, 782, 323–333. [Google Scholar] [CrossRef]
- Liu, H.; Zhao, X.B.; Yuan, Y.; Dang, Y.Y.; Li, W.Q.; Xu, J.C.; Cheng, Y.; Yue, Q.Z.; Gu, Y.F.; Zhang, Z. Influence of thermal exposure on microstructural stability and tensile properties of a new Ni-base superalloy. J. Mater. Res. Technol. 2022, 21, 4462–4472. [Google Scholar] [CrossRef]
- Liu, L.R.; Jin, T.; Zhao, N.R.; Sun, X.F.; Guan, H.R.; Hu, Z.Q. Formation of carbides and their effects on stress rupture of a Ni-base single crystal superalloy. Mat. Sci. Eng. A 2003, 361, 191–197. [Google Scholar] [CrossRef]
- He, L.Z.; Zheng, Q.; Sun, X.F.; Hou, G.C.; Guan, H.R.; Hu, Z.Q. M23C6 precipitation behavior in a Ni-base superalloy M963. J. Mater. Sci. 2005, 40, 2959–2964. [Google Scholar] [CrossRef]
- Yin, H.F.; Gao, Y.M.; Gu, Y.F. Effects of long term thermal exposure on microstructure and mechanical property evolution of a new wrought Ni–Fe based superalloy. Mater. Des. 2016, 105, 66–74. [Google Scholar] [CrossRef]
- Connor, L.D.; Stone, H.J.; Collins, D.M.; Preuss, M.; Hardy, M.C.; Rae, C.M.F. The Effect of Cooling Rate from Solution on the Lattice Misfit During Isothermal Aging of a Ni-Base Superalloy. Metall. Mater. Trans. A 2014, 45, 2436–2444. [Google Scholar] [CrossRef]
- Qin, X.Z.; Guo, J.T.; Yuan, C.; Chen, C.L.; Hou, J.S.; Ye, H.Q. Decomposition of primary MC carbide and its effects on the fracture behaviors of a cast Ni-base superalloy. Mat. Sci. Eng. A 2008, 485, 74–79. [Google Scholar] [CrossRef]
- Chu, C.H.; Guo, Q.Y.; Guan, Y.; Qiao, Z.X.; Liu, Y.C. Deformation mechanisms of a γʹ phase strengthened CoNi-based superalloy at high temperatures. Mat. Sci. Eng. A 2002, 833, 142587. [Google Scholar] [CrossRef]
- Oh, J.H.; Choi, I.C.; Kim, Y.J.; Yoo, B.G.; Jang, J.I. Variations in overall- and phase-hardness of a new Ni-based superalloy during isothermal aging. Mat. Sci. Eng. A 2011, 528, 6121–6127. [Google Scholar] [CrossRef]
Disclaimer/Publisher’s Note: The statements, opinions and data contained in all publications are solely those of the individual author(s) and contributor(s) and not of MDPI and/or the editor(s). MDPI and/or the editor(s) disclaim responsibility for any injury to people or property resulting from any ideas, methods, instructions or products referred to in the content. |
© 2025 by the authors. Licensee MDPI, Basel, Switzerland. This article is an open access article distributed under the terms and conditions of the Creative Commons Attribution (CC BY) license (https://creativecommons.org/licenses/by/4.0/).