Abstract
Molybdenum disulfide is more attractive and valuable at the molecular level due to its unique structure and exceptional properties. Here, new-type MoS2-ring chains are constructed and theoretically investigated for relevant electronic properties influenced by the length of the chain and the bias. Different from traditional wires, our findings demonstrate that the conductance of such a new-type chain presents unusually non-exponential decay with the length of the chain, with a particularly anomalous length of seven rings, which shows stronger equilibrium conductance than a shorter four-ring chain. Multi-peaks of electron transmission and delocalized electronic states contribute such uniqueness. Mo atoms play a vital role in electron transport. Essentially, a narrower “HOMO-LUMO” (the two closest energy levels to the Fermi level of MoS2-ring chain) gap compensates for the lower device density of states of new-type molybdenum disulfide-ring chains. The usual electronic structure of a seven-ring chain is derived from its slightly arched structure and mainly originates from interference, which is the resonance occurring between the electrodes. Noticeably, the bias could greatly enhance conductance, which could reach 1000 times more than the equilibrium conductance. At a certain bias, the conductance of a seven-ring chain even exceeds the shortest one- or two-ring chain. Furthermore, the threshold voltage (at which the maximum conductance appears) gradually decreases with the length of the chain and eventually remains at 0.7 V. The valuable negative differential resistance (NDR) effect could be found in such a molecular chain, which becomes more obvious as the length rises until the seven-ring chain reaches the peak. Our findings shed light on the relations between electronic properties and the length of a new-type molybdenum disulfide-ring chain, and provide support for such new-type chains in applications of innovative low-power and controllable electronics.
1. Introduction
The search for molecular nanowires has been subject to many studies in the last couple of decades, with the relationship between the electron transport mechanism and molecular chain length always being the core issue [1,2].
The conductance of traditional organic conjugated molecular lines (such as OPEs and OPVs) drops with length, and long-chain molecules are vulnerable to outside disturbances. Zheng et al. [3] successfully designed and synthesized a series of oligo(phenylene ethynylene) compounds (OPEs), and they found that conductance depends on the molecular length and substituent group. Wandlowski’s laboratory [4,5] has used the scanning tunneling microscope (STM-BJ) technique to quantitatively analyze the Pyridyl end-capped oligoyne series. The measured attenuation of constant β ranges from 1.75 to 5.4 nm−1 to reveal the exponential attenuation nature of the electron wave function in conjugated chains. This attenuating behavior can be attributed to two charge transport regimes [2]: non-resonant tunneling for short molecules and incoherent hopping for longer molecular systems. Single-molecule wires typically act as tunnel barriers, and their conductance decays exponentially by molecular length [6].
It is clear that the practical utility of molecular wires will be limited in future molecular-scale circuitry since their structural stability decreases significantly with chain elongation [5,7,8]. Thus, it is critical to investigate new-type molecular wires with controllable conductance decay and robust structural stability, because this is essential for improving our comprehension of electron transport [9,10] and establishing definitive structure–property relationships [11,12]. The innovative design of the assembled molecular wires further expands the performance boundaries of molecular wires. Recently, Li et al. [13] designed porphyrin–graphene nanoribbon (GNR) molecular wires. This work innovatively revealed that, in equilibrium, the conductance of the newly molecular wires shows a non-monotonic “odd–even” difference in length: the conductivity of “even” number wires is significantly better than that of “odd” number wires and even increases with length. This is quite different from the exponential decay of pure GNR wires. Song et al. [14] designed C2N-ring-based molecular chains at the molecular level and theoretically showed that a valuable negative differential resistance (NDR) effect appeared in longer molecular chains with an even number of big carbon–nitrogen rings and strengthened with size. The research of novel two-dimensional molecular materials has attracted extensive attention from academia and industry in many fields such as field effect transistors, logic circuits, and memory devices [15,16,17].
It is noteworthy that transition metal chalcogenides (TMDCs) are emerging molecular wire materials, and that their multi-dimensional structural properties provide a new dimension for performance regulation. Among many TMDCs, MoS2, as a typical representative, has experienced a systematic exploration of its multi-dimensional structural properties and performance modulation, from 3D bulk materials to 2D monolayers and 1D nanostructures.
Three-dimensional bulk systems and hierarchical composites achieve functional enhancement by integrating low-dimensional elements such as nanosheets and nanospheres. For example, the 3D heterojunction catalyst (e.g., 1T0.81-MoS2@Ni2P) designed by Liu et al. [18] exhibited excellent hydrogen evolution reaction (HER) activity and stability over a wide pH range through interfacial electron modulation. Hierarchical 3D flower-like MoS2 spheres provide fast pathways for gas diffusion with mesoporous structures, and their sensor response time is 50% shorter than that of conventional materials [19]. In addition, a uniform mesoporous MoS2 foam (mPF-MoS2) has vertically aligned layers to provide abundant active edge sites [20].
Two-dimensional monolayers, as the core form of MoS2, are outstanding in photocatalysis, adsorption, and energy storage due to their monolayer direct bandgap (~1.8 eV) and ultra-high specific surface area (e.g., 185.5 m2/g of nanoflowers). The 2D nanoflowers synthesized by Joshi et al. contributed to the removal of 96% rhodamine-B dye and 85% Ciprofloxacin [21]. Wang et al. developed MoS2 nanoplates that have a high reversible discharge capacity up to 994.6 mAh/g [22]. Their weak interlayer interactions also confer excellent lubrication properties to the material, making them widely used in MEMS and coating materials.
One-dimensional nanostructures (e.g., nanowires, nanotubes) have attracted attention due to their unique edge states and confinement effects. Xu et al. [23] prepared MoS2 nanowires with a width of less than 1 nm via the surface template technique. They found that the jagged edges in their bilayer structure formed defects by sharing Mo/S atoms, and that the edge state electronic structure could be modulated by Coulomb force interactions. Hierarchical MoS2 tubular structures could significantly enhance the capacity and cycling stability of lithium-ion batteries by increasing the specific surface area and active sites [24]. In addition, nanotube technology based on MoO3 sulfide transformation provides a controllable synthesis pathway for high-performance gas sensors [25]. It is worth mentioning that the combined 1D nanowire and nanotube structures incorporating a MoS2 shell would have a significantly enhanced electrochemical performance due to the interface passivation effect [26,27]. However, there is little research on the electron transport properties of MoS2 at the single-molecule level.
Therefore, this study aims to systematically investigate the electron transport ability of one new-type MoS2 molecular wires by theoretical calculations and simulations, especially under different size and voltage conditions. Through these studies, we expect to provide theoretical support for the design of multifunctional molecular devices.
2. Materials and Computational Methods
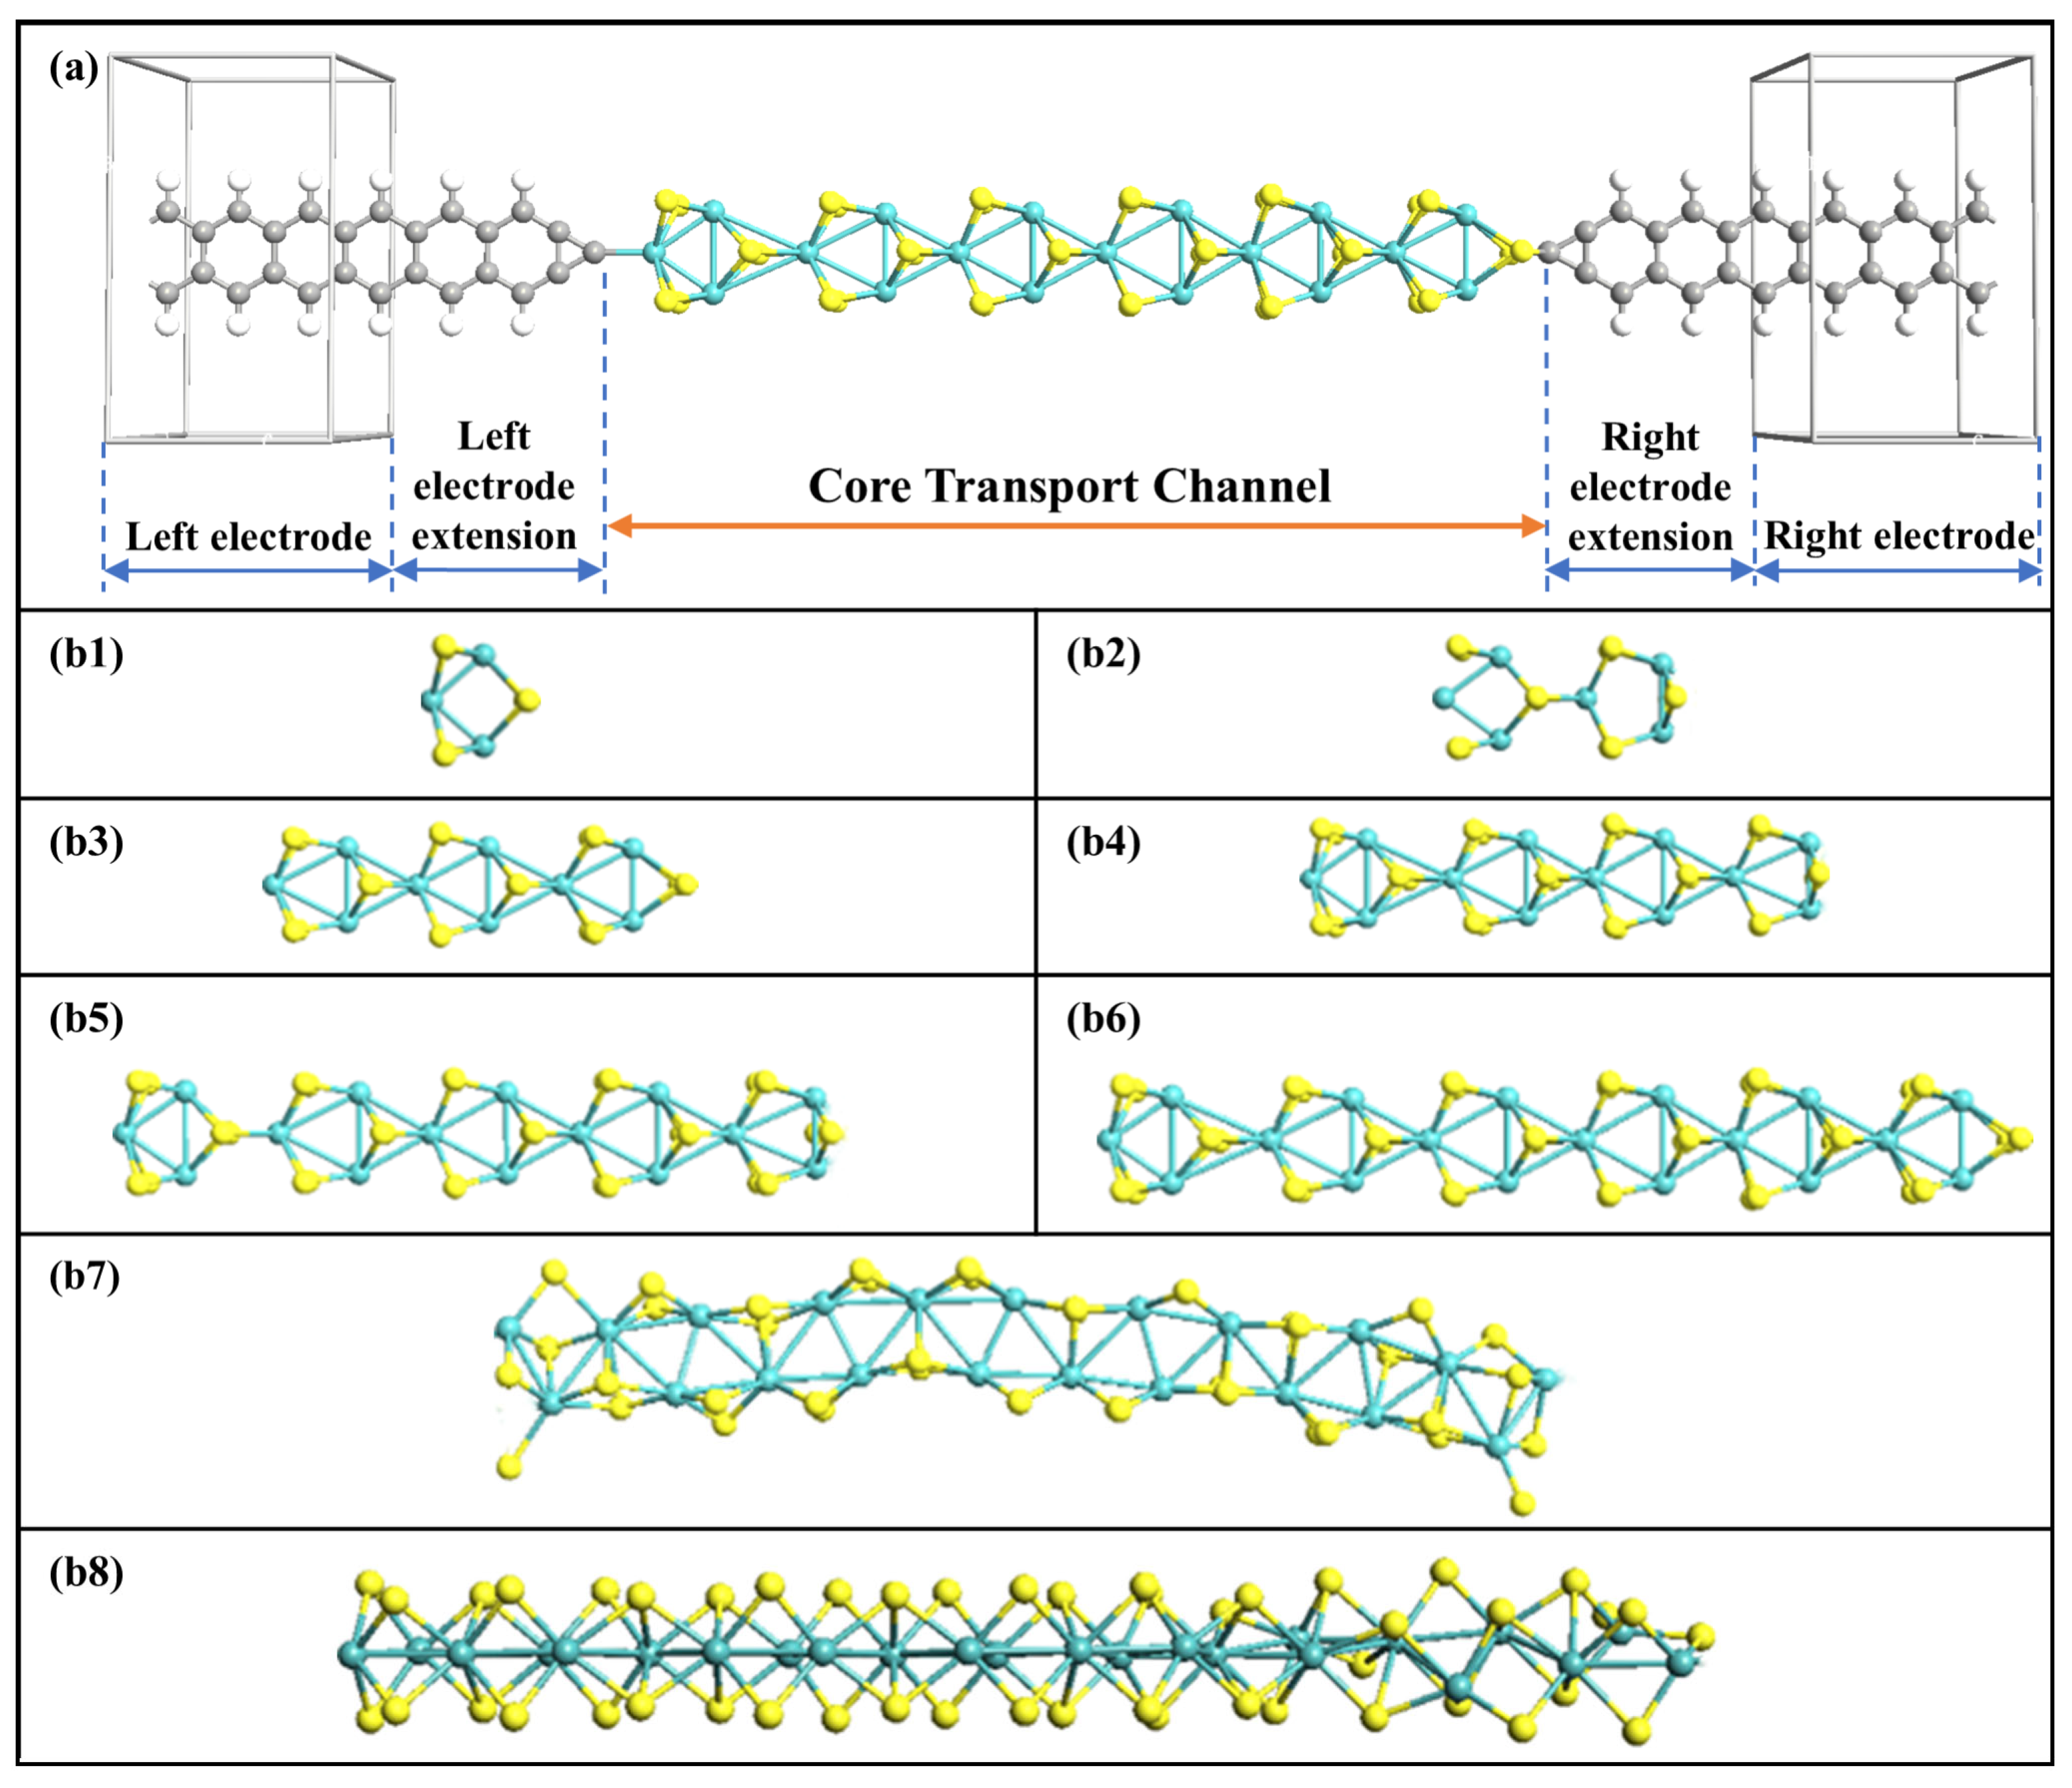
Figure 1a shows the schematic diagram of the device-structure-based MoS2 rings chain. The central transmission channel is the new-type MoS2 rings chain, consisting of a series of single hexagonal MoS2 rings, which are derived from the MoS2 bulk material. The molecular wire is sandwiched between four-atoms-wide graphene nanoribbon (GNR) electrodes with one tip C atom as the linked atom. On the left side, the tip electrode atom is bonded to one Mo atom on the outer edge of the MoS2 ring, while S is on the opposite side. The length of a single MoS2 ring is set as a unit length, and this is gradually expanded from one ring to eight rings. Eight different lengths of MoS2 ring chain after structural optimization are depicted in Figure 1(b1–b8). It is evident that the intrinsic atomic structure of the MoS2 rings chain varies somewhat as the number of rings increases, leading to the chain length of each ring having a unique appearance. When the chain is seven and eight rings wide, the chain is no longer straight and gets bent by different amounts. According to the number of MoS2 rings, the corresponding devices are named Device MoS2 ring i (i = 1~8). All devices are constructed within a supercell, with a vacuum space exceeding 15Å, to avoid interactions between periodic mirror images.
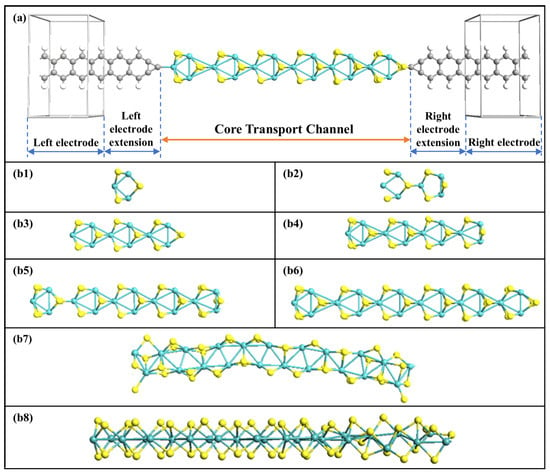
Figure 1.
(a) Structural representation of MoS2-ring-chain-based devices. (b1–b8) Structures of optimized 8 MoS2 rings chains, respectively.
All calculations used the first principles theory based on density functional theory (DFT) and non-equilibrium Green’s function (NEGF), and were performed in Atomistix Toolkit (QuantumATK U-2022.12) [28,29]. Before the calculation of the electronic transport properties, the structures of all devices were optimized using quasi-Newtonian methods until the residual forces on all atoms were less than 0.05 eV/Å. To enhance the computational accuracy, GGA-PBE was chosen as the exchange–correlation function, with all atoms employing a double-ζ polarization (DZP) basis set. The temperature within the Fermi function was set to 300 K, while the grid cutoff for the electrostatic potential was set to 75 Hartree. The electrostatic potential grid was divided by 150 Ry of energy. The k-point sampling was set as 1 × 1 × 100, ensuring both computational accuracy and efficiency [30].
The conductance G can be expressed in terms of the transmission function within the Landauer–Büttiker formalism [31,32]:
The current through a molecular junction was calculated by the Landauer–Büttiker equation [33]:
where G0 = 2e2/h is the quantum unit of conductance, h is Planck’s constant, e is the electron charge, f (E) is the Fermi distribution function, f1,2 (E) are the Fermi functions of source and drain electrodes, and T (E, V) is the quantum mechanical transmission probability of electrons, which can be given as follows [33]:
3. Results and Discussion
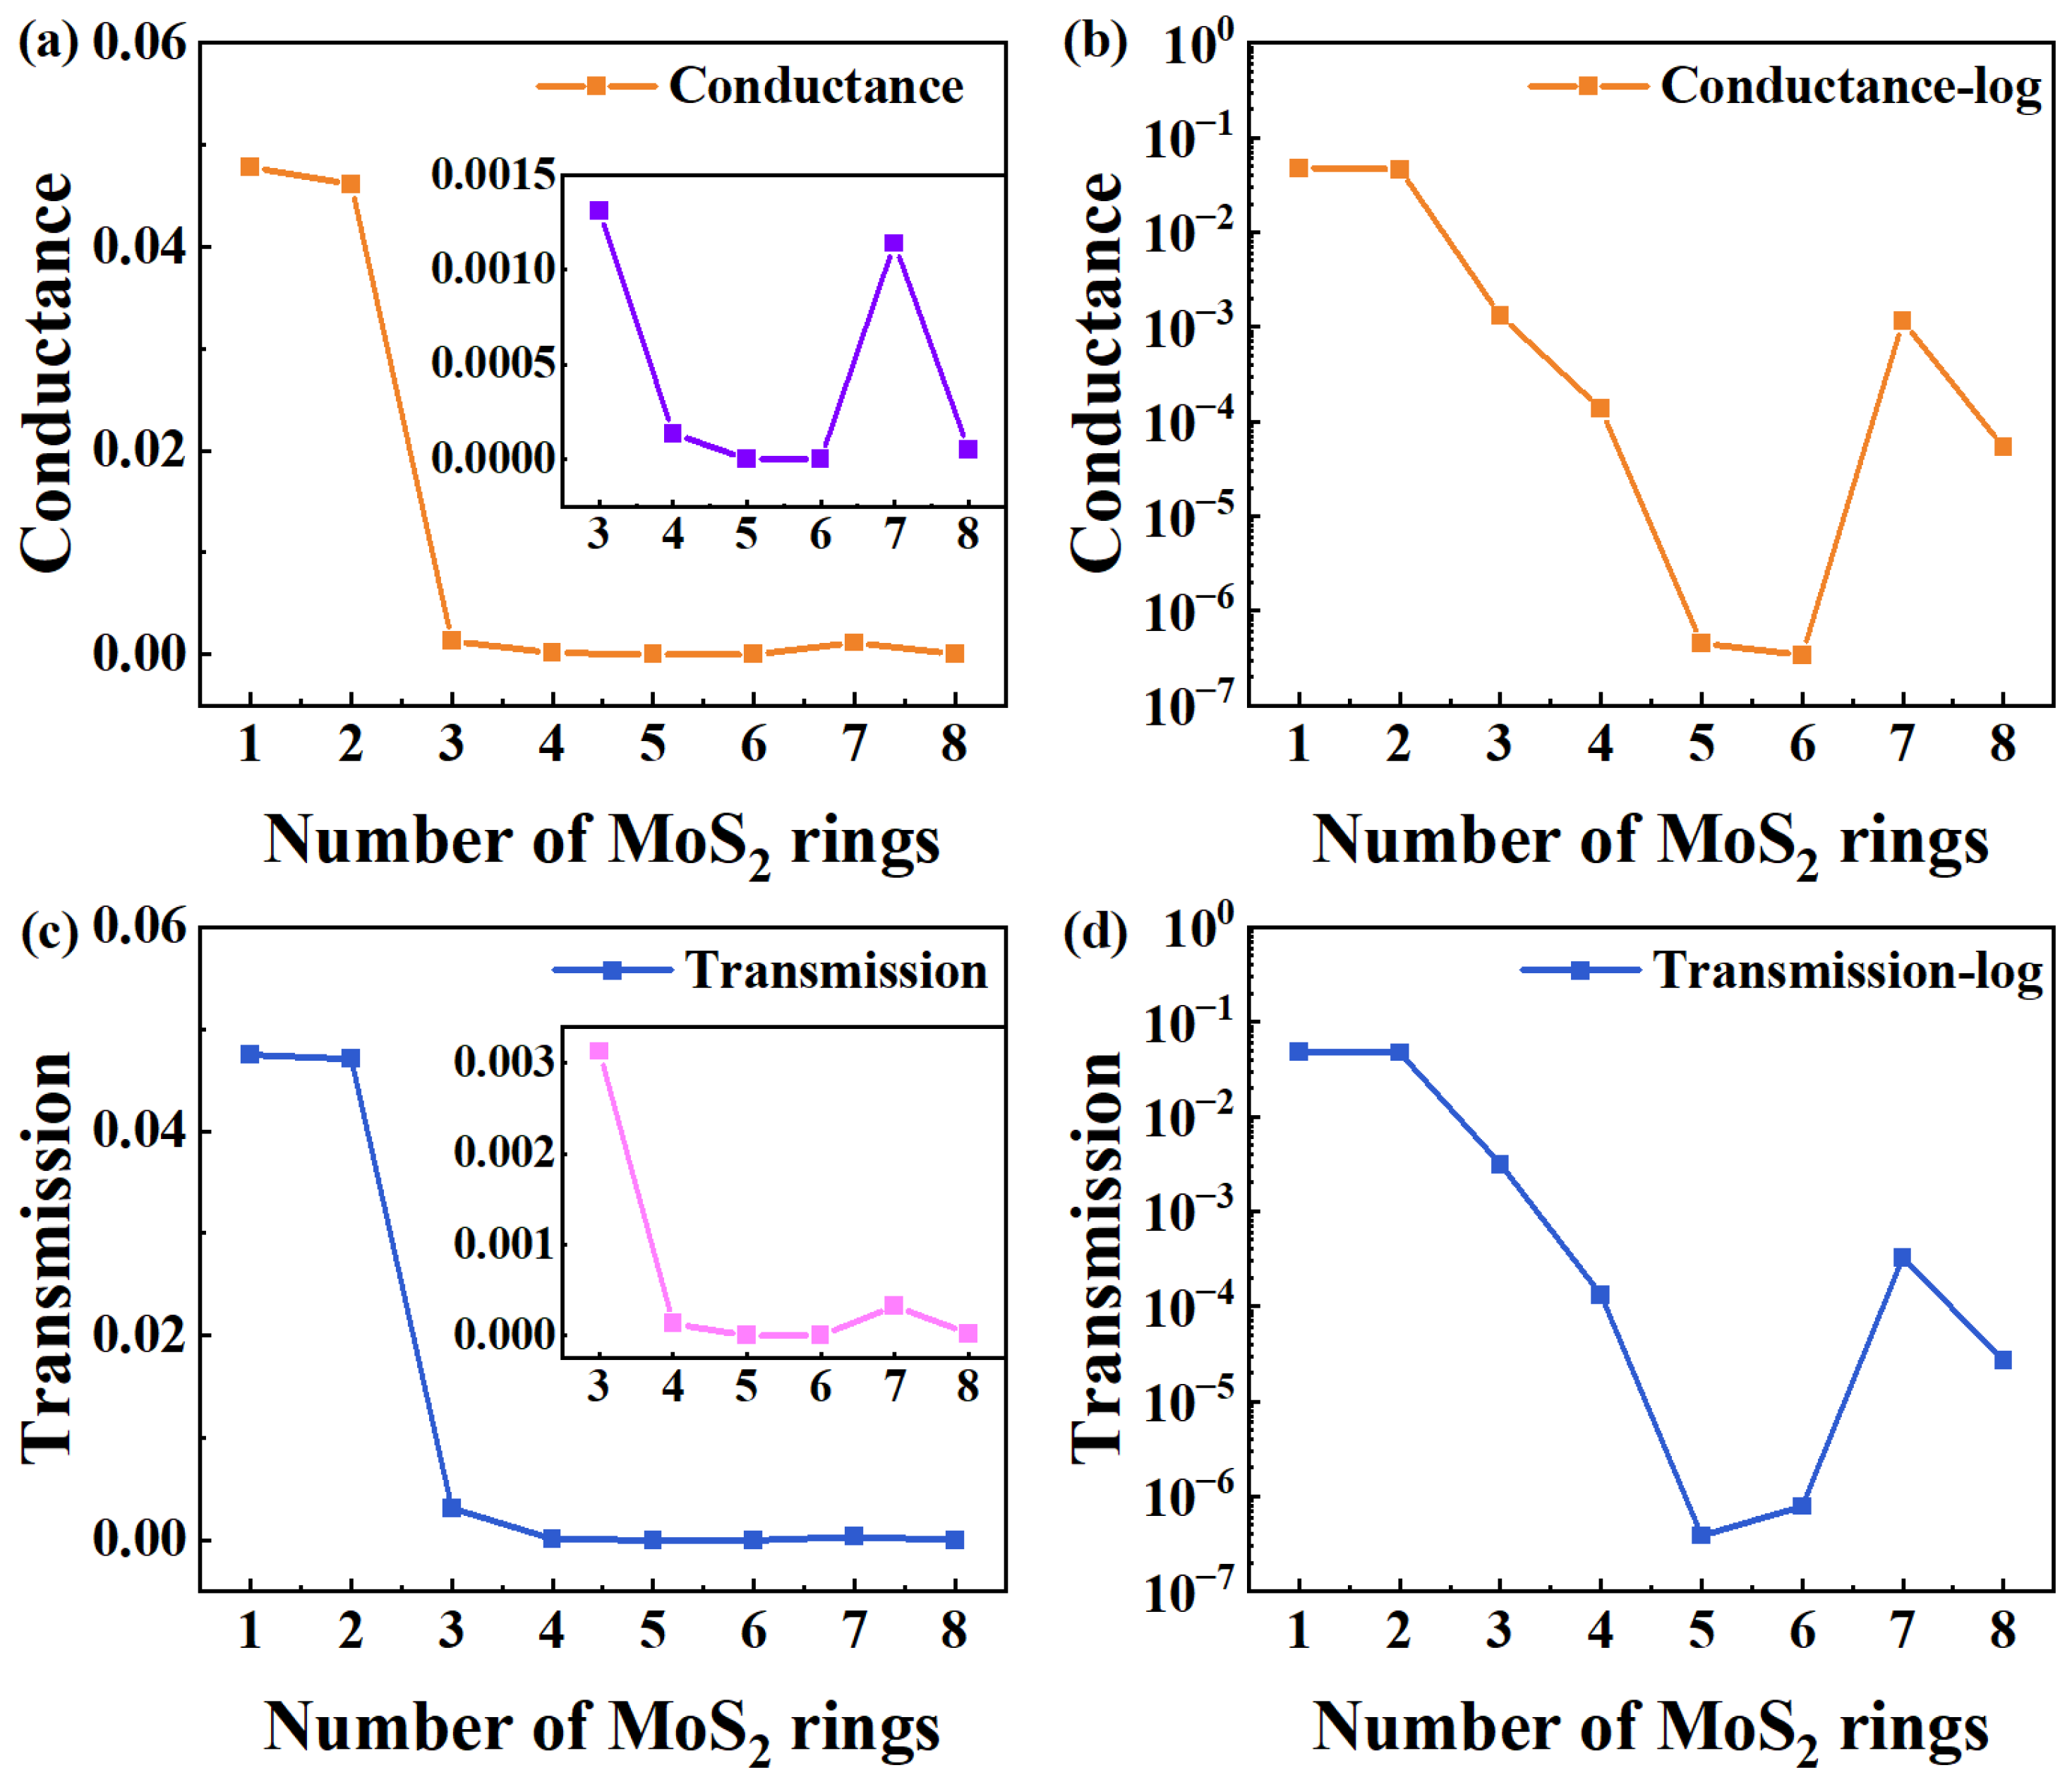
To investigate the equilibrium electronic transport features of such new-type chains, Figure 2 exhibits the equilibrium quantum conductance and electron transmission of all devices. From Figure 2a, when the rings chain is shorter (one and two rings), the conductance of devices at the Fermi energy level (EF) is much higher, and there is not much difference between the two. When the number of rings is greater than three, the conductance drops significantly, exhibiting a general declining trend. Because of the significant difference between short and long chains (greater than 3), the inset shows the corresponding changes in a narrower range of [3,8] to illustrate more intuitively and clearly the trend of conductance changing from three to eight rings. Generally, the conductance attenuation with the length of the conventional molecular (L) satisfies the typical equation [34]:
where β is the decay constant, which is calculated from the slope of the plot of logarithmic conductance (lnG) vs. L. A is a constant related to the interaction between the molecular wire and electrodes, reflecting the contact resistance. According to the exponential decay model, the conductance of traditional rings chain devices decays exponentially as the number of rings increases. Meanwhile, the changing trend of the MoS2 rings chain may be effectively analyzed thanks to the curve’s slope, which directly represents the conductance decay rate with length. To clearly show the trend, Figure 2b presents the trend of conductance changing with length on a log scale. It is clear that the conductance variation in MoS2 ring chains with length does not follow the standard exponential decay function. Instead, the conductance exhibits fluctuations as a function of length, with a significantly reduced rate of decrease. Notably, the conductivity difference between longer ring chains (Device MoS2 ring 7) and those with three rings is negligible. Only the shortest-length devices (Devices MoS2 ring 1 and Device MoS2 ring 2) have a higher value.
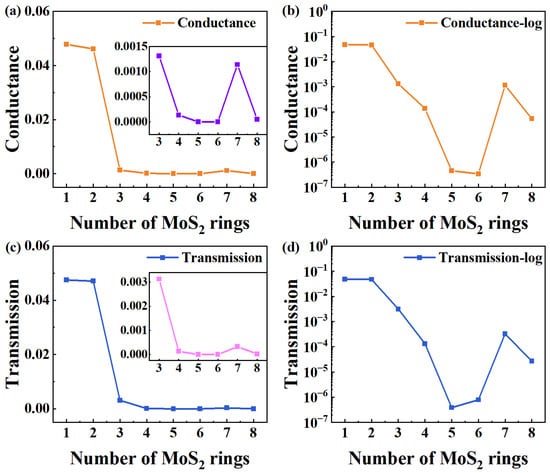
Figure 2.
(a,b) Curve of equilibrium quantum conductance number of MoS2 rings on a linear and log scale, respectively. The inset in (a) displays the corresponding changes in a narrower range of [3,8]. (c,d) Electron transmission at EF as a function of the number of rings for MoS2-ring-chain-based devices on a linear and log scale, respectively. The inset in (c) shows the corresponding changes in a narrower range of [3,8].
To further elucidate the electron transmission of the MoS2 ring chains, Figure 2c shows the electron transmission at EF as a function of the number of rings. When the rings chain is shorter (1–2 rings), the electron transport coefficient at EF is significantly higher, suggesting that the devices based on the shorter molecular chains show stronger electron transport capabilities. Furthermore, the transmission shows little differences between Device MoS2 ring 1 and 2, and the electron transmission drops significantly when the length exceeds three rings. There is a decreasing trend in the overall electron transmission. To illustrate more intuitively the trend of electron transmission change from three rings to eight rings, the inset shows the corresponding changes in a narrower range of [3,8], due to the significant difference in electron transmission between short and long chains (greater than 3). Similarly, the electron transmission of MoS2 ring chains varies and also does not present a traditionally exponential decay with length, which is clear in Figure 2d (on a log scale). Such a mutation point can be used to create new-type memory, low-power switching devices, and high-sensitivity sensors. However, structural design and environmental regulation must be taken into consideration to stabilize the mutation point.
We compare the equilibrium conductance and electron transmission at EF with the number of rings. Obviously, the change in the electron transmission with the number of rings is the same as that for the conductance. So, the change in electron transmission can explain the change in conductance well. On a deeper level, the tunnel barrier energy, i.e., the energy difference between the dominant transport orbital and EF, is the internal determinant for the electron transport of molecular devices [14]. Usually, the tunnel barrier energy of the molecular wire would increase as the length increases, essentially causing conductance decay [35]. Consistent with the change trend observed for conductance, the electron transport coefficient of the MoS2 rings chain at EF also presents a state of fluctuation, changing with the number of rings. This result further confirms the complex interrelation between the electron transport coefficient and molecular chain length, and also highlights the key role of tunnel barrier energy.
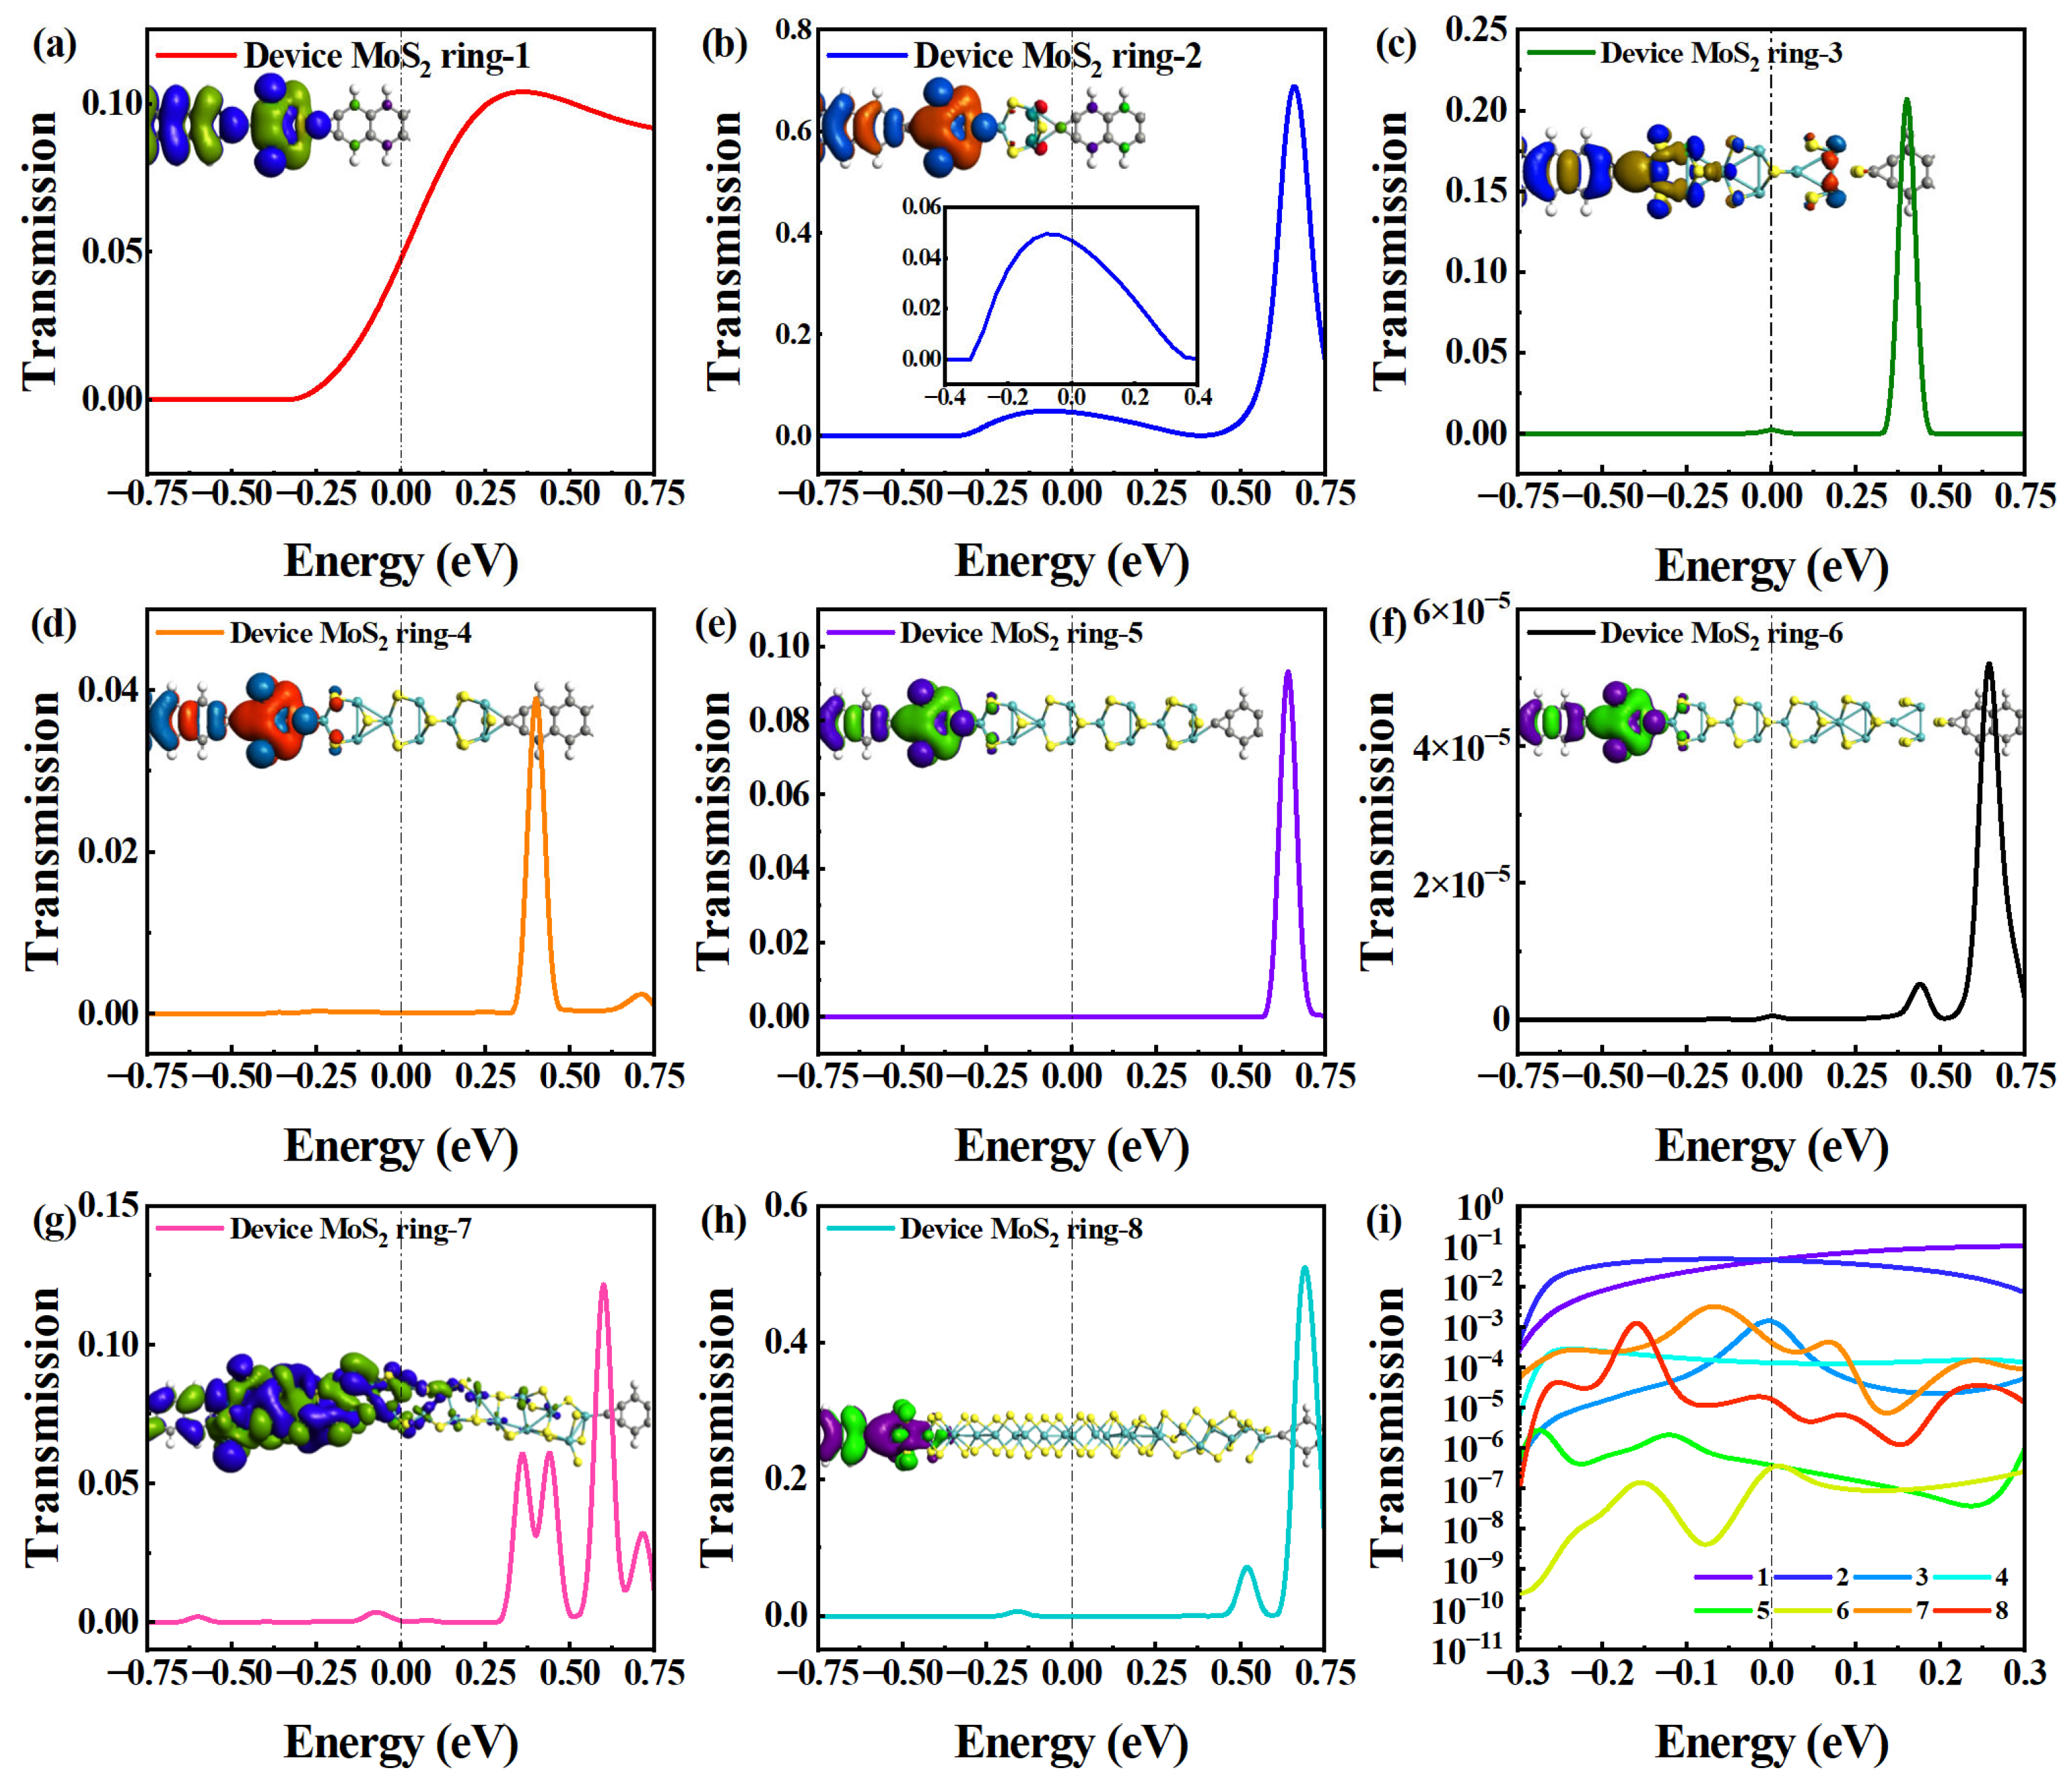
The electron transport conditions around EF are also given in Figure 3. Figure 3a–h shows the electron transmission spectrum in [−0.75 eV, 0.75 eV] for Device MoS2 ring 1–8. For Device MoS2 ring 1, the peak width within the given energy range spans from −0.3 to 0.75 eV, covering an energy range of 1.05 eV. It exhibits a single electron transmission peak at 0.36 eV, with a peak height of 0.104. The single-peak feature indicates that electron transport is concentrated in this energy range. Conversely, for Device MoS2 ring 2, two transmission peaks fall into the same energy range, but there is a noticeable variation in strength between them. The higher peak suppresses the lower peak shape, making it indistinguishable. Therefore, we decided to highlight the lower electron transmission peak in the energy range of −0.4 to 0.4 eV. The higher peak occupies a 0.29 eV energy range, and has a peak height of 0.72 at −0.08 eV, while the lower peak spans a 0.68 eV energy range, with a peak height of 0.05. Higher equilibrium electron transmission at EF indicates stronger electron transport capabilities. We uniformly selected the electron transmission peak nearest to EF for comparison [36]. The transmission peak of Device MoS2 ring 1 deviates 0.05 eV from that of EF, making its electron transport property slightly stronger than that of Device MoS2 ring 2.
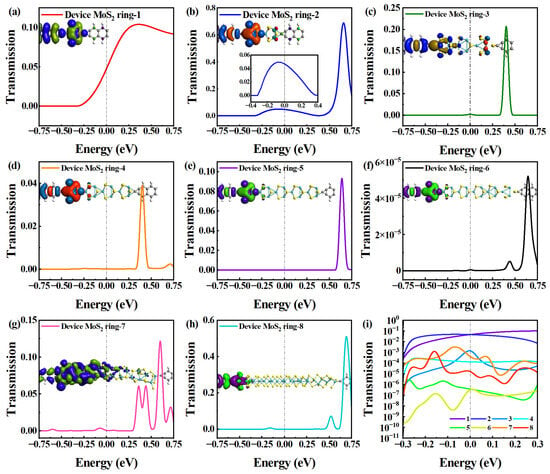
Figure 3.
(a–h) Electron transmission spectrum in [−0.75 eV, 0.75 eV] for Device MoS2 ring 1–8, respectively. The insets show the corresponding transmission eigenstates. Another inset in (b) shows the transmission spectrum in [−0.4, 0.4 eV]. (i) Comparison of transmission spectrum of all devices on a logarithmic scale.
Further, Device MoS2 ring 3–5 have comparable electron transport features, displaying a single notable electron transmission peak in the same energy range. In particular, the transmission peak of Device MoS2 ring 3 covers the energy range of 0.16 eV and has a peak height of 0.31 at 0.4 eV. Device MoS2 ring 4 also exhibits an energy range of 0.16 eV, but has a peak height of only 0.058 at 0.4 eV. The transmission peak of Device MoS2 ring 5 also occupies the energy range of 0.16 eV, with a peak height of 0.14 at 0.64 eV. The width of the transmission peak does not significantly change from Device MoS2 ring 3 to 5. However, the peak of Device MoS2 ring 5 shifts toward higher energy in comparison to Devices MoS2 ring 3 and 4. This displacement leads to a decline in electron transport capabilities because of the changes in the length or structure of the molecular wire, which affects the electron transport path and efficiency.
Regarding Device MoS2 ring 6 and Device MoS2 ring 8, there are two transmission peaks within the energy range. The two peaks of Device MoS2 ring 6 cover the energy range of 0.12 eV and 0.19 eV, respectively. The higher transmission peak height is 7.05 × 10⁻⁵, and the lower transmission peak height is 7.48 × 10⁻⁶. For Device MoS2 ring 8, the two transmission peaks cover the energy range of 0.12 eV and 0.15 eV, respectively. The height of the higher transmission peak is 0.624 and the height of the lower transmission peak is 0.106. Compared to the two devices, the two peaks deviate from EF to a similar degree, but the transmission peak of Device MoS2 ring 6 is lower than that of Device MoS2 ring 8, and the value at EF is also lower. Device MoS2 ring 7 has multiple transmission peaks in a given energy range. So, it shows strong electron transport capabilities owing to its structure, which provides efficient electron transport paths.
There is only one transmission peak for the shorter chains (Device MoS2 ring 1–5) and two transmission peaks for the longer chains (Device MoS2 ring 6–8). It is worth noting that Device MoS2 ring 7 presents multiple transmission peaks due to its special structure. The peaks near EF do not differ much among the devices with different lengths, except for Device MoS2 ring 6, which shows much smaller peaks than the other devices. To compare more intuitively the effects of length on electron transmission near EF, we use a logarithmic scale to describe them (see Figure 3i). It is very obvious that the electron transmission of Device MoS2 ring 1 and 2 is significantly higher than that of the other six devices, showing a strong electron transport property. In contrast, the electron transmission of Device MoS2 ring 5 and 6 is significantly lower than other devices over the entire energy range, and Device MoS2 ring 6 shows the weakest electron transmission in the negative energy range.
In order to elucidate the electronic transport of MoS2-ring-chain-based devices with different lengths, the insets in Figure 3a–h show the transmission eigenstates of the eight devices with the same iso-value at EF, respectively. The transmission eigenstate portrays how the electrons propagate through the central region and can also reveal, for instance, phase shifts in the wave function, as the eigenstate is a complex quantity. Specifically, these eigenstates describe the scattering states of electrons as they travel from one electrode to the other [37].
For the shortest Device MoS2 ring 1, there is a delocalization of electronic states throughout the region from the left electrode to the right electrode. The distribution of electronic states of Device MoS2 ring 2 is similar to Device MoS2 ring 1, but the distribution of the right electrode is a little weaker than that of Device MoS2 ring 1. So, the electron transmission of Device MoS2 ring 1 and 2 are significantly higher than that of the other six devices, showing strong electron transport capabilities. There are changes in the distribution pattern of electronic states in the left region for Device MoS2 ring 3, and there is no distribution of electronic states in the right electrode region. So, the electron transmission drops sharply from Device MoS2 ring 2 to 3. The distribution of electronic states differs slightly among Device MoS2 ring 4 to 8 (except Device MoS2 ring 7). The electronic states are localized in the left electrode and the first two rings, and it is difficult for electrons to be transmitted to the right electrode through the long chain. So, the electronic transmission of these devices is generally suppressed. For the special Device MoS2 ring 7, the region of the left electronic state distribution becomes longer and it has a similar electron state distribution to Device MoS2 ring 3, except for the right electrode. Therefore, Device MoS2 ring 7 exhibits a similar electron transport property to Device MoS2 ring 3, and is much stronger than other long chain lengths.
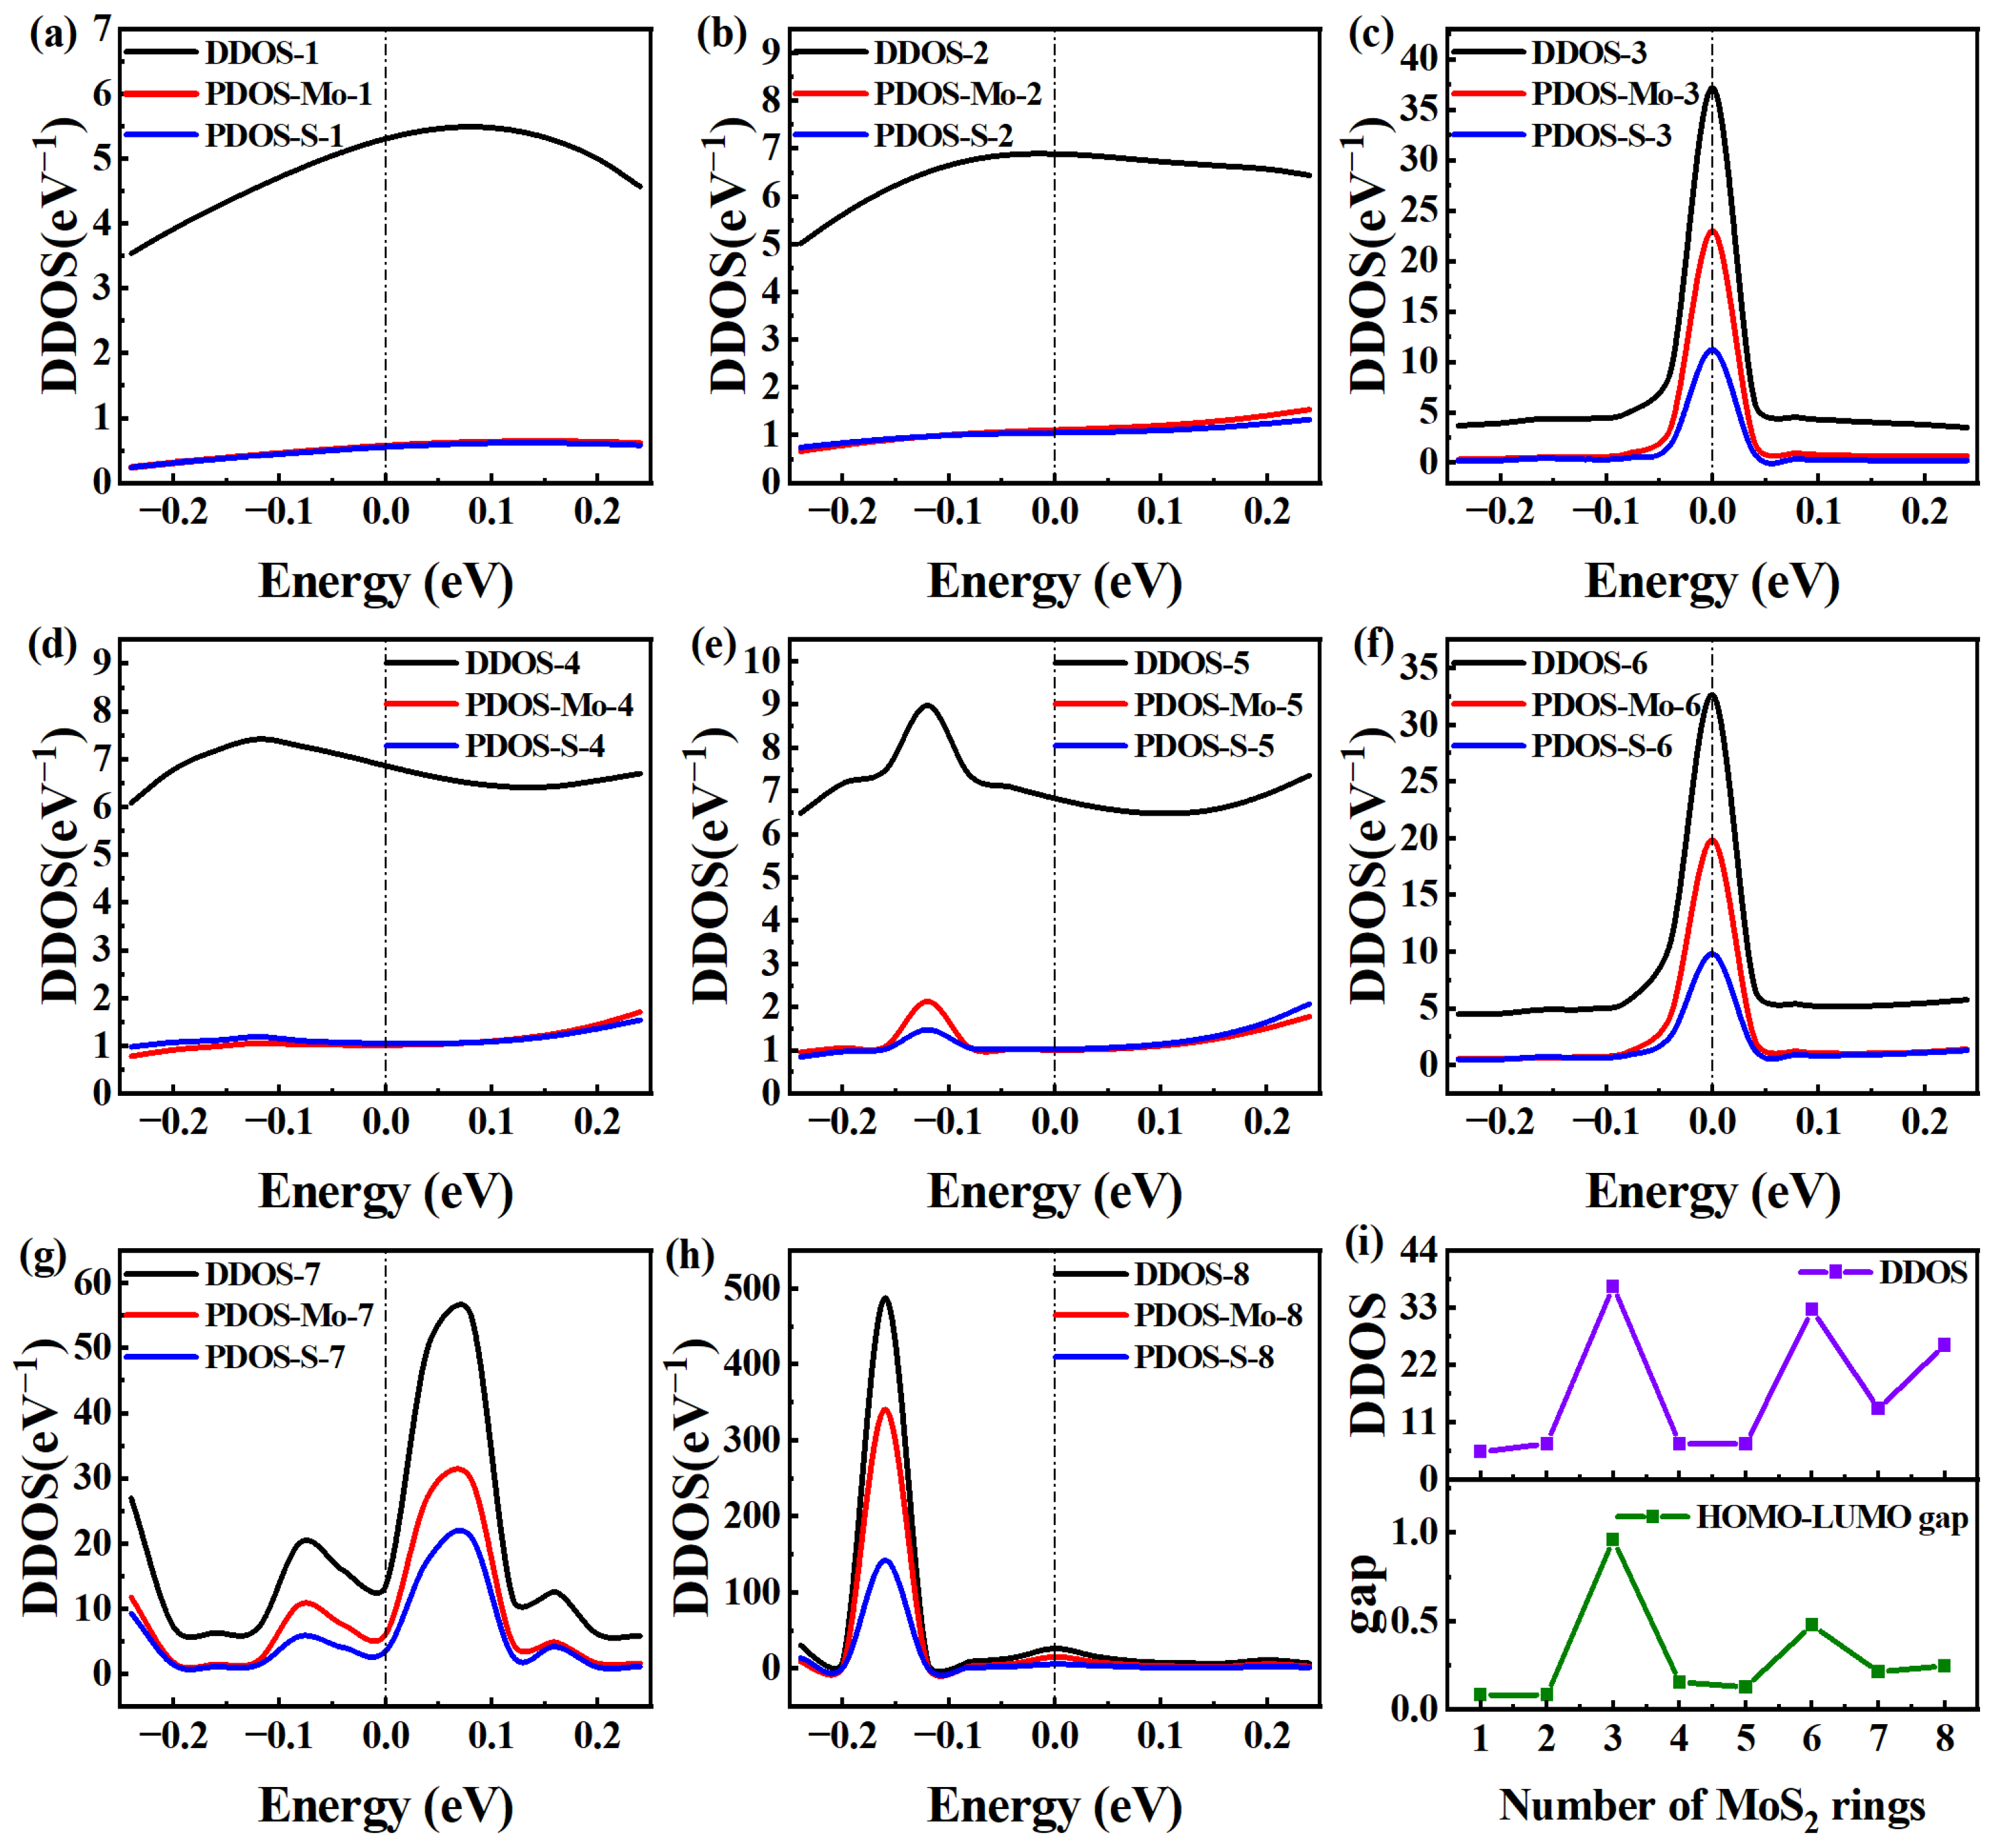
To further clarify the differences in electron transmission at EF, we conducted a further quantitative analysis of the device density of states (DDOS) for MoS2-ring-chain-based devices of varying lengths. In general, higher DDOS values around EF indicate a greater number of electronic states around EF, potentially allowing more electrons to pass through the bandgap [13]. This is just a possibility. Actually, a wide range of additional factors influence the actual number of electrons that can move across the bandgap. Here, the MoS2 rings chain can be regarded as a macromolecule. To understand the energy levels of the MoS2 rings chain in the presence of the surrounding electrodes, we calculate the Molecular Projected Self-Consistent Hamiltonian (MPSH) energies. Like the molecule, the two closest energy levels to EF are written as “HOMO” and “LUMO”, respectively. As seen in Figure 4, we report the DDOS and PDOS for each device in the range of [−0.25, 0.25 eV], and compare the DDOS and HOMO-LUMO gap at EF with the number of rings. The number of states occupied close to EF and the number of electronic states themselves are typically directly correlated with the DDOS rating. Generally, the DDOS increases with the number of atoms in the system. Therefore, as a whole, the DDOS shows a certain degree of increase with the increase in the rings chain, but the increase is small.
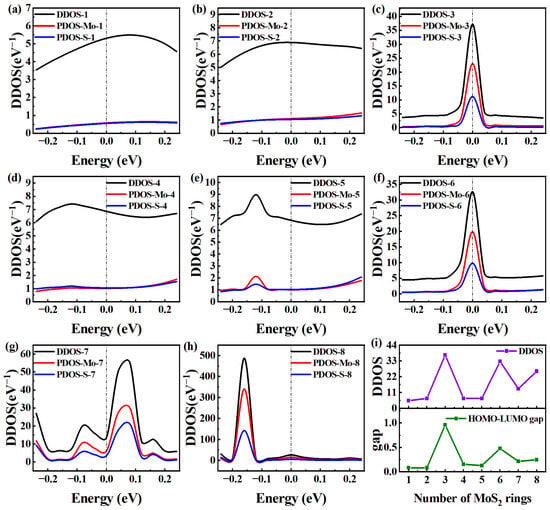
Figure 4.
(a–h) DDOS and PDOS in the energy region [−0.25, 0.25 eV] for Device MoS2 ring 1–8, respectively. (i) DDOS and HOMO-LUMO gap as a function of the number of rings.
Among the peaks of DDOS intensity nearest to EF, Device MoS2 ring 1 is similar to Device MoS2 ring 2 and exhibits a wide peak, which indicates a relatively smooth change in intensity near EF. Specifically, Device MoS2 ring 1 shows the largest DDOS peak at 0.08 eV, with a value of 5.49 eV−1. Device MoS2 ring 2 shows a maximum DDOS peak of 6.88 eV−1 at 0 eV. The two have identical electron transmissions, which can be quantitatively explained by the lack of significant variation between them. In contrast, the DDOS peak of Device MoS2 ring is smaller, peaking at EF and an intensity of 37.16 eV−1, which is overall consistent with the normal DDOS growth pattern. Unlike Device MoS2 ring 3, Device MoS2 ring 5 has wider DDOS peaks and similar curve distributions, but it shows the maximum DDOS peak of 8.97 eV−1 at −0.12 eV, demonstrating more fluctuations. However, Device MoS2 ring 4 shows the maximum DDOS peak of 7.41 eV−1 at −0.14 eV. The DDOS curve of Device 4 resembles that of Device MoS2 ring 5, with values only slightly higher than those of the shortest chain. The suppressed DDOS partly explains their weak electron transport property.
The DDOS of Device MoS2 ring 6 is very similar to that of Device MoS2 ring 3, and the intensity is also very similar. It is even lower than that of Device MoS2 ring 3, so its electronic transmission is smaller. In addition, the DDOS of Device MoS2 ring 8 is also very similar to these two, and Device MoS2 ring 8 fluctuates more sharply between 0 and −0.25 eV, which makes the peak of Device MoS2 ring 8 appear earlier than Device MoS2 ring 6. Specifically, Device MoS2 ring 8 shows the maximum DDOS peak of 487.49 eV−1 at −0.16 eV. Device MoS2 ring 6 shows the maximum DDOS peak of 32.63 eV−1 at 0 eV. However, the DDOS of the longest Device MoS2 ring 8 is just a little higher, but the DDOS peak is the farthest from EF. At the same time, the DDOS at EF is also very small, resulting in the weakest electron transport property. The fact that Device MoS2 ring 7 has substantially more peaks within the specified energy range suggests that the distribution of electronic states is somewhat complicated. This may be related to the unique structural features or electronic configuration of the device, which greatly promotes the electron transport properties.
The DDOS and PDOS of MoS2-ring-chain-based devices are detailed in Figure 4a–h. We can find that the PDOS curves of S almost coincide with those of Mo for Devices MoS2 ring 1, 2 and 4. This indicates that there is little difference in the contribution of the two elements to DDOS in MoS2-ring-chain-based devices. For longer ring chains (Device MoS2 ring 3–8, except Device MoS2 ring 4), the PDOS curves of Mo are significantly higher than those of S, showing that Mo actually is the element that contributes more to the electron transport. To more clearly explain the mechanism of the influence of length on the electron transport of the rings chain, we compare the DDOS and HOMO-LUMO gap at the EF of eight devices with different lengths in Figure 4i.
In general, DDOS increases as the number of rings increases. From Figure 4i, we can find that the DDOS of MoS2-ring-chain-based devices roughly conforms to this rule. However, the DDOS values of Device MoS2 ring 3 and 6 are significantly larger than those of other devices. For Device MoS2 ring 1 and 2, both the DDOS and the HOMO-LUMO gap are comparatively low. Because of the short length, the electron transmission is significantly higher than other devices. For Device MoS2 ring 3, there is a substantial increase in both the DDOS and HOMO-LUMO gap, leading to a dramatic decrease in electron transmission as a result of the increased chain length. While the HOMO-LUMO gap remains relatively small for Device MoS2 ring 4 and 5, the DDOS decreases sharply. However, the combination of low DDOS and more length increases resulted in a notable decrease in electron transmission. For Device MoS2 ring 6, DDOS reaches its maximum, and the HOMO-LUMO gap is slightly larger than that of Device MoS2 ring 5. Nevertheless, because of the long length, the electron transmission is not large. Both the DDOS and HOMO-LUMO gap decrease for Device MoS2 ring 7. However, because of its unique structure, it generates several channels, which allow the electron transmission to peak at a central chain length. For Device MoS2 ring 8, the DDOS rebounds, but the HOMO-LUMO gap again increases and is the longest, causing another decline in electron transmission. Thus, the influencing mechanism of length on the electron transport of a such new-type chain may be explained by the relationship between the DDOS and HOMO-LUMO gap and the number of rings.
Further, to essentially explain the large conductance of the device with seven rings, we examined a configuration with 14 (2 × 7) rings. We constructed 14 (2 × 7) rings and calculated the electronic properties. The calculated quantum conductance was 3.473208 × 10³ G0, which is quite close to the value of 1.140076 × 10³ G0 for the configuration with seven rings. In this respect, the large conductance of the seven-ring MoS2 chain is caused by multiple factors. The dominant factor is interference, which is the resonance occurring between the electrodes. Specifically, this is the odd-ring constructive interference effect. As an odd-numbered structure, the seven-ring chain satisfies the constructive interference condition in the parity-dependent quantum interference of the cyclic molecular chain, and the symmetry-allowed constructive interference makes the electron wave function coherently superimposed, which greatly enhances the conductance. In addition, LUMO-EF resonance also plays an important role; with the increase in the number of rings, the molecular orbital energy level (HOMO/LUMO) splits and moves, and the seven-ring structure aligns a transport orbital with the EF energy, which significantly reduces the tunnel barrier and forms a resonance tunneling channel, which effectively reduces the hindrance of electron transport.
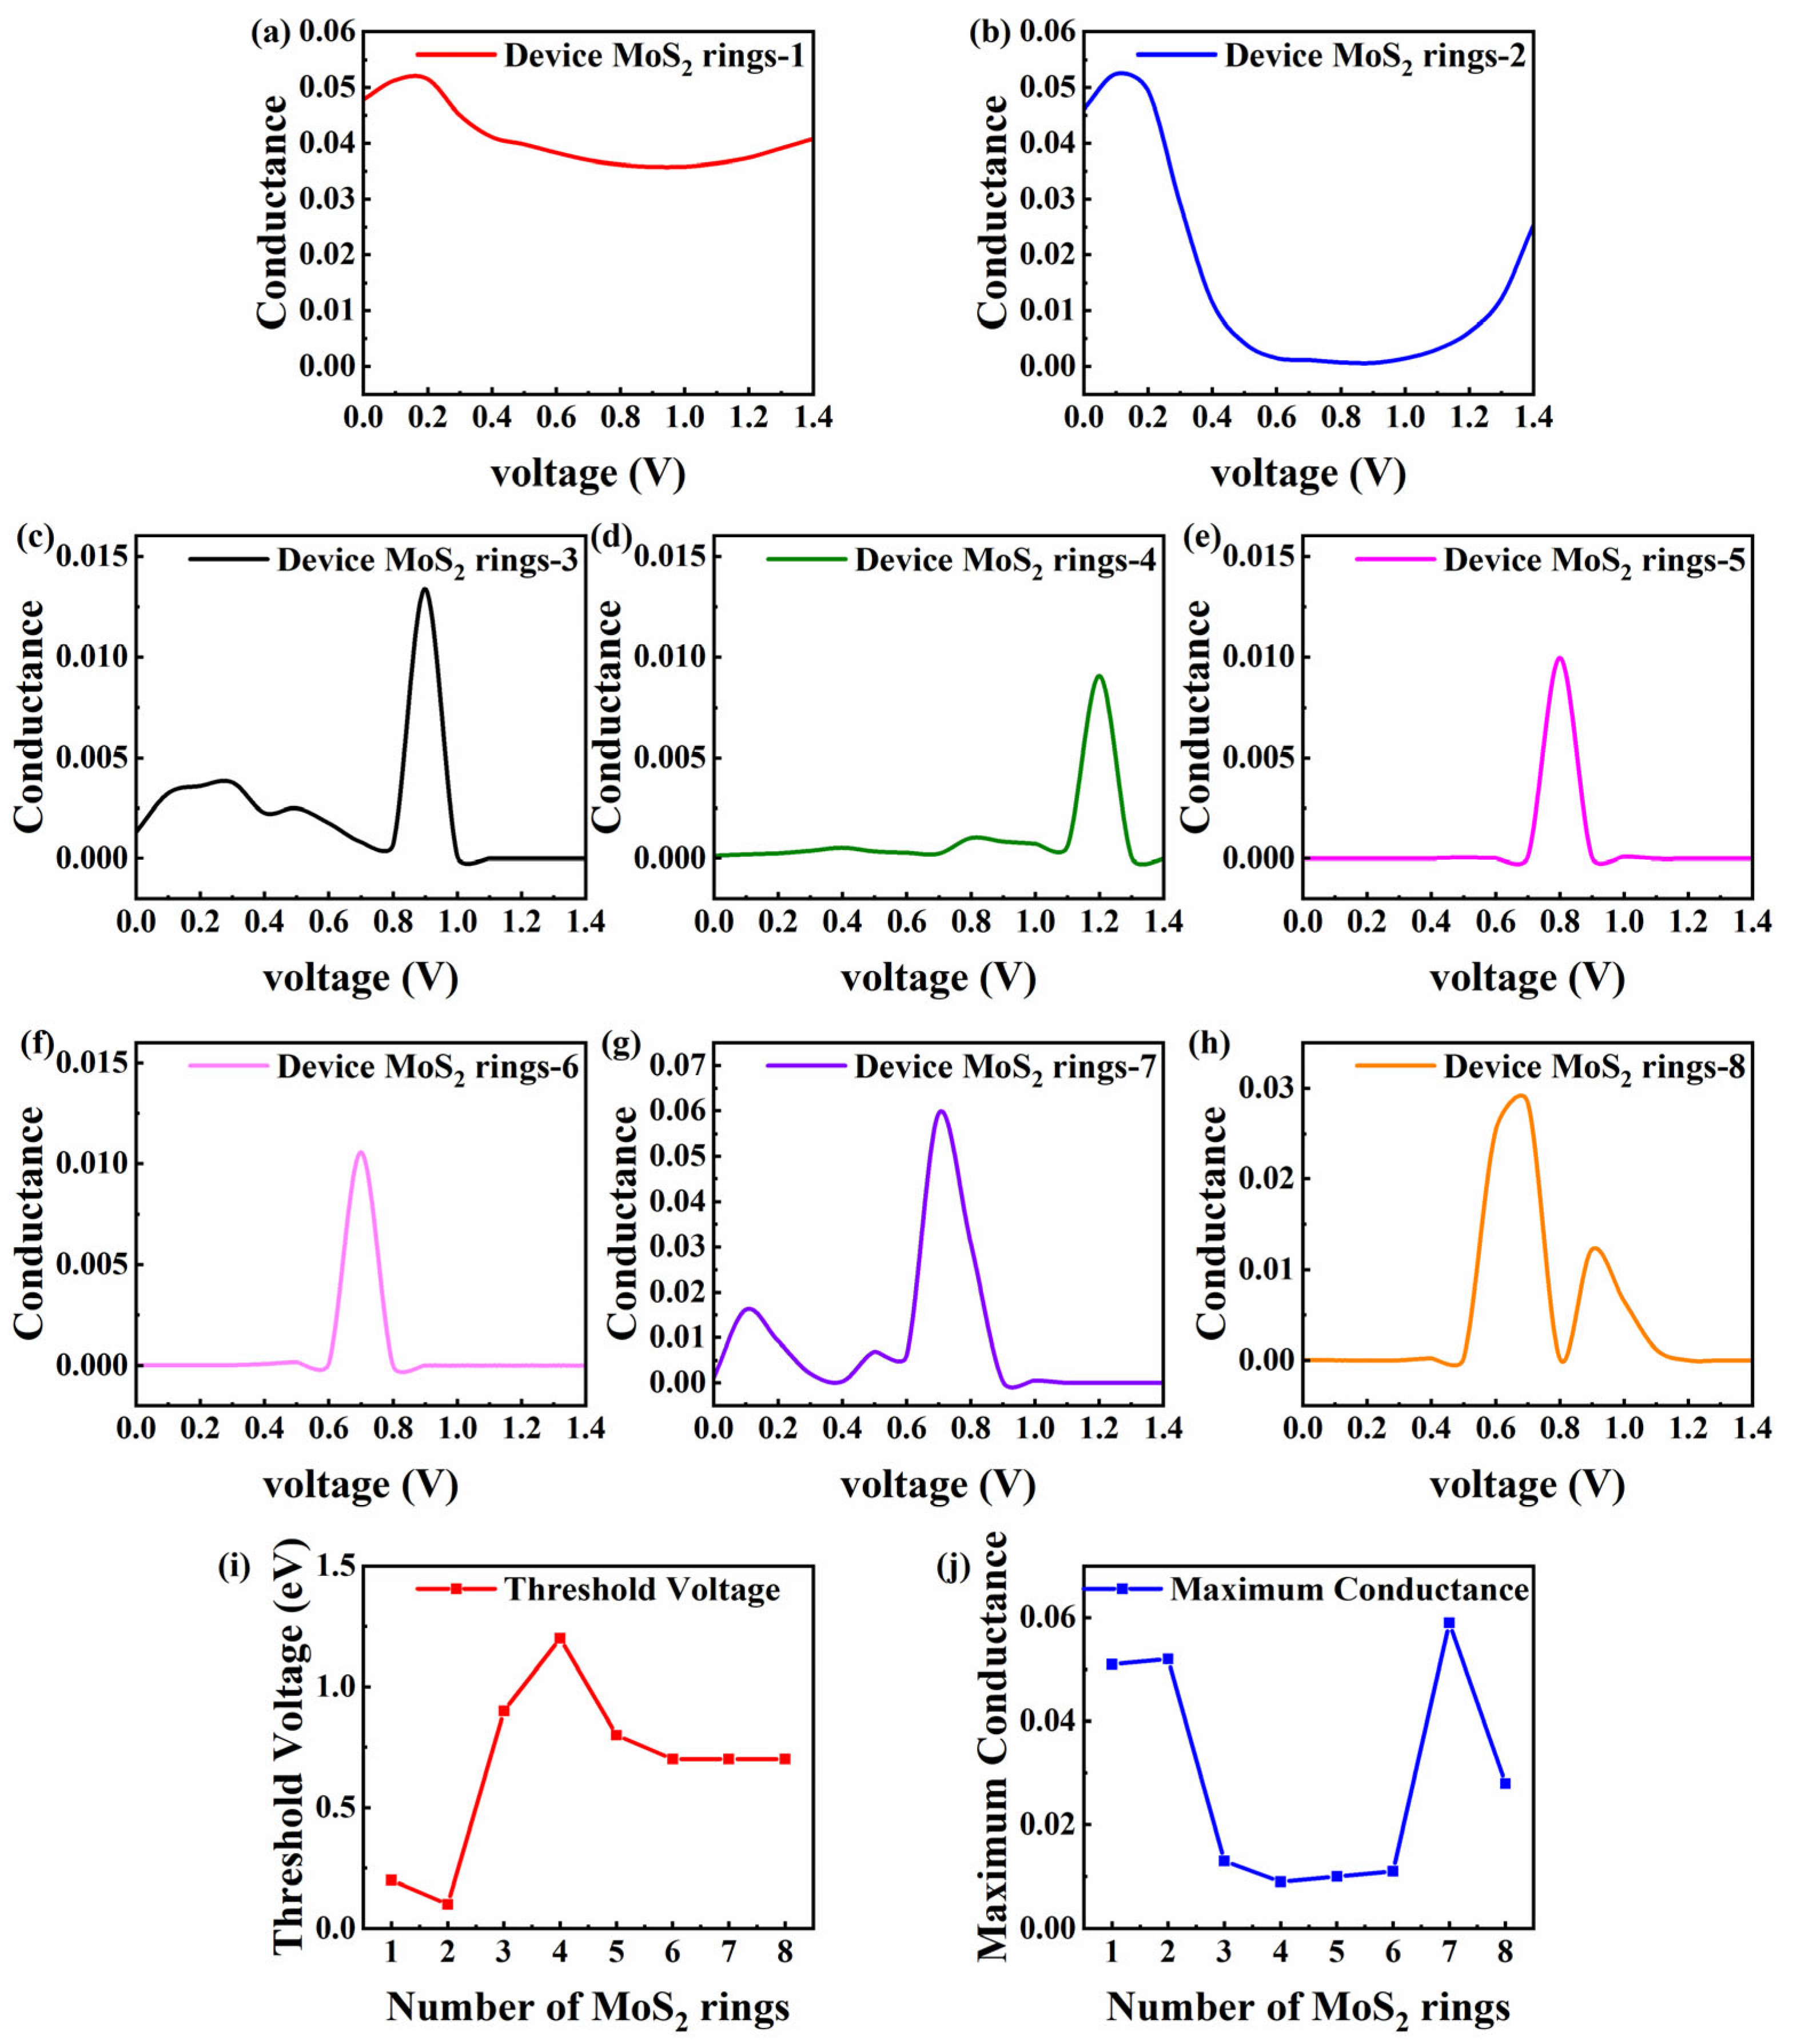
Non-equilibrium changes in conductance are associated with the length and voltage, which is crucial for understanding and optimizing the performance of MoS2-based devices in practical applications. Figure 5a–h displays the conductance–voltage curves of MoS2-ring-chain-based devices [1,8]. The conductance–voltage curves of Device MoS2 ring 1 and 2 (the shortest length) show a similar trend. As the voltage increases, the conductance sees a small increase and then decreases to a smaller value. In particular, the conductance of Device MoS2 ring 1 increases from 0.048 to 0.051 and then subsequently decreases to 0.036, which is about 0.75 times that at 0 V. This indicates that the conductance of Device MoS2 ring 1 decreases significantly in an environment with a high voltage. The conductance of Device MoS2 ring 2 increases from 0.046 to 0.052 and falls to 0.00068, which is about 0.15 times that at 0 V. This means that applying a voltage decreases the transmission of electrons between the two shortest devices. To maintain high electron transmission, the two devices must be in equilibrium or the applied voltage must be controlled at a low value (no more than 0.3 V).
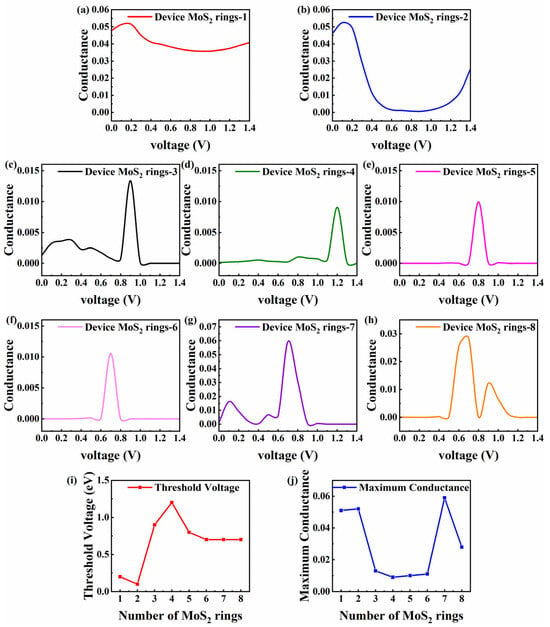
Figure 5.
(a–h) Conductance–voltage curves for Device MoS2 ring 1–8, respectively. (i) Threshold voltage of the maximum conductance varying with the number of rings. (j) Maximum conductance value varying with the number of rings.
Unlike above, as the length increases, the trends in the conductance with the voltage are very similar and gentle for Device MoS2 ring 3–8. The conductance of all devices significantly rises and achieves its maximum value when the voltage is raised to a specific level. At first, the conductance changes smoothly, but when the voltage increases further, the conductance drops dramatically. Specifically, when the voltage increases from 0 V to 0.8 V, Device MoS2 ring 3 exhibits a slight oscillation, succeeded by a notable rise in conductance. It reaches a peak of 0.013 at 0.9 V, which is almost 10 times the conductance at 0 V. Another initial fluctuation that is more pronounced is seen for Device MoS2 ring 7. As the voltage increases from 0 V to 0.4 V, the conductance increases from 0.0011 to 0.016 and then decreases. When the voltage reaches 0.6 V, the conductance increases significantly, peaking at 0.05939 at 0.7 V, which is about 59 times that at 0 V.
For the three devices of medium length (Device MoS2 ring 4–6), negligible fluctuations occur at low voltages. Device MoS2 ring 4 does not change much until the voltage is raised to 1.1 V. At that point, the conductance rises sharply and peaks at 0.0091 at 1.2 V, which is around 70 times higher than that at 0 V. Until the voltage is raised to 0.7 V, Device MoS2 ring 5 does not fluctuate much. At that point, the conductance rises sharply with a peak of 0.010, which is roughly 1000 times higher than that at 0 V. Device MoS2 ring 6 does not fluctuate significantly until the voltage reaches 0.6 V. After that, the conductance increases significantly and reaches a peak of 0.011 at 0.7 V, about 1000 times that of 0 V. Device MoS2 ring 8 has two distinct peaks in the given range, with no significant fluctuations until the voltage increases to 0.5 V. It reaches a peak of 0.028 at 0.7 V, about 2800 times that of 0 V. The second peak appears at 0.9 V, with a peak value of 0.012, which is about 1200 times that of 0 V.
The above analysis shows that the conductance of different devices varies significantly in different voltage ranges. For a better analysis, we introduce the concept of the threshold voltage, which is defined as the voltage corresponding to the maximum conductance value. Figure 5i shows the threshold voltage varying with the number of rings, and Figure 5j shows that the maximum conductance varies with the number of rings. For Device MoS2 ring 1 and 2, they have a lower threshold voltage and a significantly higher maximum conductance than other devices, indicating that they are not suitable for operation in high-voltage environments. However, they have good transmission capabilities, which makes them ideal for low-power applications. In contrast, the devices with longer chains (Device MoS2 ring 3–8) show a significant increase in conductance within a specific voltage range, and these devices may be more suitable for operating in high-voltage environments, capable of providing higher current outputs for applications requiring high power transmission. It is worth mentioning that the conductance of Device MoS2 ring 7 increases significantly at a specific voltage. Its threshold voltage value of 0.7 V is smaller than that of medium-length ring chain devices, while the maximum value of conductance is 0.059, which even exceeds that of shorter devices (Device MoS2 ring 1 and 2). This indicates that Device MoS2 ring 7 may have higher sensitivity near smaller opening voltage points, which makes it ideal for high-sensitivity sensors.
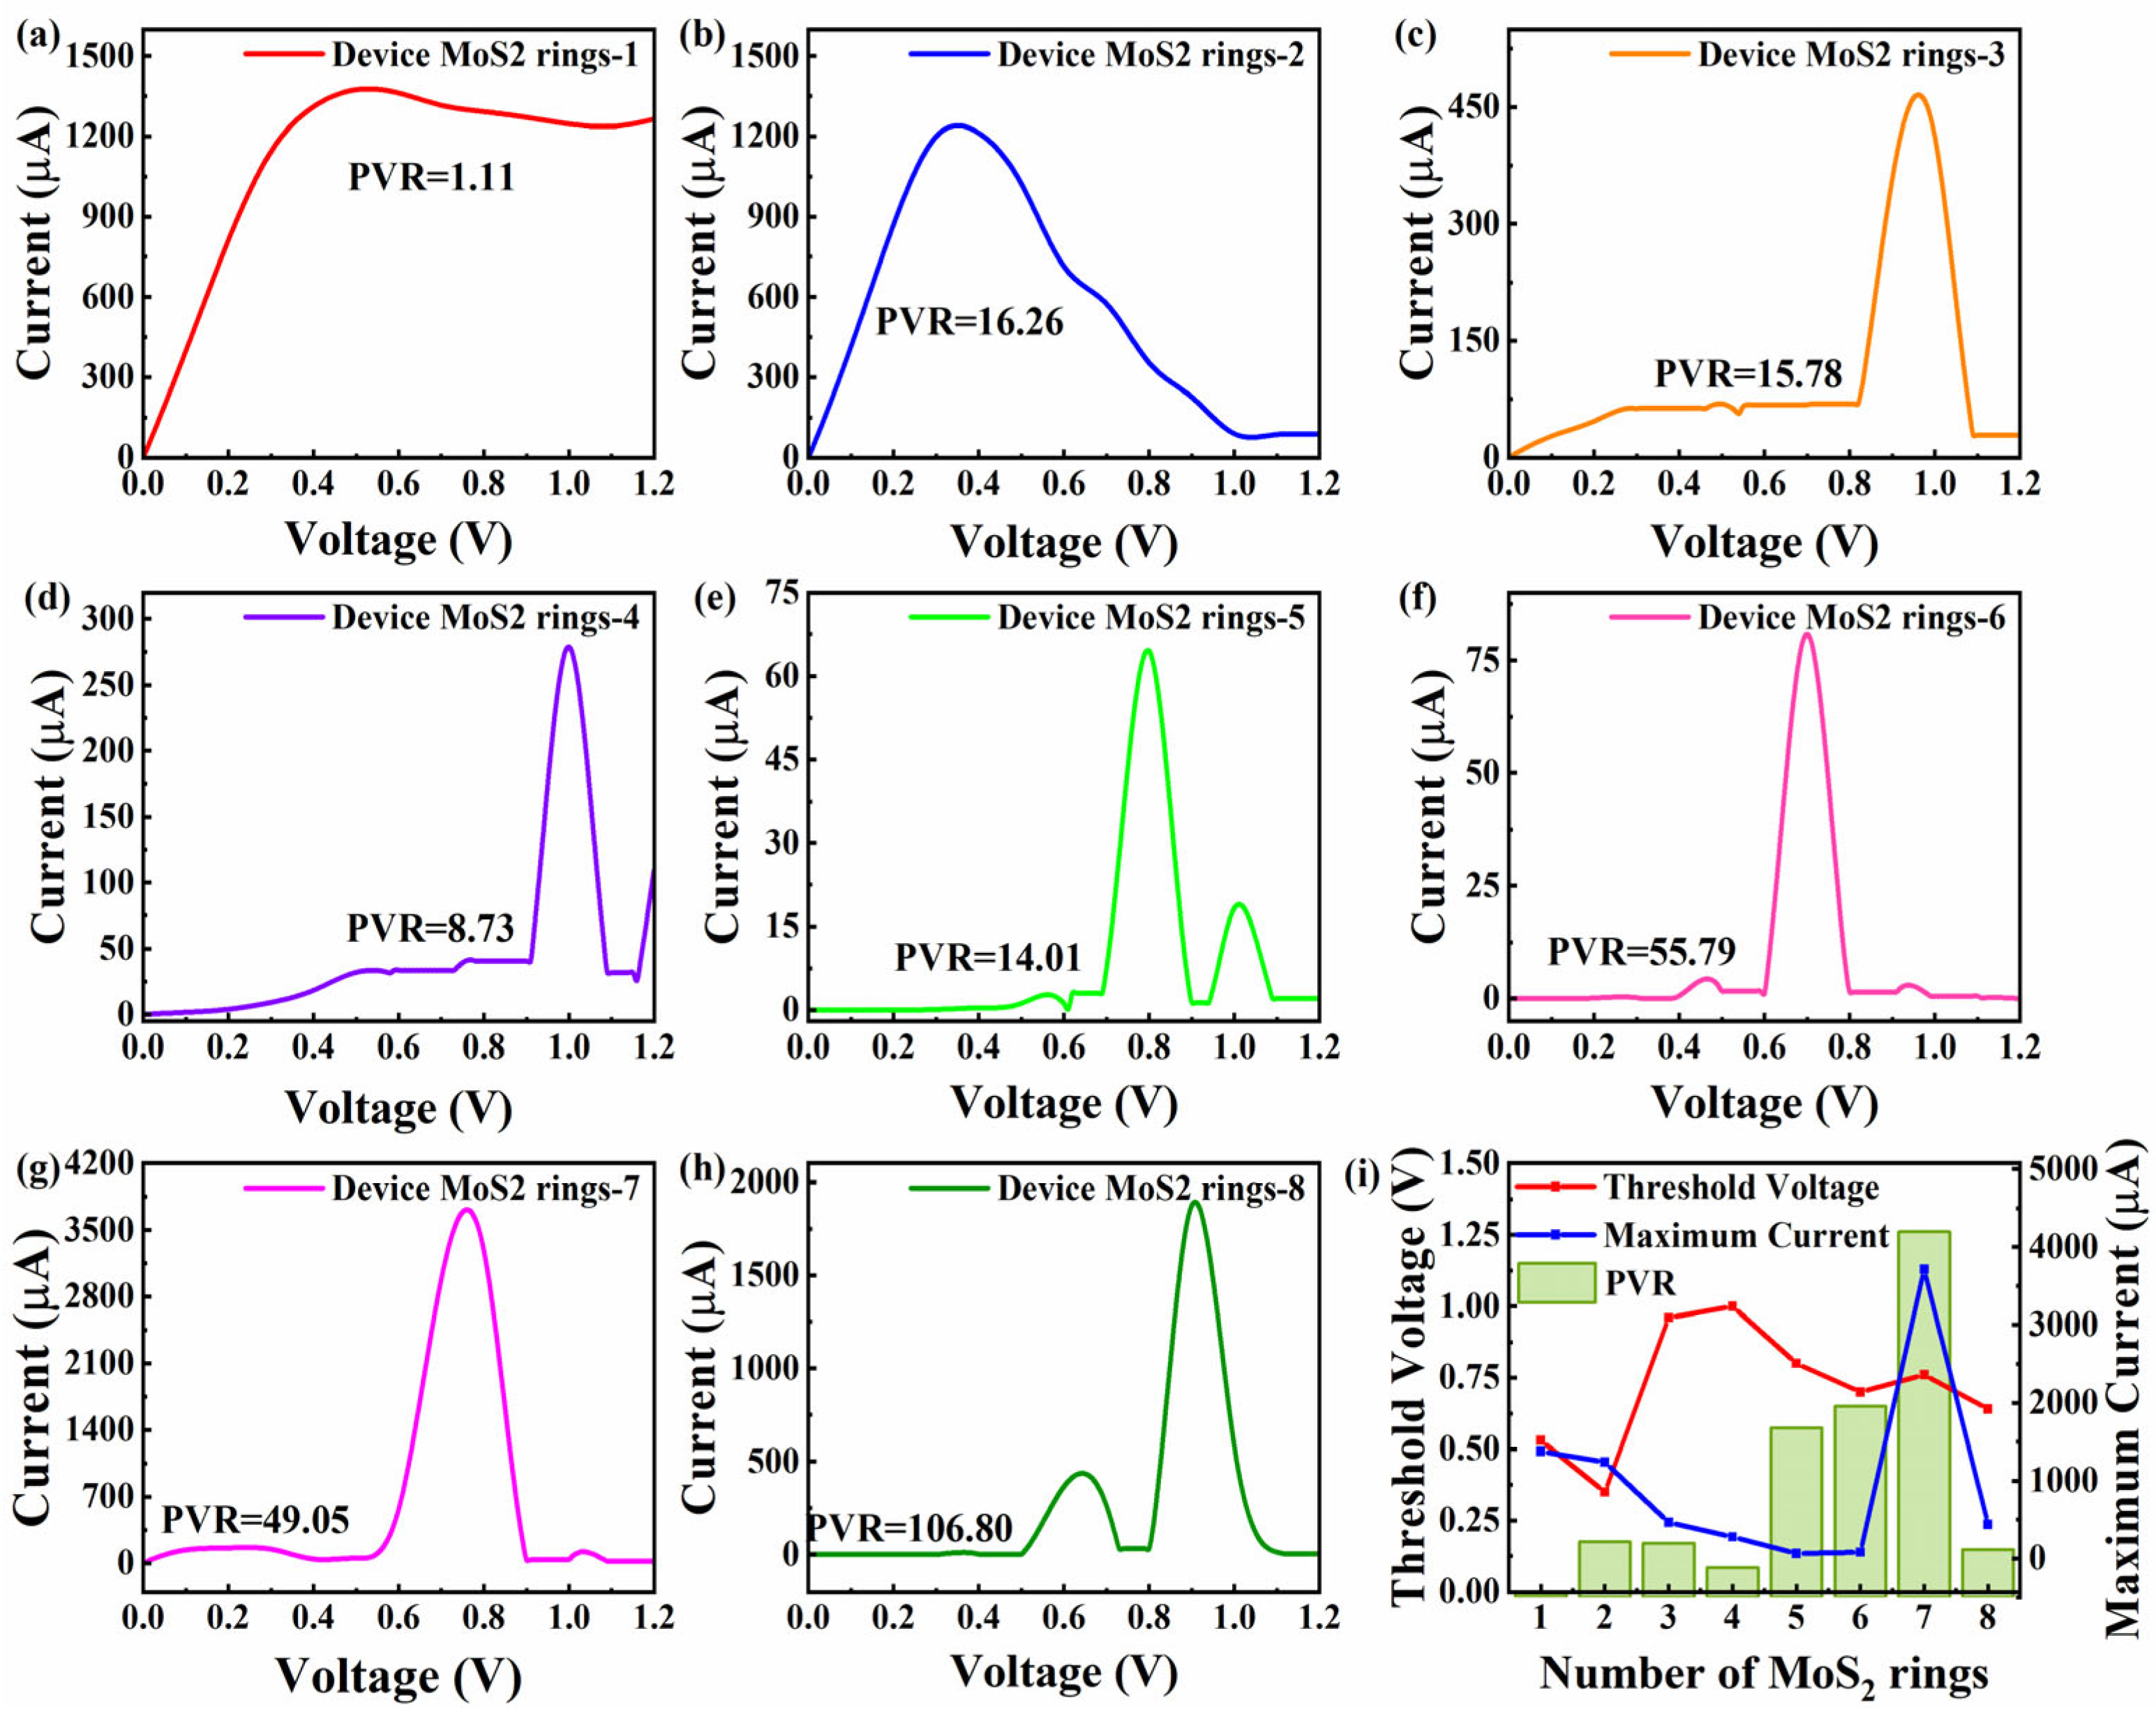
The current–voltage features are related to the practical and important nonequilibrium performance [38]. So, Figure 6 presents the current–voltage curves of Device MoS2 ring 1 to 8 in a voltage range of 0 to 1.2 V. Obviously, all the devices exhibit a negative differential resistance (NDR) effect, where the current decreases as the voltage increases. In order to properly assess the NDR effect, we provide the concept of peak-to-valley ratios (PVR). PVR is defined as the absolute ratio of the peak current to the subsequent valley current. This parameter quantitatively characterizes the intensity of the NDR effect and reflects the carrier transport mutation ability of the device under critical voltage. The two shortest chains show a relatively significant increase in current with increasing voltage, followed by the onset of NDR effects. In Figure 6a, Device MoS2 ring 1 reaches a peak current of 1376.38 μA at 0.53 V, while the current drops to 1236.09 μA at 1.08 V, with a PVR of 1.11. Similar to Device MoS2 ring 1, Device MoS2 ring 2 exhibits NDR effects at lower voltages. Device MoS2 ring 2 reaches a peak current of 1239.772 μA at 0.35 V, and drops to a valley current of 76.17 μA at 1.04 V. In contrast to Device MoS2 ring 1, the current of Device MoS2 ring 2 fluctuates more dramatically, and drops quite sharply. The NDR effect is more pronounced with the PVR of 16.26. Device MoS2 ring 3–8 have a similar trend. Before the voltage reaches the threshold voltage (0.4–0.8 V), the current of all devices is quite weak (<10 μA). When the voltage exceeds the critical value, the current surges by 2–4 orders of magnitude, accompanied by NDR effects.
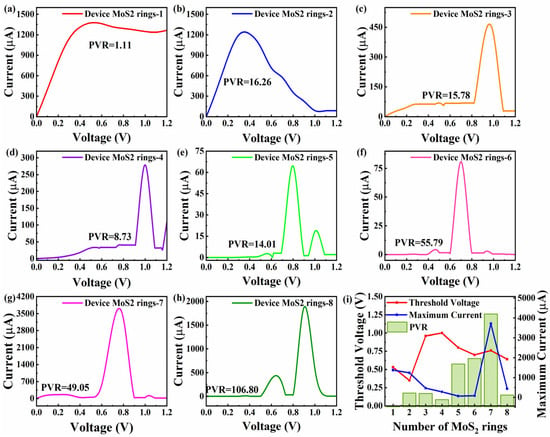
Figure 6.
(a–h) Current–voltage curves for Device MoS2 rings 1–8, respectively, with the corresponding PVR value. (i) PVR, corresponding opening voltage and maximum current value as a function of the number of rings.
When the length increases to three rings, a peak current of 465.43 μA at 0.96 V appears, and the current drops to a valley current of 39.32 μA at 1.09 V, with a PVR of 15.87. Device MoS2 ring 4 reaches a peak current of 278.50 μA at 1 V, and the current drops to a valley current of 31.89 μA at 1.1 V, with a PVR of 8.73. Although the trend of the two devices is similar, Device MoS2 ring 4 has a higher peak current and greater subsequent fluctuations. Longer chains (5–7 rings) show little changes in current until the voltage is increased to 0.6 V, and then a surge in current is triggered at 0.8 V (64.46 μA), 0.7 V (80.72 μA) and 0.76 V (3714.55 μA), respectively. The valley values show significant gradient differences and are, respectively, 1.31 μA (0.9 V), 1.45 μA (0.81 V), and 34.78 μA (0.91 V), corresponding to PVRs of 49.05, 55.79 and 106.8. In particular, Device 7 reaches an extreme peak current of 3714.55 μA at 0.76 V, which is two to three orders of magnitude higher than other devices. The shortest chain exhibits small changes in current until the voltage is raised to 0.4 V. Then, the current starts to rise sharply and exhibits an NDR effect. This device reaches a peak current of 436.51 μA at 0.64 V, and the current drops to a valley current of 31.16 μA at 0.74 V, with a PVR of 14.00. It is worth noting that Device MoS2 ring 8 experienced a second current surge after the first current trough, while Device MoS2 ring 3 to 6 experienced a lower current after NDR effects.
To reflect the influence of length on the NDR effect more directly, Figure 6i shows the change in PVR with length, as well as the corresponding threshold voltages and current maximum values. The threshold voltages of short-chain devices (Device MoS2 ring 1 and 2) are low, ranging from 0.35 to 0.53 V, showing a good low-power potential. The voltage of the medium-chain device (Device MoS2 ring 3–5) rises to 0.8–1.0 V, requiring a higher electric field to drive electron transport. The longer six-ring device has a voltage of 0.7 V, which is both efficient and stable. In terms of the features of current, the peak current of Device MoS2 ring 1 and 2 is higher (1376 μA and 1239 μA, respectively). The PVR is significantly different (1.11 and 16.26, respectively), indicating that the steep NDR effect features of Device MoS2 ring 2 are more suitable for precision switches. The PVR of medium-chain devices (Device MoS2 ring 5) and long-chain devices (Device MoS2 ring 7) jumped to 49.05 and 1066.7, respectively, where the extreme peak current of 3714.55 μA at 0.76 V appeared in Device MoS2 ring 7, two to three orders higher than other devices. Its multi-channel transport mechanism provides a new solution for nanoscale current drive. It can be seen that the NDR effect of MoS2-ring-chain-based devices varies with the length. The short-chain devices exhibit advantages due to their low power consumption, while medium-chain devices achieve an optimal balance between energy efficiency and performance. Notably, long-chain devices demonstrate superior performance potential, especially with the high PVR and extreme peak currents of Device MoS2 ring 7, as well as the distinctive double-valley effect observed in Device MoS2 ring 8.
4. Conclusions
We theoretically investigate the electron transport properties of MoS2-ring-chain-based devices of various lengths. It has been demonstrated that such a new-type device shows different recession trends in conductance with length compared to traditional molecular chains. Noticeably, Device MoS2 ring 7, with a longer chain, exhibits a higher conductance value and unique multi-transmission peak features, which even exceeds those of shorter Device MoS2 ring 4. A further analysis reveals that the electron transmission and conductance of the MoS2 chain at EF fluctuates as the length of the ring increases. The shorter chains (Device MoS2 ring 1–5) only display one transmission peak, while the longer chains (Device MoS2 ring 6–8) display the features of double transmission peaks. Device MoS2 ring 7 presents multiple transmission peaks due to its unique structure. In addition, the difference in the peak-to-peak value near EF is not obvious. In essence, both the DDOS value and the HOMO-LUMO gap for Device MoS2 ring 3 abruptly rise, and as its length increases, its electron transmission suddenly drops. With a GAP marginally greater than Device MoS2 ring 5, the DDOS peaked for Device MoS2 ring 6, although electron transmission did not rise noticeably due to its comparatively long length. Mo elements play a vital role in electron transport. The large conductance of the seven-ring MoS2 chain mainly originates from interference, which is the resonance occurring between the electrodes. This performance can be used to create new-type memory, low-power switching devices, and high-sensitivity sensors. However, structural design and environmental regulation must be taken into consideration to stabilize the mutation point.
Voltage causes a significant contrast in the relationship between the original equilibrium properties and the length. The bias greatly weakens the equilibrium conductance of shorter chains (e.g., 1–2). The devices with longer chains show much stronger conductance than the corresponding equilibrium conductance at a certain bias. The conductance of Device MoS2 ring 7 even exceeds Device MoS2 ring 1–2. Furthermore, the threshold voltage of the maximum conductance decreases as the length of the chain increases, and is eventually maintained at about 0.7 V. Instead of increasing linearly as the voltage rises, it exhibits varying degrees of NDR effect. With its high PVR and exceptional peak current performance, long-chain devices show high performance potential, especially Device MoS2 ring 7. The double-valley effect of Device MoS2 ring 8 is particularly noteworthy. These distinctive nonequilibrium electronic properties make MoS2 ring chains ideal for high-sensitivity sensors, low-power devices and precision switches, and provides a new solution for nanoscale current drive.
Author Contributions
Methodology, R.L. and J.G.; software, J.G.; formal analysis, Y.S. and J.L.; data curation, R.L.; writing—original draft preparation, Y.S. and J.L.; writing—review and editing, J.L.; funding acquisition, J.L. All authors have read and agreed to the published version of the manuscript.
Funding
This work was supported by Natural Science Foundation of Jiangsu Province (Grant No. BK20210873), Natural Science Foundation of the Higher Education Institutions of Jiangsu Province (Grant No. 24KJA460002) and the “Shenlan Talent Project” of the Jiangsu University of Science and Technology (No. 2023).
Institutional Review Board Statement
Not applicable.
Informed Consent Statement
Not applicable.
Data Availability Statement
The original contributions presented in this study are included in the article. Further inquiries can be directed to the corresponding author.
Conflicts of Interest
The authors declare no conflicts of interest.
References
- Algethami, N.; Sadeghi, H.; Sangtarash, S.; Lambert, C.J. The Conductance of Porphyrin-Based Molecular Nanowires Increases with Length. Nano Lett. 2018, 18, 4482–4486. [Google Scholar] [CrossRef] [PubMed]
- Yao, X.; Sun, X.; Lafolet, F.; Lacroix, J.-C. Long-Range Charge Transport in Diazonium-Based Single-Molecule Junctions. Nano Lett. 2020, 20, 6899–6907. [Google Scholar] [CrossRef] [PubMed]
- Zheng, J.-T.; Yan, R.-W.; Tian, J.-H.; Liu, J.-Y.; Pei, L.-Q.; Wu, D.-Y.; Dai, K.; Yang, Y.; Jin, S.; Hong, W.; et al. Electrochemically assisted mechanically controllable break junction studies on the stacking configurations of oligo(phenylene ethynylene)s molecular junctions. Electrochim. Acta 2016, 200, 268–275. [Google Scholar] [CrossRef]
- Ballmann, S.; Härtle, R.; Coto, P.B.; Elbing, M.; Mayor, M.; Bryce, M.R.; Thoss, M.; Weber, H.B. Experimental Evidence for Quantum Interference and Vibrationally Induced Decoherence in Single-Molecule Junctions. Phys. Rev. Lett. 2012, 109, 056801. [Google Scholar] [CrossRef] [PubMed]
- Bryce, M.R. A review of functional linear carbon chains (oligoynes, polyynes, cumulenes) and their applications as molecular wires in molecular electronics and optoelectronics. J. Mater. Chem. C 2021, 9, 10524–10546. [Google Scholar] [CrossRef]
- Sangtarash, S.; Vezzoli, A.; Sadeghi, H.; Ferri, N.; O’Brien, H.M.; Grace, I.; Bouffier, L.; Higgins, S.J.; Nichols, R.J.; Lambert, C.J. Gateway state-mediated, long-range tunnelling in molecular wires. Nanoscale 2018, 10, 3060–3067. [Google Scholar] [CrossRef] [PubMed]
- Zhang, B.; Ryan, E.; Wang, X.; Song, W.; Lindsay, S. Electronic Transport in Molecular Wires of Precisely Controlled Length Built from Modular Proteins. ACS Nano 2022, 16, 1671–1680. [Google Scholar] [CrossRef] [PubMed]
- Patrick, C.W.; Woods, J.F.; Gawel, P.; Otteson, C.E.; Thompson, A.L.; Claridge, T.D.W.; Jasti, R.; Anderson, H.L. Polyyne 3 Rotaxanes: Synthesis via Dicobalt Carbonyl Complexes and Enhanced Stability. Angew. Chem. Int. Ed. 2022, 61, e202116897. [Google Scholar] [CrossRef] [PubMed]
- Li, P.; Jia, C.; Guo, X. Molecule-Based Transistors: From Macroscale to Single Molecule. Chem. Rec. 2021, 21, 1284–1299. [Google Scholar] [CrossRef] [PubMed]
- Yang, S.-Y.; Qu, Y.-K.; Liao, L.-S.; Jiang, Z.-Q.; Lee, S.-T. Research Progress of Intramolecular π-Stacked Small Molecules for Device Applications. Adv. Mater. 2022, 34, e2104125. [Google Scholar] [CrossRef] [PubMed]
- Gu, M.-W.; Peng, H.H.; Chen, I.W.P.; Chen, C.-h. Tuning surface d bands with bimetallic electrodes to facilitate electron transport across molecular junctions. Nat. Mater. 2021, 20, 658–664. [Google Scholar] [CrossRef] [PubMed]
- Naher, M.; Milan, D.C.; Al-Owaedi, O.A.; Planje, I.J.; Bock, S.; Hurtado-Gallego, J.; Bastante, P.; Abd Dawood, Z.M.; Rincon-Garcia, L.; Rubio-Bollinger, G.; et al. Molecular Structure-(Thermo)electric Property Relationships in Single-Molecule Junctions and Comparisons with Single and Multiple-Parameter Models. J. Am. Chem. Soc. 2021, 143, 3817–3829. [Google Scholar] [CrossRef] [PubMed]
- Li, J.; Li, T.; Duan, Y.; Li, H. “Even” conducting superiority in molecular wires designed by porphyrin and graphene nanoribbons. Mater. Des. 2020, 189, 108487. [Google Scholar] [CrossRef]
- Song, D.; Liu, K.; Li, J.; Zhu, H.; Sun, L.; Okulov, A. Mechanical tensile behavior-induced multi-level electronic transport of ultra-thin SiC NWs. Mater. Today Commun. 2023, 36, 106528. [Google Scholar] [CrossRef]
- Li, L.; Low, J.Z.; Wilhelm, J.; Liao, G.; Gunasekaran, S.; Prindle, C.R.; Starr, R.L.; Golze, D.; Nuckolls, C.; Steigerwald, M.L.; et al. Highly conducting single-molecule topological insulators based on mono- and di-radical cations. Nat. Chem. 2022, 14, 1061–1067. [Google Scholar] [CrossRef] [PubMed]
- Guldi, D.M.; Nishihara, H.; Venkataraman, L. Molecular wires. Chem. Soc. Rev. 2015, 44, 842–844. [Google Scholar] [CrossRef] [PubMed]
- Robertson, N.; McGowan, C.A. A comparison of potential molecular wires as components for molecular electronics. Chem. Soc. Rev. 2003, 32, 96–103. [Google Scholar] [CrossRef] [PubMed]
- Liu, M.; Wang, J.-A.; Klysubun, W.; Wang, G.-G.; Sattayaporn, S.; Li, F.; Cai, Y.-W.; Zhang, F.; Yu, J.; Yang, Y. Interfacial electronic structure engineering on molybdenum sulfide for robust dual-pH hydrogen evolution. Nat. Commun. 2021, 12, 5260. [Google Scholar] [CrossRef] [PubMed]
- Yu, L.; Guo, F.; Liu, S.; Qi, J.; Yin, M.; Yang, B.; Liu, Z.; Fan, X.H. Hierarchical 3D flower-like MoS2 spheres: Post-thermal treatment in vacuum and their NO2 sensing properties. Mater. Lett. 2016, 183, 122–126. [Google Scholar] [CrossRef]
- Deng, J.; Li, H.; Wang, S.; Ding, D.; Chen, M.; Liu, C.; Tian, Z.; Novoselov, K.S.; Ma, C.; Deng, D.; et al. Multiscale structural and electronic control of molybdenum disulfide foam for highly efficient hydrogen production. Nat. Commun. 2017, 8, 14430. [Google Scholar] [CrossRef] [PubMed]
- Joshi, B.; Khalil, A.M.E.; Zhang, S.; Memon, F.A.; Yang, Z. Application of 2D MoS2 Nanoflower for the Removal of Emerging Pollutants from Water. ACS Eng. Au 2023, 3, 461–476. [Google Scholar] [CrossRef] [PubMed]
- Wang, S.; Li, G.; Du, G.; Jiang, X.; Feng, C.; Guo, Z.; Kim, S.-J. Hydrothermal Synthesis of Molybdenum Disulfide for Lithium Ion Battery Applications. Chin. J. Chem. Eng. 2010, 18, 910–913. [Google Scholar] [CrossRef]
- Xu, H.; Liu, S.; Ding, Z.; Tan, S.J.R.; Yam, K.M.; Bao, Y.; Nai, C.T.; Ng, M.-F.; Lu, J.; Zhang, C.; et al. Oscillating edge states in one-dimensional MoS2 nanowires. Nat. Commun. 2016, 7, 12904. [Google Scholar] [CrossRef] [PubMed]
- Chen, Y.M.; Yu, X.Y.; Li, Z.; Paik, U.; Lou, X.W. Hierarchical MoS2 tubular structures internally wired by carbon nanotubes as a highly stable anode material for lithium-ion batteries. Sci. Adv. 2016, 2, e1600021. [Google Scholar] [CrossRef] [PubMed]
- Chithaiah, P.; Ghosh, S.; Idelevich, A.; Rovinsky, L.; Livneh, T.; Zak, A. Solving the “MoS(2) Nanotubes” Synthetic Enigma and Elucidating the Route for Their Catalyst-Free and Scalable Production. ACS Nano 2020, 14, 3004–3016. [Google Scholar] [CrossRef] [PubMed]
- Lauhon, L.J.; Gudiksen, M.S.; Wang, D.; Lieber, C.M. Epitaxial core-shell and core-multishell nanowire heterostructures. Nature 2002, 420, 57–61. [Google Scholar] [CrossRef] [PubMed]
- Low, J.; Yu, J.; Jaroniec, M.; Wageh, S.; Al-Ghamdi, A.A. Heterojunction Photocatalysts. Adv. Mater. 2017, 29, 1601694. [Google Scholar] [CrossRef] [PubMed]
- Brandbyge, M.; Mozos, J.-L.; Ordejón, P.; Taylor, J.; Stokbro, K. Density-functional method for nonequilibrium electron transport. Phys. Rev. B 2002, 65, 165401. [Google Scholar] [CrossRef]
- Taylor, J.; Guo, H.; Wang, J. Ab initio modeling of quantum transport properties of molecular electronic devices. Phys. Rev. B 2001, 63, 245407. [Google Scholar] [CrossRef]
- Liu, R.; Li, J.; Liu, K.; Okulov, A. “V”-Shaped Changing Electronic Performance of Iodinene-Based Nanoflakes as a Function of Width. Inorg. Chem. 2024, 63, 21012–21024. [Google Scholar] [CrossRef] [PubMed]
- Landauer, R. Electrical resistance of disordered one-dimensional lattices. Philos. Mag. J. Theor. Exp. Appl. Phys. 1970, 21, 863–867. [Google Scholar] [CrossRef]
- Reed, M.A.; Zhou, C.; Muller, C.J.; Burgin, T.P.; Tour, J.M. Conductance of a Molecular Junction. Science 1997, 278, 252–254. [Google Scholar] [CrossRef]
- Datta, S. Electronic Transport in Mesoscopic Systems; Cambridge University Press: Cambridge, UK, 1997. [Google Scholar]
- Li, H.; Garner, M.H.; Su, T.A.; Jensen, A.; Inkpen, M.S.; Steigerwald, M.L.; Venkataraman, L.; Solomon, G.C.; Nuckolls, C. Extreme Conductance Suppression in Molecular Siloxanes. J. Am. Chem. Soc. 2017, 139, 10212–10215. [Google Scholar] [CrossRef] [PubMed]
- Zhang, L.; Li, T.; Li, J.; Jiang, Y.; Yuan, J.; Li, H. Perfect Spin Filtering Effect on Fe3GeTe2-Based Van der Waals Magnetic Tunnel Junctions. J. Phys. Chem. C 2020, 124, 27429–27435. [Google Scholar] [CrossRef]
- Bischoff, F.; Seufert, K.; Auwärter, W.; Joshi, S.; Vijayaraghavan, S.; Écija, D.; Diller, K.; Papageorgiou, A.C.; Fischer, S.; Allegretti, F.; et al. How Surface Bonding and Repulsive Interactions Cause Phase Transformations: Ordering of a Prototype Macrocyclic Compound on Ag(111). ACS Nano 2013, 7, 3139–3149. [Google Scholar] [CrossRef] [PubMed]
- Nazarov, Y.V.; Blanter, Y.M. Quantum Transport: Introduction to Nanoscience; Cambridge University Press: Cambridge, UK, 2009. [Google Scholar]
- Cao, J.; Dong, J.; Saglik, K.; Zhang, D.; Solco, S.F.D.; You, I.J.W.J.; Liu, H.; Zhu, Q.; Xu, J.; Wu, J.; et al. Non-equilibrium strategy for enhancing thermoelectric properties and improving stability of AgSbTe2. Nano Energy 2023, 107, 108118. [Google Scholar] [CrossRef]
Disclaimer/Publisher’s Note: The statements, opinions and data contained in all publications are solely those of the individual author(s) and contributor(s) and not of MDPI and/or the editor(s). MDPI and/or the editor(s) disclaim responsibility for any injury to people or property resulting from any ideas, methods, instructions or products referred to in the content. |
© 2025 by the authors. Licensee MDPI, Basel, Switzerland. This article is an open access article distributed under the terms and conditions of the Creative Commons Attribution (CC BY) license (https://creativecommons.org/licenses/by/4.0/).

