Article

Effects of Pulse Ion Source Arc Voltage on the Structure and Friction Properties of Ta-C Thin Films on NBR Surface

1
College of Mechanical and Electrical Engineering, Nanjing University of Aeronautics and Astronautics, Nanjing 210016, China
2
Jiangsu Xuzhou Construction Machinery Research Institute Co., Ltd., Xuzhou Construction Machinery Group, Xuzhou 221004, China
3
State Key Laboratory of Intelligent Manufacturing of Advanced Construction Machinery, Xuzhou 221004, China
*
Author to whom correspondence should be addressed.
Coatings 2025, 15(7), 809; https://doi.org/10.3390/coatings15070809
Submission received: 19 June 2025 / Revised: 3 July 2025 / Accepted: 8 July 2025 / Published: 10 July 2025
(This article belongs to the Section Thin Films)

Abstract

Nitrile rubber (NBR) is prone to adhesion and hysteresis deformation when in contact with hard materials, leading to wear failure. To mitigate this issue, the deposition of diamond-like carbon (DLC) films onto the rubber surface is a commonly employed method. By utilizing pulsed arc ion plating technology and adjusting the arc voltage of the pulsed arc ion source, tetrahedral amorphous carbon (ta-C) films with varying sp3 content were prepared on the surface of NBR. The effects of arc voltage on the structural composition and friction performance of NBR/ta-C materials were examined. A scanning electron microscopy analysis revealed that the ta-C film applied to the surface of NBR was uniform and dense, exhibiting typical network crack characteristics. The results of Raman spectroscopy and X-ray photoelectron spectroscopy indicated that as the arc voltage increased, the sp3 content in the film initially rose before declining, reaching a maximum of 72.28% at 300 V. Mechanical tests demonstrated that the bonding strength and friction performance of the film are primarily influenced by the percentage of sp3 content. Notably, the ta-C film with lower sp3 content demonstrates enhanced wear resistance. At 200 V, the sp3 content of the film is 58.16%, resulting in optimal friction performance characterized by a stable friction coefficient of 0.38 and minimal wear weight loss. This performance is attributed to the protective qualities of the ta-C film and the formation of a graphitized transfer film. These results provide valuable insights for the design and development of wear-resistant rubber materials.

1. Introduction

Nitrile rubber (NBR) has been widely used as a sealing ring material in automotive, aerospace, petrochemical, and other sealing systems due to its excellent oil resistance, wear resistance, and low cost. However, limited by its low elastic modulus and high viscoelasticity, NBR is prone to adhesion and hysteresis deformation when in contact with hard counterparts, making it susceptible to wear failure. Therefore, friction and wear performance are crucial in determining the performance of nitrile rubber products [1,2]. To tackle these challenges, protective coatings—such as metal, non-metal, and carbon-based films—are typically applied to the surface of NBR. Among these coatings, diamond-like carbon (DLC) films are particularly notable due to their chemical compatibility with rubber, low adhesion to hard materials, and excellent friction and wear properties. This makes DLC films one of the most suitable options for wear-resistant modifications of nitrile rubber surfaces [3,4].
Currently, DLC films are mainly deposited on nitrile rubber (NBR) surfaces using magnetron sputtering (MS) or plasma chemical vapor deposition (PCVD) techniques to produce hydrogen-containing amorphous carbon (a-C:H) films [5,6]. Lubwama et al. [7] prepared a-C:H films on NBR surfaces by combining closed-field non-equilibrium magnetron sputtering with PECVD, using Ar/C4H10 gas mixture as the precursor. The results showed that the film coefficients of friction (COFs) increase between 0.25 and 0.4 to between 0.45 and 0.6 during 5000 cycles at load of 5 N, while maintaining excellent adhesion through the incorporation of a Si-C interlayer. In another study, Nakahigashi et al. [8] employed RF-PCVD to deposit a-C:H films on NBR surfaces reporting a significant reduction in COFs under dry friction conditions—from approximately 1.5 to 0.6—at a load of 0.1 N. In another work, Martínez et al. [9] applied PECVD to deposit a-C:H coatings on NBR, which not only significantly reduced COFs under a 10 N load but also mitigated friction-induced noise. The application of a-C:H films considerably improves the wear resistance of NBR; however, these coatings have some limitations. They exhibit poor thermal stability and insufficient oxidation resistance, which restricts their use in rubber seals operating in complex or harsh conditions [10].
Tetrahedral amorphous carbon (ta-C) is a hydrogen-free diamond-like carbon film characterized by a high proportion of sp3 hybridized bonds, typically exceeding 50%. It possesses diamond-like properties, including exceptional hardness, a high elastic modulus, a low friction coefficient, high wear resistance, excellent corrosion resistance, and chemical inertness. These qualities have led to its widespread use in cutting tools and as protective coatings for components that experience mechanical friction [11,12]. The research and development of ta-C film materials have gained significant attention due to their excellent performance. However, there have been no reports on the preparation of ta-C films on NBR surfaces. This lack of research is primarily attributed to the limited thermal stability of NBR, which can deform under high temperatures, leading to film failure during the deposition process. Therefore, it is crucial to minimize the rise in surface temperature during the deposition of ta-C films on NBR substrates. The pulsed arc ion source employs pulsed discharge instead of continuous discharge, generating an instantaneous discharge current that can reach several thousand amperes. This allows for the rapid evaporation of high-melting-point materials. Between pulsed discharges, a circulating cooling water system efficiently removes heat from the target, thereby controlling the target temperature and significantly reducing the energy carried by the plasma. As a result, the temperature increase on the substrate surface during deposition can be kept within 5 °C [13], making this technique suitable for applying ta-C films to nitrile rubber surfaces. In this work, ta-C films were deposited onto nitrile rubber substrates using a custom-designed pulsed arc ion plating system. The role of arc voltage in shaping the films’ microstructural evolution and tribological performance was systematically explored, integrating experimental findings with theoretical analysis to refine the deposition protocol for enhanced film quality and durability.

2. Experiment Design

2.1. Sample Material

Nitrile rubber sheets from Longli Sealing Technology Co., Ltd. (Hengshui, China) measuring 50 mm × 50 mm × 2 mm, were used as the substrate material. Single-crystal silicon wafers (100) with dimensions of 20 mm × 20 mm × 1 mm were used as reference substrates and co-deposited with nitrile rubber during the ta-C film deposition process. Selected regions of the silicon wafers were masked with adhesive tape prior to deposition to generate a well-defined step edge, enabling accurate measurement of film thickness. To ensure cleanliness, the samples were ultrasonically cleaned in distilled water and anhydrous ethanol for 10 min, effectively removing surface oil and impurities. After cleaning, the samples were dried in a forced-air oven at a temperature of 50 °C for 60 min. Once cooled to room temperature, the samples were ready for use.

2.2. Sample Preparation

Ta-C films were deposited onto the surface of a nitrile rubber sheet using the self-developed pulsed arc ion plating equipment PVCA-800. This equipment is equipped with a Hall ion source for ion cleaning, and the process gas is 99.999% high-purity argon. A pulsed arc ion source is used for depositing ta-C films, and the cathode employs a high-purity graphite target (99.999%) with a diameter of 49 mm. A schematic diagram of the equipment structure is shown in Figure 1a.
A schematic diagram of the pulsed arc ion source is presented in Figure 1b. The fundamental operating principle of this type of ion source relies on a multilevel triggering system. Capacitor C1 is connected between the primary ignition graphite cathode and the ignition graphite anode, with a ceramic layer coated with a conductive film placed in between. The charging voltage of capacitor C1 is set at 500 V. Capacitor C2 is connected between the secondary ignition graphite cathode and the ignition graphite anode, with a constant charging voltage of 300 V. Meanwhile, capacitor C3 is connected between the graphite cathode target and the copper discharge anode, with a charging voltage ranging from 150 V to 350 V. The charging voltage of C3, known as the arc voltage, directly determines the energy released to generate carbon ions. When C1, C2, and C3 are fully charged, a discharge phenomenon occurs on the surface of the conductive layer on the ceramic. As the plasma concentration increases, C2 begins to discharge, creating an arc between the secondary ignition graphite cathode and the ignition anode. This is followed by C3, which drives the plasma to move between the graphite cathode and the copper anode, initiating arc discharge based on the energy stored in C3. Once the energy in C3 is completely released, the pulsed arc discharge cycle is complete [14].
The steps for depositing ta-C films on the surface of nitrile rubber using pulsed arc ion plating technology are as follows:
(1)
the cleaned nitrile rubber substrates were mounted onto a rotating support inside the vacuum chamber. The chamber was sealed and evacuated to a base pressure of 5 × 10⁻³ Pa. High-purity argon gas was introduced into the vacuum chamber at a pressure of 0.13 Pa. A Hall ion source was employed to excite the argon gas, generating argon ions to bombard the substrate surface. This ion cleaning process removed residual contaminants and enhanced film-substrate adhesion. The ion source was operated at a current of 60 mA, with an etching duration of 5 min.
(2)
A high-purity graphite target (99.999%) was used as the cathode. The ta-C deposition processes were carried out with fixed pulse frequency and pulse count. The arc voltage was varied to investigate its effect on the deposited film. Starting from the equipment’s minimum arc voltage, which is 150 V, the voltage was increased in 50 V increments up to 350 V. Five sets of ta-C films were prepared. The detailed deposition parameters are shown in Table 1.
Deposited film thickness of the samples 2–6 are 58 nm, 100 nm, 156 nm, 225 nm, 310 nm, respectively.

2.3. Structural Characterization and Performance Testing

The thickness of the thin films deposited on silicon wafers were measured by using a step profiler (Dektak XT, Bruker, Billerica, MA, USA). The surface micro-morphology of the substrate and the film was characterized using a field emission scanning electron microscope (Verios 5UC, Thermo Fisher, Waltham, MA, USA) at a voltage of 10 kV. The surface roughness of the prepared film was measured using a roughness meter (S25, Taylor, Leicester, UK). The Andor SR-500i confocal Raman spectrometer was employed to obtain the Raman spectrum of the film with an excitation wavelength of 532 nm and a scanning range of 500~2500 cm−1. The chemical bonding state of the film surface elements was determined using a X-ray photoelectron spectrometer (EscaLab Xi+, Thermo Fisher, Waltham, MA, USA). The film adhesion strength was qualitatively evaluated using the X-cut test. Specifically, tape (600, 3M, Saint Paul, MN, USA) with adhesive force of 40 ± 4 N/100 mm was pressed onto the film surface under a constant 5 N load. After 15 min, the tape was rapidly removed, and the X-cut area was examined under an optical microscope to evaluate film peeling or delamination. The friction coefficient was measured under dry friction conditions using the rotary mode of a tribometer (UMT-2MT, Bruker, Billerica, MA, USA). The friction pair was a GCr15 steel ball (3 mm diameter) with a normal load of 1 N, a track diameter of 10 mm, a sliding speed of 10 cm/s, and a test duration of 60 min. The instrument continuously recorded the coefficient of friction during the test. Mass loss before and after wear testing was determined using a precision electronic balance (JJ124BC, G&G, Suzhou, JS, CN) with an accuracy of 0.0001 g. The worn surface morphology was further analyzed using a field emission scanning electron microscope (Verios 5UC, Thermo Fisher).

3. Results and Discussion

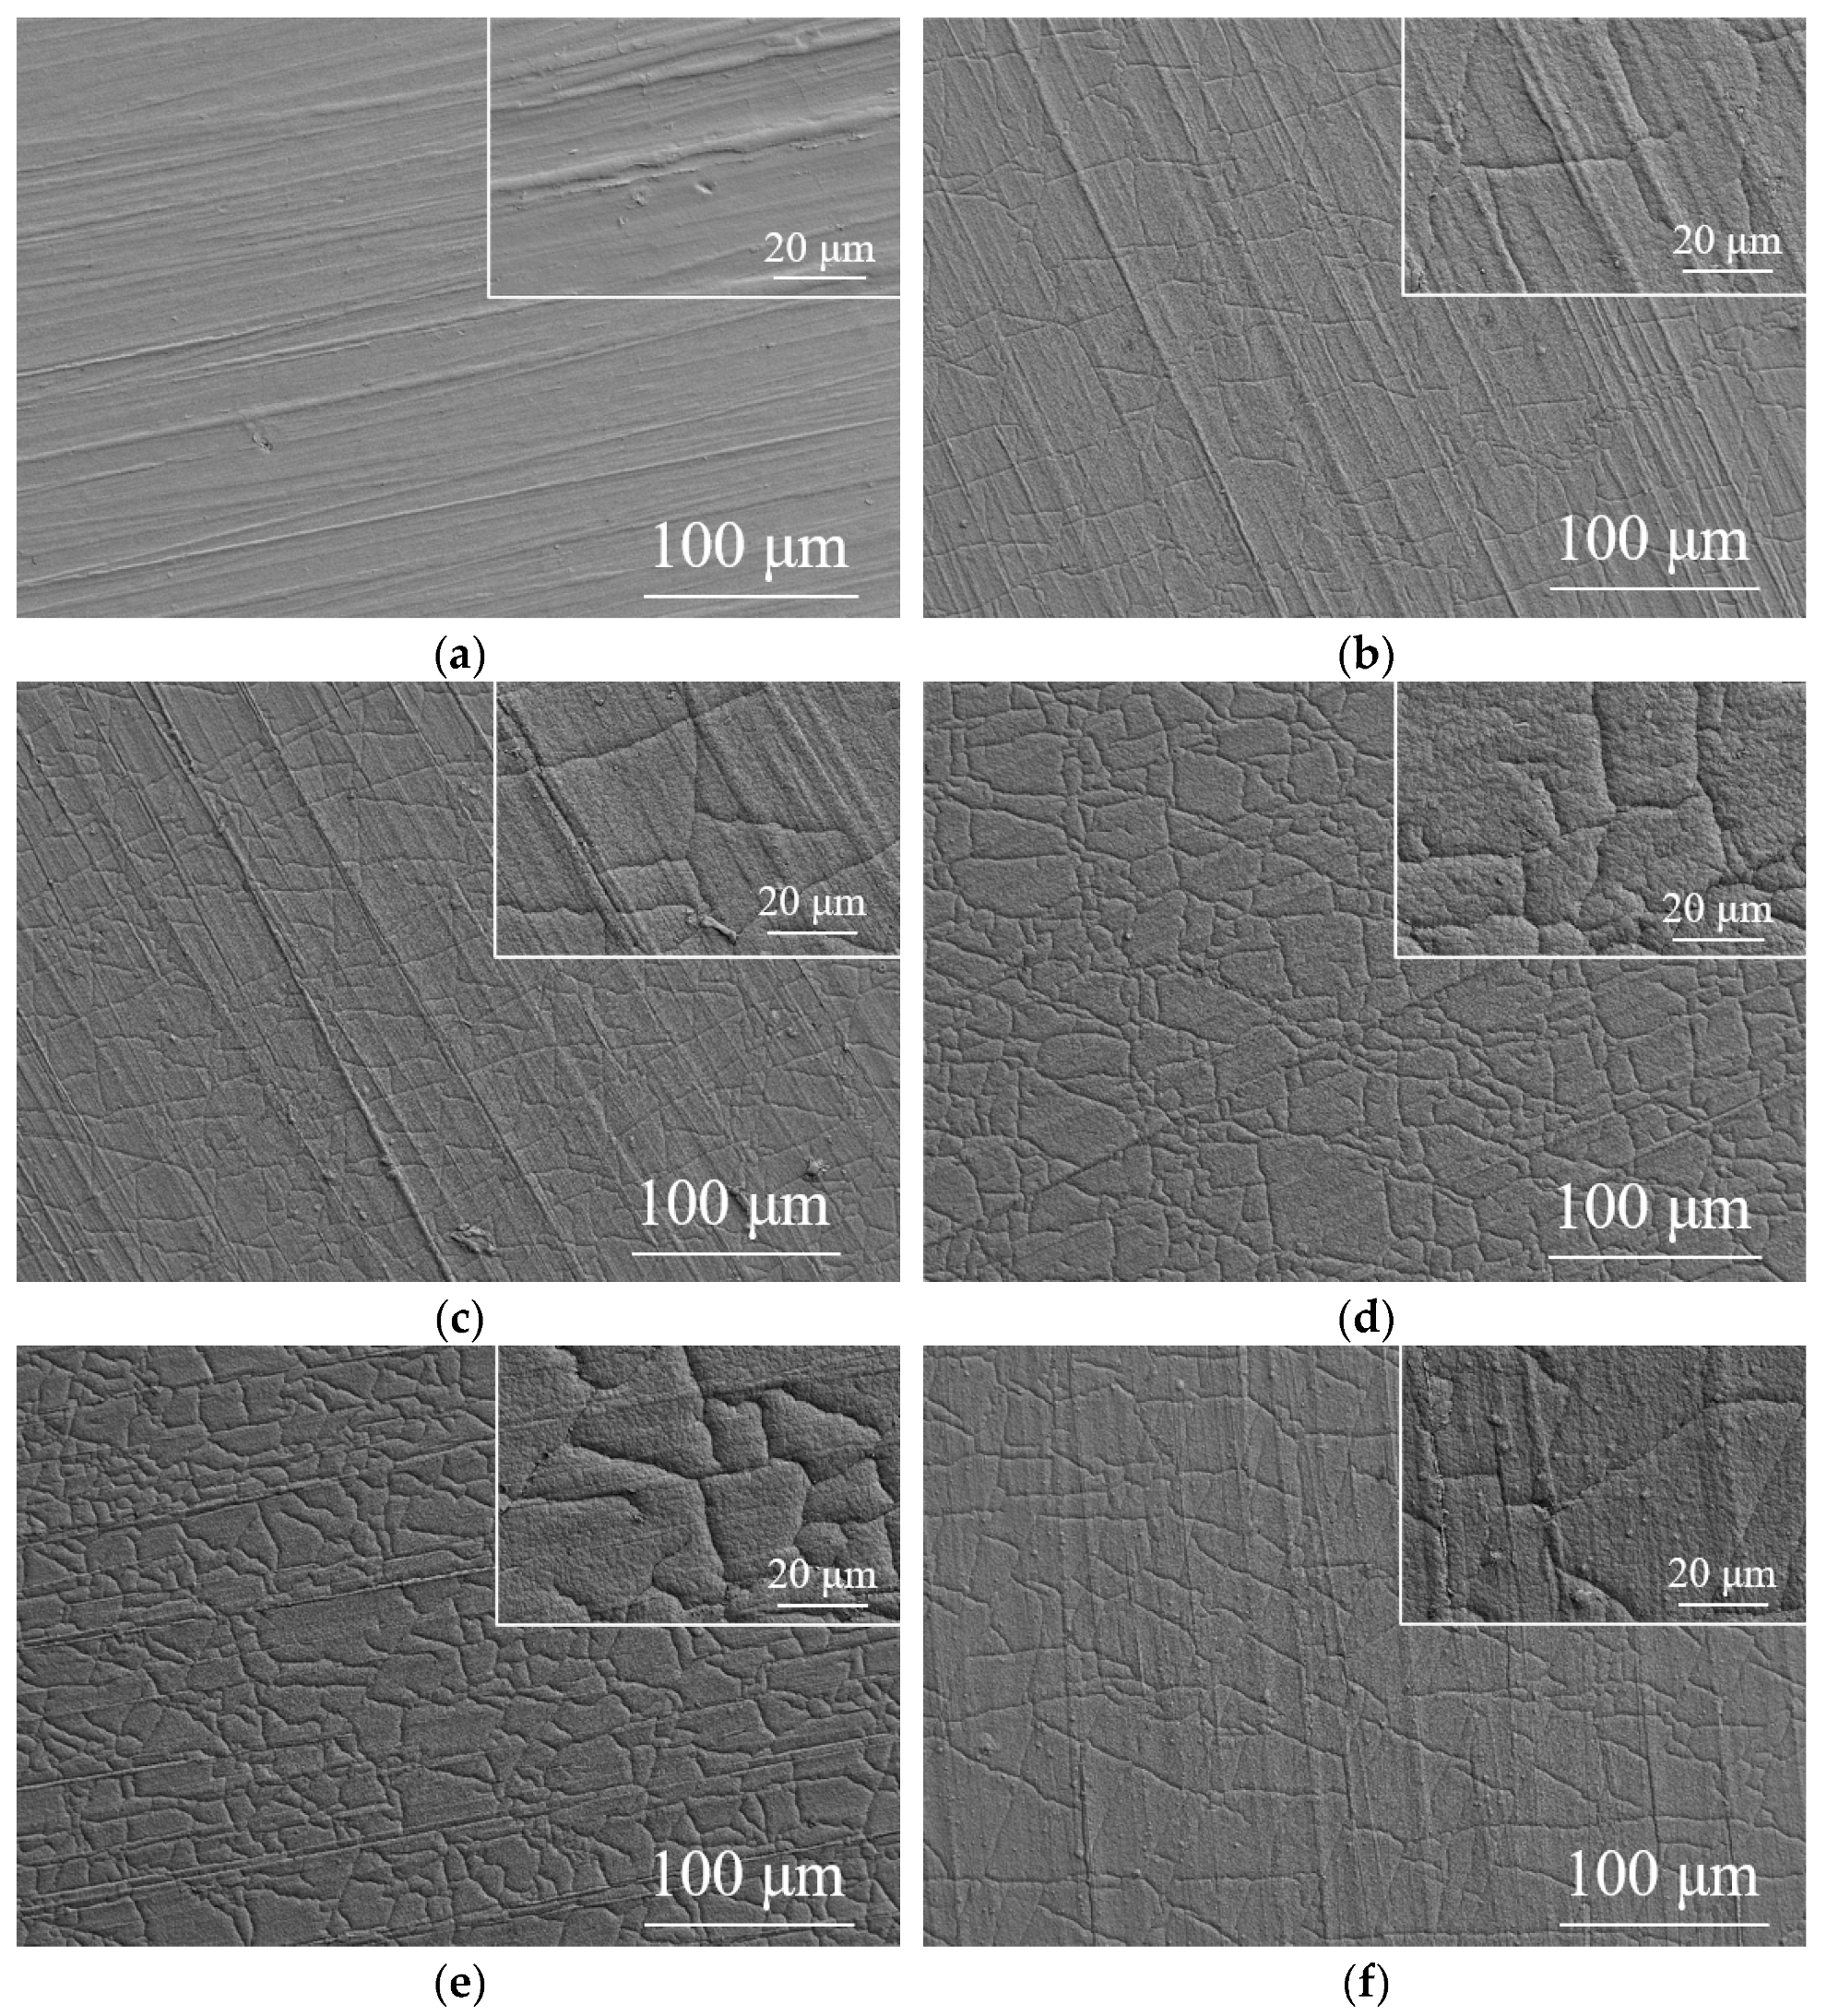
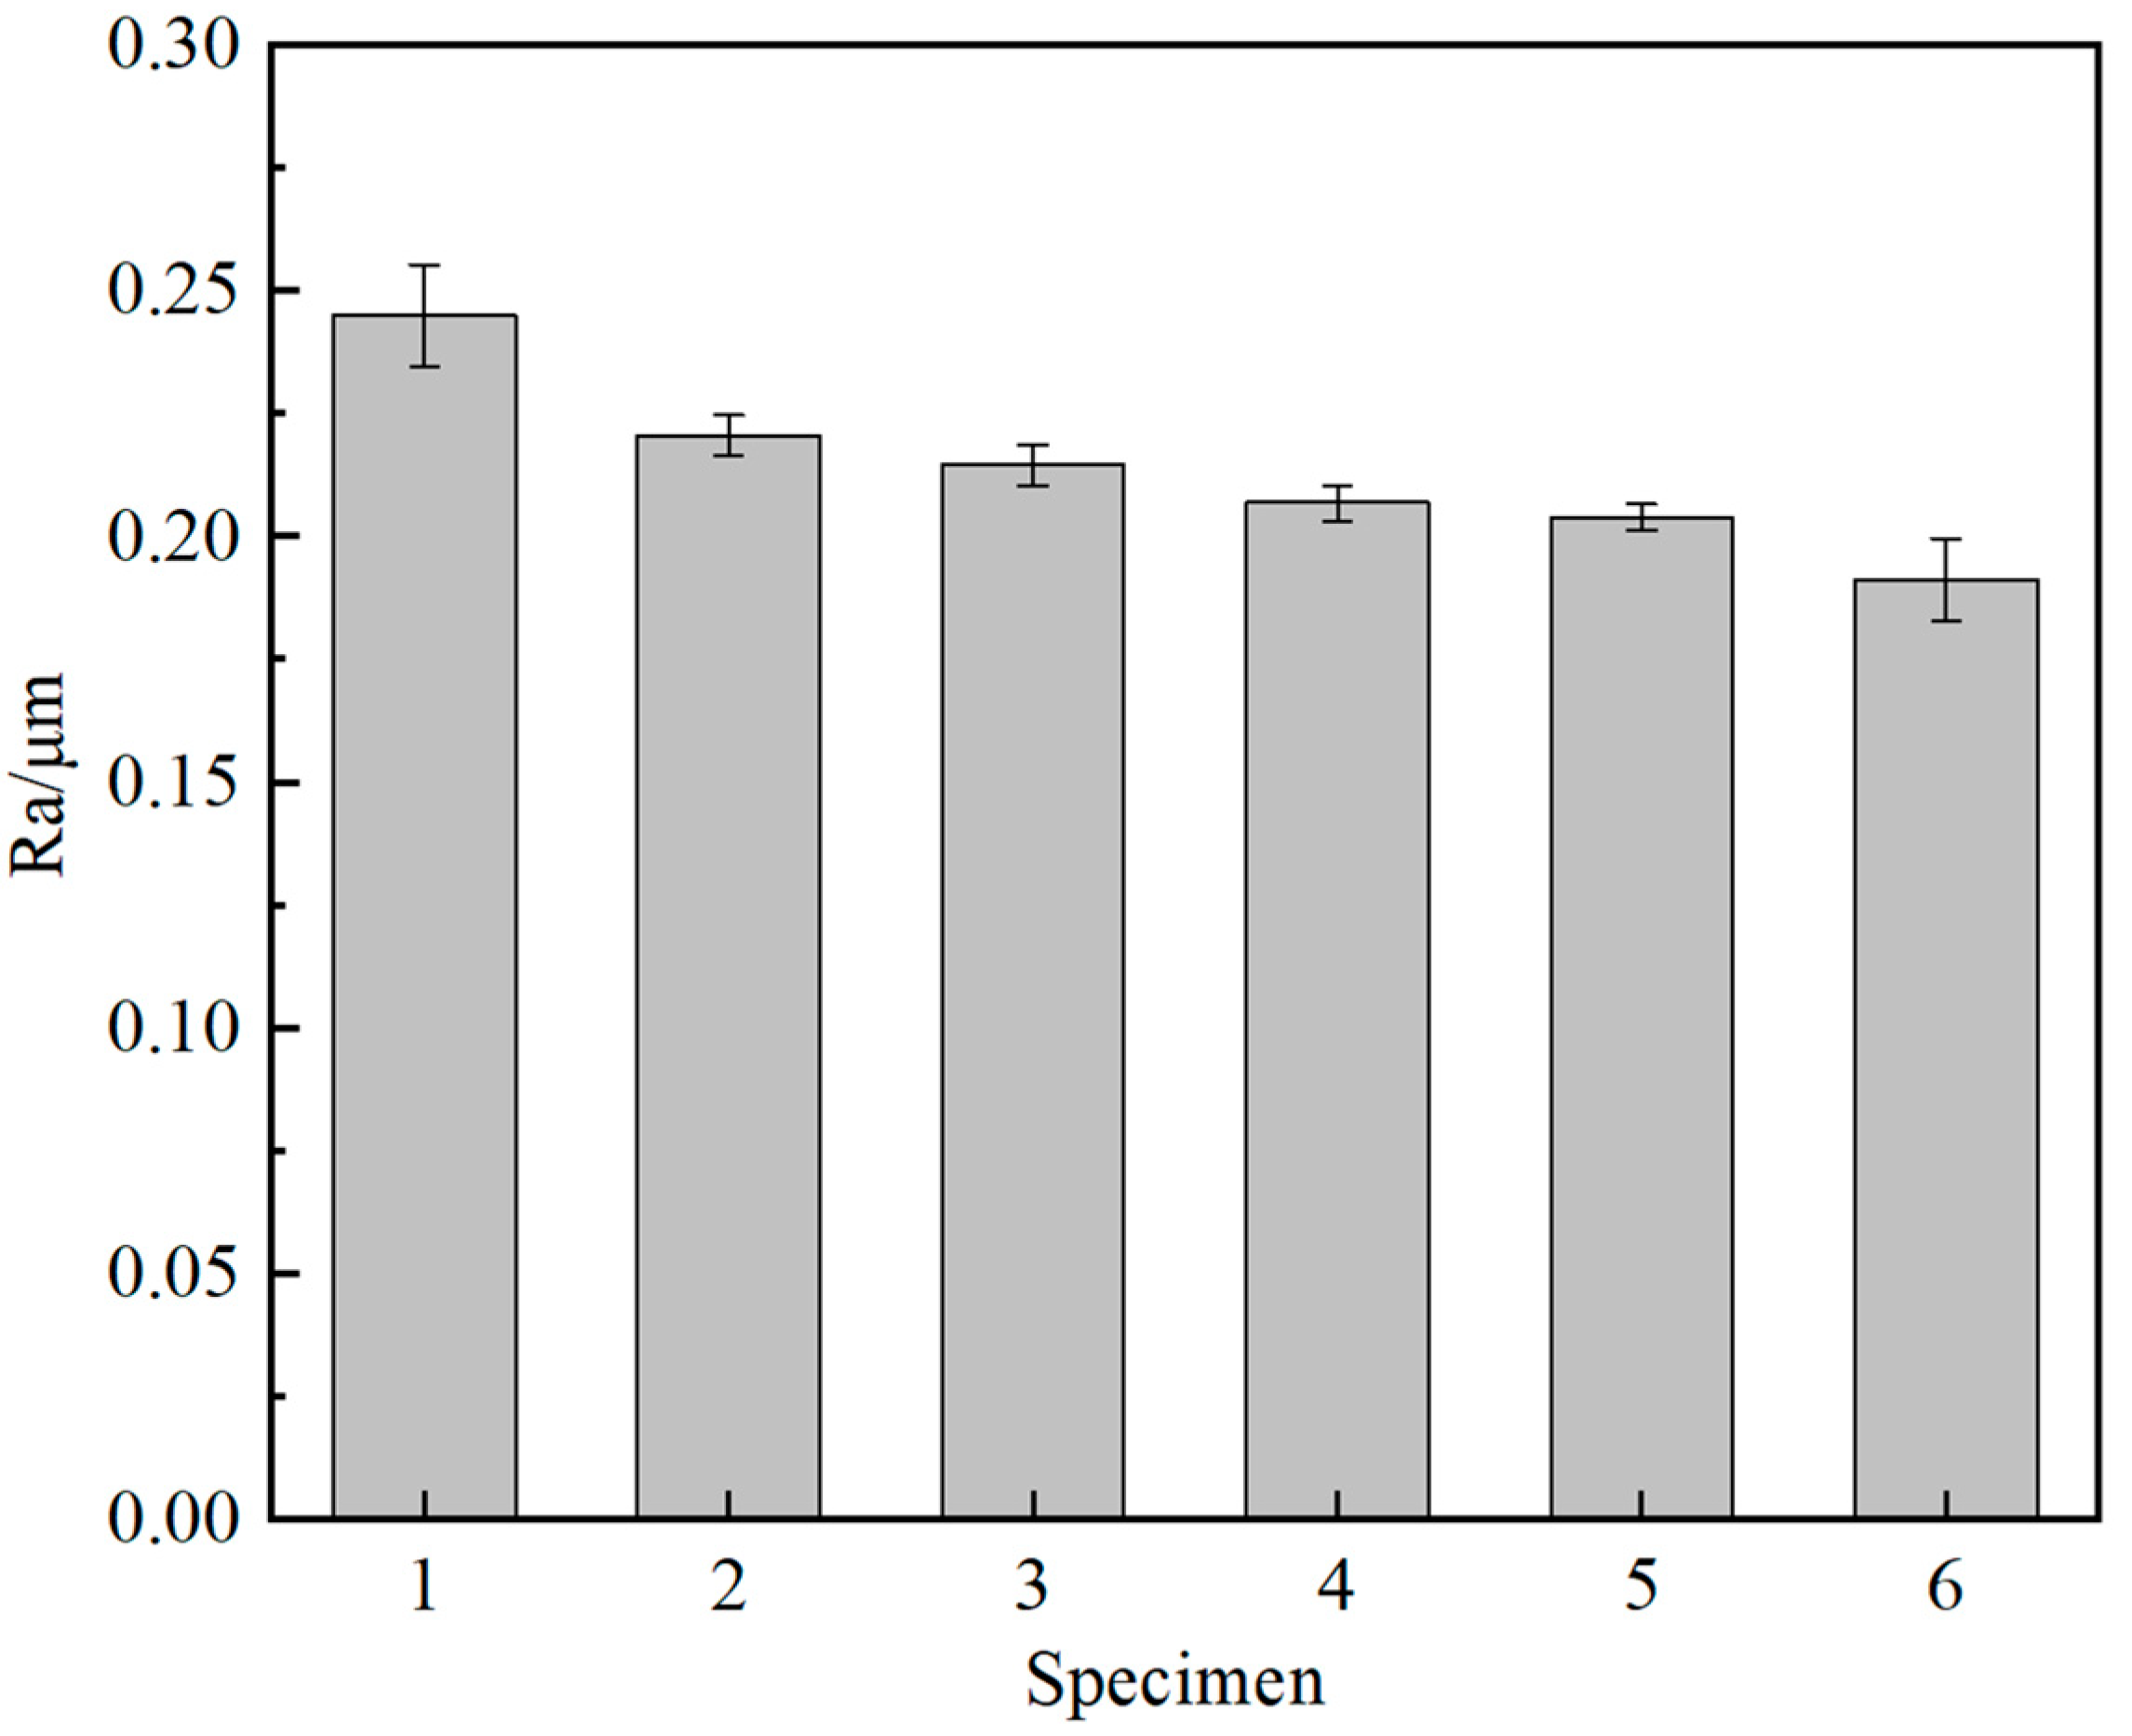
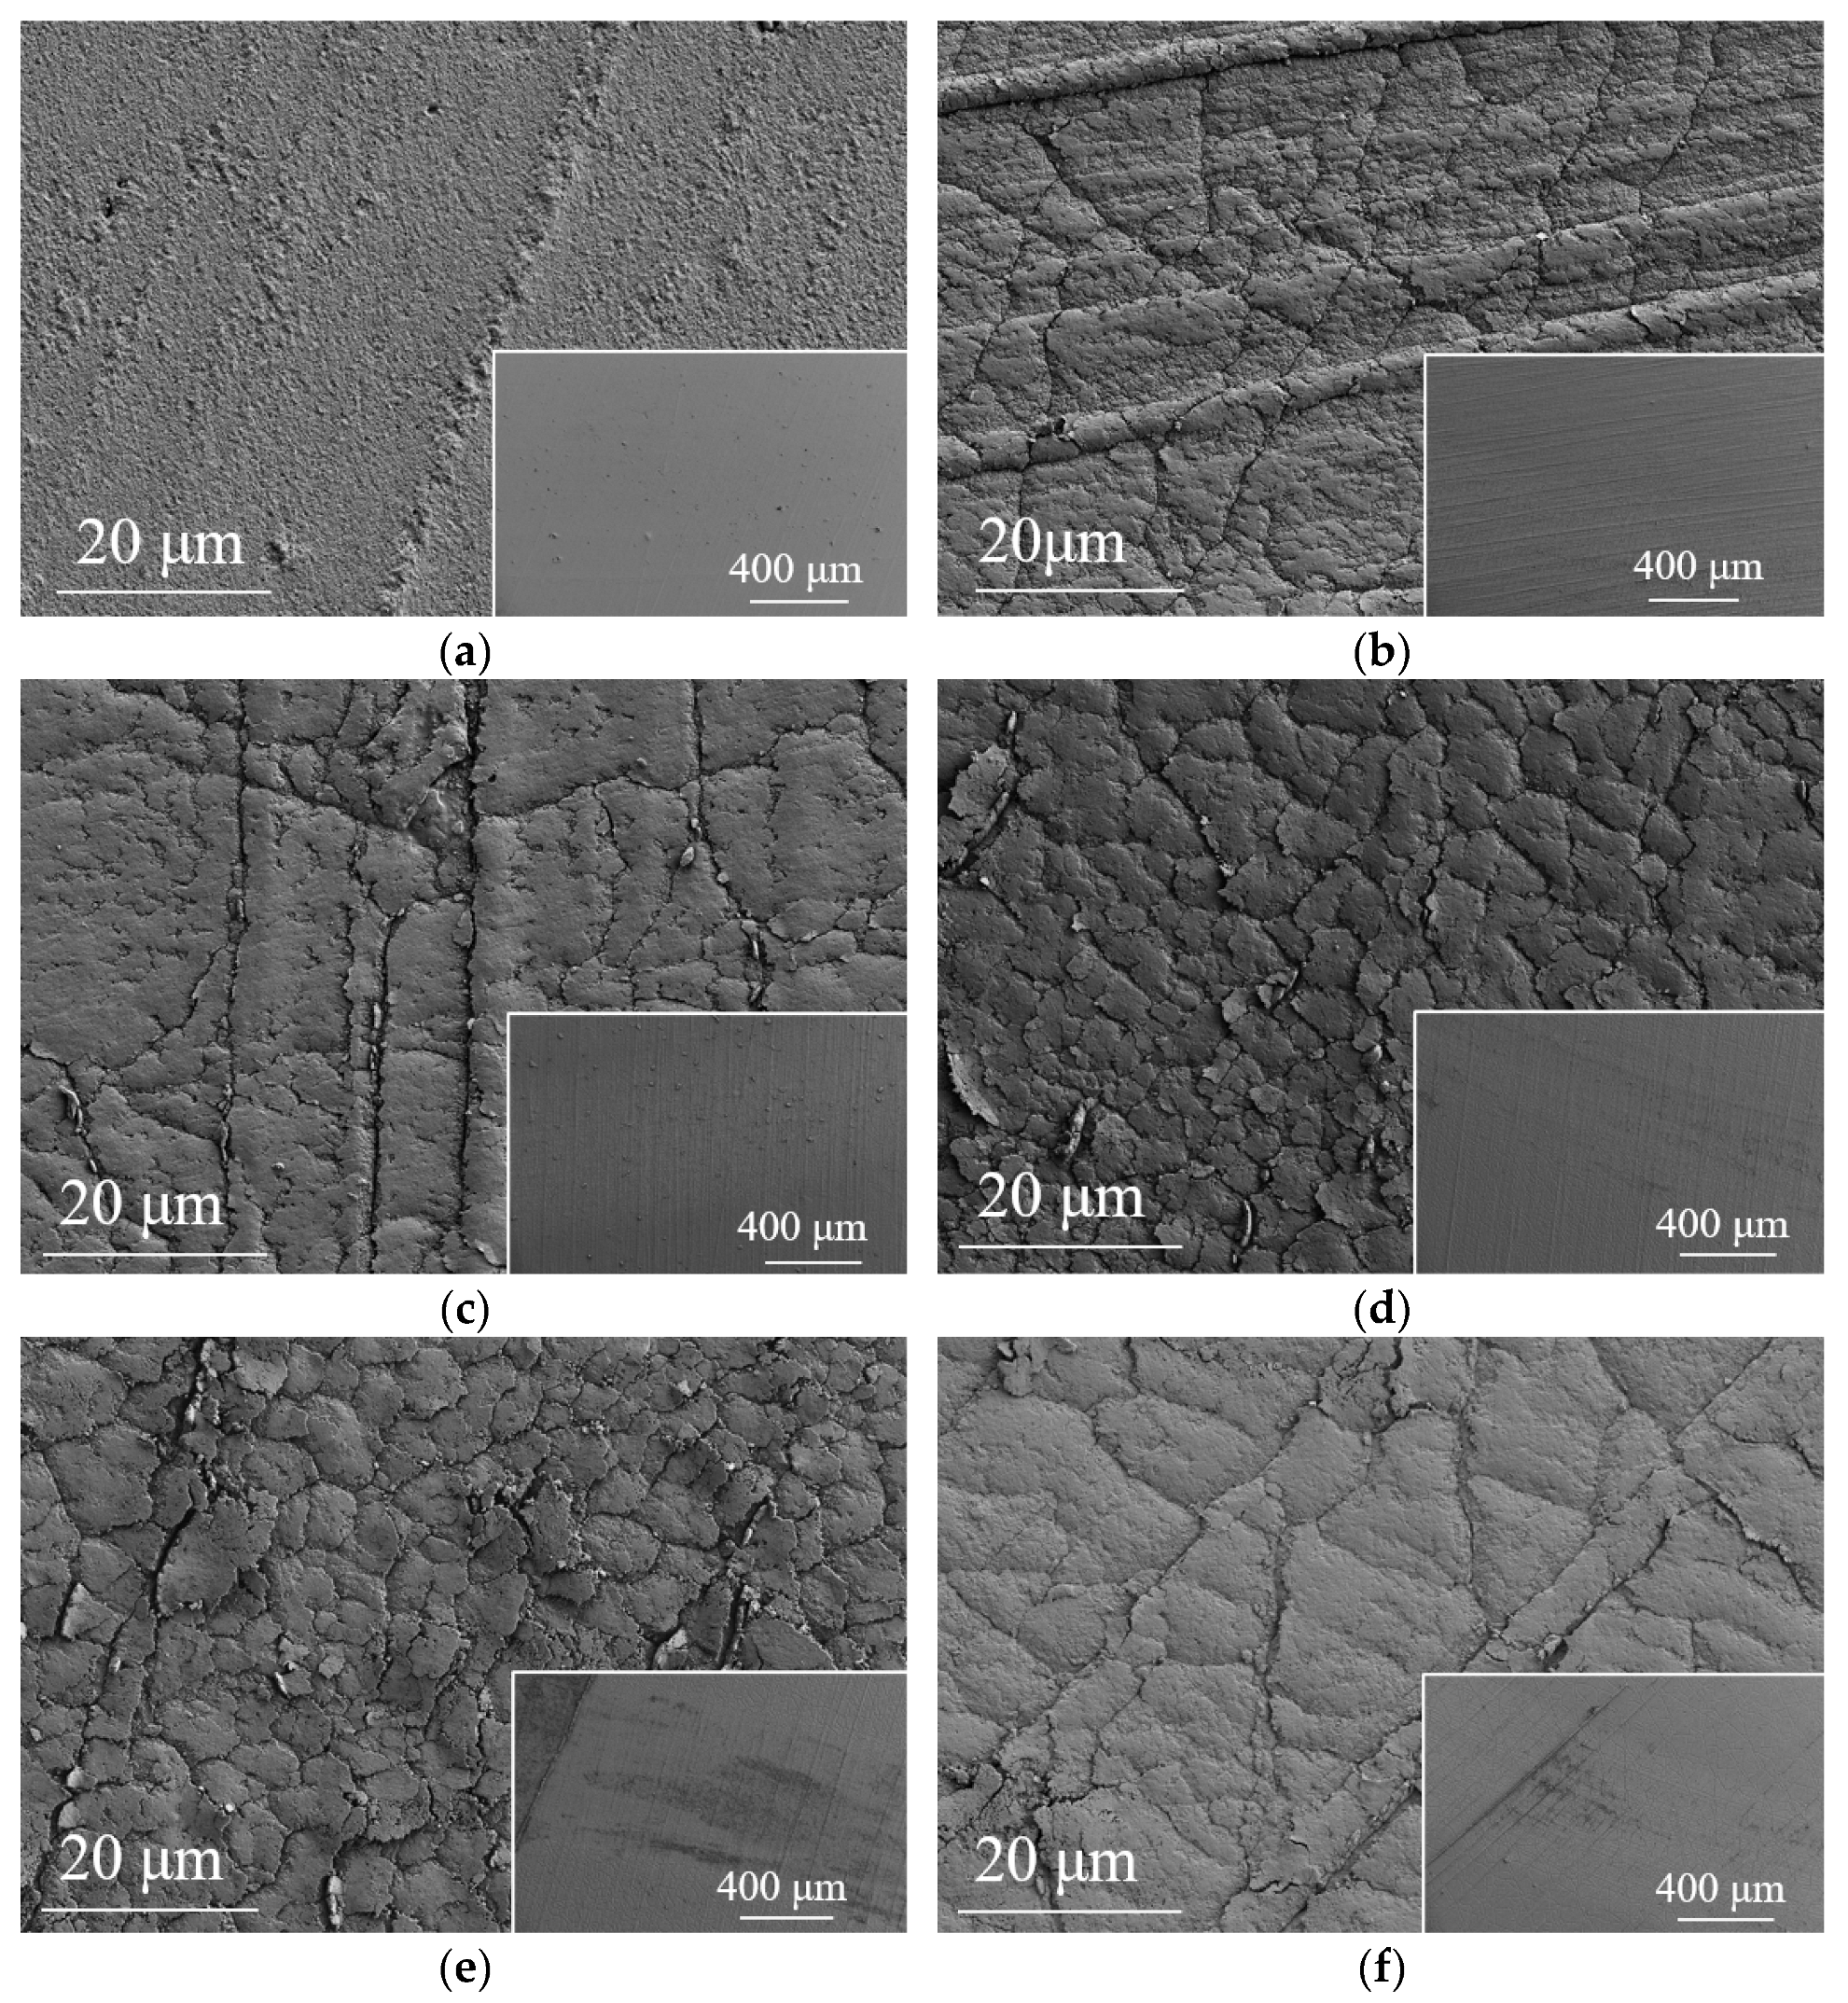
3.1. Substrate and Film Morphology
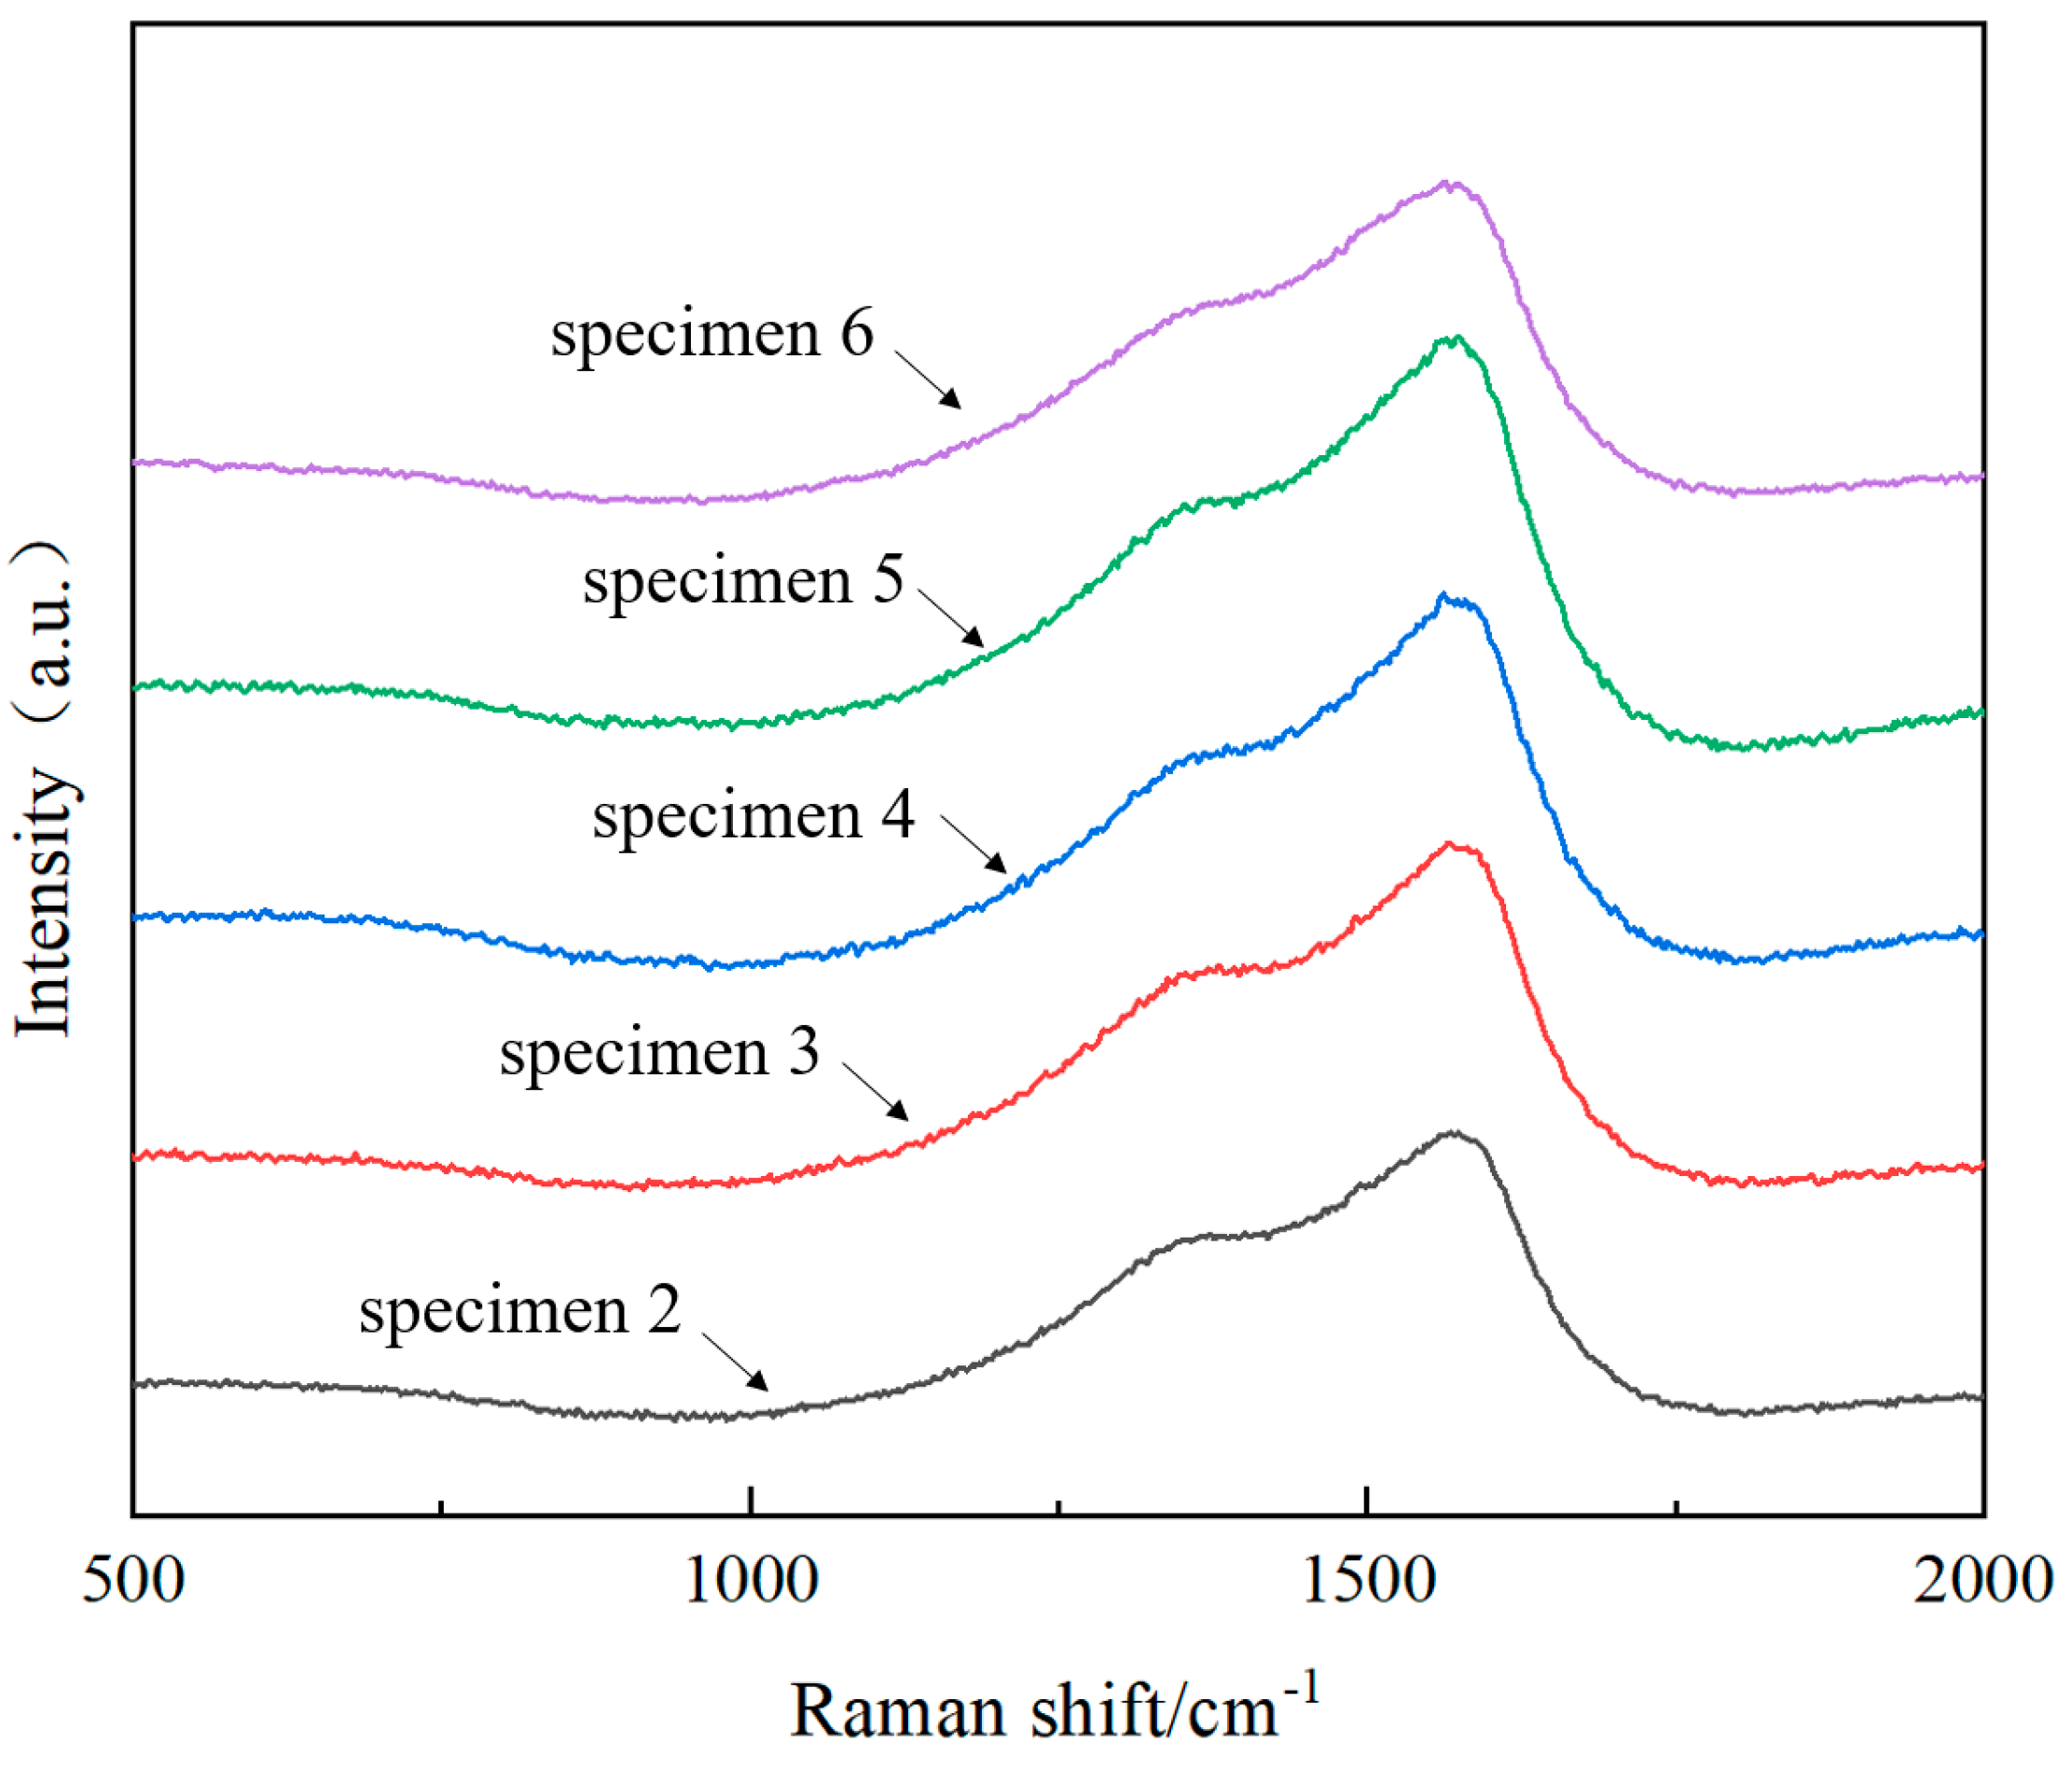
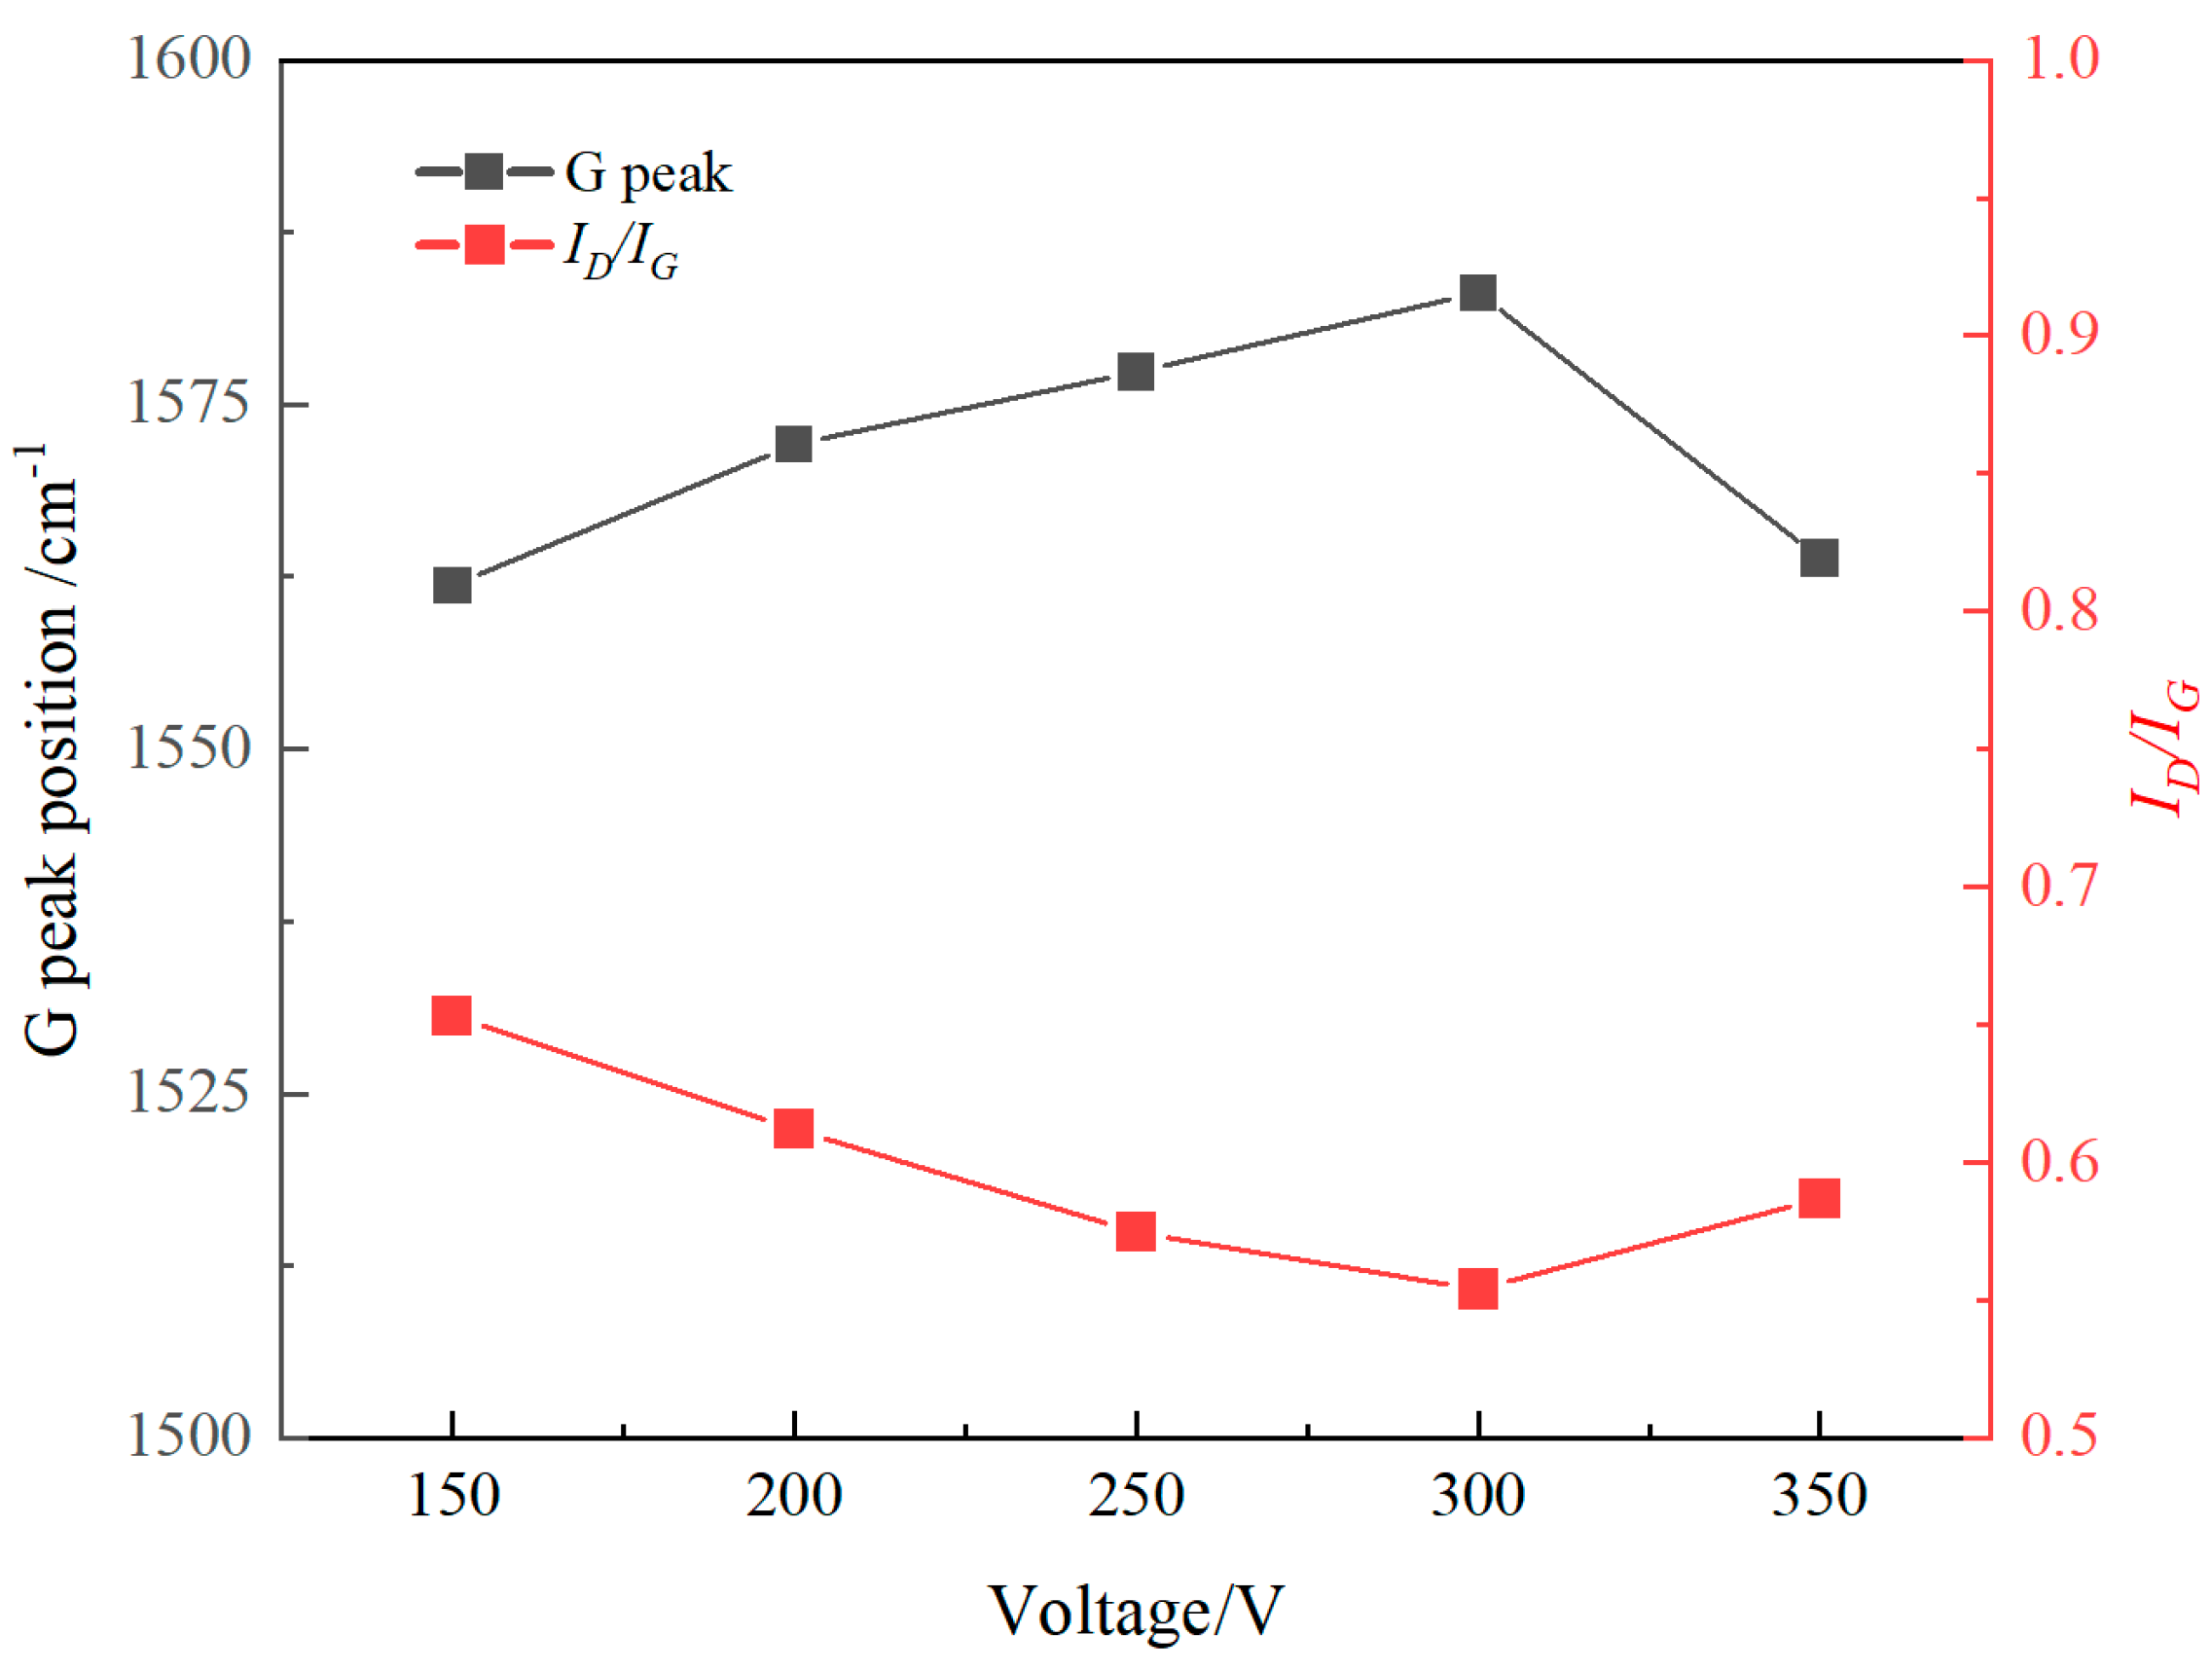
Figure 2 depicts the surface morphologies of samples 1–6. Figure 1a illustrates the surface morphology of sample 1 after ultrasonic cleaning with anhydrous ethanol. It is observed that the substrate surface is relatively flat and free of contaminants. The presence of vertical stripes, randomly generated during the molding process using a mold for nitrile rubber, can be seen. The existence of these stripes effectively increases the contact area between the substrate and the film, exerting a locking effect during the film growth process, which is beneficial for enhancing the bonding strength between the substrate and the film [15]. Figure 2b–f show the surface morphologies of nitrile rubber coated with ta-C films using different arc voltages. It can be observed that the ta-C films on the nitrile rubber substrates exhibit dense network-like cracks with a “tile-like” characteristic. This is due to the mismatch in thermal expansion coefficients between the nitrile rubber and the diamond-like carbon films. The generation of these cracks aids in stress relief of the ta-C film, improving the films’ flexibility and tribological properties [16]. The cracks also serve as oil reservoirs, enhancing the lubrication performance of the films. The size of the tile-like features is primarily influenced by the mismatch in thermal expansion coefficients between the ta-C film and the rubber substrate. This mismatch becomes more pronounced with increasing sp3 content in the film, as higher sp3 fractions impart diamond-like rigidity and thermal characteristics [17]. As a result, the amplified thermal expansion differences promote crack formation, leading to a higher crack density and smaller tile sizes. The variation in sp3 content will be further discussed in the Raman spectroscopy analysis. Meanwhile, as the arc voltage increases, the original stripe height on the sample surface decreases. This is because with the increase in arc voltage, the deposition ratio of pulsed arc ion source increases, more particles reaching the substrate, gradually filling the areas between the stripes [18]. The measured surface roughness values of samples 1–6 are shown in Figure 3. The results indicate that with increasing arc voltage, the roughness of coated samples decreases, which is beneficial for lowering the surface friction coefficient [19].

3.2. Raman Spectrum

Raman spectroscopy is a widely used technique for characterizing the bonding structure of diamond-like carbon films. In Raman spectroscopy, the G peak is observed near 1580 cm−1, while the D peak appears near 1360 cm−1. Both peaks are associated with sp2 hybridized carbon structures. The D peak is generated by the breathing vibration mode of sp2 atoms within the carbon rings, whereas the G peak results from the stretching motion of all sp2 atomic pairs in the carbon rings or along long chains [20]. Figure 4 displays the Raman spectra of films prepared under varying arc voltages. All spectra show a clear double-peak structure comprising the D peak at 1360 cm−1 and the G peak at 1580 cm−1. This indicates that DLC films have been successfully deposited on the surface of nitrile rubber using pulsed arc ion plating technology. The presence of graphite phases (sp2 content) enhances the friction and wear properties of the films [21].
The position of the G peak is related to the content of sp3 hybridized bonds. As the proportion of sp3 hybridized bonds decreases, the number of sp2 hybridized bonds increases and the size of sp2 clusters increases, leading to a decrease in Raman wavenumber, i.e., the G peak shifts towards lower wavenumbers. The intensity ratio of the D and G peaks (ID/IG) exhibits a negative correlation with the content of sp3 hybridized bonds in the film [22]. Figure 5 illustrates the variation of G peak position and ID/IG ratio as a function of the arc voltage. As the arc voltage increases, the position of the G peak in the films first increases and then decreases, while the ID/IG ratio first decreases and then increases. At the arc voltage of 300 V, the position of the G peak reaches a maximum of 1583 cm−1, and the ID/IG ratio reaches a minimum of 0.55. This suggests that 300 V is the optimal arc voltage for maximizing the diamond-like character of the deposited film.
Previous study has demonstrated that both excessively high and low incident particle energies can reduce the sp3 content in ta-C films, thereby diminishing their performance characteristics [23]. During pulsed arc ion deposition, variations in arc voltage primarily influence the energy of incident particles and the number of carbon species emitted from the ion source. According to the sub-plantation model [24], at lower arc voltages (150 V and 200 V), the carbon ions possess insufficient kinetic energy to penetrate beyond the film’s surface into the subsurface region. As a result, the carbon atoms tend to form sp2 bonded structures upon adsorption, leading to lower sp3 content in the film, as reflected by higher ID/IG ratios of 0.65 and 0.61, respectively. When the arc voltage is increased to 250 V and 300 V, the carbon ions gain sufficient energy to implant into the subsurface region and establish stronger sp3 bonds with neighboring atoms. This results in higher sp3 content, lower ID/IG ratios of 0.57 and 0.55, and a corresponding shift of the G peak to higher wavenumbers in the Raman spectra. However, at an arc voltage of 350 V, the excess kinetic energy of the incident carbon ions facilitates the transformation of metastable, highly strained sp3 bonds into thermodynamically more stable sp2 bonds. This structural relaxation leads to a reduction in sp3 content, an increase in the ID/IG ratio to 0.59, and a shift of the G peak toward lower wavenumbers.

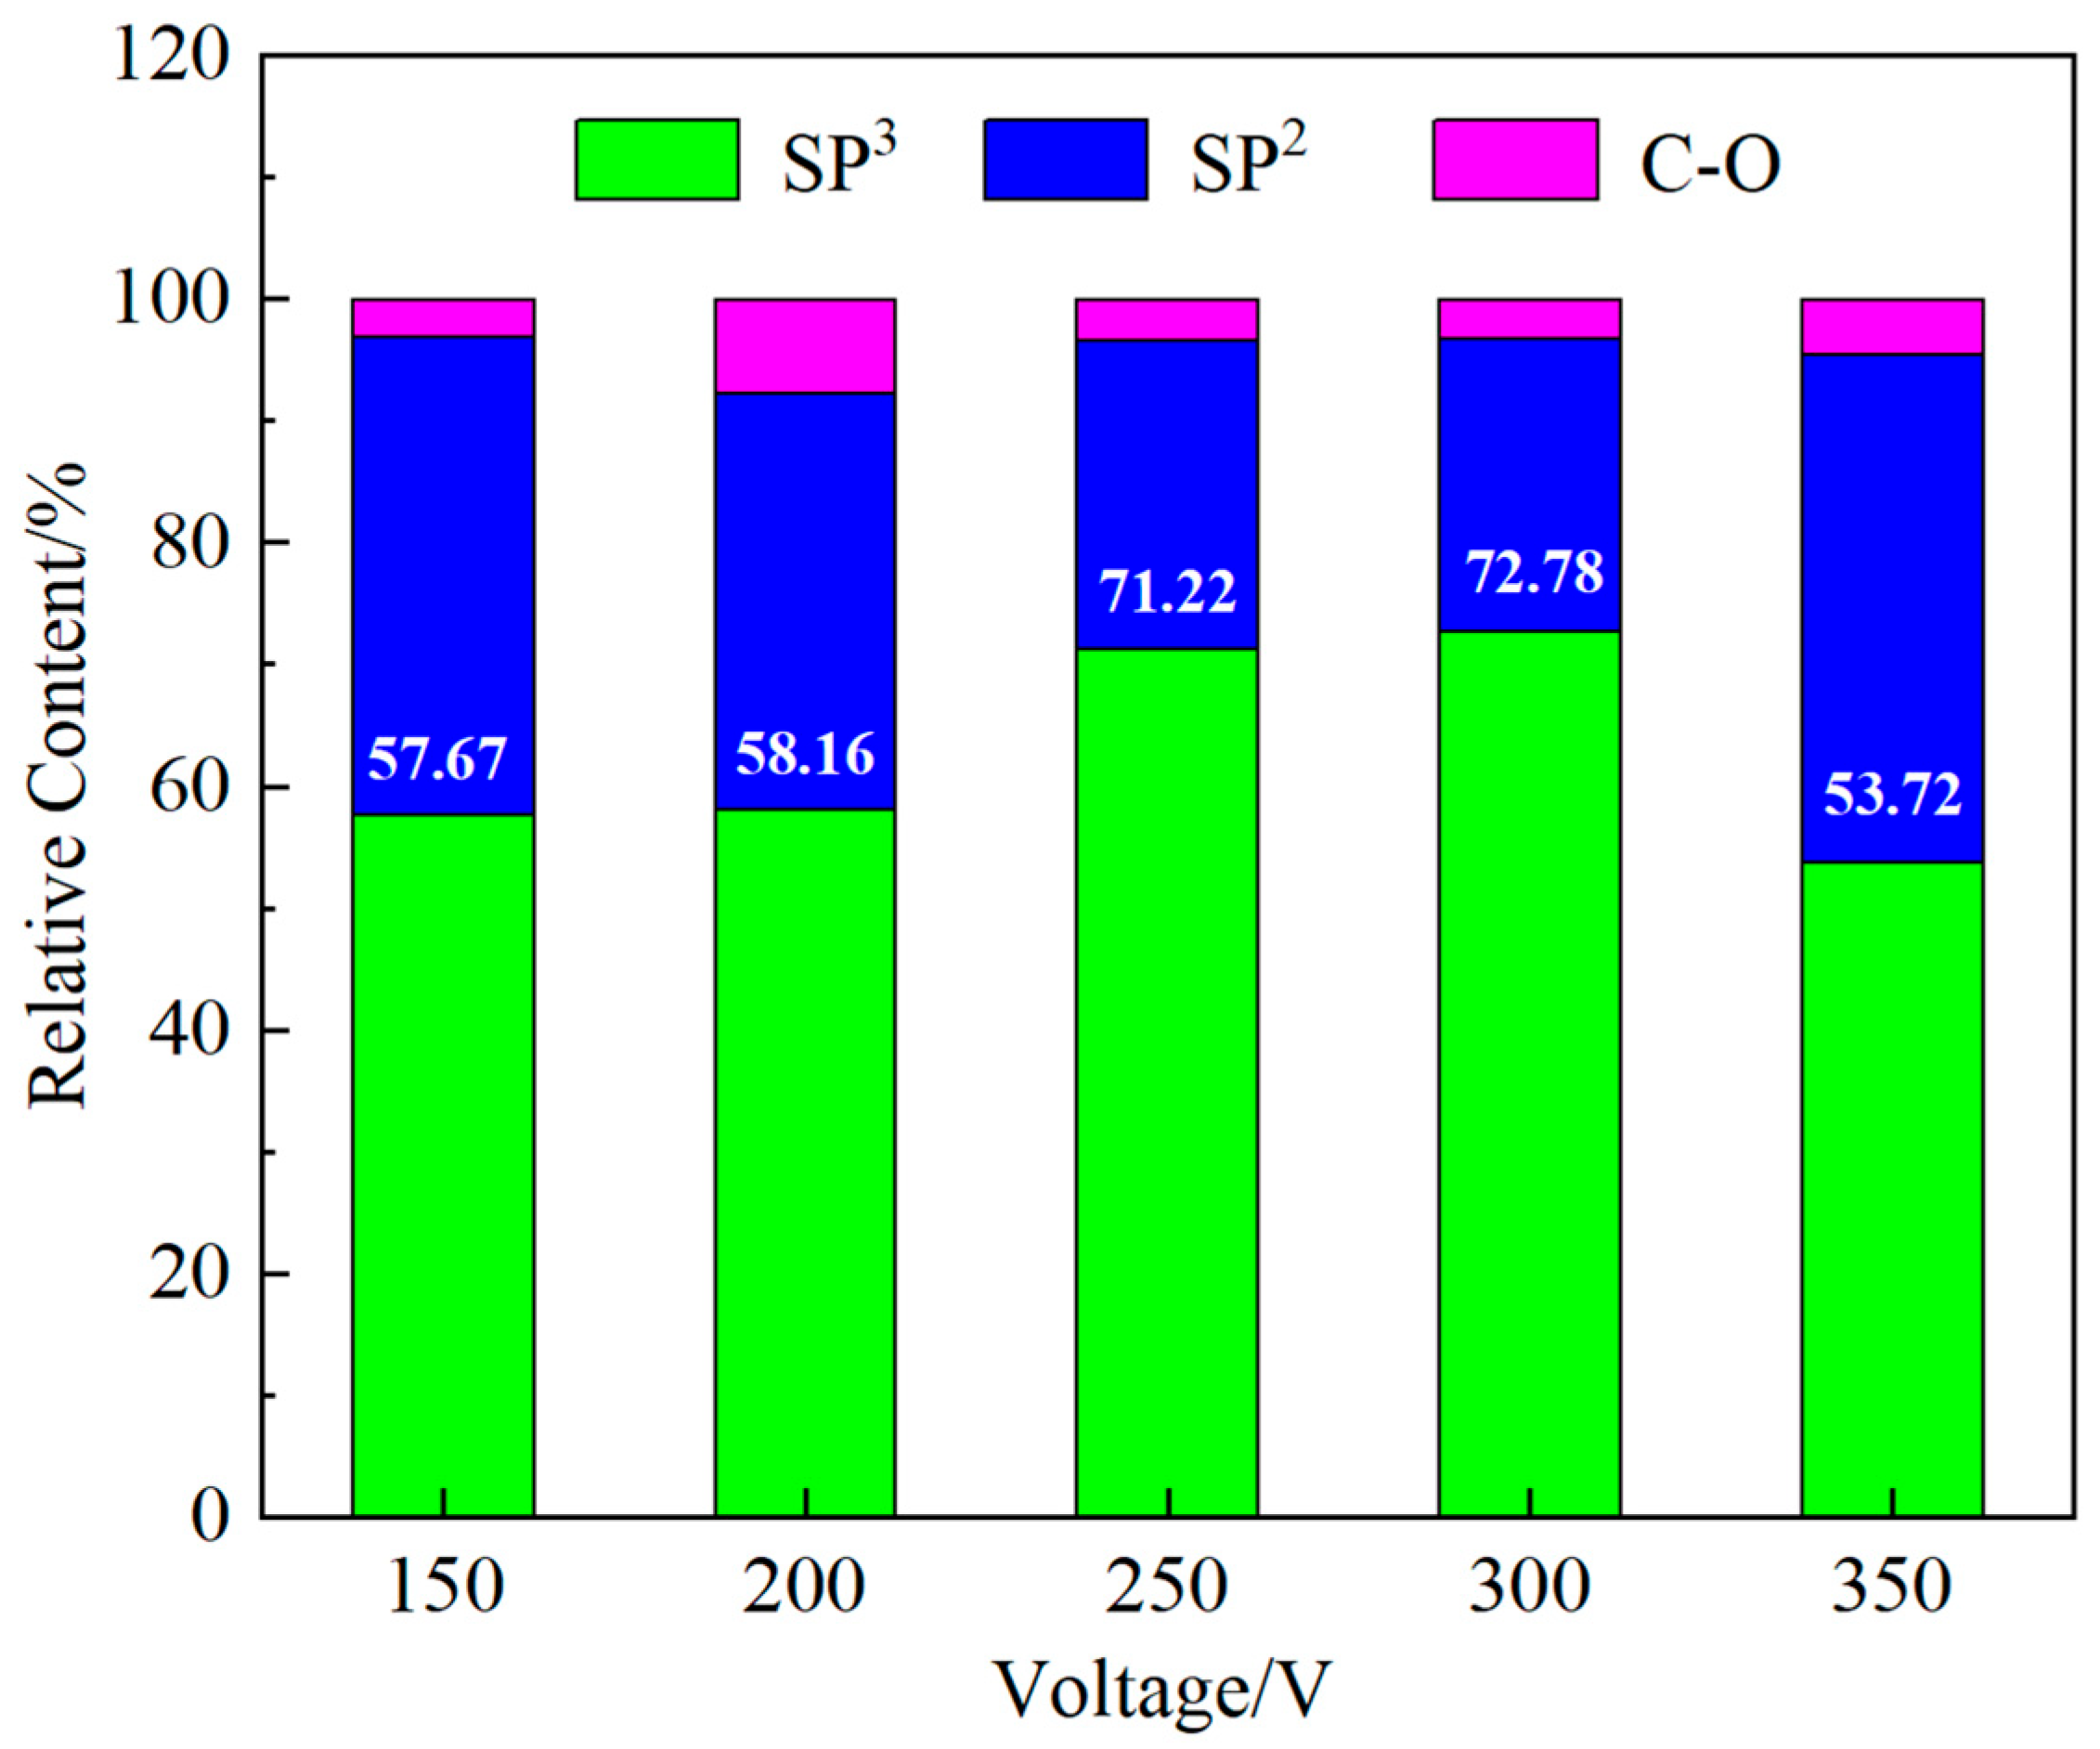
3.3. Chemical State of Thin Film Surface
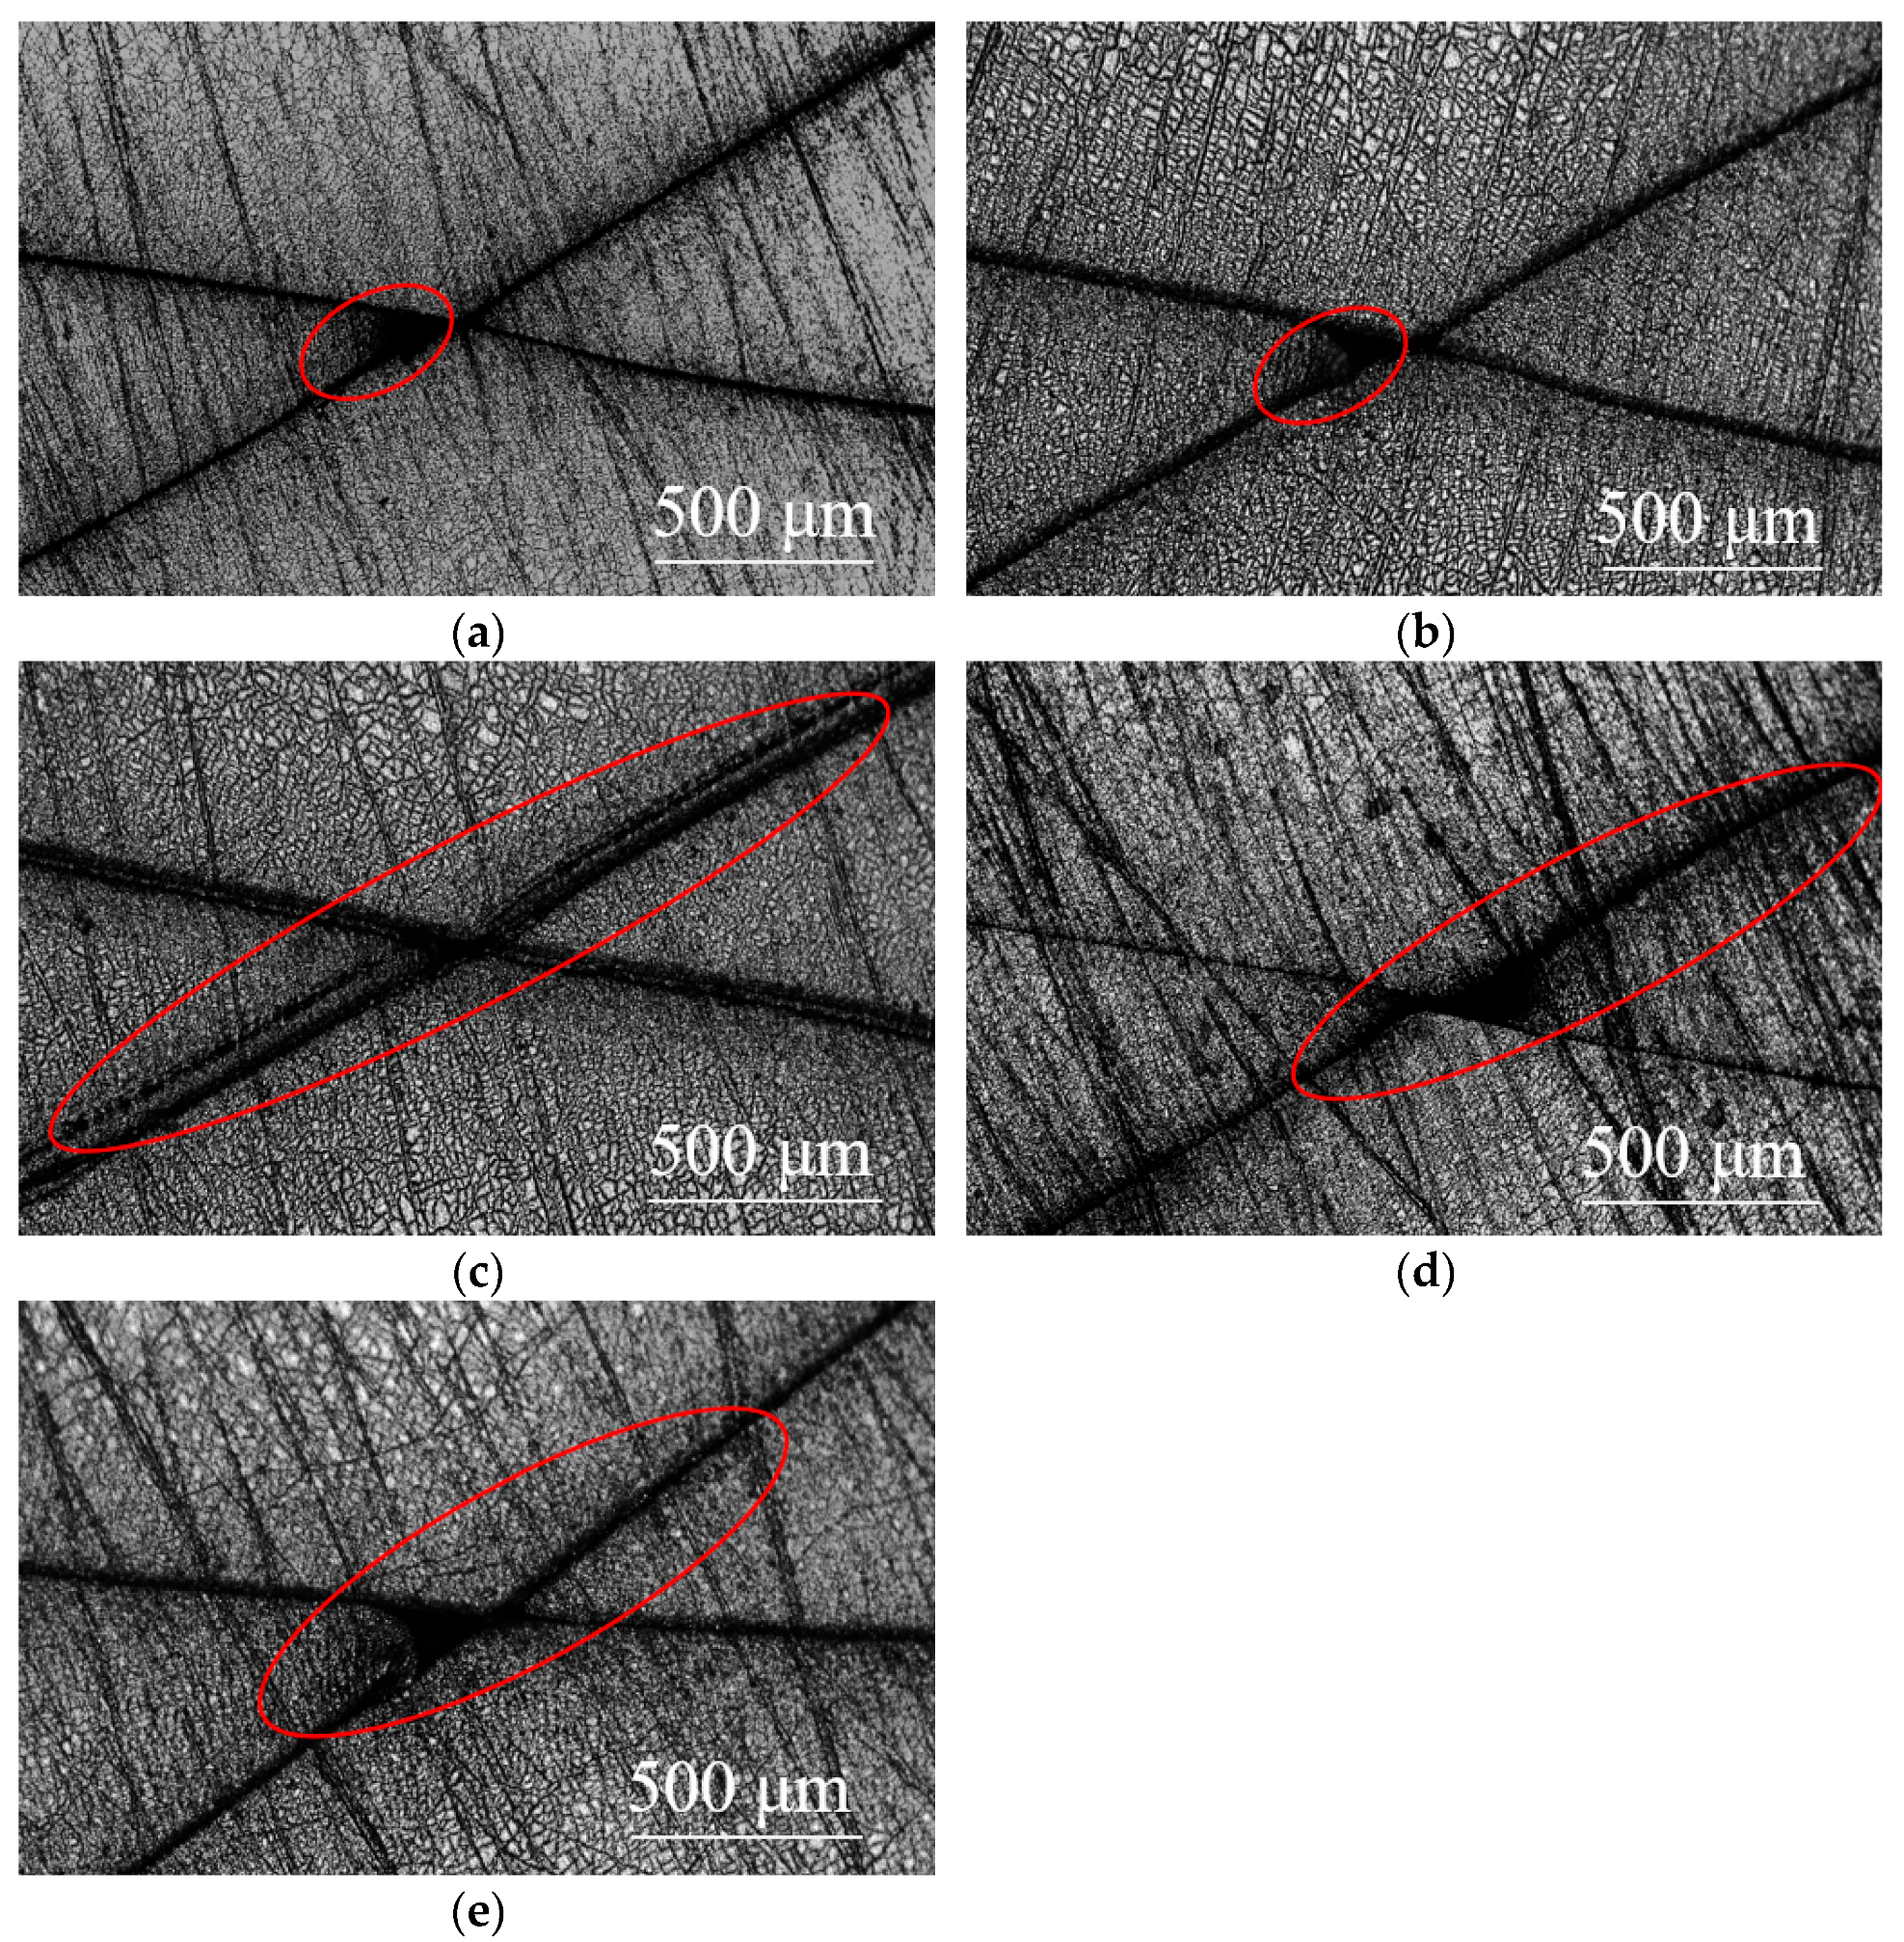
To further investigate the influence of arc current on the carbon bonding state and to quantitatively analyze the sp3 content within the ta-C films, X-ray photoelectron spectroscopy (XPS) was conducted on the prepared ta-C films. Figure 6a shows the full XPS spectra of the ta-C films after 300 s of Ar+ etching. The binding energies were calibrated using the standard amorphous carbon C 1s peak at 284.6 eV. As shown, the spectra reveal a dominant C 1s peak in the 284–286 eV range and a weak O 1s peak near 532 eV, indicating minor surface oxidation.
Figure 6b shows the high-resolution C 1s XPS spectrum of the ta-C film. The measured binding energies of the C 1s main peaks for samples deposited at arc voltages of 150 V, 200 V, 250 V, 300 V, and 350 V are 285.1 eV, 285.0 eV, 285.1 eV, 285.1 eV, and 284.6 eV, respectively. The C 1s main peak of diamond is located at 285.6 eV, with a full width at half maximum (FWHM) of approximately 1.45 eV; whereas the C 1s main peak of high-purity graphite is located at 284.4 eV, with a FWHM of approximately 1.35 eV. The difference in electron binding energy between the main peaks of the two is approximately 1.2 eV. The measured C 1s main peak positions of the ta-C film fall between those of diamond and graphite, confirming the hybridized nature of the carbon bonding in the films [25]. Meanwhile, the position of the C 1s peak is closely associated with the sp3 content in the film. An increase in sp3 hybridized bonds typically results in a shift of the C 1s peak toward higher binding energy, whereas a decrease in sp3 content causes the peak to shift toward lower binding energy [26].
Figure 7 presents the Gauss-Lorenz peak fitting results of the C 1s XPS spectra for ta-C films deposited at 150 V, 200 V, 250 V, 300 V, and 350 V. The C 1s spectra were deconvoluted into three primary components: the sp2C peak near 284.6 eV, the sp3C peak near 285.3 eV, and the C–O peak near 287.3 eV. Based on the peak areas obtained from the fitted spectra, the relative atomic percentages of sp3-hybridized carbon were calculated, yielding values of 57.67%, 58.16%, 71.22%, 72.78%, and 53.72%, corresponding to arc voltages of 150 V, 200 V, 250 V, 300 V, and 350 V, respectively (Figure 8). There is a trend of initial increase followed by a decrease, with the sp3 content reaching its peak at an arc voltage of 300 V. This trend aligns with the results obtained from Raman spectroscopy, further substantiating the connection between deposition conditions and the carbon bonding structure. Both Raman spectroscopy and XPS analyses reveal that the sp3 content of ta-C films produced at various voltages remains above 50%, confirming the successful formation of ta-C films on the nitrile rubber substrates [20].

3.4. Film Adhesion

Currently, the primary method employed for testing the bonding strength of hard coatings on elastomer surfaces is the adhesive tape peeling technique. This technique, which is standardized in the ASTM D3359–17 (Standard Test Methods for Rating Adhesion by Tape Test), consists of two methods, Test Method A is called X-cut tape test, while Test Method B is called cross-cut tape test [27]. Adhesion testing between DLC films and rubber substrates is commonly conducted using the cross-cut (X-cut) method [7,19]. To investigate the influence of arc voltage on the adhesion between the ta-C film and the nitrile rubber substrate, an X-cut test was conducted to qualitatively evaluate the adhesion by inspecting damage and delamination at the intersection points of X-shaped incisions made on the film surface. Figure 9 presents the optical microscope images of samples 2–5 after the X-cut test. For samples 2 and 3, slight peeling was observed at the intersection of the X-marks, the adhesion is 4 A according to ASTM d3359–17. For samples 4 and 5, in addition to peeling at the intersection of the X-marks, brittle fractures occurred at the X-cut points and propagated laterally along the incisions, the adhesion is 3 A. For sample 6, significant peeling was also observed at the intersection of the X-marks and the adhesion is 3 A, suggesting a progressive decline in film adhesion as the arc voltage increased. This deterioration in adhesion with increasing arc voltage can be attributed to the following two main factors: (1) With higher arc voltage, the number of particles reaching the substrate increases, leading to an increase in film thickness. This gradually fills the areas between the stripes, weakening the locking effect between the ta-C film and the nitrile rubber substrate, resulting in a decrease in adhesion [28,29]; (2) As the arc voltage increases, the proportion of sp3 hybridized bonds in the film first increases and then decreases. An increase in sp3 content in the film leads to internal stress accumulation and increased brittleness. When intrinsic stress exceeds the elastic capacity of the nitrile rubber substrate, stress concentration occurs at the interface, inducing crack propagation and resulting in a decrease in adhesion [30]. These findings suggest that lower arc voltages are more favorable for maintaining strong adhesion between ta-C films and rubber substrates.

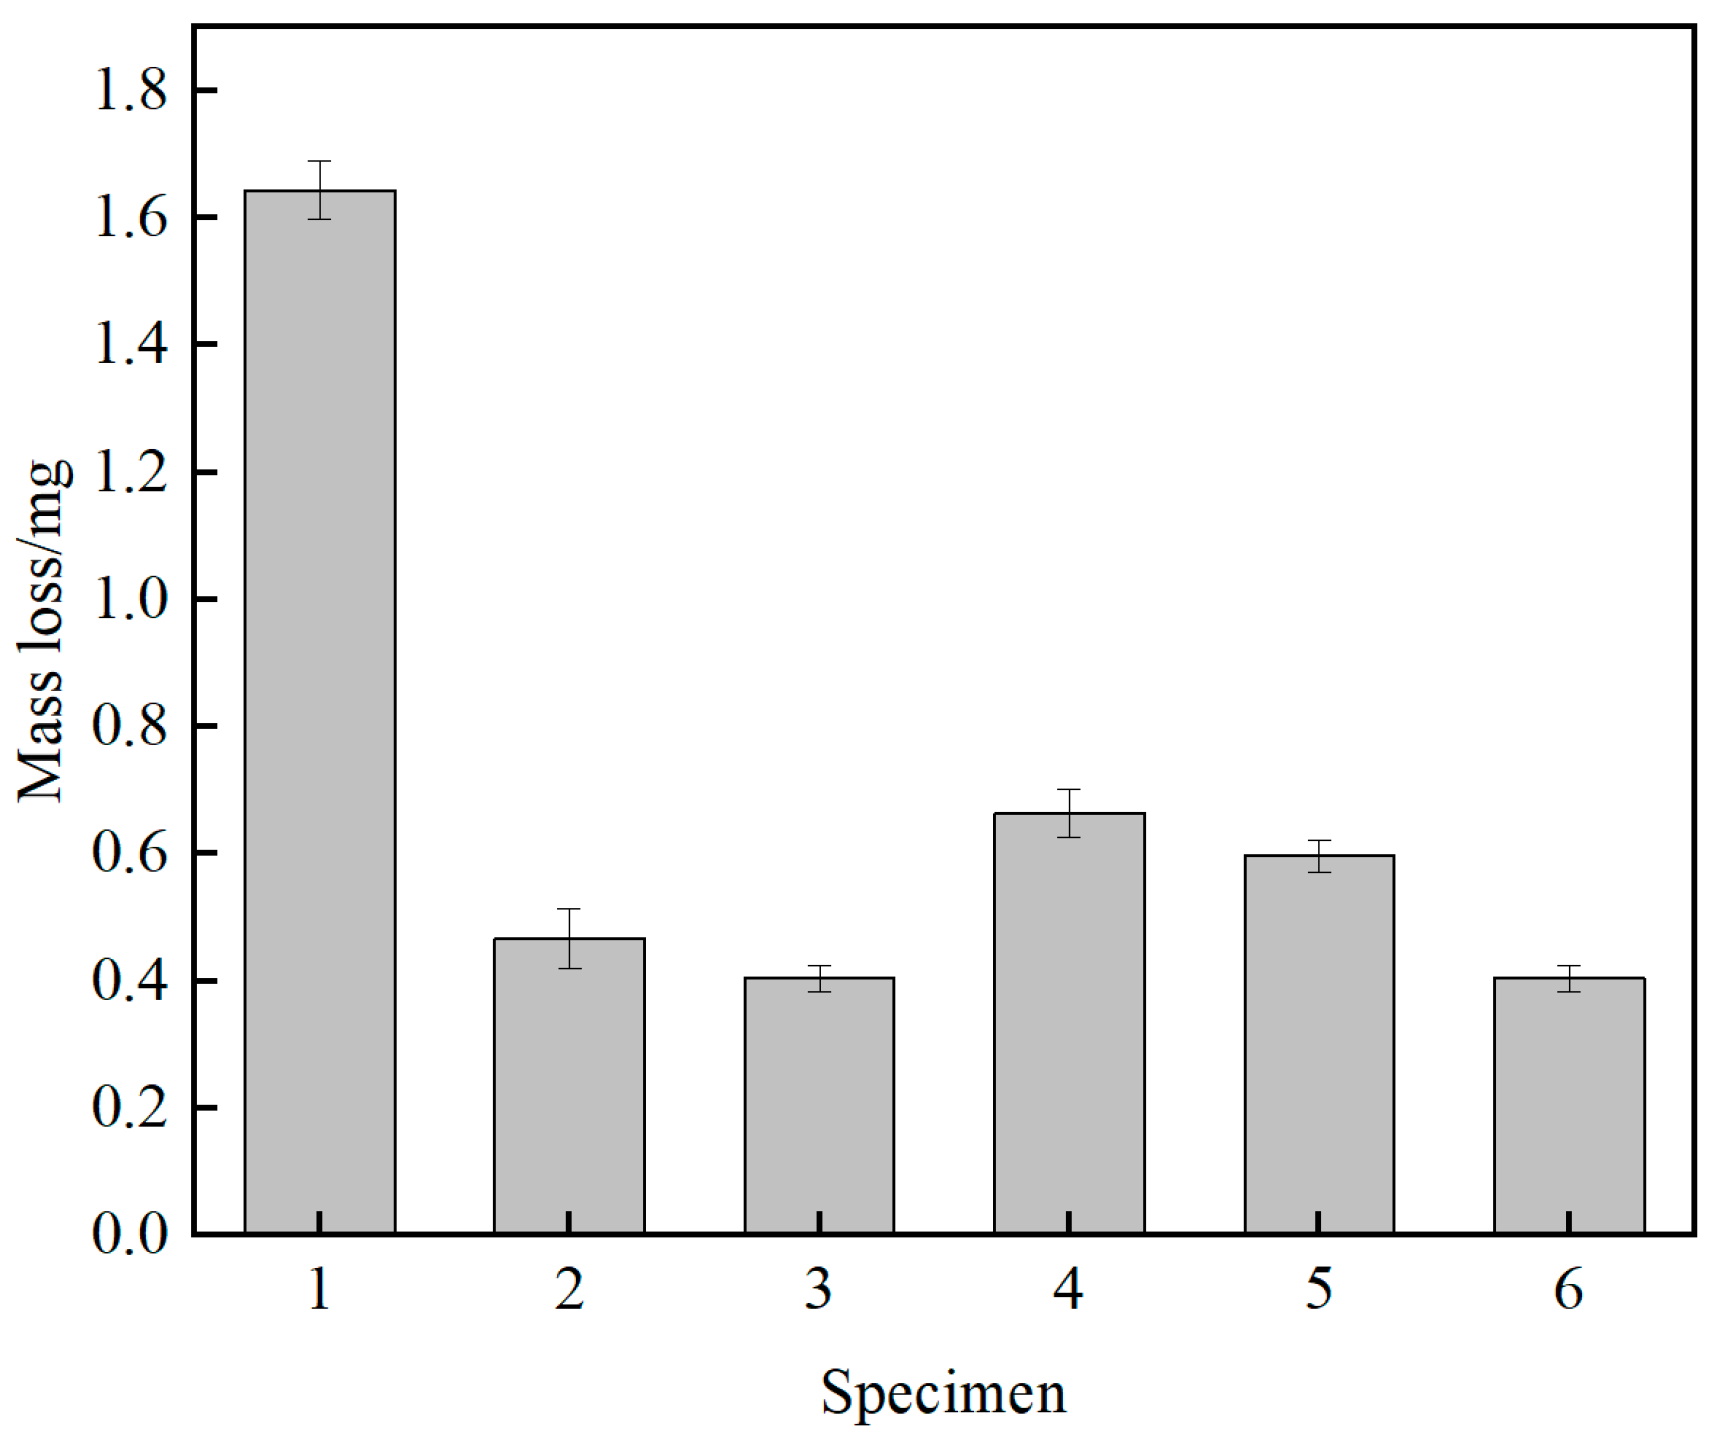
3.5. Film Friction Performance

Figure 10 depicts the friction coefficients of samples 1–6. The friction coefficient of sample 1 is unstable and relatively high, averaging over 1.0. This is attributed to the viscoelastic properties of nitrile rubber, which cause adhesion and hysteresis during sliding with GCr15 steel balls, leading to high friction. The friction coefficients of samples 2–5 exhibit a significant reduction compared to sample 1, indicating that the ta-C film effectively mitigates the adhesive friction between NBR and steel balls. For samples 2 and 3, the friction coefficient evolution shows two distinct phases: a running-in phase and a stable phase. Specifically, sample 2 undergoes a running-in phase from 0–1200 s, with the friction coefficient gradually increasing from 0.2 to approximately 0.45, followed by a stable phase. Similarly, sample 3 experiences a running-in phase from 0–1800 s, with the friction coefficient gradually increasing from 0.15 to approximately 0.38, followed by a stable phase. Notably, the friction coefficient of sample 2 in the stable phase is slightly lower than that of sample 1. This reduction is primarily due to the decreased depth of surface striations on sample 2. This variation of surface morphology reduces mechanical interlocking at the contact interface and thus reduces frictional resistance during sliding [31]. For samples 4, 5, and 6, the friction coefficient continuously increases over time. The friction coefficient of sample 4 increases from 0.15 to 0.38, while those of samples 5 and 6 increase from 0.15 to 0.35. This behavior is due to insufficient adhesion of the ta-C film at higher arc voltages according to the results of adhesion test. During sliding, poor film adhesion leads to partial delamination of the coating, exposing the soft nitrile rubber substrate. Detached hard film particles may embed into the contact interface, resulting in micro-cutting and ploughing that compromise the integrity of ta-C films, leading to a gradual rise in frictional force [32].
Figure 11 illustrates the mass loss of samples 1–6 following the dry friction test. Notably, sample 1 demonstrates the highest wear loss, which can be attributed to the rubber substrate’s inherent high friction and poor wear resistance. The elevated frictional forces during sliding lead to significant material removal, resulting in the greatest mass loss among all samples [13]. In contrast, the application of ta-C film coatings on samples 2–5 results in a substantial reduction in mass loss, exceeding 60% compared to sample 1. Interestingly, as the arc voltage increases, the mass loss of the coated samples initially rises before decreasing, with sample 3 exhibiting the least wear. This trend aligns with the earlier findings on adhesion and friction coefficient tests, indicating that an optimal arc voltage—specifically 250 V—achieves the most favorable balance among film adhesion, mechanical integrity, and tribological performance.
The morphology of the wear track provides direct visual evidence of material wear behavior and is crucial for understanding wear mechanisms. Figure 12 illustrates the wear track morphologies of samples 1–6. As shown in Figure 12a, the wear surface of sample 1 exhibits discontinuous scars and noticeable colloidal spalling. These features align with the known failure modes of rubber materials under cyclic loading, such as adhesive and fatigue wear [33]. Figure 12b–e show the wear track morphologies of samples 2–6. The ta-C films on the surfaces of samples 2 and 3 remained intact with no obvious detachment, and the crack distributions are similar to those observed before testing, indicating superior wear resistance. In contrast, the coatings on samples 4–6 show varying degrees of delamination, with visible film debris adhered to the rubber surface. These fragments contribute to abrasive wear, leading to an increase in friction over time. Samples 4 and 5 exhibit a “fish scale” pattern, with prominent radial cracks and localized delamination, indicating brittle fracture and interfacial debonding under high loads. This is mainly due to the high sp3 hybridization bond in samples 4 and 5, which renders the coatings more diamond-like—enhancing hardness but reducing flexibility. The mismatch in thermal expansion coefficients between the ta-C films and the substrates, coupled with localized thermal stress from frictional heating, leads to interfacial failure and subsequent delamination [34]. Sample 6 shows the most severe wear, marked by extensive film spalling, ploughing grooves, and surface pits. At an arc voltage of 350 V, the thickness and residual stress of the ta-C film are the highest among all samples. During sliding, stress concentrated and released within the thick film formed deep penetrating cracks, ultimately resulting in film failure.

4. Conclusions

This study employed a single-factor experimental design, using the arc voltage of the pulsed arc ion source as the variable to investigate its effect on the structure and tribological performance of ta-C films on nitrile rubber surfaces. The following conclusions were drawn:
(1)
Ta-C films were successfully deposited on the surface of nitrile rubber using the pulsed arc ion plating technique. The resulting films were uniform and dense, exhibiting typical network-like crack patterns. The coating significantly reduced surface roughness. The sp3 content in the ta-C films varied with different arc voltages, ranging from a minimum of 53.72% at an arc voltage of 350 V to a maximum of 72.78% at an arc voltage of 300 V.
(2)
As the arc voltage increases, the sp3 hybridized bond in the films initially increases and then decreases. Higher sp3 content led to increased internal stress and brittleness, adversely affected adhesion and friction stability. At 200 V, the sp3 content was 58.16%, with good film-substrate adhesion and a stable friction coefficient of approximately 0.38. In contrast, at 300 V, although the sp3 content peaked at 72.78%, the adhesion deteriorated, leading to film delamination and increased friction due to abrasive wear.
(3)
To improve the wear resistance of nitrile rubber with ta-C coatings, it is important to keep the sp3 content within a moderate range. This can be accomplished by choosing a lower arc voltage, which enhances interfacial compatibility and mechanical performance between the coating and the elastomer substrate.

Author Contributions

Conceptualization, methodology, investigation, writing—original draft, Visualization, S.F.; conceptualization, resources, writing—review & editing, supervision, project administration, funding acquisition, W.L.; investigation, writing—review & editing, supervision, F.G.; conceptualization, resources, writing—review & editing, supervision, C.W.; investigation, L.Z. All authors have read and agreed to the published version of the manuscript.

Funding

This research was funded by National Natural Science Foundation of China (Grant No. 52375444), the National Key Technologies Research and Development Program (2019YFB2005302) and the Aviation Science Foundation of China (20220019052001).

Institutional Review Board Statement

Not applicable.

Informed Consent Statement

Not applicable.

Data Availability Statement

Data are contained within the article.

Conflicts of Interest

Sen Feng, Fei Guo, Can Wang and Liang Zou were employed by Jiangsu Xuzhou Construction Machinery Research Institute Co., Ltd. The remaining author declares that the research was conducted in the absence of any commercial or financial relationships that could be construed as a potential conflict of interest.

References

  1. Liu, Y.S.; Shuai, C.G.; Lu, G.; Yang, X.; Hu, X.Y. Tribological characteristics and mechanism of nitrile butadiene rubber coated with typical liquid lubricants. Polym. Test. 2022, 115, 107724. [Google Scholar] [CrossRef]
  2. Liu, Y.H.; Xu, P.H.; Zhu, X.H.; Liu, L.G.; Li, B.; Li, Q.Q. Interfacial friction evolution between DLC film and sealing NBR on the plunger of fracturing pump based on molecular dynamics simulation. Ind. Lubr. Tribol. 2024; ahead of print. [Google Scholar] [CrossRef]
  3. Vasconcelos, B.; Serra, R.; Oliveira, J.C.; Fonseca, C. Durable electroless deposited Ni-P films on NBR for dynamic contacts. Characterization and tribological performance. Surf. Coat. Technol. 2021, 423, 127579. [Google Scholar] [CrossRef]
  4. Wu, Y.M.; Liu, J.Q.; Cao, H.T.; Wu, Z.Y.; Wang, Q.; Ma, Y.P.; Jiang, H.; Wen, F.; Pei, Y.T. On the adhesion and wear resistance of DLC films deposited on nitrile butadiene rubber: A Ti-C interlayer. Diam. Relat. Mater. 2020, 101, 107563. [Google Scholar] [CrossRef]
  5. Yang, T.; Han, C.X.; Deng, Q.Y.; Wen, F. Optimized Tribological Performance of Nitrogen-Doped Diamond-like Carbon Films on NBR: Influence of Bias Voltage of DC Magnetron Sputtering. Nanomaterials 2024, 14, 564. [Google Scholar] [CrossRef] [PubMed]
  6. Thirumalai, S.; Hausberger, A.; Lackner, J.M.; Waldhauser, W.; Schwarz, T. Anode layer source plasma-assisted hybrid deposition and characterization of diamond-like carbon coatings deposited on flexible substrates. Thin Solid Film 2018, 655, 54–61. [Google Scholar] [CrossRef]
  7. Lubwama, M.; Corcoran, B.; Sayers, K.; Kirabira, J.B.; Sebbit, A.; McDonnell, K.A.; Dowling, D. Adhesion and composite micro-hardness of DLC and Si-DLC films deposited on nitrile rubber. Surf. Coat. Technol. 2012, 206, 4881–4886. [Google Scholar] [CrossRef]
  8. Nakahigashi, T.; Tanaka; Miyake, K.; Oohara, H. Properties of flexible DLC film deposited by amplitude-modulated RF P-CVD. Tribol. Int. 2004, 37, 907–912. [Google Scholar] [CrossRef]
  9. Martinez, L.; Nevshupa, R.; Alvarez, L.; Huttel, Y.; Mendez, J.; Roman, E.; Mozas, E.; Valdes, J.R.; Jimenez, M.A.; Gachon, Y.; et al. Application of diamond-like carbon coatings to elastomers frictional surfaces. Tribol. Int. 2009, 42, 584–590. [Google Scholar] [CrossRef]
  10. Mangolini, F.; Krick, B.A.; Jacobs, T.D.B.; Khanal, S.R.; Streller, F.; McClimon, J.B.; Hilbert, J.; Prasad, S.V.; Scharf, T.W.; Ohlhausen, J.A.; et al. Effect of silicon and oxygen dopants on the stability of hydrogenated amorphous carbon under harsh environmental conditions. Carbon 2018, 130, 127–136. [Google Scholar] [CrossRef]
  11. Kang, M.C.; Tak, H.S.; Jeong, Y.K.; Lee, H.W.; Kim, J.S. Properties and tool performance of ta-C films deposited by double-bend filtered cathodic vacuum arc for micro drilling applications. Diam. Relat. Mater. 2010, 19, 866–869. [Google Scholar] [CrossRef]
  12. Harigai, T.; Miyamoto, Y.; Yamano, M.; Tanimoto, T.; Suda, Y.; Takikawa, H.; Kawano, T.; Nishiuchi, M.; Sakaki, H.; Kondo, K.; et al. Self-supporting tetrahedral amorphous carbon films consisting of multilayered structure prepared using filtered arc deposition. Thin Solid Films 2019, 675, 123–127. [Google Scholar] [CrossRef]
  13. Zhang, L.J.; Zong, X.M.; Yuan, X.M.; Xing, X.L. Effects of Polyurethane Substrate Pre-Treatment on Pulsed Cathodic Arc Deposited DLC Films. Coatings 2020, 10, 545. [Google Scholar] [CrossRef]
  14. Zhao, D.C.; Ma, Z.J.; Liu, X.G.; Zheng, J.; Zhang, Z.Y. Study on Mechanical Properties of Nitrogen-doped ta-C Thin Films Prepared by Multi-stage Triggered Pulsed Arc Source Technology. J. Mech. Eng. 2023, 59, 108–117. [Google Scholar] [CrossRef]
  15. Li, Z.D.; Zhan, H.; Wang, Y.Q.; Wang, R.J.; Wang, W.P. Effects of Plasma Etching Pretreatment on Adhesion of Carbon-based Film. Surf. Technol. 2017, 46, 64–68. [Google Scholar] [CrossRef]
  16. Song, Y.Q.; Han, C.X.; Zhen, N.N.; Wang, Y.K.; Leng, Y.X.; Wu, Z.Y.; Deng, Q.Y.; Wen, F. Nitrogen-Doped Diamond-like Carbon Buffer Layer Enhances the Mechanical and Tribological Properties of Diamond-like Carbon Films Deposited on Nitrile Rubber Substrate. Coatings 2024, 14, 515. [Google Scholar] [CrossRef]
  17. Zhang, T.F.; Wan, Z.X.; Ding, J.C.; Zhang, S.H.; Wang, Q.M.; Kim, K.H. Microstructure and high-temperature tribological properties of Si-doped hydrogenated diamond-like carbon films. Appl. Surf. Sci. 2018, 435, 963–973. [Google Scholar] [CrossRef]
  18. Cai, C.L.; Wang, J.M.; Mi, Q.; Hang, L.X.; Yan, Y.X.; Xu, J.Q. Study on the Deposition Ratio of Pulsed Vacuum Arc Ion Deposition. Surf. Technol. 2002, 31, 27–29. [Google Scholar] [CrossRef]
  19. Xu, Y.; Wang, L.G.; Zhang, G.A.; Chen, T.J.; Jia, J.H. Effect of Rubber Surface Roughness on the Tribological Properties of DLC Film. Surf. Technol. 2023, 52, 225–232. [Google Scholar] [CrossRef]
  20. Wang, M.L.; Cheng, W.J.; Lin, G.Q. Influence of Arc Current on Structure and Properties of the Super-Hard ta-C Film Deposited by Arc Ion Plating. Rare Met. Mater. Eng. 2022, 51, 3095–3102. [Google Scholar]
  21. He, M.Y.; Yeo, C.D. Evaluation of Thermal Degradation of DLC Film Using a Novel Raman Spectroscopy Technique. Coatings 2018, 8, 143. [Google Scholar] [CrossRef]
  22. Zhang, S.; Zeng, X.T.; Xie, H.; Hing, P. A phenomenological approach for the Id/Ig ratio and sp3 fraction of magnetron sputtered a-C films. Surf. Coat. Technol. 2000, 123, 256–260. [Google Scholar] [CrossRef]
  23. Xu, S.P.; Chen, W.Q.; Li, Y.H.; Li, X.W. Effect of Arc Current on Structure and Properties of Ultrathin Tetrahedral Amorphous Carbon Film. Chin. J. Mater. Res. 2016, 30, 11. [Google Scholar] [CrossRef]
  24. Mabuchi, Y.; Higuchi, T.; Yoshimura, D.; Murashima, M.; Kousaka, H.; Umehara, N. Influence of carbon black in engine oil on wear of H-free diamond-like carbon coatings. Tribol. Int. 2014, 73, 138–147. [Google Scholar] [CrossRef]
  25. Chen, R.F.; Ye, C.C.; Sun, X.H.; Li, F.F.; Chen, H.B.; Miao, Y.L.; Zhao, Z.S.; Zhao, Y.H. Effect of Bias Substrate on the Structure and Corrosion Resistance of Tetrahedral Amorphous Carbon Thin Films. J. Mater. Eng. Perform. 2025. [Google Scholar] [CrossRef]
  26. Walter, M.; Mangolini, F.; McClimon, J.B.; Carpick, R.W.; Moseler, M. Origin of C(1s) binding energy shifts in amorphous carbon materials. Phys. Rev. Mater. 2025, 9, 035601. [Google Scholar] [CrossRef]
  27. Yudhanto, A.; Li, X.L.; Tao, R.; Melentiev, R.; Lubineau, G. Identifying adhesion characteristics of metal-polymer interfaces: Recent.advances in the case of electroplated acrylonitrile butadiene styrene. Mater. Today Commun. 2023, 35, 106218. [Google Scholar] [CrossRef]
  28. Xu, Y.; Jia, J.H.; Zhang, G.A.; Li, H.C.; Chen, T.J. Effect of rubber substrates on the flexibility and tribological properties of diamond-like carbon coatings. Surf. Coat. Technol. 2021, 422, 127526. [Google Scholar] [CrossRef]
  29. Bai, C.N.; Qiang, L.; Zhang, B.; Gao, K.X.; Zhang, J.Y. Optimizing the tribological performance of DLC-coated NBR rubber: The role of hydrogen in films. Friction 2022, 10, 866–877. [Google Scholar] [CrossRef]
  30. Si, Y.J.; Wei, Y.J. Semi-analytical solutions of kinked edge cracks. Eng. Fract. Mech. 2024, 309, 110392. [Google Scholar] [CrossRef]
  31. Xing, Y.Q.; Wang, X.S.; Du, Z.H.; Zhu, Z.W.; Wu, Z.; Liu, L. Synergistic effect of surface textures and DLC coatings for enhancing friction and wear performances of Si3N4/TiC ceramic. Ceram. Int. 2021, 48, 514–524. [Google Scholar] [CrossRef]
  32. Wang, L.J.; Zhang, Z.L.; Chen, H.; Wang, H.Y.; Liu, Y.; Wang, J.X.; Wang, M.C. Friction behavior of diamond-like carbon coatings with different sp3 contents by atomistic-scale friction dynamics. Surf. Coat. Technol. 2023, 464, 129580. [Google Scholar] [CrossRef]
  33. Shen, M.X.; Peng, X.D.; Meng, X.K.; Zheng, J.P.; Zhu, M.H. Fretting wear behavior of acrylonitrile-butadiene rubber (NBR) for mechanical seal applications. Tribol. Int. 2016, 93, 419–428. [Google Scholar] [CrossRef]
  34. Suzuki, A.; Aiyama, Y.; Tokoro, M.; Sekiguchi, H.; Masuko, M. Friction and wear characteristics of hydrogenated diamond-like carbon films formed on the roughened stainless steel surface. Wear 2010, 269, 118–124. [Google Scholar] [CrossRef]
Figure 1. (a) Schematic diagram of thin film deposition system and (b) Schematic diagram of the pulsed arc ion source, C1: capacitor connects primary ignition anode and cathode; C2: capacitor connects secondary ignition anode and cathode; C3: capacitor connects cathode target and discharge anode, the voltage between C3 is known as the arc voltage U.
Coatings 15 00809 g001
Figure 2. SEM of specimens after pretreatment: (a) specimen 1, (b) specimen 2, (c) specimen 3, (d) specimen 4, (e) specimen 5, (f) specimen 6.
Coatings 15 00809 g002
Figure 3. Surface roughness of deposited films.
Coatings 15 00809 g003
Figure 4. Raman spectroscopy of films.
Coatings 15 00809 g004
Figure 5. G peak position of deposited samples and ID/IG as a function of arc voltage.
Coatings 15 00809 g005
Figure 6. XPS full spectra (a) and C 1s XPS spectra (b) of ta-C films deposited at different arc currents.
Coatings 15 00809 g006
Figure 7. C 1s XPS fitting spectra of ta-C films deposited at different arc voltage: (a) specimen 2, (b) specimen 3 (c) specimen 4, (d) specimen 5, (e) specimen 6.
Coatings 15 00809 g007
Figure 8. sp3 content of ta-C films deposited at different arc voltage.
Coatings 15 00809 g008
Figure 9. Optical microscopy images of X-cut positions of ta-C films deposited at different arc voltage: (a) specimen 2, (b) specimen 3, (c) specimen 4, (d) specimen 5, (e) specimen6.
Coatings 15 00809 g009
Figure 10. Friction coefficient of ta-C films as a function of sliding time.
Coatings 15 00809 g010
Figure 11. Mass loss of specimens after dry friction.
Coatings 15 00809 g011
Figure 12. Wear track morphology of rubber substrates and ta-C films: (a) specimen 1, (b) specimen 2, (c) specimen 3, (d) specimen 4, (e) specimen 5, (f) specimen 6.
Coatings 15 00809 g012
Table 1. Deposition parameters and thickness of the ta-C coating.
Sample No.Voltage/VWorking Pressure/PaPulse Frequency/HzPulse
Count
Film
Thickness/nm
1/////
21505 × 10−3312,00058
32005 × 10−3312,000100
42505 × 10−3312,000156
53005 × 10−3312,000225
63505 × 10−3312,000310
Disclaimer/Publisher’s Note: The statements, opinions and data contained in all publications are solely those of the individual author(s) and contributor(s) and not of MDPI and/or the editor(s). MDPI and/or the editor(s) disclaim responsibility for any injury to people or property resulting from any ideas, methods, instructions or products referred to in the content.

