Abstract
Under service conditions, randomly distributed cracks in the top coat (TC) layer of thermal barrier coatings (TBCs) lead to local stress concentrations, which serve as the primary drivers of crack propagation and coating delamination. This study systematically analyzes the influence of crack defects on the thermal stress distribution in TBCs, based on their microstructural characteristics, using a multi-physics-coupled finite element model. Numerical analysis of crack characteristics reveals that crack length significantly influences the stress distribution in the coatings, with the maximum tensile stress at the crack tip increasing from 104.02 to 238.51 MPa as the crack half-length extends from 400 to 1000 μm. Shorter cracks induce lower tensile stresses, thereby retarding crack propagation and delaying coating delamination. Crack depth also influences the stress distribution, with the maximum tensile stress decreasing from 205.88 to 101.65 MPa as the crack is buried deeper, from 50 to 200 μm, indicating a more stable stress state less prone to propagation in deeper cracks. For inclined cracks, increasing the inclination angle induces a shift in stress from tensile to compressive, with larger inclination angles exhibiting greater stability. Accordingly, this study proposes a laser scribing strategy to mitigate crack-tip stress concentration, which is validated through comparison with two-dimensional crack models. Laser scribing shortens crack length by interrupting crack continuity, relieves localized thermal expansion strain, effectively suppresses crack growth, and significantly enhances the crack resistance and thermal shock stability of the coating.
1. Introduction
Turbine blades, as critical components of aero-engines, operate under extremely harsh environmental conditions for prolonged periods [1]. Thermal barrier coatings (TBCs) serve as protective layers and are subjected to combined thermal, mechanical, and chemical stresses during service, eventually leading to failure and delamination from the substrate [2,3]. Premature coating delamination presents a critical barrier to safe application, making the extension of TBC service life vital for ensuring engine reliability and safety [4,5]. At elevated temperatures, failure mechanisms primarily arise from stress mismatches between mechanical loads and thermal cycling, which readily induce crack initiation and propagation at the coating surface and interface, ultimately resulting in delamination and failure [6,7]. Therefore, comprehensive analysis of the failure mechanisms of TBCs under complex service environments is essential for improving their longevity and overall reliability.
The spalling failure of TBCs resulting from crack propagation under high-temperature service conditions has become a major obstacle to their engineering applications [8]. Stress concentration at crack tips during thermal cycling is widely regarded as the primary mechanism responsible for TBC spallation [9,10]. Numerous studies have demonstrated that crack propagation occurs when localized stresses exceed the material’s yield strength, with primary contributing factors including thermal stresses from mismatched coefficients of thermal expansion, thermally induced growth stresses in the thermally grown oxide (TGO) layer, and phase transformation stresses [11,12,13]. Kyaw et al. [14] employed finite element analysis to investigate stress mismatches within a TBC system, showing that maximum tensile stress concentrated at the peak of the bond coat (BC) layer and the valley of the top coat (TC) layer, with significant thermal mismatch stresses developing during the cooling stage, thereby promoting crack propagation [15]. As TGO thickness increases, it becomes a key factor in driving interfacial crack initiation and propagation [16]. To accurately simulate the initiation and propagation of cracks in TBCs under multi-physics coupling conditions, the extended finite element method and the cohesive zone model (CZM) are widely employed to model multi-crack interactions and interface delamination. Previous studies have demonstrated that XFEM is effective in capturing the evolution paths of internal (bulk) cracks, while CZM is well-suited for characterizing the interfacial crack driving mechanisms. The integrated application of these two methods enables a comprehensive analysis of the effects of TGO thickness evolution, interface roughness, and thermal stress cycling on the early-stage spallation behavior of TBC systems [17,18,19].
Three-dimensional numerical simulations analyzing peak and trough effects at the TC/BC interface indicate that, although variations in TGO thickness have limited impact on radial and circumferential stresses at the BC interface, elevated TGO growth stresses tend to induce early cracking, whereas the TGO creep effect may delay crack formation at the TC/TGO interface [20,21]. At the microscale, the surface roughness and porosity of the TC significantly influence the distribution of residual stresses in the TGO during thermal cycling. Studies have shown that surface roughness during heating induces localized stress concentrations that promote horizontal crack initiation, while during cooling, porosity shifts stress concentration from the TC/TGO interface to nearby pores, accelerating horizontal crack propagation within the TC as TGO thickness increases [22,23]. To investigate the effects of TGO growth on thermal-cycling-induced stress states and crack propagation behavior, various layered structural models have been developed in recent years to quantitatively simulate the continuous propagation, coalescence, and exfoliation of multiple cracks, incorporating inhomogeneous transverse growth strains, fracture mechanics, and extended finite element methods [24,25]. Considering lateral growth strain within the TGO, tensile and shear stresses in the TC accumulate periodically, and localized stress concentrations become the dominant factor promoting early crack propagation, while the continued interlocking growth of multiple cracks further exacerbates overall spallation. Additionally, the distribution of vertical and periodic surface cracks significantly affects TBC system failure behavior. Studies employing TBC models with multiple vertical cracks have systematically investigated the effects of crack spacing, distribution uniformity, and coating thickness on interfacial stress, crack driving forces, and dynamic propagation behavior, revealing that optimizing vertical crack spacing or surface crack density can suppress crack propagation, mitigate interfacial cracking, and thereby enhance overall TBC durability [26].
Therefore, a comprehensive analysis of stress field distribution in cracked regions during thermal cycling is of critical theoretical importance for elucidating the failure mechanisms of TBCs. Accurate characterization of stress field intensity in cracked TBC systems not only aids in interpreting failure phenomena observed during thermal cycling tests or actual service but also establishes a robust theoretical basis for optimizing TBC structural design. Currently, research on surface cracks in TC layers remains limited, and the quantitative characterization of local stress distribution in crack-containing TBC systems is still inadequate. Accordingly, this study employs the finite element method to systematically analyze the stress field distribution and deformation response of crack-containing TC layers under thermal cycling and investigates the influence of crack structural parameters on local stress evolution. Based on the simulation results, a strategy to alleviate crack-tip stress concentration and suppress crack propagation is proposed and validated through numerical simulations. This study aims to provide a robust theoretical foundation and technical guidance for optimizing the structural design and extending the service life of TBCs.
2. Materials and Methods
2.1. Structural Characterization and Crack Geometry Extraction
In order to better observe the crack structure within the TC layer, X-ray CT scanning experiments were conducted on the thermal-barrier-coated ceramic insulation layer using a nano-CT system manufactured by Zeiss—one of the most advanced nano-scale CT systems. This equipment offers a detail resolution of up to 200 nm and a voxel resolution of 0.3 μm. During the experiments, a magnification of approximately 130× was selected for X-ray projection imaging, yielding an imaging resolution of 0.65 μm. The corresponding transillumination parameters are presented below:
- (1)
- Tube voltage: 150 kV;
- (2)
- Tube current: 15 μA;
- (3)
- Integration time: 6000 ms;
- (4)
- Magnification: 130×;
- (5)
- Focus-to-sample distance: 11.4 mm;
- (6)
- Focus-to-detector distance: 12 mm;
- (7)
- Number of projections: 1801 over 360°.
The TC layer scan data were imported into Avizo software to perform threshold segmentation of pores and cracks, enabling the visualization of internal pore and crack structures. The blue-rendered areas in Figure 1 represent pores and cracks, illustrating the complexity of the coating’s internal structure. The internal cracks in the TC layer of this thermal barrier coating primarily exhibit a long, stripe-like distribution pattern and are randomly located at varying depths within the TC layer, with no fixed orientation. These long, stripe-like cracks are associated with localized thermal stress concentrations within the coating or stress mismatches caused by differences in material thermal expansion, which can lead to brittle fracture in the coating.
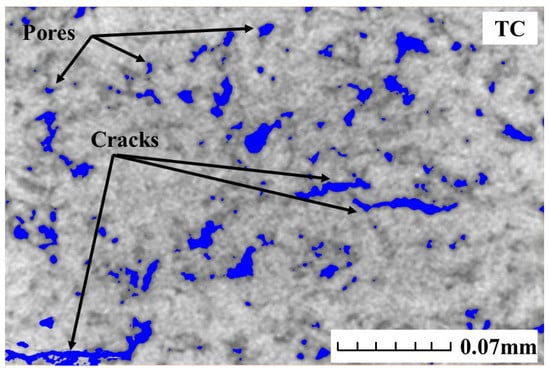
Figure 1.
Analysis of the pores and cracks in the TC layer.
Thus, crack morphology and distribution not only reflect the mechanical behavior of coatings under high-temperature conditions but also serve as key indicators in failure analysis. Detailed analysis enables the identification of crack formation mechanisms and clarifies their specific morphology and distribution, providing a foundation for subsequent investigations into the coating’s thermal insulation performance, service life, and failure mechanisms. These insights can guide targeted design optimization, enhance coating reliability and stability, and support the performance improvement and practical application of thermal barrier coatings.
2.2. Finite Element Modeling
2.2.1. Geometric Model and Boundary Conditions
The thermal barrier coating structure model constructed in this study consists of a ceramic layer (TC), a thermally grown oxide layer (TGO), a bonding layer (BC), and a high-temperature alloy substrate (SUB). To simplify the calculation, the model was treated as a two-dimensional planar model, and its geometry is shown in Figure 2a. The overall width of the model is 3 mm, and the thicknesses of each layer are 250 or 800 μm for the TC layer, 150 μm for the BC layer, 5 μm for the TGO layer, and 3 mm for the SUB layer. The layers are bonded to form an integrated structure, with the interfacial roughness between layers neglected and the assumption that the layers are tightly adhered to each other, ensuring efficient heat and stress transfer within the thermal barrier coating.
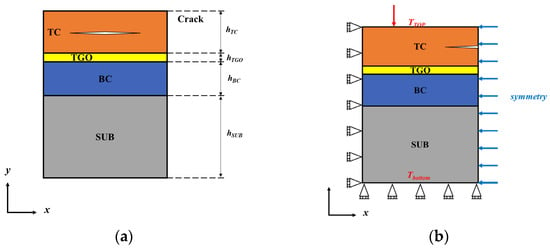
Figure 2.
Geometric model and boundary conditions: (a) multilayer structural model of the thermal barrier coating; (b) boundary conditions of the thermal barrier coating.
To investigate crack behavior in the TC layer, the following modeling assumptions are applied:
- (1)
- The dynamic growth of the TGO layer is neglected.
- (2)
- Residual stress generated during coating preparation is not considered.
- (3)
- Phase transition-induced thermal effects are excluded from the calculations.
- (4)
- Interfaces between layers are fully bonded with no relative displacement.
To simplify the calculation, the model is treated as a two-dimensional planar geometry. Interfacial roughness is neglected, and perfect adhesion between layers is assumed to ensure efficient thermal and mechanical continuity across the TBC.
As shown in Figure 2b, symmetric boundary conditions along the y-axis were applied to the left edge of the two-dimensional model, while displacements at the bottom surface (in the y-direction) and the right boundary (in the x-direction) were restricted [27,28]. In the finite element simulation, the service-related thermal cycling conditions were divided into three stages, and periodic thermal boundary conditions were applied to the upper surface of the coating.
Specifically, in each thermal cycle, the upper surface was rapidly heated from 20 °C to 1425 °C within 5 min, held at 1425 °C for 50 min, and then cooled back to 20 °C over 5 min, completing one full thermal cycle per hour. A similar thermal cycling profile was applied to the bottom surface of the substrate, with the maximum temperature limited to 875 °C. Figure 3 presents the temperature–time profile for a single thermal cycle.
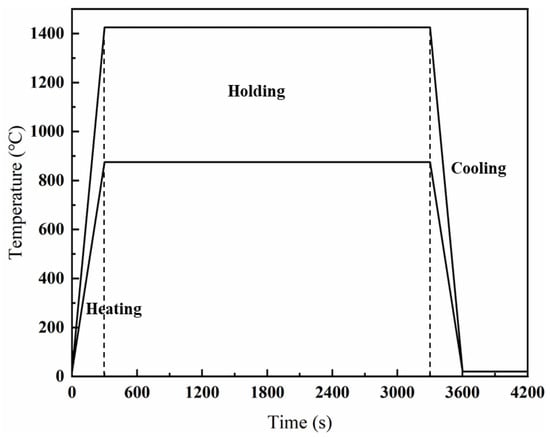
Figure 3.
Thermal cycling curves for thermal barrier coatings.
2.2.2. Grid Division and Material Parameters
The model was discretized using CPE4T four-node plane strain elements. Due to the pronounced stress concentration and strain gradient near the crack tip, a local mesh refinement strategy was employed to enhance numerical accuracy and capture detailed mechanical responses in this critical region. Additionally, the axial direction of the TGO layer was also refined due to its significantly smaller thickness compared to the substrate. A mesh and time-step independence study was conducted for the transient simulations, in which the variation in maximum von Mises stress near the crack tip was compared under various mesh densities and refinement levels. The results of the mesh independence analysis are summarized in Table 1, indicating that mesh independence is achieved when the mesh size near the crack tip is below 0.8 μm, the maximum mesh size in the matrix and other regions does not exceed 50 μm, and the time step remains below 50 s. Based on this validation, the final simulation employed a global mesh size of 15 μm, a refined mesh of 0.2–0.3 μm near the crack tip, and a time step of 20–30 s, as shown in the meshing schematic in Figure 4.

Table 1.
Verification of grid and time step independence.
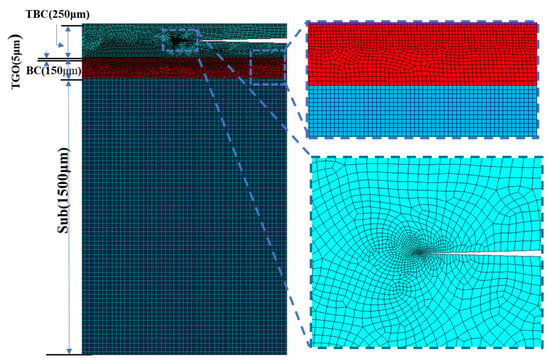
Figure 4.
Schematic diagram of grid division.
In finite element modeling of TBC systems, the choice of material parameters is critical for elucidating failure mechanisms. Assuming isotropy and material homogenization, each layer is treated as an isotropic, homogeneous medium, and a multilayer constitutive model is constructed for the TBC/TGO/SUB system.
For the TC layer, typically composed of yttria-stabilized zirconia (YSZ), and the SUB layer, commonly made of LaMgAl11O19-based high-temperature alloy, both exhibit predominantly linear elastic behavior under conventional service conditions. Therefore, Hooke’s law is employed to characterize the stress–strain relationship. The tensor form is given by
Assuming material isotropy, the equation simplifies to the above form, where
where and denote the stress and infinitesimal strain tensors, respectively; is the trace of the strain tensor; is the second-order identity tensor; and are the Lamé constants, which are related to the Young’s modulus and Poisson’s ratio by
For the TGO layer and the BC layer, typically consisting of NiCoCrAlY alloy, inelastic deformation behavior must be considered. Long-term thermal cycling experiments have shown that when the operating temperature exceeds the critical threshold of 600 °C, creep relaxation can reduce interfacial stress amplitudes by over 58%. This time–temperature-dependent degradation mechanism critically influences the kinetics of coating delamination failure [29,30]. Accordingly, both plasticity and creep effects are incorporated into the numerical simulations. The plastic response is characterized using a kinematic hardening model expressed as
where is the plastic strain rate tensor, denotes the back stress tensor, and is a function describing the evolution of the yield surface governed by the following hardening modulus.
At elevated temperatures, time-dependent deformation becomes dominant, and creep is modeled using the Norton power-law equation:
where is the applied stress, MPa; n is the creep exponent; B is the creep pre-factor, MPa−n·s−1; and is the creep strain rate, s−1.
The creep parameters for the TBC system are summarized in Table 2. The elastic modulus, Poisson’s ratio, and thermal expansion coefficients of each layer are presented in Table 3, while the plasticity parameters of the bond coat are provided in Table 4. By carefully assigning these material parameters, the constructed computational model reliably captures the mechanical behavior of the TBC system under complex thermo-mechanical loading.
Table 2.
Physical parameters of thermal barrier coatings [31,32].
Table 3.
Plasticity parameters of bonded and oxidized layers [33].
Table 4.
Creep parameters of materials in layers of thermal barrier coatings [34].
2.3. Simulation Methodology
In this study, numerical simulations of the thermo-mechanical coupling behavior of a TBC system under cyclic thermal loading were conducted using the standard finite element module in ANSYS. A two-dimensional axisymmetric model was adopted, and PLANE223 high-order coupled-field elements were selected for mesh discretization. Each PLANE223 element is an 8-node plane strain element with both temperature and displacement degrees of freedom, capable of accurately capturing thermo-mechanical coupling effects in the multilayer structure, particularly near the crack tip. Transient analysis based on a directly coupled thermo-mechanical approach was employed to capture the time-dependent evolution of stress fields within the coating, with emphasis on the crack tip region. A strong coupling between temperature and stress fields was implemented using iterative solving techniques based on the maximum stress criterion, focusing on the influence of crack geometry on local stress distribution near the tip. The parametric model was developed using APDL scripting to enable flexible adjustment of geometric variables such as crack length, location, and inclination angle. Three key parameters—crack length, burial depth, and inclination angle—were selected to represent the principal geometric features of open cracks. This numerical approach provides an efficient analytical tool and theoretical basis for investigating the influence of crack defects on the extension mechanism of TBCs under complex thermo-mechanical loading.
3. Results and Discussion
3.1. Temperature Field Calculation Results
Under thermal cyclic loading, a pronounced nonuniform temperature gradient develops within the TBC system. The transient temperature distribution of the TBC system is illustrated in Figure 5a, showing a distinct temperature difference between the upper and lower crack surfaces at the high-temperature steady state (300 s), as shown in Figure 5b, with a temperature difference of approximately 50 °C across the crack region. This indicates significant thermal nonuniformity within the crack region, with local temperature gradients reaching magnitudes on the order of 102 °C/mm. As the core insulating layer, the temperature distribution in the top coat (TC) significantly influences the stress state and deformation behavior of the entire coating system, with thermally induced stresses due to temperature gradients acting as the primary mechanical drivers of coating failure.
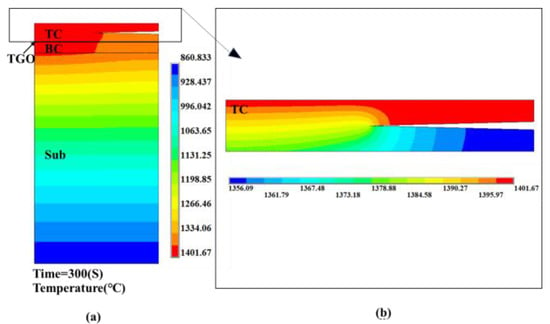
Figure 5.
Calculated temperature field of thermal barrier coating at 300 s: (a) Temperature Distribution of TBCs (b) Temperature Distribution of TC Layer.
3.2. Effect of Crack Characteristics on Local Stress Distribution
Failure in TBC systems is primarily initiated by the nucleation and propagation of transverse cracks, governed by the combined effect of tensile stress in the coating thickness direction (σyy) and interfacial shear stress (σxy). Among these, tensile stress in the y-direction, induced by thermal expansion near cracks, acts as the primary driving factor for crack propagation.
To investigate stress distribution at the crack tip, a thermo-mechanical coupling model was developed to systematically analyze how various crack geometries affect the normal stress component σ22 under service conditions, and to examine its intrinsic correlation with coating failure mechanisms. Here, σ22 represents the normal stress in the y-direction: positive values correspond to tensile stress (material under tension), while negative values represent compressive stress (material under compression).
Figure 6 presents the time-dependent evolution of the normal stress component σ22 over a single thermal cycle for a crack length of 400 μm and a depth of 125 μm in the TC layer, clearly delineating the stress response stages under coupled thermo-mechanical loading. During the heating phase (0–300 s), σ22 values at monitoring points gradually increase with temperature, exhibiting an initial rise, followed by a temporary drop and subsequent increase. This trend is governed by variations in the internal temperature gradient during the coupled thermo-mechanical process. At the onset of heating, a significant temperature gradient between the surface and interior induces uneven thermal expansion and localized stress concentration. As heating continues, the internal temperature becomes more uniform, leading to reduced thermal mismatch and a temporary stress decrease. The initial stress rise is attributed to the mismatch in coefficients of thermal expansion between the TC surface and the substrate, with the surface expanding more rapidly and inducing stress accumulation. As the system approaches thermal equilibrium, thermal mismatch reduces and the stress stabilizes. The stress evolution near the crack tip during heating is driven by localized thermal expansion and temperature field nonuniformity. During the constant-temperature phase (300–3300 s), the stress remains stable, indicating that thermal equilibrium has been achieved. In the cooling phase (3300–3600 s), the stress gradually decreases. Initially, stress relaxation occurs rapidly due to faster contraction of the cooler surface. As the temperature continues to decrease, the stress reduction rate slows and eventually stabilizes.
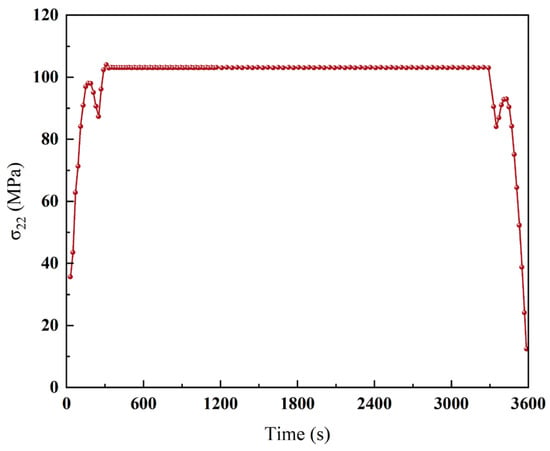
Figure 6.
Stress-time variation curve of monitoring point subjected to temperature gradient.
3.2.1. Effect of Crack Length on Stress Distribution
With prolonged service time, crack initiation and propagation become the most prominent degradation mechanisms in TBCs. To systematically investigate the effect of crack length on the thermo-mechanical behavior and durability of the coating, this study employs a layered coating model and uses numerical simulation to analyze stress field distributions for crack lengths ranging from 400 to 1000 μm. Due to the symmetry of the model, the simulated crack length was set to one-half of the actual physical length.
As illustrated in Figure 7, increasing crack length significantly alters the stress distribution within the coating and leads to pronounced stress concentration near the crack tip. The maximum stress consistently occurs at the crack tip and is accompanied by a steep stress gradient, indicating that this region plays a critical role in stress evolution and crack-driven failure mechanisms.
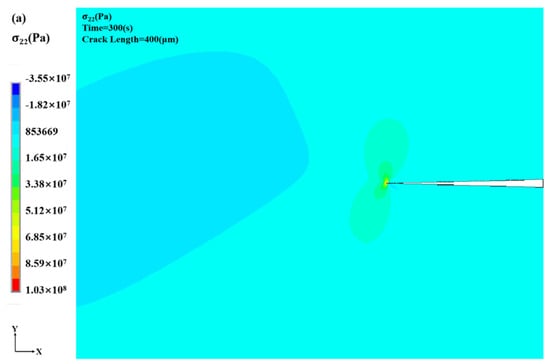
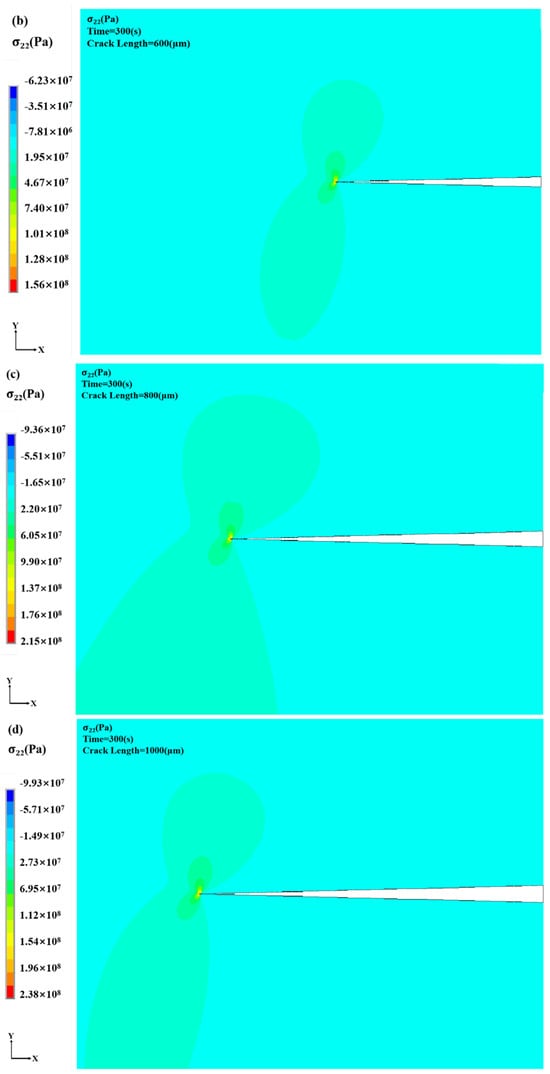
Figure 7.
Stress distribution cloud for different crack lengths: (a) crack length: 400 μm (b) crack length: 600 μm (c) crack length: 800 μm (d) crack length: 1000 μm.
Figure 8 illustrates the evolution of normal stress (σ22) along the Y-direction at the crack tip under varying crack lengths. A clear positive correlation is observed between crack length and crack-tip stress: as the crack length increases from 400 to 1000 μm, σ22 at the crack tip increases significantly, accompanied by an increasingly pronounced stress concentration zone. The maximum σ22 increases from 104.02 to 238.51 MPa, indicating that longer cracks lead to stronger stress amplification.
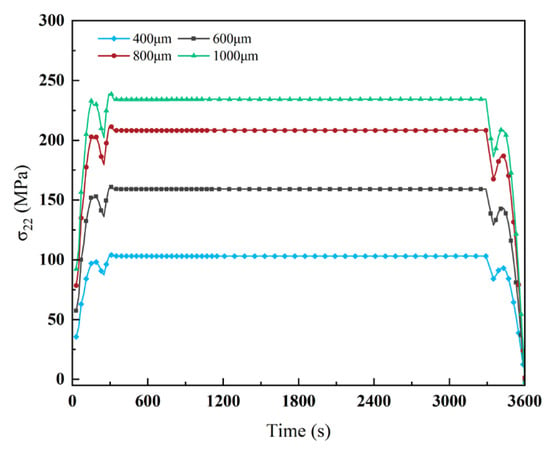
Figure 8.
Effect of crack length on stress at crack tip.
This increase in crack-tip stress is primarily due to the enhanced thermal stress response induced by longer cracks during thermal expansion. The crack tip consistently acts as the primary stress concentration site, and this effect is particularly pronounced under thermally coupled loading, where crack length strongly influences stress sensitivity. Notably, during the heating and cooling phases, the crack-tip stress increases significantly with crack length. This behavior is attributed to differences in thermal expansion and the presence of thermal gradients, which are exacerbated by longer cracks. In particular, peak temperatures result in a sharp increase in crack-tip stress. During cooling, the stress gradually decreases; however, coatings with longer cracks retain elevated stress levels, indicating that crack length also affects the rate of stress relaxation.
Thus, increasing crack length leads to higher stress concentration at the crack tip, driven by thermal expansion and gradient effects. The thermal stress response becomes more severe for longer cracks, especially during heating and cooling, thereby increasing the risk of fracture.
3.2.2. Effect of Crack Depth on Stress Distribution
Crack burial depth, defined as the vertical distance from the coating surface to the crack, significantly affects stress distribution at the crack tip. To examine this effect, simulations were performed under varying crack burial depths, with a fixed crack length of 600 μm and burial depths ranging from 50 to 200 μm within the TC layer. Figure 9 presents the layered coating model and the corresponding stress field distributions for different crack depths. The crack position along the thickness direction significantly alters the overall stress field within the coating. In all cases, maximum stress occurs at the crack tip; however, the influence of stress concentration on the surrounding material varies with crack depth. Specifically, shallower cracks closer to the coating surface induce broader nonuniformity in the stress field, indicating that burial depth plays a key role in modulating stress transfer and local mechanical behavior in the TBC system.
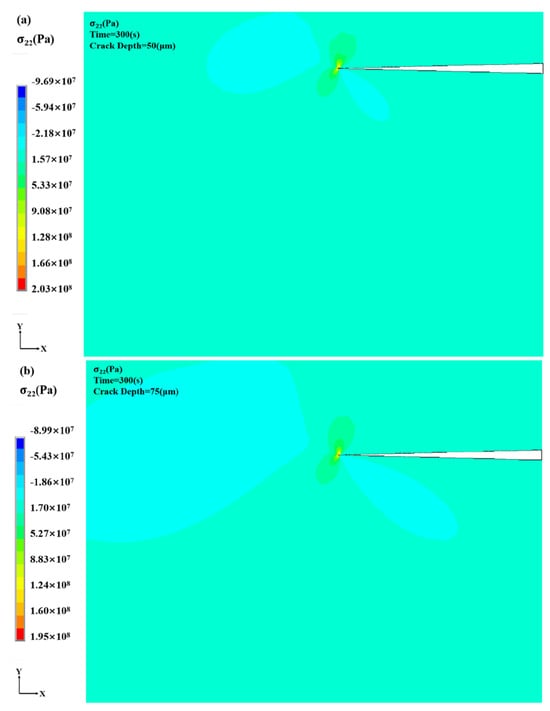
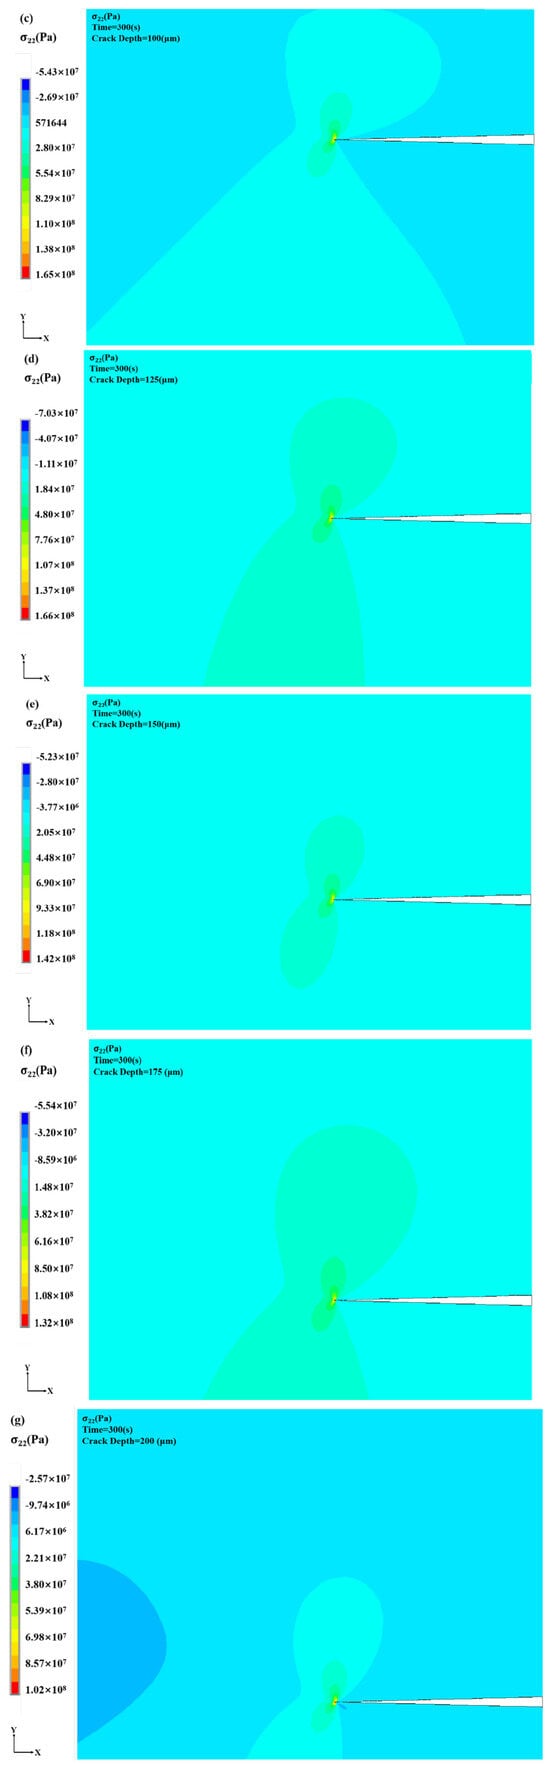
Figure 9.
Stress distribution cloud for different crack depths: (a) crack depth: 50 μm (b) crack depth: 75 μm (c) crack depth: 100 μm (d) crack depth: 125 μm (e) crack depth: 150 μm (f) crack depth: 175 μm (g) crack depth: 200 μm.
Figure 10 and Figure 11 illustrate the time-dependent evolution of crack tip σ22 under thermal loading for various burial depths from the free surface. During the heating phase, σ22 rises rapidly at each depth, with the rate of increase varying based on crack burial depth. For shallow cracks, proximity to the free surface results in strong thermal stress concentration at the tip, reaching up to 205.89 MPa. Cracks near the surface are more directly exposed to thermal cycling, intensifying stress responses.
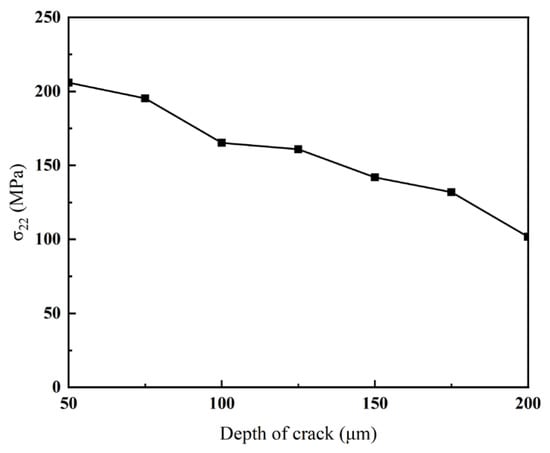
Figure 10.
Maximum tip stresses for cracks of different depths.
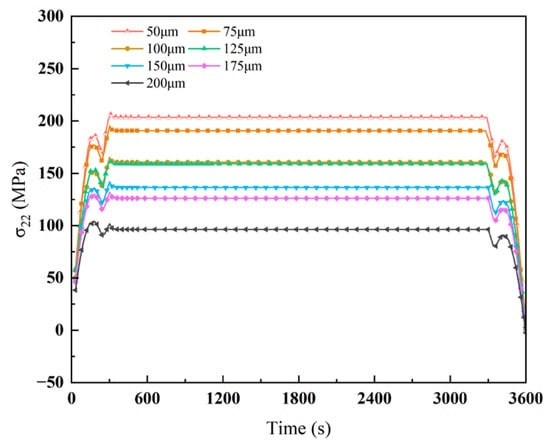
Figure 11.
Effect of crack depth on stresses at the crack tip.
With increasing depth, the crack tip becomes more insulated from surface effects, resulting in a reduced σ22 value of 101.65 MPa. Deeper cracks are less influenced by external thermal loads, and the associated stress transfer paths are more complex, which weakens the concentration effect. During thermal expansion, surface regions experience stronger thermal gradients due to direct heat exposure, leading to higher stresses in shallower cracks. In contrast, deeper cracks exhibit lower thermal gradients and a reduced stress response.
Shallow cracks allow thermal stresses to accumulate and transfer more rapidly to the tip, whereas deeper cracks, embedded within the coating, experience reduced thermal expansion effects. Therefore, crack burial depth significantly affects crack-tip stress behavior. Shallower cracks experience higher σ22 values and pose a greater risk of stress-driven failure. This trend is highly relevant for coating design, as burial depth must be considered when evaluating durability and resistance to crack propagation.
3.2.3. Effect of Crack Inclination on Stress Distribution
To systematically investigate the influence of crack inclination on the stress field within the coating, a 600 μm crack with inclination angles ranging from 10° to 80° was positioned at the center of the simulation domain, and the stress field distribution in the x–y cross-section was analyzed. As shown in Figure 12 and Figure 13, variations in crack inclination significantly alter the coating’s stress distribution characteristics, with the maximum stress consistently localized at the crack tip. Pronounced stress field inhomogeneity is observed in the vicinity of the central crack region. Figure 13 compares the temporal evolution of σ22 at both crack tips for different inclination angles, showing that the inclined crack tip closer to the coating surface exhibits a higher stress concentration, with correspondingly greater tensile stress in the cross-section.
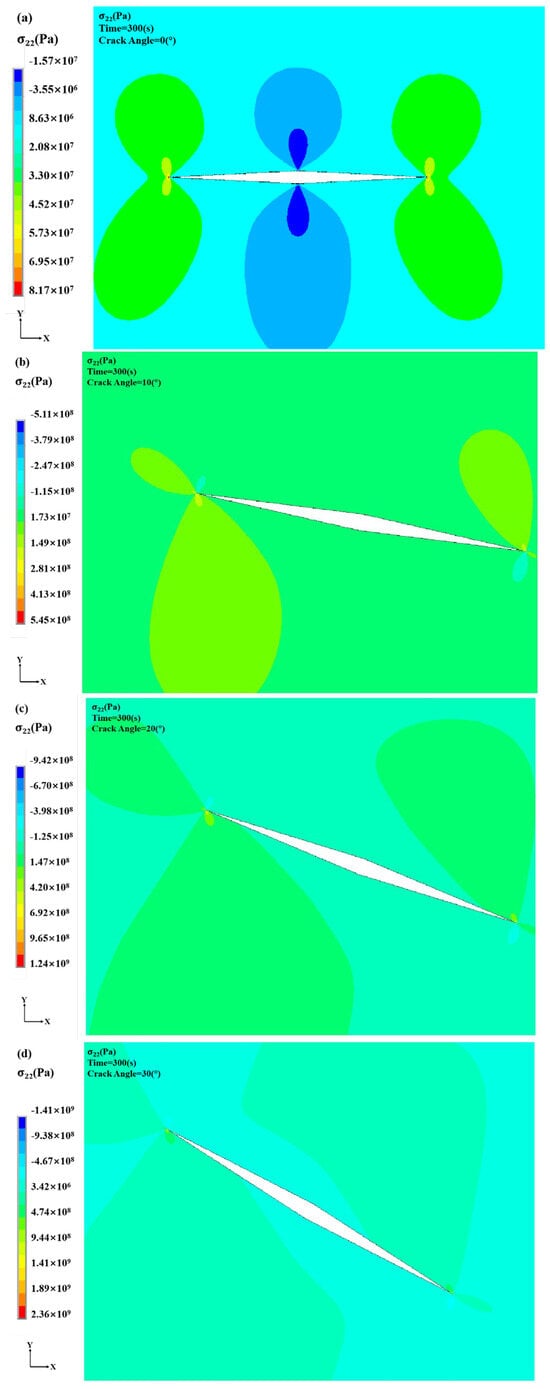
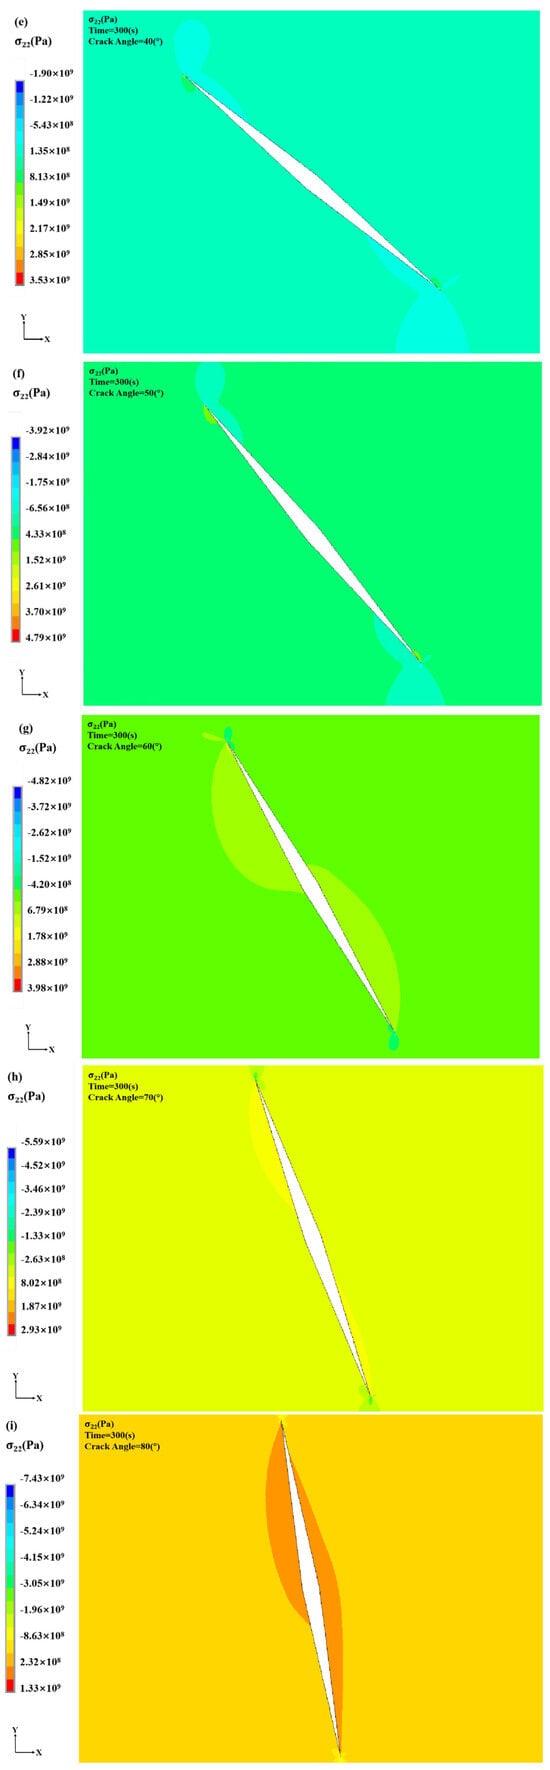
Figure 12.
Stress distribution cloud for different crack inclinations: (a) Crack Inclination: 0° (b) Crack Inclination: 10° (c) Crack Inclination: 20° (d) Crack Inclination: 30° (e) Crack Inclination: 40° (f) Crack Inclination: 50° (g) Crack Inclination: 60° (h) Crack Inclination: 70° (i) Crack Inclination: 80°.
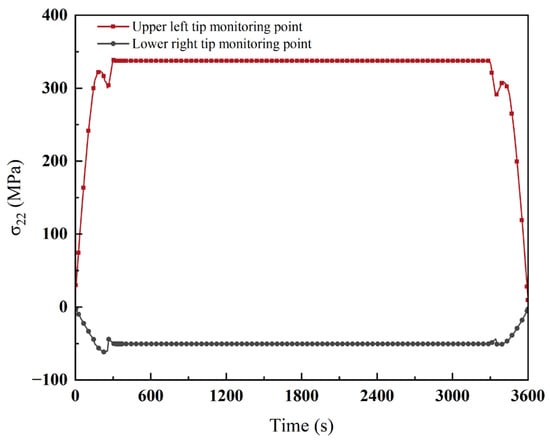
Figure 13.
Variation curves of crack-tip stress values with time at different locations at 10° inclination.
Figure 14 illustrates the temporal evolution of σ22 at the crack tip for various inclination angles. Crack inclination angle significantly affects crack-tip stress, showing a clear fluctuation trend as the angle increases. At 20°, the crack tip exhibits the highest σ22 value of 582.80 MPa, indicating the strongest stress concentration. With increasing inclination angle, the crack-tip stress gradually decreases, with a sharp transition at 40°, where the stress direction reverses from tensile to compressive, reaching −62.04 MPa. Beyond 50°, the compressive stress intensifies further, reaching a minimum of −6786.86 MPa at 80°. This suggests that larger inclination angles enhance stress relief at the crack tip and significantly alter the stress direction.
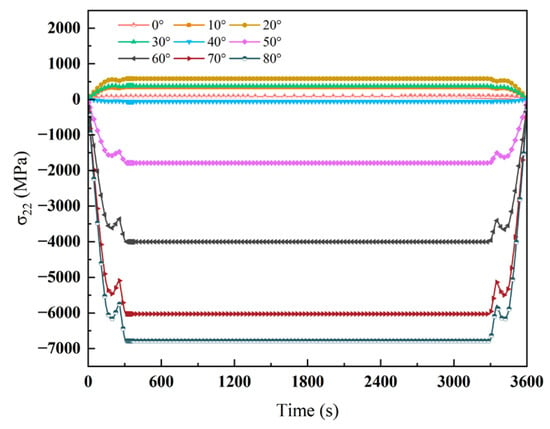
Figure 14.
Effect of crack inclination on the stress at the crack tip.
At low-inclination angles, the crack tip experiences strong thermal expansion mismatch and steep temperature gradients, resulting in localized stress concentration. As the angle increases, the orientation disperses the stress more effectively, reducing its magnitude. Therefore, crack inclination plays a key role in regulating crack-tip stress, with larger angles effectively reducing stress concentration and lowering the risk of crack propagation.
In summary, crack inclination significantly influences the time-dependent evolution of σ22 at the crack tip. Larger inclination angles are associated with higher initial stress sensitivity, lower steady-state stress levels, and more pronounced fluctuations during unloading. These findings highlight the critical role of crack inclination in shaping local stress field evolution and emphasize the importance of considering inclination effects when modeling and assessing the structural integrity and crack growth behavior of TBC systems.
3.3. Optimization Analysis of Surface Scoring Strategy
As demonstrated in the preceding analysis, short cracks induce relatively weak stress–strain responses [35]. In contrast, longer cracks tend to exhibit significant stress concentration at the crack tip, which increases the risk of crack propagation and coating failure. Based on the principles of stress relief and concentration mitigation, converting a long crack into multiple shorter segments can effectively reduce peak stress levels at the crack tip [36]. Laser scribing technology, as illustrated in Figure 15, offers a practical means of segmenting long cracks. To evaluate the effectiveness of this approach in modulating the stress–strain behavior of the coating, a comparative analysis must be performed using a finite element model incorporating segmented cracks.
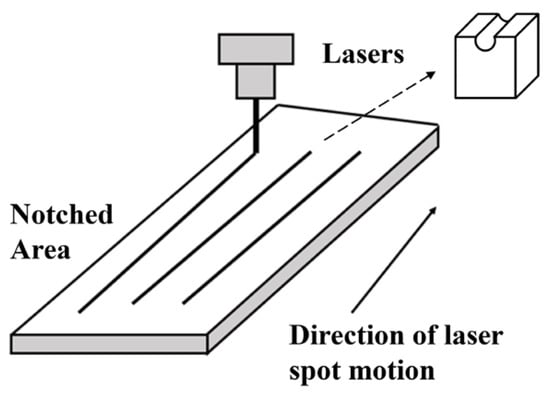
Figure 15.
Schematic diagram of the principle of laser scoring.
3.3.1. Analysis of Crack Stress Response at Different Lengths
To better illustrate the stress distribution at the crack tip, the post-processing results display only the stress distribution at the TC layer crack. Figure 16 shows that, after laser scribing, the location of the maximum internal stress shifts and is no longer concentrated at the crack tip. This observation highlights the limitation of using the overall stress maximum as a benchmark for evaluating crack-tip stress, as done in earlier sections. Accordingly, a fixed node at the crack tip is selected as a consistent observation point, and the crack-tip stress is evaluated before and after laser treatment by analyzing its time-dependent variation at this node. This approach enables a quantitative assessment of the stress mitigation effect of laser scribing at the crack tip.
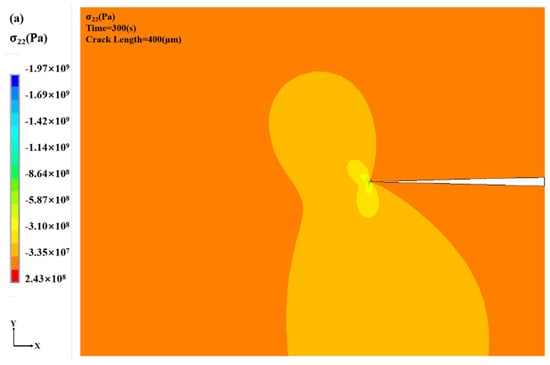
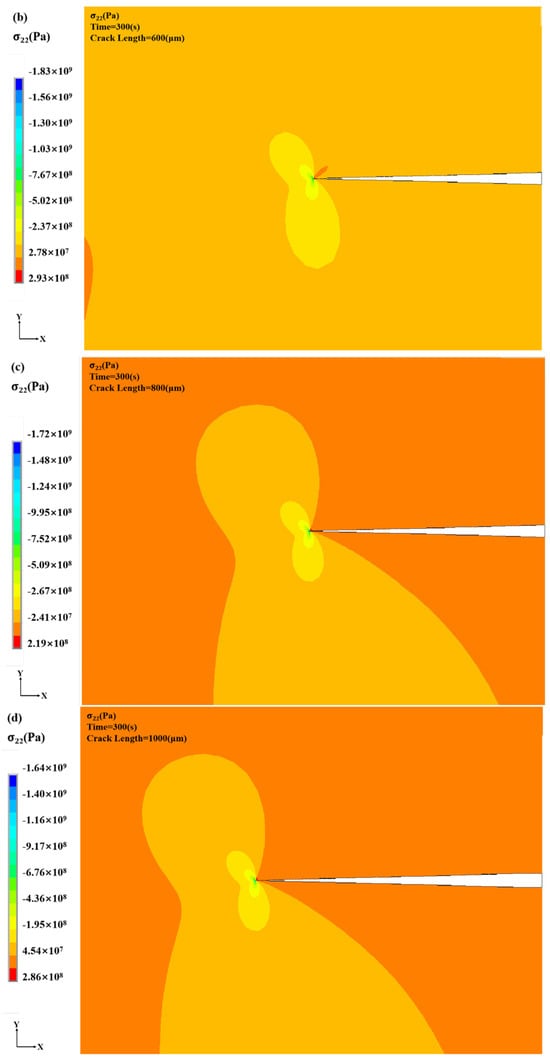
Figure 16.
Stress distribution in cracks of different lengths after laser scoring: (a) crack length: 400 μm (b) crack length: 600 μm (c) crack length: 800 μm (d) crack length: 1000 μm.
As shown in Figure 17, crack-tip stress after laser scoring exhibits non-monotonic fluctuation with respect to crack length. During the heating phase, crack-tip stress increases with rising temperature and thermal expansion mismatch. Increasing crack length intensifies stress concentration. However, laser scoring mitigates this effect by segmenting the crack, reducing stress concentration and resulting in fluctuating rather than monotonically increasing crack-tip stress. Notably, at a crack length of 1000 μm, the stress is comparable to that at 400 μm and closely aligns with values at 600 and 800 μm. During the constant-temperature phase, crack-tip stress stabilizes, and laser scoring results in smaller stress variations due to shortened effective crack length. In the cooling phase, the crack-tip stress decreases gradually.
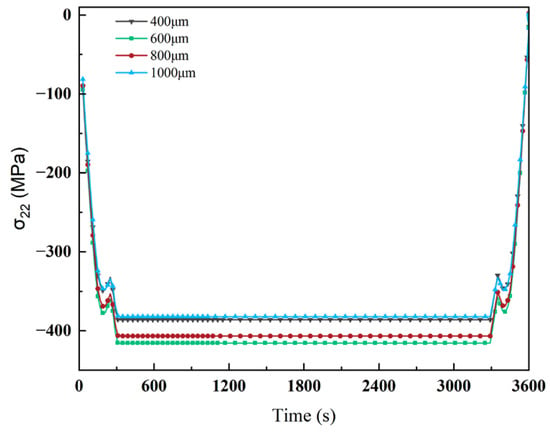
Figure 17.
Effect of laser scoring on stresses in cracks of different lengths.
Importantly, laser scoring induces a notable reversal of stress direction at the crack tip—from tensile to compressive. Although the absolute stress magnitude changes modestly, this reversal can effectively suppress crack propagation. By reversing the stress direction, laser scoring reduces the influence of tensile loading at the crack tip, thereby enhancing the coating’s crack resistance and thermal shock stability.
3.3.2. Analysis of Crack Stress Response at Different Locations
As shown in Figure 18 and Figure 19, crack depth exhibits a contrasting influence on crack-tip stress after indentation compared to the unmodified case. In the unscored model, crack-tip stress typically decreases with increasing crack depth, whereas in the presence of indentation, crack-tip stress increases with depth. At depths of 175 and 200 μm, the stress increases significantly, reaching −534.47 and −577.73 MPa, respectively, while shallower cracks (e.g., 50 μm) exhibit a lower compressive stress of −211.55 MPa. This suggests that indentation modifies the crack stress distribution pattern, enhancing stress concentration at greater depths during thermal cycling.
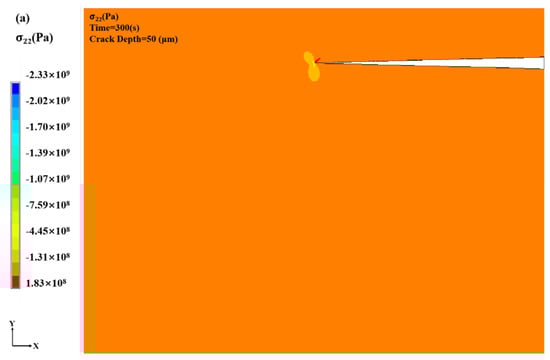
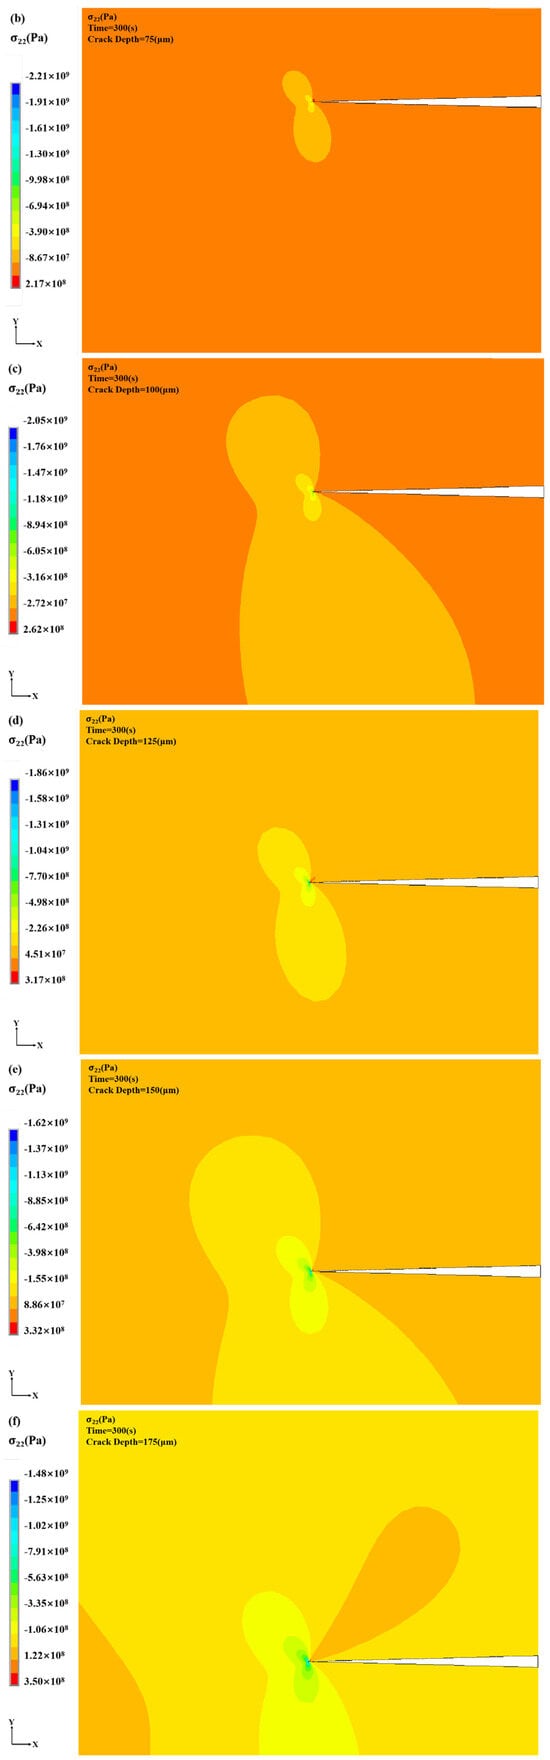
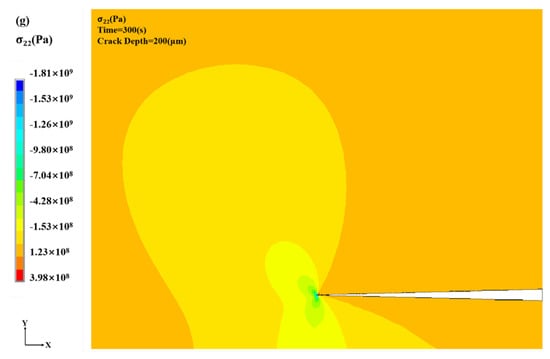
Figure 18.
Stress distribution in cracks of different depths after laser scoring: (a) crack depth: 50 μm (b) crack depth: 75 μm (c) crack depth: 100 μm (d) crack depth: 125 μm (e) crack depth: 150 μm (f) crack depth: 175 μm (g) crack depth: 200 μm.
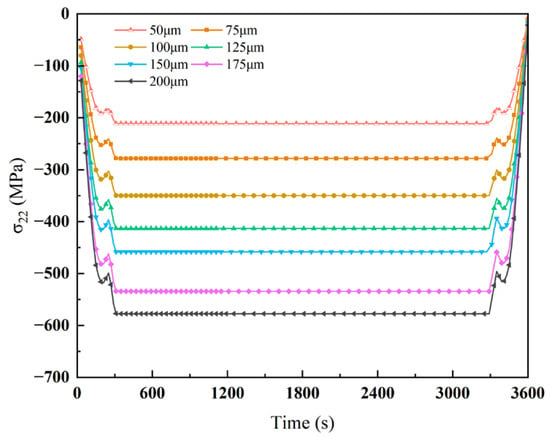
Figure 19.
Effect of laser scoring on stresses in cracks of different depths.
Further analysis shows that indentation also alters the stress direction at the crack tip. As crack depth increases, the stress shifts from tensile to compressive, with deeper cracks exhibiting stronger compressive effects. The increasing magnitude of negative stress indicates that the crack tip is subjected to higher compressive loading. This stress reversal inhibits crack propagation, as compressive stress counteracts tensile-driven crack opening and thus delays crack growth.
Laser scoring not only altered the stress distribution at the crack tip but also enhanced the coating’s crack resistance by reducing effective crack length and reversing stress direction. After laser scoring, crack depth and crack-tip stress exhibit a positive correlation—particularly for deeper cracks, which show both higher compressive stress and a pronounced shift in stress direction, thereby contributing to a reduction in crack propagation rate. As an effective crack intervention, laser scoring contributes to the improved reliability and extended service life of thermal barrier coatings by optimizing local stress fields and mitigating crack growth.
3.3.3. Analysis of Crack Stress Response at Different Inclination Angles
After laser scoring, cracks with varying inclination angles exhibit distinct stress distribution patterns. As shown in Figure 20 and Figure 21, when the inclination angle is small (0°–20°), crack-tip stress concentration remains low, and laser scoring effectively suppresses stress in this region. As the inclination angle increases to 30°–50°, local stress at the crack tip intensifies, and the stress concentration zone shifts progressively along the crack propagation direction. Although laser scoring partially mitigates the crack extension tendency in this range, it also enlarges the high-stress region, thereby increasing the risk of crack growth. At inclination angles above 60°, stress concentration becomes highly pronounced, with high-stress zones extending significantly along the crack path. This suggests that under thermal loading, high-inclination cracks are prone to unstable propagation. Laser scoring can locally redistribute stress but cannot fully eliminate the driving force for crack advancement in such cases.
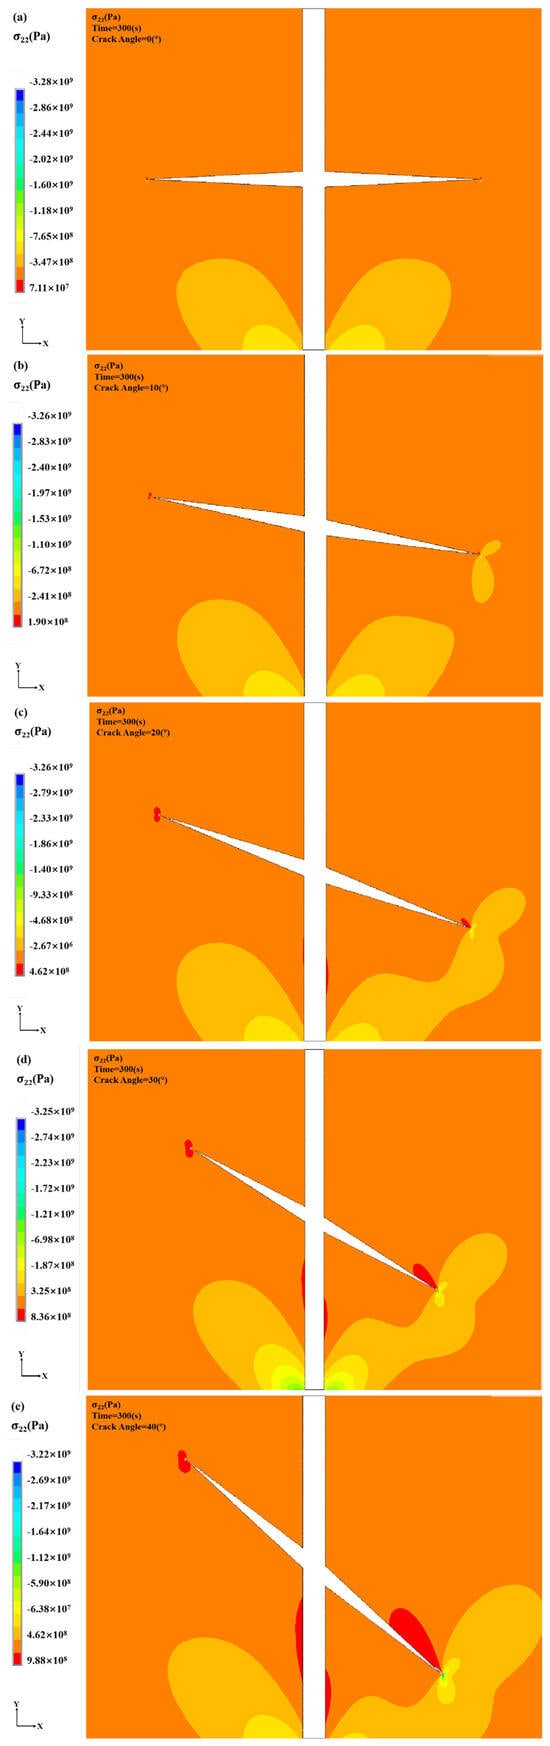
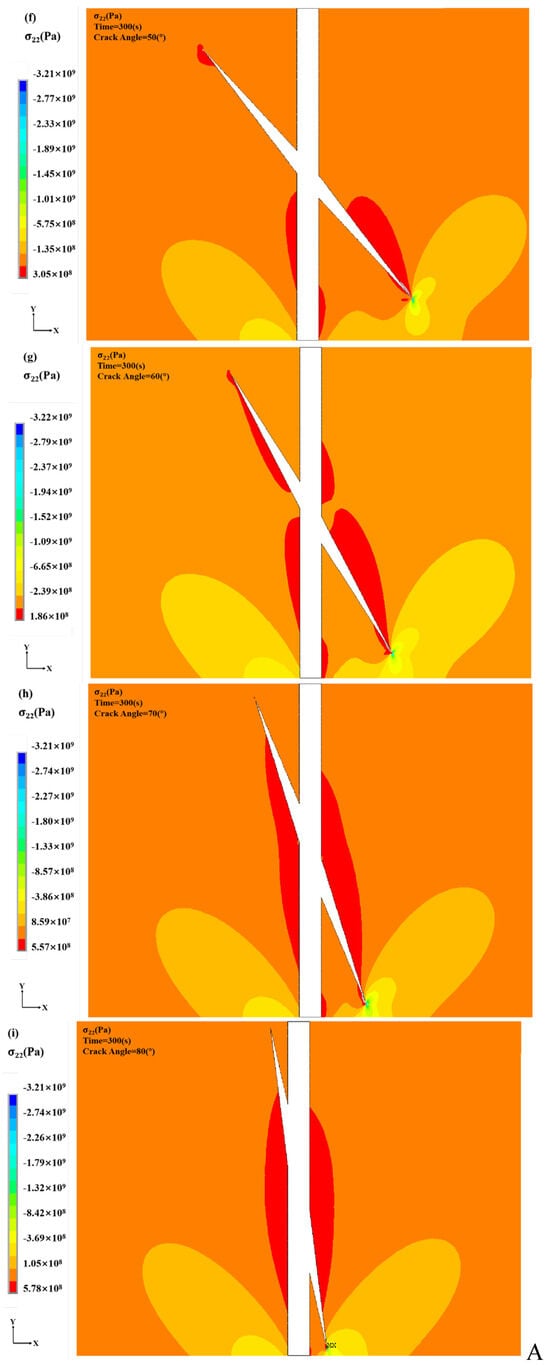
Figure 20.
Crack stress cloud at different inclinations after laser scoring: (a) Crack Inclination: 0° (b) Crack Inclination: 10° (c) Crack Inclination: 20° (d) Crack Inclination: 30° (e) Crack Inclination: 40° (f) Crack Inclination: 50° (g) Crack Inclination: 60° (h) Crack Inclination: 70° (i) Crack Inclination: 80°.
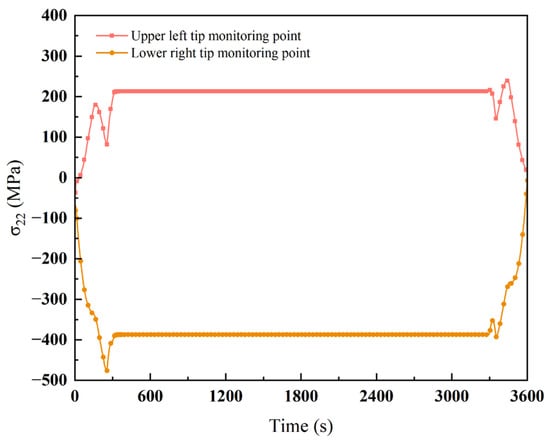
Figure 21.
Stress value versus time for 10° inclination crack tip by laser scoring.
Figure 22 demonstrates that crack inclination significantly influences crack-tip stress evolution, including both magnitude and direction. Compared to unmodified cracks, those treated with laser scoring exhibit a distinct stress evolution pattern. Laser scoring induces a reversal in stress polarity, shifting crack-tip stress from compressive (negative) to tensile (positive). This effect is particularly evident at higher inclination angles, where stress relief becomes more pronounced. With increasing inclination, tensile stress is effectively reduced and replaced by compressive stress, which helps suppress crack propagation. During the heating phase, cracks with smaller inclination angles exhibit higher tensile stress, whereas during cooling, cracks with higher inclination demonstrate smoother stress relaxation and shift toward compressive stress. As crack inclination increases, the peak stress at the crack tip progressively decreases. For inclination angles of 30° and above, crack-tip stress rapidly declines and eventually becomes compressive, indicating that higher inclination effectively reduces stress concentration. Following laser scoring, thermal stress is redistributed and no longer concentrated exclusively at the crack tip. Increasing inclination further promotes a more uniform stress distribution, with smoother stress relief—especially in high-inclination cracks. This demonstrates that scoring improves stress uniformity and mitigates localized stress buildup.
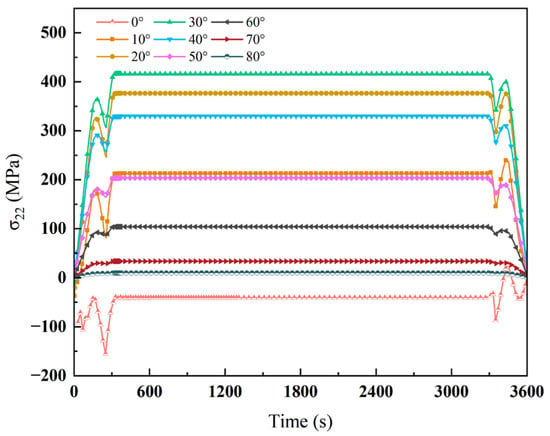
Figure 22.
Effect of laser scoring on stresses in cracks with different inclination angles.
Overall, laser scoring is more effective in adjusting stress fields for low- to medium-inclination cracks, whereas its ability to suppress crack propagation diminishes at high-inclination angles. Crack inclination thus becomes a critical factor governing stress concentration and crack growth tendency.
4. Conclusions
This study conducted a systematic investigation of the thermal stress field and cracking behavior in TBCs. By integrating numerical simulation, CT-based experimental analysis, and a multi-physics coupling approach, a thermo-mechanical model incorporating coating microstructure was developed and used to quantitatively analyze stress distribution under varying crack geometries. The main conclusions are summarized as follows:
- (1)
- Crack length, depth, and inclination angle significantly influence crack-tip stress. Under thermo-mechanical loading, thermal expansion inhomogeneity leads to strong stress concentration at the crack tip. Specifically, as the crack length increases from 400 to 1000 μm, the maximum tensile stress rises from 104.02 to 238.51 MPa. In contrast, increasing crack depth results in reduced crack-tip stress, indicating a negative correlation.
- (2)
- When crack depth increases from 50 to 200 μm, the maximum crack-tip stress decreases from 205.89 to 101.65 MPa. Shallow cracks are less constrained by surrounding material, resulting in higher local stress concentration, whereas deeper cracks are more constrained, promoting a more uniform stress field. Crack inclination also significantly affects stress behavior. As inclination increases, the crack-tip stress decreases, and the stress direction transitions from tensile to compressive.
- (3)
- When the inclination angle reaches 40°, the stress drops sharply and changes from tensile to compressive. With further increases in inclination, the compressive stress intensifies and becomes more uniformly distributed, indicating that higher inclination angles help mitigate stress concentration and reduce the risk of crack propagation.
- (4)
- Laser scoring treatment was shown to effectively reduce crack-tip stress by shortening the effective crack length and modifying the local stress direction. At a crack length of 1000 μm, the post-scoring stress was comparable to that of a 400 μm crack, confirming the scoring’s regulatory effect. Additionally, scoring reversed the stress direction from tensile to compressive, suppressing crack extension.
These results provide a theoretical foundation for optimizing the crack-resistance design of TBCs. They highlight the importance of simultaneously controlling crack geometry—length, depth, and inclination—and applying localized scoring strategies to redistribute stress and extend coating service life under high-temperature cyclic loading.
Author Contributions
Conceptualization, L.Z. and R.D.; methodology, L.Z.; software, L.Z.; validation, R.D. and N.L.; formal analysis, L.Z.; writing—original draft preparation, L.Z.; writing—review and editing, J.S.; visualization, X.L.; supervision, Z.W. All authors have read and agreed to the published version of the manuscript.
Funding
This research received no external funding.
Institutional Review Board Statement
Not applicable.
Informed Consent Statement
Not applicable.
Data Availability Statement
Data are contained within the article.
Conflicts of Interest
Ningning Liu, Jian Sun I hereby disclose my conflict of interest as outlined by the MDPl guidelines. l am currently employed by China United Gas Turbine Technology Co., Ltd. while contributing to this manuscript. My contributions to this work and manuscript were made independently without any requirement, guidance or input by my employer, l received no financial compensation from any source for the contributions l made to this scientific work and manuscript.
References
- Song, X.; Xie, M.; Qu, X.; Song, X.; Zhang, Y.; Mu, R. Study of Gd2O3-Doped La2(Zr0.7Ce0.3)2O7 Thermal Barriers for Coating Ceramic Materials for CMAS Resistance. Coatings 2025, 15, 483. [Google Scholar] [CrossRef]
- Shi, L.; Sun, Z.; Lu, Y. The Combined Influences of Film Cooling and Thermal Barrier Coatings on the Cooling Performances of a Film and Internal Cooled Vane. Coatings 2020, 10, 861. [Google Scholar] [CrossRef]
- Bhattacharyya, A.; Maurice, D. Residual Stresses in Functionally Graded Thermal Barrier Coatings. Mech. Mater 2019, 129, 50–56. [Google Scholar] [CrossRef]
- Liu, Q.; Huang, S.; He, A. Composite Ceramics Thermal Barrier Coatings of Yttria Stabilized Zirconia for Aero-Engines. J. Mater. Sci. Technol 2019, 35, 2814–2823. [Google Scholar] [CrossRef]
- Liu, B.; Liu, Y.; Zhu, C.; Xiang, H.; Chen, H.; Sun, L.; Gao, Y.; Zhou, Y. Advances on Strategies for Searching for Next Generation Thermal Barrier Coating Materials. J. Mater. Sci. Technol. 2019, 35, 833–851. [Google Scholar] [CrossRef]
- Song, J.; Wang, L.; Yao, J.; Dong, H. Multi-Scale Structural Design and Advanced Materials for Thermal Barrier Coatings with High Thermal Insulation : A Review. Coatings 2023, 13, 343. [Google Scholar] [CrossRef]
- Wang, L.; Lia, D.C.; Yang, J.S.; Shao, F.; Zhong, X.H.; Zhao, H.Y.; Yang, K.; Tao, S.Y.; Wang, Y. Modeling of Thermal Properties and Failure of Thermal Barrier Coatings with the Use of Finite Element Methods: A review. J. Eur. Ceram. Soc. 2016, 36, 1313–1331. [Google Scholar] [CrossRef]
- Lo, K.; Kuo, J.; Huang, P.; Hsiao, C. Using Preexisting Surface Cracks to Prevent Thermal Fatigue Failure and Crack Delamination in FGM Thermal Barrier Coatings. Coatings 2025, 15, 362. [Google Scholar] [CrossRef]
- Jiang, J.; Wang, W.; Zhao, X.; Liu, Y.; Cao, Z.; Xiao, P. Numerical Analyses of The Residual Stress and Top Coat Cracking Behavior in Thermal Barrier Coatings under Cyclic Thermal Loading. Eng. Fract. Mech. 2018, 196, 191–205. [Google Scholar] [CrossRef]
- Liu, K.; Du, Y.; Guo, X.; Ma, J.; He, W.; Cao, Y.; Du, J. Study of Stress-Driven Cracking Behavior and Competitive Crack Growth in Functionally Graded Thermal Barrier Coatings. Surf. Coat. Technol. 2023, 473, 129969. [Google Scholar] [CrossRef]
- Xiao, Q.; Yang, L.; Zhu, W.; Zhou, C.; Pi, P.; Wei, G. Delamination Mechanism of Thermal Barrier Coatings Induced by Thermal Cycling and Growth Stresses. Eng. Fail. Anal. 2021, 121, 105202. [Google Scholar] [CrossRef]
- Li, Y.; Gao, H.; Wang, L.; Sun, Y.; Zhang, J. Discrete Element Modeling of Effect of Interfacial Roughness and Pre-Crack on Crack Propagation in Thermal Barrier Coatings. Comput. Part Mech. 2025, 12, 31–39. [Google Scholar] [CrossRef]
- Tao, S.; Yang, J.; Shao, F.; Zhao, H.; Zhong, X.; Zhuang, Y.; Sheng, J.; Ni, J.; Li, Q.; Tao, S. Atmospheric Plasma Sprayed Thick Thermal Barrier Coatings : Microstructure, Thermal Shock Behaviors and Failure Mechanism. Eng. Fail. Anal. 2022, 131, 105819. [Google Scholar] [CrossRef]
- Kyaw, S.; Jones, A.; Hyde, T. Predicting Failure within Tbc System : Finite Element Simulation of Stress within Tbc System as Affected by Sintering of Aps Tbc, Geometry of Substrate and Creep of Tgo. Eng. Fail. Anal. 2013, 27, 150–164. [Google Scholar] [CrossRef]
- Wu, J.; Mao, G.; Zhou, C.; Lu, C. Digital Image Correlation Approach to Cracking and Decohesion in a Brittle Coating / Ductile Substrate System. Appl. Surf. Sci. 2011, 257, 6040–6043. [Google Scholar] [CrossRef]
- Izadinia, M.; Soltani, R.; Sohi, M.H. Effect of Segmented Cracks on Tgo Growth and Life of Thick Thermal Barrier Coating under Isothermal Oxidation Conditions. Ceram. Int. 2020, 46, 7475–7481. [Google Scholar] [CrossRef]
- Bostancı, S.M.; Gürses, E.; Çöker, D. Finite Element Modelling of TBC Failure Mechanisms by Using XFEM and CZM. Procedia Struct. Integr. 2019, 21, 91–100. [Google Scholar] [CrossRef]
- Thamburaja, P.; Sarah, K.; Srinivasa, A.; Reddy, J. Fracture of Viscoelastic Materials: Fem Implementation of a Non-Local & Rate Form-Based Finite-Deformation Constitutive Theory. Comput. Methods Appl. Mech. Eng. 2019, 354, 871–903. [Google Scholar] [CrossRef]
- Sarah, K.; Thamburaja, P.; Srinivasa, A.; Reddy, J.N. Numerical Simulations of Damage and Fracture in Viscoelastic Solids Using a Nonlocal Fracture Criterion. Mech. Adv. Mater. Struct. 2020, 27, 1085–1097. [Google Scholar] [CrossRef]
- Wang, L.; Li, Z.; Ding, K.; Deng, C.; Zhang, S.; Zheng, R.; Yang, L.; Lin, X. Effects of Tgo Growth on the Stress Distribution and Evolution of Three-Dimensional Cylindrical Thermal Barrier Coatings Based on Finite Element Simulations. Ceram. Int. 2022, 48, 7864–7875. [Google Scholar] [CrossRef]
- Huang, Y.; Wei, Z.; Cai, H.; Liu, Y.; Han, X. The Effects of Tgo Growth Stress and Creep Rate on Tc/Tgo Interface Cracking in Aps Thermal Barrier Coatings. Ceram. Int. 2021, 47, 24760–24769. [Google Scholar] [CrossRef]
- Abdelgawad, A.; Al-Athel, K. Effect of Tgo Thickness, Pores, and Creep on the Developed Residual Stresses in Thermal Barrier Coatings under Cyclic Loading Using Sem Image-Based Finite Element Model. Ceram. Int. 2021, 47, 20064–20076. [Google Scholar] [CrossRef]
- Torkashvand, K.; Poursaeidi, E.; Mohammadi, M. Effect of Tgo Thickness on the Thermal Barrier Coatings Life under Thermal Shock and Thermal Cycle Loading. Ceram. Int. 2018, 44, 9283–9293. [Google Scholar] [CrossRef]
- Wei, Z.-Y.; Cai, H.-N. Comprehensive Effects of Tgo Growth on the Stress Characteristic and Delamination Mechanism in Lamellar Structured Thermal Barrier Coatings. Ceram. Int. 2020, 46, 2220–2237. [Google Scholar] [CrossRef]
- Wei, Z.-Y.; Cai, H.-N.; Li, C.-J. Comprehensive Dynamic Failure Mechanism of Thermal Barrier Coatings Based on a Novel Crack Propagation and Tgo Growth Coupling Model. Ceram. Int. 2018, 44, 22556–22566. [Google Scholar] [CrossRef]
- Fan, X.; Xu, R.; Zhang, W.; Wang, T. Effect of Periodic Surface Cracks on the Interfacial Fracture of Thermal Barrier Coating System. Appl. Surf. Sci. 2012, 258, 9816–9823. [Google Scholar] [CrossRef]
- Lee, D.H.; Lee, K.S.; Kim, T.W.; Kim, C. Hertzian Stress Analysis and Characterization of Thermal Barrier Coatings Containing Unidirectional Vertical Cracks. Ceram. Int. 2019, 45, 21348–21358. [Google Scholar] [CrossRef]
- Wei, Z.-Y.; Cai, H.-N.; Feng, R.-X.; Su, J.-Y. Dynamic Crack Growth Mechanism and Lifetime Assessment in Plasma Sprayed Thermal Barrier System upon Temperature Cycling. Ceram. Int. 2019, 45, 14896–14907. [Google Scholar] [CrossRef]
- Pan, D.; Chen, M.W.; Wright, P.K.; Hemker, K.J. Evolution of a Diffusion Aluminide Bond Coat for Thermal Barrier Coatings During Thermal Cycling. Acta Mater. 2003, 51, 2205–2217. [Google Scholar] [CrossRef]
- Wang, X.; Cui, Y.; Zhou, Y.; Zhao, Y.; Wang, J. Microstructure and Cracking Behavior of a Four-Layer Thermal Barrier Coating after Thermal Cycle Test. Coatings 2025, 15, 307. [Google Scholar] [CrossRef]
- Sfar, K.; Aktaa, J.; Munz, D. Numerical Investigation of Residual Stress Fields and Crack Behavior in Tbc Systems. Mater. Sci. Eng. 2002, 333, 351–360. [Google Scholar] [CrossRef]
- Aktaa, J.; Sfar, K.; Munz, D. Assessment of Tbc Systems Failure Mechanisms Using a Fracture Mechanics Approach. Acta Mater. 2005, 53, 4399–4413. [Google Scholar] [CrossRef]
- Widjaja, S.; Limarga, A.M.; Yip, T.H. Modeling of Residual Stresses in a Plasma-Sprayed Zirconia/Alumina Functionally Graded-Thermal Barrier Coating. Thin Solid Films 2003, 434, 216–227. [Google Scholar] [CrossRef]
- Zhu, W.; Cai, M.; Yang, L.; Guo, J.; Zhou, Y.; Lu, C. The Effect of Morphology of Thermally Grown Oxide on the Stress Field in a Turbine Blade with Thermal Barrier Coatings. Surf. Coat. Technol. 2015, 276, 160–167. [Google Scholar] [CrossRef]
- de Freitas, F.E.; Silva, R.A.L.D.; Takahashi, R.J.; Reis, A.G.D.; Capella, A.G.; Reis, D.A.P. Influence of Laser Remelting on Creep Resistance in Ti-6Al-4V Alloy with Thermal Barrier Coating. Coatings 2025, 15, 220. [Google Scholar] [CrossRef]
- Zhang, W.; Chen, J.; Lin, M.; Zhang, L.; Hu, Y.; Tang, S.; Lu, H.; Feng, J.; Li, R. The Influence of Laser Process Parameters on the Iron Loss of Grain-Oriented Silicon Steel. J. Mater. Res. Technol. 2024, 33, 2958–2969. [Google Scholar] [CrossRef]
Disclaimer/Publisher’s Note: The statements, opinions and data contained in all publications are solely those of the individual author(s) and contributor(s) and not of MDPI and/or the editor(s). MDPI and/or the editor(s) disclaim responsibility for any injury to people or property resulting from any ideas, methods, instructions or products referred to in the content. |
© 2025 by the authors. Licensee MDPI, Basel, Switzerland. This article is an open access article distributed under the terms and conditions of the Creative Commons Attribution (CC BY) license (https://creativecommons.org/licenses/by/4.0/).