Article

Fabrication of CF–NiO Electrodes and Performance Evaluation of Microbial Fuel Cells in the Treatment of Potato Starch Wastewater

1
School of Food Engineering, Harbin University of Commerce, Harbin 150028, China
2
Hunan Construction Investment Water Conservancy and Hydropower Co., Ltd., Changsha 410000, China
3
Ecological Environment Monitoring Station of Lincang Ecological Environment Bureau, Lincang 677000, China
4
School of Light Industry, Harbin University of Commerce, Harbin 150028, China
*
Authors to whom correspondence should be addressed.
These authors contributed equally to this work.
Coatings 2025, 15(7), 760; https://doi.org/10.3390/coatings15070760 (registering DOI)
Submission received: 2 June 2025 / Revised: 25 June 2025 / Accepted: 25 June 2025 / Published: 27 June 2025
(This article belongs to the Section Environmental Aspects in Colloid and Interface Science)

Abstract

Microbial fuel cells (MFCs) generate electricity through the microbial oxidation of organic waste. However, the inherent electrochemical performance of carbon felt (CF) electrodes is relatively poor and requires enhancement. In this study, nickel oxide (NiO) was successfully loaded onto CF to improve its electrode performance, thereby enhancing the electricity generation capacity of MFCs during the degradation of treated wastewater. Scanning electron microscopy (SEM), X-ray diffraction (XRD), and energy diffusion spectrometer (EDS) analyses confirmed the successful deposition of NiO on the CF surface. The modification enhanced both the conductivity and capacitance of the electrode and increased the number of microbial attachment sites on the carbon fiber filaments. The prepared CF–NiO electrode was employed as the anode in an MFC, and its electrochemical and energy storage performance were evaluated. The maximum power density of the MFC with the CF–NiO anode reached 0.22 W/m2, compared to 0.08 W/m2 for the unmodified CF anode. Under the C1000-D1000 condition, the charge storage capacity and total charge output of the CF–NiO anode were 1290.03 C/m2 and 14,150.03 C/m2, respectively, which are significantly higher than the 452.9 C/m2 and 6742.67 C/m2 observed for the CF anode. These results indicate notable improvements in both power generation and energy storage performance. High-throughput gene sequencing of the anodic biofilm following MFC acclimation revealed that the CF–NiO anode surface hosted a higher proportion of electroactive bacteria. This suggests that the NiO modification enhances the biodegradation of organic matter and improves electricity generation efficiency.

1. Introduction

Potato (Solanum tuberosum) is an annual crop of the Solanaceae family and the Solanum genus, with over 400 years of cultivation history in China [1,2]. It is rich in nutrients, containing approximately 15%–20% starch and 2%–3% protein, along with abundant vitamin C and potassium [3,4,5]. Research on potatoes in China began in the early 20th century. Due to its diverse textures and excellent processing adaptability, the potato has been developed into various food products [6,7,8]. One such product is vermicelli made from potatoes (potato starch noodles), known for their smooth and chewy texture. These are typically produced via sedimentation separation. However, for every ton of starch produced, vermicelli factories discharge 8–12 t of wastewater, resulting in a substantial volume of effluent [9,10,11]. This potato-processing wastewater contains approximately 0.8% protein and large amounts of soluble sugars. While starch is the primary component utilized during vermicelli production, a significant portion of protein and sugars is wasted [12,13]. At present, studies on the resource utilization of potato starch wastewater remain limited, making the recovery of valuable resources from such effluents a topic of considerable practical importance [14].
Microbial fuel cells (MFCs) are a novel type of bioelectrochemical system that utilizes electroactive microorganisms to catalyze the oxidation of organic matter while simultaneously recovering electrical energy [15,16,17]. The working principle of MFCs involves the degradation of organic pollutants—such as starch and proteins—by electroactive microbial communities in the anode chamber, which results in the release of electrons and protons. The electrons are transferred through an external circuit to the cathode, where they combine with protons and an electron acceptor (e.g., oxygen) to form water, thereby enabling energy recovery [18,19,20]. MFC technology demonstrates unique advantages in the treatment of wastewater from the food industry, as it can directly convert the chemical energy contained in wastewater into electricity, with energy recovery efficiencies ranging from 40% to 60% [21,22].
However, the large-scale application of microbial fuel cell (MFC) technology still faces significant challenges. Firstly, the high cost of electrode materials remains a major barrier, with platinum–carbon cathodes and carbon felt anodes still being prohibitively expensive [23,24]. In addition, the power density of MFCs is generally low (typically < 1 W/m2), which limits their potential for industrial-scale applications [25,26]. Research on metal oxide-modified materials for improving MFC anodes has identified two major synergistic mechanisms: (1) reducing ohmic polarization caused by biofilm adhesion through electrode surface optimization and (2) enhancing and facilitating long-range extracellular electron transfer (EET) [27,28,29]. Nickel oxide (NiO)-loaded carbon felt electrodes fall under the second category. These electrodes have demonstrated notable advantages in MFC systems: the modification with NiO nanoparticles significantly enhances electron transfer rates and promotes increased microbial attachment [30,31,32]. Using potato starch wastewater as an example, the NiO/carbon felt anode leads to a substantial improvement in MFC performance compared to unmodified carbon felt anodes. The maximum power density is notably increased, and both energy storage and electricity generation are enhanced by approximately 2.3 times [33,34].
In this study, a novel electrochemical device—a microbial fuel cell (MFC)—was employed for the degradation of wastewater and simultaneous electricity generation. By modifying the anode, the power generation performance of the MFC was significantly enhanced, thereby achieving effective energy recovery [35,36,37,38,39,40]. By loading NiO onto carbon felt (CF) to fabricate a CF–NiO electrode, its electrical conductivity and biocompatibility are enhanced. This electrode is then used as the anode in a MFC system to improve electricity generation and resource recovery from potato starch wastewater. The experimental approach is environmentally friendly and sustainable. Although it may not lead to immediate economic savings, it demonstrates a notable improvement in energy yield and efficiency. Furthermore, this study provides a theoretical foundation for future resource recovery technologies and holds considerable significance for the reuse of wastewater resources.

2. Materials and Methods

2.1. Experimental Materials

The following chemicals were used in this study: cetyltrimethylammonium bromide (CTAB, analytical grade, Tianjin Fuyu Fine Chemical Co., Ltd., Tianjin, China), urea (CH4N2O, analytical grade, Tianjin BASF Chemical Co., Ltd., Tianjin, China), nickel chloride hexahydrate (NiCl2·6H2O, analytical grade, Tianjin Fuyu Fine Chemical Co., Ltd., Tianjin, China), graphite powder (C, analytical grade, Shanghai Aladdin Biochemical Technology Co., Ltd., Shanghai, China), liquid paraffin (AR, chemically pure, Tianjin Fuyu Fine Chemical Co., Ltd., Tianjin, China), glacial acetic acid (CH3COOH, analytical grade, Tianjin Guangfu Technology Development Co., Ltd., Tianjin, China), anhydrous sodium acetate (CH3COONa, analytical grade, Tianjin Tianli Chemical Reagent Co., Ltd., Tianjin, China), potassium chloride (KCl, analytical grade, Tianjin Tianli Chemical Reagent Co., Ltd., Tianjin, China), potassium ferricyanide (K3[Fe(CN)6], analytical grade, Tianjin Xinbote Chemical Co., Ltd., Tianjin, China), and silver nitrate (AgNO3, analytical grade, Shanghai Aladdin Biochemical Technology Co., Ltd., Shanghai, China).

2.2. Preparation of the CF–NiO Electrode

The CF–NiO electrode was prepared by in situ growth of nickel oxide (NiO) on a carbon felt (CF) substrate using a chemical synthesis method. Specifically, 0.819 g of cetyltrimethylammonium bromide (CTAB) was dissolved in 60 mL of distilled water and stirred for 15 min to ensure complete mixing. Subsequently, 0.45 g of urea and 0.713 g of NiCl2·6H2O were added to the solution, followed by continuous stirring for 30 min. The resulting mixture was transferred into the inner liner of a hydrothermal autoclave, and a piece of carbon felt was immersed in it. The hydrothermal reaction was conducted at 120 °C for 6 h, followed by calcination at 350 °C for 2 h. The solution was transferred into the inner chamber of a Teflon-lined autoclave, into which a piece of carbon felt was placed. The hydrothermal reaction was conducted at 260 °C for 8 h. After thorough washing and drying, the product was placed in a crucible and calcined at a specified temperature for 2 h. The final product was the CF–NiO electrode. Electrochemical performance of the electrode was evaluated under a three-electrode system using cyclic voltammetry (CV), electrochemical impedance spectroscopy (EIS), and charge–discharge tests. These three measurements served as key indicators to investigate the effects of hydrothermal temperature, hydrothermal duration, calcination temperature, and calcination time on the electrode’s performance. Finally, an orthogonal experimental design was conducted to determine the optimal conditions for electrode fabrication.

2.3. Electrochemical Characterization of the Electrode

Cyclic voltammetry (CV), electrochemical impedance spectroscopy (EIS), and charge–discharge tests of the electrodes were conducted in a three-electrode system. The system employed 0.25 mol/L sodium sulfate (Na2SO4) solution as the electrolyte, with the prepared electrode used as the working electrode, a saturated calomel electrode (SCE) as the reference electrode, and a platinum electrode as the counter electrode. Electrochemical measurements were conducted repeatedly using a Gamry Instruments Reference 600 electrochemical workstation (Gamry Instruments, Warminster, PA, USA), and the data were recorded accordingly.

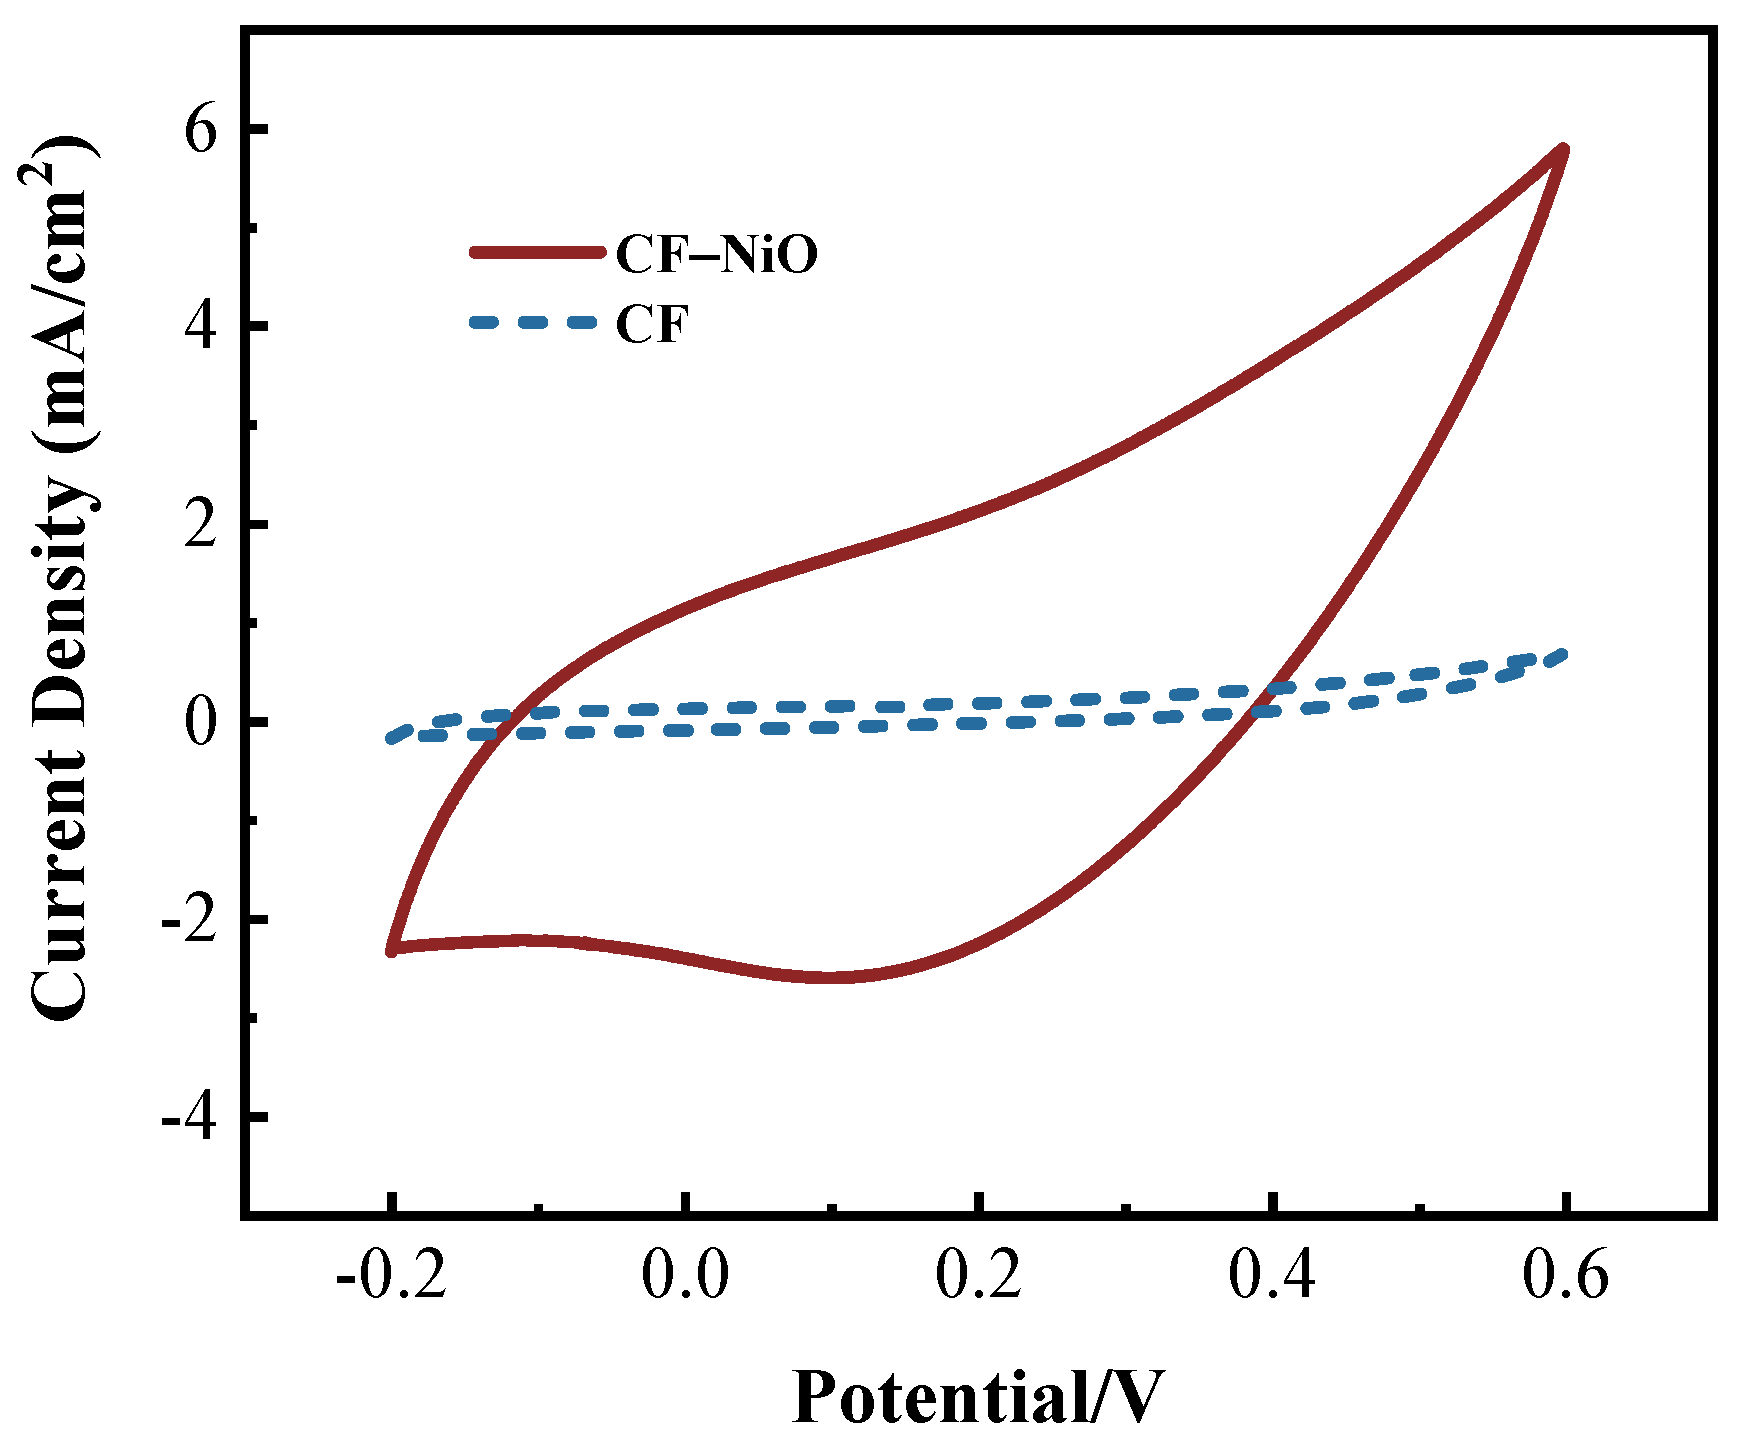
2.3.1. Cyclic Voltammetry (CV) Test

Cyclic voltammetry (CV) is a commonly used electrochemical technique for elucidating the electrochemical behavior of a system. It is typically employed to investigate electron transfer processes, interfacial interactions between the electrode surface and electrolyte, and the reversibility of redox reactions. The area enclosed by the CV curve reflects the amount of charge transferred during the potential sweep; a larger curve area indicates greater charge transfer and suggests a higher density of electrochemically active sites on the electrode surface. Enhanced charge transfer capability is indicative of improved electrical conductivity. In this study, the CV tests were conducted at a scan rate of 20 mV/s.

2.3.2. Electrochemical Impedance Spectroscopy (EIS) Test

Electrochemical impedance spectroscopy (EIS) involves applying a small-amplitude sinusoidal voltage signal to the working electrode over a predefined frequency range to perturb the system. By measuring the system’s impedance response and analyzing the relationship between the response and the perturbation signal, important information such as electrode impedance and other electrochemical parameters can be obtained. In this study, EIS measurements were conducted under open-circuit potential (OCP) conditions, with a perturbation amplitude of 5 mV and a frequency range from 105 Hz to 0.1 Hz.

2.3.3. Chronopotentiometry (CP) Test

Chronopotentiometry (CP) is an electrochemical technique in which a constant current is applied to the system while the corresponding charge/discharge voltage is recorded over time, generating a voltage–time curve. Analysis of the charge/discharge time provides insights into the specific capacitance, stability, and efficiency of the electrode during electrochemical cycling. The specific capacitance of the electrode is calculated using the following equation (Equation (1)). In this study, the constant current was set at 5 mA, and the cut-off potential was 0.6 V.
C s = 2 I V d t A ( V f V i )
In the equation:
  • Cs is the areal specific capacitance (F/cm2);
  • I is the constant current (A);
  • ∫Vdt is the integrated area under the voltage–time curve (V·s);
  • A is the surface area of the electrode (cm2);
  • Vf is the final potential (V);
  • Vi is the initial potential (V).

2.4. Characterization of CF–NiO Electrode

This study utilized an Hitachi SU 5000 scanning electron microscope (SEM) (Hitachi High-Tech, Tokyo, Japan) to observe and analyze the morphological characteristics of the samples, with testing parameters set at EHT = 20 kV. The crystal structure of the experimental materials was analyzed using X-ray diffraction (XRD). The testing conditions were set with a scanning angle range of 5° to 90° and a scanning speed of 5°/min. The instrument bombards the sample surface with high-energy electron beams, which excite the inner electrons of the atoms in the sample to higher energy levels. The characteristic X-rays emitted during the transition from the higher energy states to lower energy states are then identified and analyzed to determine the types and concentrations of elements present on the sample’s surface. This test was conducted in conjunction with SEM, and the instrument used for energy dispersive X-ray spectroscopy (EDS) was a Thermo Fisher Scientific UltraDry EDS system (Thermo Fisher Scientific, Waltham, MA, USA).

2.5. Construction and Performance Evaluation of the MFC

2.5.1. Start-Up of the Microbial Fuel Cell

In this experiment, a dual-chamber MFC is used, consisting of glass jars with equal volumes for the anode and cathode chambers, separated by a proton exchange membrane. The MFC system was operated at room temperature (25 ± 2 °C). The inoculum was anaerobic sludge obtained from a municipal wastewater treatment plant, which was pretreated in the laboratory for a certain period before use. It was added to the anolyte at a volumetric ratio of 20% (v/v). The electrodes prepared for the experiment are used as the MFC anode. The anode solution consists of anaerobic mixed microbial liquid and wastewater from recycled protein-enriched rice noodle wastewater (The pH of the anolyte was initially adjusted to 7.0 using 1 mol/L HCl or NaOH and was monitored during the operation. No additional control was applied after the initial adjustment). The anode chamber was sealed with “epoxy resin” material at the bottle neck contact area, and the titanium wire was connected to the electrode and immersed in the anode solution, with the electrode positioned parallel to the proton exchange membrane. The cathode chamber contained a potassium ferrocyanide solution at 10 g/L as the catholyte, with a carbon rod serving as the MFC cathode. Similarly, titanium wire was used to connect the electrode and immerse it in the cathode solution. An external load of 8000 Ω resistance was applied to acclimate the microorganisms, and the anode potential was recorded from its fluctuations until it stabilized, indicating successful acclimatization.

2.5.2. MFC Performance Testing

The prepared CF–NiO anode was placed in the MFC system described above, and the principle of microbial decomposition of organic matter in the wastewater to generate electricity was applied to investigate the power generation performance of the modified anode in the MFC. The MFC polarization curve, which describes the relationship between voltage and current density, was used to study the MFC performance. The measurements were conducted when the system reached a stable operation under optimal conditions. An external variable resistor box (0–9999.9 Ω) was connected to the MFC, and the external resistance was varied to repeatedly measure the MFC voltage. The resulting data were used to construct the MFC polarization curve. The calculation formula is shown in Equation (2). The power density curve, which describes the relationship between output power and current density, reflects the power generation capacity of the MFC. The battery voltage test is performed similarly to the polarization curve, and the power density curve is calculated. The calculation formula is shown in Equation (3).
J = U × 10 7 R × A
In the formula:
  • J is the current density (A/m2);
  • U is the battery potential (mV);
  • R is the external resistance value (Ω);
  • A is the electrode surface area (cm2).
P = U 2 × 10 10 R × A
In the formula:
  • P is the power density (W/m2)
  • U is the battery potential (mV);
  • R is the external resistance value (Ω);
  • A is the electrode surface area (cm2).
The anode polarization curve is used to study the MFC anode performance by describing the relationship between the anode potential and current density. In this experiment, measurements were also taken when the system was operating stably under optimal conditions. An external 0–9999.9 Ω variable resistor was connected to the MFC, and by adjusting the external resistance value, the MFC anode potential was measured using a saturated calomel electrode, which was then used to generate the anode polarization curve. The calculation formula is the same as that in Equation (2). The electrochemical tests were performed using a Gamry Instruments Reference 600 electrochemical workstation. In this setup, the MFC anode serves as the working electrode, the cathode is the auxiliary electrode, and the saturated calomel electrode acts as the reference electrode for the cyclic voltammetry tests. These tests investigate the MFC anode’s bioelectrochemical activity, electron transfer performance, and charge–discharge behavior. The chronoamperometric test involves applying a constant potential to the MFC and recording the current between the two terminals of the MFC. This measures the relationship between the discharge current density of the MFC anode relative to the saturated calomel electrode and time under the constant potential.

2.6. High-Throughput Sequencing of the MFC Microbial Community

Anodic microorganisms play a critical role in the performance of MFCs. In this study, high-throughput sequencing was conducted to analyze the microbial community structure on the MFC anode, using standardized protocols provided by Sangon Biotech (Shanghai, China). Genomic DNA (gDNA) was extracted using a commercial extraction kit. The integrity of the DNA was verified by agarose gel electrophoresis, and the concentration of the DNA samples was determined using a Qubit fluorometer (Thermo Fisher Scientific, Waltham, MA, USA). Target sequences were enriched using highly specific primers, targeting the V3–V4 region of the 16S rRNA gene for amplification. Following PCR amplification, the products were analyzed by agarose gel electrophoresis and then purified for downstream analysis. The species abundance and relative content of different microorganisms in the samples were analyzed by test results.

3. Results and Discussion

3.1. Structural Characterization of CF–NiO Electrodes

3.1.1. SEM: Scanning Electron Microscopy Analysis

The surface loading and microstructural features of the modified CF–NiO electrodes were investigated using scanning electron microscopy (SEM), as shown in Figure 1. Figure 1a,b displays SEM images of the pristine CF electrode at magnifications of 1000× and 5000×, respectively, revealing that the carbon fiber surfaces are smooth and uniform. In contrast, Figure 1c,d shows SEM images of the modified CF–NiO electrode at the same magnifications. These images clearly demonstrate the formation of a dense NiO layer uniformly adhered to the surface of the carbon fibers. This confirms the successful in situ growth of conductive metal oxides on the CF substrate through the modification process. The uniform NiO coating significantly increases the specific surface area of the CF electrode, providing more electrochemically active sites and forming a three-dimensional framework for subsequent material loading [41]. At the same time, Zhong et al. [42] also proved this view by increasing its power density.
To further investigate the microstructure of the carbon fiber surface at higher magnifications, SEM imaging was conducted at increased magnification levels. Figure 2 shows SEM images of the CF–NiO electrode at 40,000× and 60,000× magnifications. The surface of the CF–NiO electrode predominantly exhibits nanoscale NiO in the form of sheet-like and sheet-aggregated spherical structures. The lateral size of the sheet-like structures is approximately 23 nm, indicating that the NiO deposited on the CF surface is indeed nanoscale nickel oxide.

3.1.2. XRD: X-Ray Diffraction Analysis

The phase and crystal structure of CF and CF–NiO were analyzed using X-ray diffraction (XRD), as shown in Figure 3.
The diffraction peaks of the CF–NiO electrode sample align well with the standard pattern for nickel oxide (NiO), corresponding to PDF#78-0423. As observed in the figure, characteristic diffraction peaks appear at 2θ values of 37.253°, 43.258°, 62.687°, 75.411°, and 79.405°, which correspond to the (111), (200), (220), (311), and (222) crystal planes of NiO, respectively. These results confirm that NiO has been successfully loaded onto the CF substrate in the modified electrode.

3.1.3. EDS: Energy-Dispersive X-Ray Spectroscopy Analysis

The surface elemental composition and content of the CF–NiO sample were analyzed using energy-dispersive X-ray spectroscopy (EDS), as shown in Figure 4. From the spectrum, it can be observed that the mass percentages of carbon, nickel, and oxygen on the sample surface are 18.04%, 71.83%, and 10.13%, respectively. As a carbon-based material, CF serves as the source of carbon in the sample. The presence of both nickel and oxygen further confirms that the main active component of the sample is NiO, which is consistent with the expected composition of the modified electrode.

3.2. Performance Evaluation of the CF–NiO Anode in Microbial Fuel Cells (MFCs)

The CF–NiO electrode was employed as the anode in a microbial fuel cell (MFC), with the anodic solution composed of residual wastewater remaining after protein flocculation. The organic matter in the wastewater served as a nutrient source for electroactive microorganisms, which decomposed the organics to generate electrochemical energy. Given the crucial role of anode performance in determining MFC output, the electrochemical efficiency of the MFC equipped with the modified CF–NiO electrode was systematically compared to that using an unmodified (bare) carbon felt electrode.

3.2.1. Polarization Curve

The polarization curves of the MFCs using the CF–NiO electrode or the unmodified CF electrode as anodes are shown in Figure 5.
As illustrated in the Figure 5, with increasing current density, the voltage output of the MFC with the CF–NiO anode decreases more gradually compared to that with the unmodified CF anode. This indicates that the degree of polarization in the CF–NiO-based MFC is lower, reflecting superior electrode performance due to the NiO modification. For example, in the current density range of 0.3–0.5 A/m2, the output voltage of the CF electrode decreases by 0.069 V, while that of the CF–NiO electrode decreases by only 0.034 V. The figure also clearly shows a significant difference in open-circuit voltage (OCV) between the two electrodes: the CF–NiO electrode exhibits an OCV of 0.406 V, whereas the CF electrode exhibits an OCV of 0.294 V, representing a difference of 0.112 V in favor of the modified electrode. Therefore, the polarization curves demonstrate that the modified CF–NiO electrode exhibits superior electrochemical performance compared to the unmodified CF electrode.

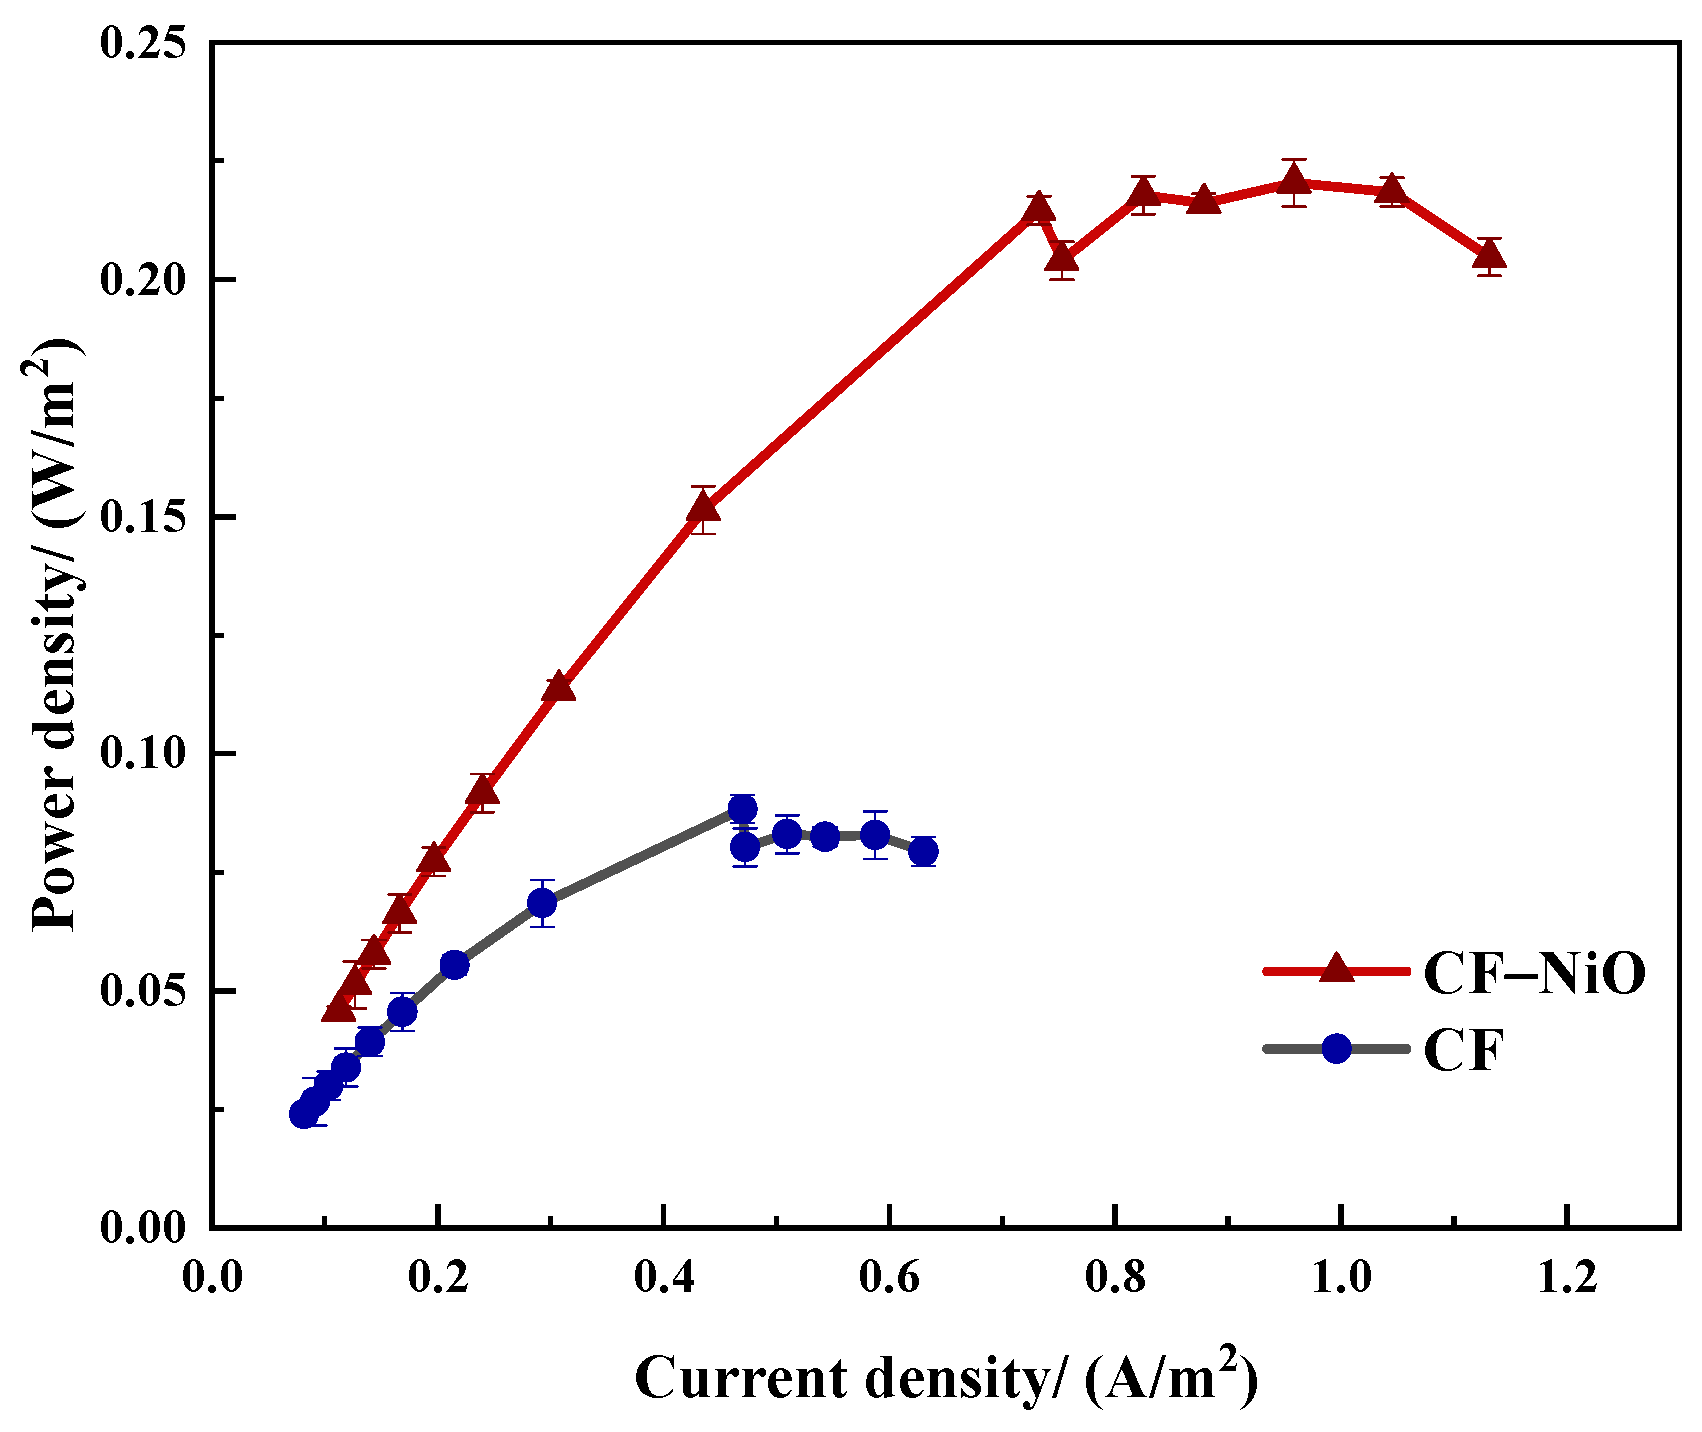
3.2.2. Power Density Curve

The power density curves of MFCs using the CF–NiO electrode or the CF electrode as anodes are presented in Figure 6.
As shown in Figure 6, the power densities of both types of electrodes exhibit the same trend as the current density increases. The maximum power density achieved by the MFC with the CF–NiO anode is 0.22 W/m2, whereas the MFC with the CF anode reaches only 0.08 W/m2. The maximum power density of the modified electrode is, therefore, 2.75 times higher than that of the unmodified CF electrode.
This significant enhancement indicates that the in situ growth of NiO on the CF surface improves the electron transfer efficiency between the anode and the electroactive microorganisms. These results confirm that the CF–NiO electrode enables superior power generation performance in MFC applications.
The CF–NiO cathode delivers significantly enhanced power density relative to the benchmark materials in Table 1, which is attributable to its balanced catalytic activity and cost efficiency. The material exhibits considerable specific surface area, exceptional hydrophilicity, and favorable biocompatibility, collectively contributing to enhanced power output in microbial fuel cells (MFCs).

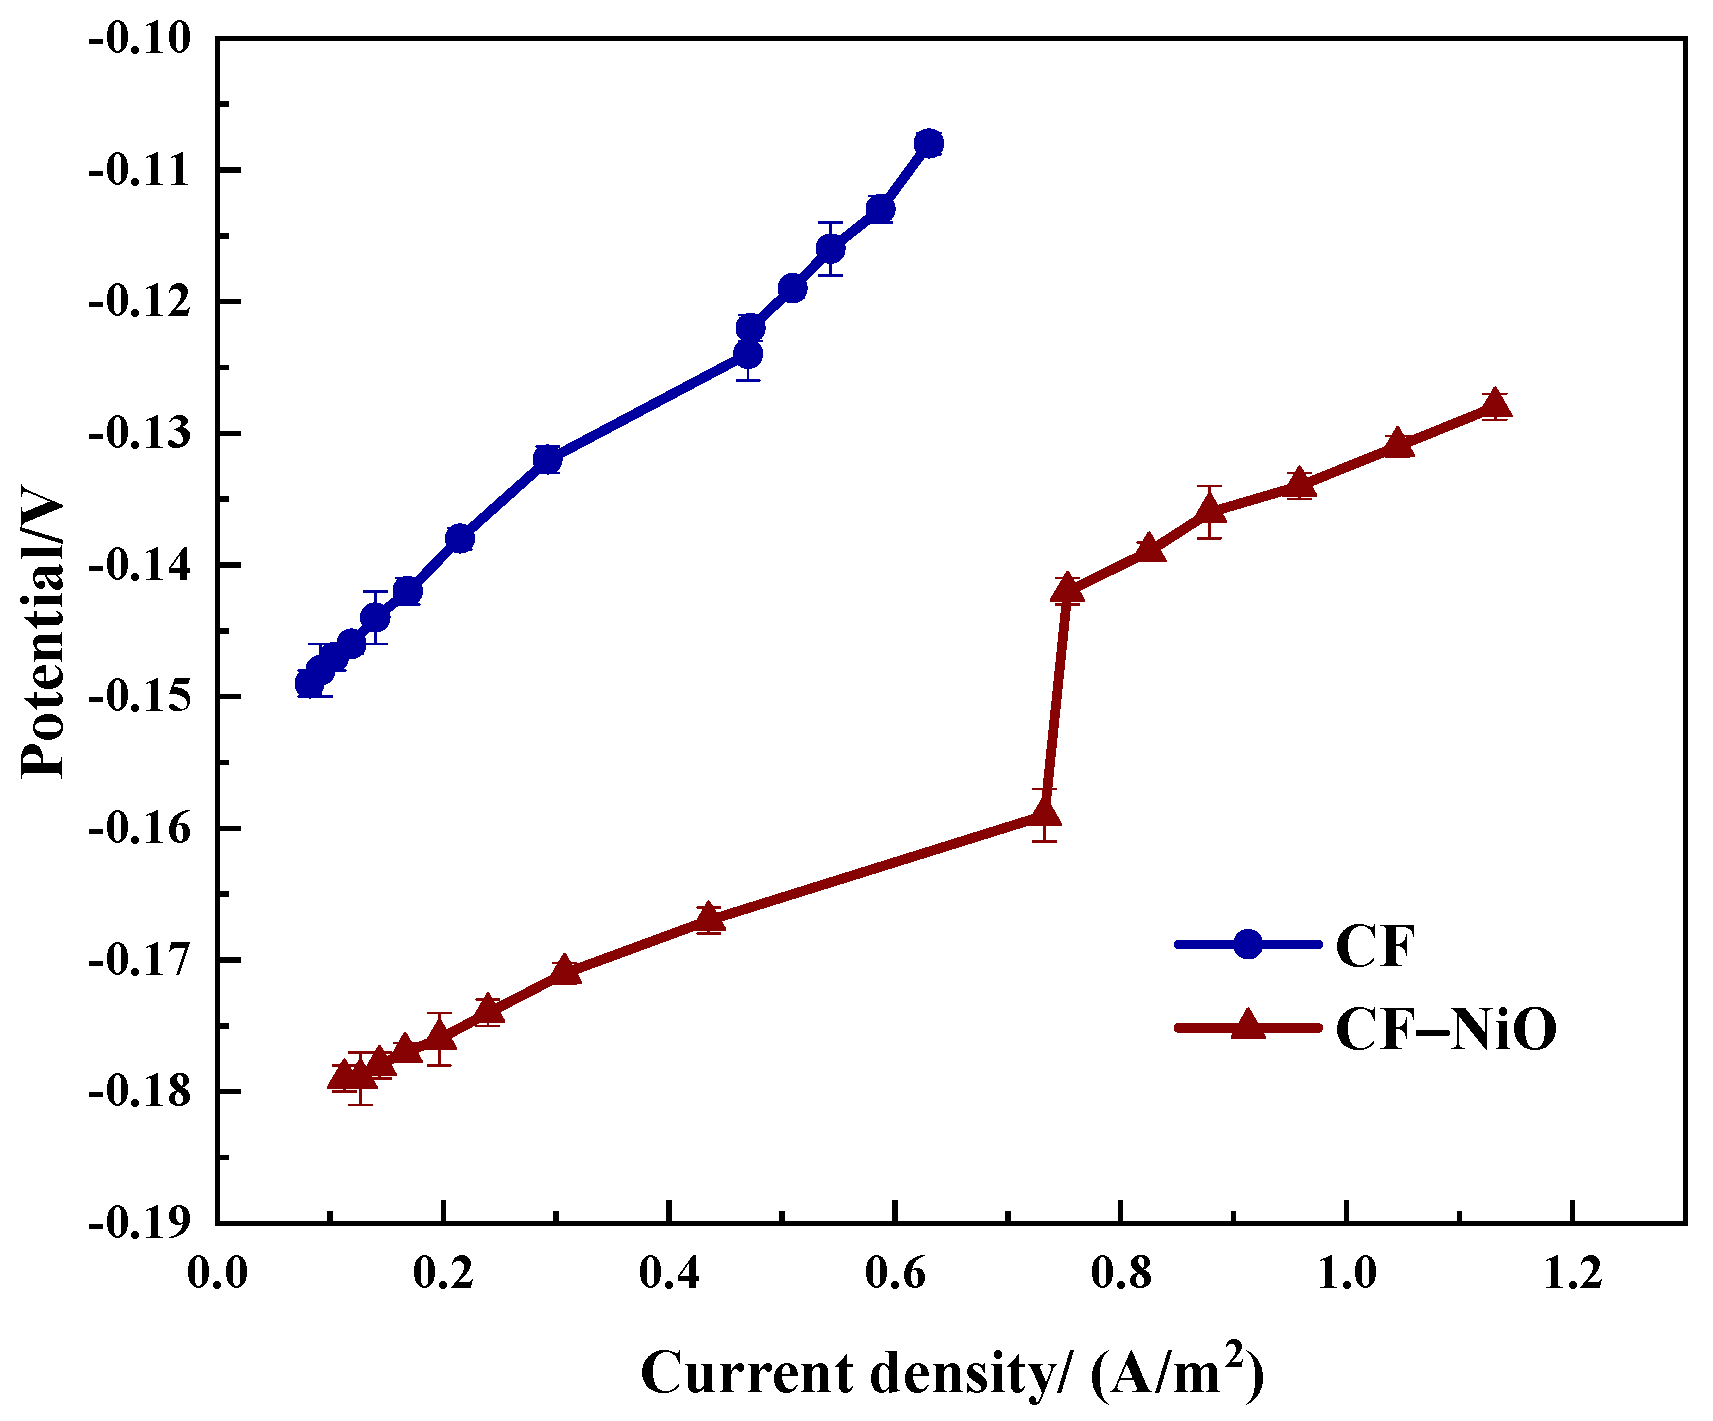
3.2.3. Anode Polarization Curve

The anodic polarization curves of the MFCs with the CF–NiO electrode and the unmodified CF electrode as anodes are shown in Figure 7.
In Figure 7, the anode polarization curve of the MFC reflects the degree of polarization at the anode and can thus be used to evaluate the electron transfer rate and bioelectrocatalytic activity. A lower degree of polarization indicates a faster electron transfer rate and better bioelectrocatalytic performance. As shown in the figure, both curves exhibit an upward trend with increasing current density. However, the CF–NiO electrode shows a more gradual increase, indicating a lower degree of polarization. For example, when the current density increases from 0.4 A/m2 to 0.6 A/m2, the CF–NiO anode potential increases by only 0.013 V, while the CF anode increases by 0.028 V, demonstrating a significant reduction in electrode polarization. This result confirms that the incorporation of NiO enhances the ability of electroactive microorganisms to transfer electrons to the anode. In addition, the introduction of metal oxides increases the specific surface area of the electrode and provides more active sites, facilitating microbial attachment to the electrode surface and ultimately improving the performance of the MFC.

3.2.4. Cyclic Voltammetry Test of the MFC

The cyclic voltammetry (CV) curves of the MFCs with the CF–NiO electrode or the unmodified CF electrode as anodes, recorded at a scan rate of 20 mV/s, are shown in Figure 8.
From the Figure 8, it is evident that the CF–NiO electrode exhibits a CV curve with a significantly larger enclosed area compared to the CF electrode after microbial acclimation within the MFC. A larger enclosed area in the CV curve indicates a greater amount of charge transfer at the electrode surface, reflecting higher electrocatalytic activity. These results confirm that the introduction of NiO through surface modification enhances microbial adhesion and provides a more favorable environment for microbial growth and electron transfer within the MFC system.

3.2.5. Electrochemical Impedance Spectroscopy (EIS) Test of the MFC

The electrochemical impedance spectroscopy (EIS) plots of the MFCs using the CF–NiO electrode or the CF electrode as anodes are shown in Figure 9. As illustrated in the figure, the EIS spectra of the MFCs after microbial acclimation consist of two distinct regions. The semicircular portion in the high-frequency region represents the charge-transfer process, where the intercept on the X-axis corresponds to the solution resistance (RΩ), and the diameter of the semicircle indicates the charge transfer resistance (Rct). The linear portion in the low-frequency region reflects the diffusion process, and the slope of this line is indicative of the ion diffusion behavior within the electrolyte.
From the figure, it can be observed that the slopes of the linear portions are similar for both electrodes, indicating minimal differences in the diffusion processes. However, there are clear differences in the semicircular regions. The fitted electrochemical impedance parameters are presented in Table 2. As shown in the table, the solution resistances (RΩ) for the CF–NiO and CF electrodes are 11.55 Ω and 14.83 Ω, respectively, while the charge transfer resistances (Rct) are 11.72 Ω and 24.8 Ω, respectively. These results indicate that after microbial acclimation in the MFC, the electrochemical impedance values of the modified CF–NiO electrode are significantly lower than those of the unmodified CF electrode. This demonstrates that the NiO modification facilitates electron transfer and effectively reduces the electrochemical resistance of the electrode.

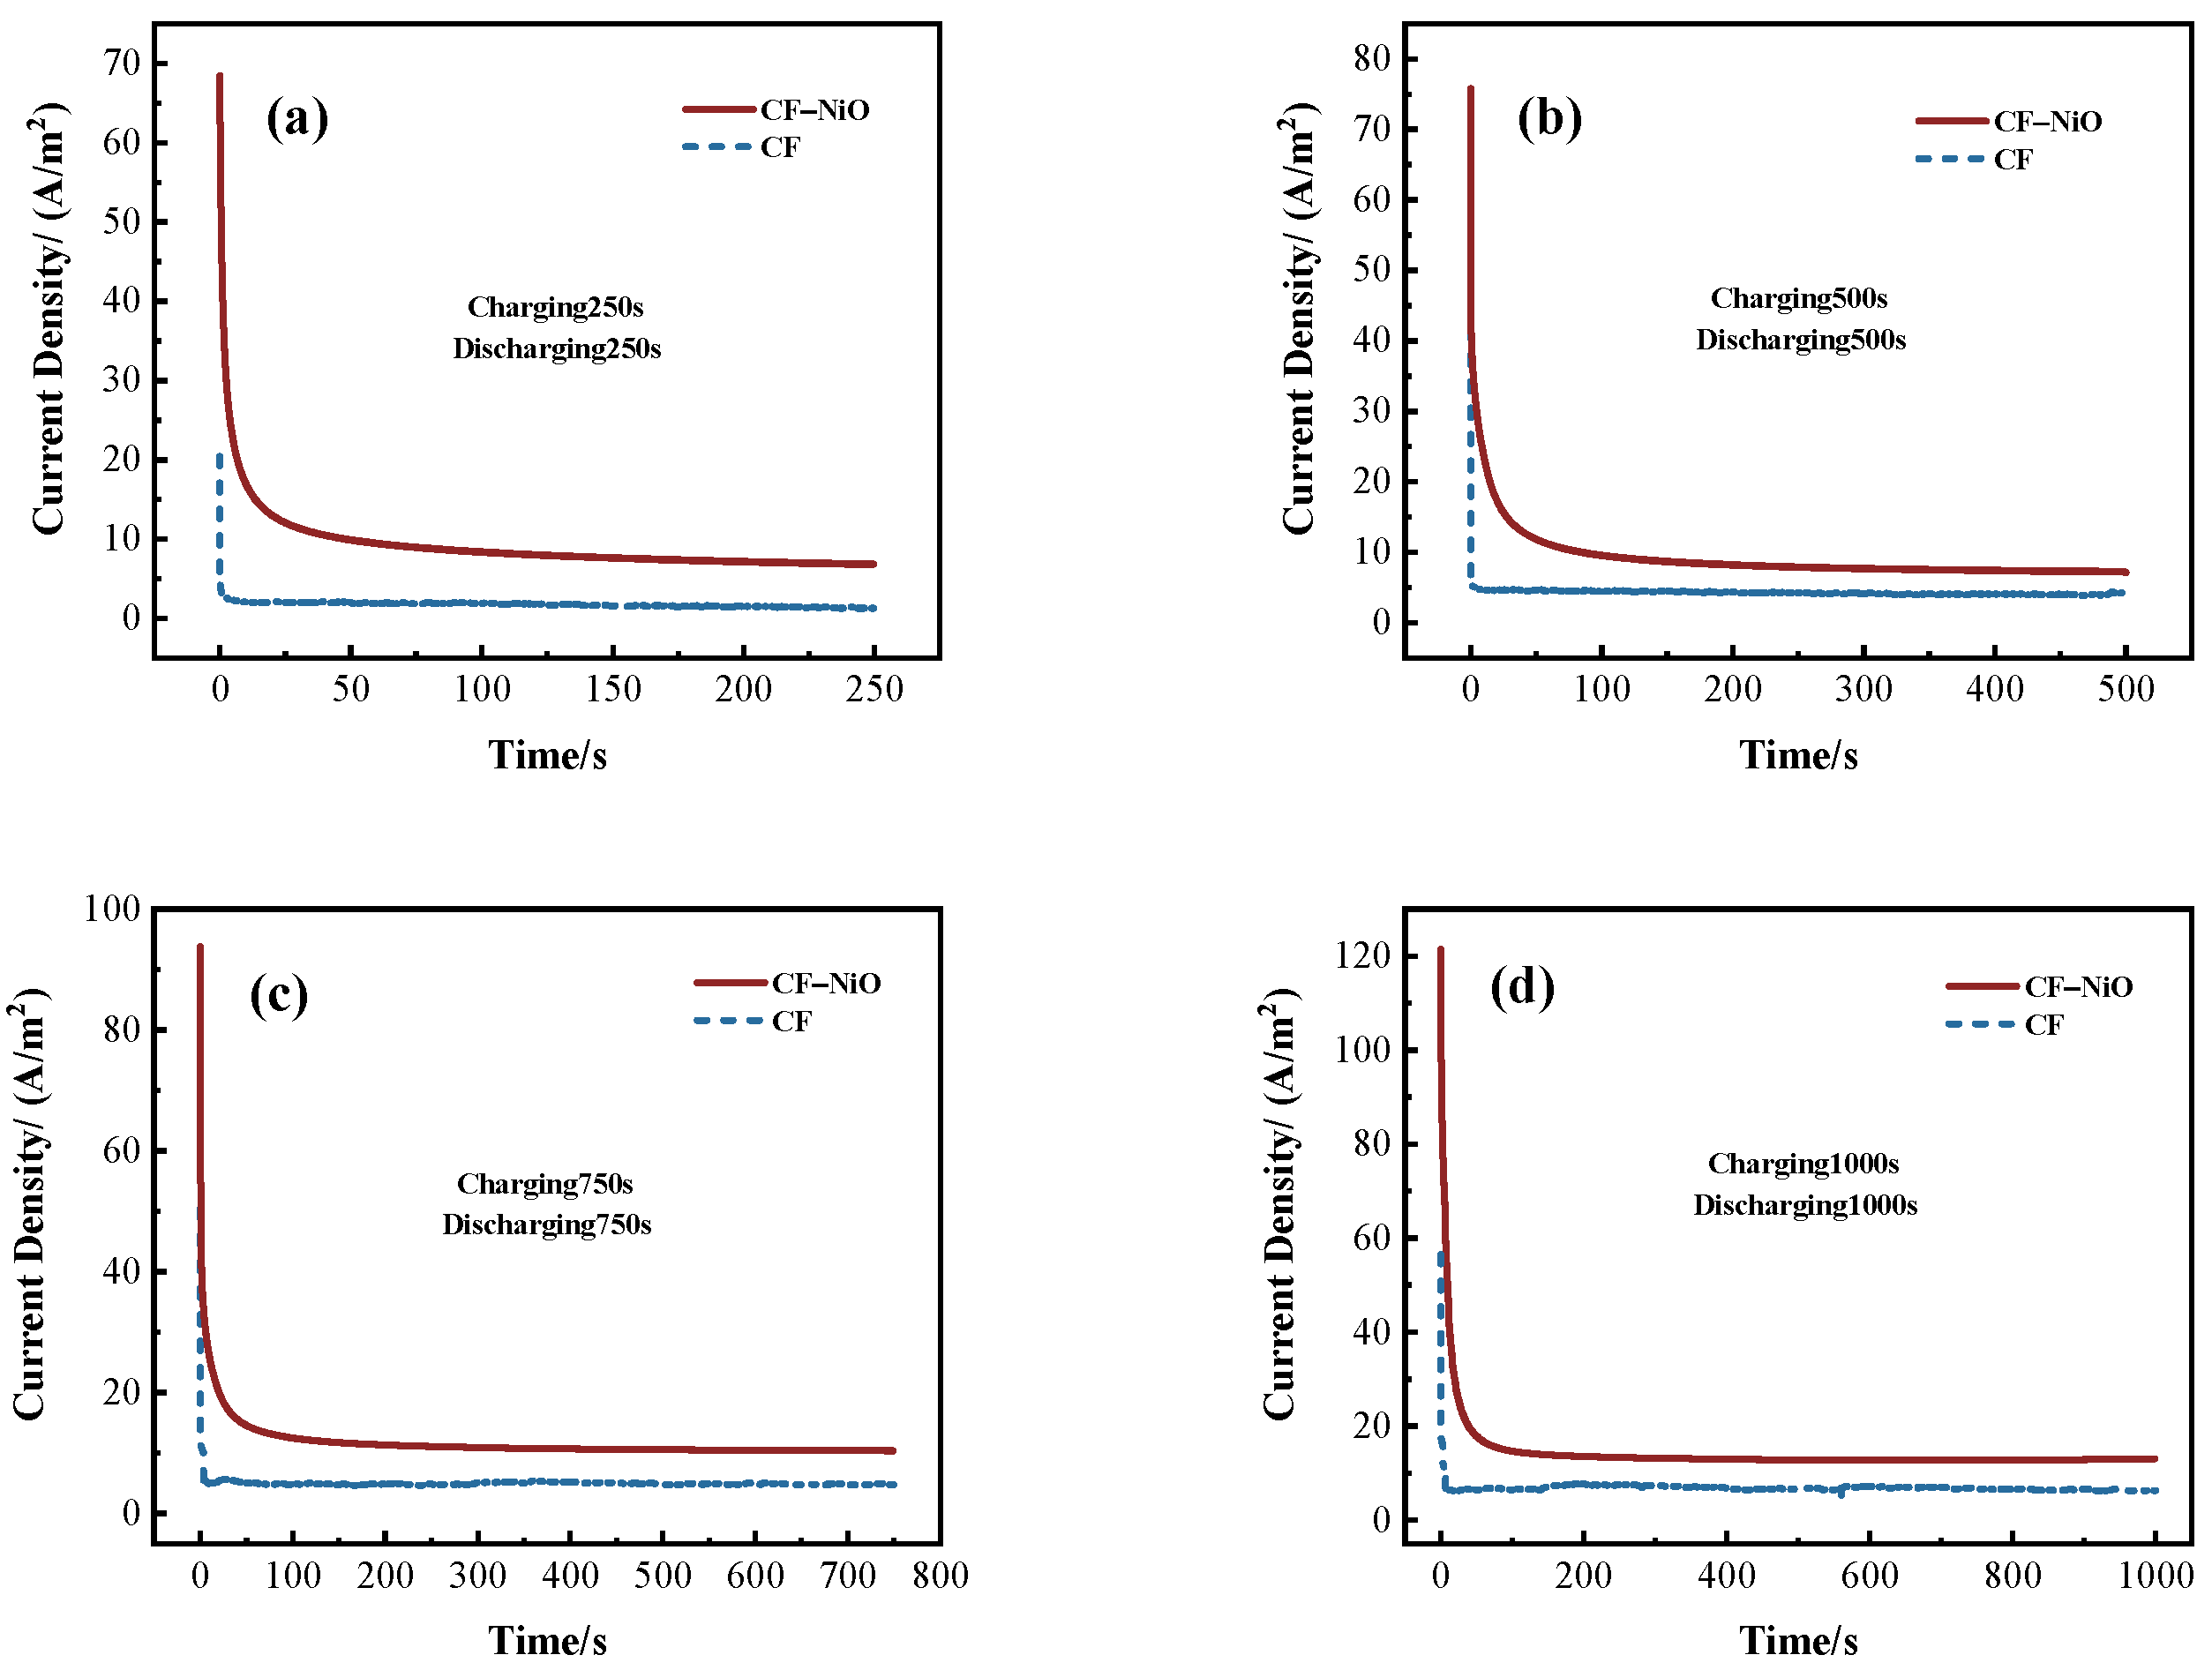
3.2.6. Energy Storage Test of the MFC
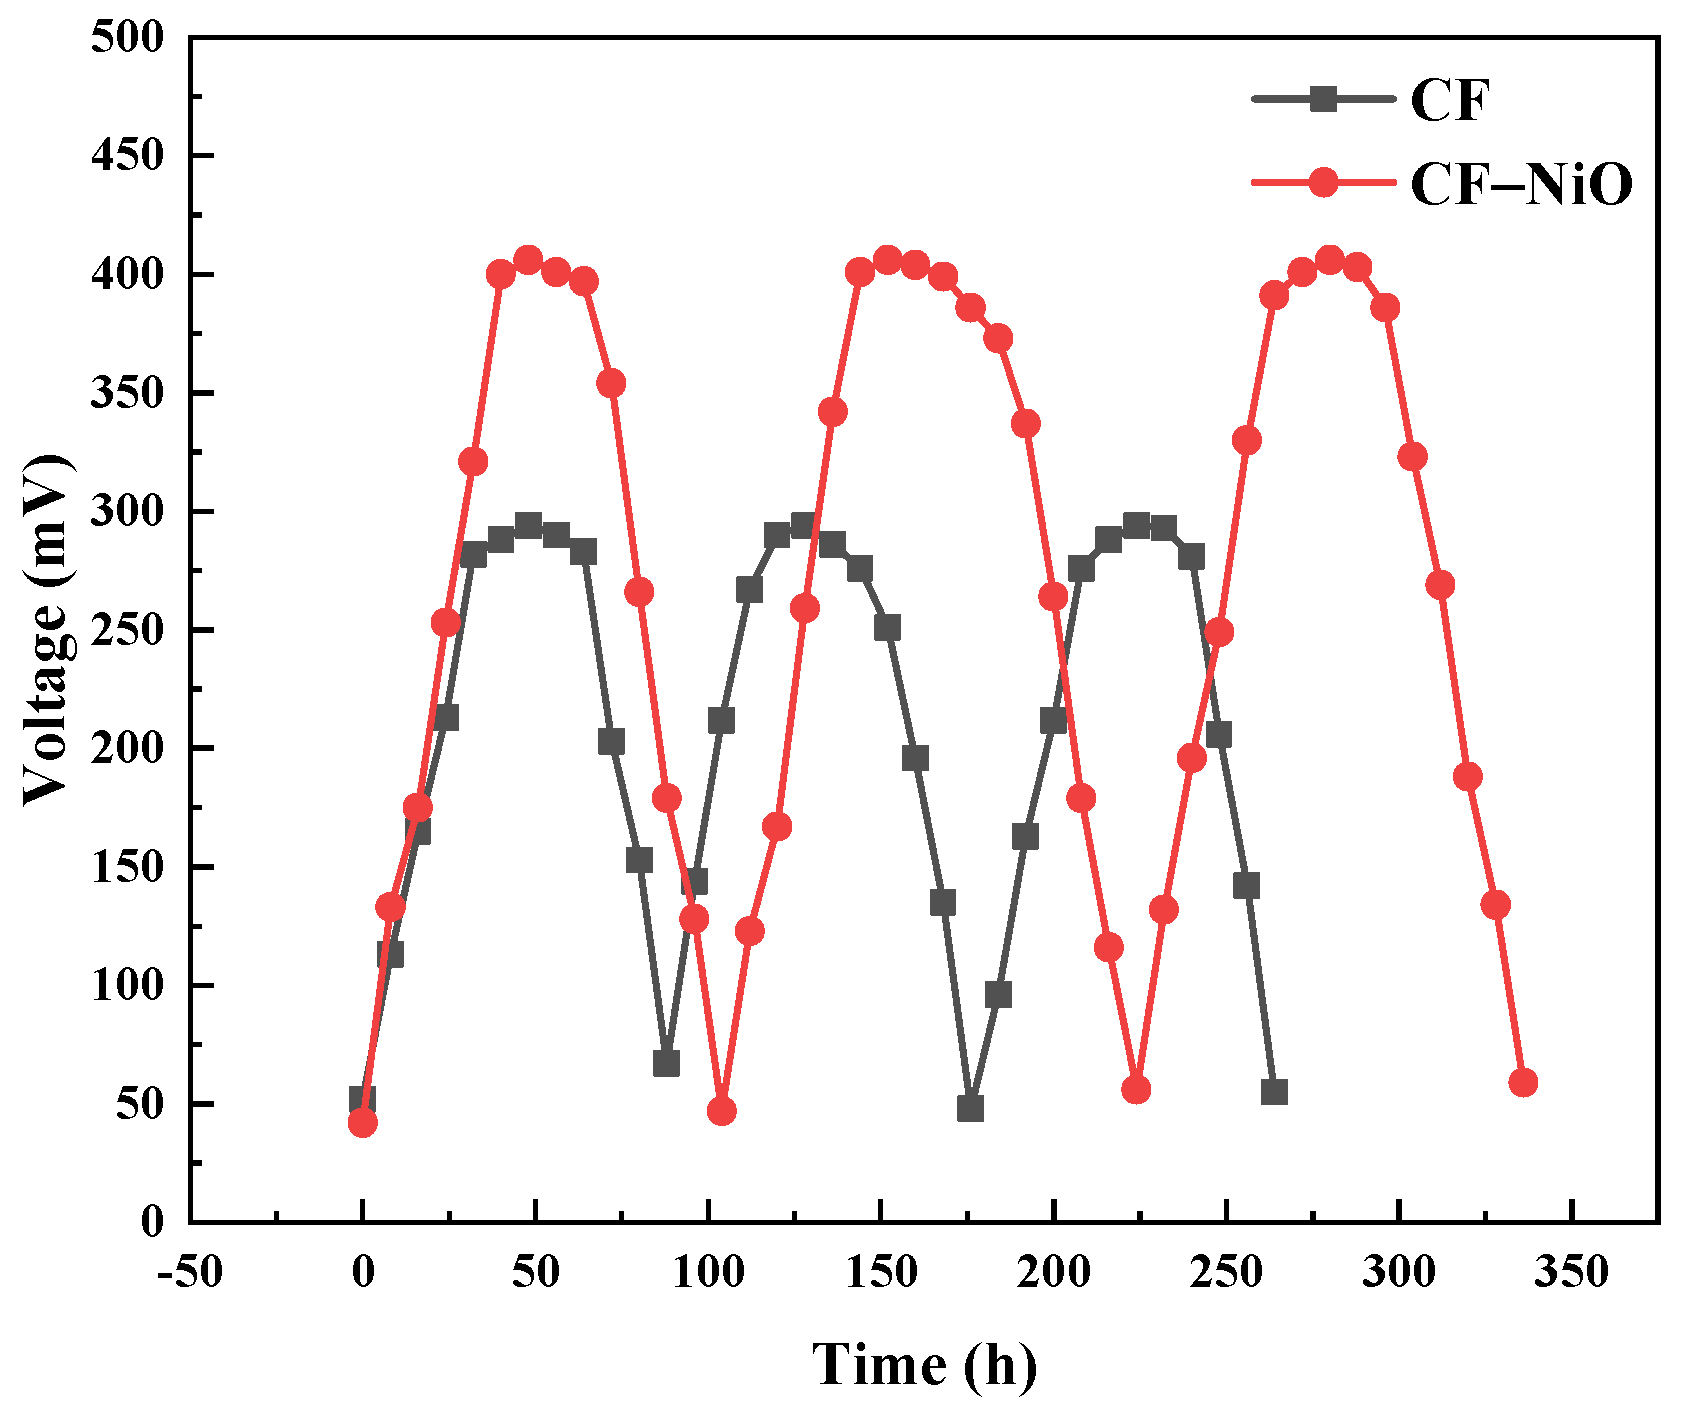
Discharge curves of the MFCs using the CF–NiO electrode or the unmodified CF electrode as anodes under different charging durations are shown in Figure 10a–d. The experiments were conducted under four charging/discharging durations: (a) charging for 250 s and discharging for 250 s (C250–D250), (b) charging for 500 s and discharging for 500 s (C500–D500), (c) charging for 750 s and discharging for 750 s (C750–D750), (d) charging for 1000 s and discharging for 1000 s (C1000–D1000).
As illustrated in the figures, the current density decreases with time during discharge. The initial current density at the beginning of discharge, denoted as ih, represents the maximum current density, while the steady-state current density, is, reflects the stabilized value after a certain discharge duration. These discharge curves also reveal the energy storage capacity of the electrodes, quantified by Qs (stored charge) and Q (total charge output during discharge). The value of Qs is related to the maximum current density, where higher ih indicates greater charge storage capacity. Meanwhile, the anode’s energy storage capability is associated with is, where a higher is corresponds to stronger energy storage performance of the electrode.
As shown in Figure 10a–d, under all four charging/discharging durations, the CF–NiO electrode consistently exhibits a higher maximum current density (ih) compared to the pristine CF electrode. This indicates that the NiO-loaded electrode enables greater energy storage capacity under various charging conditions. The corresponding ih values for each group are summarized in Table 3. It can be observed that ih increases with longer charging times, which is attributed to the accumulation of more charge during extended charging periods. In addition, the CF–NiO electrode also demonstrates the highest steady-state current density (is) in all discharge curves, indicating its superior energy storage capability. The specific values are also listed in the table. It is evident that it increases with longer charging durations, as a longer charging time allows for more stored charge, resulting in a higher ih and an extended discharge period.
As shown in the table, under the C250–D250 condition, the CF–NiO electrode exhibited a stored charge (Qs) and total discharge charge (Q) of 742.82 C/m2 and 2285.29 C/m2, respectively, which are increases of 681.56 C/m2 and 1445.78 C/m2 compared to the pristine CF electrode. Under the C500–D500 condition, the CF–NiO electrode reached Qs and Q values of 986.53 C/m2 and 4549.47 C/m2, representing improvements of 907.96 C/m2 and 2456.13 C/m2, respectively. Under the C750–D750 condition, Qs and Q reached 989.69 C/m2 and 8674.49 C/m2, which are 896.02 C/m2 and 5018.52 C/m2 higher than those of the CF electrode. Finally, under the C1000–D1000 condition, the CF–NiO electrode demonstrated Qs and Q values of 1290.03 C/m2 and 14,150.03 C/m2, showing increases of 837.13 C/m2 and 7407.36 C/m2, respectively. These results clearly indicate that both Qs and Q of the CF–NiO electrode are significantly higher than those of the CF electrode under all tested conditions. This enhancement in charge storage performance is attributed to the structural modification of the electrode. The smooth surface of the pristine CF makes microbial adhesion difficult. However, after NiO growth, the surface of the carbon fiber is covered with a well-developed, nanosheet-like 3D structure, providing favorable sites for microbial attachment within the MFC, as previously shown in the SEM images. As the number of electroactive microorganisms on the electrode surface increases, electrons generated during charging are more efficiently stored in the anode, and protons produced by the microorganisms are retained in the biofilm on the electrode surface. During discharge, electrons flow from the anode to the cathode, while protons are released into the anolyte, increasing the current density and enhancing the overall energy storage performance.

3.2.7. Cyclic Test

To evaluate the stability of the CF/CF–NiO anode, long-term cycling tests were conducted during the experiment. Voltage monitoring was performed using an externally connected 8000 Ω resistor. The results demonstrated that during stable operation, the CF–NiO anode not only exhibited a higher output voltage but also showed a significantly extended cycle period. As illustrated in the Figure 11, the voltage profiles of different anodes within the MFC during each operational cycle consistently exhibited a three-phase characteristic: the rising phase, the stable phase, and the decay phase. Origin of the rising phase: replacement of the nutrient solution in the anode chamber at the initiation of each cycle stimulated the metabolic activity of electrogenic bacteria, thereby accelerating electron migration from the sodium acetate oxidation towards the anode. Origin of the stable phase: the microbial community in the anode chamber attained a dynamic equilibrium between proliferation and decay, leading to stabilized rates of electron generation and transfer. Origin of the decay phase: continuous depletion of organic carbon sources within the anode chamber resulted in diminished activity of electrogenic bacteria, consequently reducing electron production and transfer efficiency.

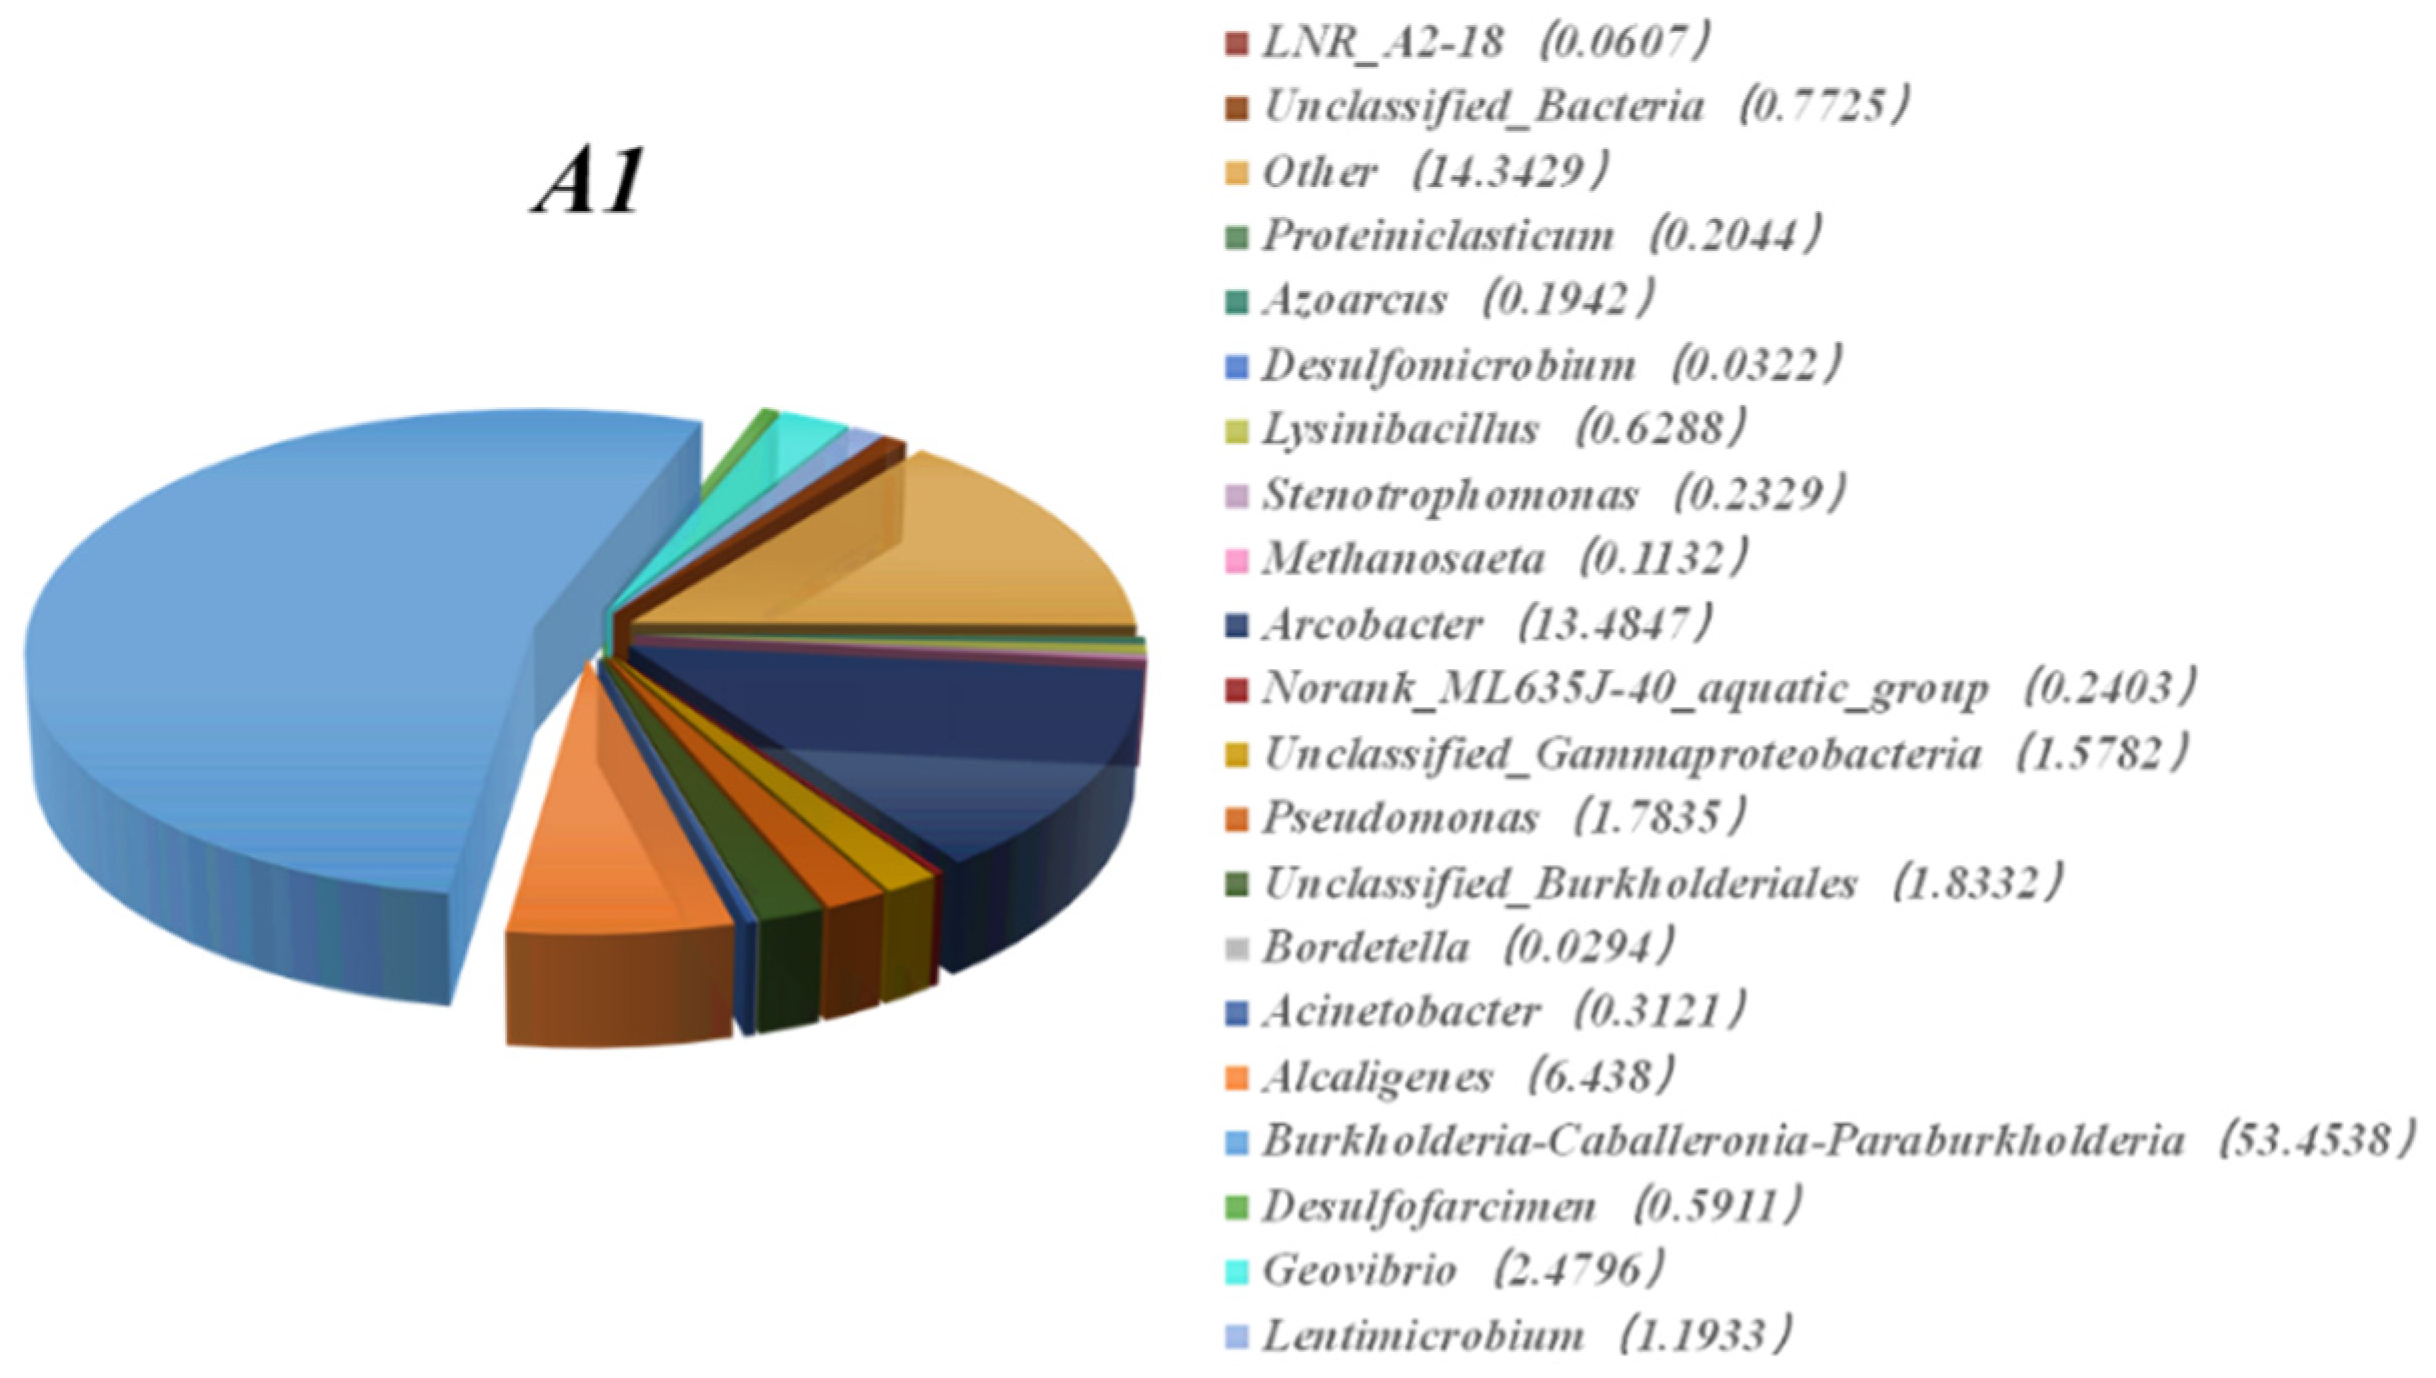
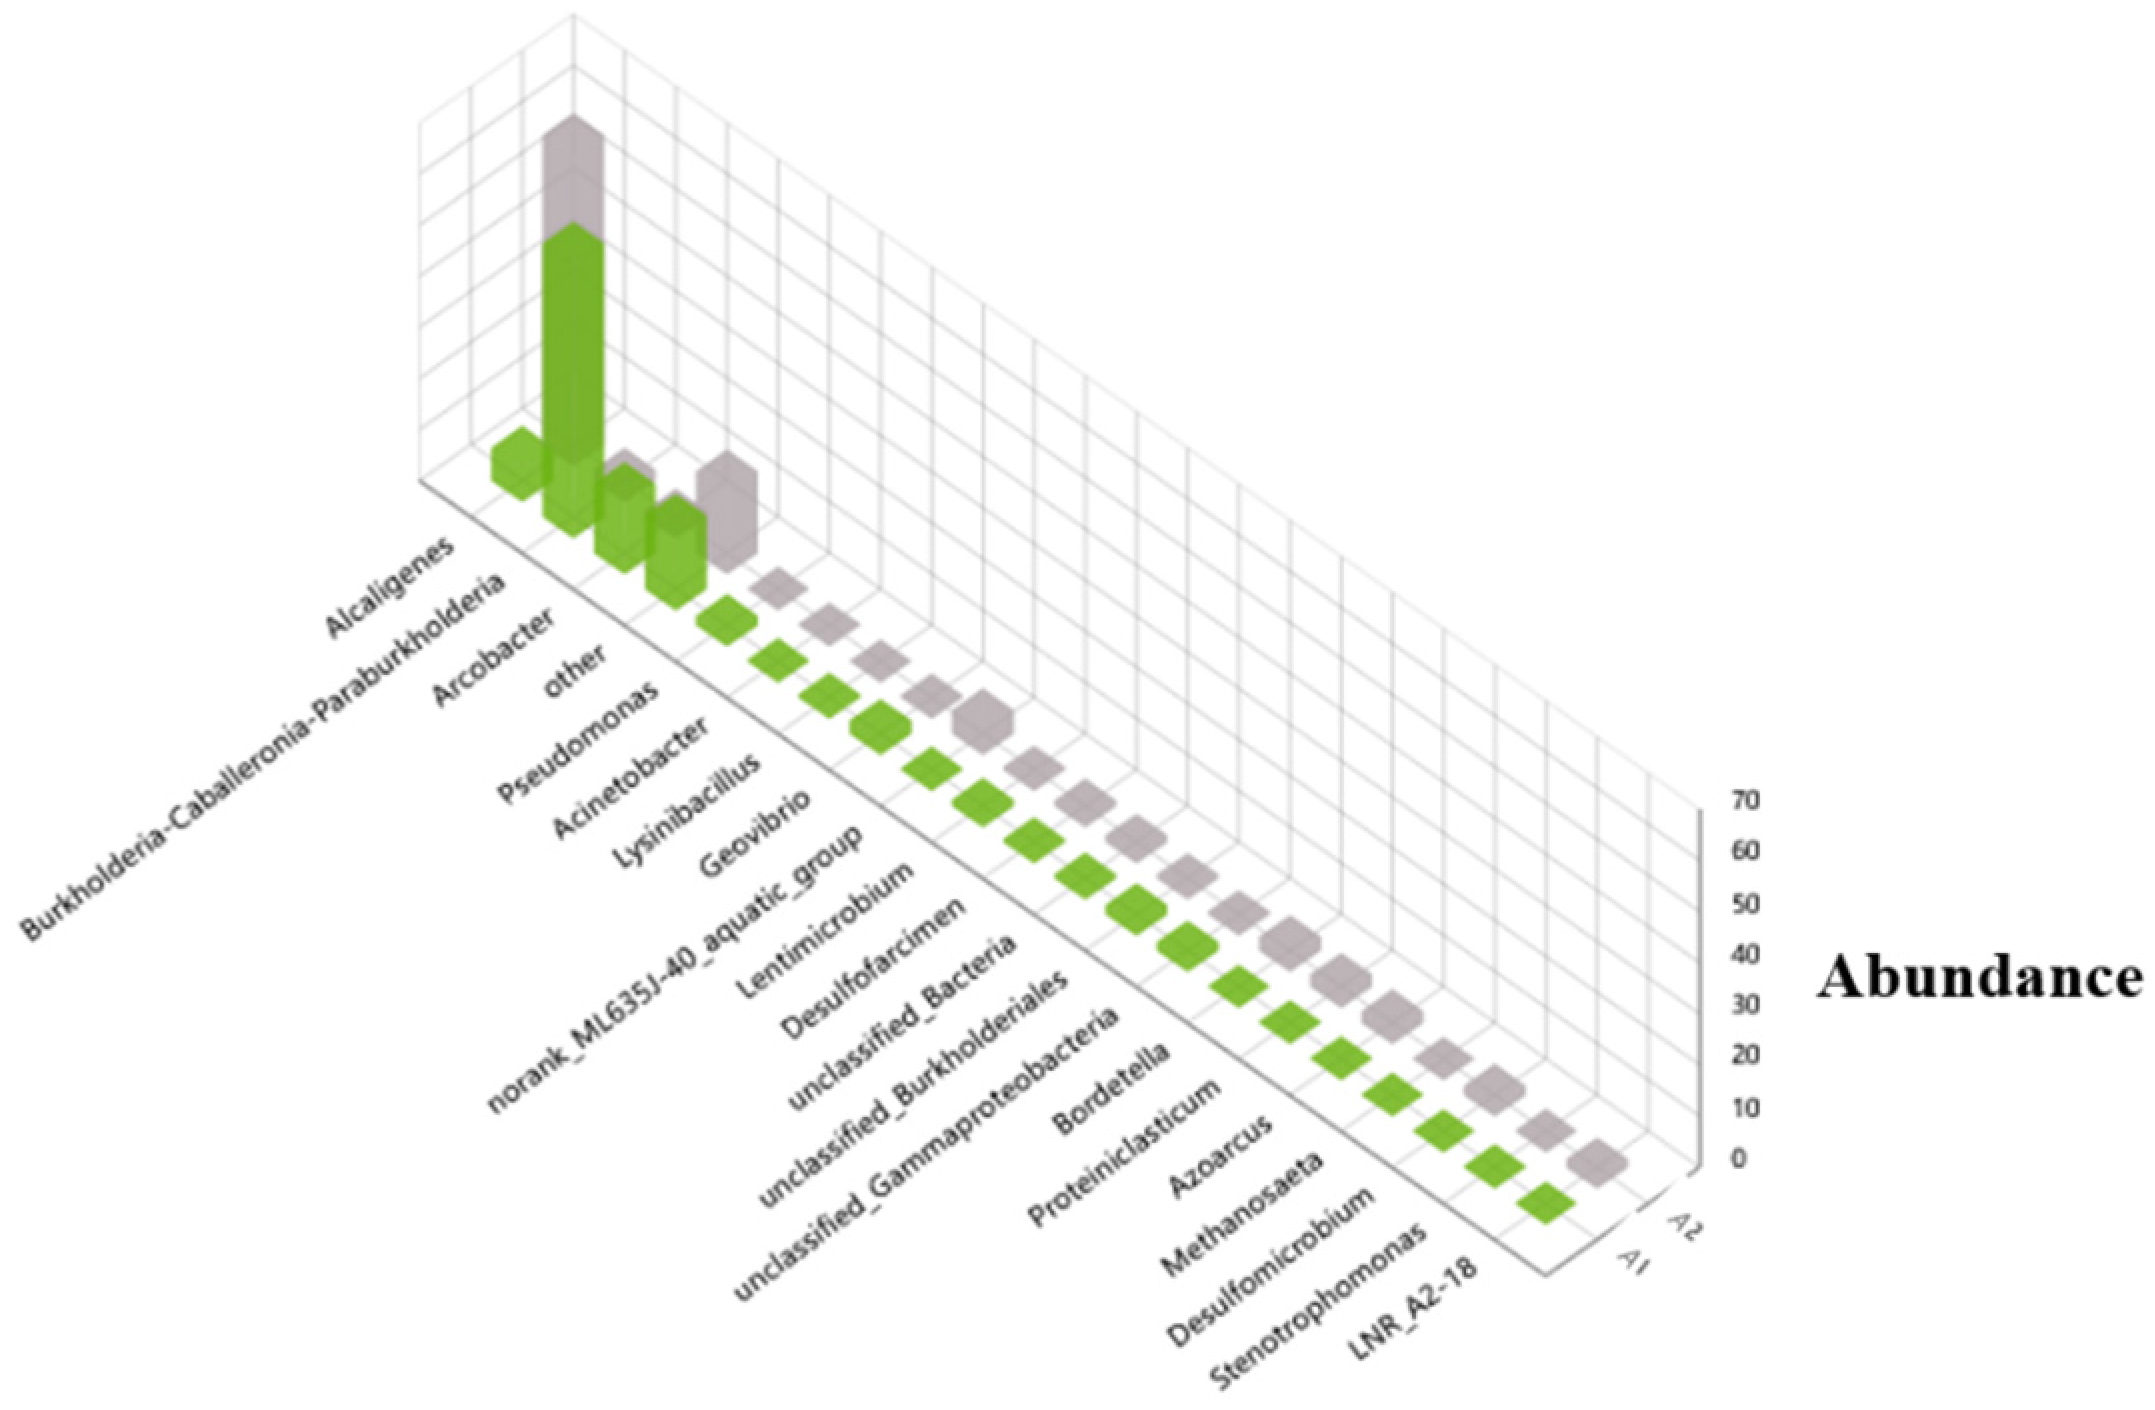
3.3. High-Throughput Sequencing of the MFC with the CF–NiO Anode

To further investigate the reasons behind the enhanced power generation performance of the modified MFC anode, high-throughput sequencing technology was employed to analyze the microbial community structure and species composition on the surfaces of the CF–NiO and pristine CF anodes. This analysis aimed to assess microbial attachment and the growth of electroactive bacteria (EAB) on the anode surfaces. Sample A1 corresponds to the pristine CF anode, while sample A2 corresponds to the CF–NiO anode. Figure 12 presents a Venn diagram showing the microbial species distribution on the CF and CF–NiO anodes. Figure 13 illustrates the microbial community composition on both anodes in the form of a stacked bar chart. Figure 14, Figure 15, and Figure 16 display the species abundance on the CF and CF–NiO anodes using 3D pie charts and 3D bar charts, respectively.
(1) As shown in Figure 12, the Venn diagram illustrates the microbial species classification at the genus level for the two electrode types. It is evident that sample A2 (the CF–NiO electrode) harbors a greater number of microbial species than sample A1 (the pristine CF electrode). Specifically, A2 contains 563 operational taxonomic units (OTUs), whereas A1 contains 549 OTUs. A total of 381 OTUs are shared between both samples. This result indicates that while there is a considerable overlap in microbial species between A1 and A2—likely due to the identical environmental conditions during MFC startup and microbial acclimation—distinct differences also exist. These differences can be attributed to the variation in anode surface properties after modification. During the subsequent power generation and organic matter degradation processes, the distinct surfaces of the CF and CF–NiO electrodes may have selectively enriched different microbial populations, leading to the formation of more stable and functionally specialized microbial communities on each anode.
Figure 12. The Venn diagram of classification of microbial species on the surface of the CF–NiO and CF electrode.
Coatings 15 00760 g012
(2) As shown in Figure 13, the bar chart illustrates the microbial community structure at the genus level on the surfaces of the CF–NiO and CF anodes. It is evident that both anodes host 21 major microbial genera, with varying relative abundances. Among the 21 identified microbial taxa, the electrochemically active species include: Lysinibacillus (spherical bacillus), which participates in anode respiration through quinone-mediated extracellular electron transfer pathways; Arcobacter (arc-shaped bacterium), utilizing sulfide/thiosulfate as electron shuttles to couple organic oxidation with transmembrane current generation; Pseudomonas (pseudomonad), capable of establishing direct interspecies electron transfer networks while efficiently degrading aromatic pollutants; Acinetobacter (non-motile bacillus), which similarly facilitates DIET networks and demonstrates high aromatic contaminant degradation efficacy; Alcaligenes (alkaligenic bacterium), achieving efficient electron output via expression of cytochromes and nanowires [46]; and Geovibrio (terrestrial vibrio) and Lentimicrobium, both exhibiting electrogenic properties. Notably, Alcaligenes is the dominant electroactive genus on the CF–NiO (A2) anode, indicating its significant role in electricity generation in the modified electrode system. Lentimicrobium is identified as a novel genus that is commonly found in reactors treating starch-based wastewater, suggesting potential environmental adaptability and electrochemical relevance.
Figure 13. The microbial community structure distribution histogram of the CF–NiO electrode and CF electrode.
Coatings 15 00760 g013
(3) Figure 14 and Figure 15 present 3D pie charts showing the genus-level microbial species abundance on the CF–NiO and CF anodes.
The figures provide a more intuitive visualization of the relative abundance of microbial genera on the electrode surfaces. In sample A2 (CF–NiO anode), the dominant electroactive bacterium is Alcaligenes, accounting for 60.50% of the microbial community, followed by Arcobacter at 1.18%. In contrast, for sample A1 (pristine CF anode), Arcobacter is the dominant electroactive bacterium at 13.48%, followed by Alcaligenes at 6.44%. The proportions of other electroactive bacteria are shown in the figures.
Figure 14. CF anode attached microbial species abundance 3D pie chart.
Coatings 15 00760 g014
Figure 15. CF–NiO anode attached microbial species abundance 3D pie chart.
Coatings 15 00760 g015
A comparison of the data reveals that while the dominant electroactive bacterial genera are similar in both A1 and A2, their relative abundances differ significantly. In sample A2 (CF–NiO anode), the main electroactive bacteria account for 61.68% of the total community, with the total abundance of electroactive bacteria reaching 63.01%. In contrast, in sample A1 (pristine CF anode), the main electroactive bacteria represent only 19.92%, with total electroactive bacterial abundance at 26.32%. These results indicate that the modified CF–NiO electrode surface supports a higher proportion of electroactive bacteria and a lower proportion of non-electrogenic microbes. This enhancement is primarily attributed to the presence of NiO, which provides more favorable sites and spatial structures for microbial adhesion and growth, particularly for electroactive bacteria. As a result, in the MFC with the CF–NiO anode, organic substrates are predominantly decomposed by electroactive bacteria, leading to more efficient electricity generation. In contrast, the pristine CF anode supports a lower abundance of electroactive bacteria (26.32%), meaning a greater portion of the organic matter is metabolized by non-electrogenic microbes, resulting in reduced electricity generation, which is consistent with electrode characterization and MFC performance test results. The 3D bar chart of microbial species abundance on the CF–NiO and CF anodes is shown in Figure 16. It can be observed that the most abundant genus on the CF surface is Burkholderia–Caballeronia–Paraburkholderia, a non-electrogenic bacterium, whereas the dominant genus on the CF–NiO surface is Alcaligenes, an electroactive bacterium. This further supports the conclusion that NiO modification enhances the growth of electricity-generating microbial communities.
Figure 16. CF–NiO anode and CF anode species abundance 3D histogram.
Coatings 15 00760 g016

4. Conclusions

In this study, a CF–NiO electrode was fabricated using a hydrothermal method followed by calcination. The CF–NiO electrode was employed as the anode in microbial fuel cell (MFC) start-up, and electrochemical performance evaluations were conducted, including polarization testing, power density analysis, and anodic polarization measurements. The results revealed that the CF–NiO anode exhibited a less pronounced polarization and an enhanced electron transfer rate. The maximum power densities of the CF–NiO and CF anode-based MFCs were 0.22 W/m2 and 0.08 W/m2, respectively. Under the C250-D250 condition, the Qs and Q values of the CF–NiO anode increased by 681.56 C/m2 and 1445.78 C/m2, respectively, compared to the CF anode. Under the C1000–D1000 condition, these values increased by 837.13 C/m2 and 7407.36 C/m2, respectively. The significantly higher Qs and Q values indicate that the introduction of the pseudocapacitive material NiO effectively enhances the charge storage capacity of the electrode. Additionally, the modified anode surface exhibited a higher number of microbial operational taxonomic units (OTUs) and a more stable microbial community structure. The total proportion of electroactive bacteria on the CF–NiO anode reached 63.01%, with Alcaligenes identified as the dominant genus. In contrast, the CF anode showed an electroactive bacterial proportion of 26.32%, dominated by Arcobacter. These findings demonstrate that the NiO-modified electrode surface promotes the attachment and growth of a larger population of electroactive microorganisms, thereby enhancing the power generation performance of the MFC.

Author Contributions

Conceptualization, J.Z.; software, T.Y.; formal analysis, L.J.; investigation, W.L.; data curation, Y.H.; methodology and writing—original draft preparation, S.X.; writing—review and editing, Y.W.; supervision, J.Z.; resources, validation, J.L.; and project administration and funding acquisition, Z.W. All authors have read and agreed to the published version of the manuscript.

Funding

This research was funded by the 2023 Heilongjiang Natural Science Foundation Joint Guidance Project (LH2023E029).

Institutional Review Board Statement

The studies in this paper did not involve humans or animals.

Informed Consent Statement

Not applicable.

Data Availability Statement

The original contributions presented in this study are included in the article. Further inquiries can be directed to the corresponding author.

Conflicts of Interest

Author Song Xue was employed by Hunan Construction Investment Water Conservancy and Hydropower Co., Ltd., and Jiuming Lei was employed by the Ecological Environment Monitoring Station of the Lincang Ecological Environment Bureau. The remaining authors declare that the research was conducted in the absence of any commercial or financial relationships that could be construed as a potential conflict of interest.

References

  1. Wijesinha-Bettoni, R.; Mouillé, B. The Contribution of Potatoes to Global Food Security, Nutrition and Healthy Diets. Am. J. Potato Res. 2019, 96, 139–149. [Google Scholar] [CrossRef]
  2. Ovchinnikova, A.; Krylova, E.; Gavrilenko, T.; Smekalova, T.; Zhuk, M.; Knapp, S.; Spooner, D.M. Taxonomy of cultivated potatoes (Solanum section Petota: Solanaceae). Bot. J. Linn. Soc. 2011, 165, 107–155. [Google Scholar] [CrossRef]
  3. De Jong, H. Impact of the potato on society. Am. J. Potato Res. 2016, 93, 415–429. [Google Scholar] [CrossRef]
  4. Beals, K.A. Potatoes, nutrition and health. Am. J. Potato Res. 2019, 96, 102–110. [Google Scholar] [CrossRef]
  5. Raigond, P.; Jayanty, S.S.; Parmar, V.; Dutt, S.; Changan, S.S.; Luthra, S.K.; Singh, B. Health-Promoting compounds in Potatoes: Tuber exhibiting great potential for human health. Food Chem. 2023, 424, 136368. [Google Scholar] [CrossRef] [PubMed]
  6. Wang, Y.; Zhang, R.; Li, S.; Guo, X.; Li, Q.; Hui, X.; Wang, Z.; Wang, H. An Evaluation of Potato Fertilization and the Potential of Farmers to Reduce the Amount of Fertilizer Used Based on Yield and Nutrient Requirements. Agronomy 2024, 14, 612. [Google Scholar] [CrossRef]
  7. Han, J.-S.; Kozukue, N.; Young, K.-S.; Lee, K.-R.; Friedman, M. Distribution of Ascorbic Acid in Potato Tubers and in Home-Processed and Commercial Potato Foods. J. Agric. Food Chem. 2004, 52, 6516–6521. [Google Scholar] [CrossRef] [PubMed]
  8. Xu, J.; Li, Y.; Kaur, L.; Singh, J.; Zeng, F. Functional Food Based on Potato. Foods 2023, 12, 2145. [Google Scholar] [CrossRef]
  9. Chen, Z.; Zhang, T.; Liu, Q.; Liu, W.; Zhao, R.; Hu, H. Effects of additives (NaCl, citric acid, and ethanol) on the cooking quality and sensory quality of vermicelli produced from freeze–thaw-dehydrated whole potato powder. Int. J. Food Sci. Technol. 2024, 59, 9459–9468. [Google Scholar] [CrossRef]
  10. Liu, T.; Men, Z.; Lai, C.; Lian, X. Preparation and Mechanism Analysis of Boiling Resistance of the Fresh Alum-Free Sweet Potato Vermicelli Containing Gliadin Fractions. Foods 2025, 14, 81. [Google Scholar] [CrossRef]
  11. Wang, X.; Wang, J.; Liu, H.; Zhao, L.; Wang, Y.; Wu, X.; Liao, X. Improving the production efficiency of sweet potato starch using a newly designed sedimentation tank during starch sedimentation process. J. Food Process. Preserv. 2020, 44, e14811. [Google Scholar] [CrossRef]
  12. Li, H.; Zeng, X.; Shi, W.; Zhang, H.; Huang, S.; Zhou, R.; Qin, X. Recovery and purification of potato proteins from potato starch wastewater by hollow fiber separation membrane integrated process. Innov. Food Sci. Emerg. Technol. 2020, 63, 102380. [Google Scholar] [CrossRef]
  13. Durruty, I.; Bonanni, P.S.; González, J.F.; Busalmen, J.P. Evaluation of potato-processing wastewater treatment in a microbial fuel cell. Bioresour. Technol. 2012, 105, 81–87. [Google Scholar] [CrossRef] [PubMed]
  14. Cancino-Madariaga, B.; Aguirre, J. Combination treatment of corn starch wastewater by sedimentation, microfiltration and reverse osmosis. Desalination 2011, 279, 285–290. [Google Scholar] [CrossRef]
  15. Li, M.; Zhou, M.; Tian, X.; Tan, C.; McDaniel, C.T.; Hassett, D.J.; Gu, T. Microbial fuel cell (MFC) power performance improvement through enhanced microbial electrogenicity. Biotechnol. Adv. 2018, 36, 1316–1327. [Google Scholar] [CrossRef]
  16. Logan, B.E.; Hamelers, B.; Rozendal, R.; Schröder, U.; Keller, J.; Freguia, S.; Aelterman, P.; Verstraete, W.; Rabaey, K. Microbial Fuel Cells: Methodology and Technology. Environ. Sci. Technol. 2006, 40, 5181–5192. [Google Scholar] [CrossRef]
  17. Oliveira, V.; Simões, M.; Melo, L.; Pinto, A. Overview on the developments of microbial fuel cells. Biochem. Eng. J. 2013, 73, 53–64. [Google Scholar] [CrossRef]
  18. Apollon, W. An overview of microbial fuel cell technology for sustainable electricity production. Membranes 2023, 13, 884. [Google Scholar] [CrossRef]
  19. Aiyer, K.S. How does electron transfer occur in microbial fuel cells? World J. Microbiol. Biotechnol. 2020, 36, 19. [Google Scholar] [CrossRef]
  20. Ieropoulos, I.A.; Greenman, J.; Melhuish, C.; Hart, J. Comparative study of three types of microbial fuel cell. Enzym. Microb. Technol. 2005, 37, 238–245. [Google Scholar] [CrossRef]
  21. Oh, S.E.; Logan, B.E. Hydrogen and electricity production from a food processing wastewater using fermentation and microbial fuel cell technologies. Water Res. 2005, 39, 4673–4682. [Google Scholar] [CrossRef]
  22. Cecconet, D.; Molognoni, D.; Callegari, A.; Capodaglio, A.G. Agro-food industry wastewater treatment with microbial fuel cells: Energetic recovery issues. Int. J. Hydrogen Energy 2018, 43, 500–511. [Google Scholar] [CrossRef]
  23. Moqsud, M.A.; Omine, K.; Yasufuku, N.; Hyodo, M.; Nakata, Y. Microbial fuel cell (MFC) for bioelectricity generation from organic wastes. Waste Manag. 2013, 33, 2465–2469. [Google Scholar] [CrossRef]
  24. Zhou, M.; Chi, M.; Luo, J.; He, H.; Jin, T. An overview of electrode materials in microbial fuel cells. J. Power Sources 2011, 196, 4427–4435. [Google Scholar] [CrossRef]
  25. Logan, B.E.; Wallack, M.J.; Kim, K.-Y.; He, W.; Feng, Y.; Saikaly, P.E. Assessment of Microbial Fuel Cell Configurations and Power Densities. Environ. Sci. Technol. Lett. 2015, 2, 206–214. [Google Scholar] [CrossRef]
  26. Chinga-Carrasco, G. Cellulose fibres, nanofibrils and microfibrils: The morphological sequence of MFC components from a plant physiology and fibre technology point of view. Nanoscale Res. Lett. 2011, 6, 1–7. [Google Scholar] [CrossRef]
  27. Mehdinia, A.; Ziaei, E.; Jabbari, A. Facile microwave-assisted synthesized reduced graphene oxide/tin oxide nanocomposite and using as anode material of microbial fuel cell to improve power generation. Int. J. Hydrogen Energy 2014, 39, 10724–10730. [Google Scholar] [CrossRef]
  28. Lu, A.; Li, Y.; Jin, S.; Wang, X.; Wu, X.-L.; Zeng, C.; Ding, H.; Hao, R.; Lv, M.; Wang, C.; et al. Growth of non-phototrophic microorganisms using solar energy through mineral photocatalysis. Nat. Commun. 2012, 3, 768. [Google Scholar] [CrossRef]
  29. Alatraktchi, F.A.; Zhang, Y.; Angelidaki, I. Nanomodification of the electrodes in microbial fuel cell: Impact of nanoparticle density on electricity production and microbial community. Appl. Energy 2014, 116, 216–222. [Google Scholar] [CrossRef]
  30. Dey, N.; Samuel, G.V.; Raj, D.S.; Gajalakshmi, B. Nanomaterials as potential high performing electrode materials for microbial fuel cells. Appl. Nanosci. 2022, 13, 2625–2640. [Google Scholar] [CrossRef]
  31. Wang, Y.; Ma, S.; Hou, L.; Zuo, J.; Kong, X.; Song, Y.; Wang, Z.; Tian, Y.; Dong, J. Enhanced electricity generation and energy storage in a microbial fuel cell with a bimetallic-modified capacitive anode. Desalination 2024, 593, 118247. [Google Scholar] [CrossRef]
  32. Zhu, K.; Wang, S.; Liu, H.; Liu, S.; Zhang, J.; Yuan, J.; Fu, W.; Dang, W.; Xu, Y.; Yang, X.; et al. Heteroatom-doped porous carbon nanoparticle-decorated carbon cloth (HPCN/CC) as efficient anode electrode for microbial fuel cells (MFCs). J. Clean. Prod. 2022, 336, 130374. [Google Scholar] [CrossRef]
  33. Santos, J.S.; Tarek, M.; Sikora, M.S.; Praserthdam, S.; Praserthdam, P. Anodized TiO2 nanotubes arrays as microbial fuel cell (MFC) electrodes for wastewater treatment: An overview. J. Power Sources 2023, 564, 232872. [Google Scholar] [CrossRef]
  34. Santoro, C.; Li, B.; Cristiani, P.; Squadrito, G. Power generation of microbial fuel cells (MFCs) with low cathodic platinum loading. Int. J. Hydrogen Energy 2013, 38, 692–700. [Google Scholar] [CrossRef]
  35. Gude, V.G. Wastewater treatment in microbial fuel cells—An overview. J. Clean. Prod. 2016, 122, 287–307. [Google Scholar] [CrossRef]
  36. He, Z.; Minteer, S.D.; Angenent, L.T. Electricity Generation from Artificial Wastewater Using an Upflow Microbial Fuel Cell. Environ. Sci. Technol. 2005, 39, 5262–5267. [Google Scholar] [CrossRef]
  37. Liu, H.; Ramnarayanan, R.; Logan, B.E. Production of Electricity during Wastewater Treatment Using a Single Chamber Microbial Fuel Cell. Environ. Sci. Technol. 2004, 38, 2281–2285. [Google Scholar] [CrossRef]
  38. Arun, J.; SundarRajan, P.; Pavithra, K.G.; Priyadharsini, P.; Shyam, S.; Goutham, R.; Le, Q.H.; Pugazhendhi, A. New insights into microbial electrolysis cells (MEC) and microbial fuel cells (MFC) for simultaneous wastewater treatment and green fuel (hydrogen) generation. Fuel 2024, 355, 129530. [Google Scholar] [CrossRef]
  39. Chaturvedi, V.; Verma, P. Microbial fuel cell: A green approach for the utilization of waste for the generation of bioelectricity. Bioresour. Bioprocess. 2016, 3, 1–14. [Google Scholar] [CrossRef]
  40. Hamedani, E.A.; Abasalt, A.; Talebi, S. Application of microbial fuel cells in wastewater treatment and green energy production: A comprehensive review of technology fundamentals and challenges. Fuel 2024, 370, 131855. [Google Scholar] [CrossRef]
  41. Kumar, M.; Kumar, V.; Mustafa, S.; Aftab, U.; Laghari, Z.A.; Jatoi, A.S.; Mashooque, S.; Ahmed, M. Graphene-loaded nickel oxide nanocomposite as anode material for microbial fuel cell. Biomass Convers. Biorefinery 2022, 13, 13245–13252. [Google Scholar] [CrossRef]
  42. Zhong, D.; Liu, Y.; Liao, X.; Zhong, N.; Xu, Y. Facile preparation of binder-free NiO/MnO2-carbon felt anode to enhance electricity generation and dye wastewater degradation performances of microbial fuel cell. Int. J. Hydrogen Energy 2018, 43, 23014–23026. [Google Scholar] [CrossRef]
  43. Li, X.; Hu, B.; Suib, S.; Lei, Y.; Li, B. Electricity generation in continuous flow microbial fuel cells (MFCs) with manganese dioxide (MnO2) cathodes. Biochem. Eng. J. 2011, 54, 10–15. [Google Scholar] [CrossRef]
  44. Wu, X.; Sun, D.; Li, M.; Zhang, X.; Al-Dhabi, N.A.; Fang, Q.; Tang, W.; Tang, Q.; Kou, J.; Wang, Z.; et al. Nano-Fe3O4/polymerize aniline/carbon cathode based microbial fuel cell for efficient power generation and uranium separation. Chem. Eng. J. 2024, 487, 150634. [Google Scholar] [CrossRef]
  45. Dehghanian, M.; Mahdavi, M.A.; Gheshlaghi, R.; Darband, G.B.; Absalan, Y. Synthesis of TiC@C–TiO2 as an emerging efficient nanostructure for anode modification in high-power microbial fuel cells. Int. J. Hydrogen Energy 2025, 116, 591–600. [Google Scholar] [CrossRef]
  46. Zeng, F.; Wu, Y.; Bo, L.; Zhang, L.; Liu, W.; Zhu, Y. Coupling of electricity generation and denitrification in three-phase single-chamber MFCs in high-salt conditions. Bioelectrochemistry 2020, 133, 107481. [Google Scholar] [CrossRef]
Figure 1. The SEM images of the CF electrode with 1000× and 5000× magnification (a,b) and the SEM images of the CF–NiO electrode with 1000× and 5000× (c,d).
Coatings 15 00760 g001
Figure 2. The SEM images of the CF–NiO electrode with 40,000- and 60,000-times magnification.
Coatings 15 00760 g002
Figure 3. XRD pattern of the CF–NiO electrode showing characteristic diffraction peaks of NiO.
Coatings 15 00760 g003
Figure 4. EDS spectrum of the CF–NiO electrode indicating elemental composition.
Coatings 15 00760 g004
Figure 5. Performance of MFCs equipped with a CF–NiO anode or CF anode: Polarization curves of the cells.
Coatings 15 00760 g005
Figure 6. Performance of the MFCs equipped with a CF–NiO anode or CF anode: Power density curves.
Coatings 15 00760 g006
Figure 7. Polarization curves of the MFCs equipped with a CF–NiO anode or CF anode.
Coatings 15 00760 g007
Figure 8. The CV curves of the MFCs with a CF–NiO anode or CF anode.
Coatings 15 00760 g008
Figure 9. The EIS curves of the MFCs with a CF–NiO anode or CF anode.
Coatings 15 00760 g009
Figure 10. Chronoamperometric curves polarized for the CF–NiO anode and the CF anode at different discharge times under closed-circuit conditions: (a) 250 s, (b) 500 s, (c) 750 s, and (d) 1000 s.
Coatings 15 00760 g010
Figure 11. Long-term cycling tests of different anodes in the MFCs.
Coatings 15 00760 g011
Table 1. Comparison of functional densities of different loaded materials.
MaterialsPower Density W/m2References
CF-MnO20.161[43]
nFe3O4/PA/CB-MFC0.01517[44]
TiO2@CC0.188[45]
CF–NiO0.22This work
Table 2. Impedance values of different electrodes in MFCs.
ElectrodeCFCF–NiO
RΩ (Ω)14.83 ± 0.0311.55 ± 0.05
Rct (Ω)24.8 ± 0.0211.72 ± 0.02
Note: All data are expressed as mean ± standard deviation.
Table 3. The results of chronoamperometric curves with different anodes.
ElectrodeCurrent and ChargeC250/D250C500/D500C750/D750C1000/D1000
CFih (A/m2)20.4345.4550.3756.55
is (A/m2)1.274.064.756.29
Qs (C/m2)61.2678.5793.67452.9
Q (C/m2)839.512093.573655.976742.67
CF/NiOih (A/m2)68.4375.7593.83121.45
is (A/m2)6.717.1310.2612.86
Qs (C/m2)742.82986.53989.691290.03
Q (C/m2)2285.294549.478674.4914,150.03
Disclaimer/Publisher’s Note: The statements, opinions and data contained in all publications are solely those of the individual author(s) and contributor(s) and not of MDPI and/or the editor(s). MDPI and/or the editor(s) disclaim responsibility for any injury to people or property resulting from any ideas, methods, instructions or products referred to in the content.

