Article

The Non-Destructive Testing of Architectural Heritage Surfaces via Machine Learning: A Case Study of Flat Tiles in the Jiangnan Region

by
Haina Song
1,2,
Yile Chen
1 and
Liang Zheng
1,3,*
1
Faculty of Humanities and Arts, Macau University of Science and Technology, Avenida Wai Long, Tapai, Macau 999078, China
2
Faculty of Design and Architecture, Zhejiang Wanli University, No. 8 Qianhu South Road, Yinzhou District, Ningbo 315100, China
3
Zhuhai MUST Science and Technology Research Institute, Macau University of Science and Technology, Zhuhai 519099, China
*
Author to whom correspondence should be addressed.
Coatings 2025, 15(7), 761; https://doi.org/10.3390/coatings15070761 (registering DOI)
Submission received: 28 May 2025 / Revised: 21 June 2025 / Accepted: 26 June 2025 / Published: 27 June 2025

Abstract

This study focuses on the ancient buildings in Cicheng Old Town, a typical architectural heritage area in the Jiangnan region of China. These buildings are famous for their well-preserved Tang Dynasty urban layout and Ming and Qing Dynasty roof tiles. However, the natural aging, weathering, and biological erosion of the roof tiles seriously threaten the integrity of heritage protection. Given that current detection methods mostly depend on manual checks, which are slow and cover only a small area, this study suggests using deep learning technology for heritage protection and creating a smart model to identify damage in flat tiles using the YOLOv8 architecture. During this research, the team used drone aerial photography to collect images of typical building roofs in Cicheng Old Town. Through preprocessing, unified annotation, and system training, a damage dataset containing 351 high-quality images was established, covering five types of damage: breakage, cracks, the accumulation of fallen leaves, lichen growth, and vegetation growth. The results show that (1) the model has an overall mAP of 73.44%, an F1 value of 0.75 in the vegetation growth category, and a recall rate of 0.70, showing stable and balanced detection performance for various damage types; (2) the model performs well in comparisons using confusion matrices and multidimensional indicators (including precision, recall, and log-average miss rate) and can effectively reduce the false detection and missed detection rates; and (3) the research team applied the model to drone images of the roof of Fengyue Painted Terrace Gate in Cicheng Old Town, Jiangbei District, Ningbo City, Zhejiang Province, and automatically detected and located multiple tile damage areas. The prediction results are highly consistent with field observations, verifying the feasibility and application potential of the model in actual heritage protection scenarios.

1. Introduction

1.1. Research Background

Cicheng Old Town is the most well-preserved ancient county town in Jiangnan, China. It retains the pattern of county towns from the Tang Dynasty and a large number of ancient buildings from the Ming and Qing Dynasties. In 2009, the ancient county town’s architectural heritage won the UNESCO Asia–Pacific Award for Cultural Heritage Conservation [1]. Cicheng Old Town is located on the east coast of China and beside the China Grand Canal and covers a total area of 2.17 km2 (Figure 1). It was first built in the Spring and Autumn period (473 BC), and the county town was built in the Tang Dynasty (738 AD), following the pattern of the ancient capital Chang’an. The entire county town has preserved the complete double checkerboard pattern of the Tang Dynasty for more than 1200 years (Figure 2). There is approximately 600,000 m2 of ancient buildings preserved in the ancient county town and nearly 50 cultural protection units and points at all levels, among which 6 are listed as national key cultural relic protection buildings. These ancient buildings are a model of ancient Chinese county towns in the area south of the Yangtze River.
In ancient China, clay roof tiles were the most important material for protecting ancient buildings from rainwater erosion; they also had high cultural value [2,3]. All the ancient buildings preserved in Cicheng Old Town have clay tile roofs; however, because the tiles are laid on the roofs of the buildings, it is not easy to visually inspect damage to the tiles. At present, the detection of damage to the roofs of ancient buildings relies mainly on manual inspection. The inspection and repair of these tile roofs are difficult and associated with a heavy workload and may also result in secondary damage [4]. Thus, efficiently and accurately detecting the state of tile roofs has become an urgent problem.

1.2. Literature Review

1.2.1. A Cultural and Conservation Study of Chinese Traditional Clay Roof Tiles

The unique roof form, color, and texture are important parts of Chinese architectural esthetics. It is well known that wooden structures are sensitive to water, and roof tiles play an important role in protecting building timber from water erosion. As such, the emergence and popularization of tiles also gradually contributed to the development of wooden buildings in ancient China [5]. The use of clay tiles was described in documents from the Xia Dynasty (around 1561 B.C.). By the Spring and Autumn period, clay tiles were commonly used in various buildings [3,6]. The knowledge of tiles later expanded to the Korean Peninsula, Japan, and Southeast Asia, deeply influencing the architectural culture there [7,8]. Roofing clay tiles can be divided into flat tiles, round tiles, Eave tiles, lace tiles, drip tiles, and so on, depending on their functional uses and the location of laying [9]. Gray clay flat tiles are the main material for tile roofing. These tiles are waterproof, fireproof, and windproof and have good heat insulation properties [9]. The most unique aspects of traditional Chinese gray clay flat tiles manufacturing are the ‘barrel molding method’ and the reduction firing technique. Both Yingzao Fashi and Tiangong Kaiwu provide documentation on this method [10,11,12]. Gray clay flat tiles produced using this technology have better physical properties, such as higher strength and better waterproofing qualities, which is supported by the results of some recent scientific experiments [13]. However, the scarcity of clay resources and production inefficiencies have jeopardized the production of traditional Chinese flat tiles [14]. Mechanized production simplifies many of the production processes; however, it results in the production of flat tiles with lower durability, strength, and other properties compared with those produced via traditional processes [15,16]. As a result, it is particularly important to protect traditional flat tiles from further damage.
The Jiangnan region—a quintessential human geographical region in China—encompasses the southern edge of the Yangtze River Delta, covering parts of the Jiangsu, Shanghai, Zhejiang, and Anhui provinces and municipalities [17]. Most of the heritage buildings in the Jiangnan region use flat tiles as roof covering materials, such as the classical gardens in Suzhou, the ancient villages in southern Anhui Province, and the West Lake cultural landscape in Hangzhou. These historically protected buildings have experienced nearly a thousand years of history. Previous research on flat tile roofs has focused on archeology, production processes, and material analysis, with a lack of research on detecting damage to flat tiles on the roofs of heritage buildings. Much of the recent research has started to adopt new technologies to detect damage to heritage buildings and determine their efficient management using intelligent systems.

1.2.2. Application of Artificial Intelligence Technology in Architectural Heritage Inspection

Periodic damage detection plays a crucial role in the maintenance and protection of existing buildings and infrastructure, especially for historic buildings. Artificial intelligence technology offers new and more effective solutions for architectural heritage inspection. For example, image recognition algorithms can be used to recognize specific architectural elements such as walls, floors, and wood [18,19,20]. First, images of architectural heritage objects are classified and recorded with the help of deep learning techniques [21,22]. This information can then be used for architectural restoration and preservation. In addition, object detection algorithms can be utilized to detect problems such as damage and cracks to help people better manage and maintain buildings [23,24]. A faster R-CNN model based on the ResNet101 framework has been used to detect two types of damage (efflorescence and spalling) to historic masonry structures [25]. For historical buildings that are difficult to reach and touch, such as the top of a pagoda, scholars have used drone photography, CNNs, and SVMs to conduct experiments on the cracks in the masonry of Thailand’s Historic City of Ayutthaya [26]. For roof tile detection, a two-level strategy based on deep learning technology has been used for the automatic detection, segmentation, and measurement of large-area surface damage to historical buildings, and experiments were conducted on the glazed roof tiles of the National Palace Museum in China [27]. In order to quickly assess roof damage after a typhoon, aerial photographs were processed using a trained model, allowing the degree of roof damage to be categorized [28].
You Only Look Once (YOLO) is a widely adopted single-stage visual detection model known for its speed and accuracy. The latest version, YOLOv8, has demonstrated strong performance in real-time object detection tasks. In recent heritage studies, YOLOv8 has been effectively applied to detect damage in traditional village buildings and recognize complex structures in classical Chinese gardens, highlighting its potential in heritage conservation scenarios with intricate textures and diverse targets [29,30,31,32,33].

1.2.3. Intelligent Management of Architectural Heritage Diseases

Due to the uniqueness of historic building configurations and the rarity of cultural values, architectural heritage management activities—including documentation, restoration, and preservation—are very complex and demanding. In recent years, the scope of architectural heritage conservation has moved beyond individual buildings to encompass larger heritage areas such as cultural landscapes, clusters of architectural heritage, and even entire cities [34]. Therefore, managing the digital recording, intelligent detection, and restoration of architectural heritage is a systematic process [35]. Heritage building information modeling (HBIM), which is a digital method for conserving architectural heritage, has recently received a great deal of attention from researchers, planners, and policy-makers in related fields around the world [36,37]. HBIM, first proposed by Murphy et al. in 2009, is a novel system for modeling historic buildings that involves using terrestrial laser scanners in conjunction with digital cameras to collect survey data from the asset, meshing the point cloud data, and finally texturing them to create a three-dimensional model [38]. The core concept of HBIM involves the detailed digital modeling of built heritage, integrating physical and historical information. The model is a dynamic database that can be used not only for restoration and conservation but also for ongoing maintenance and monitoring [39]. Alvaro Mol et al. [40] proposed an HBIM-based workflow that combines the results of non-destructive testing and geometric measurements to allow the modeling, analysis, and storage of geometric data, decay levels, and wooden building materials to achieve the preventive preservation of the architectural heritage of wooden structures. Furthermore, in the context of the integrated conservation of historic buildings, Dionizio, RF et al. [41] explored the integration of HBIM and GIS in cultural landscape management, using a systematic analysis of data and metadata to construct an HBIM-GIS model. Research has shown that the effective integration of HBIM models with GISs (Geographic Information Systems), such as ArcGIS, has the potential to revolutionize the construction industry, particularly in building heritage management. This integration facilitates multi-scalar documentation and temporal and predictive analytics to prevent catastrophes and significantly enhance management and analytical capabilities. At present, the exploration of HBIM-GIS is still in its infancy. Although the benefits of HBIM-GIS have been recognized, practical applications still need to be improved. Therefore, the dissemination and exploration of HBIM-GIS knowledge should be deepened to maximize its potential.

1.3. Problem Statement and Objectives

Periodic damage detection plays a crucial role in the maintenance and protection of existing buildings and infrastructure, especially historic buildings [42]. Relying on manual ascents to detect damage to the roofs of ancient buildings is associated with problems such as safety hazards, inefficient detection, low accuracy, and small coverage. Through recording the condition of the roof using drone technology and analyzing the captured images using computer vision technology, the type of damage to the tiled roof can be automatically identified. This method can also reduce the required labor cost, to a certain extent, and improve the efficiency of the daily maintenance of architectural heritage. In this study, taking Cicheng Old Town as an example, a YOLOv8 machine learning model is constructed to verify the accuracy of machine learning in automatically detecting damage to the roof tiles of cultural relic buildings. The technology is also integrated into an HBIM system to facilitate daily operation and management. This study explores the following three issues:
(1)
How many types of damage can be identified in the flat tiles on the heritage buildings in Cicheng Old Town based on site surveys and Unmanned Aerial Vehicle (UAV) photography?
(2)
What are the results of the photo-identification and analysis of the types of damage to flat tiles on the heritage buildings?
(3)
How effective is the trained machine learning model?

2. Materials and Methods

2.1. Flat Tiles in Cicheng Old Town

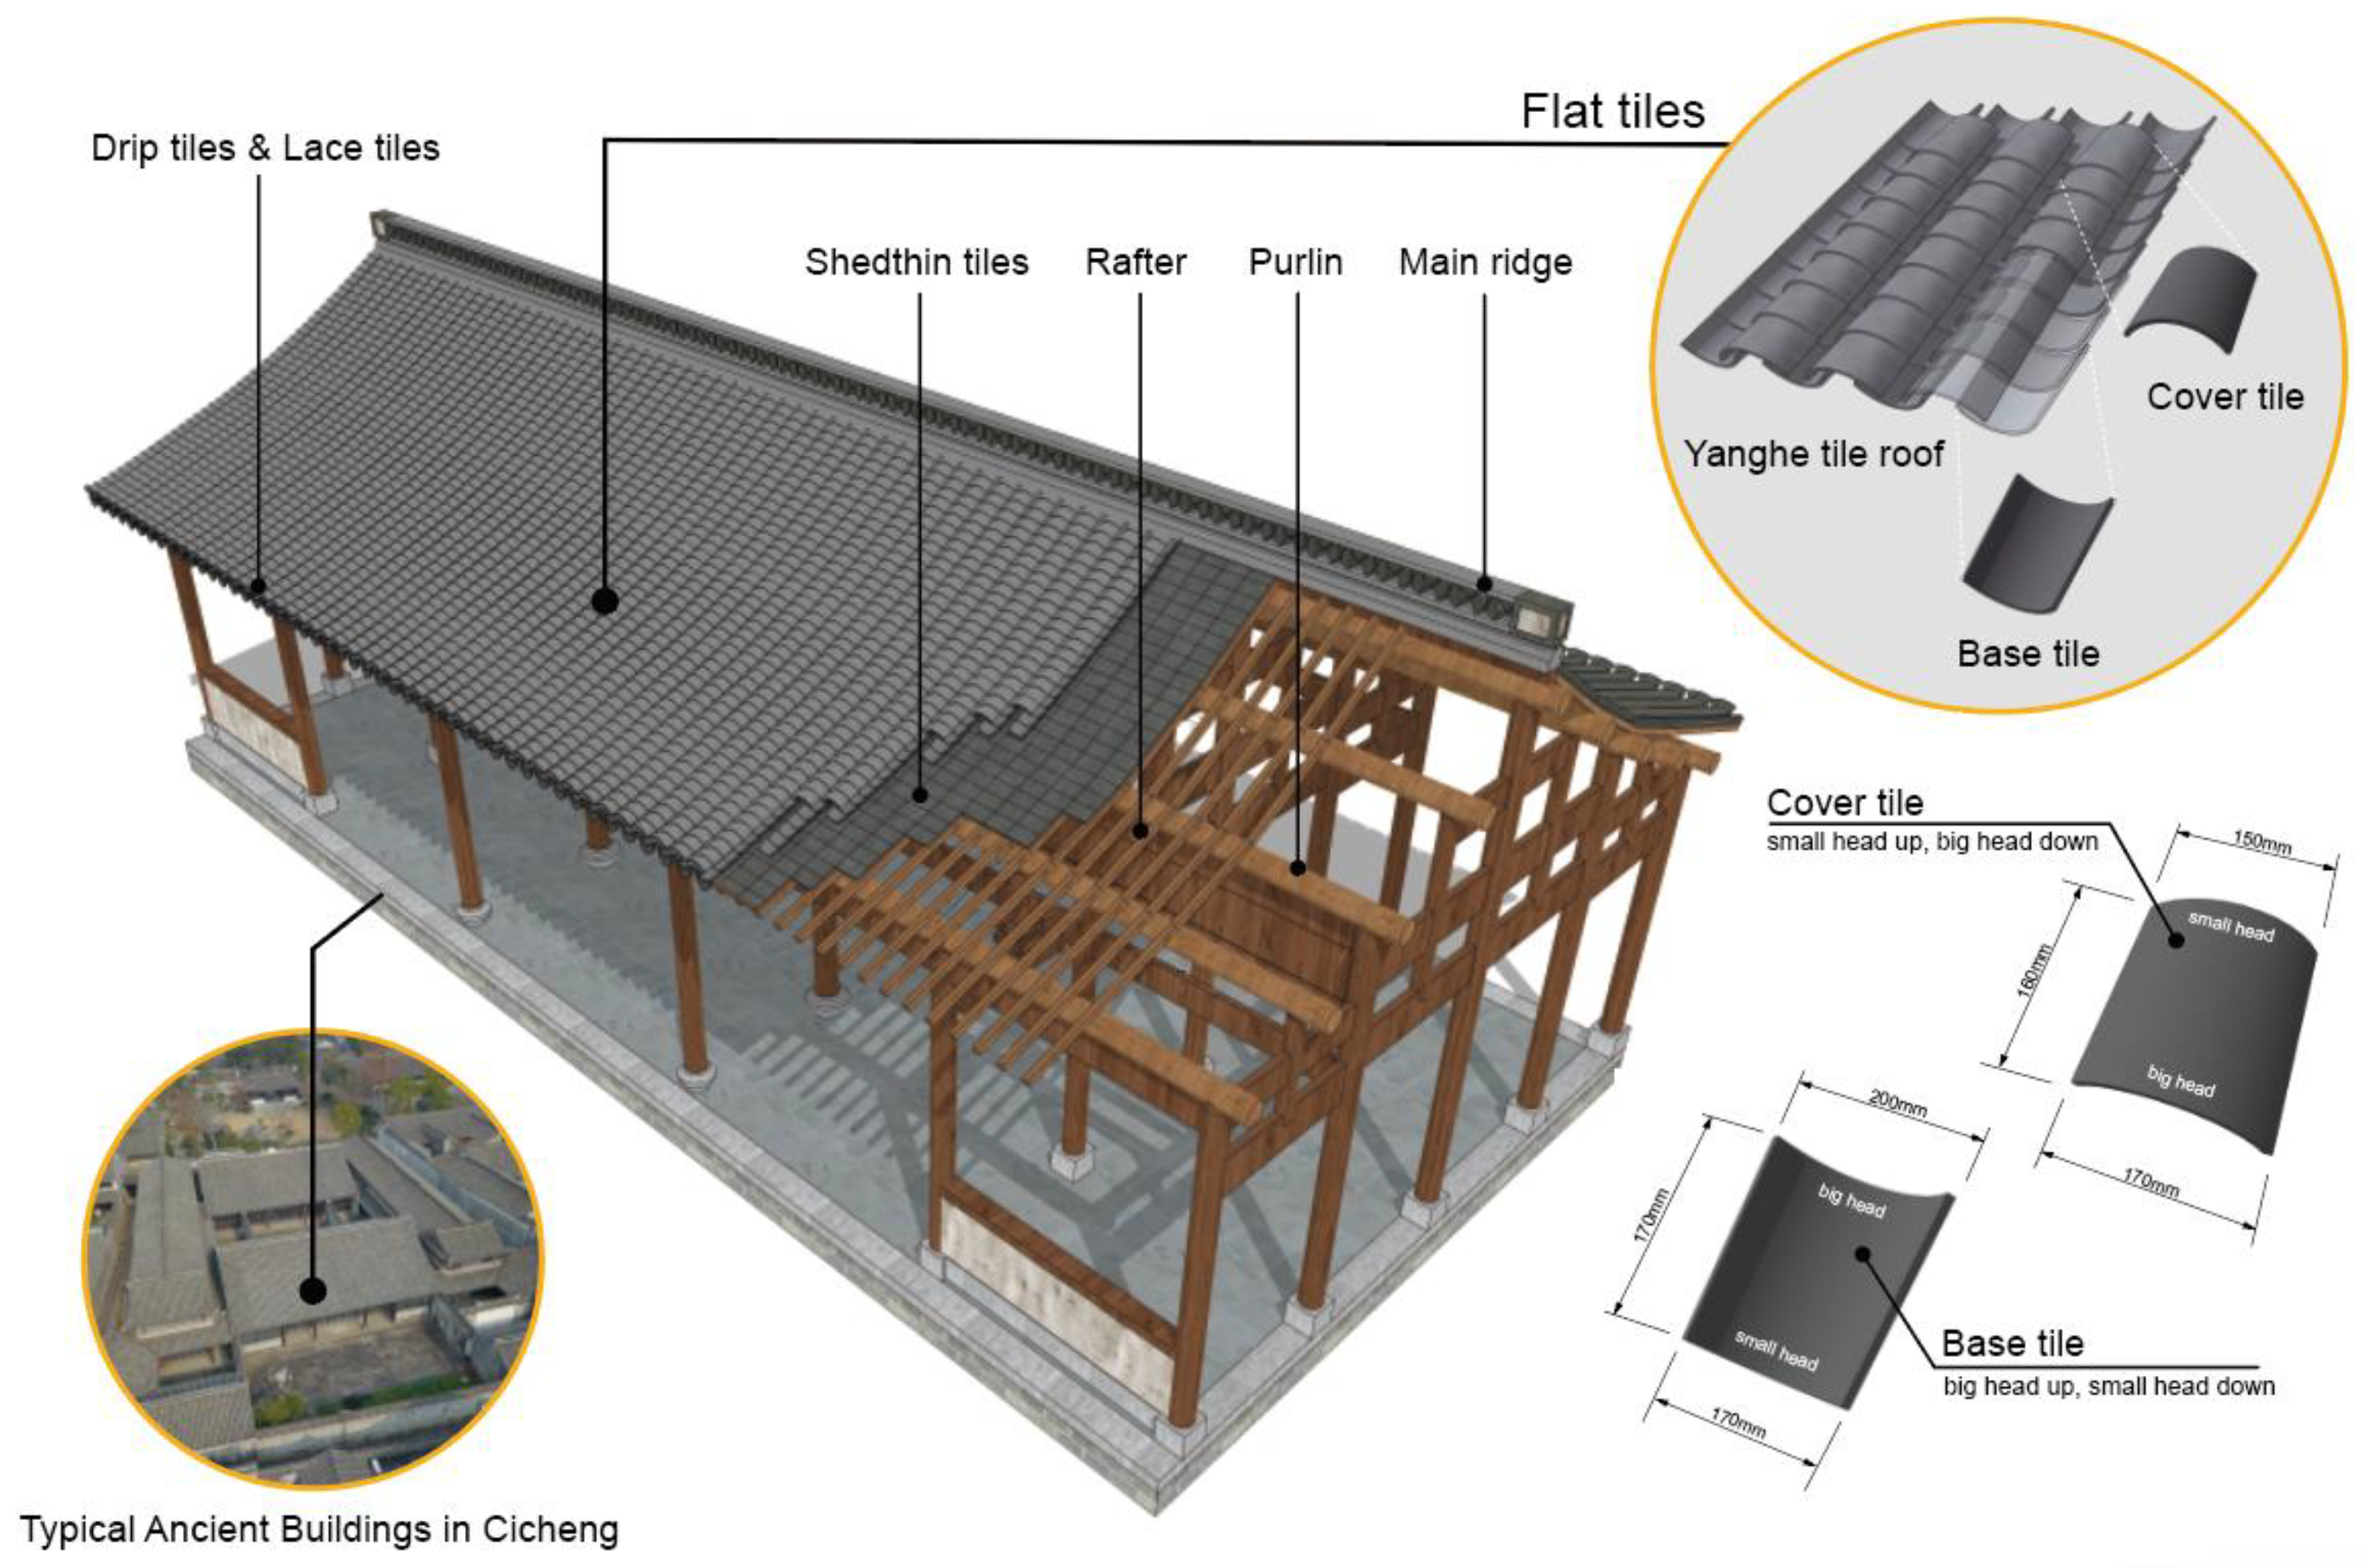
2.1.1. Characteristics of Chinese Flat Tiles

The roof tiles used in this experiment were made by mixing locally sourced clay with water, kneading it into uniformly thick rectangles, and shaping them on the surface of a cylindrical mold (a wooden cylindrical tool). When the clay was half-dry, it was removed from the mold and divided into four pieces. The dried clay was then fired in a kiln. When the temperature inside the kiln reached 1000–1200 °C, water was dripped from the top, maintaining an oxygen-deficient environment inside the kiln for an extended period. This process reduced iron oxide (Fe2O3) to iron (II) oxide (FeO), resulting in the production of blue-gray tiles [9]. Flat tiles are not truly flat but have a certain curvature. They can be laid directly on the rafters of a timber-framed roof, but most historic buildings have a layer of shedthin tiles or shedthin boards between the flat tiles and the rafters, with whitewash fixed between them [9,10]. Flat tiles are divided into base tiles and cover tiles when laying the roof, and their repeated stacking constitutes a Yanghe tile roof [3], which prevents the seepage of rainwater since it can drain water quickly. Commonly used in the Jiangnan area, the specifications of flat tiles are 140–280 mm in length, 150–295 mm in the width of the big head, 130–265 mm in the width of the small head, 8–15 mm in thickness, and 0.3–2.2 kg in weight (Figure 3). The specifications of slate tiles also differ based on the sizes and grades of different buildings [15].

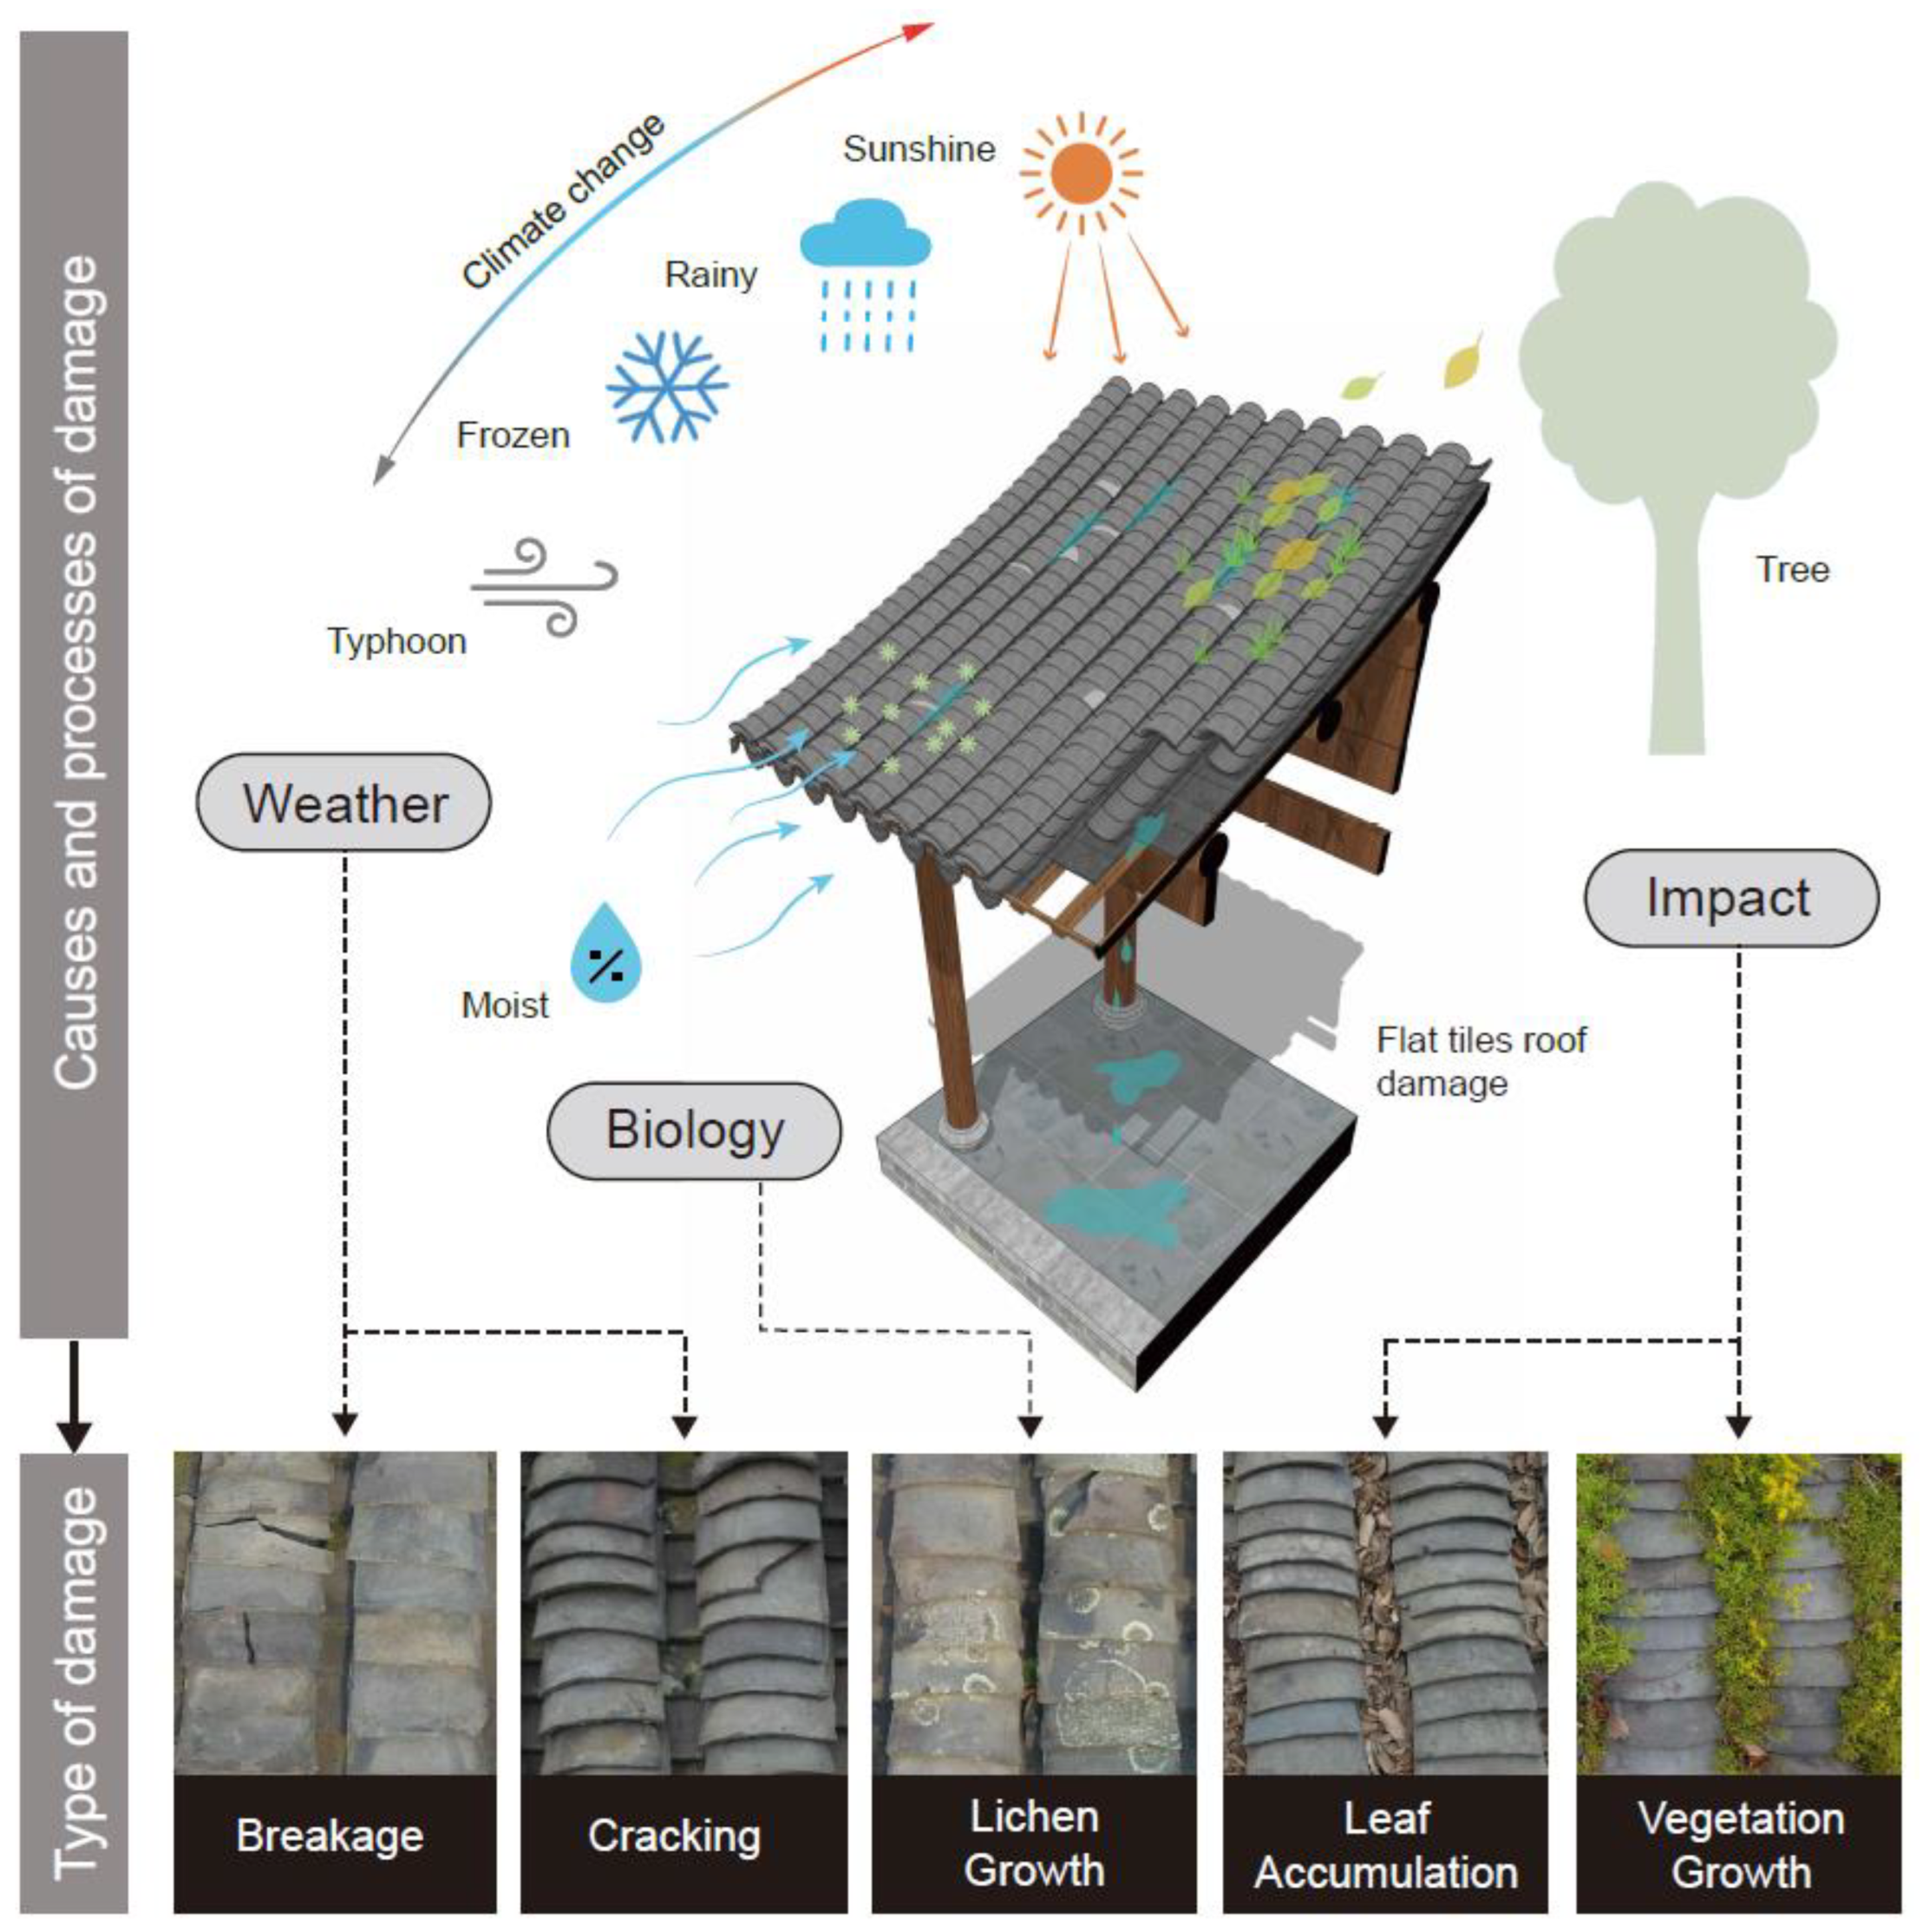
2.1.2. Types and Causative Factors of Damage to Flat Roof Tiles

As the flat tiles on the roof are exposed to the outdoors, they naturally age, making them fragile and vulnerable to cracking. The flat tiles are prone to breakage when subjected to inclement weather or external forces, resulting in the leakage of rainwater. If repairs are not made in a timely manner, they can affect the safety of the overall wooden structure and cause damage to property inside the building (Figure 4). There are three main causes of damage to roof shingles: weather, biology, and impact.
First, the climate affects the service life of flat tiles. The Jiangnan region has four distinct seasons: hot, humid, and rainy summers often characterized by typhoons and cold and rainy winters. Sunshine, temperature, and humidity changes, as well as wind and rain erosion, accelerate the aging, cracking, or even direct cracking of tiles following long-term exposure to the outdoor environment.
In addition, a humid environment is suitable for the growth and reproduction of fungi, especially mildews and other lower plants. Acidolysis and complexation by microorganisms cause serious biological weathering and accelerate damage to flat tiles [43].
Finally, flat tiles covering the roofs are also susceptible to impacts from external forces. Due to the limited strength of tiles, the impact of broken branches of large trees growing on the sides of buildings falling on the flat tiles can result in their breakage. Animal activity on the roof, such as that of cats and birds, can also increase the chances of shingle breakage.
Based on these three main reasons, the researchers summarized five common types of damage: cracking, breakage, lichen growth, leaf accumulation, and vegetation growth (Figure 5).
(1)
Cracking: Flat tiles have a certain strength; however, long-term exposure to solar radiation, dry and wet cycles, and freeze–thaw cycles makes them susceptible to weathering. Weathering damage generally develops from the surface to the interior, and cracks naturally appear in aged shingles or easily develop under the action of external forces. Rainwater can seep into the cracks and remain there for long periods, causing the shingles to become weaker.
(2)
Breakage: If cracked tiles are not repaired, they may break under natural aggression or external forces. Larger broken sections will not be able to serve as a roof barrier, and rainwater will leak into the shedthin tiles or shedthin boards covering the underside of the flat tiles or, in severe cases, into the roof rafters or directly leak into the interior.
(3)
Lichen Growth: A lichen is a composite organism formed by the symbiotic association of algae or cyanobacteria with filaments of various fungal species. The clay material making up the flat tiles, combined with the moist environment, facilitates the growth of lichens on the tile surfaces. Lichens are symbiotic complexes of algae and fungi whose root systems can penetrate the building material, leading to the deterioration of the tiles. Lichens can also reduce the water resistance of flat tiles, widen cracks, and increase the risk of water leakage. They also affect the esthetics of ancient buildings.
(4)
Leaf Accumulation: The construction of ancient Chinese buildings emphasized integration with nature, and tall trees were often planted on the sides of the buildings. Leaves from the trees fall directly onto or are blown by the wind onto the roof; if these are not cleaned up in time, large quantities of leaves will block the drain of the base tiles, preventing the quick drainage of rainwater and causing the roof to be in a long-term wet state, thus increasing the load bearing capacity of the tiles and making them prone to breakage.
(5)
Vegetation Growth: The long-term accumulation of fallen leaves provides soil and nutrients for seed growth, which, together with good exposure to sunlight, makes it easy for a large number of succulent plants or small tares to grow. The growth of plants will accelerate the breakage of tiles, and the increased weight of the roof due to the growing plants will deform the roof structure, thus affecting the safety of the whole ancient building.
Based on the samples collected during the fieldwork, the flat tile roofs on the heritage buildings in Cicheng Old Town have different degrees of damage. To effectively deal with these damages, the first step should be to strengthen the routine maintenance and inspection of the roofs and repair or replace them as soon as cracks or signs of deterioration are detected. Therefore, this study employs an artificial intelligence approach to the rapid detection of real-time damage to roof tiles to improve the intelligence of building inspection and the sustainability of heritage conservation.

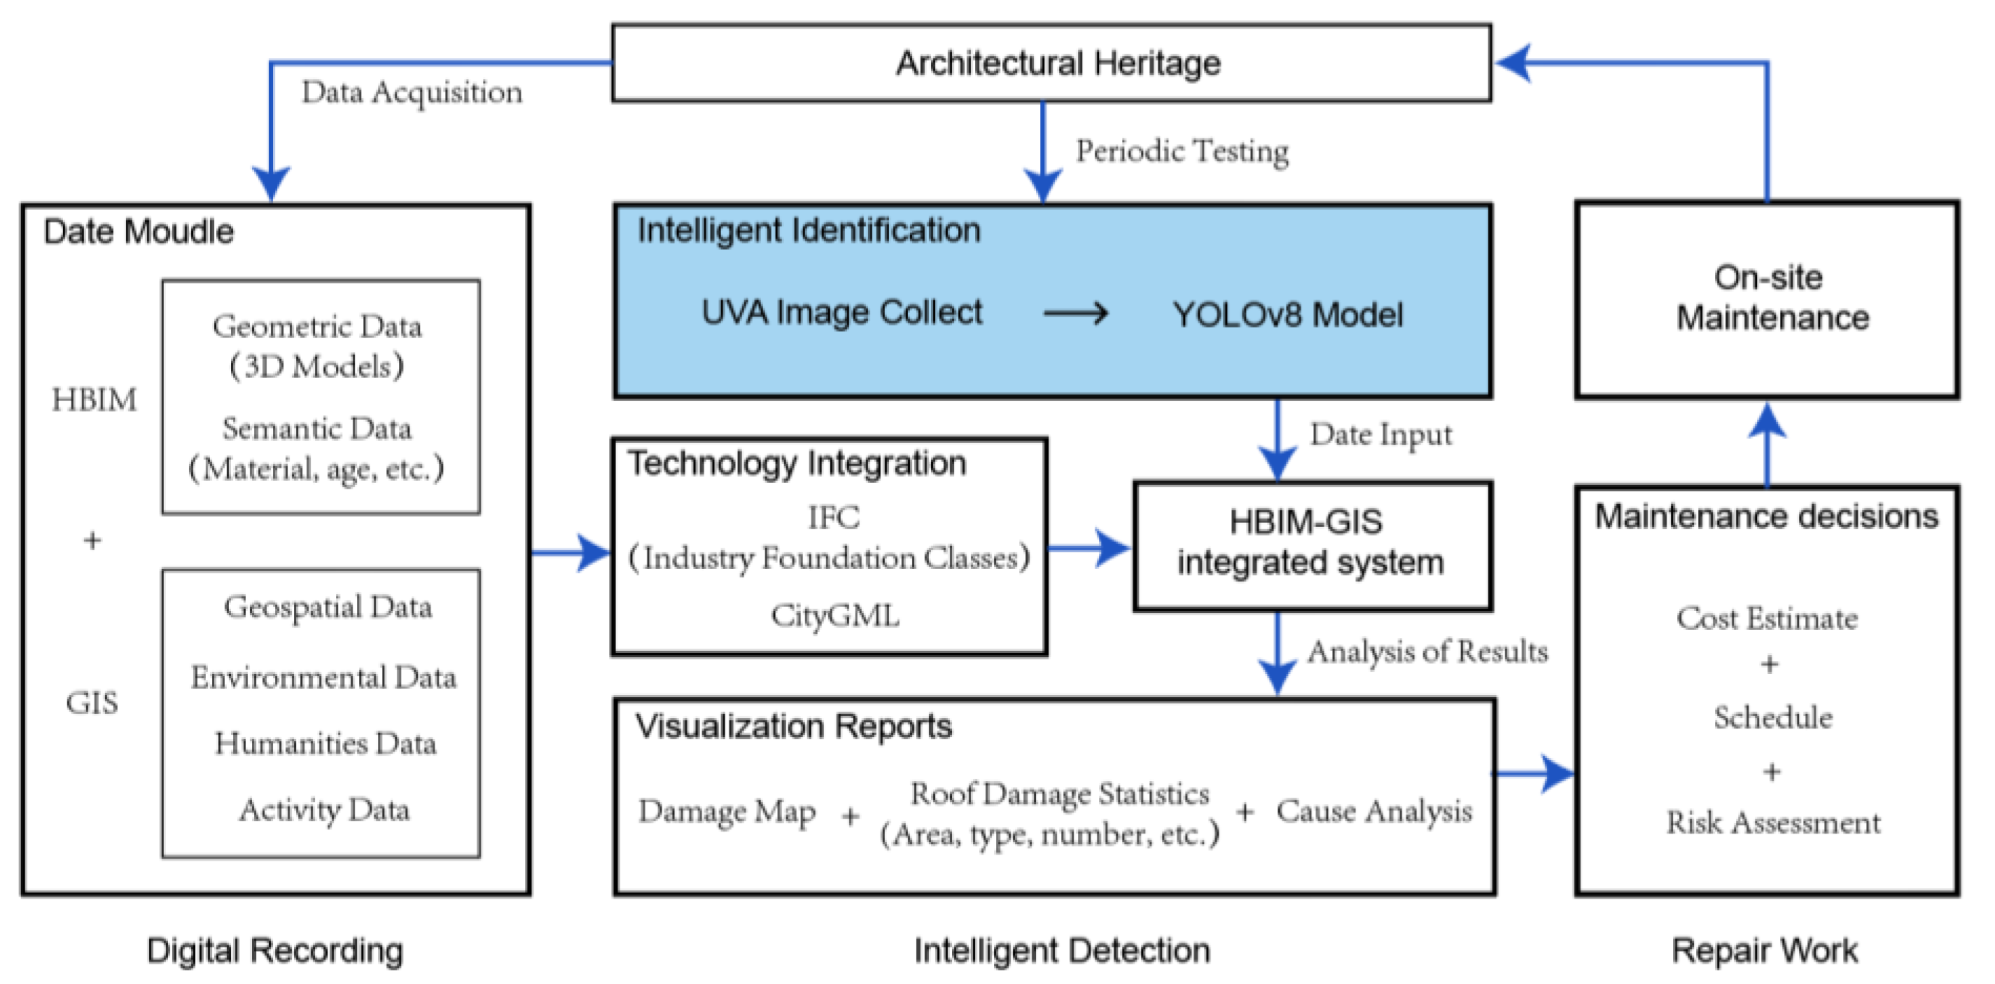
2.2. Research Process

Through combining machine learning with the actual needs of ancient building protection, this study aims to construct a model that can accurately and quickly detect damage to roof flat tiles and utilize this model as part of an intelligent management platform for the heritage building complex, providing scientific and technological support for the long-term protection of architectural heritage in the Jiangnan region. Following a series of steps, from on-site data collection to scenario application, the accuracy and application value of machine learning in the detection of flat tile roofing of traditional buildings in the Jiangnan region are systematically explored (Figure 6).
(1)
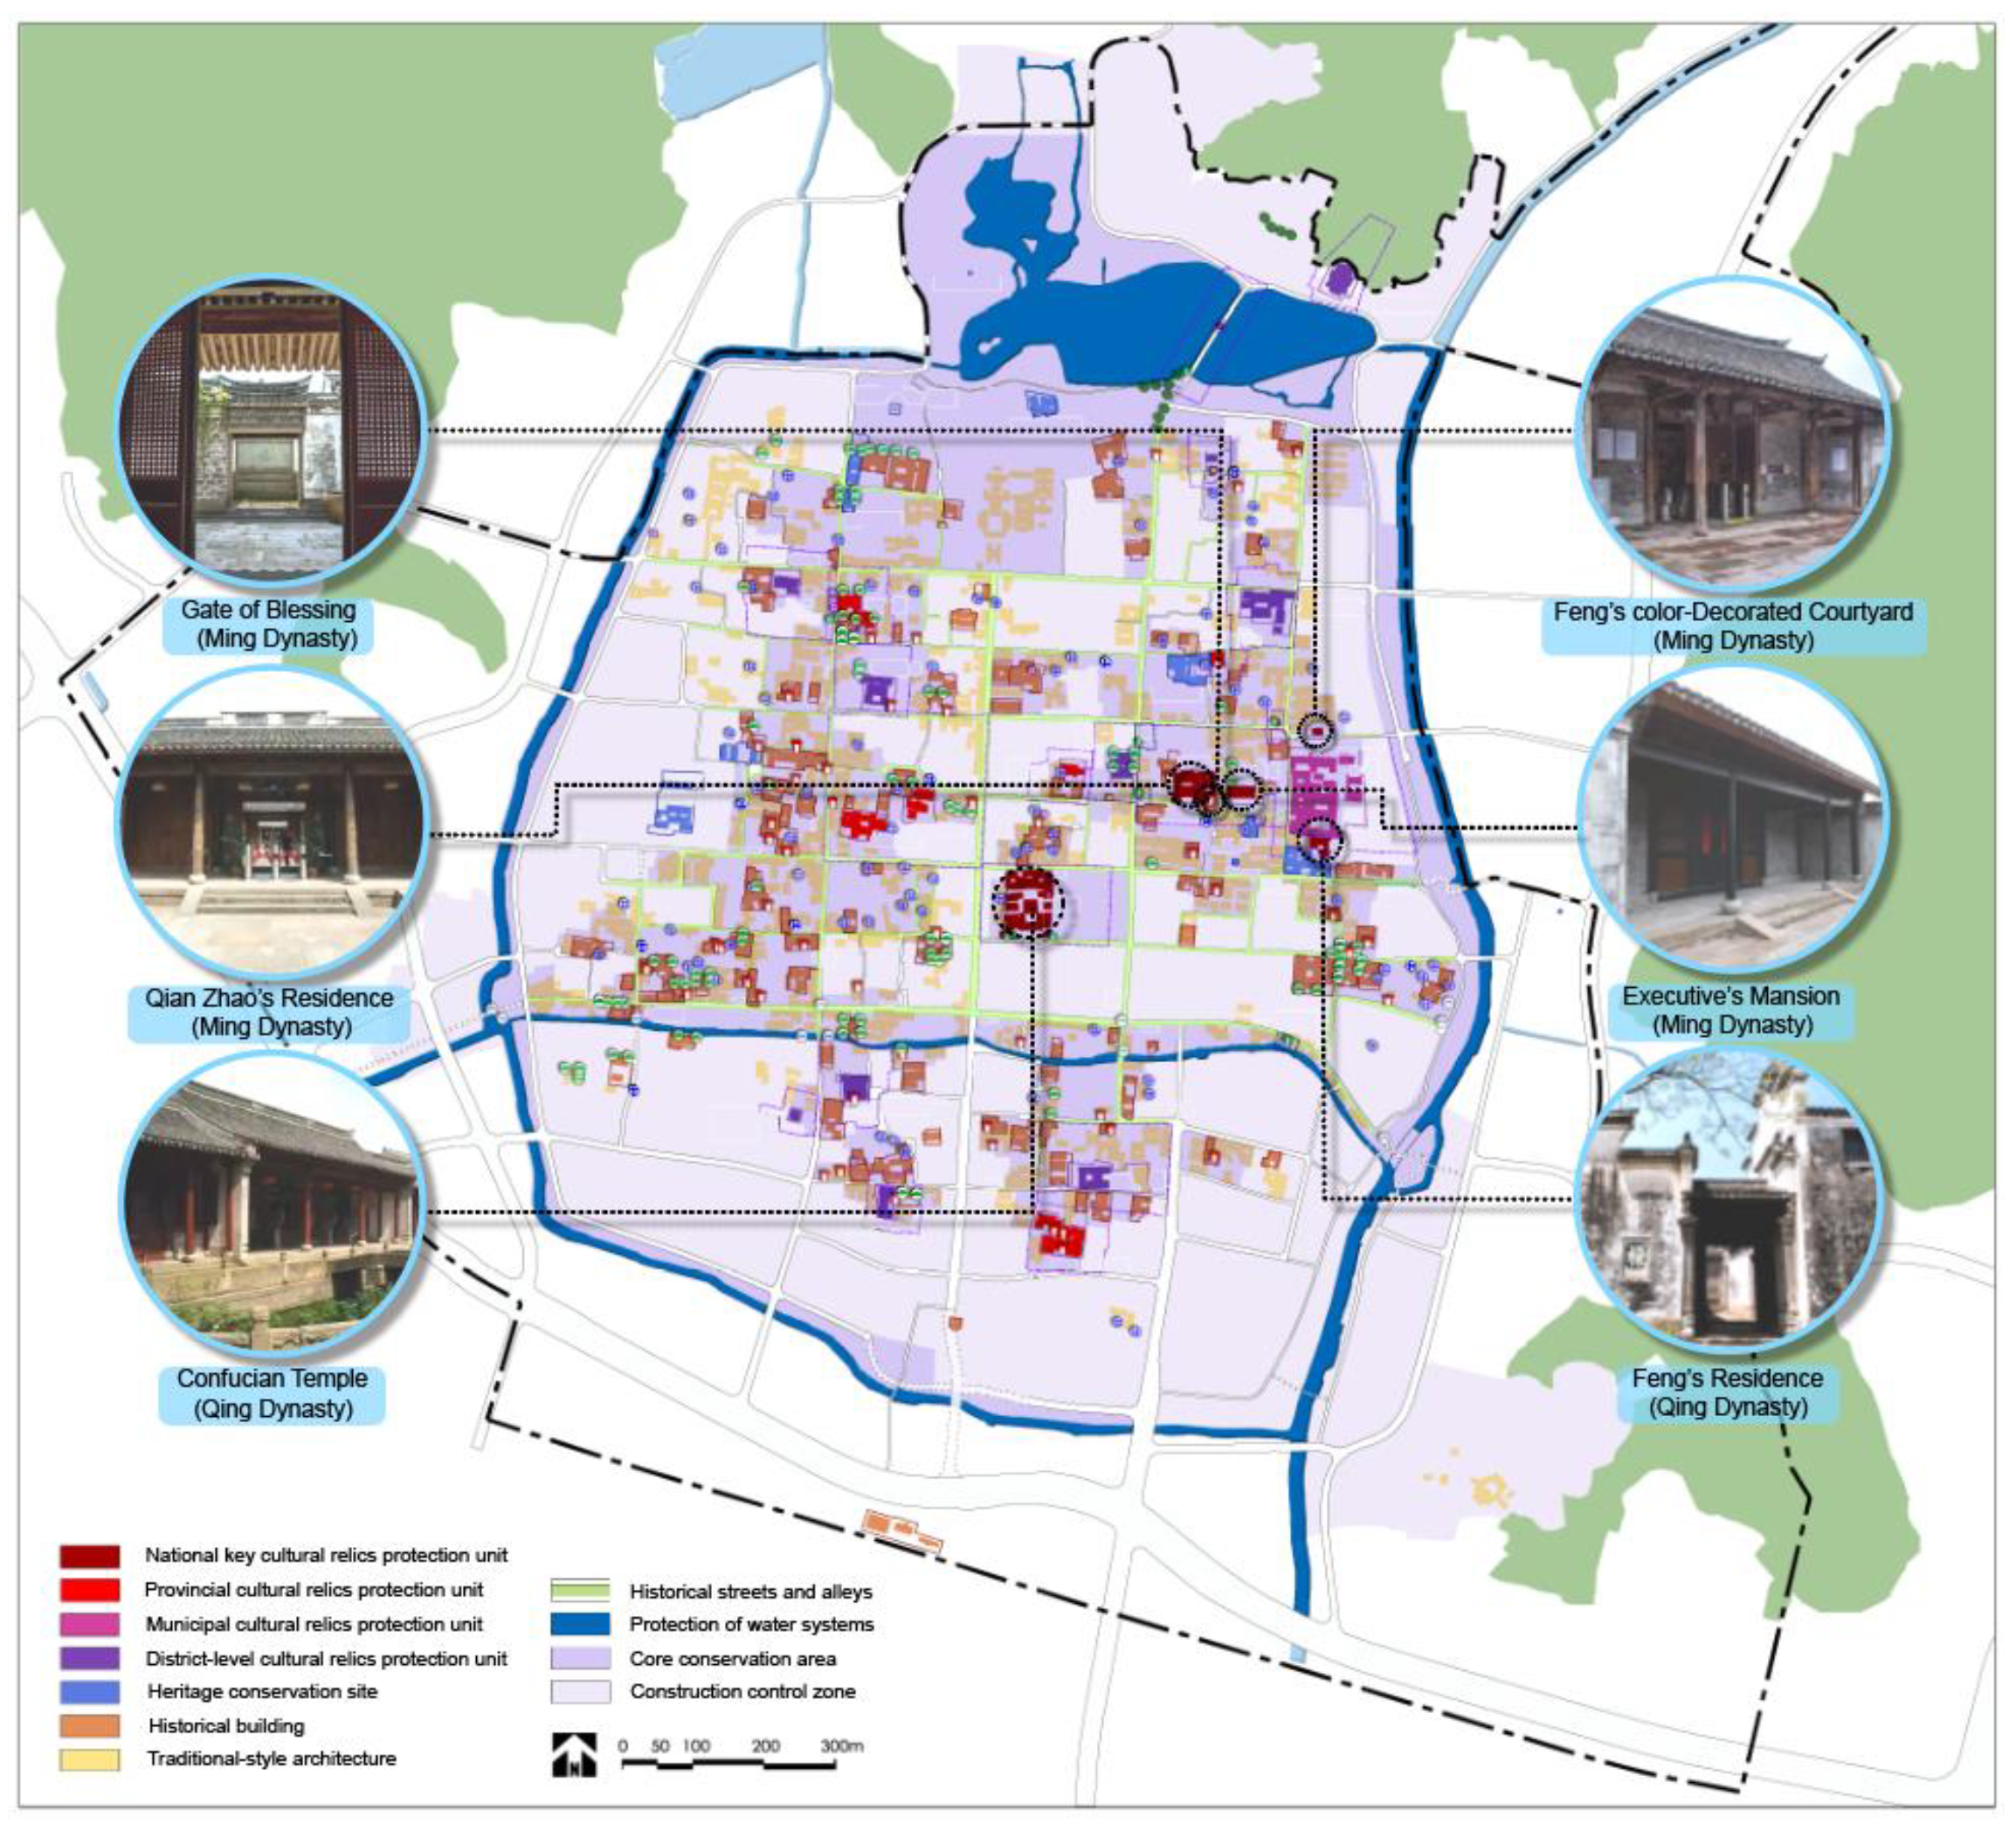
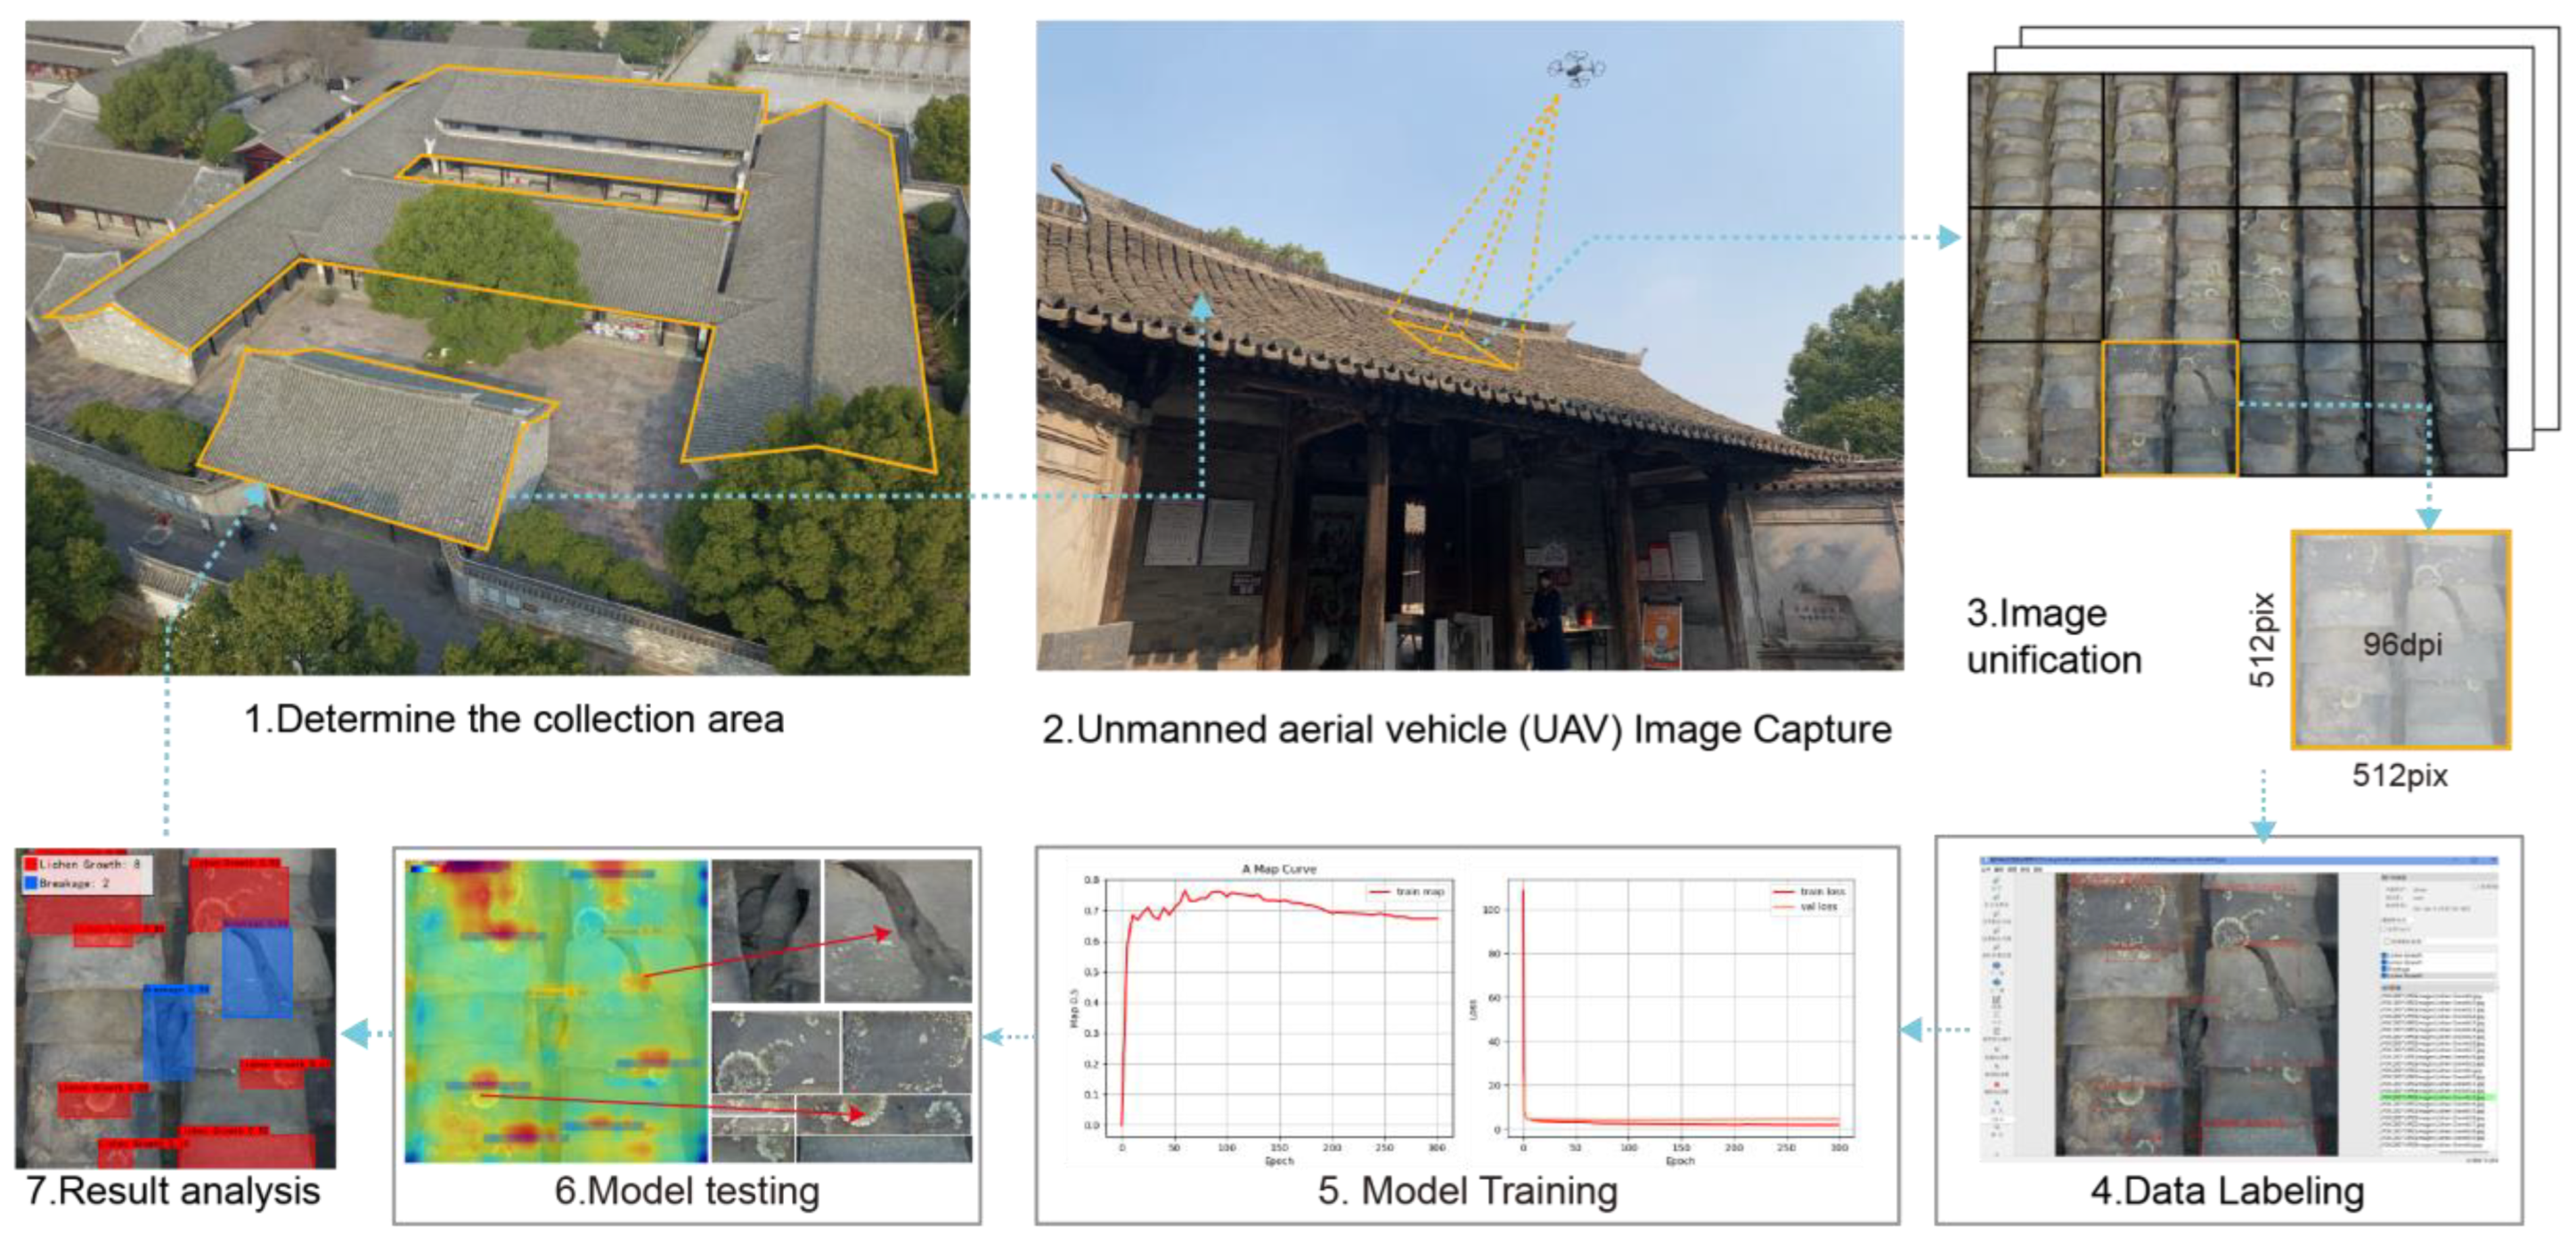
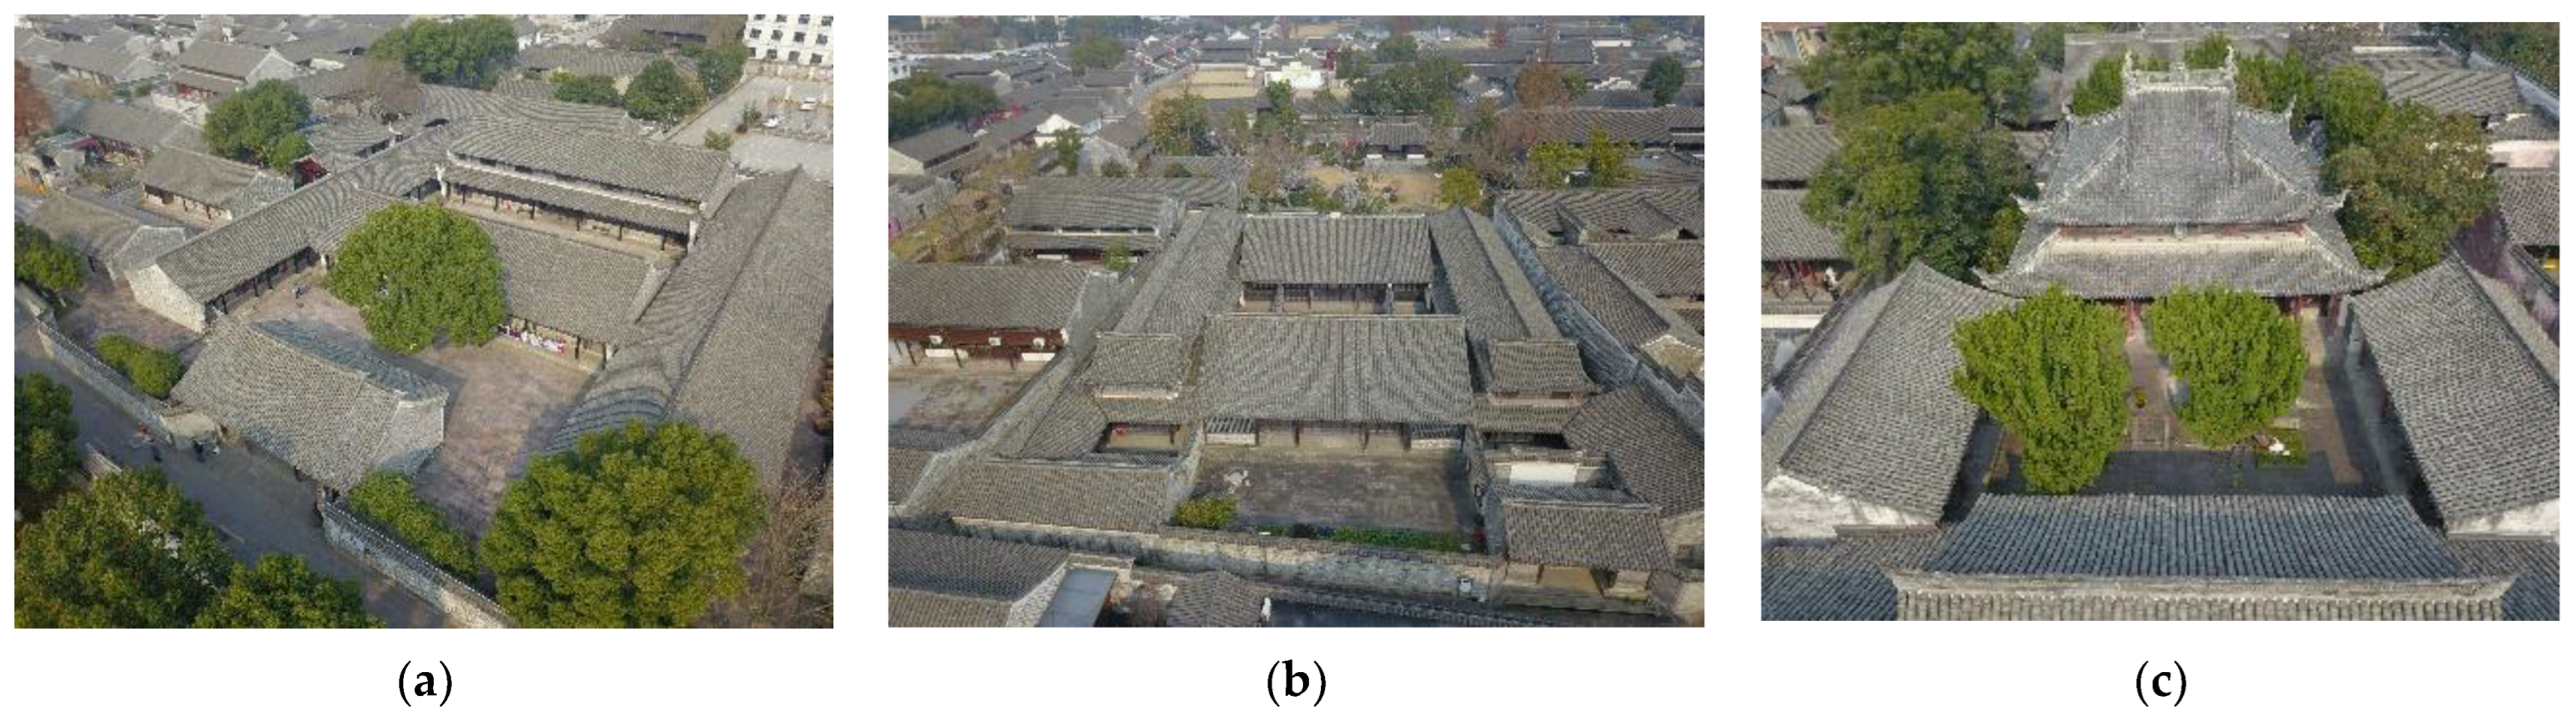
Determination of the collection area. The samples used in this study were collected from the buildings in Feng’s Color Decorated Courtyard, Qian Zhao’s Residence, and Confucian Temple in Cicheng Old Town (Figure 7). These three buildings are all National Key Cultural Relic Protection units, and the roofing materials on these buildings are typical representatives of roofing in the Jiangnan region.
(2)
Drone aerial image acquisition. To establish an effective model for identifying the types of damage to flat tile roofs, the diversity and representativeness of the data are directly correlated with the stability and generalization of the model. The research team collected field data on 19 December 2024 and 26 December 2024. During the fieldwork, the roofs were photographed in flight using a DJI drone (Mavic 3E, Shenzhen Dajiang Innovation Technology Co., Ltd., Shenzhen, China); the drone was flown 2–5 m above the roofs to obtain high-quality tile surface image data. Sample collection sites were chosen on the roofs of buildings with obvious damage features and good lighting to ensure the clarity of the photographs. A total of 412 sample photos were taken of the site, and 351 flat tile roof images were obtained after screening the samples for machine learning training. The collected data reflected the characteristics of various damage types, including 87 images of breakage, 87 images of cracking, 89 images of leaf accumulation, and 88 images of lichen growth. The diversity of the data comes not only from the differences in tile damage types but also from the multiple dimensions of damage severity, size, shape, and color.
(3)
Data unification. A series of image preprocessing methods was used in the data processing stage to optimize image quality and ensure consistency of data input, thereby improving model training. These include histogram equalization and noise filtering techniques. The purpose of this step is to eliminate the influence of environmental factors such as light and shadow, reduce random noise, and improve the clarity of damaged features in the image. Additionally, this study performed image size standardization to ensure that all images fed into the YOLOv8 model had the same resolution and dimensions. Image size standardization involved adjusting all images to a unified 512 × 512-pixel resolution, 96 dpi (dots per inch) for both horizontal and vertical resolutions, and 24 bits for depth. This goal was achieved by combining resizing and mosaicking, in which an overlapping strategy was used in the mosaicking process to ensure that complete thin-sheet features existed in at least one image. This step ensures the stability of model training and reduces the computational complexity caused by inconsistent image sizes and scales. Finally, during the training stage of the model, codes for data augmentation operations such as rotating and flipping images were added to expand the diversity of the dataset and enhance the versatility and robustness of the model.
(4)
Data labeling. To ensure that the YOLOv8 model can accurately identify the type of damage and spatial location of roof tiles, the research team performed high-quality manual annotation work on all collected images. The open-source image annotation tool LabelImg (https://github.com/HumanSignal/labelImg, accessed on 16 January 2025) was used for the annotation process to clarify the boundaries and attributes of each type of damaged area by drawing precise bounding boxes in the image. During the annotation process, each type of tile surface damage (such as fracture, crack, leaf accumulation, or lichen growth) was assigned a unique category code and was strictly boxed and named according to the category definition to establish a clear image and label mapping relationship. To further improve the data quality and the transferability of the model, the annotation work was reviewed and calibrated twice after the first draft was completed. The first round of annotations was completed by the first author of this study; she also verified the content of her work. In the second round, the second author of this study conducted a final review of the key samples to minimize human errors and ensure the accuracy of the annotation labels in terms of semantics and shape boundaries.
(5)
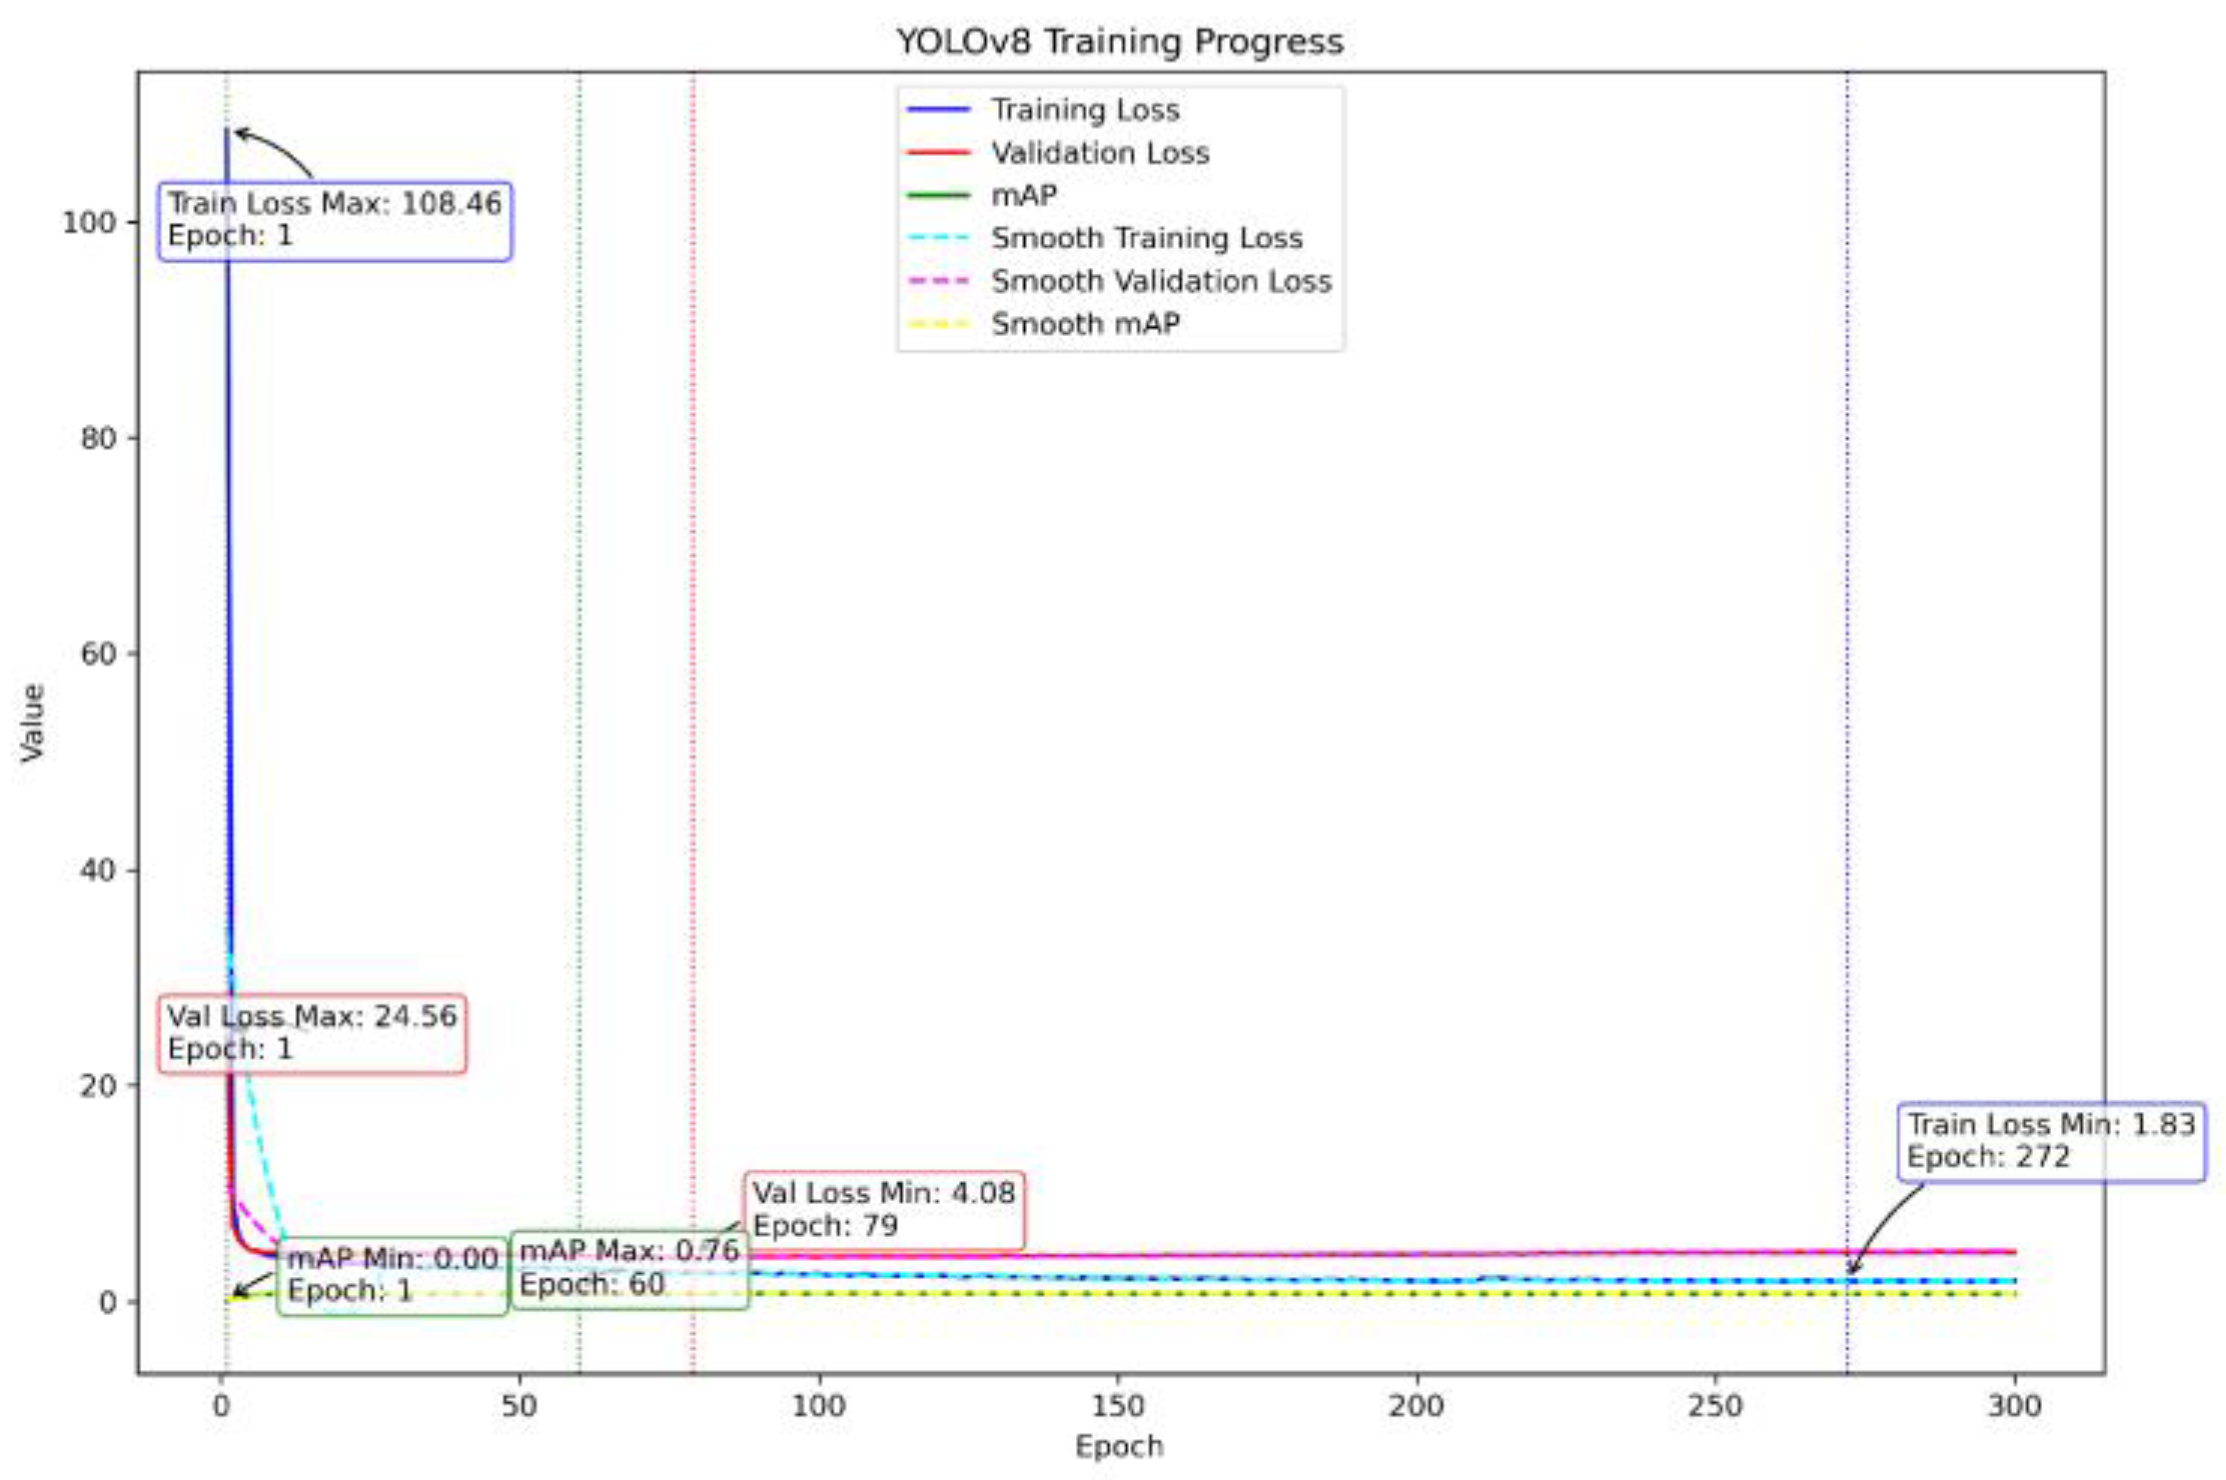
YOLOv8 model training. After the image data were labeled, the research team systematically trained the task of identifying roof tile damage based on the YOLOv8 model architecture. As an advanced single-stage model in the field of target detection, YOLOv8 has both accuracy and speed advantages, and its stability has been verified in multiple scenarios. This study first loaded the pre-trained YOLOv8 model as the basis and adopted a frozen training strategy at the beginning of training to retain the existing general feature extraction capabilities of the backbone. In the first 50 training epochs, only the head was trained, and some parameters of the backbone were kept constant to prevent the model from overfitting small sample data in the initial stage. Starting from the 51st epoch, we began full training by gradually allowing all model parameters to be adjusted, and we continued this training until the 300th epoch to thoroughly investigate how deep features and boundary features relate to different categories. During the training process, the input image was uniformly adjusted to a fixed size of 512 × 512 pixels. The SGD optimizer was used during the training process. The initial learning rate was set to 0.01, and the minimum learning rate was set to 0.0001. Cosine decay was introduced to adjust the learning rate dynamically to achieve smooth convergence. The momentum parameter was set to 0.937, the batch size in the freezing phase to 4, and the batch size in the thawing phase was adjusted to 2 to adapt to the training memory load. The training set contained 351 annotated images, while the number of validation sets was 40.
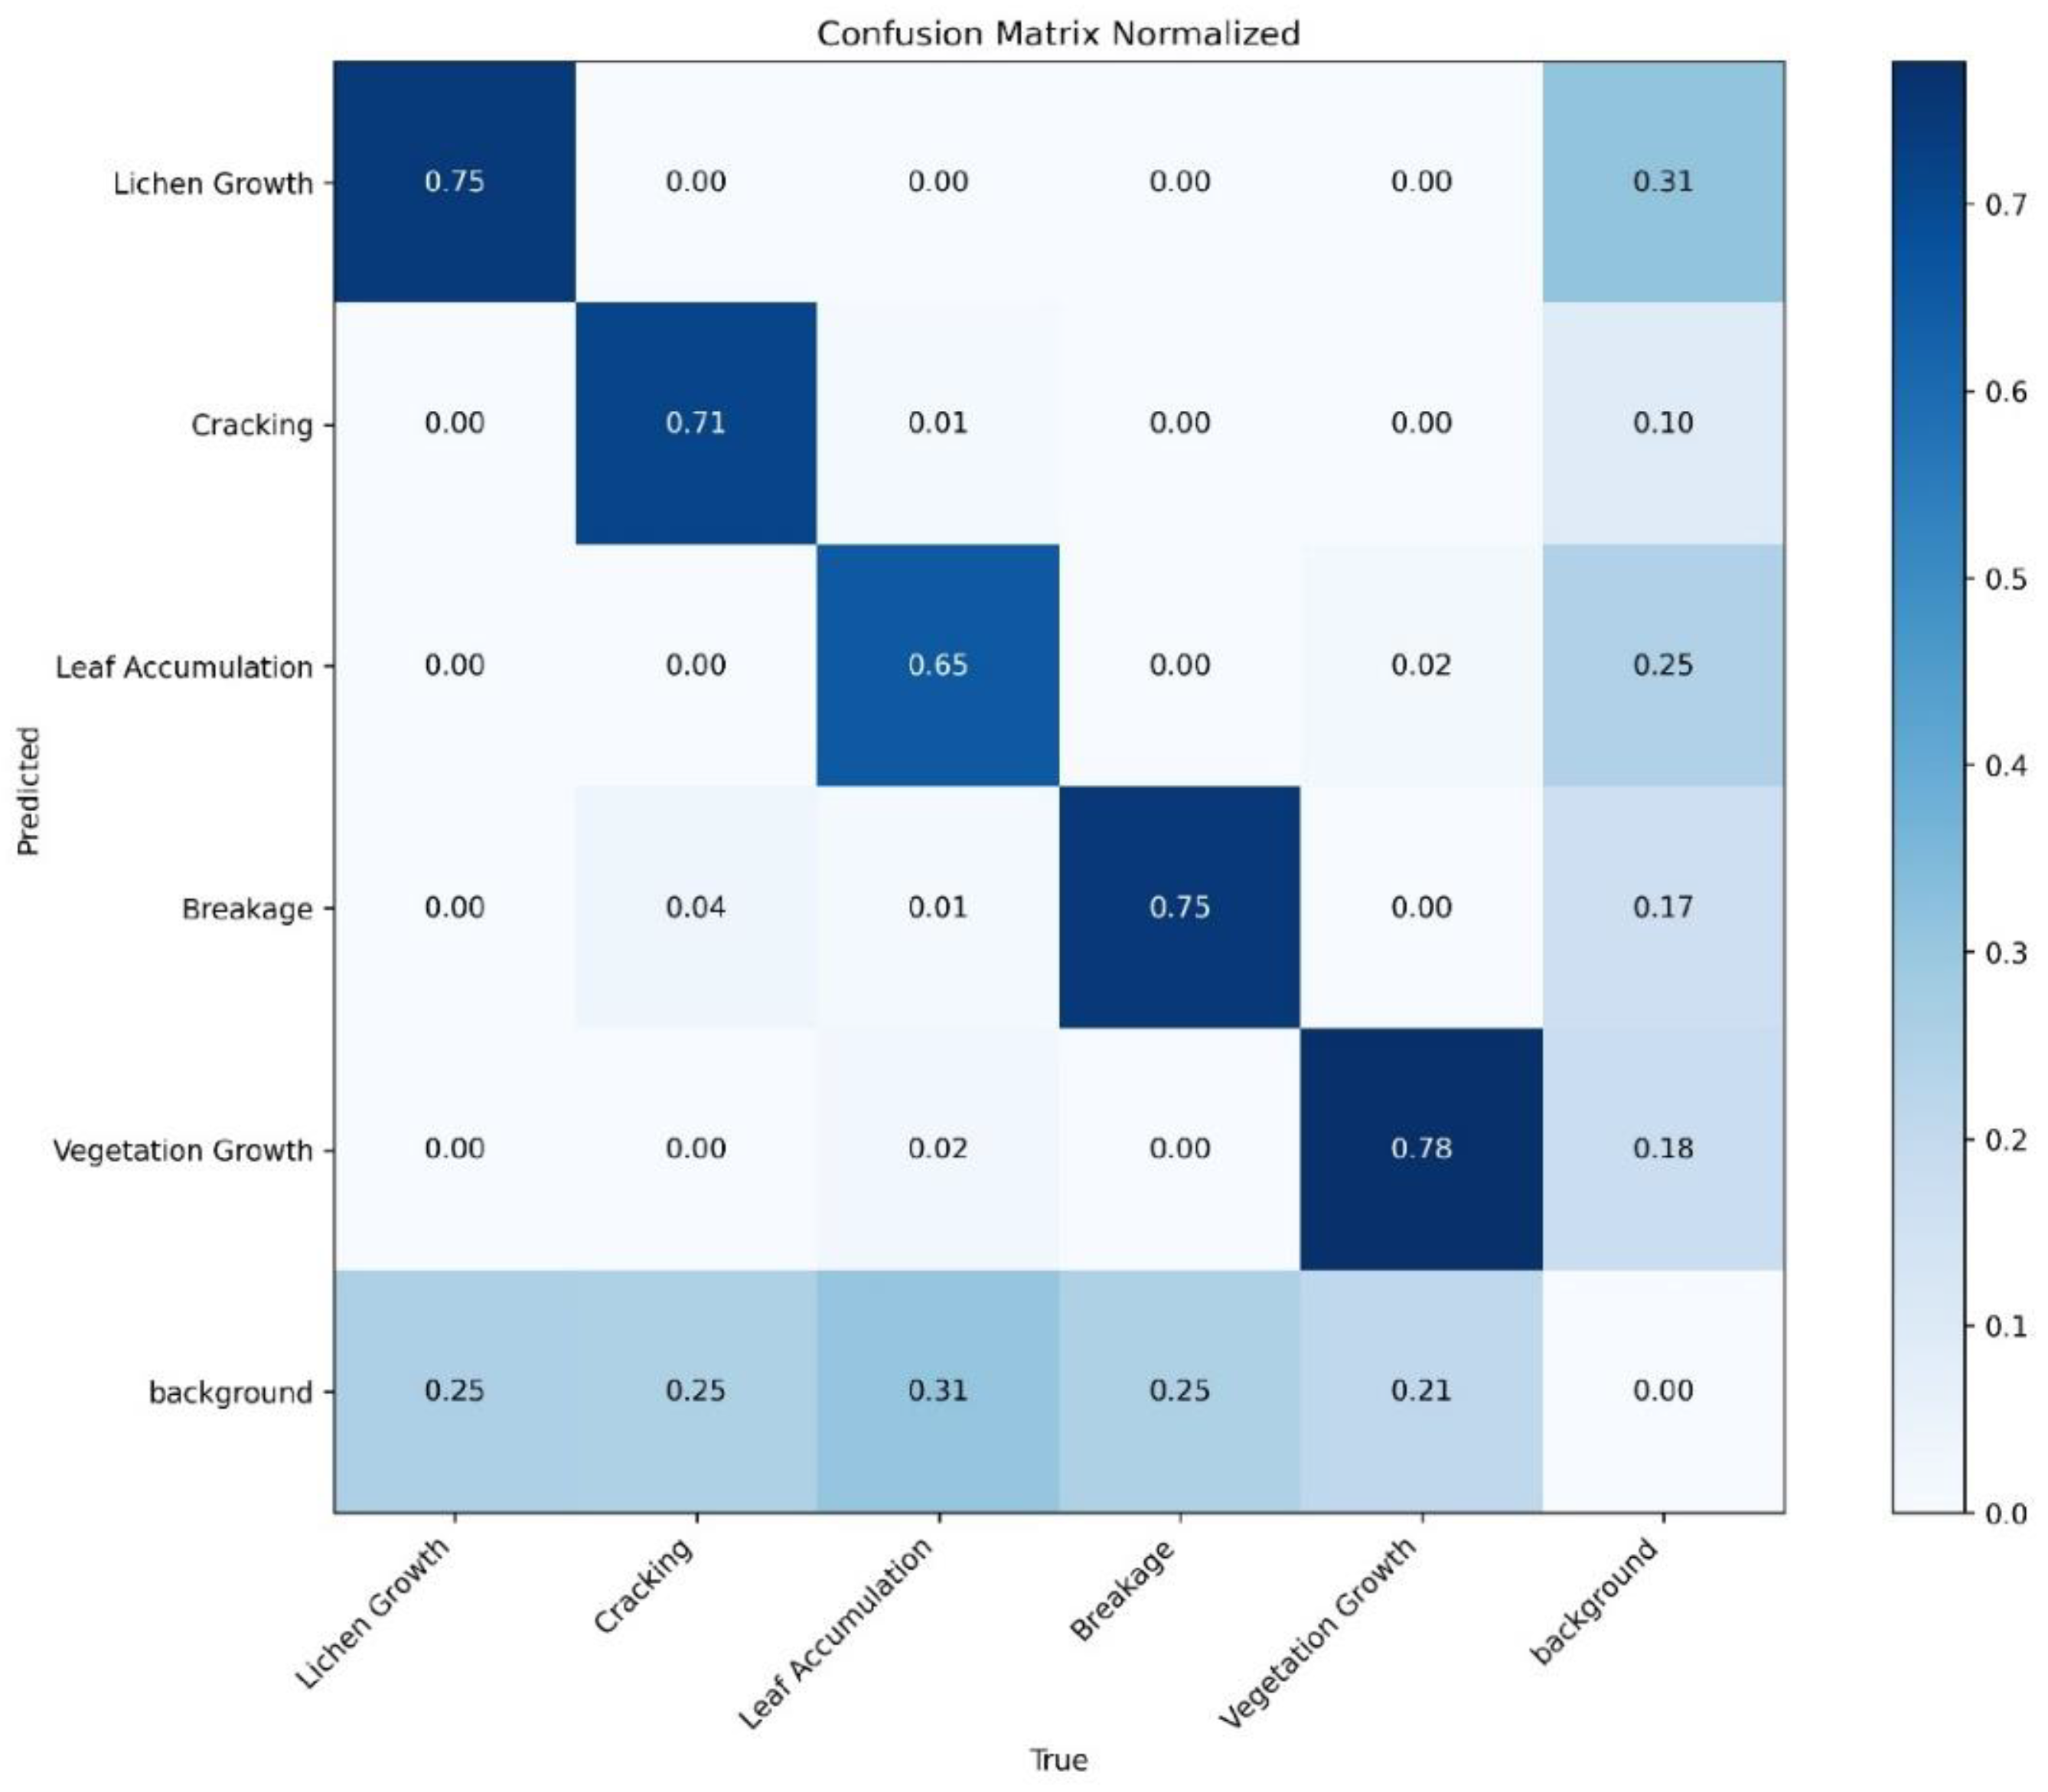
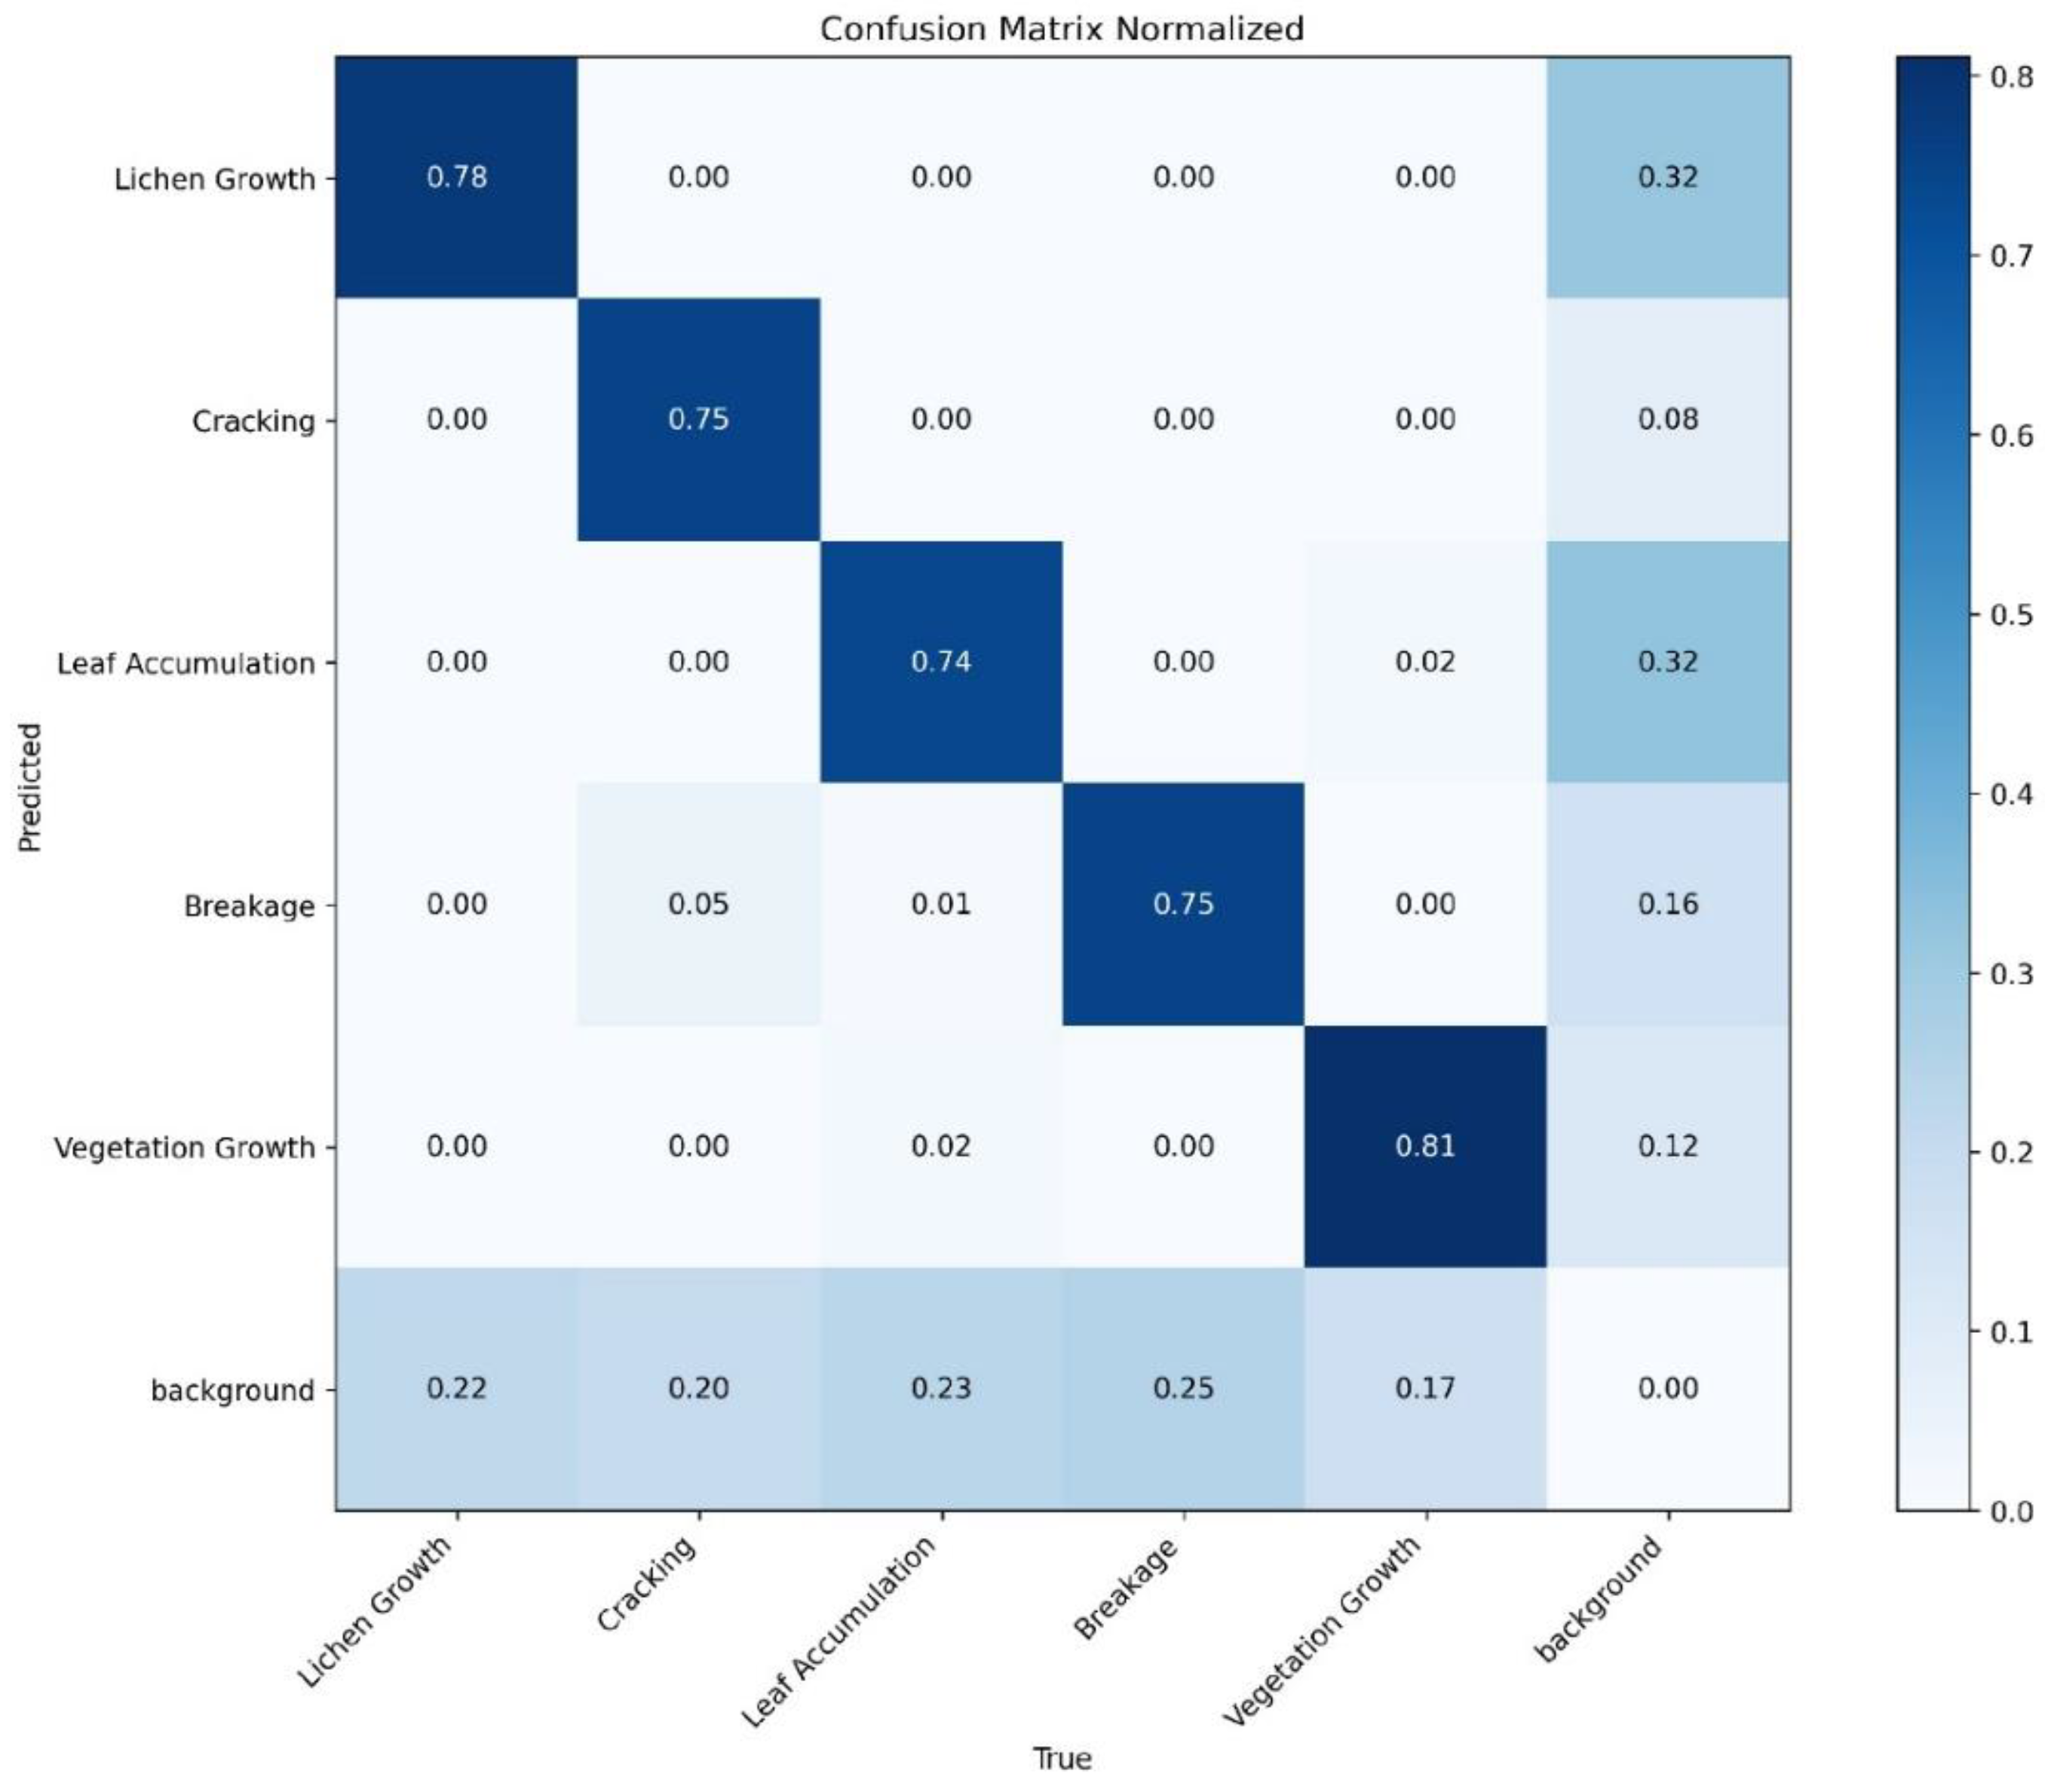
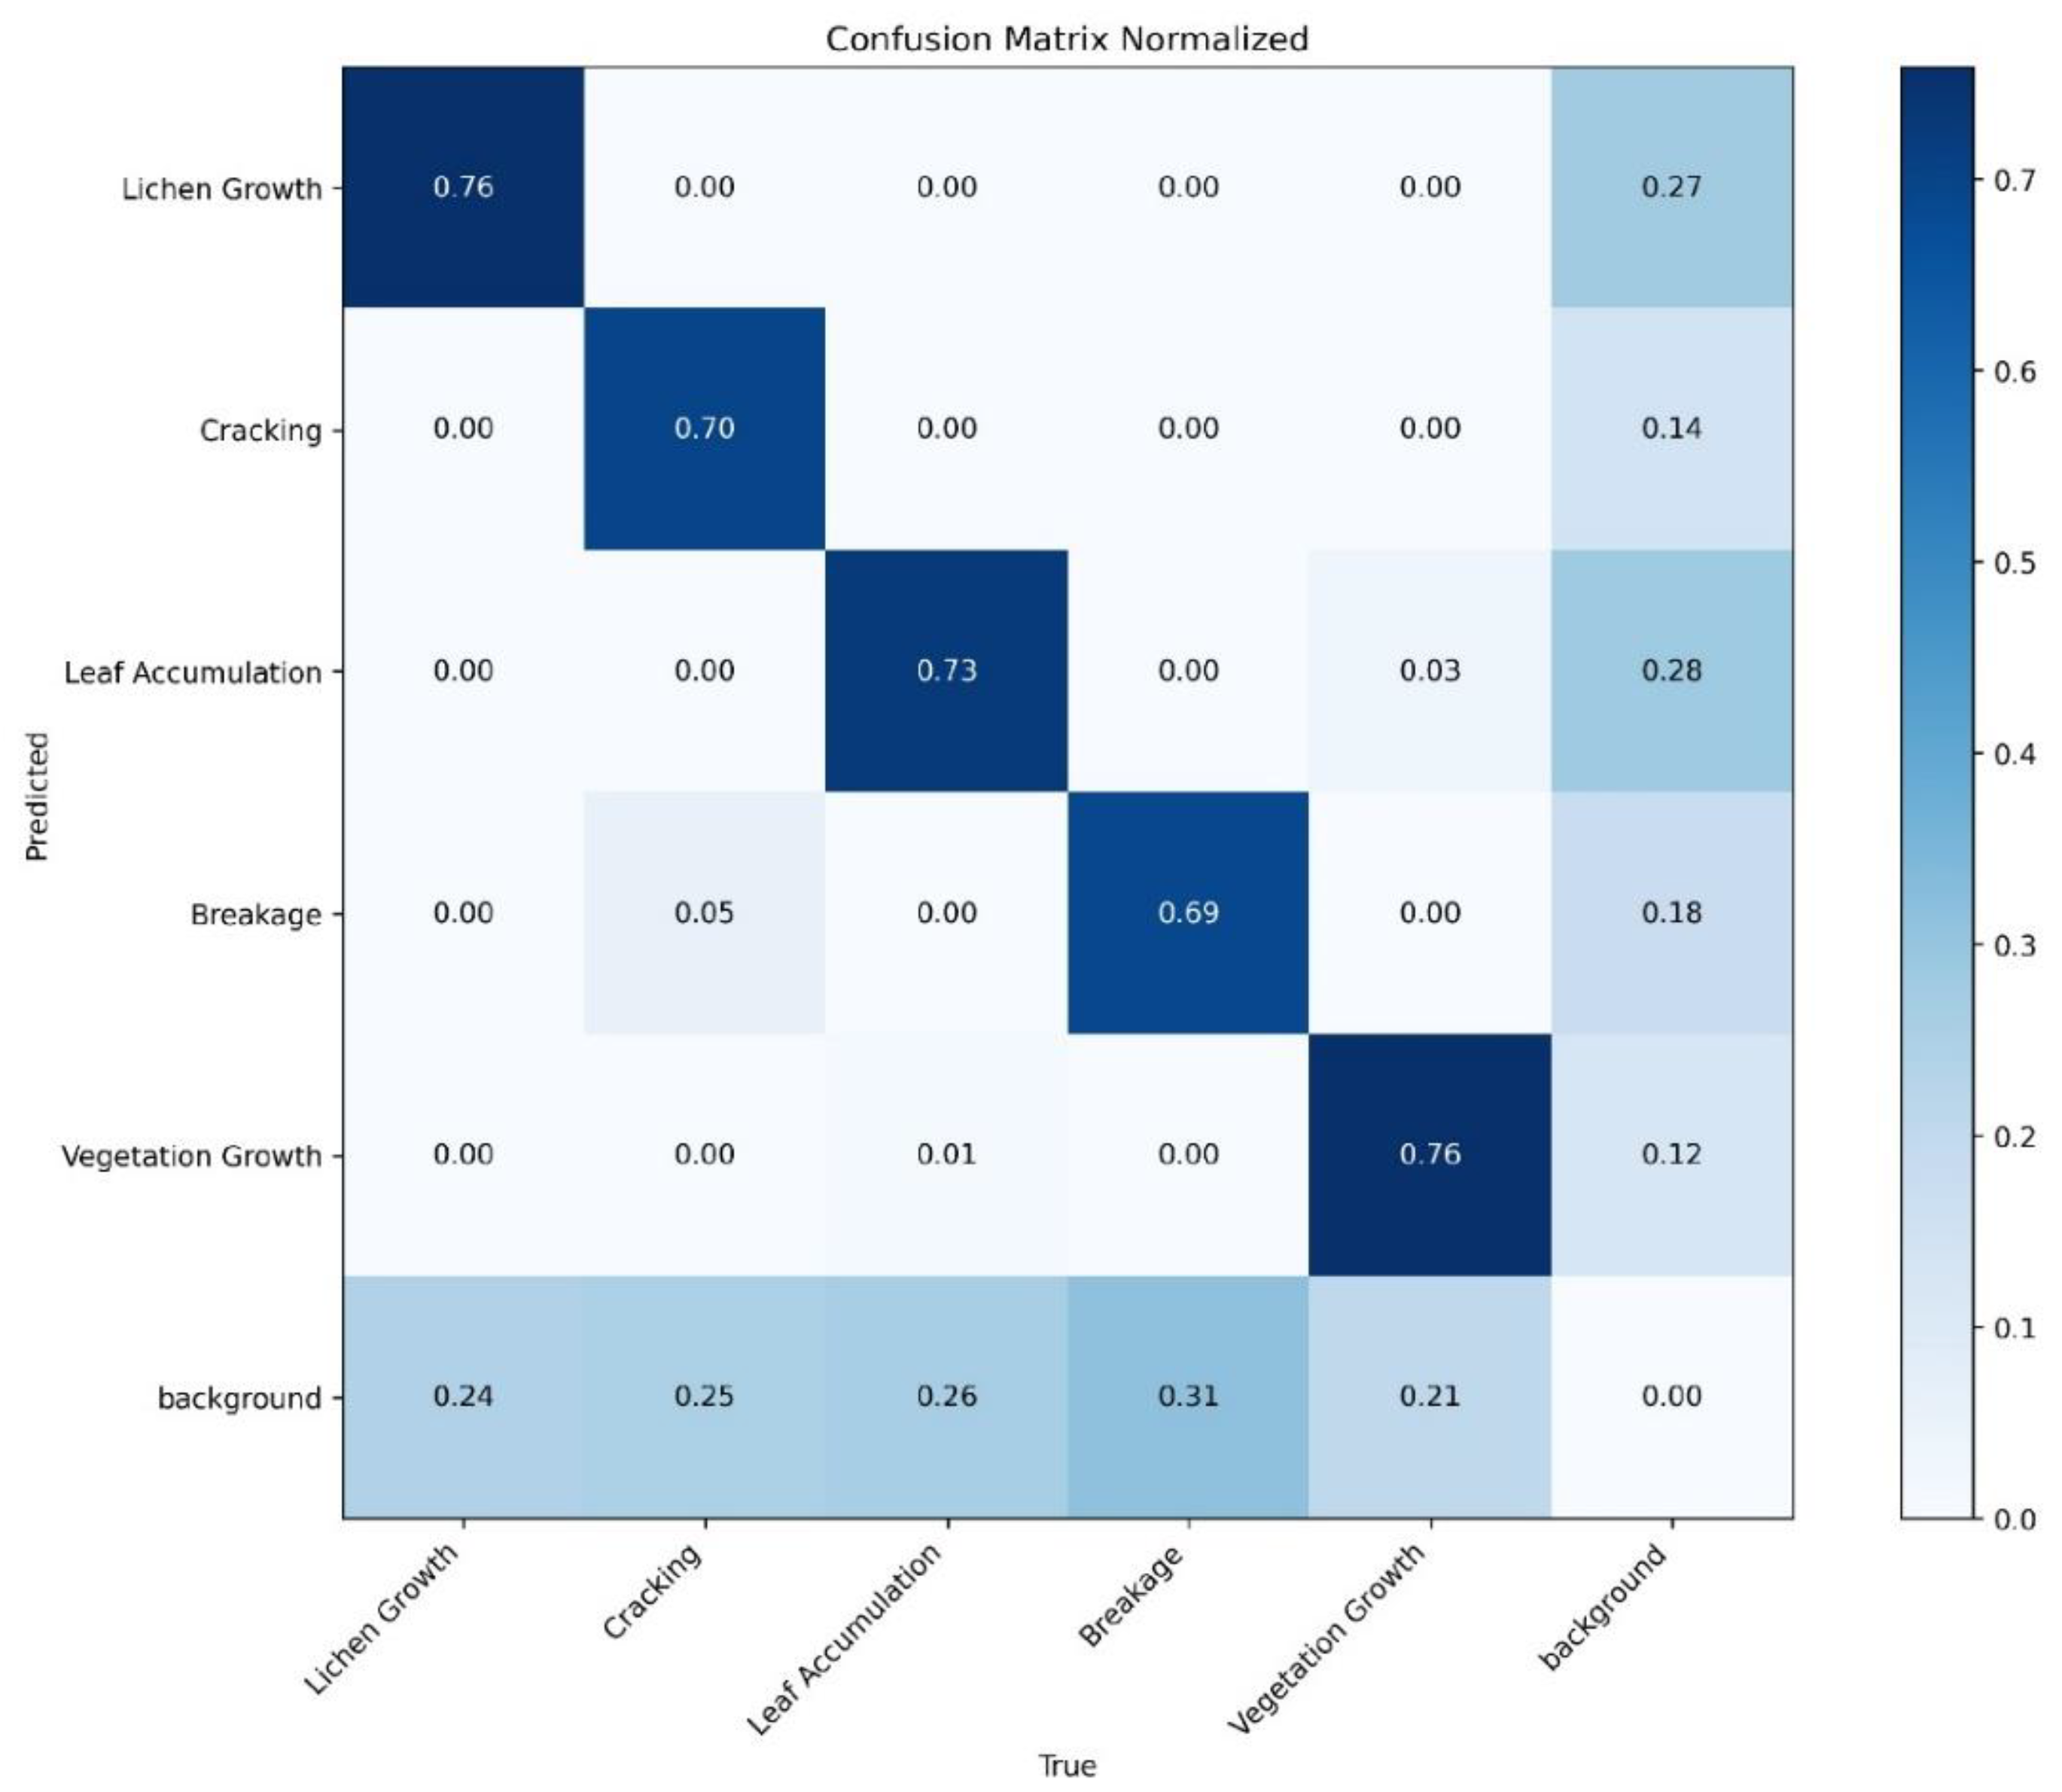
(6)
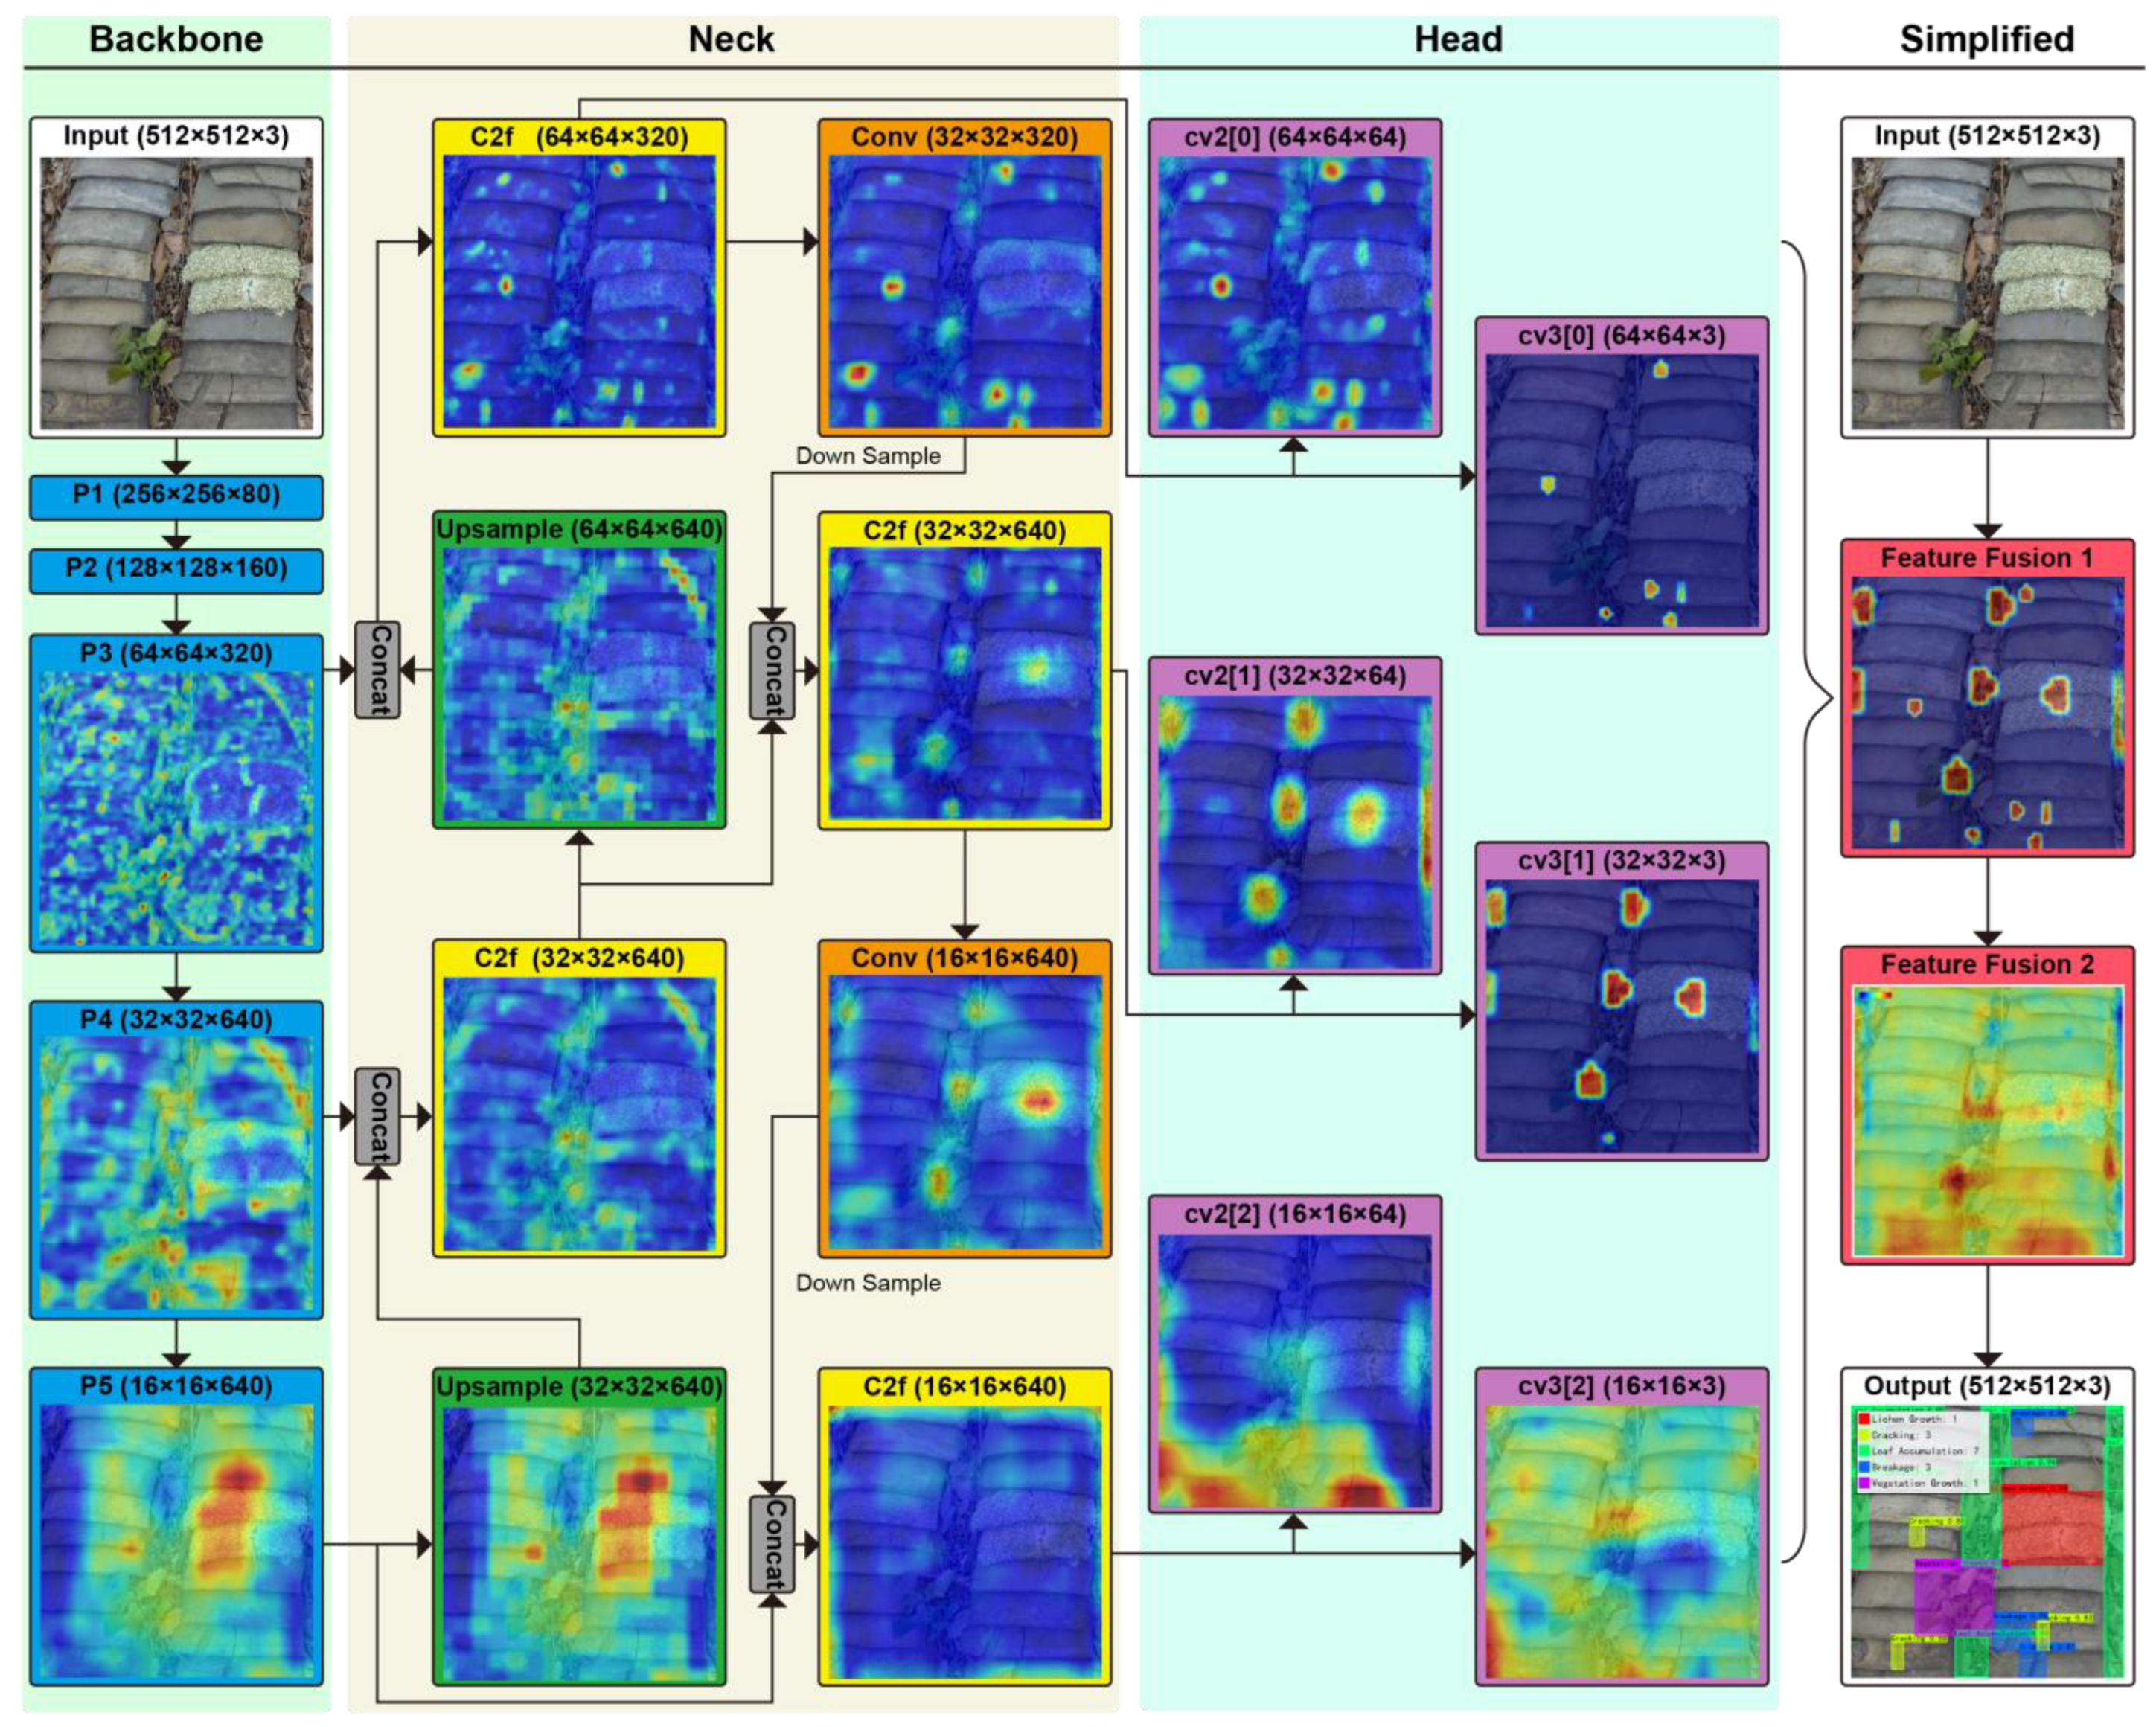
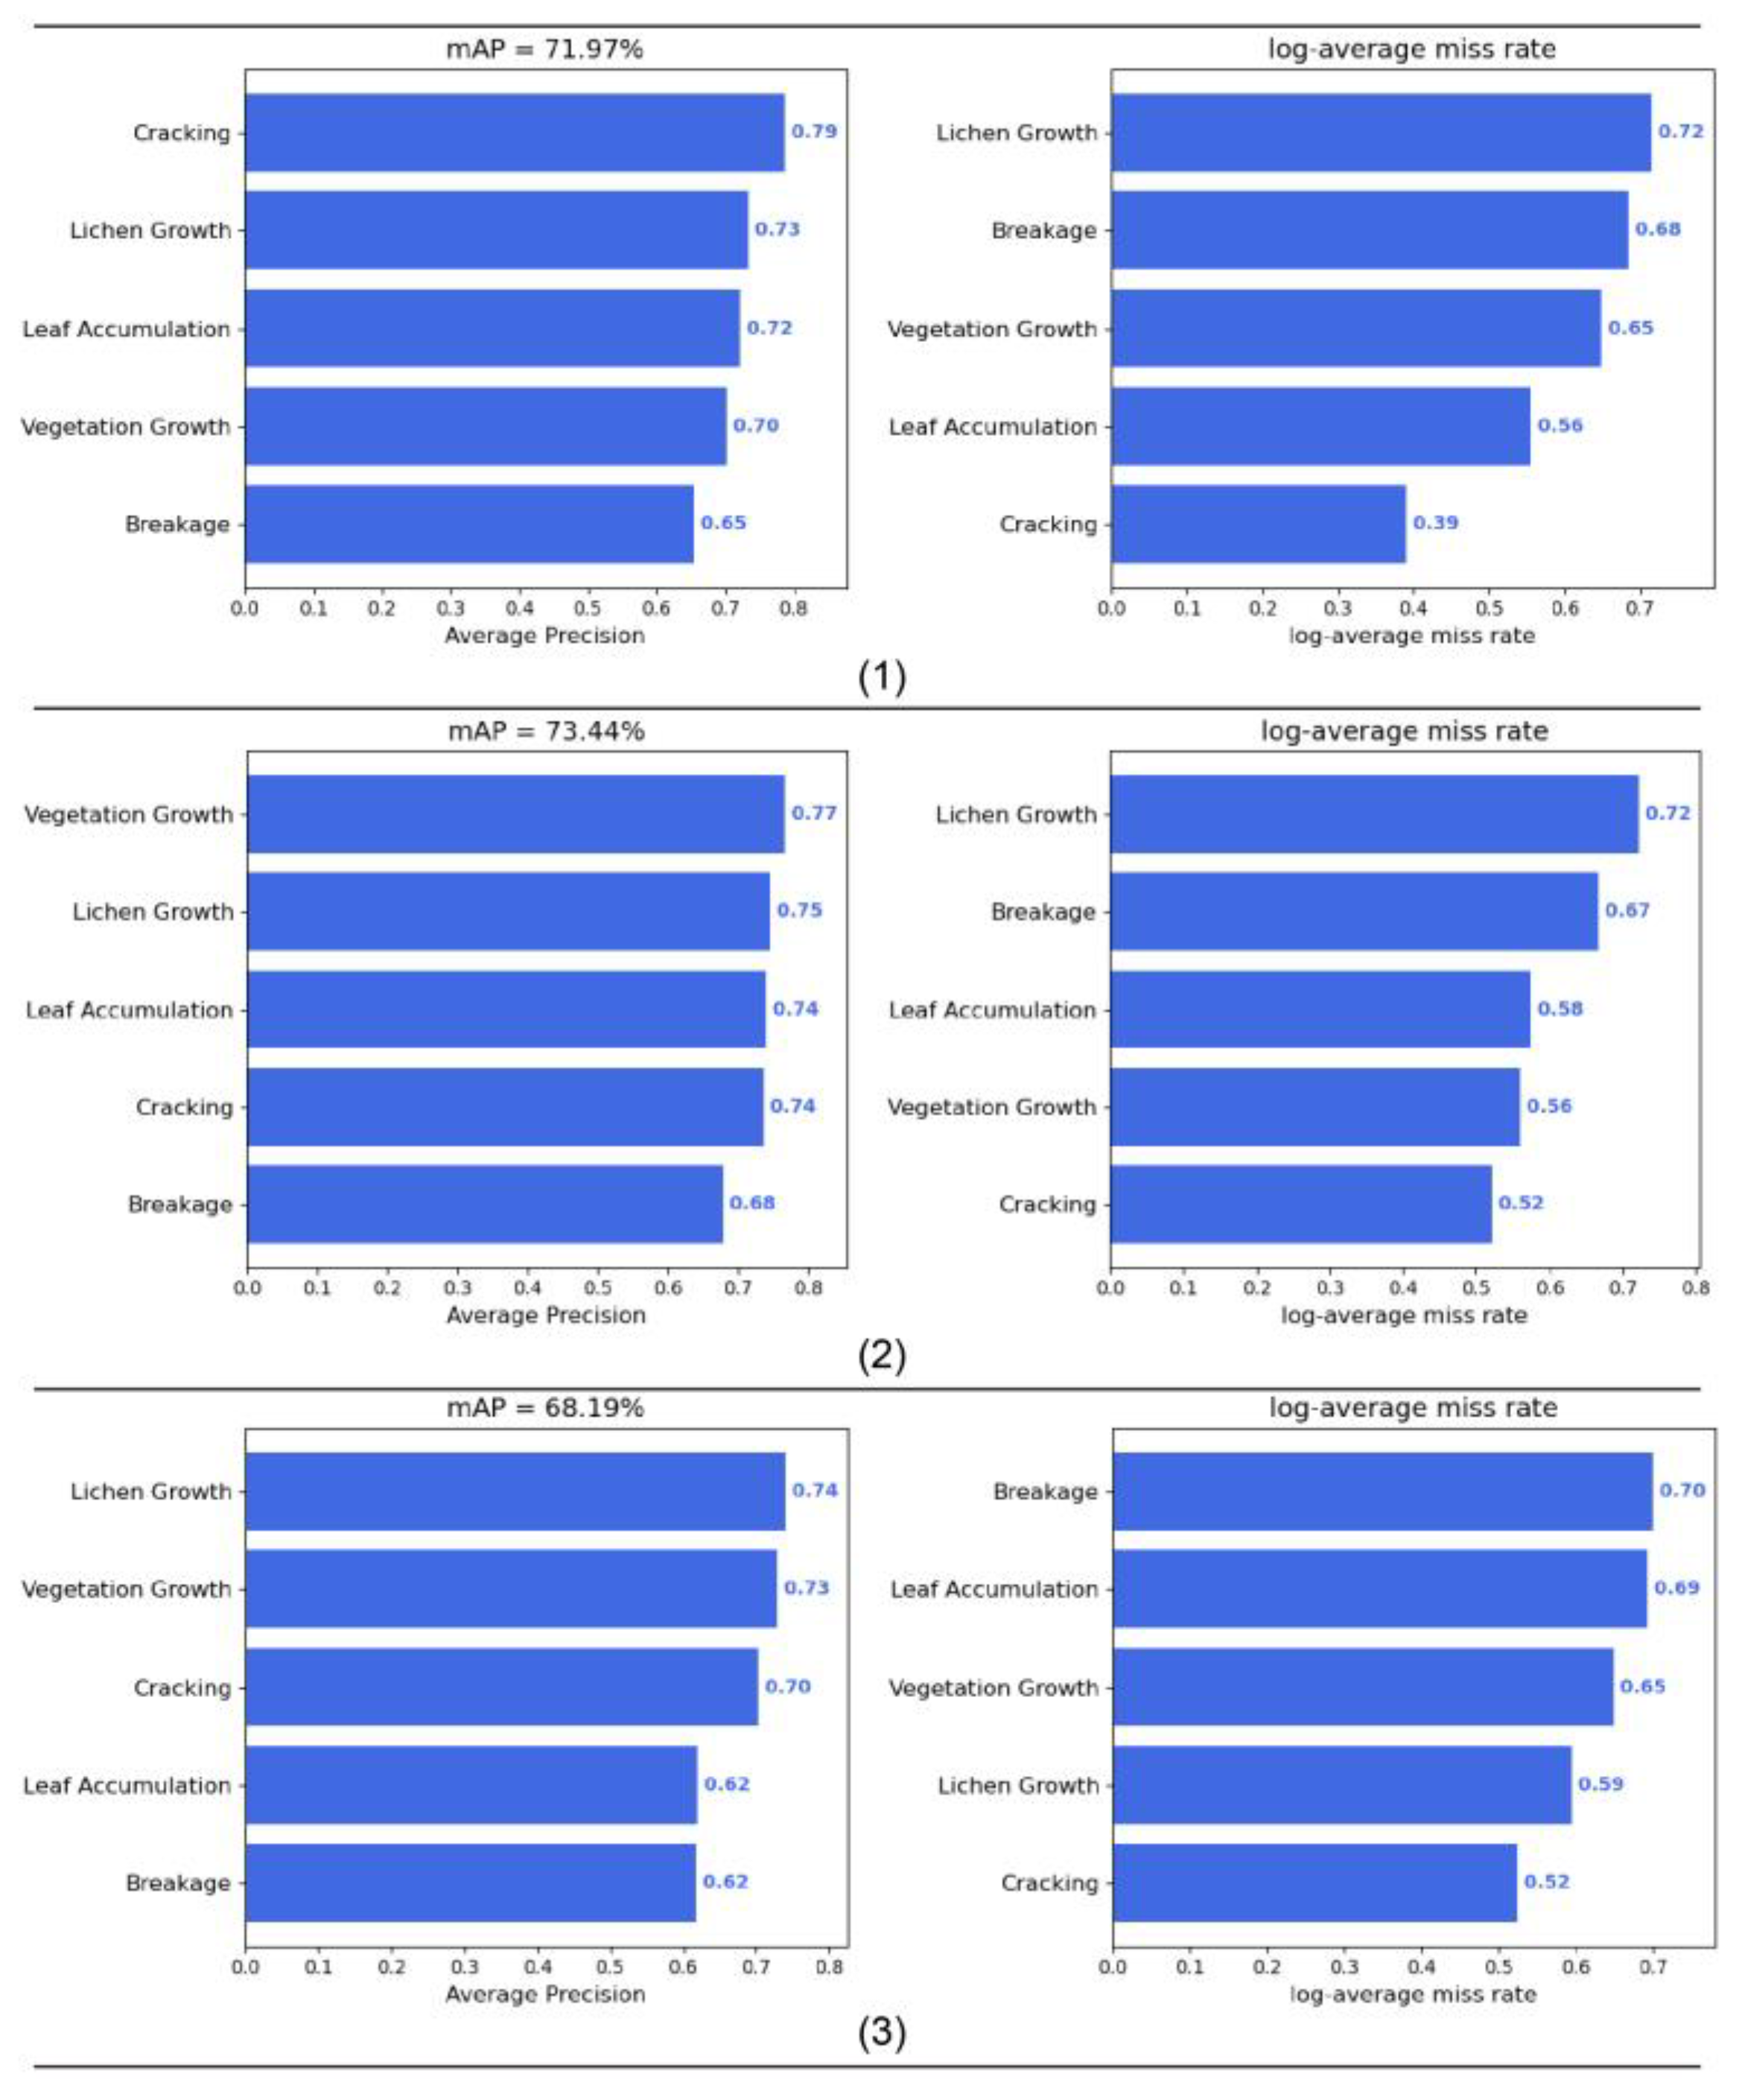
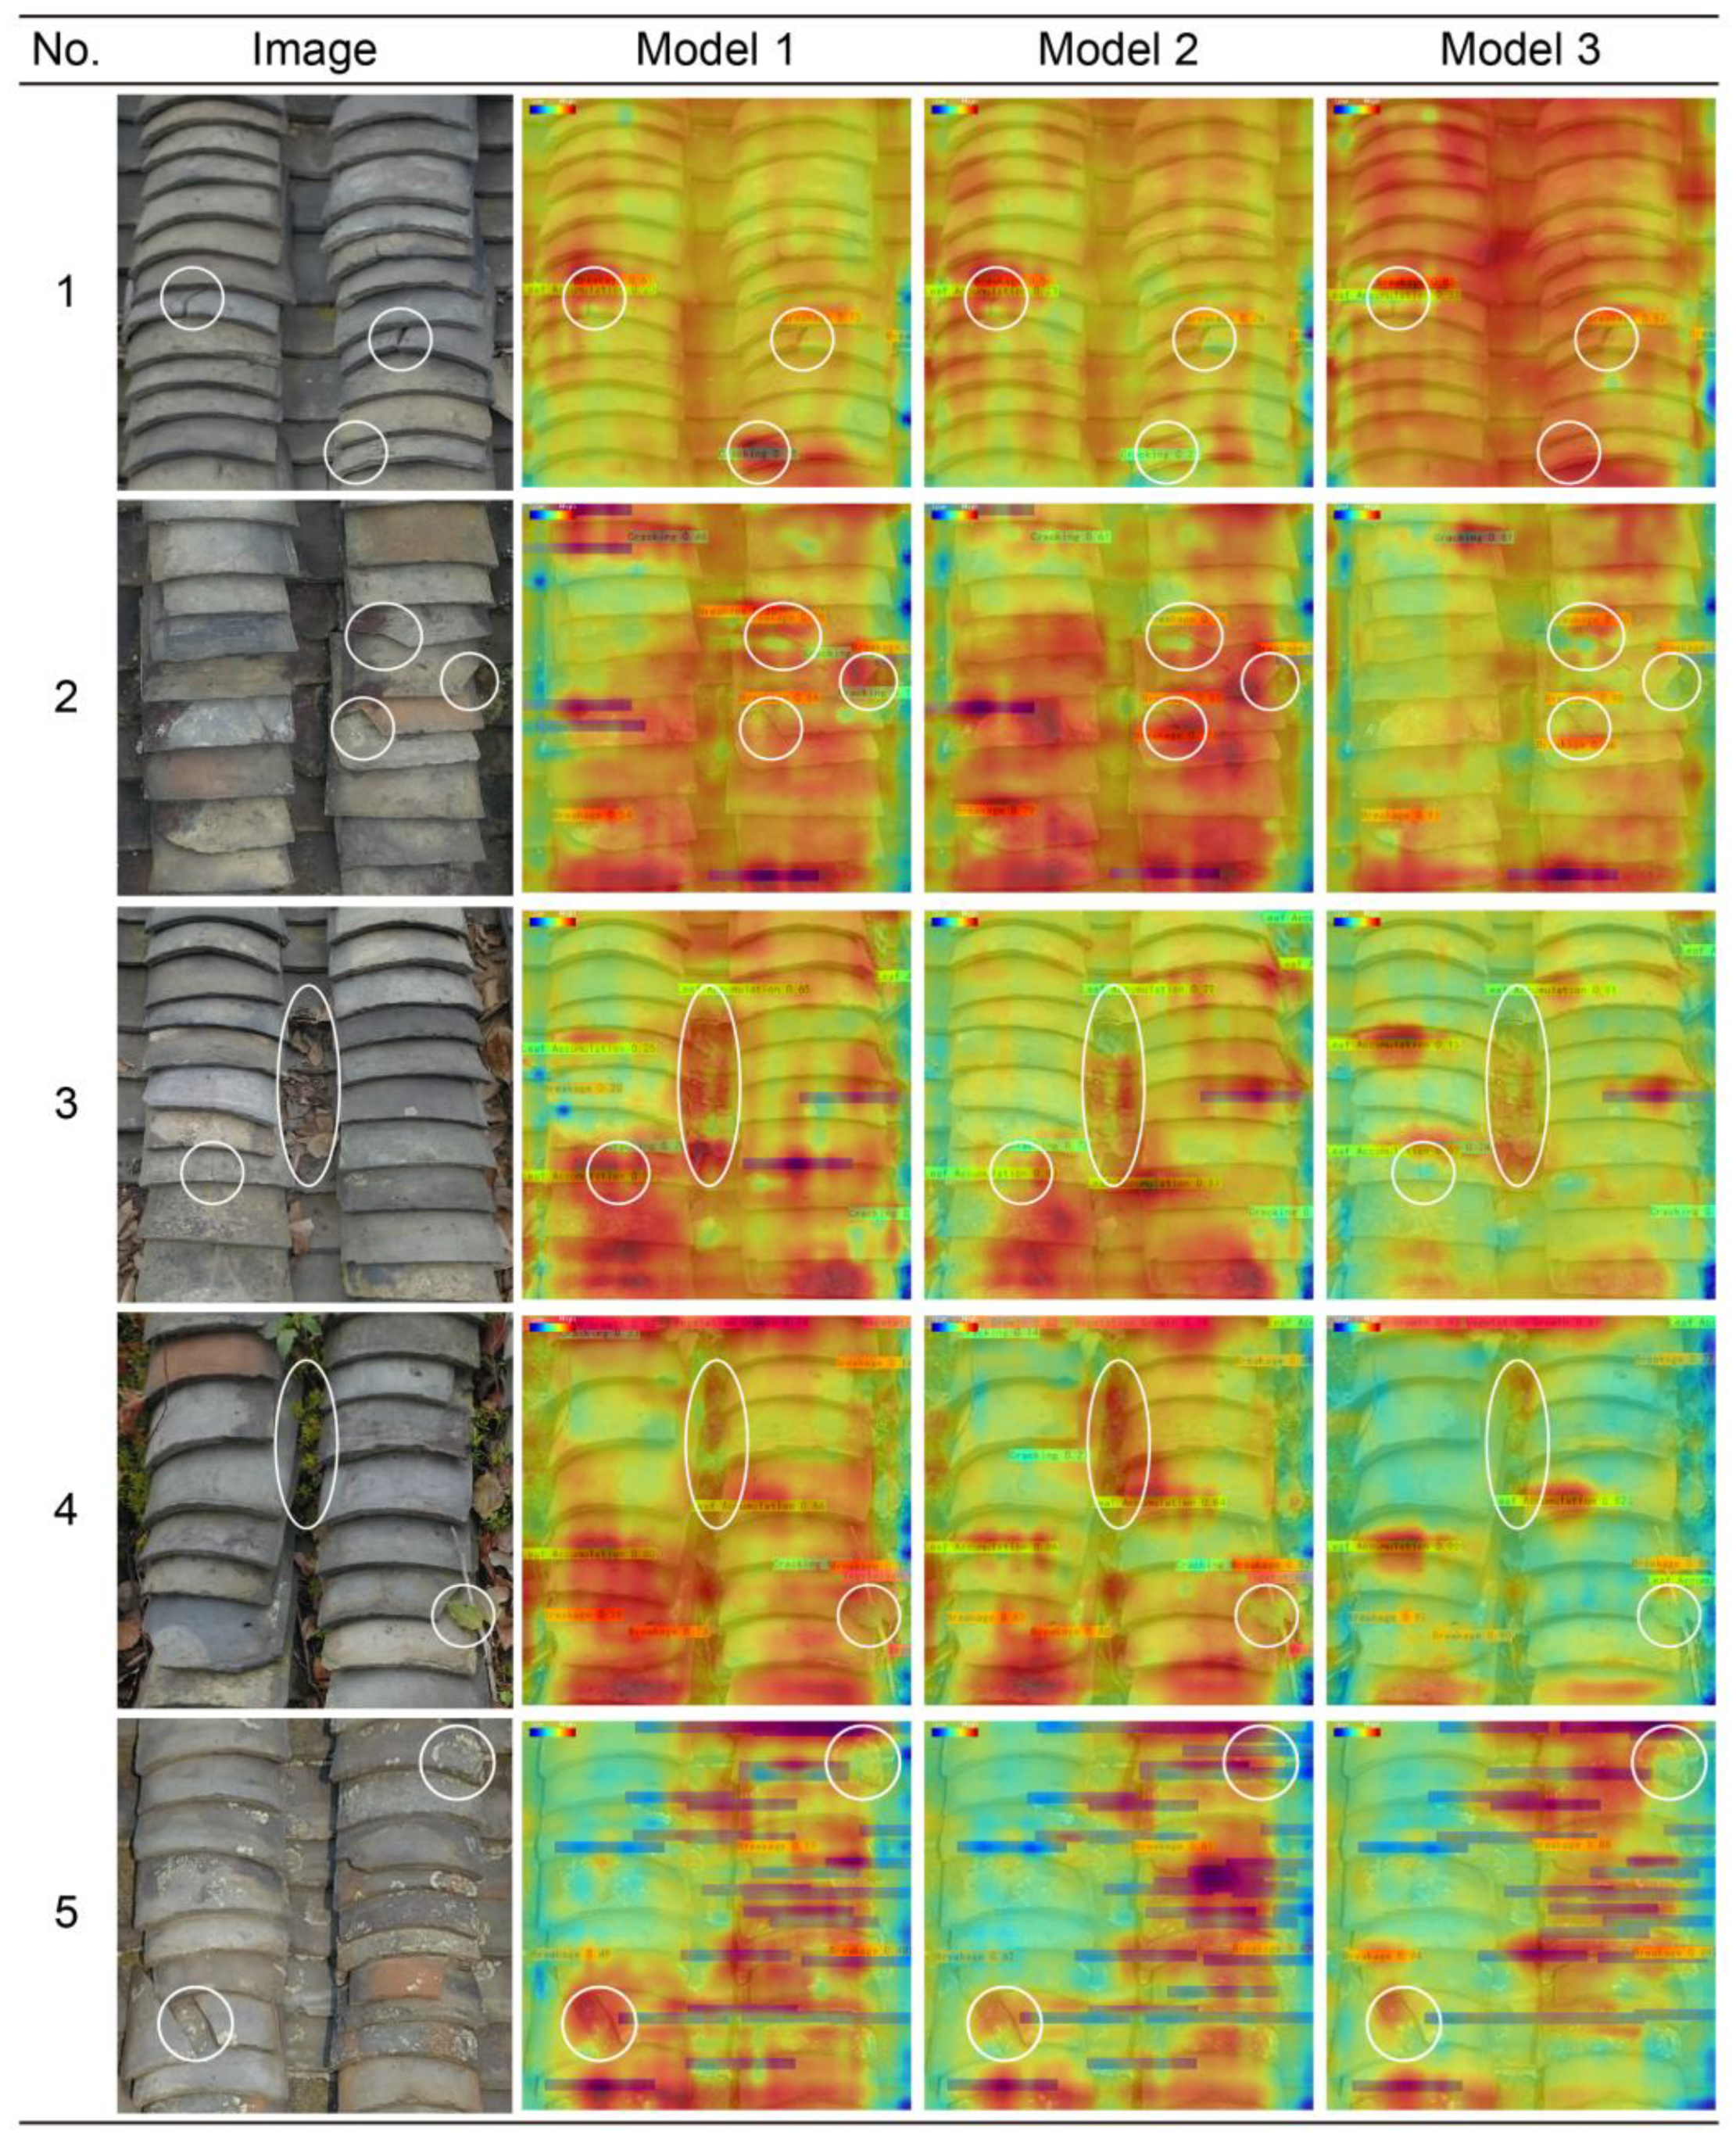
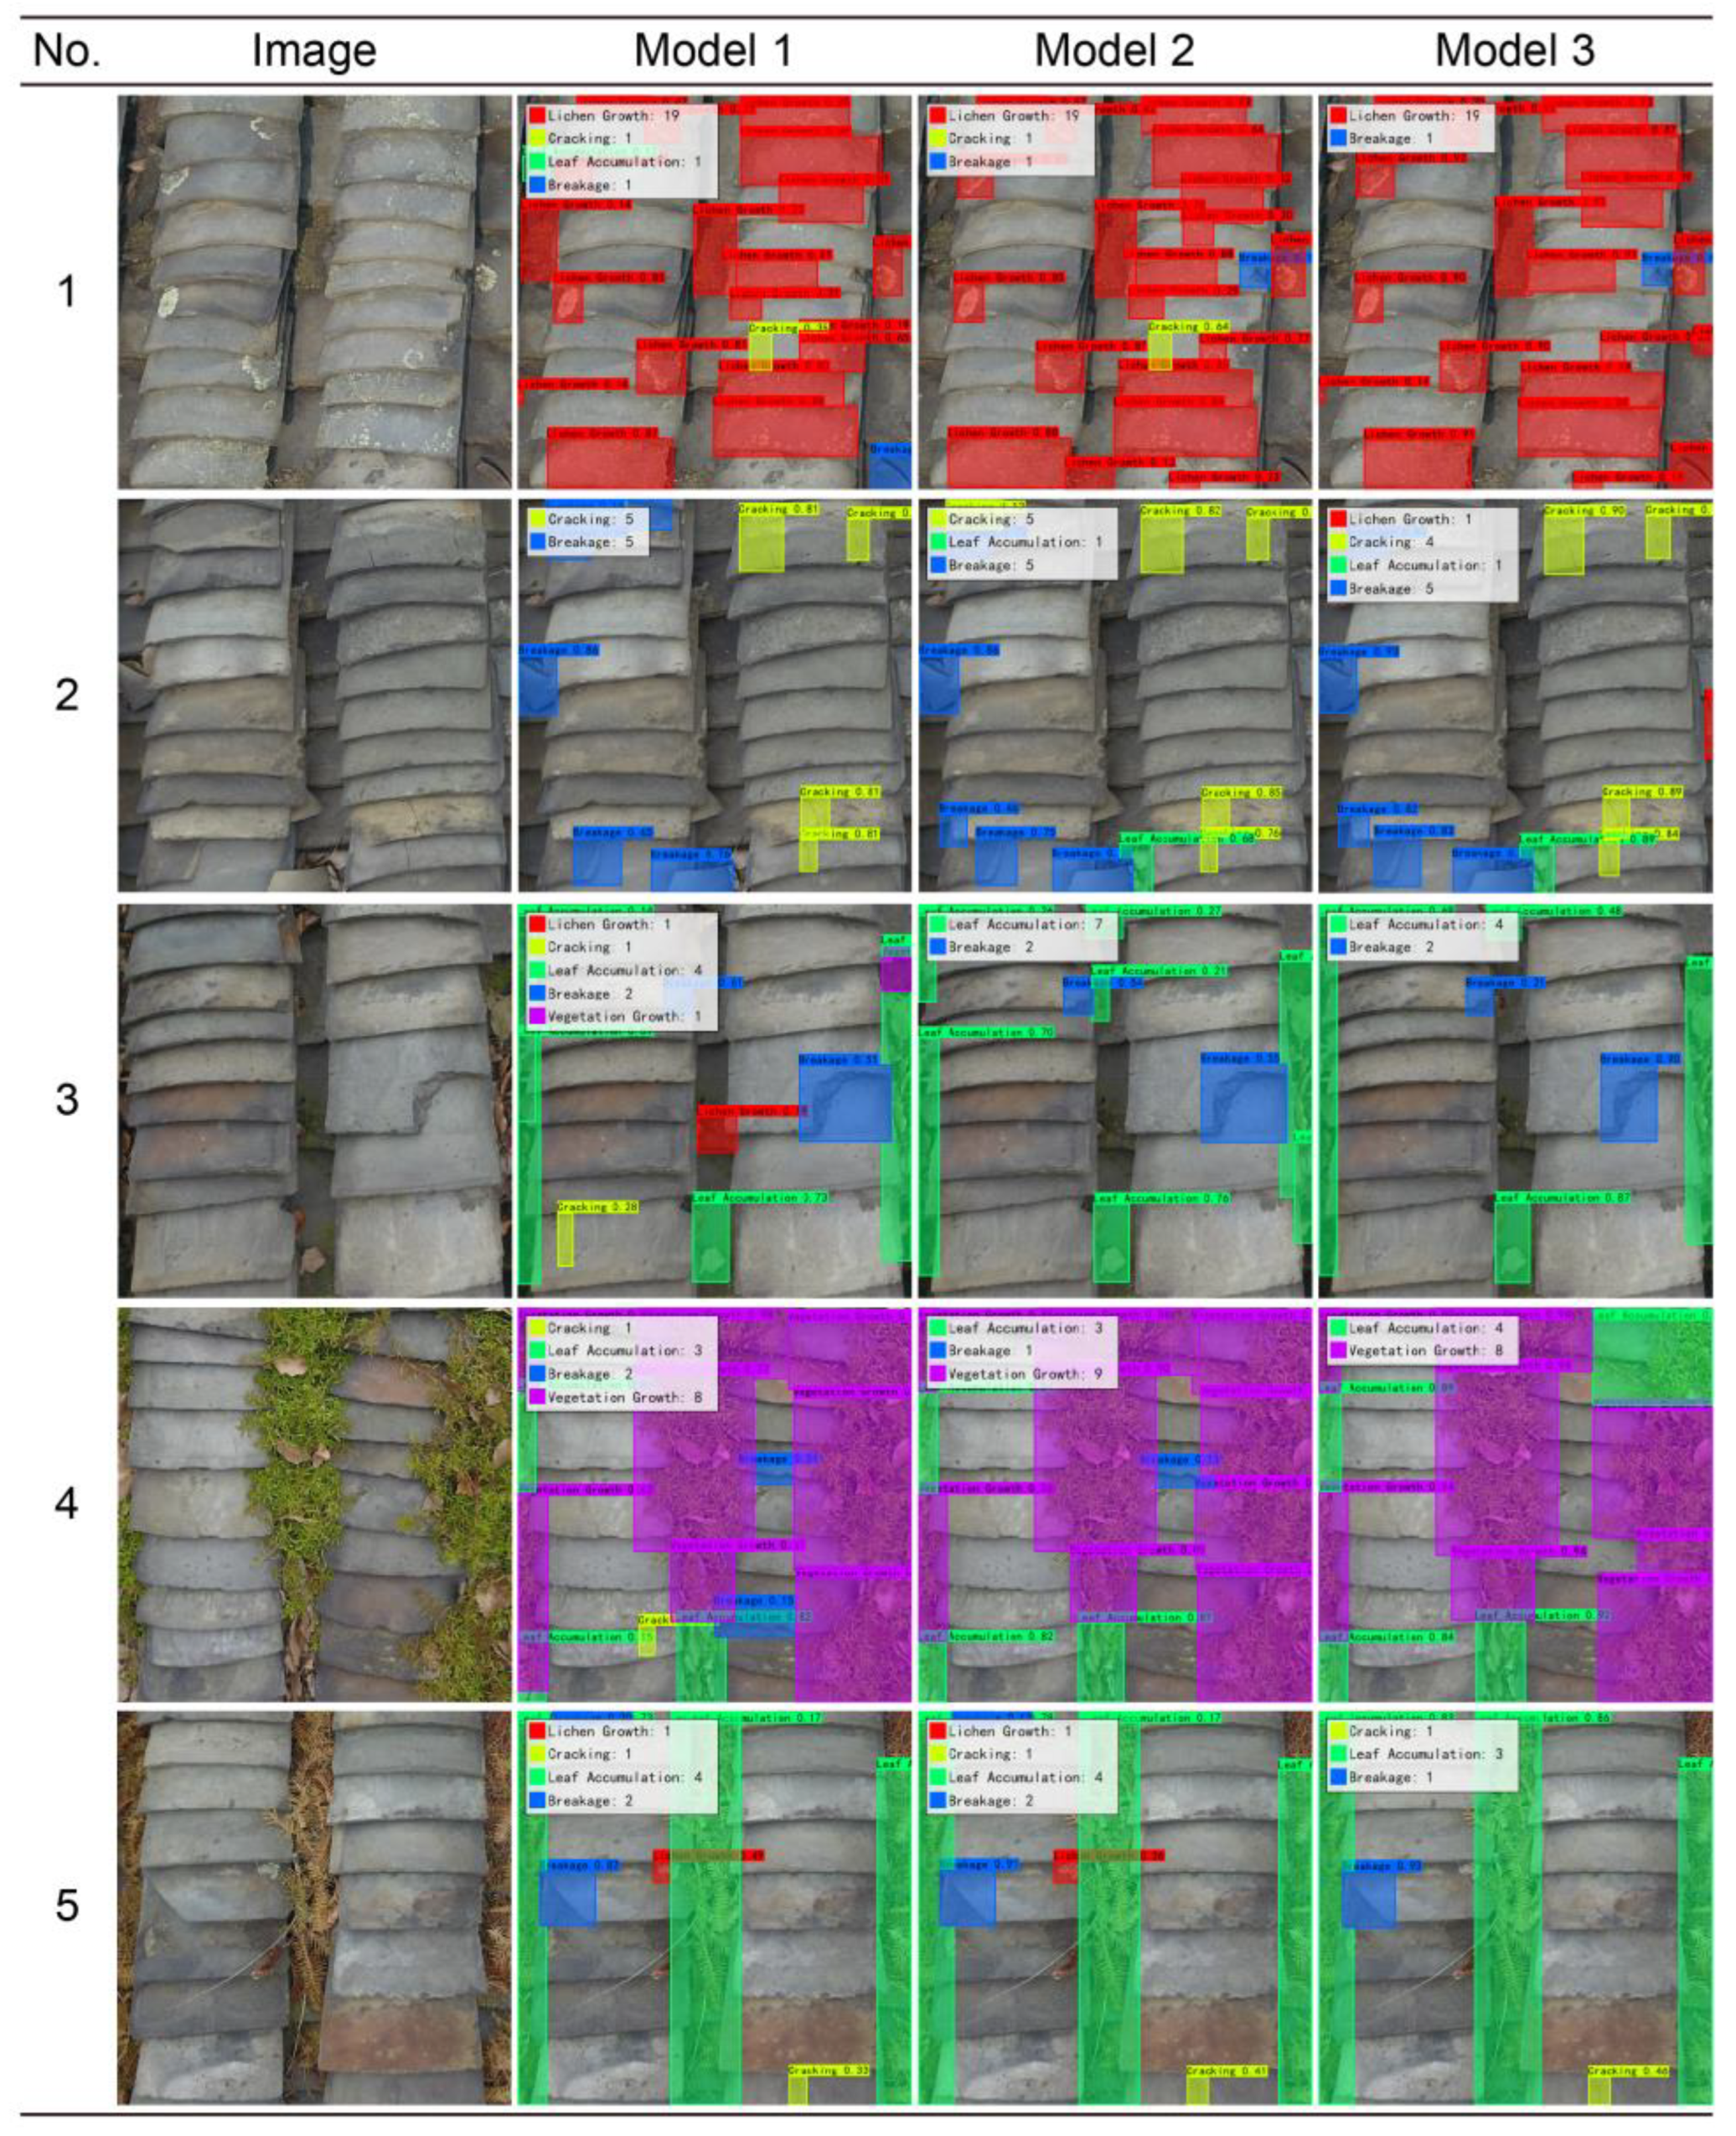
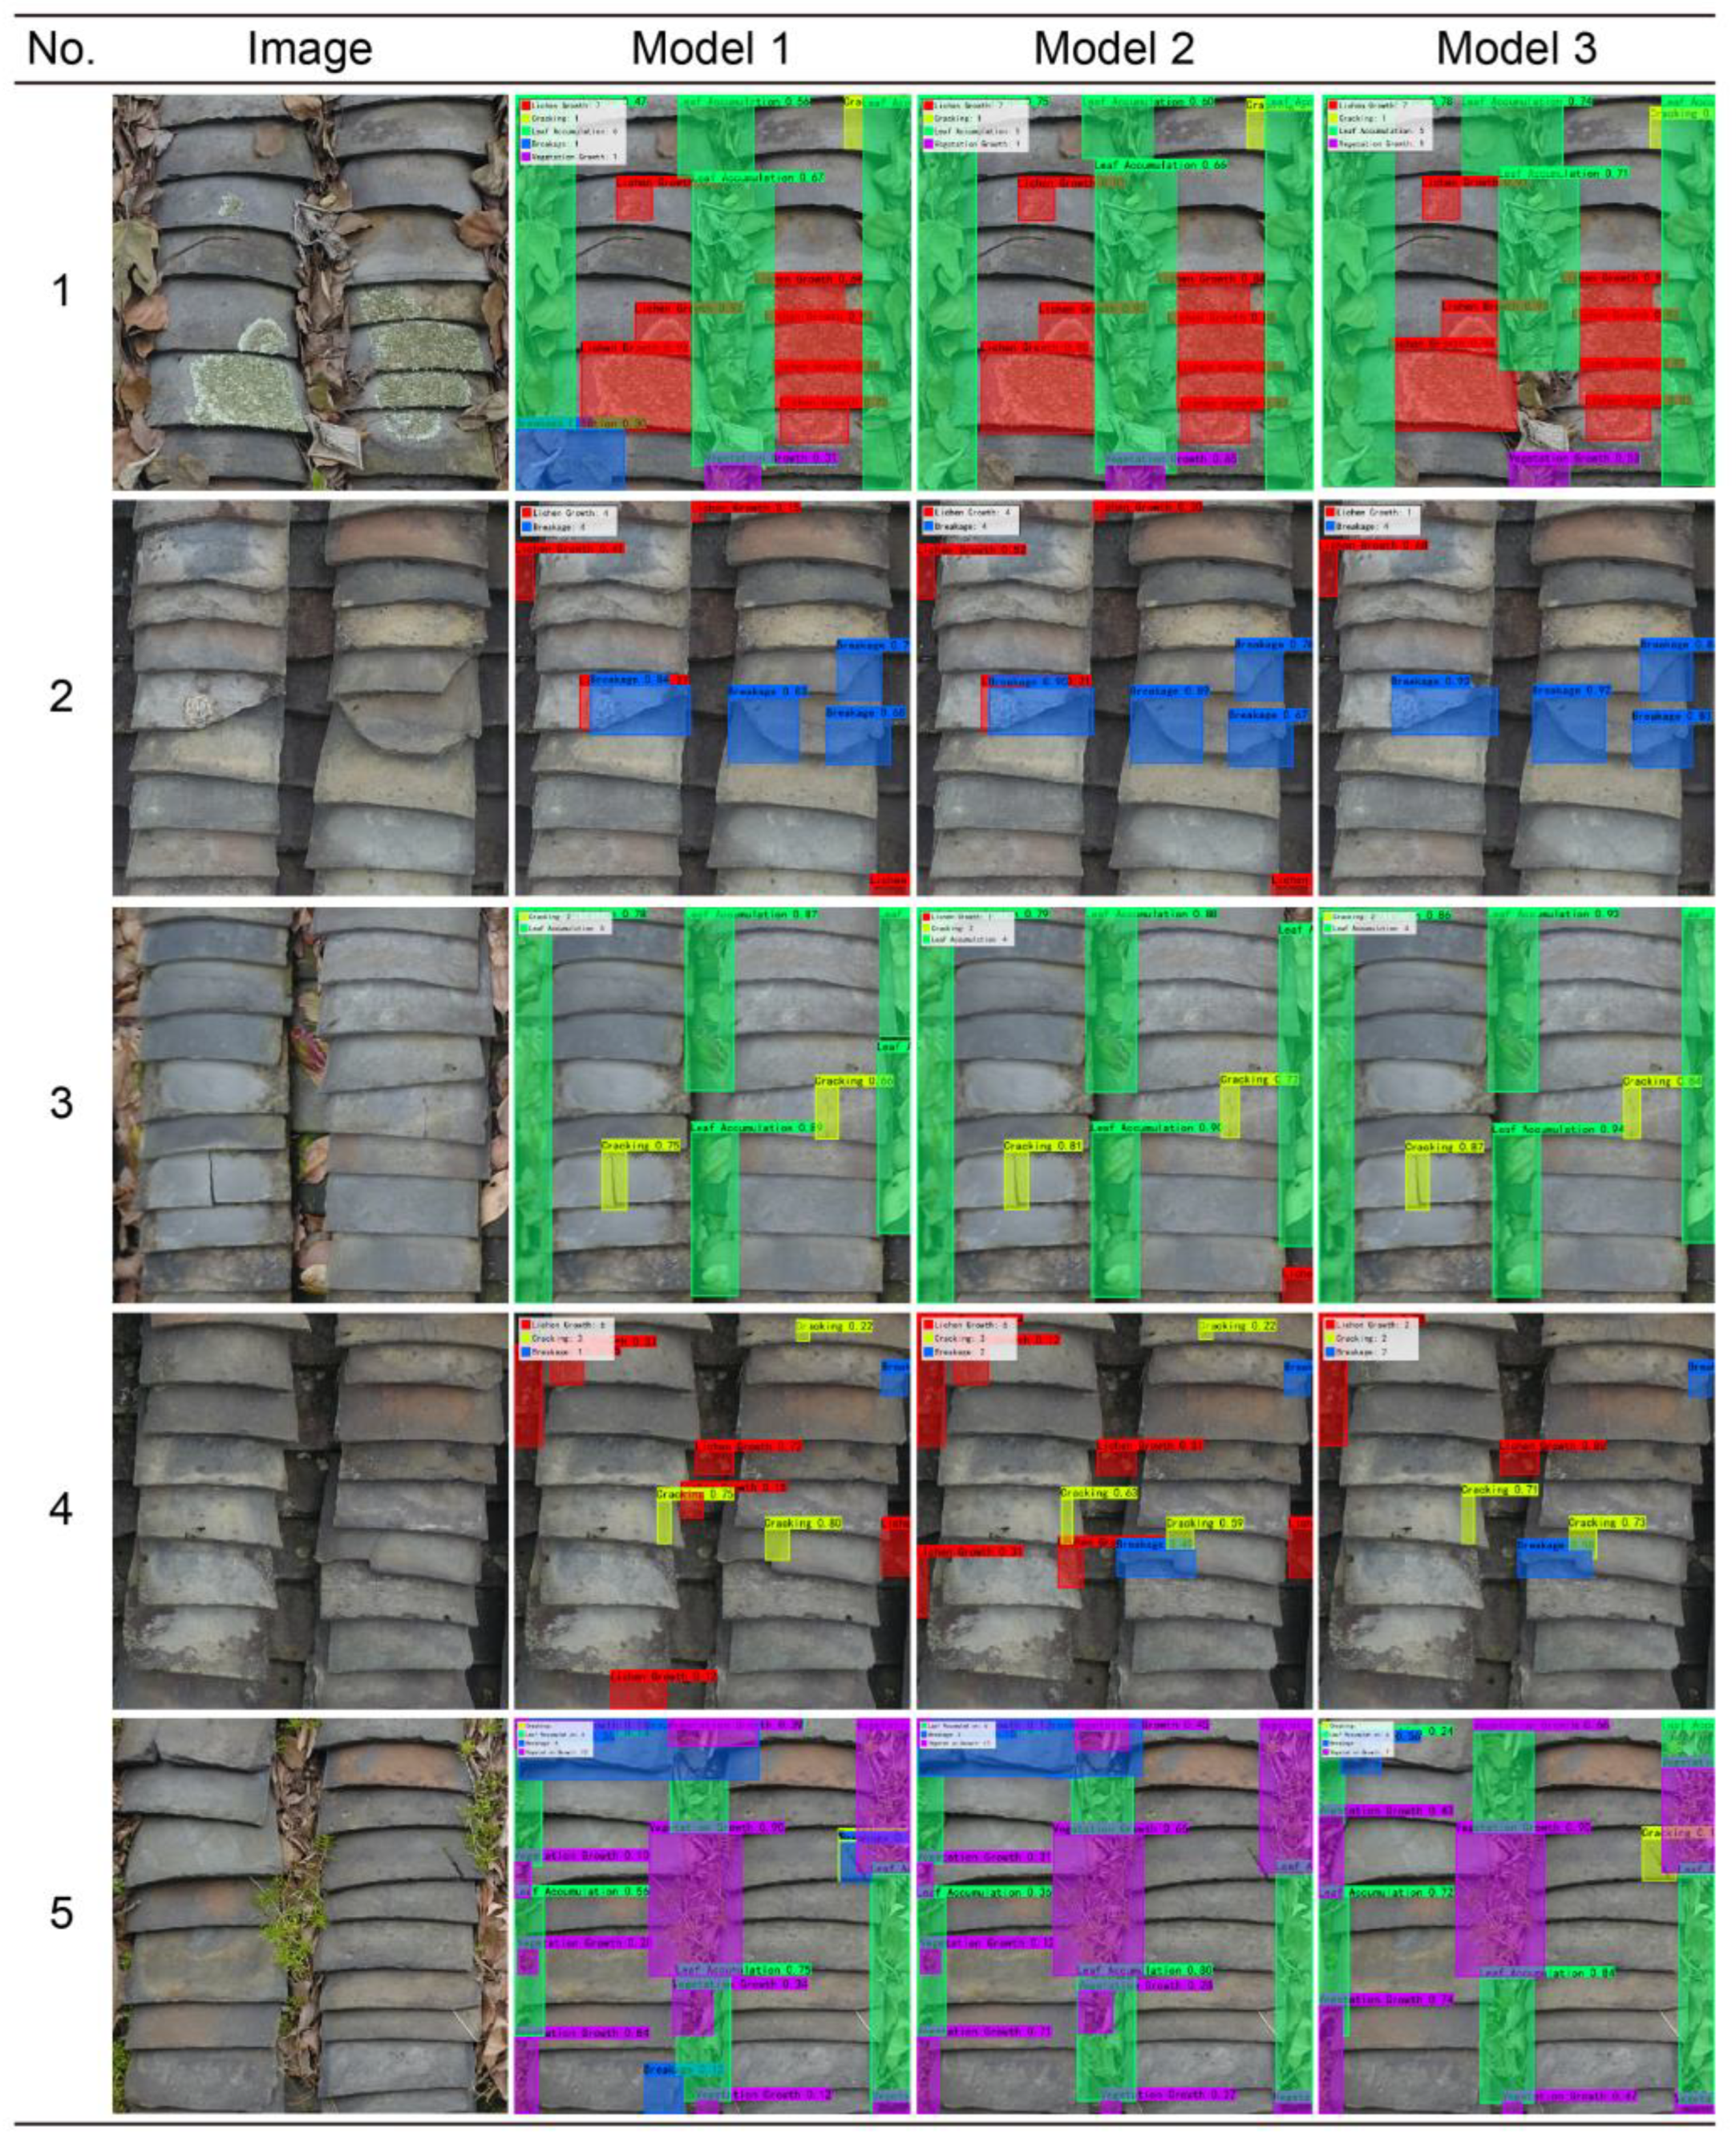
Model testing. To systematically evaluate the actual performance of the YOLOv8 model in the flat tile damage detection task after completing the model training, this study designed a set of multi-index comprehensive evaluation systems. In the test phase, instead of using a single indicator as the judgment standard, this study combined indicators such as average precision (AP), F1, precision, recall, and log-average miss rate (LAMR) to measure the detection performance of the model from different dimensions. Among them, AP is used to evaluate the average recognition accuracy of the model under different confidence thresholds, reflecting its overall target recognition ability; the F1 score takes into account both precision and recall and strikes a balance between accuracy and detection rate, which is a key indicator for measuring the robustness of the model; and LAMR is suitable for measuring the stability of the detection system under multi-scale and multi-background conditions by taking a logarithmic weighted average of the recall level under different missed detection rates, especially for the recognition ability of low-visibility targets. Additionally, to better understand the model’s classification ability, this study constructed a confusion matrix, which shows the clarity and confusability of the classification boundaries among various types of damage and helps identify potential recognition error trends in the model. In addition to quantitative indicators, the testing phase also included a comparative analysis of visual detection results and feature heatmaps. Heatmaps display how much focus the model gives to different parts of an image at various levels, which helps us understand how the model reacts to fine details, edges, and blocked areas. By looking at the detection results alongside manual notes on the layout and categories, we can check whether the model’s predictions match the actual data and also identify where it struggles to recognize complex flat tile surfaces.
(7)
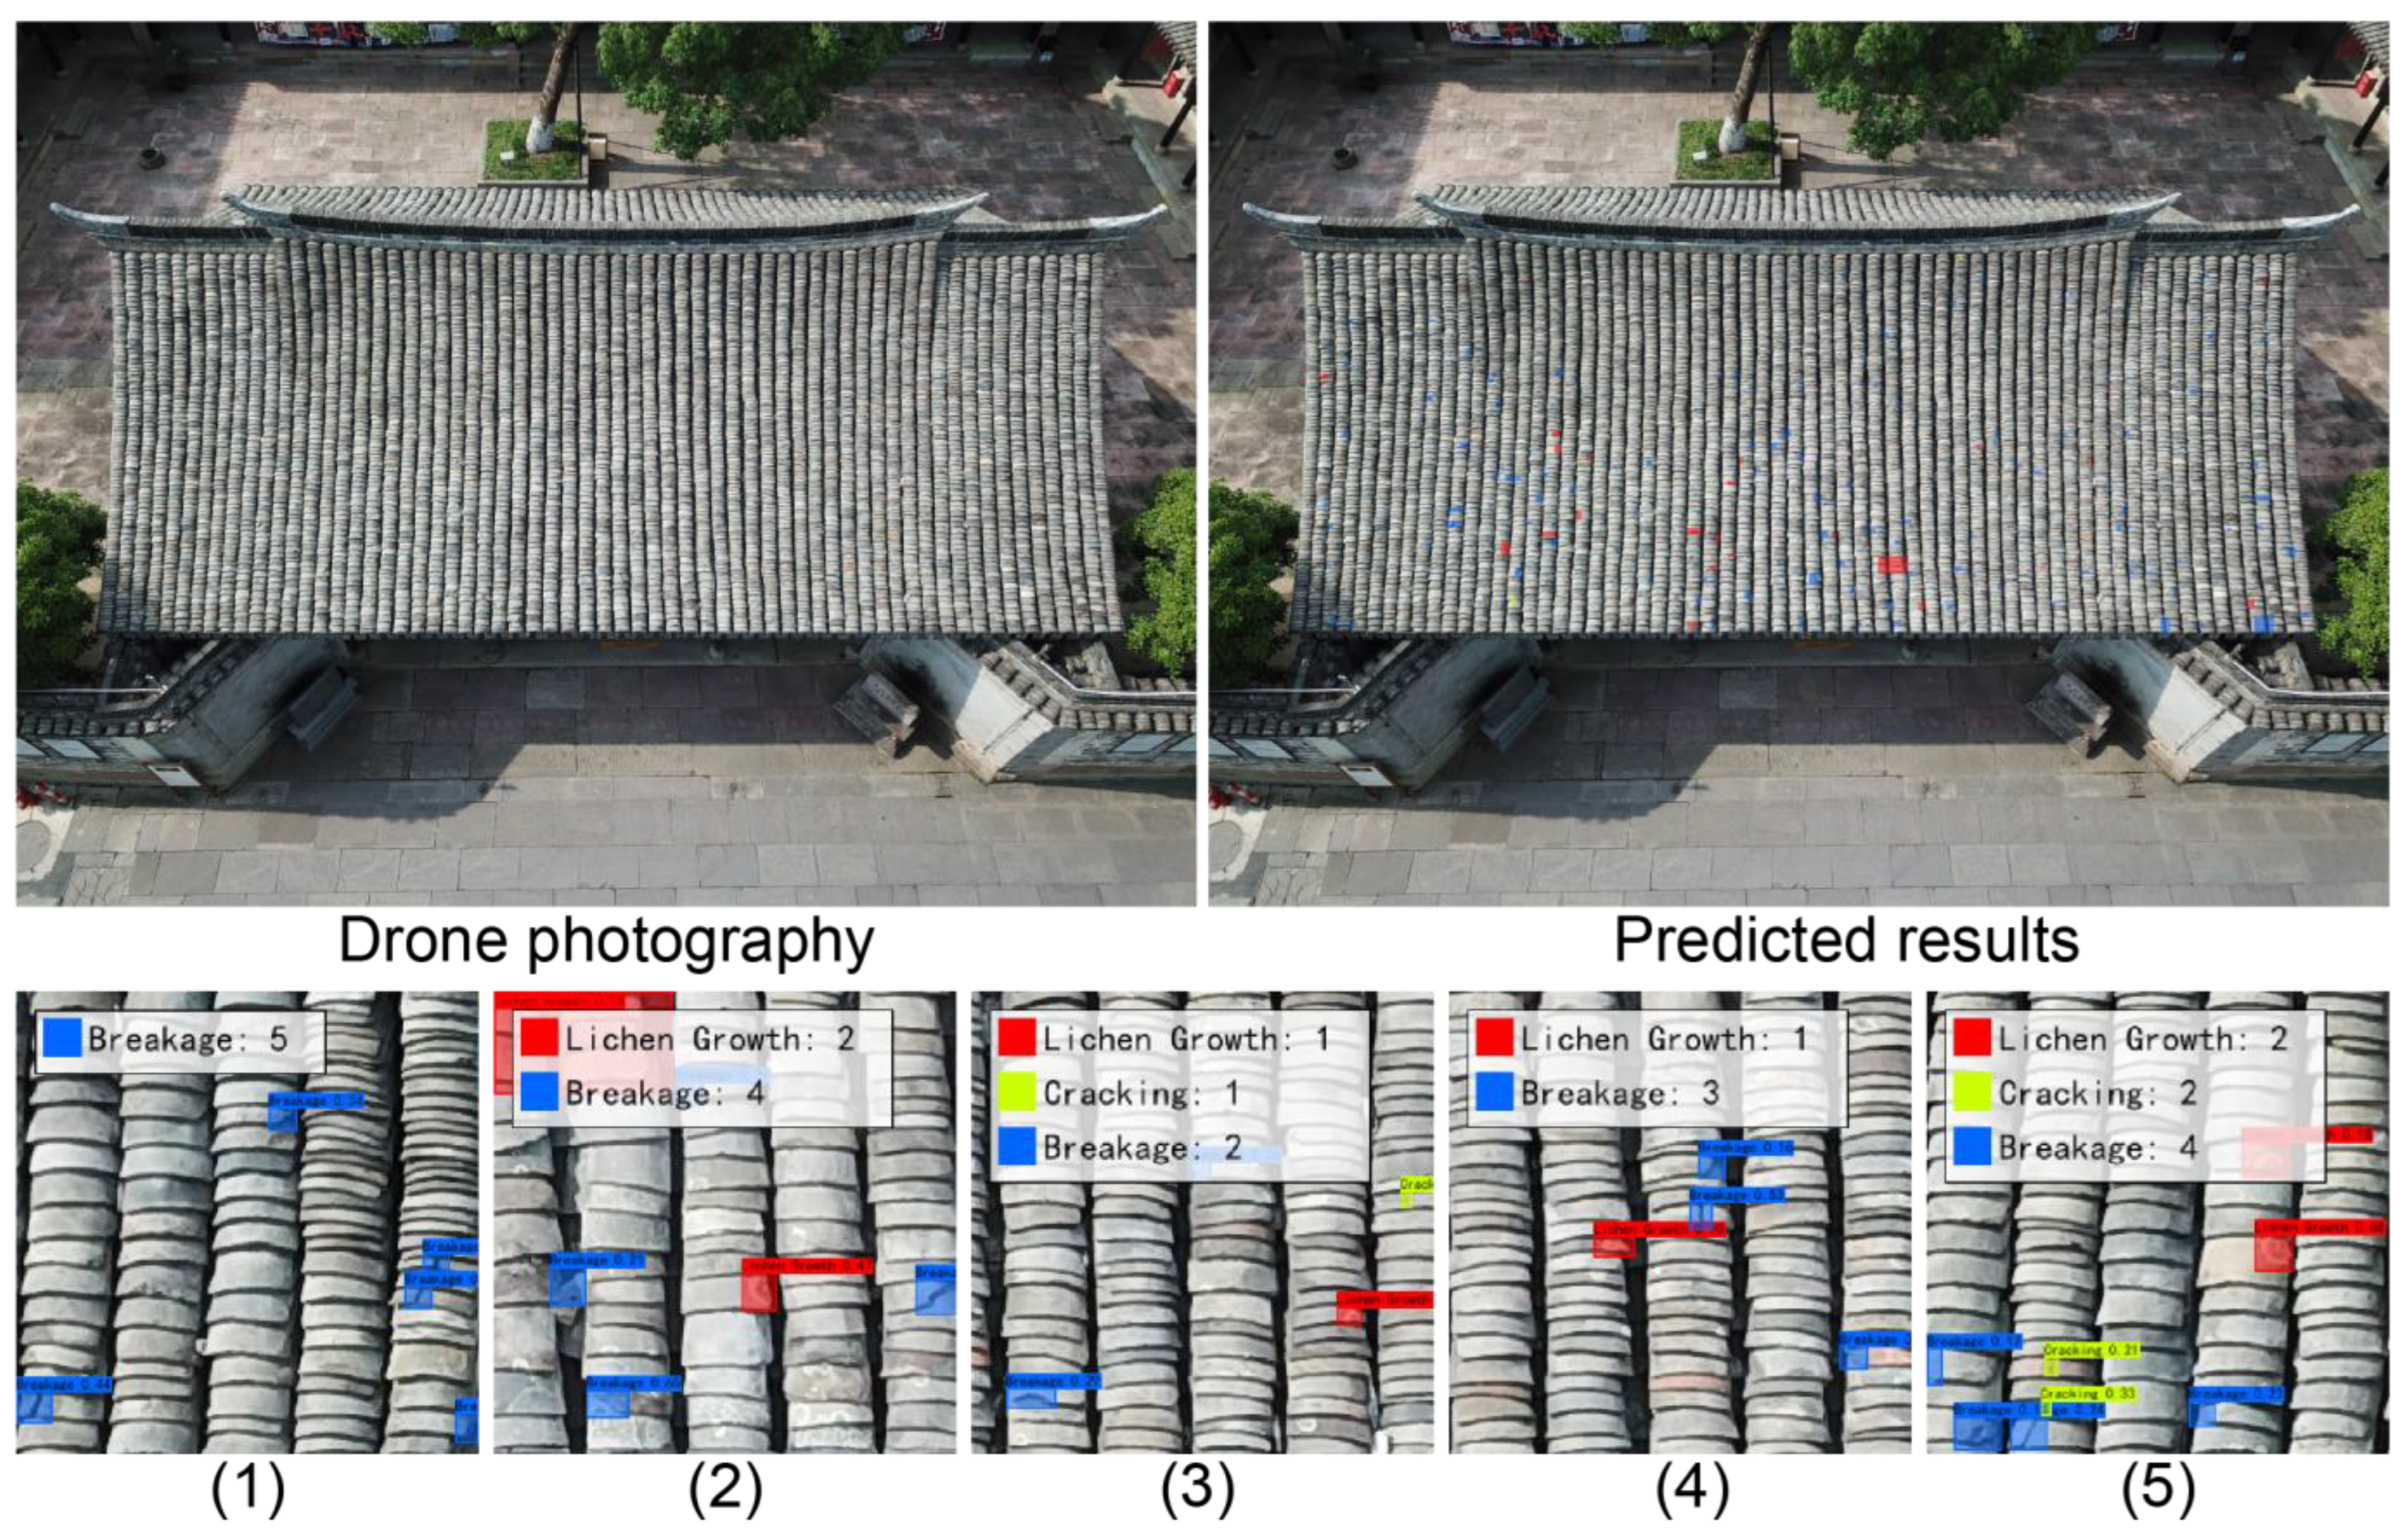
Result analysis. After completing model training and multidimensional performance testing, this study further selected the YOLOv8 model with the best performance in the training set and validation set and applied it to new image data collected in the field to verify the recognition ability and robustness of the model in unknown environments. The test images included photographs of flat tile roofs taken under multiple real-life scenarios, covering different lighting conditions, perspective changes, and complex background interference, in order to ensure they were as close as possible to the application scenarios in real architectural heritage inspection tasks. During the model reasoning process, the research team concentrated on recognizing various types of damage in real environments, particularly emphasizing the recognition performance of categories that experience significant interference from natural factors such as lichen growth and fallen leaves, particularly under conditions of high occlusion or low contrast.

2.3. Model Structure Design

The YOLOv8 detection model used in this study is an advanced single-stage target detection architecture with the characteristics of being fast, lightweight, and highly precise. It is particularly suitable for the recognition of fine-grained targets on traditional building tiles. The overall structure of YOLOv8 consists of three parts: the backbone, neck, and head. It achieves the efficient detection of multi-scale damaged targets in images in an end-to-end manner. As shown in Figure 8, the model takes a flat tile surface image with a resolution of 512 × 512 as input. First, the basic features are extracted using the backbone, which comprises multi-layer convolution and aggregation modules (P1 to P5) for step-by-step downsampling to capture the hierarchical structural features of the flat tile surface texture. As the depth increases, the model gradually extracts more semantic mid- and high-level features to locate abnormal information on the flat tile surface, such as cracks, moss, or fallen leaves.
In the neck part, YOLOv8 introduces the C2f structure and multi-scale path fusion mechanism to enhance the semantic consistency and spatial resolution of features at different scales. The model achieves the effective fusion of deep and shallow information through multiple upsampling and feature connection operations, which is particularly critical for flat tile surface damage types with high variability and occlusion interference. The head part classifies and locates multi-scale output features based on the refined convolution prediction module (cv2 and cv3) and finally outputs the detection results containing category labels and bounding box information.
To more intuitively understand the response mechanism of the model during the processing of tile surface images, the study also generated a layer-by-layer heatmap to show the attention distribution of the model at each stage. The model initially focuses on the texture mutation area of the flat tile surface at a shallow stage, while in the deep stage, its response gradually focuses on the damaged edge, moss-covered area, or leaf accumulation area, indicating that YOLOv8 can effectively capture the key features of diverse damage types.
This study did not modify the YOLOv8 model structure but instead focused on exploring its direct applicability and generalization capabilities for the inspection of cultural heritage building roofs. The modular structure and multi-scale fusion mechanism of the model enable it to adapt to various practical challenges, such as complex tile morphology, diverse types of damage, and significant changes in image illumination without structural adjustment, indicating good application value. The indicators and terms involved in this study are presented in Table 1.

3. Results

3.1. Training Process

To accurately identify the types of damage on flat tiles on the roofs of ancient buildings, this study performed complete training epoch optimization and parameter scheduling based on the pre-trained YOLOv8 model structure. The training process is shown in Figure 9 and includes a total of 300 epochs. The freezing strategy was adopted in the first 50 epochs, and only the head was trained to stabilize the basic feature extraction structure. The backbone module was then gradually unfrozen to improve the model’s global feature extraction ability. Looking at the training graph, we can see that both the training loss and validation loss start off high, peaking at 108.46 and 24.56 in the first epoch, but then quickly reduce, with the model achieving its best mean average precision (mAP) of 0.76 by the 60th epoch, indicating that the model learns to identify damage features in the images quickly. The validation loss dropped to the lowest point of 4.08 in the 79th epoch, and the recognition effect of the model on the validation set was optimal. During the training process, the mAP curve was stable and converged synchronously with the loss curve, indicating that the model maintained a favorable learning effect while avoiding overfitting. Finally, the training loss dropped to the lowest value of 1.83 at the 272nd epoch, indicating that the overall training process of the model had reached stable convergence.

3.2. Comparison of Indicators

To better understand how well the model works and how stable it is at different training points, this study chose three important training stages for comparison (Figure 10): the 60th stage (where the model had the best mAP), the 79th stage (where the validation loss was lowest), and the 272nd stage (where the training loss was lowest). By comparing the average precision (AP) and log-average miss rate (LAMR) indicators under different tile damage types, the classification ability, robustness, and generalization performance of the model at each stage are explored to provide a basis for the selection and deployment of the final model.
The 60th epoch model reached a peak mAP of 71.97% and showed advantages in identifying cracking and lichen growth damage types, achieving AP values of 0.79 and 0.73, respectively, indicating that the model at this stage has a strong ability to distinguish damaged targets with clear contours and significant texture differences. However, from the perspective of LAMR, the model has a high missed detection rate in the lichen growth and breakage categories (0.72 and 0.68, respectively), indicating that it is still unstable under complex textures and occluded backgrounds, especially when identifying damage in occluded or overlapping tiles; the performance fluctuated slightly.
Although the overall mAP of the 79th epoch model increased slightly to 73.44%, its performance is more balanced. The AP of each category shows that the other four categories are all stable above 0.74, except for the breakage category, which is slightly lower at 0.68; notably, the vegetation growth category demonstrates strong recognition adaptability at 0.77. In the LAMR dimension, the model still has weak control over missed detection of “lichen growth” (0.72), but the missed detection rates in cracking and vegetation growth categories have decreased (0.52 and 0.56, respectively), indicating that the model has certain optimization in the comprehensiveness and stability of damage identification and is suitable for actual detection tasks with diverse scenes and mixed damage types.
In comparison, even though the 272nd epoch model has the lowest training loss at 1.83, its overall mAP is just 68.19%, and the AP values for leaf accumulation and breakage are both 0.62, suggesting that the model might be slightly overfitting or losing its ability to generalize after being trained for a long time. The LAMR results also further support this judgment. The missed detection rates of the model in the breakage and leaf accumulation categories are 0.70 and 0.69, respectively, which are significantly higher than in other stages, showing a lack of recognition when the feature boundaries are blurred or the target area is dense. Therefore, although the model at this stage is fully optimized on the training set, its adaptability to unknown data is weakened, and it is not suitable for the final deployment plan.
To further reveal the detailed performance of the model in actual detection, this study conducted a comprehensive comparison of the key indicators of the 60th, 79th, and 272nd epoch models on five types of damage (breakage, cracking, leaf accumulation, lichen growth, and vegetation growth) (Figure 11), including AP, LAMR, F1, precision, and recall. Table 2 contains the statistical results, highlighting the distinct features of the models’ recognition accuracy and stability across various rounds.
According to the overall trend, the 79th epoch model has more balanced indicators in most categories, especially F1 and Recall, which show a stable improvement. For instance, in the vegetation growth category, the 79th epoch model achieves an F1 score of 0.75 and a recall score of 0.70, which are better than the scores from the other two stages, showing that this model is better at recognizing targets that are hard to see or have low contrast. In contrast, although the 60th epoch model has the highest precision of 0.87 in the cracking category, its recall is only 0.60, and the log-average miss rate is 0.39, indicating that it tends to make high-confidence predictions but has the risk of missed detection and is prone to ignoring some edge or weak texture damage. Additionally, the precision and recall of the 60th epoch model in the cracking and leaf accumulation categories are very different, showing that its way of recognizing issues is not fully balanced, which could result in missing some problems during actual inspections.
Although the training loss of the 272nd epoch model is the smallest, a gap between precision and recall still exists in terms of indicator performance, and the recall of some categories is slightly lower than that of the previous two stages, such as breakage at 0.61 and leaf accumulation at 0.58. At the same time, the F1 indicator is slightly lower than that of the 79th epoch in most categories, indicating that although the model is well fitted in the training set, the recognition consistency is slightly insufficient when generalized to the test set, especially in the detection of breakage and leaf accumulation tiles; thus, stability issues still persist.
To further understand the classification accuracy and confusability of the model for specific category recognition, this study analyzed and compared the standardized confusion matrices generated by the 60th, 79th, and 272nd epoch models, focusing on the clarity of the classification boundaries between different damage types, the distribution of misjudgments, and the influence of background interference (Figure 12, Figure 13 and Figure 14). The confusion matrix not only reveals the recognition accuracy of the model on various types of damage targets but also reflects its ability to handle category similarity and background interference in complex tile surface images.
The confusion matrix for the 79th epoch model showed the best balance, with high accuracy in recognizing all five damage categories. For instance, the recognition rates for lichen growth, cracking, and vegetation growth were 0.78, 0.75, and 0.81, respectively, much better than those of the 60th and 272nd epoch models, showing that it can better tell the categories apart. At the same time, the misclassification ratio on the off-diagonal line was relatively lower, indicating that the model has a stronger ability to suppress the fuzzy boundary between classes (such as the confusion between leaf accumulation and vegetation growth). In contrast, although the recognition accuracy of the 60th epoch model in the breakage and cracking categories also reached 0.71 and 0.75, the confusion between leaf accumulation and background was more obvious. For example, the proportion of leaf accumulation misclassified as background was as high as 0.25, and the proportion of lichen growth misclassified as background was even higher (0.31), indicating that the model still has a lot of room for improvement in the discrimination of targets with complex textures and weak contrast.
Although the 272nd epoch model had the smallest training loss, its confusion matrix showed that the recognition accuracy in the breakage category had dropped to 0.69, and the overall misclassification rate of the background has increased; in particular, the background confusion ratios of breakage and leaf accumulation reached 0.31 and 0.28, respectively, reflecting that the model may contain overfitting after deep training, and its adaptability to inter-class differences in test data decreased. This performance indicates that it is insufficient to simply look at training loss to judge how good the model is; instead, we should assess the model’s ability to understand the differences between classes using tools such as confusion matrices.

3.3. Comparative Analysis of Model Detection Results

To further verify the perception ability and visual focusing effect of the models on the actual tile damage area at different training stages, this study randomly selected five representative tile image samples from the test set and input the 60th epoch (Model 1), 79th epoch (Model 2), and 272nd epoch (Model 3) models to obtain their corresponding object detection heatmaps and visual response results, as shown in Figure 15. By comparing thermal response area, accuracy, and intensity differences in different models for the same image, the feature capture ability and false detection suppression effect of each model on damage types such as cracks, mosses, and plants can be further analyzed.
In sample 1, even though all three models showed thermal responses in the image, they did not accurately focus on the clear crack in the middle of the tile, suggesting that they need to become better at identifying small damages such as cracks. Additionally, on the tiles without clear damage at the bottom of the image, Model 1 and Model 3 created unnecessary thermal spots, showing that they are more likely to misinterpret the texture of the tile surface, while Model 2 did a better job of avoiding this mistake. In addition, on the tiles with no obvious damage at the bottom of the image, Model 1 and Model 3 produced unnecessary thermal focus, reflecting their higher tendency to misjudge the local tile surface texture, while Model 2 avoided this erroneous activation better. Sample 2 showed three tiles with obvious damage, with Model 1 locating the actual damage most accurately. Although Model 2 had the strongest reaction (the heat is deep red), the boundary was slightly blurred. Model 3 had a weaker reaction and failed to fully identify the damaged area, indicating reduced ability to perceive this damage.
Sample 3 contained a composite of tile cracking and accumulation of fallen leaves. In this case, Model 3 exhibited the most dispersed thermal response, with some activation areas deviating from the actual damage location, resulting in a weak overall detection effect; however, both Model 1 and Model 2 accurately captured the damaged center area, and Model 2 demonstrated clearer edge focus. In sample 4, the main feature was the vegetation growth in the center of the tile. Model 2 effectively detected the vegetation growth area and showed a strong thermal response, while Model 3 barely responded and incorrectly focused on the undamaged tile, showing that it struggled to recognize non-geometric damage, such as vegetation growth. Finally, in sample 5, all three models produced excellent thermal responses to the cracked area, indicating that the models performed relatively consistently in the identification of cracks with large areas and obvious texture contrast; however, only Model 2 responded accurately to the moss-covered area in the upper right corner of the image, with the responses of the other two models being weak or deviating from the target, further verifying the comprehensive adaptability of Model 2 to multiple types of damage.
To further verify the impact of the model on the visibility, consistency, and misjudgment of damaged targets in practical applications, this study selected five typical images (Figure 16), input the 60th epoch (Model 1), the 79th epoch (Model 2), and the 272nd epoch (Model 3) models for target detection and statistically and visually compared the category labels, target quantity, and spatial distribution output of each model. By analyzing the number of detections, false detections, and missed detections by the model, its practicality and differences in identifying damages on complex tile surfaces can be more comprehensively evaluated. In sample 1, Model 3 overlooked a clear crack label in the image’s center, suggesting that it still struggles to identify small-scale crack edge features. Although Model 1 recognized more labels, it misclassified the debris on the tile surface in the lower right corner as “damaged”, reflecting its poor robustness to non-structural interferences; Model 2 had the best detection accuracy for “cracks” and “damaged”, but missed a pile of fallen leaves in the upper right corner, indicating that it may still have local neglect when dealing with local dense distribution features. In sample 2, Model 3 misclassified the moss on the tile on the right side of the image as “cracks” and only recognized four of the five real cracks, showing insufficient ability to distinguish similar textures in the context of confusion. Model 1 missed the obvious fallen leaf target. Although Model 2 failed to completely avoid misjudgment, the overall classification balance and boundary control in the “fallen leaf accumulation” and “damaged” categories were more reasonable. It is worth noting that all three models mistakenly identified the dry fallen leaves in the lower left corner of the image as “damaged”, suggesting that there is a certain representation overlap between the texture and the damaged morphology in this area at the visual level, which is one of the difficulties that the current detection strategy has not yet fully solved.
In sample 3, only Model 1 detected the lichen growth in the center of the image; however, it also misidentified a slight scratch on the surface of a tile as “crack”, showing a tendency to be oversensitive; Model 2 was the most comprehensive in identifying “leaf accumulation”, and the boundary and position matched the actual target area; Model 3 had an insufficient number of labels and the most serious missed detection, indicating that its overall feature activation ability was attenuated in weak damage scenarios. Sample 4 further deepened this trend. Model 1 misidentified the natural color difference in the intact tile as “crack”, and Model 3 directly missed a “damaged” target in the upper right corner. Only Model 2 showed a good balance and accuracy in the four types of labels and could consider the recognition tasks of large-scale plants and local structural damage. Finally, in sample 5, Model 3 failed to identify the obvious moss area in the upper right corner of the image, while both Models 1 and 2 were able to successfully mark the area, although Model 1 had slightly broader boundary details.
In summary, the 79th epoch model (Model 2) was most stable in terms of target quantity statistics, spatial distribution coverage, and consistency of multiple types of targets. It not only avoided the overreaction of Model 1 and the significant missed detection of Model 3 but also demonstrated good label quantity control and target morphology recognition capabilities. This visual detection result not only confirms the quantitative indicators and heatmap analysis conclusions from the target quantity level but also further strengthens the practical logic that model selection should be comprehensively considered in multiple dimensions, including detection quantity, semantic accuracy, and error tolerance.

4. Discussion

To further verify the sensitivity and responsiveness of the model to different damage types in actual application scenarios, this study selected five representative types of flat tile surface damage (leaf accumulation, breakage, cracking, and vegetation growth) based on newly collected on-site real-life images and compared the performance of characteristic thermal distribution in real environments of three different training stage models (i.e., the 60th epoch, 79th epoch, and 272nd epoch models), as shown in Figure 17. This analysis demonstrates how well the models focus on specific types of damage and their ability to locate them while also providing real examples of issues such as unclear boundaries, incorrect feature identification, and environmental distractions that might occur during actual detection tasks.
In sample 1, Model 2 showed the highest thermal response in the area where fallen leaves gathered, indicating that it had good perception ability when processing the characteristics of the covering on the tile surface and could accurately focus on the location where leaves were densely accumulated. The responses of Models 1 and 3 to such features were relatively uniform but not concentrated enough; particularly Model 3 was significantly lower than Model 2 in terms of thermal intensity and positioning accuracy, which was consistent with the downward trend in its generalization ability shown in the previous analysis. Sample 2 revealed that all three models could generate thermal responses to the damaged locations of tiles more accurately, with the thermal response in the central area of the image being the strongest, indicating that different models had high consistency and accuracy in processing clear and well-defined damage features. However, Model 2’s response was stronger and more focused overall, which further confirmed its ability to distinguish categories after training; in sample 3, even though all models showed some response to the crack area, the strongest thermal areas were not aligned with the actual crack locations, showing that the current models still struggle to capture details when dealing with thin and linear damage. In addition, interference by background texture and changes in lighting conditions may also explain the deviation in thermal areas. The results for sample 4 indicate that Model 2 exhibits the most prominent thermal response in the moss-covered area at the center of the image, with clear boundaries; in contrast, Models 1 and 3 also respond, but their thermal distribution is lower, and some areas even show background thermal misjudgment. This further shows that Model 2 has better key feature extraction capabilities under complex background and texture interference, especially in detecting anomalies on the surface of tiles with lichen growth, showing stronger focus and stability; in sample 5, the three models all generated significant thermal responses to vegetation growth areas, but the thermal intensity of Model 3 at the center of the image was significantly lower than that of the other two models, and the thermal coverage area was relatively scattered, indicating that its ability to recognize plant damage features was limited. Models 1 and 2 generated both full and accurate thermal concentrations in this area, especially Model 2, which performs better in thermal intensity and regional positioning, indicating that it has stronger adaptability in complex scenes and non-structural damage detection.
To further verify the model’s detection capability and missed detection suppression effect on different types of damage on flat tile surfaces in real environments, we used the samples in Figure 17 and combined the models at different training stages (Models 1, 2, and 3) to conduct a comparative analysis of the detection results to reveal the classification difficulties and response differences faced by the model in diverse environments.
As shown in Figure 18, sample 1 mainly focuses on the leaf accumulation scene. Model 1 mistakenly identified local fallen leaves as breakage in the lower right area of the tile, exposing its limited ability to distinguish similar colors and texture structures. Model 3 failed to cover all fallen leaf areas during the detection of leaf accumulation, resulting in missing labels. In contrast, Model 2 performed relatively well in terms of label integrity and positioning accuracy, considering both detection accuracy and boundary control. Sample 2 contained many features of lichen growth on the tile surfaces. Model 3 missed detections and failed to accurately identify most of the lichen areas in the image; in contrast, both Model 1 and Model 2 could capture the main features of the lichen area well, with Model 2 performing better at detecting local small-area lichens. Sample 3 mainly examined the mixed scene of tile cracks and lichens. The results show that Model 2 not only detected and covered the main crack area but also successfully identified the lichen targets in the corners, showing its adaptability to complex multi-target scenes, while Model 1 and Model 3 were slightly insufficient at detecting corner areas, and there were missing labels. In sample 4, all three models failed to completely detect all damaged areas. Model 1 missed the breakage label in the center of the image, while Model 2 missed the central lichen area. Model 3 had a higher rate of missed lichen detections, exposing its lack of stability in complex textures and overlapping multiple targets. Sample 5 was based mainly on vegetation growth. Combined with local cracking and breakage scenes, Model 1 performed the most accurately in detecting cracking and breakage labels, and its coverage and label positioning were better than the other two models, verifying its feature extraction and recognition effect in scenes with obvious structural damage. Models 2 and 3 had varying degrees of missing detections and misjudgment in label integrity, especially Model 3, whose vegetation growth detection boundaries were blurred and had some missing areas.
Beyond performance comparisons, it is important to understand why the model underperforms in certain categories, such as lichen growth. One possible reason is the subtle visual characteristics of vegetation-like growth, which often blend with the aging textures of clay tiles and exhibit low color contrast. Additionally, moss tends to appear in irregular, small patches, making it difficult for the model to distinguish between noise and actual biological growth. Unlike larger objects such as vegetation clusters or leaf accumulation, lichen lacks consistent shape and boundary cues, which reduces the model’s confidence and detection consistency. This suggests a need for fine-grained supervision strategies or feature-level enhancements to improve the detection of subtle, texture-driven anomalies.
Through systematic model training, verification, and multidimensional test analysis, this study comprehensively evaluated the performance of YOLOv8 in flat tile damage identification on the roofs of ancient buildings in the Jiangnan region. Combining quantitative indicators (including average precision, missed detection rate, F1 score, etc.) and qualitative visualization analysis (heatmap, detection frame comparison, feature response, etc.), the 79th epoch model (Model 2) was finally selected as the best application solution for the study by comprehensively considering detection accuracy, label integrity, false detection suppression, and environmental adaptability. The model demonstrated a balanced performance between accuracy and robustness within the scope of the current dataset, though further validation is needed to confirm generalization across broader scenes and conditions.
Field application tests were conducted on the model to validate the applicability and promotional value of the model in real-world environments and to effectively integrate it into heritage protection workflows. First, Model 2 was integrated into the HBIM-GIS system (Figure 19), which comprehensively manages the digital documentation, intelligent detection, and restoration of architectural heritage. This integration significantly enhances the management and analytical capabilities to protect ancient architectural heritage. Second, Model 2 was applied to the roof of the Feng Yue Painted Terrace Gate, a nationally designated key cultural relic protection unit located in Cicheng Old Town, Jiangbei District, Ningbo City, Zhejiang Province. The model automatically detected roof tile surfaces based on high-resolution aerial images captured by drones. The prediction results are shown in Figure 20. The model successfully located and classified various types of damage in a large number of roof images, including cracks, fissures, lichen growth, and vegetation growth. Finally, the visualized reports and statistical data from the inspection were compared with actual observation results, showing a high degree of consistency, proving its stable detection capability under complex backgrounds, natural lighting, and obstruction interference conditions.
While the experimental results demonstrate that the 79th epoch model achieved the most balanced performance across categories, its relative superiority in identifying vegetation growth and leaf accumulation may stem from the fact that these categories cover larger areas and exhibit stronger color contrast and clearer texture boundaries—features more easily captured by convolutional feature extractors. In contrast, damage types such as cracking and breakage—which often appear as fine lines or fragmented features embedded in weathered textures—are inherently harder to detect due to their subtle intensity gradients and frequent blending with the background. These challenges are particularly evident in misclassification cases where background noise or natural tile patterns are falsely interpreted as cracks or breaks, highlighting the model’s sensitivity to feature-level ambiguity. This suggests that although the model benefits from multi-scale fusion and deep convolutional layers, it still lacks the capacity to robustly discriminate visually similar but semantically different patterns.
From a critical standpoint, such systematic misidentifications imply that current annotation strategies and training data may not be fully sufficient to capture edge-level or low-contrast patterns. Incorporating advanced attention mechanisms or integrating semantic segmentation modules could help strengthen spatial contextual understanding, especially for subtle or overlapping damage types. Moreover, the training data’s limited environmental diversity—e.g., variations in lighting, seasonality, or tile material weathering—may reduce generalization when deploying the model across broader heritage sites. This limitation is particularly relevant in real-world heritage conservation, where such environmental variability is the norm rather than the exception.
The validation of the model is limited by the relatively small size of the validation set, which includes only 40 images. While these images reflect representative roof damage types within Cicheng Old Town, they do not cover broader temporal or spatial variability. In particular, the model has not been tested on independent datasets from other seasons, roof structures, or heritage sites. This limitation constrains our ability to assess the model’s generalization capacity beyond the studied area and may reduce confidence when applying the model to diverse real-world scenarios. Furthermore, while the current model performs well in Cicheng Old Town, its generalizability to other regions and material types may be constrained by several factors. Regional variation in tile fabrication techniques, surface wear, and roofing patterns—such as glazed tiles, wood–shingle combinations, or different mortar materials—can introduce new feature distributions that the model was not trained on. Seasonal variations may also affect image clarity and feature salience, for example, through lighting changes, shadowing, or bio-growth states. As such, deploying this approach to other heritage sites requires either re-training with localized data or adapting the model through transfer learning to maintain detection accuracy. These considerations highlight the importance of future work focusing on model adaptability and scene-invariant robustness.
Despite these limitations, the model shows promising application value when embedded into practical conservation workflows. For instance, rapid identification of moss and lichen growth is critical for preventing biological corrosion and water seepage in traditional clay tiles, and early warning through automated drone detection can significantly reduce the time window for irreversible damage. Additionally, when integrated into Heritage Building Information Modeling (HBIM) systems, the model’s output can be stored, queried, and visualized alongside 3D reconstructions, enabling longitudinal monitoring and predictive maintenance. This reflects a paradigm shift from passive inspection to intelligent, data-driven management of architectural heritage assets. Therefore, while technical improvements remain necessary, the present model already contributes toward operationalizing smart diagnostics in cultural heritage practice.

5. Conclusions

This study applied deep learning to address the urgent needs in the field of architectural heritage preservation by developing a YOLOv8-based model for detecting flat tile roof damage in Jiangnan’s traditional buildings. Through a systematic process—including UAV data collection, image preprocessing, manual annotation, and model training and validation—this study demonstrated that the model trained at the 79th epoch achieved the best performance, with an overall mAP of 73.44%, outperforming both the 60th (71.97%) and 272nd (68.19%) epoch models. In the vegetation growth category, the model achieved an F1 score of 0.75 and a recall of 0.70, indicating strong adaptability in multi-target recognition. The results obtained from applying the model to drone imagery of real heritage sites further validate its detection accuracy and practical feasibility under complex lighting and occlusion conditions.
Despite these achievements, the model still shows limitations in recognizing fine-grained damage such as small cracks, and its generalization remains constrained by the current dataset’s diversity. Future work should expand the dataset’s sample diversity across seasons and lighting conditions, incorporate modules such as attention mechanisms or semantic segmentation, and explore multi-modal data fusion (e.g., infrared or 3D point clouds). These enhancements will help to build a more intelligent, robust, and lifecycle-oriented system for the conservation of architectural heritage.

Author Contributions

Conceptualization, Y.C. and L.Z.; methodology, Y.C. and L.Z.; software, Y.C. and L.Z.; validation, H.S., Y.C. and L.Z.; formal analysis, H.S., Y.C. and L.Z.; investigation, H.S.; resources, H.S.; data curation, H.S.; writing—original draft preparation, H.S., Y.C. and L.Z.; writing—review and editing, H.S., Y.C. and L.Z.; visualization, H.S., Y.C. and L.Z.; supervision, Y.C.; project administration, L.Z.; funding acquisition, L.Z. All authors have read and agreed to the published version of the manuscript.

Funding

This research was supported by Faculty Research Grants funded by Macau University of Science and Technology (grant number: FRG-25-041-FA).

Institutional Review Board Statement

Not applicable for studies not involving humans or animals.

Informed Consent Statement

Not applicable for studies not involving humans.

Data Availability Statement

Haina Song organized and participated in this study’s investigation and has all the original data. Anyone who is interested or wants to learn more, please contact Haina Song (songhaina@zwu.edu.cn) for further information.

Acknowledgments

We sincerely thank the staff who provided assistance during the investigation of Cicheng Old Town.

Conflicts of Interest

The authors declared no potential conflicts of interest with respect to the research, authorship, and/or publication of this article.

References

  1. Winners of 2009 UNESCO Asia-Pacific Awards for Cultural Heritage Conservation. 2009. Available online: https://www.unesco.org/en/articles/winners-heritageawards (accessed on 10 May 2025).
  2. Knapp, R.G. Chinese Houses: The Architectural Heritage of a Nation; Tuttle Publishing: North Clarendon, VT, USA, 2012. [Google Scholar]
  3. Xu, M. Study on History of Little Black Tile in China. J. Chin. Cult. 2014, 4, 86–91. [Google Scholar]
  4. Bown, M.; Miller, K. The use of unmanned aerial vehicles for sloped roof inspections–considerations and constraints. J. Facil. Manag. Educ. Res. 2018, 2, 12–18. [Google Scholar] [CrossRef] [PubMed]
  5. Wei, C. Endless Sights of Tiled Buildings: A Discussion of the Association Between the Developments of the Tiled Roofs and the Wooden Structures System. Archit. J. 2019, 12, 20–27. [Google Scholar]
  6. Jiazhi, L. Influence of “Qin Brick and Han Tile” in History. J. Build. Mater. 1998, 1, 26–29. [Google Scholar]
  7. Ahn, K.; Han, M.S. Characteristic classification using physicochemical analysis data of ancient roof tiles. J. Radioanal. Nucl. Chem. 2023, 332, 5289–5298. [Google Scholar] [CrossRef]
  8. Sharon, W.W.Y.; Darith, E.; Rachna, C.; Suy, T.B. Two traditions: A comparison of roof tile manufacture and usage in Angkor and China. Asian Perspect. 2021, 60, 128–156. Available online: https://www.jstor.org/stable/27136713 (accessed on 12 May 2025). [CrossRef]
  9. Cuilin, L. Construction and Craftsmanship of Tile Roofing in Jiang-Zhe Area. Master’s Thesis, Southeast University, Nanjing, China, 2016. [Google Scholar]
  10. Chen, Y. An ‘Anthropo-Architectural Approach’ to Integrated Conservation: A Case Study of Cultural Heritage Associated with the Traditional Chinese Roof Tile Industry, in School of Architecture, Design and Planning. Ph.D. Thesis, The University of Queensland, Brisbane, Australia, 2024. Available online: https://espace.library.uq.edu.au/view/UQ:435e694 (accessed on 10 May 2025).
  11. Yong, L. Research on the Brick and Tile Craftsmanship of Huizhou Traditional Residence in the Ming and Qing Dynasties, in School of Architeture and Urban Planning. Master’s Thesis, Anhui Jianzhu University, Hefei, China, 2023. [Google Scholar]
  12. Guo, Q. Tile and Brick Making in China: A Study of the “Yingzao Fashi”. Constr. Hist. 2000, 16, 3–11. [Google Scholar]
  13. Yang, W.; Wen, X. Antique blue brick and fired common brick on the quality of the research. China Build. Mater. Sci. Technol. 2017, 26, 20–22. [Google Scholar]
  14. Zhao, P.; Zhang, X.; Qin, L.; Zhang, Y.; Zhou, L. Conservation of disappearing traditional manufacturing process for Chinese grey brick: Field survey and laboratory study. Constr. Build. Mater. 2019, 212, 531–540. [Google Scholar] [CrossRef]
  15. Peng, Z. Deterioration Mechanism of Grey Brick and Masonry Structures Under the Action of Load and Environment in Materials Science and Engineering School. Ph.D. Thesis, Southeast University, Nanjing, China, 2015. [Google Scholar]
  16. Dai, S.; Huang, J.; Shen, Z.; Zhou, Y.; Ju, F. Characteristics of Historic Roof tiles and Proposed Technical Standard for Restoration of traditional architecture in the Southern Shanxi Province, China. In Proceedings of the 2014 Conference on Architectural Historian Studies of China, Fuzhou, China, 18 October 2014. [Google Scholar]
  17. Bi, S.; Du, J.; Tian, Z.; Zhang, Y. Investigating the spatial distribution mechanisms of traditional villages from the human geography region: A case study of Jiangnan, China. Ecol. Inform. 2024, 81, 102649. [Google Scholar] [CrossRef]
  18. Zheng, L.; Chen, Y.; Yan, L.; Zhang, Y. Automatic detection and recognition method of Chinese clay tiles based on YOLOv4: A case study in Macau. Int. J. Archit. Herit. 2024, 18, 1551–1570. [Google Scholar] [CrossRef]
  19. Yang, X.; Zheng, L.; Chen, Y.; Feng, J.; Zheng, J. Recognition of Damage Types of Chinese Gray-Brick Ancient Buildings Based on Machine Learning—Taking the Macau World Heritage Buffer Zone as an Example. Atmosphere 2023, 14, 346. [Google Scholar] [CrossRef]
  20. Hao, Y.; Yao, Z.; Wu, R.; Bao, Y. Damage and restoration technology of historic buildings of brick and wood structures: A review. Herit. Sci. 2024, 12, 301. [Google Scholar] [CrossRef]
  21. Llamas, J.; Lerones, M.P.; Medina, R.; Zalama, E.; Gómez-García-Bermejo, J. Classification of Architectural Heritage Images Using Deep Learning Techniques. Appl. Sci. 2017, 7, 992. [Google Scholar] [CrossRef]
  22. Solla, M.; Maté-González, M.Á.; Blázquez, C.S.; Lagüela-López, S.; Nieto, I.M. Analysis of structural integrity through the combination of non-destructive testing techniques in heritage inspections: The study case of San Segundo’s hermitage (Ávila, Spain). J. Build. Eng. 2024, 89, 109295. [Google Scholar] [CrossRef]
  23. Akinosho, T.D.; Oyedele, L.O.; Bilal, M.; Ajayi, A.O.; Delgado, M.D.; Akinade, O.O.; Ahmed, A.A. Deep learning in the construction industry: A review of present status and future innovations. J. Build. Eng. 2020, 32, 101827. [Google Scholar] [CrossRef]
  24. Yan, L.; Chen, Y.; Zheng, L.; Zhang, Y. Application of computer vision technology in surface damage detection and analysis of shedthin tiles in China: A case study of the classical gardens of Suzhou. Herit. Sci. 2024, 12, 72. [Google Scholar] [CrossRef]
  25. Wang, N.; Zhao, X.; Zhao, P.; Zhang, Y.; Zou, Z.; Ou, J. Automatic damage detection of historic masonry buildings based on mobile deep learning. Autom. Constr. 2019, 103, 53–66. [Google Scholar] [CrossRef]
  26. Ravichand, M.; Kumar, R.; Hazela, B.; Suthar, T. Crack on brick wall detection by computer vision using machine learning. In Proceedings of the 2022 6th International Conference on Electronics, Communication and Aerospace Technology, Coimbatore, India, 1–3 December 2022; IEEE: Danvers, MA, USA, 2022; pp. 1017–1020. [Google Scholar] [CrossRef]
  27. Wang, N.; Zhao, X.; Zou, Z.; Zhao, P.; Qi, F. Autonomous damage segmentation and measurement of glazed tiles in historic buildings via deep learning. Comput.-Aided Civ. Infrastruct. Eng. 2020, 35, 277–291. [Google Scholar] [CrossRef]
  28. Xu, J.; Zeng, F.; Liu, W.; Takahashi, T. Damage Detection and Level Classification of Roof Damage after Typhoon Faxai Based on Aerial Photos and Deep Learning. Appl. Sci. 2022, 12, 4912. [Google Scholar] [CrossRef]
  29. Diwan, T.; Anirudh, G.; Tembhurne, J.V. Object detection using YOLO: Challenges, architectural successors, datasets and applications. Multimed. Tools Appl. 2023, 82, 9243–9275. [Google Scholar] [CrossRef] [PubMed]
  30. Terven, J.; Córdova-Esparza, D.-M.; Romero-González, J.-A. A Comprehensive Review of YOLO Architectures in Computer Vision: From YOLOv1 to YOLOv8 and YOLO-NAS. Mach. Learn. Knowl. Extr. 2023, 5, 1680–1716. [Google Scholar] [CrossRef]
  31. Sohan, M.; Ram, T.S.; Reddy, C.V.R. A review on yolov8 and its advancements. In Data Intelligence and Cognitive Informatics; Jacob, I.J., Piramuthu, S., Falkowski-Gilski, P., Eds.; ICDICI 2023; Algorithms for Intelligent Systems; Springer: Singapore, 2023. [Google Scholar] [CrossRef]
  32. Qiu, H.; Zhang, J.; Zhuo, L.; Xiao, Q.; Chen, Z.; Tian, H. Research on intelligent monitoring technology for roof damage of traditional Chinese residential buildings based on improved YOLOv8: Taking ancient villages in southern Fujian as an example. Herit. Sci. 2024, 12, 231. [Google Scholar] [CrossRef]
  33. Gao, C.; Zhang, Q.; Tan, Z.; Zhao, G.; Gao, S.; Kim, E.; Shen, T. Applying optimized YOLOv8 for heritage conservation: Enhanced object detection in Jiangnan traditional private gardens. Herit. Sci. 2024, 12, 31. [Google Scholar] [CrossRef]
  34. Colucci, E.; Iacono, E.; Matrone, F.; Ventura, G.M. The development of a 2D/3D BIM-GIS web platform for planned maintenance of built and cultural heritage: The MAIN10ANCE project. Int. Arch. Photogramm. Remote Sens. Spat. Inf. Sci. 2023, 48, 433–439. [Google Scholar] [CrossRef]
  35. Vacca, G.; Quaquero, E.; Pili, D.; Brandolini, M. GIS-HBIM integration for the management of historical buildings. Int. Arch. Photogramm. Remote Sens. Spat. Inf. Sci. 2018, 42, 1129–1135. [Google Scholar] [CrossRef]
  36. Ávila, F.; Blanca-Hoyos, Á.; Puertas, E.; Gallego, R. HBIM: Background, Current Trends, and Future Prospects. Appl. Sci. 2024, 14, 11191. [Google Scholar] [CrossRef]
  37. Rolim, R.; López-González, C.; Viñals, M.J. Analysis of the Current Status of Sensors and HBIM Integration: A Review Based on Bibliometric Analysis. Heritage 2024, 7, 2071–2087. [Google Scholar] [CrossRef]
  38. Murphy, M.; McGovern, E.; Pavia, S. Historic building information modelling (HBIM). Struct. Surv. 2009, 27, 311–327. [Google Scholar] [CrossRef]
  39. Lovell, L.J.; Davies, R.J.; Hunt, D.V.L. The Application of Historic Building Information Modelling (HBIM) to Cultural Heritage: A Review. Heritage 2023, 6, 6691–6717. [Google Scholar] [CrossRef]
  40. Mol, A.; Cabaleiro, M.; Sousa, H.S.; Branco, J.M. HBIM for storing life-cycle data regarding decay and damage in existing timber structures. Autom. Constr. 2020, 117, 103262. [Google Scholar] [CrossRef]
  41. Dionizio, R.F.; Dezen-Kempter, E. From Data and Metadata to HBIM-GIS Integration. Int. J. Archit. Herit. 2024, 1–14. [Google Scholar] [CrossRef]
  42. Li, Q.; Zhang, T.; Fang, Y.; Lin, F. A Pathological Diagnostic Method for Traditional Brick-Masonry Dwellings: A Case Study in Guangfu Ancient City. Buildings 2024, 14, 3563. [Google Scholar] [CrossRef]
  43. Liu, S.; Wang, R.; Yu, J.; Peng, X.; Cai, Y.; Tu, B. Effectiveness of the anti-erosion of an MICP coating on the surfaces of ancient clay roof tiles. Constr. Build. Mater. 2020, 243, 118202. [Google Scholar] [CrossRef]
Figure 1. Location of Cicheng Old Town (image source: illustration drawn by the authors).
Coatings 15 00761 g001
Figure 2. The pattern of Cicheng Old Town and the distribution of ancient buildings (image source: illustration drawn by the authors).
Coatings 15 00761 g002
Figure 3. Flat tiles on ancient buildings in Cicheng Old Town (image source: illustration drawn by the authors).
Coatings 15 00761 g003
Figure 4. On-site images of flat tiles’ restoration. (Image source: photographed by the authors).
Coatings 15 00761 g004
Figure 5. Causes, processes, and types of damage to flat tiles (image source: illustration drawn by the authors).
Coatings 15 00761 g005
Figure 6. Research process. The Chinese in the picture is because it is the Chinese version of the software interface (image source: illustration drawn by the authors).
Coatings 15 00761 g006
Figure 7. Image collection locations. (a) Feng’s Color Decorated Courtyard; (b) Qian Zhao’s Residence; (c) Confucian Temple (image source: photographed by the authors).
Coatings 15 00761 g007
Figure 8. Model structure design (image source: illustration drawn by the authors).
Coatings 15 00761 g008
Figure 9. Loss statistics during model training (Image source: illustration drawn by the authors).
Coatings 15 00761 g009
Figure 10. Model mAP and LAMR numerical statistics: (1) 60th epoch model; (2) 79th epoch model; (3) 272nd epoch model (Image source: illustration drawn by the authors).
Coatings 15 00761 g010
Figure 11. Parameter statistics of different algebraic models. In the figure, F1* indicates score threshold = 0.5; Recall* indicates score threshold = 0.5; Precision* indicates score threshold = 0.5. The green triangle represents the Max Value; the red triangle represents the Min Value (Image source: illustration drawn by the authors).
Coatings 15 00761 g011
Figure 12. Confusion matrix of Model 1 (YOLOv8 trained at the 60th epoch). The diagonal cells represent correct predictions, while off-diagonal cells indicate misclassification, particularly evident in background confusion for lichen growth and leaf accumulation (Image source: illustration drawn by the authors).
Coatings 15 00761 g012
Figure 13. Confusion matrix of Model 2 (YOLOv8 trained at the 79th epoch), showing the most balanced classification performance across categories. High diagonal values reflect improved recognition accuracy and reduced false negatives, especially for vegetation growth (Image source: illustration drawn by the authors).
Coatings 15 00761 g013
Figure 14. Confusion matrix of Model 3 (YOLOv8 trained at the 272nd epoch), highlighting performance degradation due to overfitting. Increased background misclassification in categories such as breakage and leaf accumulation indicates diminished generalization (Image source: illustration drawn by the authors).
Coatings 15 00761 g014
Figure 15. Comparative feature heatmaps of Models 1, 2, and 3 applied to five test samples. Warmer regions (red) indicate stronger model attention. Model 2 consistently localizes damage more accurately, avoiding unnecessary activation in undamaged areas (image source: illustration drawn by the authors. Note: The heatmaps shown are not associated with infrared thermography. They visualize the activation intensity of intermediate feature layers within the YOLOv8 model, representing the model’s focus during object detection, not real-world temperature values.
Coatings 15 00761 g015
Figure 16. Model test results combined with damage quantity statistics (Image source: illustration drawn by the authors).
Coatings 15 00761 g016
Figure 17. Feature heatmap comparisons across three models based on real-world heritage tile images. Circles highlight differences in focus regions. Model 2 shows stronger and more focused responses to actual damage, supporting its field applicability (image source: illustration drawn by the authors. Note: The heatmaps shown are not associated with infrared thermography. They visualize the activation intensity of intermediate feature layers within the YOLOv8 model, representing the model’s focus during object detection, not real-world temperature values.
Coatings 15 00761 g017
Figure 18. Model test results based on on-site real-life pictures (Image source: illustration drawn by the authors).
Coatings 15 00761 g018
Figure 19. Workflow for the protection of architectural heritage (Image source: illustration drawn by the authors).
Coatings 15 00761 g019
Figure 20. Model detection results based on on-site drone images. (15) are the five sites where the field experiment was carried out (image source: illustration drawn by the authors).
Coatings 15 00761 g020
Table 1. Terminology and related explanations in this study.
TermExplanation
Heatmap (in AI models)A visual representation of model attention or feature activation across an image. Colors indicate intensity, not physical temperature.
mAP (Mean Average Precision)A standard metric in object detection that evaluates the average precision across all classes, reflecting both recall and precision.
F1 ScoreThe harmonic mean of precision and recall, measuring the model’s accuracy and completeness in detecting true positives.
LAMR (Log-Average Miss Rate)A metric that calculates the average miss rate across multiple thresholds, weighted logarithmically. It reflects the robustness of detection performance.
Confusion MatrixA table summarizing the model’s classification results by comparing actual labels to predicted labels. Diagonal values represent correct predictions.
HBIM (Heritage Building Information Modeling)A digital modeling method for documenting, managing, and preserving architectural heritage using 3D models and metadata.
GeneralizationThe ability of a trained model to perform well on new, unseen data, beyond the training dataset.
OverfittingA condition where a model performs well on training data but poorly on unseen data due to excessive learning of training-specific patterns.
Table 2. Parameter statistics of different algebraic models.
EpochClassAverage PrecisionLog-Average Miss RateF1*Precision*Recall*
60Breakage0.650.680.640.730.57
Cracking0.790.390.720.870.6
Leaf Accumulation0.720.560.640.780.54
Lichen Growth0.730.720.680.70.66
Vegetation Growth0.70.650.640.680.6
79Breakage0.680.670.690.740.65
Cracking0.740.520.710.830.62
Leaf Accumulation0.740.580.690.770.62
Lichen Growth0.750.720.680.690.67
Vegetation Growth0.770.560.750.780.7
272Breakage0.620.70.650.70.61
Cracking0.70.520.710.80.64
Leaf Accumulation0.620.690.640.70.58
Lichen Growth0.740.590.70.720.67
Vegetation Growth0.730.650.70.70.68
Source: Statistics from the authors, based on model training results. In this Table, F1* indicates score threshold = 0.5; Precision* indicates score threshold = 0.5; Recall* indicates score threshold = 0.5.
Disclaimer/Publisher’s Note: The statements, opinions and data contained in all publications are solely those of the individual author(s) and contributor(s) and not of MDPI and/or the editor(s). MDPI and/or the editor(s) disclaim responsibility for any injury to people or property resulting from any ideas, methods, instructions or products referred to in the content.

