Article

Study on the Damage Evolution Mechanism of FRP-Reinforced Concrete Subjected to Coupled Acid–Freeze Erosion

1
Longjian Road & Bridge Co., Ltd., Harbin 150090, China
2
School of Civil Engineering and Transportation, Northeast Forestry University, Harbin 150040, China
3
School of Civil Engineering and Architectural, East University of Heilongjiang, Harbin 150066, China
4
School of Architecture & Design, China University of Mining and Technology, Xuzhou 221008, China
*
Authors to whom correspondence should be addressed.
Coatings 2025, 15(7), 759; https://doi.org/10.3390/coatings15070759 (registering DOI)
Submission received: 9 June 2025 / Revised: 22 June 2025 / Accepted: 23 June 2025 / Published: 26 June 2025
(This article belongs to the Special Issue Surface Treatments and Coatings for Asphalt and Concrete)

Abstract

Plain concrete specimens and FRP(Fiber Reinforced Polymer)-reinforced concrete specimens were fabricated to investigate concrete’s mechanical and surface degradation behaviors reinforced with carbon, basalt, glass, and aramid fiber-reinforced polymer under coupled sulfuric acid and freeze–thaw cycles. The compressive strength of fully wrapped FRP cylindrical specimens and the flexural load capacity of prismatic specimens with FRP reinforced to the pre-cracked surface, along with the dynamic elastic modulus and mass loss, were evaluated before and after acid–freeze cycles. The degradation mechanism of the specimens was elucidated through analysis of surface morphological changes captured in photographs, scanning electron microscopy (SEM) observations, and energy-dispersive spectroscopy (EDS) data. The experimental results revealed that after 50 cycles of coupled acid–freeze erosion, the plain cylindrical concrete specimens showed a mass gain of 0.01 kg. In contrast, after 100 cycles, a significant mass loss of 0.082 kg was recorded. The FRP-reinforced specimens initially demonstrated mass loss trends comparable to those of the plain concrete specimens. However, in the later stages, the FRP confinement effectively mitigated the surface spalling of the concrete, leading to a reversal in mass loss and subsequent mass gain. Notably, the GFRP(Glassfiber Reinforced Polymer)-reinforced specimens exhibited the most significant mass gain of 1.653%. During the initial 50 cycles of acid–freeze erosion, the prismatic and cylindrical specimens demonstrated comparable degradation patterns. However, in the subsequent stages, FRP reduced the exposed surface area-to-volume ratio of the specimens in contact with the acid solution, resulting in a marked improvement in their structural integrity. After 100 cycles of acid–freeze erosion, the compressive strength loss rate and flexural load capacity loss rate followed the ascending order: CFRP-reinforced < BFRP(Basalt Fiber Reinforced Polymer)-reinforced < AFRP(Aramid Fiber Reinforced Polymer)-reinforced < GFRP-reinforced < plain specimens. Conversely, the ductility ranking from highest to lowest was AFRP/GFRP > control group > BFRP/CFRP. A probabilistic analysis model was established to complement the experimental findings, encompassing the quantification of hazard levels and reliability indices.

1. Introduction

Concrete, one of the most widely utilized construction materials globally, is often subjected to complex environmental conditions that accelerate the degradation of its mechanical properties [1,2,3,4]. The reinforcement of existing concrete structures and the enhancement in the load-bearing capacity of new concrete structures due to changes in their usage have consistently been key research focuses for scholars. Traditional methods such as demolition and reconstruction, or increasing the cross-sectional area, contribute to environmental pollution and reduce the structure’s adequate utilization space. Fiber-reinforced plastic (FRP), characterized by high strength, corrosion resistance, and lightweight properties, can enhance the mechanical strength of concrete and extend its service life when used for reinforcement. This method represents a green, environmentally friendly, and auspicious approach to structural repair and reinforcement [5,6,7].
Given the extensive application of concrete across various construction domains, FRP-reinforced concrete structures may frequently be exposed to high temperatures, freeze–thaw (FT) cycles, and other harsh environments. Studies have shown that the transverse shear strength of basalt fiber-reinforced polymer (BFRP) rods immersed in a solution with a pH of 13.2 decreased by 47.08% and 6.17%, compared to rods immersed in solutions with a pH of 10.1 [8]. Kim et al. [9] reported that the tensile strength of glass fiber-reinforced polymer (GFRP) samples immersed in alkaline solutions at 80 °C was reduced by 15.7% and 20.3%, compared to samples immersed in tap water and 3% NaCl solutions. D’Antino et al. [10] further demonstrated that GFRP rods exhibited relatively low residual strength retention rates in solutions with higher alkalinity.
In recent years, numerous experts and scholars have conducted extensive experimental investigations into using fiber-reinforced polymer for concrete reinforcement. Some researchers have primarily focused on such reinforced structures’ mechanical properties and failure mechanisms [11,12,13,14]. Hamrat et al. [15] attempted to elaborate the reinforcement performance of fiber-composite-reinforced structures from the perspective of numerical simulation and, combined with experiments, predicted the load-deflection behavior of RC beams and evaluated the interfacial shear stress. Maio’s numerical fracture model [16], combining the cohesive fracture method and embedded truss model, simulated structural damage under quasi-static loads. Small-amplitude free vibration analysis yielded the dynamic response, and numerical results matched experimental data. This confirmed the model’s applicability for FRP-reinforced concrete damage identification. Song et al. [17] explored the influence of parameters, such as the number of fiber-reinforced polymer layers and concrete strength, on the stress–strain curve and toughness. Golham et al. [18] found that applying fiber-reinforced polymer improved the flexural bearing capacity, stiffness, and deflection under service loads. Noha et al. [19] investigated the mechanical behavior of self-compacting concrete reinforced with glass fibers under torsional loading, analyzing the failure modes, stress distribution, and ultimate load of the reinforced components through finite element simulations.
Additionally, some scholars have concentrated on the durability performance of fiber-reinforced concrete [20,21,22,23]. Wang et al. [20] examined the flexural performance of basalt fiber-reinforced polymer-reinforced concrete under three chemical erosion environments (acid, alkali, and salt), analyzing the degradation trends of structural performance influenced by the number of fiber-reinforced polymer layers and the concentration of the erosion solution. Li et al. [24] compared different carbon fiber-reinforced polymer (CFRP) reinforcement methods for concrete repair, revealing the failure mechanisms at the component interface under chloride salt erosion.
Current research predominantly centers on assessing the durability of concrete reinforced with a single type of fiber composite material. However, variations exist in the performance and reinforcement effects of different types of fiber composite materials on concrete. Additionally, there remains a notable gap in the research regarding strength prediction models for concrete reinforced with various types of fiber composite materials under acid–freeze coupling conditions. Therefore, this study selected four representative types of fiber-reinforced polymer (carbon fiber-reinforced polymer, basalt fiber-reinforced polymer, glass fiber-reinforced polymer, and arylon fiber-reinforced polymer). Considering the working conditions of concrete structures in cold regions, the reinforcement effects of fiber-reinforced polymer under combined acid and freeze–thaw erosion were explored, and the degradation laws of fiber-reinforced polymer-reinforced concrete in cold-region chemical erosion environments were investigated. These findings provide a theoretical foundation for practical engineering applications.

2. Test Introduction

2.1. Test Block and Erosion Environment

The concrete specimens were prepared using ordinary Portland cement, locally sourced river sand, classified as medium-grained, continuously graded crushed aggregates, and potable tap water. The concrete was mixed, cast, and cured under standard conditions for 28 days, adhering to the mix proportions specified in Table 1.
The concrete specimens were reinforced with four types of fiber-reinforced polymers: carbon fiber-reinforced polymer (CFRP), basalt fiber-reinforced polymer (BFRP), aramid fiber-reinforced polymer (AFRP), and glass fiber-reinforced polymer (GFRP). An epoxy resin adhesive with a weight ratio of 2:1 (resin to hardener) was employed as the bonding agent between the concrete interfaces. Table 2 presents the material properties of the four fiber-reinforced polymers (CFRP, BFRP, AFRP, GFRP) and the epoxy resin adhesive. Figure 1 shows the fiber-reinforced composite material, epoxy resin, and curing agent adopted in this study.
Given the differing force conditions between the cylinder and the prism (unlike the prism, the cylinder exhibits inherent symmetry and uniform stress distribution), the strategy of partially reinforcing the prism while fully encapsulating the cylinder was adopted.
Initially, a diamond saw was employed to create a 40 mm deep notch on the tension side at the mid-span of the prismatic specimens with dimensions of 100 mm × 100 mm × 400 mm (a group of three specimens). The wet lay-up technique was utilized to bond FRP sheets measuring 100 mm × 300 mm × 0.165 mm onto the notched surface. Before bonding with the fibers, the surface was ground. Epoxy resin was evenly applied to the sawtooth-shaped concrete surface. A layer of unidirectional dry fiber cloth was coated with epoxy resin to form a fiber cloth composite system. Then, another layer of epoxy resin was applied to the other side and cured at room temperature for 7 days, finalizing the fabrication of FRP-strengthened concrete flexural specimens. This process is schematically illustrated in Figure 2a.
Cylindrical specimens were selected for the FRP-strengthened concrete compressive specimens (a group of three specimens). The wet lay-up method was applied to externally bond FRP onto the cylinder surfaces, which were subsequently subjected to compressive testing. The outer surface of the specimens was ground smooth. Each specimen’s surface was cleaned with an air brush to remove unnecessary dust and cement particles. Then, the selected cylinder was wrapped with a single layer of fiber cloth (200 mm × 340 mm × 0.165 mm) and bonded with epoxy resin. The lap length of the outer wrap of the fiber cloth around the circumference was 25 mm (1/4 of the circumference of the specimen’s circular cross-section), which not only avoided waste of the fiber cloth material but also prevented debonding at the lap interface when the specimen was under pressure. The top and bottom of the cylinder wrapped with the fiber cloth were covered with epoxy resin (approximately 5 mm thick) to prevent the concrete surface from coming into direct contact with the coupling erosion environment through the unwrapped area. The specimen was cured and aged at room temperature for 7 days. This configuration is depicted in Figure 2b.
The specimens were systematically classified and coded based on FRP type and freeze–thaw cycles. The coding system followed a three-segment format: for instance, “C-F-0” represents a CFRP-reinforced specimen undergoing zero freeze–thaw cycles, while “P-F-0” denotes a plain concrete specimen with zero cycles.
After being cured for 28 days, the specimens were immersed in a 5% sulfuric acid solution to undergo a coupled sulfate attack and freeze–thaw cycling test. The freeze–thaw testing was conducted following the accelerated freeze–thaw method specified in the Chinese National Standard GB/T 50082-2009 [26]. The freeze–thaw cycling parameters were set with a temperature range of −18 °C to 18 °C and a cycle duration of 3 h per cycle. The freeze–thaw testing apparatus used in this study is schematically shown in Figure 3a.

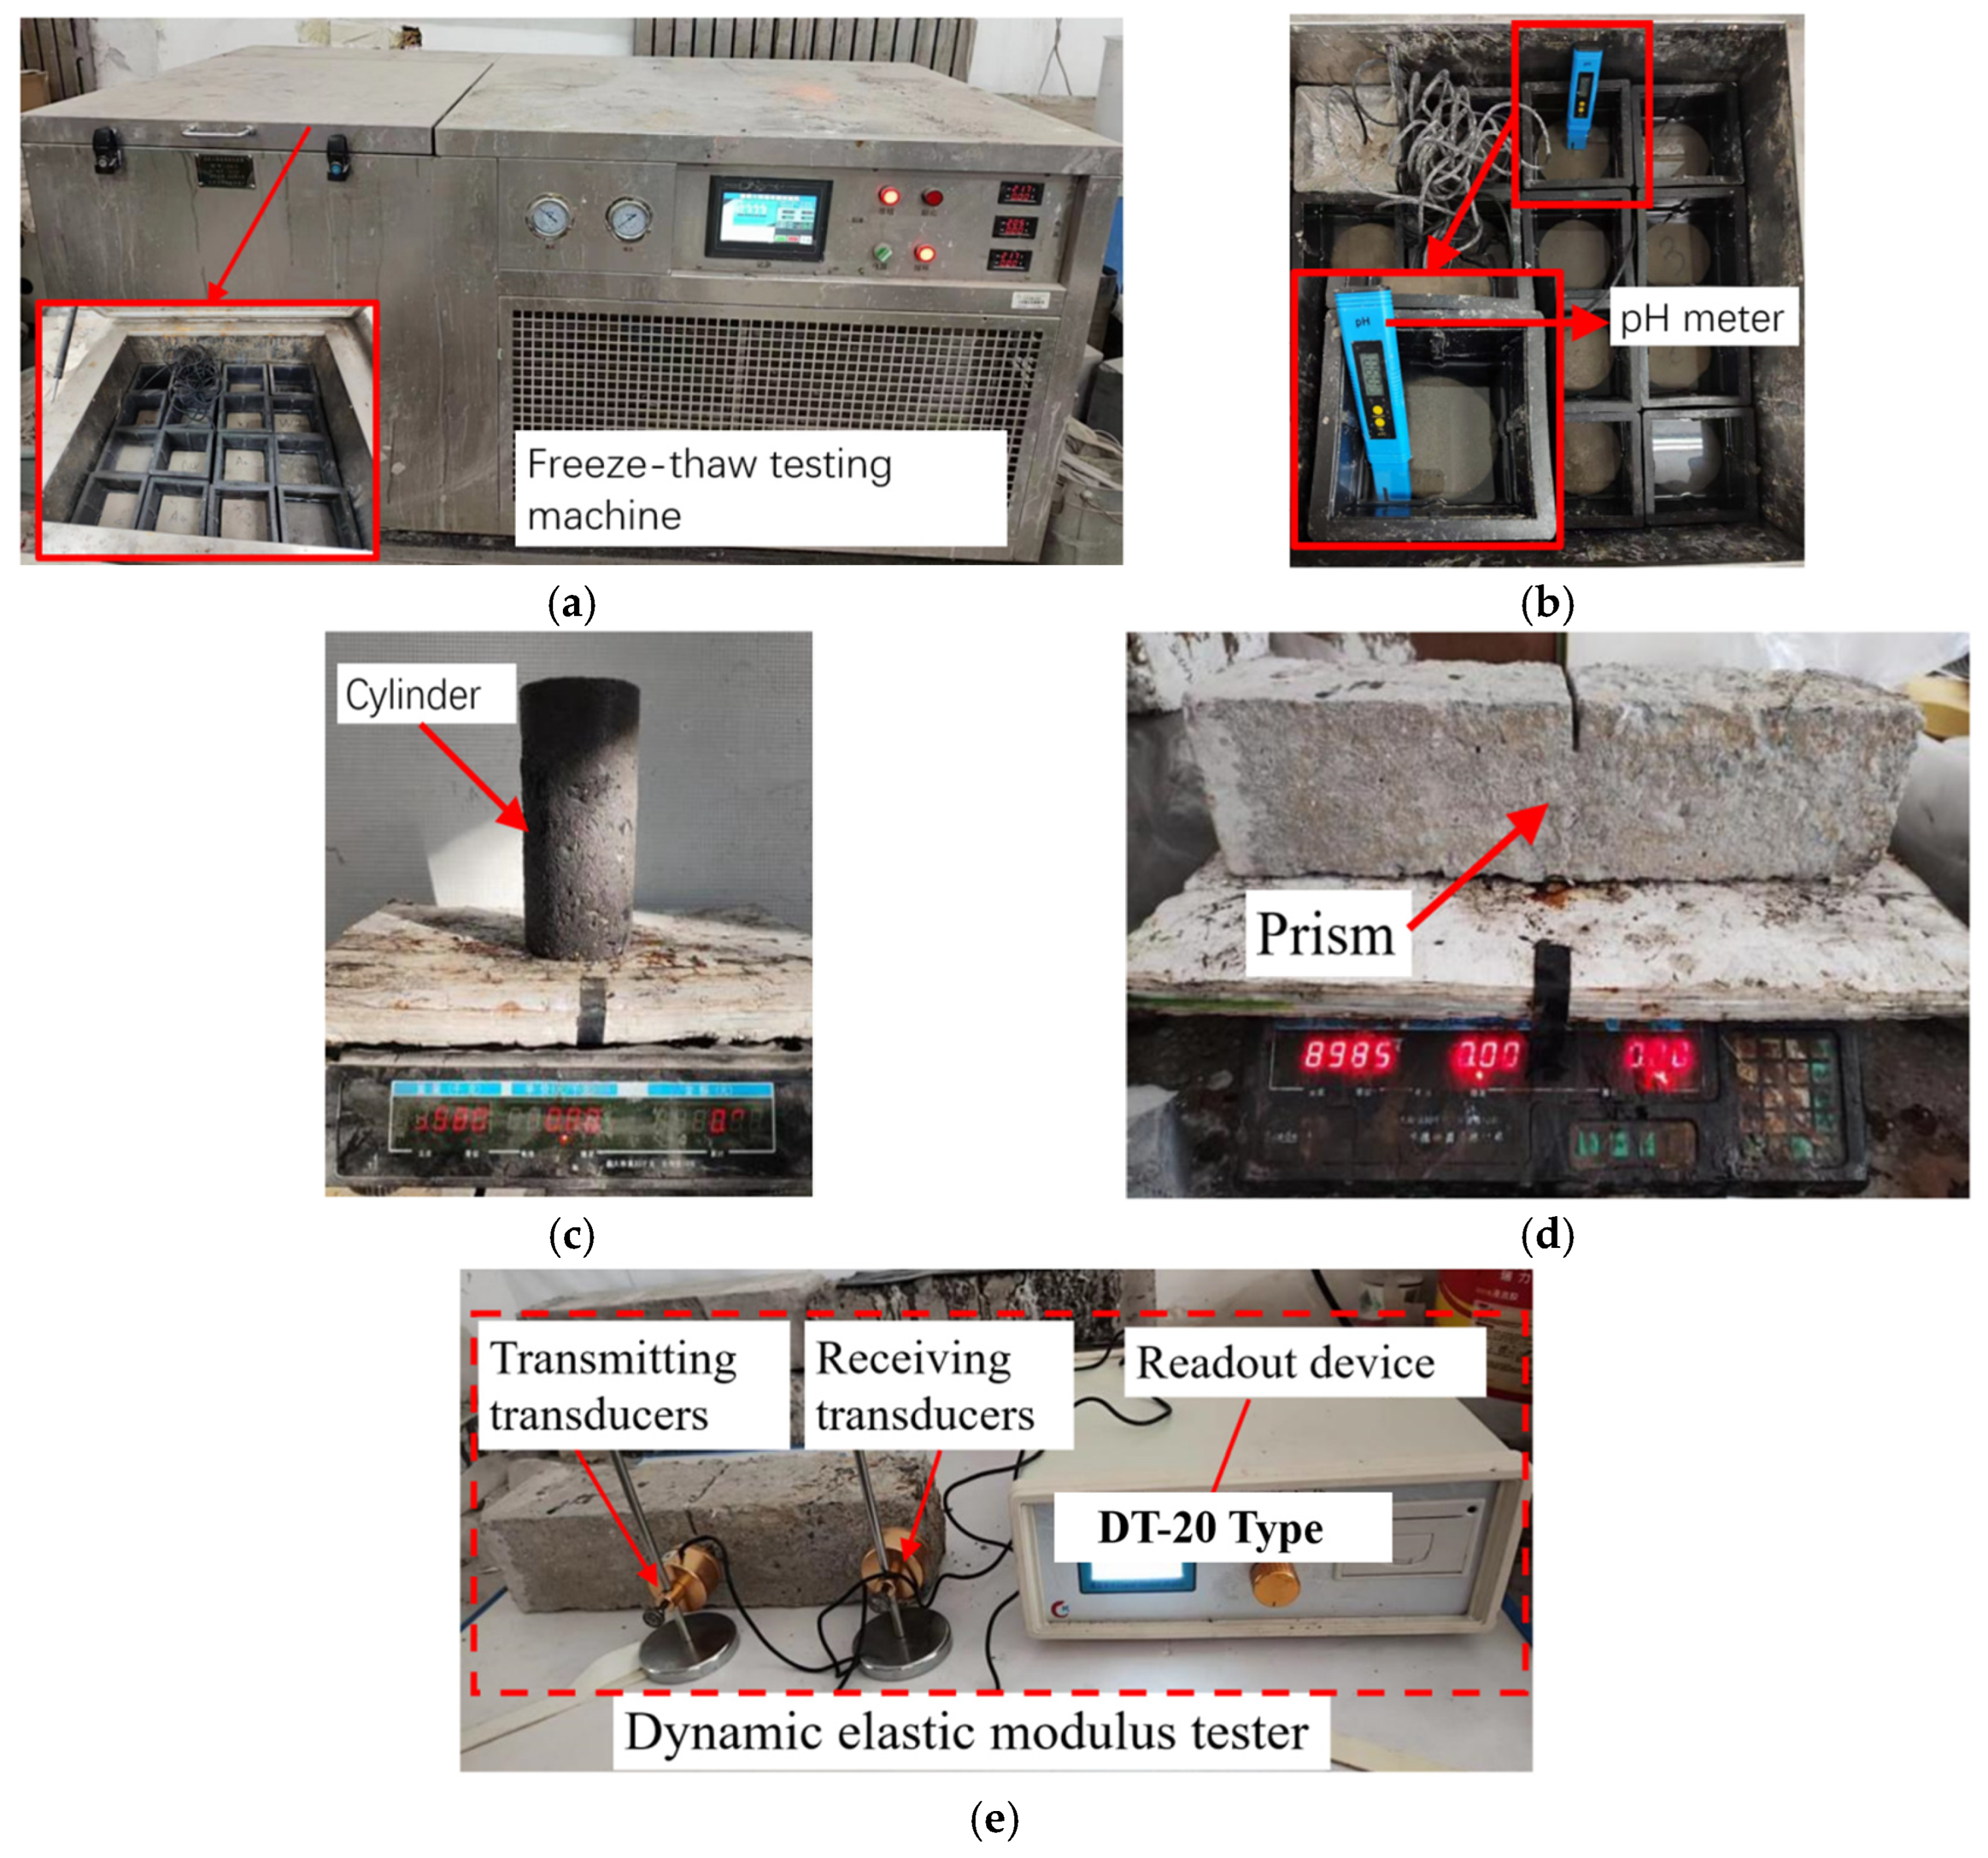
2.2. pH Value, Mass Loss, Relative Dynamic Modulus of Elasticity

To detect the deterioration of the test block under acid freezing, the mass loss rates of the prismatic test block and cylindrical test block were tested at 0, 50, and 100 cycles of freezing and thawing. The dynamic elastic modulus of the prismatic test block was tested, and the pH change in the sulfuric acid solution was detected.
The pH values of the sulfuric acid solutions in three specimen containers were measured using a pH meter. This measurement setup is schematically illustrated in Figure 3b. The mass measurement of the test block was conducted as follows: the water on the surface of the test block was dried with a dry towel; then, the weight of the test block was measured on an electronic scale, and the weight of the test block was recorded, as shown in Figure 3c,d. The mass loss ratio was calculated using Equation (1), specified in GB/T 50082-2009, with the measured value determined as the average of three specimens.
W n i = W 0 i W n i W 0 i × 100
where W n i —the mass loss ratio (%) of the i-th concrete specimen after N freeze–thaw cycles, calculated to a precision of 0.01%; W 0 i —the initial mass (g) of the i-th concrete specimen prior to freeze–thaw cycling; and W n i —the mass (g) of the i-th concrete specimen after N freeze–thaw cycles.
After completing the mass measurements, the dynamic modulus of elasticity of the fiber-reinforced concrete specimens under acid–frost coupling conditions was determined using the resonance method specified in GB/T 50082-2009. The dynamic elasticity measuring instrument was arranged as shown in Figure 3e, in which the receiving transducer was 5 mm away from the edge of the test block, and the transmitting transducer was gently pressed at 1/2 of the center line of the long side of the test block. During testing, the maximum peak frequency displayed on the dynamic elastic modulus tester, corresponding to the specimen’s resonant frequency, was recorded. The relative dynamic modulus of elasticity was calculated according to Equation (2), with the measured value determined as the average of three specimens.
P i = f n i 2 f 0 i 2 × 100
where P i —the relative dynamic modulus of elasticity (%) of the i-th concrete specimen after N freeze–thaw cycles, rounded to one decimal place; f n i —the fundamental transverse frequency (Hz) of the i-th concrete specimen after N freeze–thaw cycles; and f 0 i —the initial fundamental transverse frequency (Hz) of the i-th concrete specimen prior to freeze–thaw cycling.

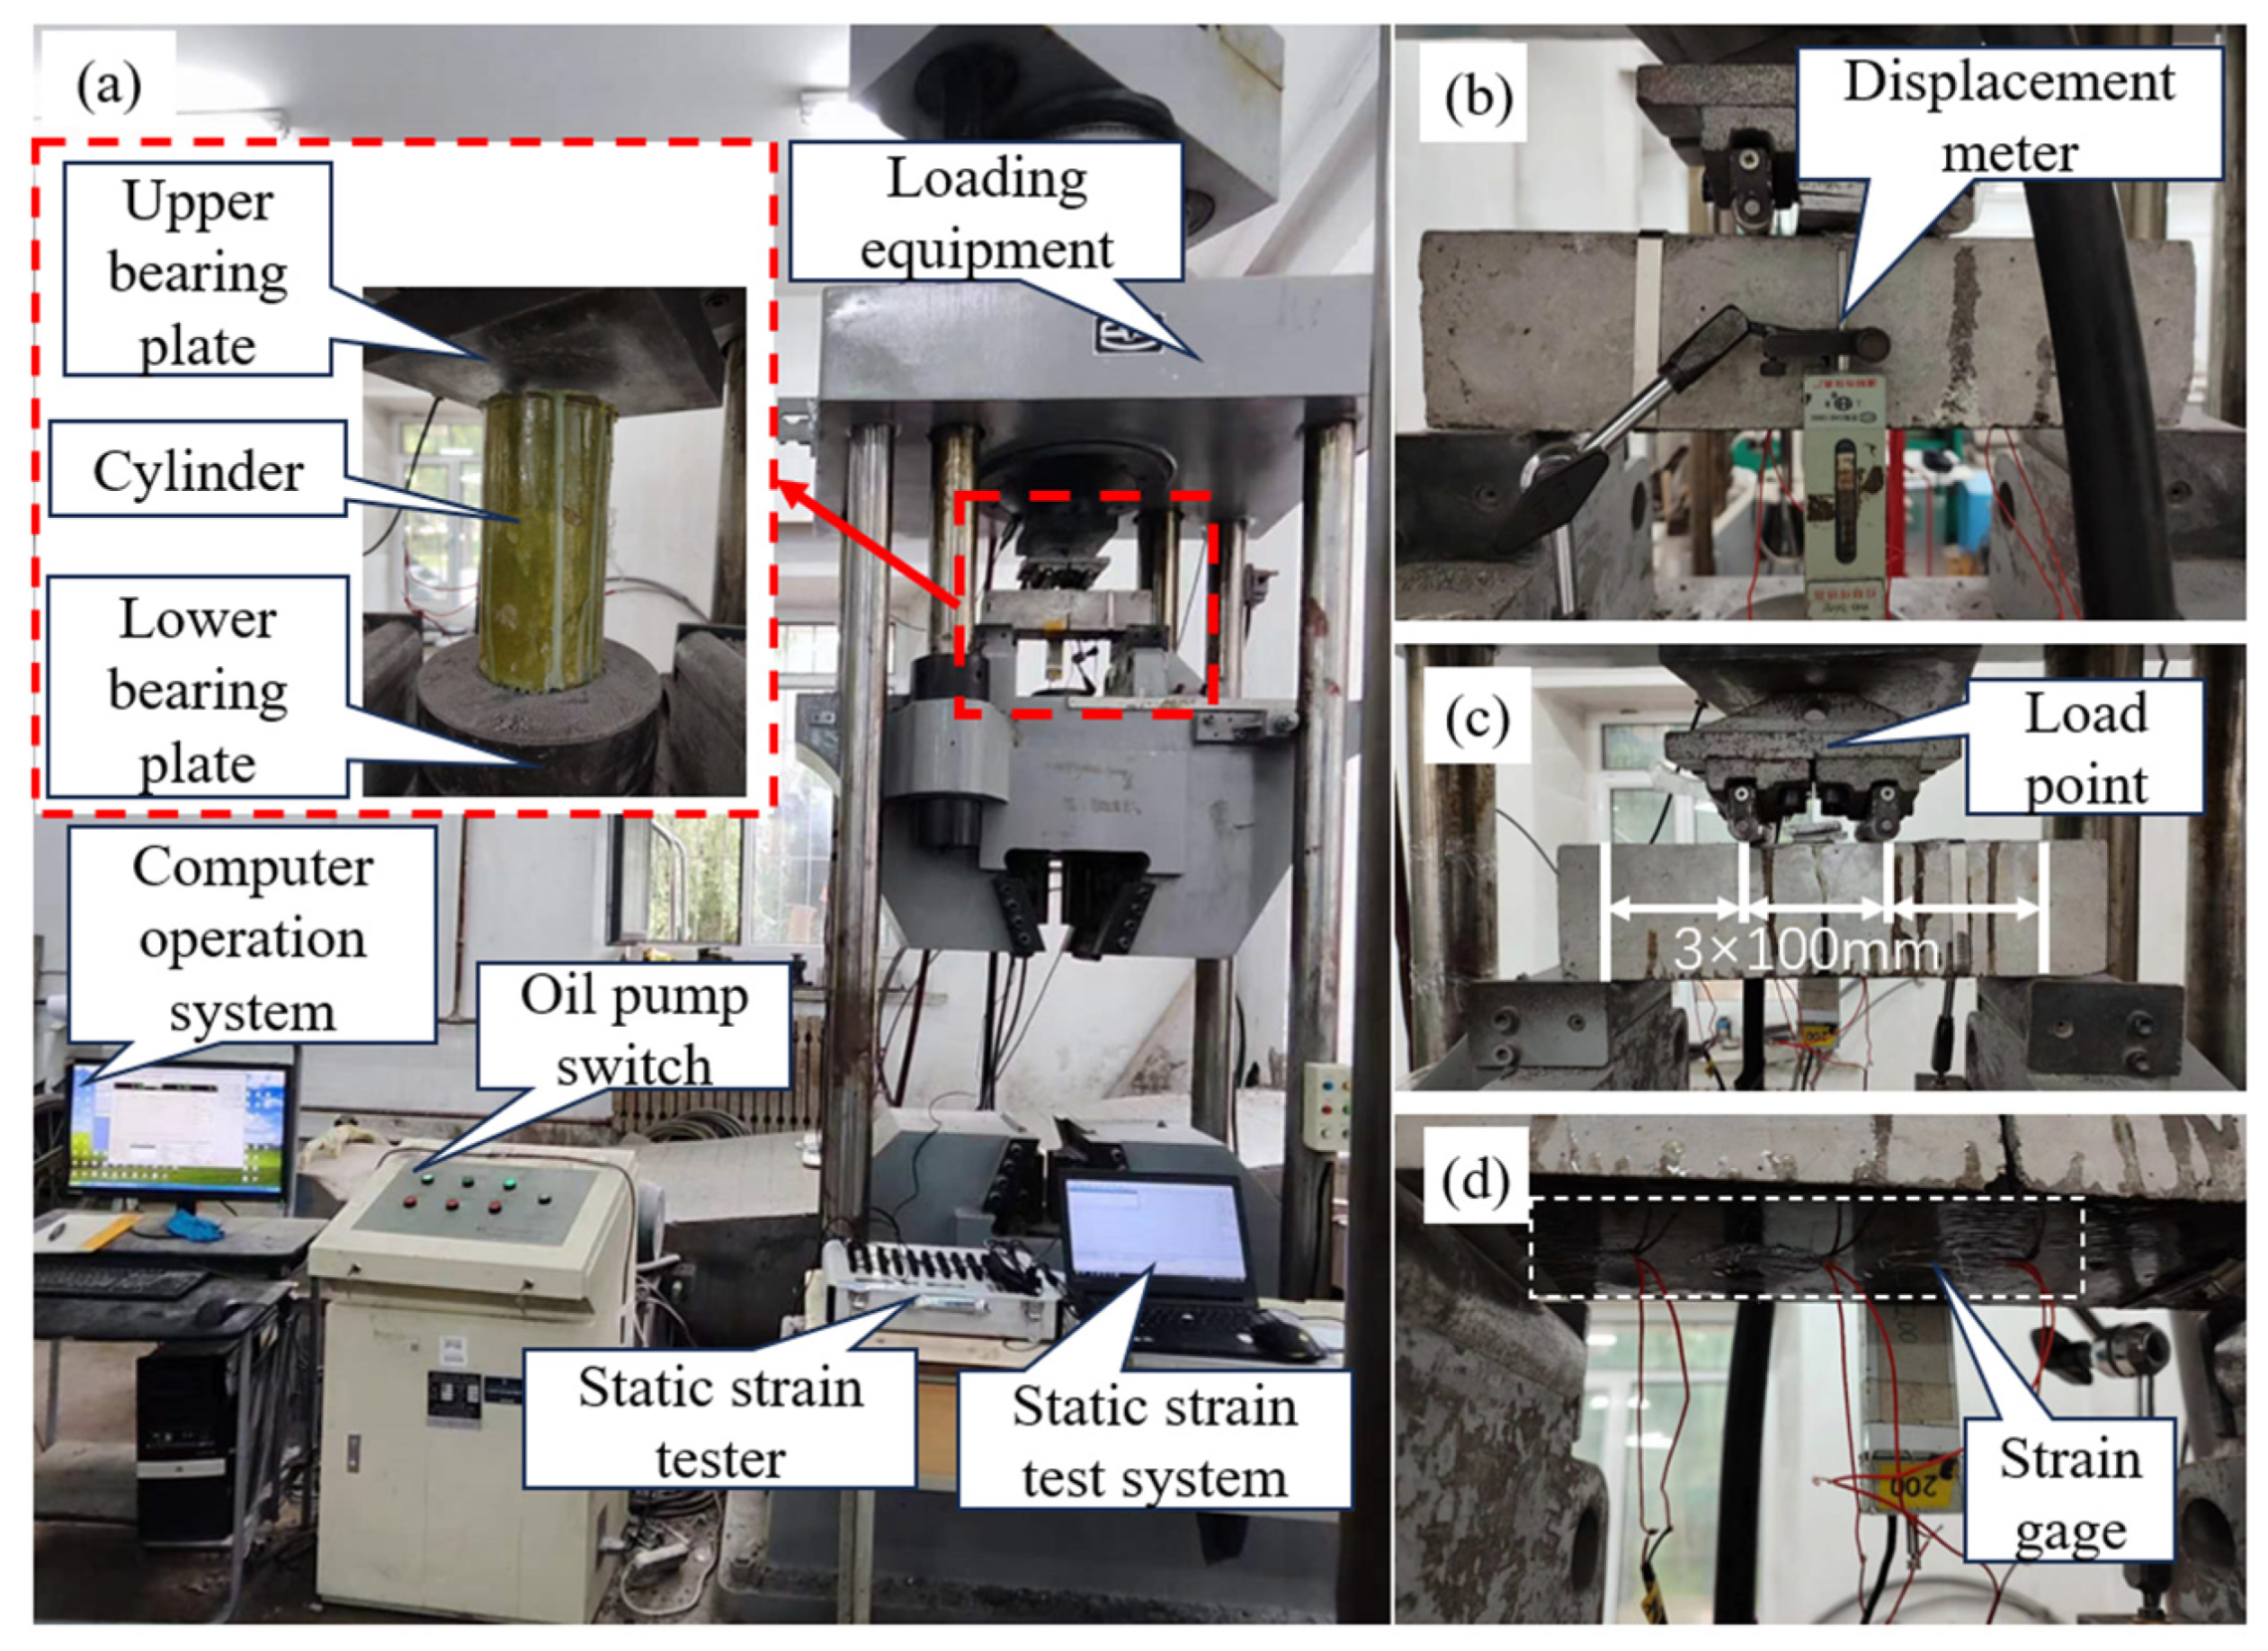
2.3. Mechanical Test

The compressive strength of the cylindrical specimens was determined following the standardized test method for the compressive strength of concrete cylinders specified in GB/T 50081-2019 [27]. The cylindrical specimen was positioned between the upper and lower compression platens, ensuring precise alignment of the specimen’s central axis with the geometric center of the loading plates. A constant loading rate of 0.3 MPa/s was applied during the compressive strength testing to ensure standardized stress application. Both compressive strength tests and flexural strength tests were conducted using the same universal testing machine, as illustrated in Figure 4a.
Following the same standard GB/T 50081-2019, the flexural load of the specimens was determined using the standardized flexural test method. The mid-span deflection of the flexural specimens was measured using displacement transducers, as indicated in Figure 4b. The specimen was positioned according to the configuration shown in Figure 4c, with the loading head making contact at the three-point bending span positions. A constant loading rate of 0.03 MPa/s was applied during the flexural strength testing to ensure standardized stress application. One side of the specimen was secured using a steel hoop, while the opposite side had a 2 cm long strain gauge bonded to the central axis of the bottom surface (on the FRP-reinforced face), as illustrated in Figure 4d.

3. Analysis of Test Results

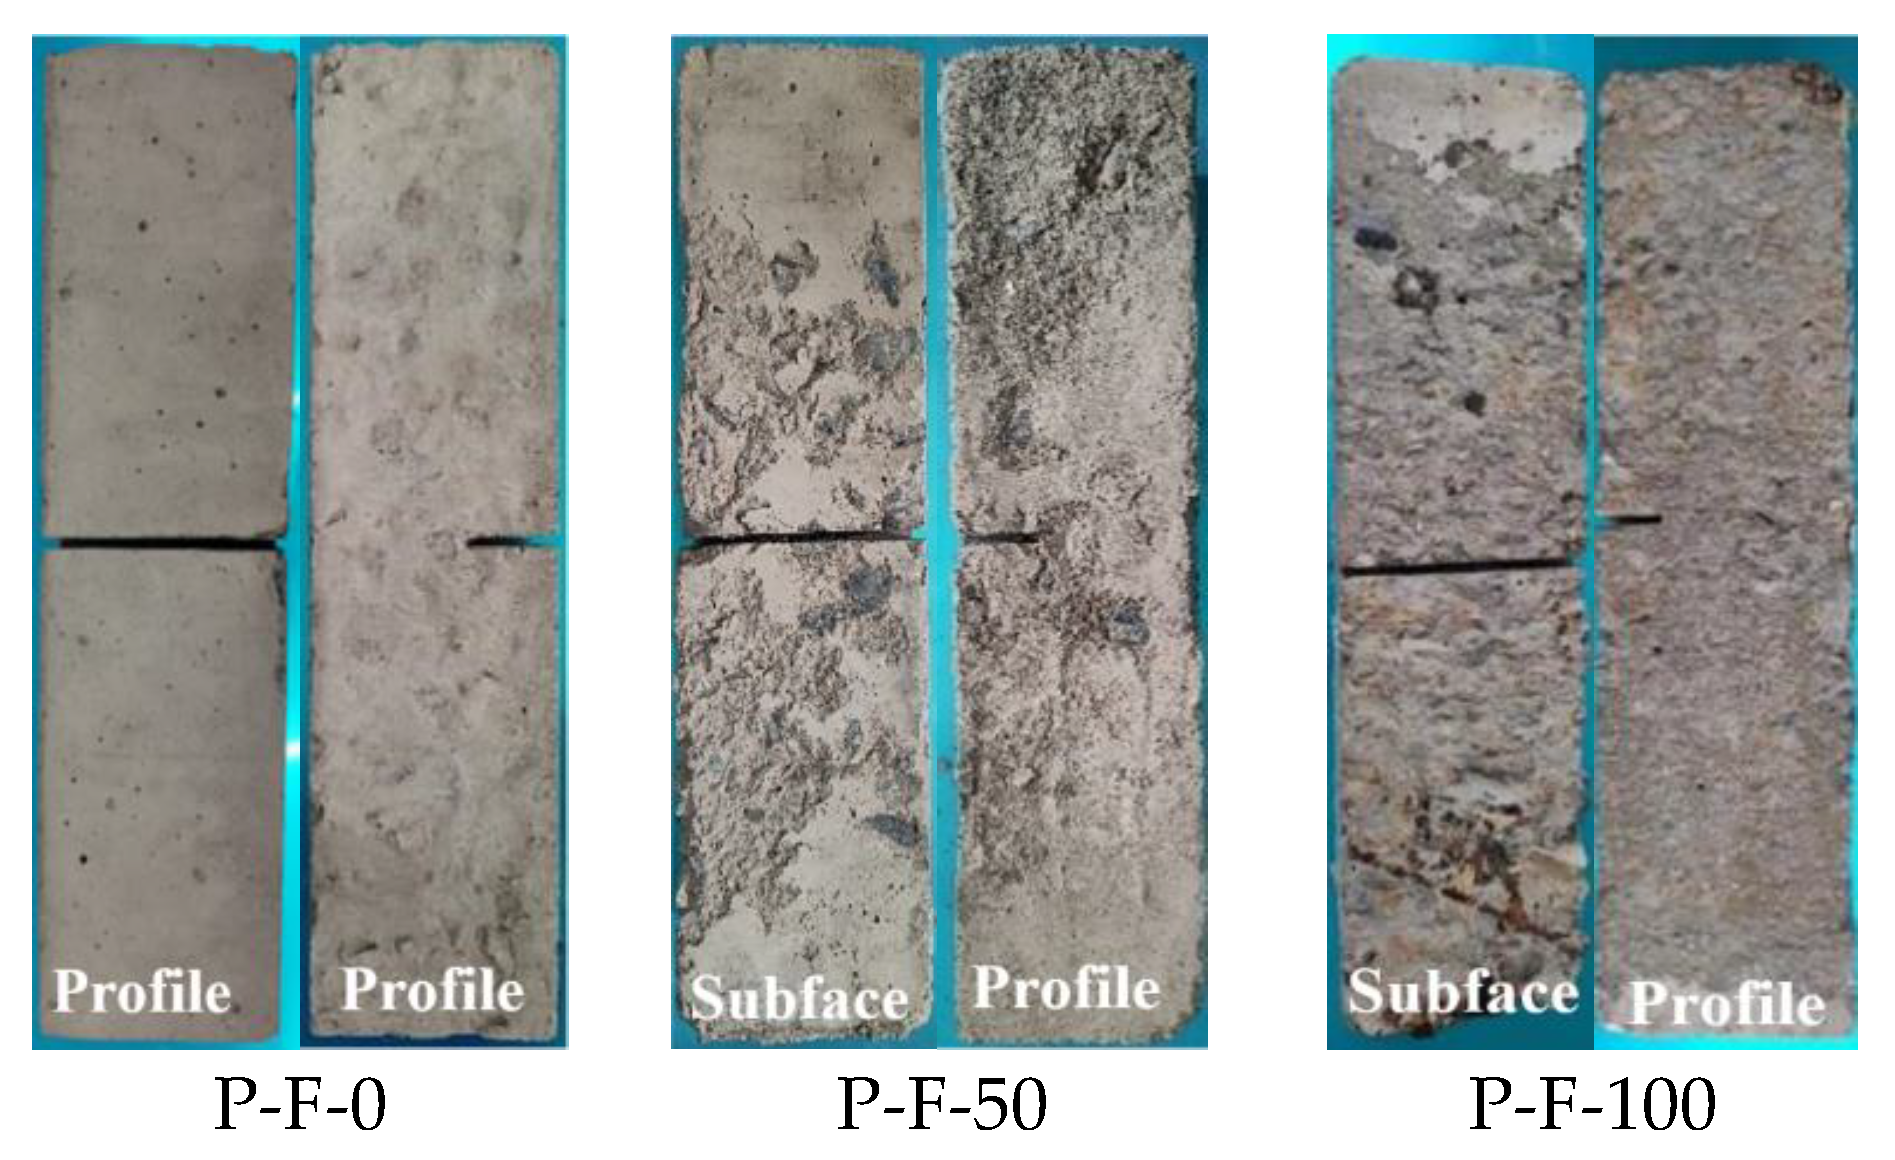
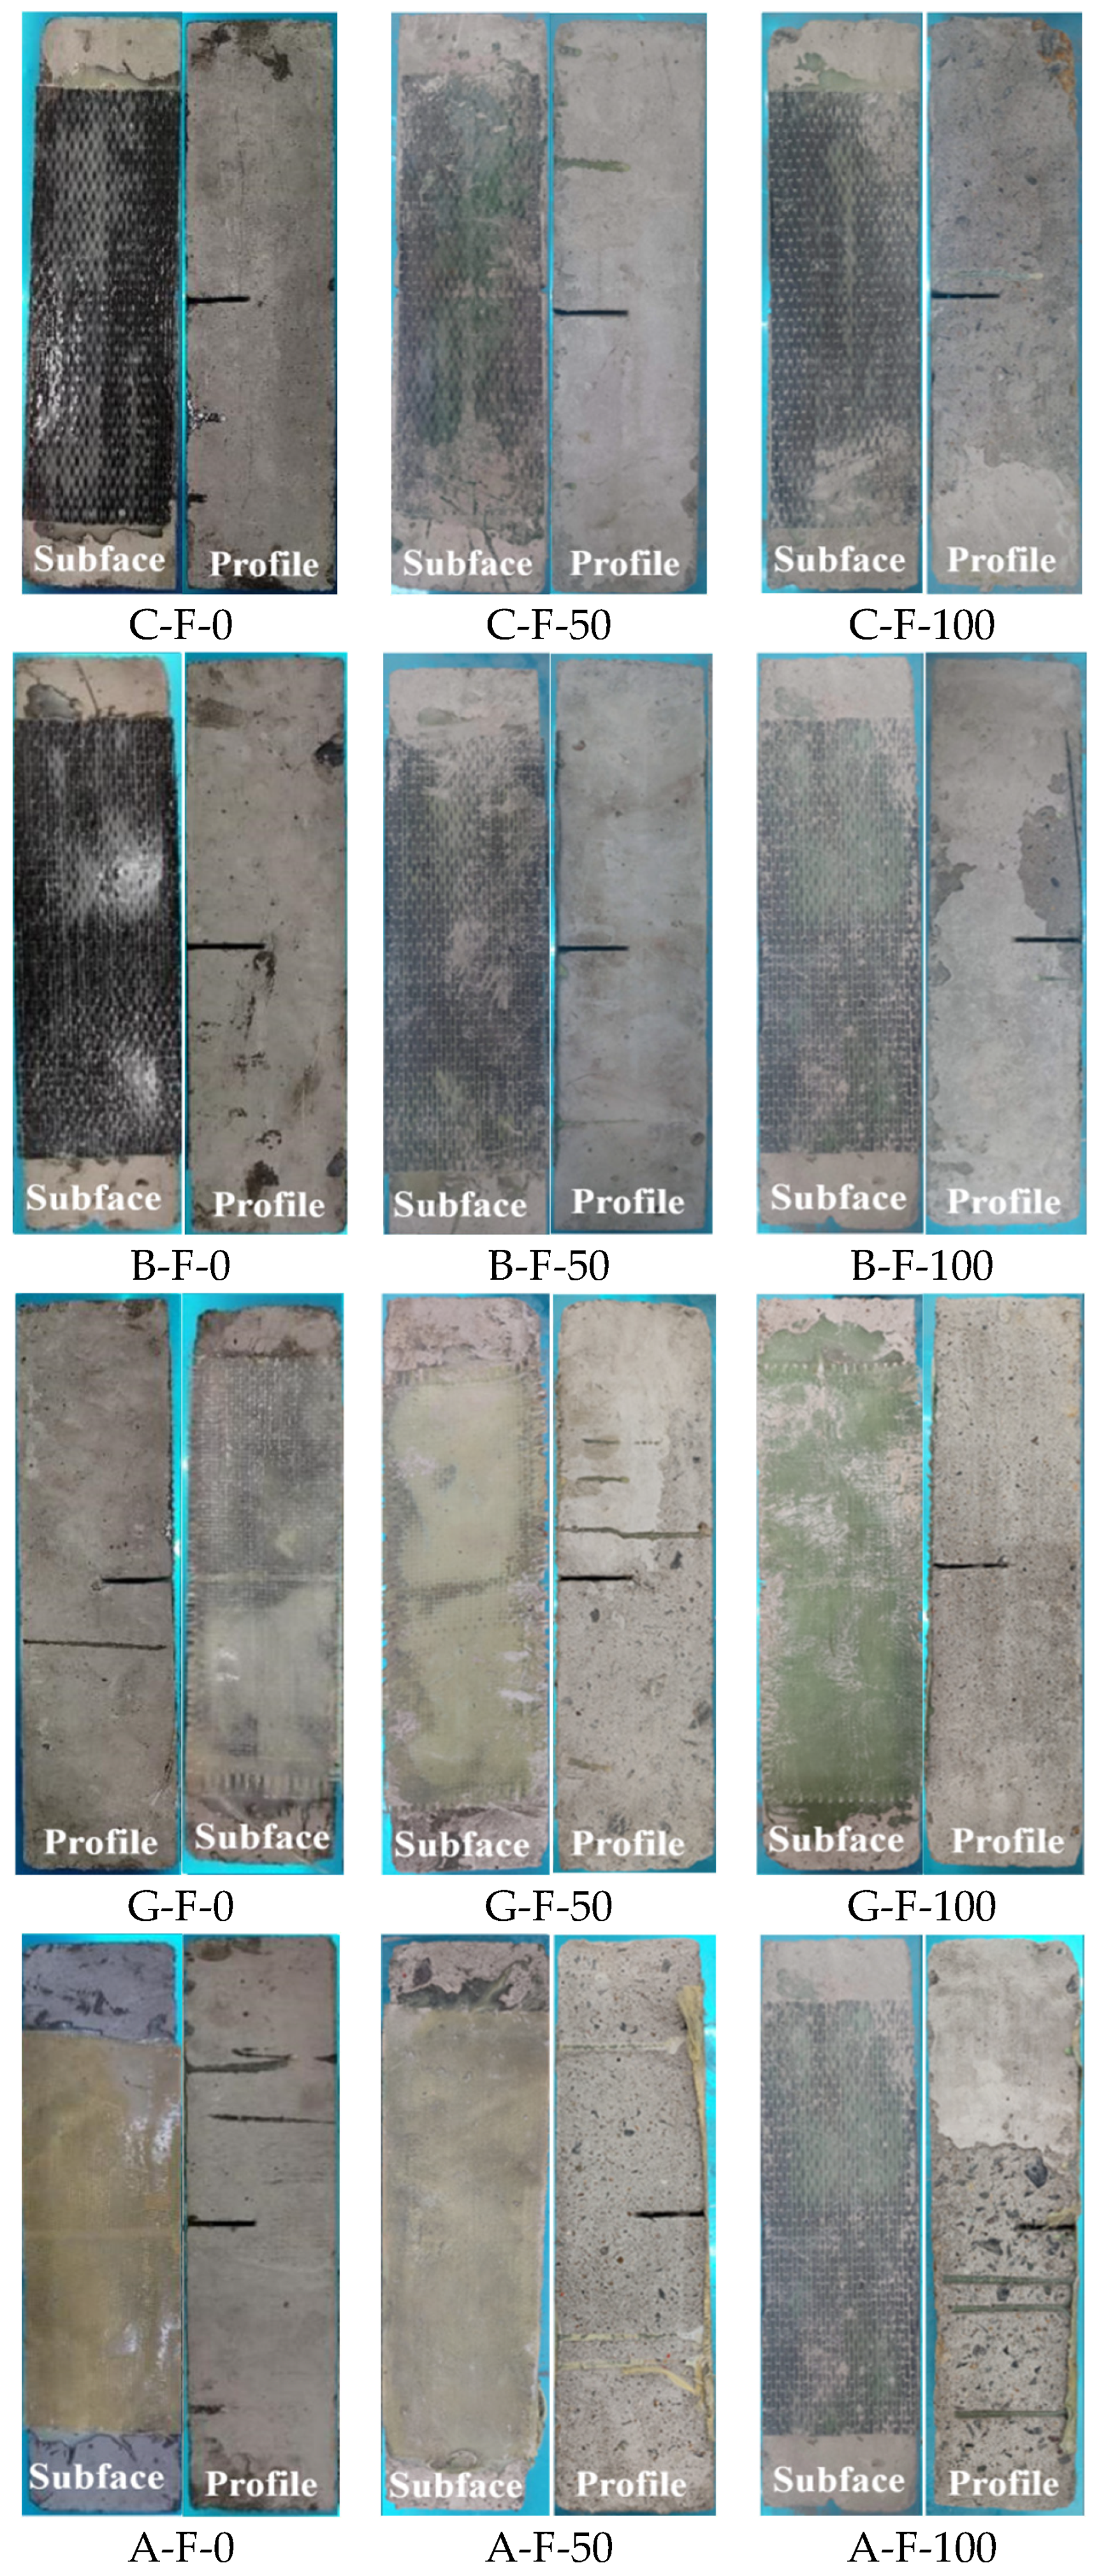
3.1. Surface Condition of Test Block

Figure 5 shows that the concrete specimens exhibited smooth and even surfaces prior to undergoing freeze–thaw cycles. Following 50 freeze–thaw cycles, the surface developed micro-voids and exhibited localized pitting phenomena. There was also a noticeable tendency for the cement mortar to spall and detach. The pitting phenomena progressed significantly after reaching 100 freeze–thaw cycles, resulting in a rougher surface texture. The spalling of the cement paste intensified, revealing small exposed areas of coarse aggregates. Additionally, aggregate particles at both ends of the specimens began to dislodge noticeably.
Under identical freeze–thaw cycle counts, the plain concrete specimens exhibited significantly higher damage levels than the FRP-reinforced concrete specimens. Among the various FRP-reinforced concrete specimens, the damage levels remained consistently comparable. In contrast to conventional concrete, the presence of FRP laminates effectively reduced the concrete surface area directly exposed to the acid solutions, resulting in a significant improvement in the overall surface integrity of the specimens.
Figure 6 presents the microstructure characteristics of concrete specimens under the combined erosion of acid and freeze–thaw cycles. The experimental results show that after 100 acid–freeze–thaw cycles of erosion, significant erosion occurs on the surface of the specimen, the pore structure is loose, accompanied by the generation of microcracks, and a large amount of ettringite crystals can be deposited in the pores. The acid–freeze–thaw cycle causes the dissolution of the surface material of the specimen, destroys the structural stability of the concrete, and promotes the dissolution of hydration products in the pores, eventually forming ettringite crystals.
As shown in Figure 6c,d, the internal structure of the specimen remains dense, and the C-S-H gel is in an intact state. The reason for this phenomenon lies in the fact that water molecules enter the pores on the surface of the specimen. Because of the continuous freeze–thaw effect and the penetration of H+ ions into the pores, the pH value of the pore solution decreases, disrupting the alkaline environment in which the hydration products stably exist. The hydration products dissolve into the pore solution, resulting in a decrease in the internal density. Furthermore, because of the low concentration of sulfate inside the specimen and the insulating effect on the surface, which limits further erosion, the degree of internal damage is relatively small.
Figure 7 shows the microstructure characteristics of FRP resin adhesive and glass fiber filaments after acid–freeze–thaw cycle coupling erosion. The surface of the FRP resin adhesive that has not been eroded by the acid–freeze–thaw cycle is smooth, indicating that there are no significant defects or degradation phenomena on its surface. As can be seen in Figure 7c,d, the GFRP fibers not eroded by the acid–freeze–thaw cycle remain intact without obvious defects, confirming that the fibers maintain an intact state under the condition of no erosion.
After the acid–freeze–thaw cycle, the surface of the GFRP epoxy resin adhesive shows obvious degradation characteristics, accompanied by the formation of a large number of micropores (Figure 7e,f). This phenomenon indicates that the acid–freeze–thaw cycle has a significant destructive effect on resin adhesives, resulting in surface degradation and local damage. Furthermore, Figure 7g,h show that the fiber properties are significantly affected. The coupled erosion effect of the acid–freeze–thaw cycle leads to a decline in the mechanical properties of the fibers and eventually causes partial fractures, indicating the destructive effect of erosion on the fibers.
Figure 8a,b reveal the microscopic morphological observation results of the white reaction layer on the surface of the concrete specimen through scanning electron microscopy (SEM), indicating that it was mainly composed of loose particles. Energy-dispersive spectroscopy (EDS) further indicated that the main constituent elements of these loose particles were O, C, Mg, and Ca. After 100 acid–freeze–thaw cycles of coupled erosion, the proportion of Al and O elements on the concrete surface was significantly higher than that in the internal area. This phenomenon can be attributed to the chemical reaction between SO42− in the sulfuric acid solution and calcium ions in the concrete, generating gypsum (CaSO4·2H2O), accompanied by the large-scale formation of ettringite (AFt), which indicates a significant increase in the degree of corrosion of the concrete. As the depth extends into the interior of the specimen, the proportion of O and Al elements gradually decreases, reflecting the reduction in the sulfate content and indicating a lower degree of sulfate erosion in the internal area.

3.2. pH and Mass Loss

In order to detect the erosion of the concrete specimens under acid–freeze–thaw coupling effects, the mass loss rates of the prismatic specimens and the cylindrical specimens were tested at 0 times, 50 times, and 100 times, and the pH value changes in the erosion solution were detected.
Figure 9 presents the recorded pH changes in the sulfuric acid solution throughout the freeze–thaw cycling process. The relatively short duration of acid–freezing exposure resulted in minimal pH changes in the sulfuric acid solution. Relative to the average initial pH value, the pH of the solution exhibited an increase of 0.01 units after 50 acid–freezing cycles and 0.04 units after 100 cycles. This phenomenon occurs because when concrete specimens are immersed in a sulfuric acid solution, hydrogen ions (H+) infiltrate the porous structure of the concrete. This infiltration leads to a decrease in the pH value of the pore solution, consequently disrupting the alkaline environment essential for maintaining the stability of hydration products within the concrete matrix.

3.2.1. Cylinder Mass Loss Rate

Figure 10 presents the mass loss rates for the FRP-reinforced and plain concrete specimens under varying freeze–thaw cycle counts. Under the combined action of acid corrosion and freeze–thaw cycles for 50 times, the plain concrete specimens exhibited a mass increase of 0.01 kg. This mass increase can be attributed to two primary factors: the infiltration of H2SO4 solution into the concrete matrix and the chemical reaction between sulfuric acid and the alkaline components within the concrete, which produces expansive compounds (CaSO4·2H2O) [28]. These combined processes contribute to the observed mass gain in the specimens. Simultaneously, the crystalline expansion of water molecules within the concrete’s internal pore structure induces surface concrete spalling. However, the mass reduction resulting from this spalling is offset by the combined mass gains from solution absorption and CaSO4·2H2O formation, leading to the net mass increase observed in the specimens.
After 100 erosion cycles, reduced infiltration of H2SO4 solution into the concrete’s pore structure occurs. This limited penetration, combined with the dissolution of cement paste (including the chemically produced CaSO4·2H2O), triggers physical deterioration and pore water crystallization processes. These combined mechanisms result in accelerated surface concrete spalling and a decrease in specimen mass compared to earlier stages.
Table 3 shows the results of the mass change of the test block. Compared to the plain concrete specimens, the FRP-reinforced concrete cylindrical specimens exhibited comparable mass gains after 50 cycles of acid–freezing coupling. Specifically, the CFRP-reinforced specimens showed a 0.1 kg increase, the BFRP-reinforced specimens demonstrated a 0.1 kg increase, and the AFRP- and GFRP-reinforced specimens each exhibited a 0.05 kg increase in mass. The epoxy resin adhesive applied to the surface of the cylindrical specimens acted as a protective barrier, effectively blocking the ingress of water molecules and sulfuric acid into the concrete matrix. In contrast to the plain concrete specimens, the FRP-reinforced concrete specimens exhibited continuous mass gain even after 100 erosion cycles. Notably, the GFRP-reinforced concrete specimens exhibited the highest mass gain among all FRP types, reaching 1.653%. When aged by acid, the epoxy resin adhesive increased the exposed surface area of the concrete specimens to the acid solution, facilitating greater penetration of H2SO4 into the specimens. Simultaneously, the epoxy coating effectively prevented surface concrete spalling, contributing to the observed mass gain. Among the FRP-reinforced specimens, the mass loss rates followed GFRP > AFRP > BFRP > CFRP, indicating varying durability performance under identical exposure conditions.

3.2.2. Prism Mass Loss Rate

Figure 11 presents the mass loss rates of the FRP-reinforced and conventional concrete prismatic specimens subjected to varying freeze–thaw cycles. At the 50th acid–freezing cycle, the average mass gain reached 0.536%. Subsequently, the mass exhibited a continuous decline, accompanied by a progressive increase in the mass loss rate. This transformation can be attributed to the concrete’s initial absorption of the acid solution. Additionally, sulfuric acid reacts with the hydration products within the concrete matrix, generating corrosion byproducts that become deposited in the concrete’s pore structure. The FRP-reinforced concrete specimens also demonstrated a comparable degradation pattern to the plain concrete. Using the CFRP-reinforced blocks as a case study, relative to the initial mass, the specimens exhibited a mass gain of 0.217% after 50 acid–freezing cycles and a subsequent mass loss of 0.759% after 100 cycles. Both the prismatic and cylindrical specimens demonstrated comparable mass variation trends during the initial 50 acid–freezing cycles. However, in the subsequent acid–freezing treatments, while the FRP laminates enhanced the integrity of the specimens by increasing their acid-exposed surface area, the prismatic blocks continued to exhibit progressive mass reduction. After 100 freeze–thaw cycles, the mass loss rates of the FRP-reinforced specimens exhibited the following order from highest to lowest: GFRP > BFRP > AFRP > CFRP.

3.3. Relative Dynamic Modulus of Elasticity

The dynamic elastic modulus can characterize the compactness of the internal structure and the overall performance of concrete. The internal structural state of the material can be measured by the change in the propagation speed of elastic waves within the concrete, and the erosion of the concrete can be determined without damaging the specimens. During the freeze–thaw cycle, the pores and micro-cracks in concrete continuously expand, and the structure gradually becomes loose, resulting in a decrease in the dynamic elastic modulus. Therefore, to a certain extent, it can reflect the process of the gradual destruction of the internal structure of the specimen under the coupled erosion conditions of acid and freeze–thaw cycles.
We determine each specimen’s relative dynamic elastic modulus using the lateral fundamental frequencies of the test blocks. The results are provided in Table 4. The dynamic elastic modulus indicates both the internal structural compactness and the overall performance characteristics of concrete. Hence, to a certain extent, it can reflect the progressive internal structural damage to the specimens under acid–freezing coupling erosion conditions.
Figure 12 illustrates the variation pattern of concrete specimens’ relative dynamic elastic modulus under acid–freezing coupling erosion. With prolonged acid–freezing exposure, the plain concrete specimens’ relative dynamic elastic modulus decreases, accompanied by a gradual reduction in the mass loss rate. Specifically, after 50 acid–freezing cycles, the dynamic elastic modulus reaches 91.7%, followed by a continuous decline in the relative dynamic elastic modulus. This phenomenon can be attributed to the acid–freezing process, causing the internal structure of the specimens to loosen. The concrete specimens reinforced with FRP also exhibit the same trend as the plain concrete. After 100 acid–freezing cycles, compared to the plain specimens, the relative dynamic elastic modulus of the CFRP, BFRP, GFRP, and AFRP reinforced concrete specimens increased by 6.1%, 4.3%, 5.5%, and 3.2%, respectively, all of which were significantly higher than those of the plain concrete. This is attributed to the partial coverage of the concrete blocks with FRP sheets, which reduces the surface area directly exposed to the acid solution and thereby weakens the acid erosion of the concrete.

3.4. Mechanical Test Results

3.4.1. Compressive Strength

Figure 13 illustrates the compressive strength and strength loss rate of the FRP-reinforced concrete specimens under varying freeze–thaw cycles. With increasing acid–freezing duration, the compressive strength of all specimen groups was reduced to a certain extent. After 100 acid–freezing cycles, the CFRP-reinforced specimens achieved the highest strength of 33.8 kN, 4.225 times that of the control group specimens. Relative to the initial strength at 0 acid–freezing cycles, the order of the strength loss rate from low to high was as follows: CFRP-reinforced specimens < BFRP-reinforced specimens < AFRP-reinforced specimens < GFRP-reinforced specimens < control group. Among these, the strength loss of the CFRP- and BFRP-reinforced specimens after 100 acid–freezing cycles was relatively similar, with the CFRP-reinforced specimens demonstrating the lowest strength loss rate of 27.8%. The GFRP-reinforced specimens exhibited inferior resistance to acid–freezing conditions, suffering a strength loss of up to 33.8%.
Figure 14 presents the uniaxial compressive stress–strain curves for each specimen group. With the progression of the freeze–thaw cycles and corrosion processes, the ultimate bearing capacity of the specimens demonstrated a sequential reduction. The control group specimens exhibited typical concrete stress–strain curves, whereas the FRP-reinforced specimens demonstrated marked variations in their stress–strain curves. The stress–strain curves of the CFRP- and BFRP-reinforced specimens were similar. After reaching their maximum compressive strength under loading, the specimens in these two groups exhibited a rapid strength drop, demonstrating brittle failure modes. The constitutive curves of the GFRP-reinforced specimens resembled those of the control group, retaining a certain degree of plasticity. In contrast, the AFRP-reinforced specimens exhibited significant deformation with a gradual increase in strength as they approached their compressive strength under compression, demonstrating excellent plastic behavior. The ductility performance hierarchy, from superior to inferior, was as follows: AFRP > GFRP > control group > BFRO > CFRP.
Additionally, the compressive strength of the bonded CFRP specimens, relative to the plain concrete, was enhanced by 244.1%, 262.9%, and 322.5% after 0, 50, and 100 freeze–thaw cycles, respectively, as illustrated in Figure 13a. The flexural behavior of the bonded BFRP specimens, relative to the plain concrete samples, was enhanced by 194.1%, 214.3%, and 258.8% after 0, 50, and 100 freeze–thaw cycles, respectively, as shown in Figure 14b. The flexural behavior of the bonded GFRP specimens, relative to the plain concrete samples, was enhanced by 195.6%, 200.9%, and 232.5% after 0, 50, and 100 freeze–thaw cycles, respectively, as shown in Figure 14c. The flexural behavior of the bonded GFRP specimens, relative to plain concrete samples, was enhanced by 160.3%, 179.0%, and 207.5% after 0, 50, and 100 freeze–thaw cycles, respectively, as shown in Figure 14d. Compared to the control group, the load-bearing capacity improvement of each group of specimens increased, indicating that FRP provided adequate protection to the concrete during the freeze–thaw erosion process. The increase in the ultimate load-bearing capacity of each group of specimens, relative to the control group, was primarily attributed to FRP restricting the lateral deformation of the plain concrete and providing reinforcement.

3.4.2. Flexural Capacity

Figure 15 presents the flexural strength and strength loss rate after 100 freeze–thaw cycles for the FRP-reinforced and control group specimens. The flexural load-bearing capacity of each group of specimens followed the same pattern, decreasing as the load-bearing capacity of the acid–frozen specimens decreased. For the bonded CFRP specimens, as an example, the flexural load-bearing capacity loss rate was 14.4% and 20.2% after 50 and 100 freeze–thaw cycles, respectively. The load-bearing capacity of each group of specimens under different acid–freezing cycles followed the same pattern, namely, CFRP > BFRP > GFRPA > CFRP. Additionally, the flexural load-bearing capacity of the concrete was significantly enhanced by bonding FRP. Compared to the plain concrete, the flexural load-bearing capacity improvement rates of C-F-100, B-F-100, G-F-100, and A-F-100 were 412.5%, 308.8%, 243.0%, and 195.3%, respectively. Relative to the initial load-bearing capacity, after 100 acid–freezing cycles, the load-bearing capacity loss of each group of specimens, from smallest to largest, was CFRP (20.23%) < BFRP (20.3%) < AFRP (25.7%) < BFRP (25.8%) < plain concrete (36.5%).
Figure 16 presents the load–displacement curves of each group of specimens. The curve of the plain concrete specimens rose slowly and then dropped abruptly, as shown in Figure 16e. The load–displacement curves of the P-C and P-B specimens were similar to those of the plain concrete, consisting of ascending and rapid descending phases, as shown in Figure 16a,b. The load–displacement curves of the P-A and P-G specimens exhibited better ductility, as shown in Figure 16c,d. Meanwhile, the flexural properties of the bonded CFRP specimens were enhanced by 307.9%, 340.0%, and 412.5% relative to those of the plain concrete specimens after 0, 50, and 100 freeze–thaw cycles, respectively. The flexural properties of the bonded BFRP specimens were enhanced by 225.7%, 256.0%, and 308.8% relative to those of the plain concrete specimens after 0, 50, and 100 freeze–thaw cycles, respectively. The flexural properties of the bonded GFRP specimens were enhanced by 193.6%, 214.6%, and 243.0% relative to those of the plain concrete specimens after 0, 50, and 100 freeze–thaw cycles, respectively. The flexural properties of the bonded BFRP specimens were enhanced by 152.3%, 164.6%, and 195.3% relative to those of the plain concrete specimens after 0, 50, and 100 freeze–thaw cycles, respectively. Compared to the control group, the load-bearing capacity improvement of each group of specimens increased, with results similar to those of the compression tests.

4. Performance Modeling

The probability distribution f(P) of the flexural load-bearing capacity of the plain concrete and the bonded FRP concrete can be represented by a two-parameter Weibull function, which is often used to describe the time-dependent damage progression and failure characteristics of materials and structures [29,30,31,32,33]. The formula is as follows:
f P = α P α 1 β α e x p P β α
α = C O V P 1.08
β = μ P 1 α + 1
where α and β are Weibull constants; C O V P and μ P are the coefficient of variation and the mean value of the load-bearing capacity under certain acid–freezing conditions, respectively. It is worth noting that the Weibull function is often used to model the progressive damage to structural materials [34]. The cumulative distribution F(P) of Equation (6) is given as:
F P = 1 e x p P β α
The hazard function h(P) of concrete failure is defined as
h P = f P R P
R P = 1 F P
where R(P) is the reliability function of the specimen.
E P = 0 P f P d P = 0 R P d P
Table 5 lists the Weibull function constants of the flexural capacity of the specimens calculated by Equations (4) and (5). Figure 17 shows the Weibull distribution of specimen strength, including the probability density function, cumulative distribution function, etc. Figure 17a shows the variation curves of constants α and β with the number of freeze–thaw cycles. α represents the −1.08th power of the coefficient of variation, and its value gradually decreases as the number of freeze–thaw cycles increases, indicating that the dispersion of the flexural load-bearing capacity increases with the acid–freezing time. Acid–freezing corrosion leads to uncertainty in the flexural performance of the specimens. β is related to the average flexural load-bearing capacity, and its value gradually decreases as the number of freeze–thaw cycles increases. Because of the difference in COV, the α of the plain concrete is 162% lower than that of the CFRP-reinforced condition; in contrast, the β constant of the latter is significantly higher than that of the former.
Because of the difference in COV, the α of plain concrete is 162% lower than that of the CFRP bonding condition; in contrast, the β constant of the latter is significantly higher than that of the former. The probability density function of the conditional concrete is shown in Figure 17b. As the exposure time decreases, the function’s mode (most probable value) shifts to the right, and the probability density increases (the curve width narrows). This observation indicates that the distribution of the random variable becomes concentrated, and the probability density increases. A weak link in the concrete, i.e., the degraded cement binder and microcracks, controls the failure of the masonry block, and the presence of this link becomes apparent as the conditions change. The cumulative distribution function of the specimen in Figure 17c shows the relative sensitivity of the concrete block to the ultimate load at a specific probability of occurrence, as the exposure time varies. It can be observed that the sensitivity of the conditional concrete is weaker than that of the plain concrete.
The hazard function for each acid–freezing condition is shown in Figure 17d. The failure rate of the plain concrete specimens increases under lower loads. A similar trend is observed in the concrete with bonded fiber-reinforced polymer, while the intensity of the failure rate is lower than that of the 0-week plain concrete. Figure 17e further supports the effectiveness of FRP bonding through the reliability function of the bonded fiber-reinforced polymer. In the load range of 4 kN to 6 kN, the reliability of the plain concrete decreases sharply, while the reliability of the bonded FRP improves significantly.
The expected failure load of the specimens was calculated using Equation (9). Figure 18a compares the curve of the expected failure load with the experimental data points. After 100 acid–freezing cycles, the failure load of the ordinary block is 4.2 kN, while the expected failure loads of concrete bonded with CFRP, BFRP, GFRP, and AFRP are 21.0 kN, 16.0 kN, 13.4 kN, and 11.4 kN, respectively. Figure 18b compares the expected and experimental failure loads. The maximum absolute threshold between the experimental data and the expected failure load is 11.1% for the plain concrete and various FRP-reinforced concretes.

5. Conclusions

This study investigates the mechanical and surface degradation patterns of concrete reinforced with carbon, basalt, glass, and aramid fiber-reinforced polymer under combined sulfuric acid and freeze–thaw cycles. The compressive strength of fully wrapped FRP cylindrical specimens before and after acid–freezing cycles is tested, as well as the flexural bearing capacity of prismatic specimens with FRP bonded on the side of pre-existing cracks, the dynamic elastic modulus, and mass loss. The experimental results are supplemented by an analysis model established based on probability theory, using changes in the surface photographs of the specimens, scanning electron microscopy (SEM), and energy-dispersive spectroscopy (EDS)(The QUANTA 200 field emission environmental scanning electron microscope produced by the Netherlands). The following conclusions are drawn:
(1)
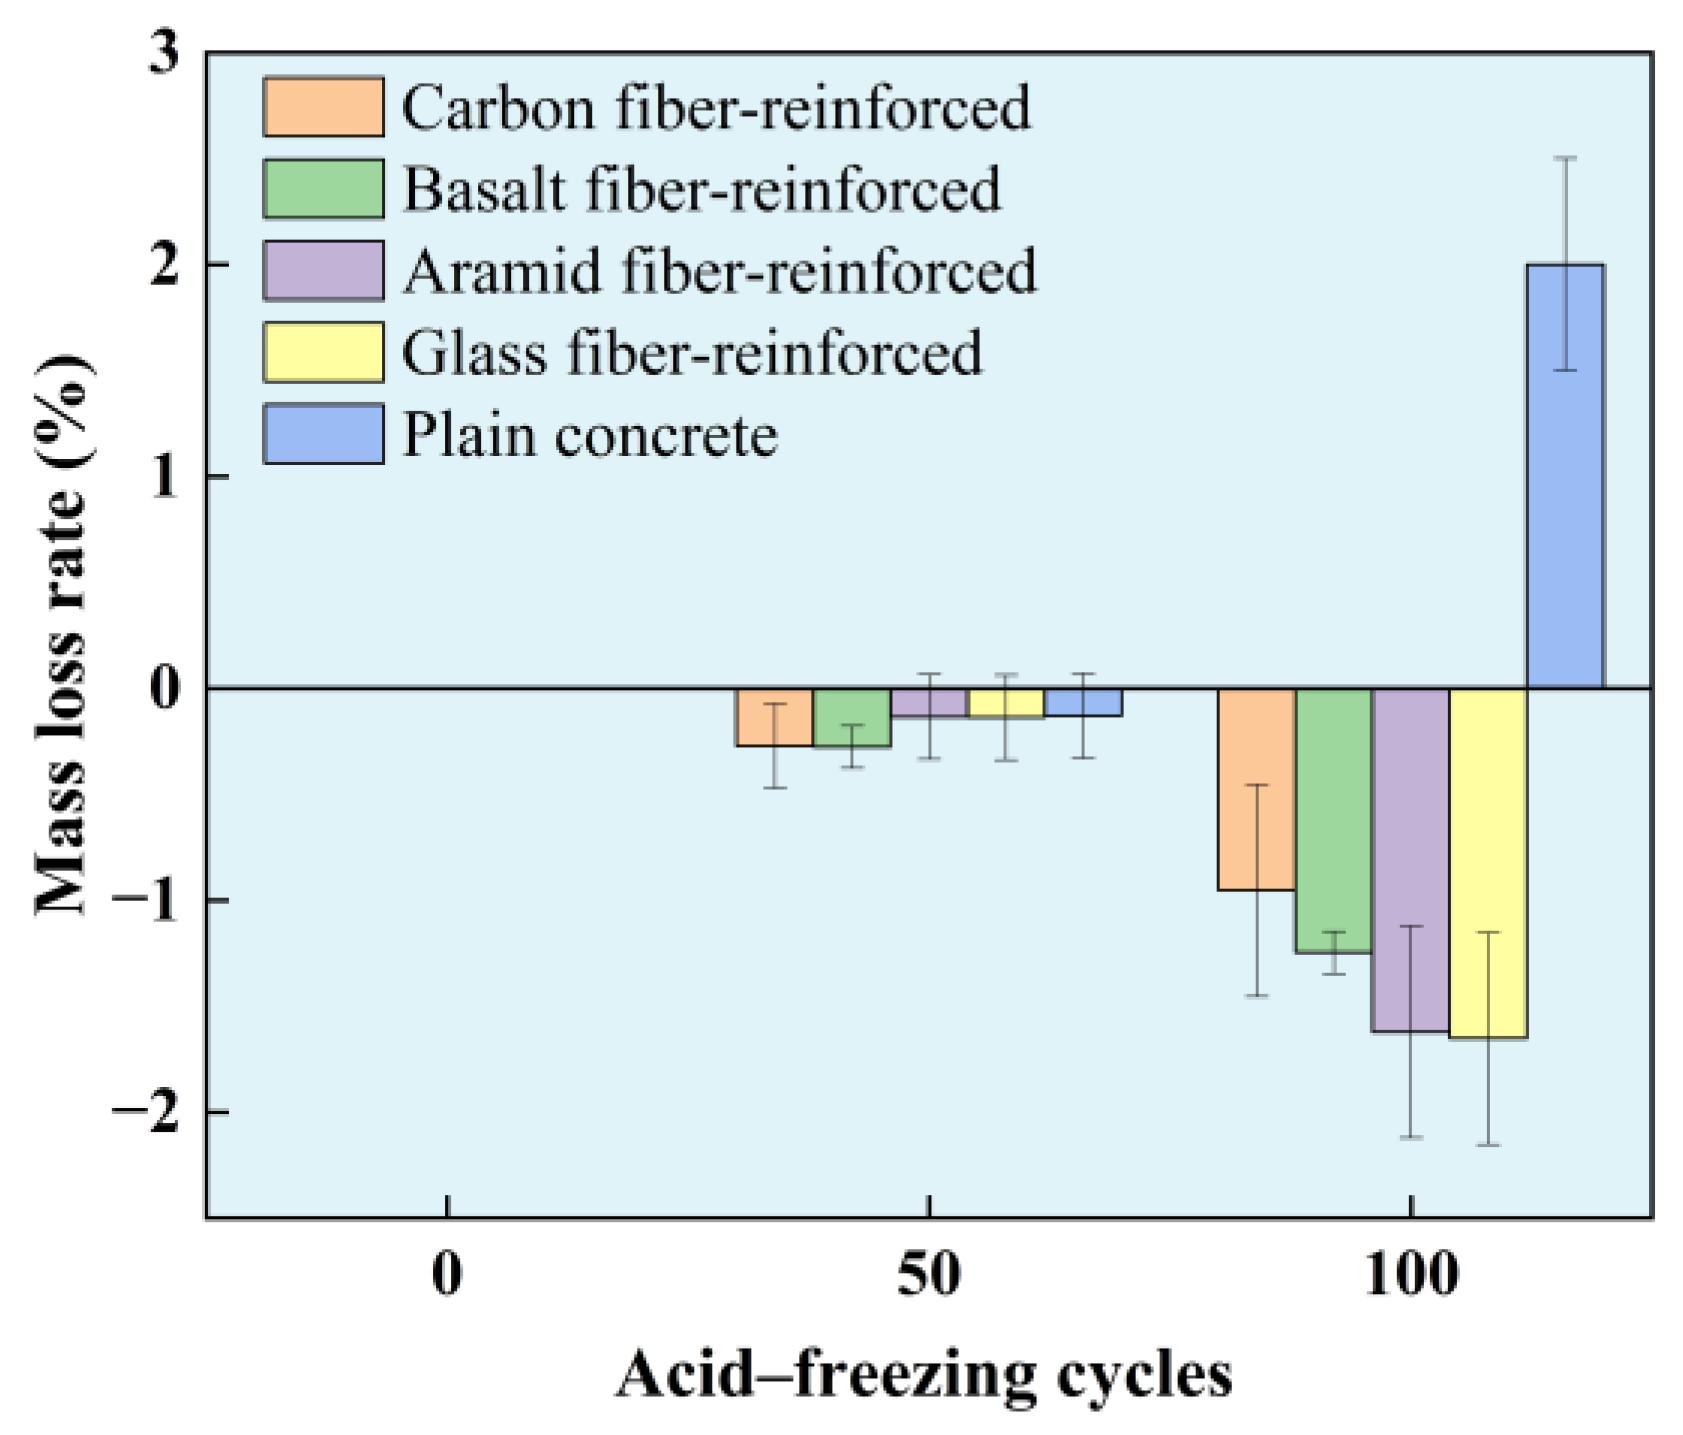
Because the increased mass from a portion of H2SO4 infiltrating the solution and the neutralization reaction producing expansive substances is greater than the mass loss from the spalling of the specimen surface, the mass of the plain cylindrical concrete increased by 0.01 kg after 50 cycles of combined acid and freeze–thaw action. After 100 cycles, as more surface concrete spalled, the mass of the plain specimen decreased by 0.082 kg. For the FRP-reinforced specimens, the initial mass loss pattern was consistent with the plain specimens. However, in the later stages, the mass increased because FRP prevented the spalling of the concrete surface. The GFRP-bonded specimens showed the most significant mass increase, reaching 1.653%.
(2)
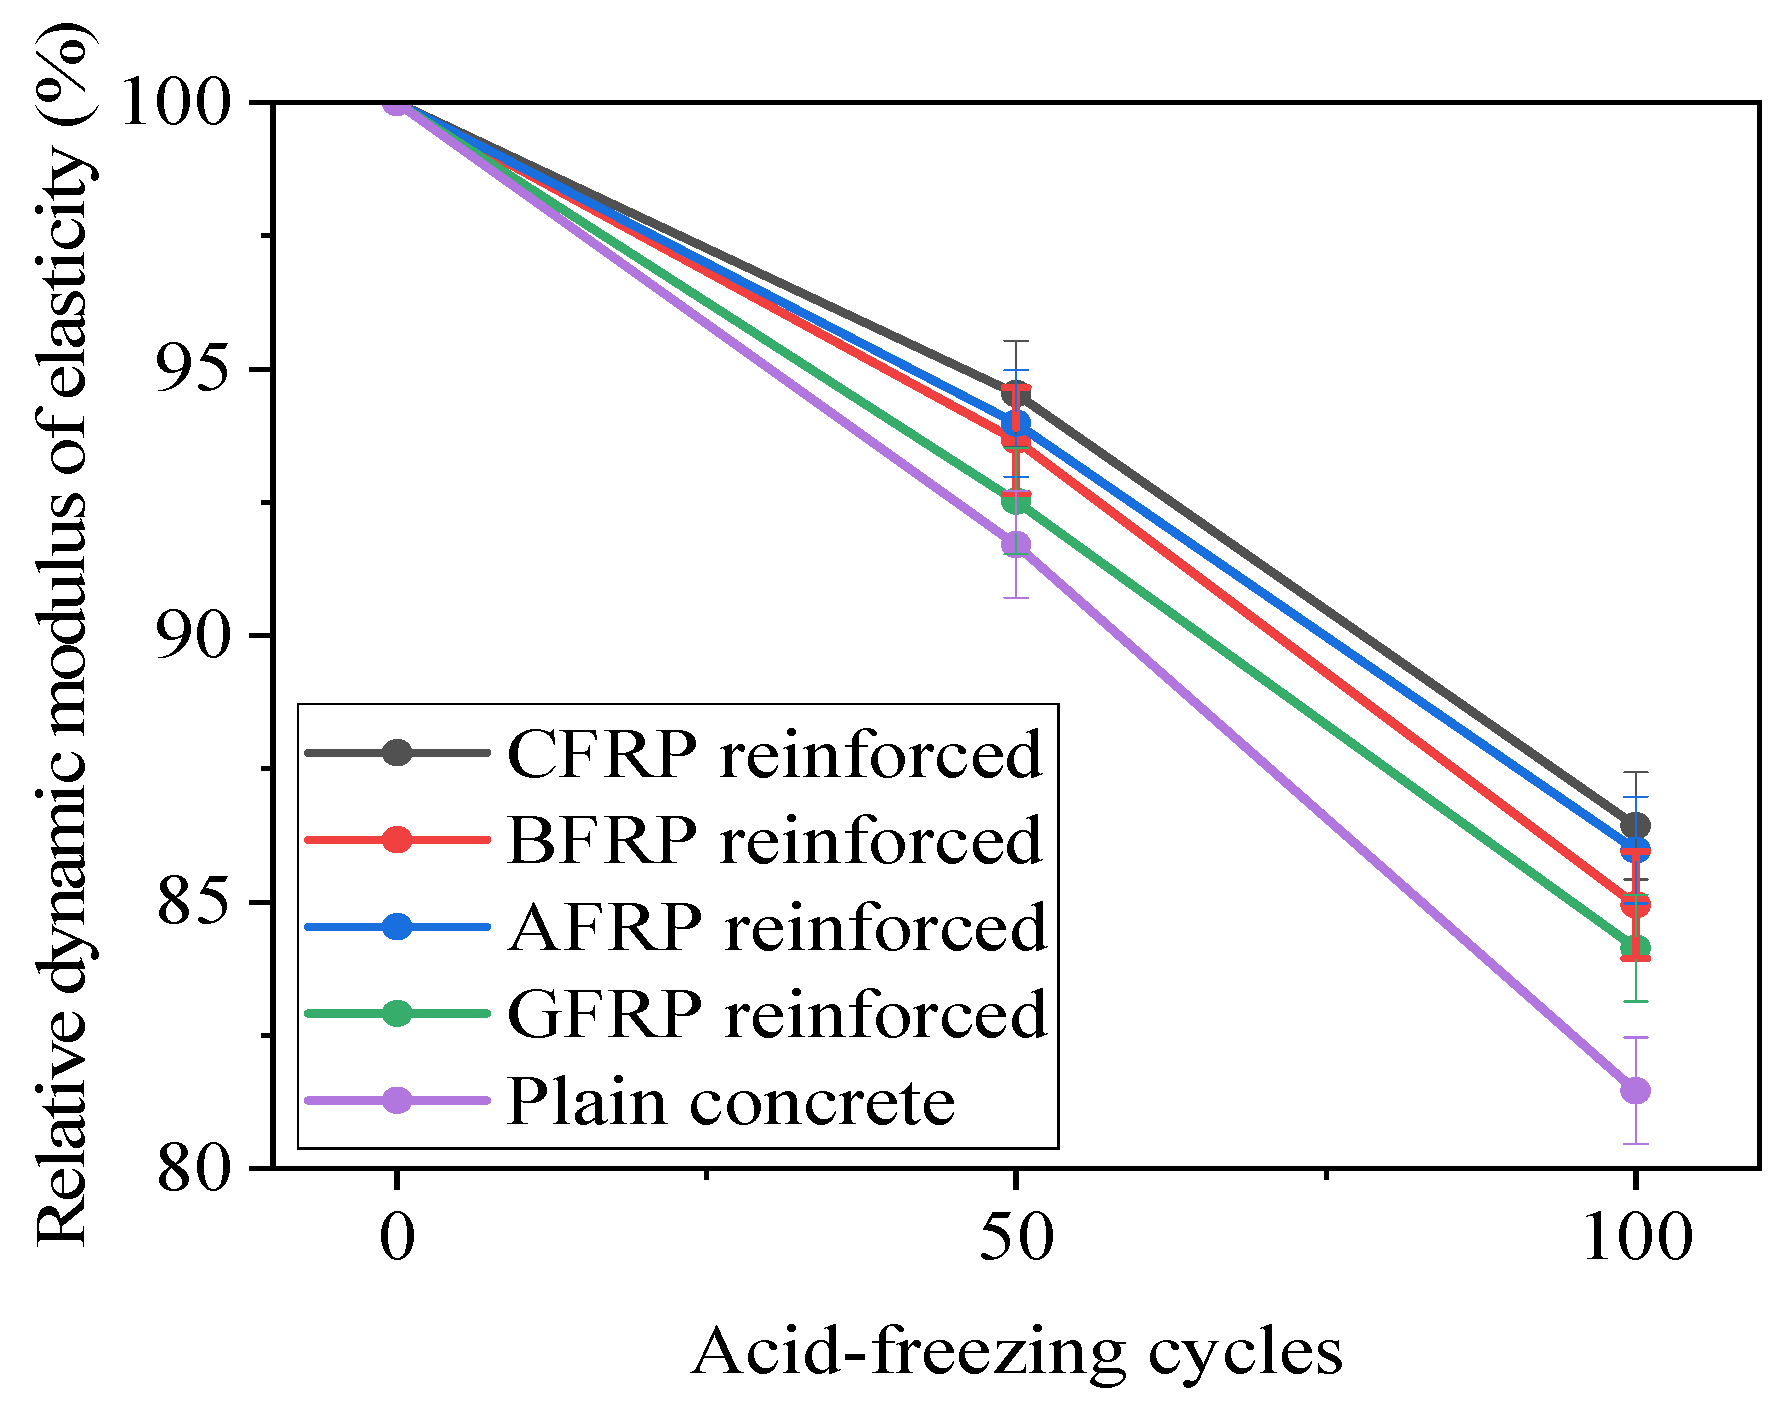
The mass change patterns of the prismatic and cylindrical specimens were similar in the first 50 cycles of acid and freeze–thaw action. However, in the later stages, the mass of the prismatic specimens still decreased because the FRP sheets increased the volume ratio of the specimens exposed to the acid solution, and their integrity significantly improved. After 50 cycles of acid and freeze–thaw action, the relative dynamic elastic modulus of the plain concrete specimens was 91.7%, and thereafter, the relative dynamic elastic modulus continued to decrease. The relative dynamic elastic modulus of the FRP-bonded specimens was consistent with that of the plain specimens. Because the FRP sheets partially covering the concrete blocks reduced the acid erosion on the concrete, their values were higher than those of the plain specimens. The relative dynamic elastic modulus of the CFRP-bonded, BFRP-bonded, GFRP-bonded, and AFRP-bonded specimens increased by 6.1%, 4.3%, 5.5%, and 3.2%, respectively.
(3)
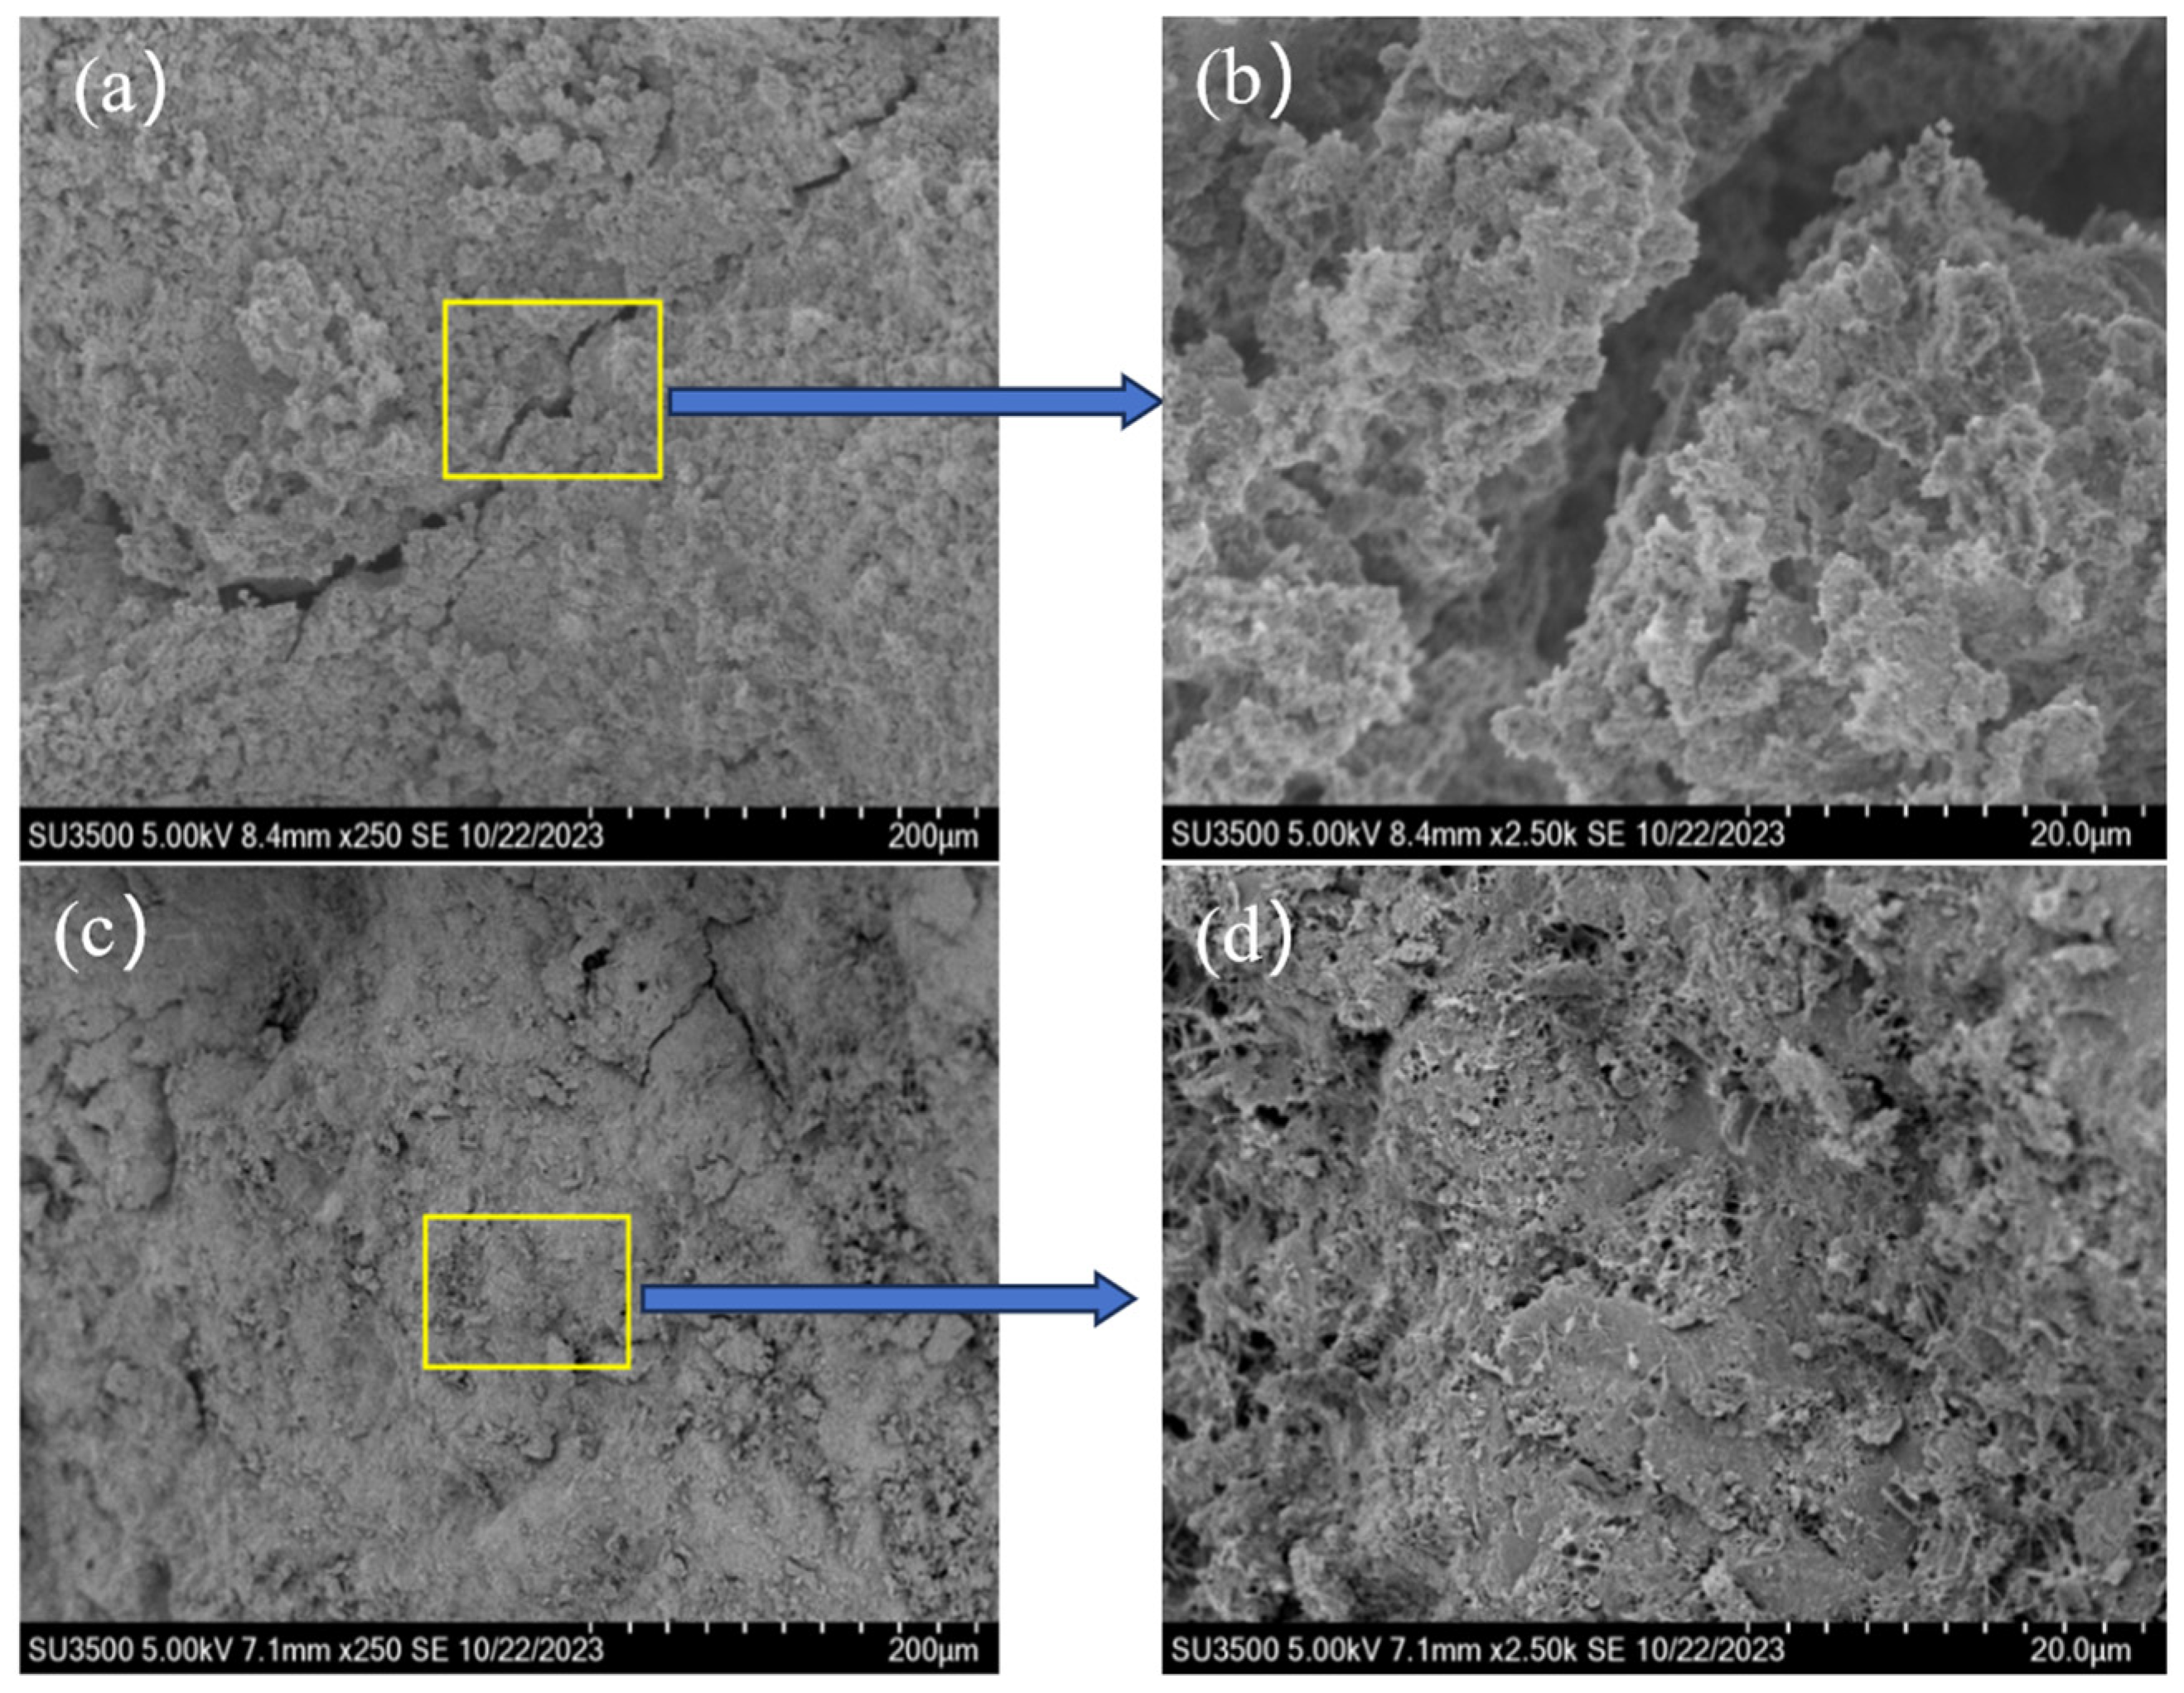
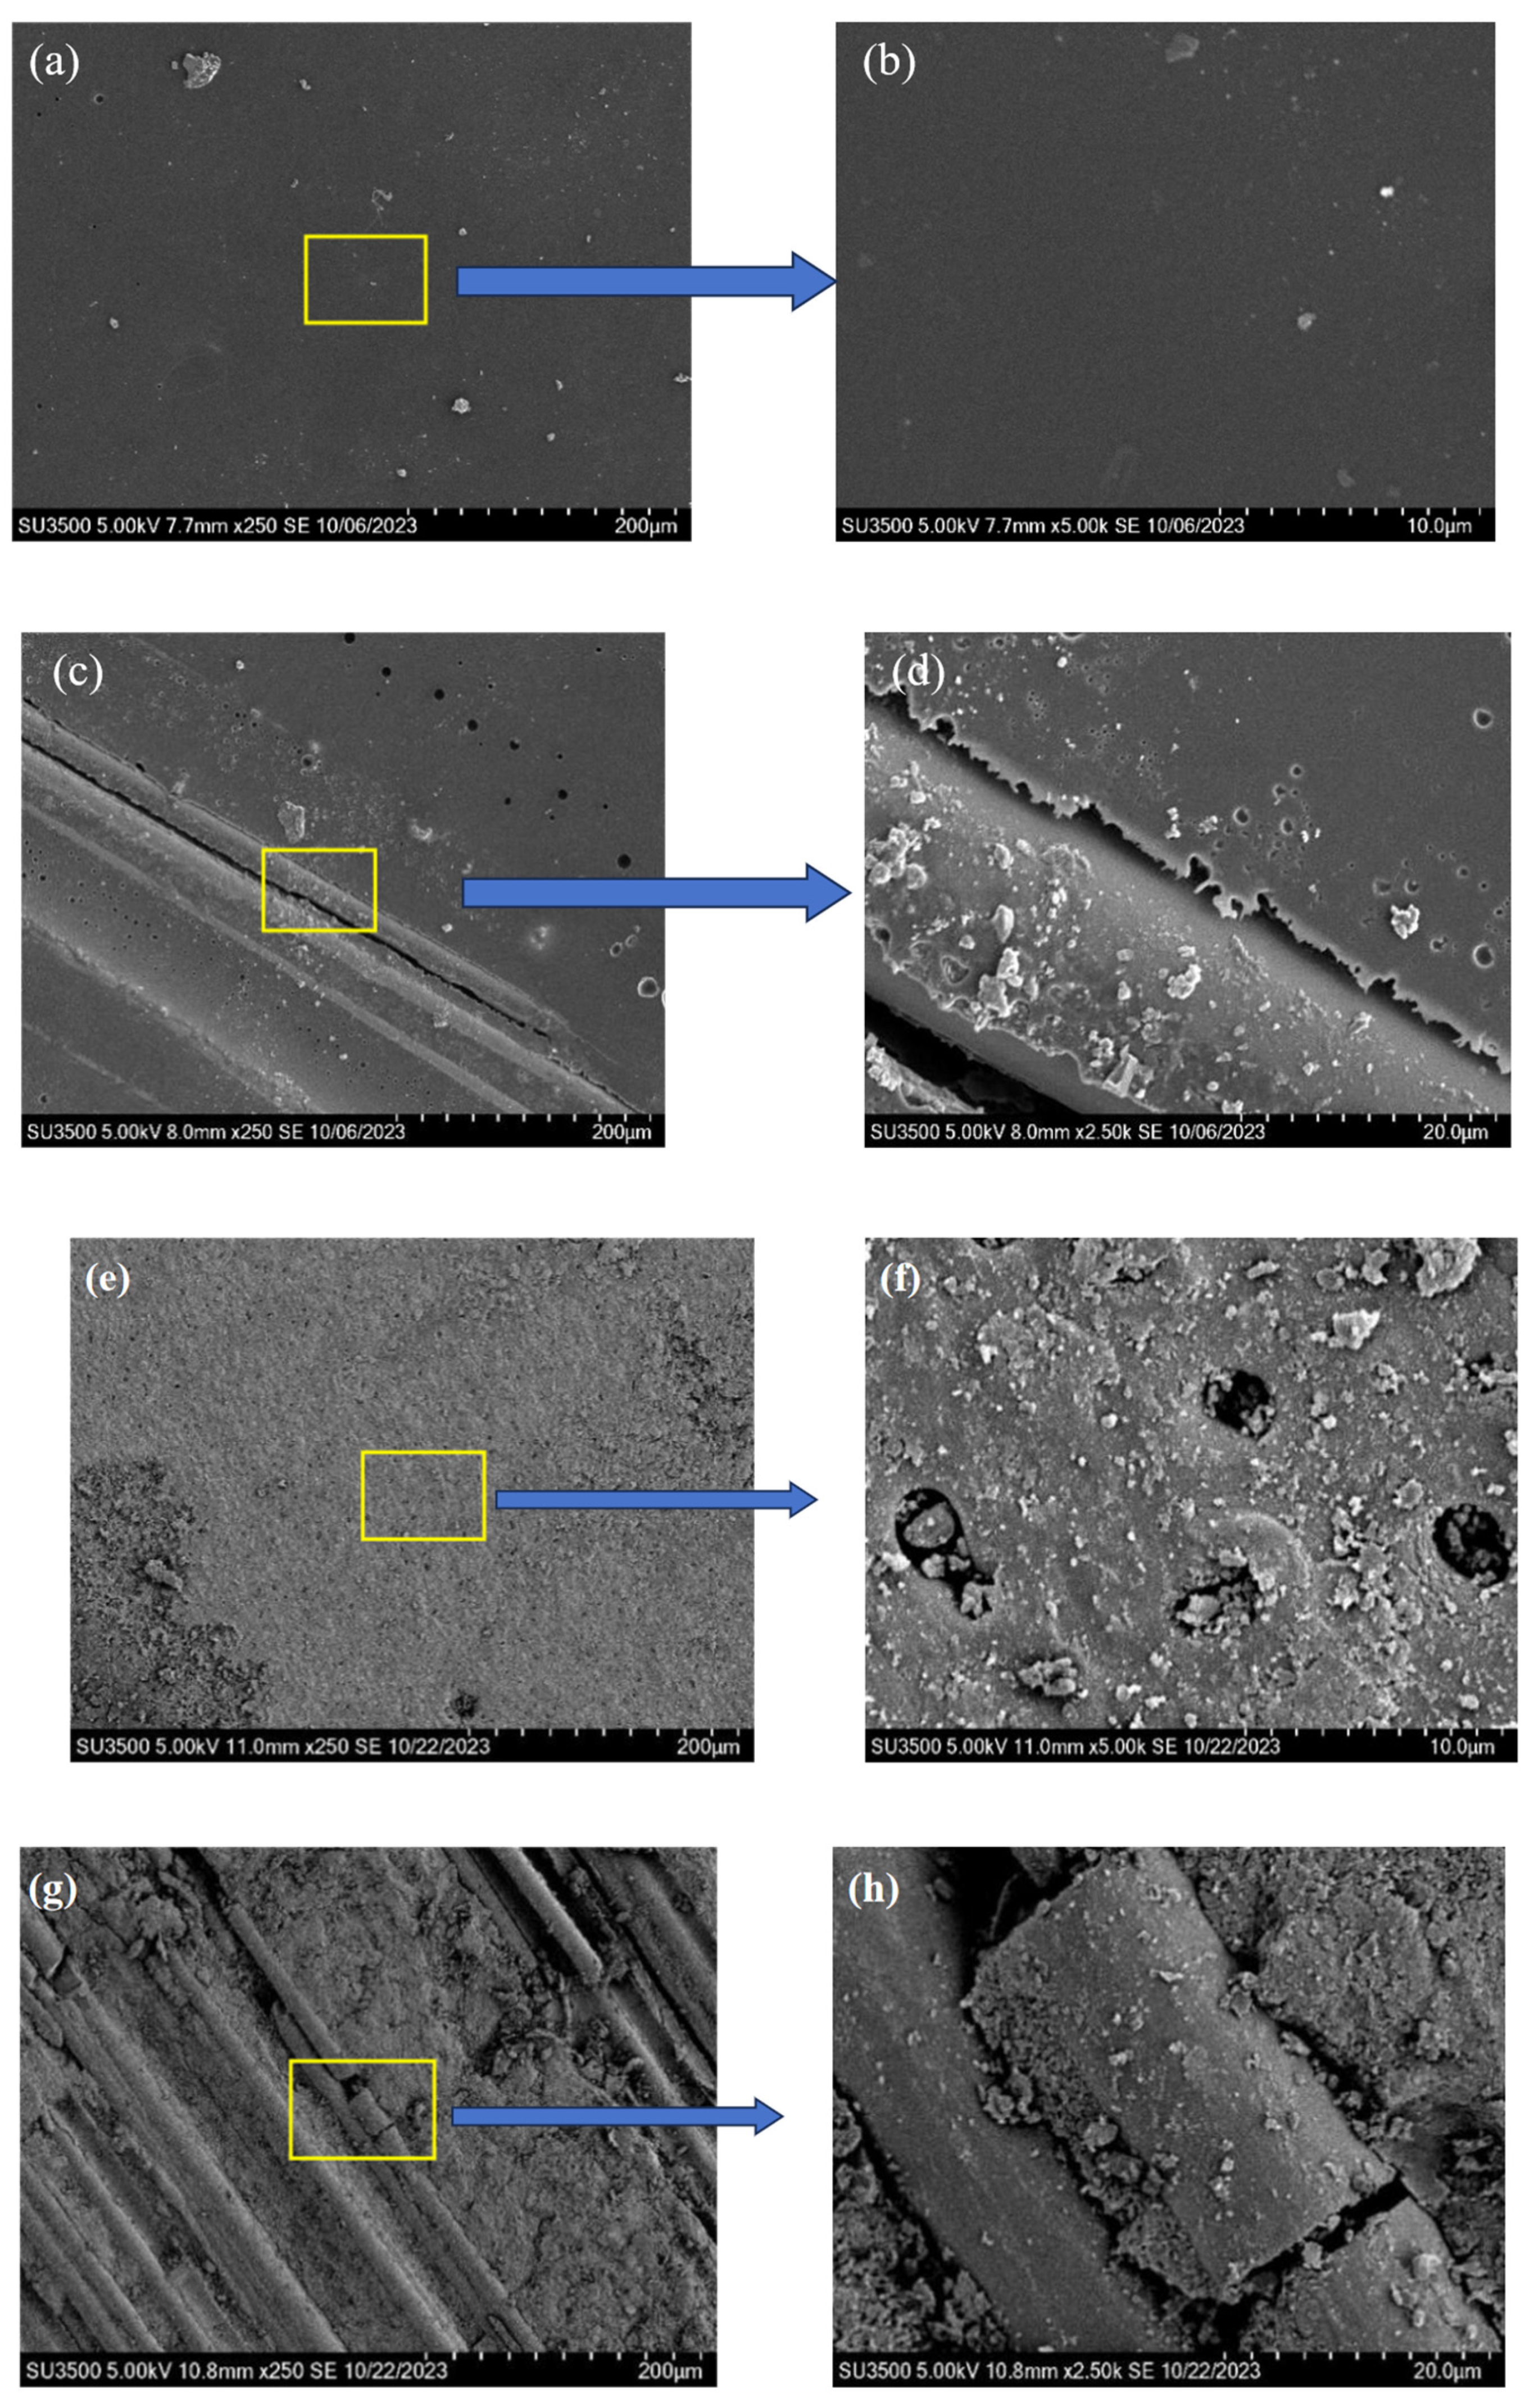
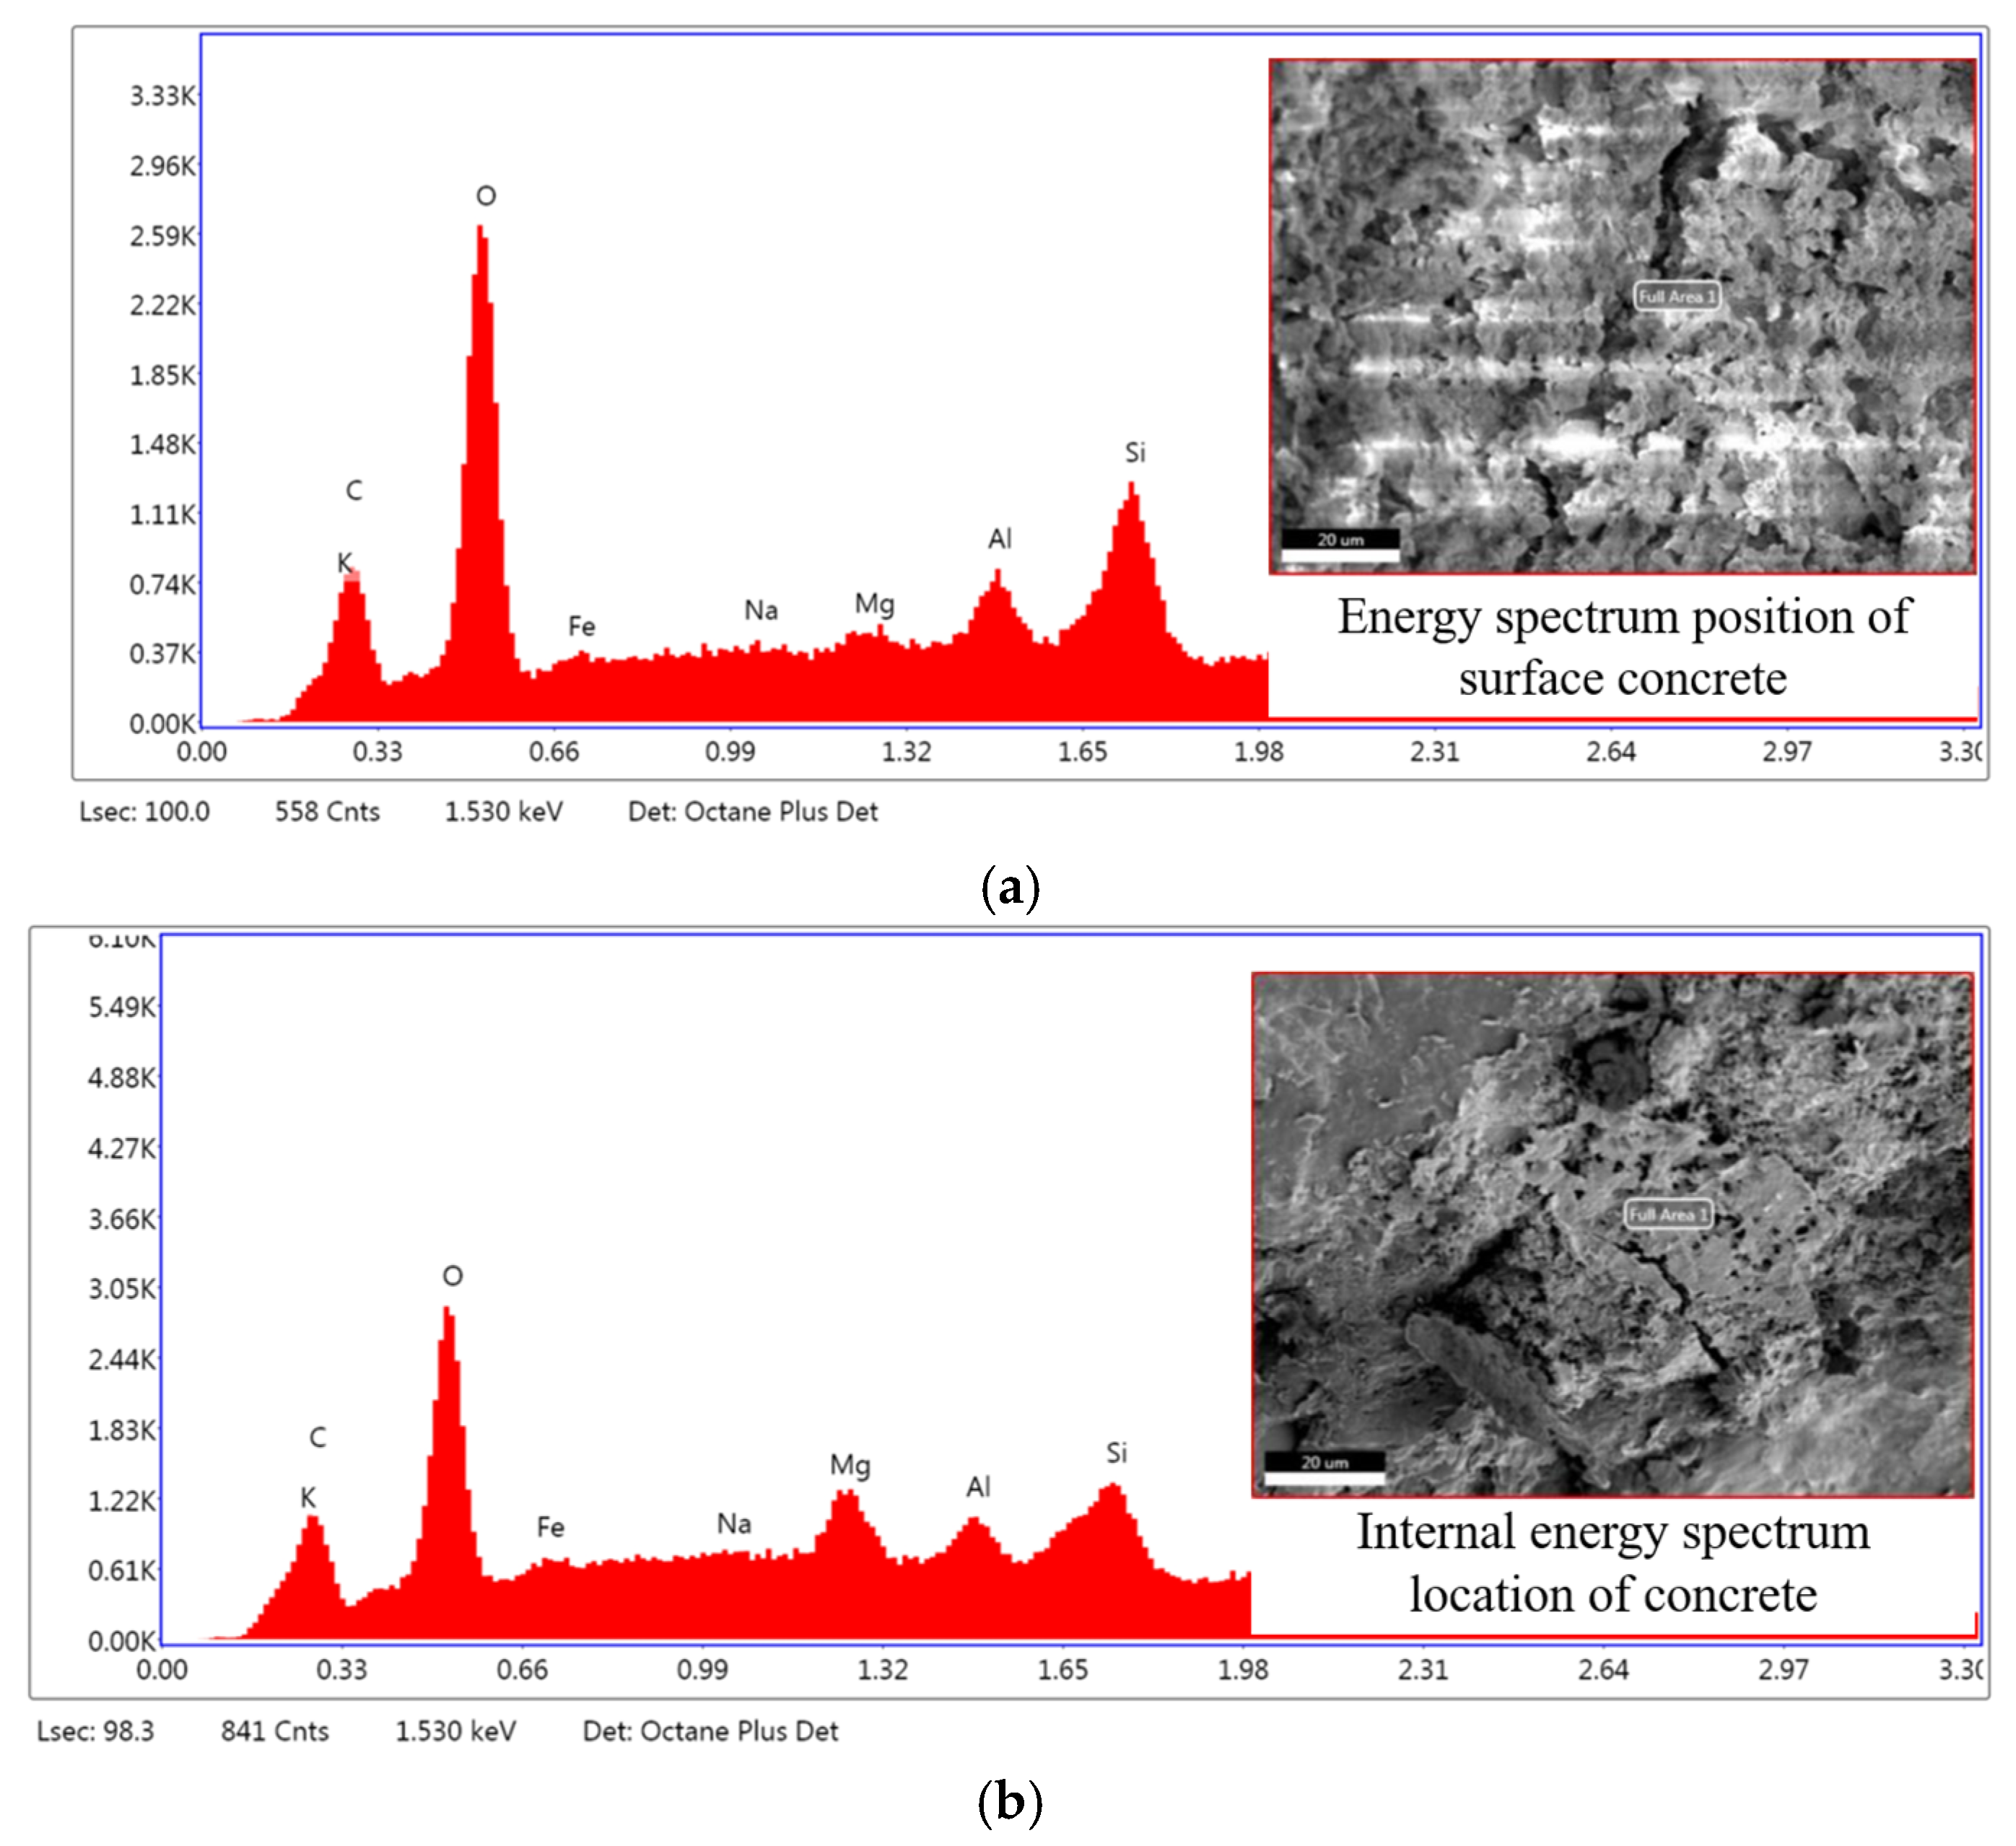
After 100 cycles of acid and freeze–thaw action, because of the crystallization of water molecules and the neutralization reaction, hydration products dissolved into the pore solution, decreasing the internal compactness. Because of the limited penetration of the sulfuric acid solution into the concrete interior, combined with the concrete surface layer’s thermal insulation effect, the concrete’s internal texture remained dense, and the C-S-H gel was intact.
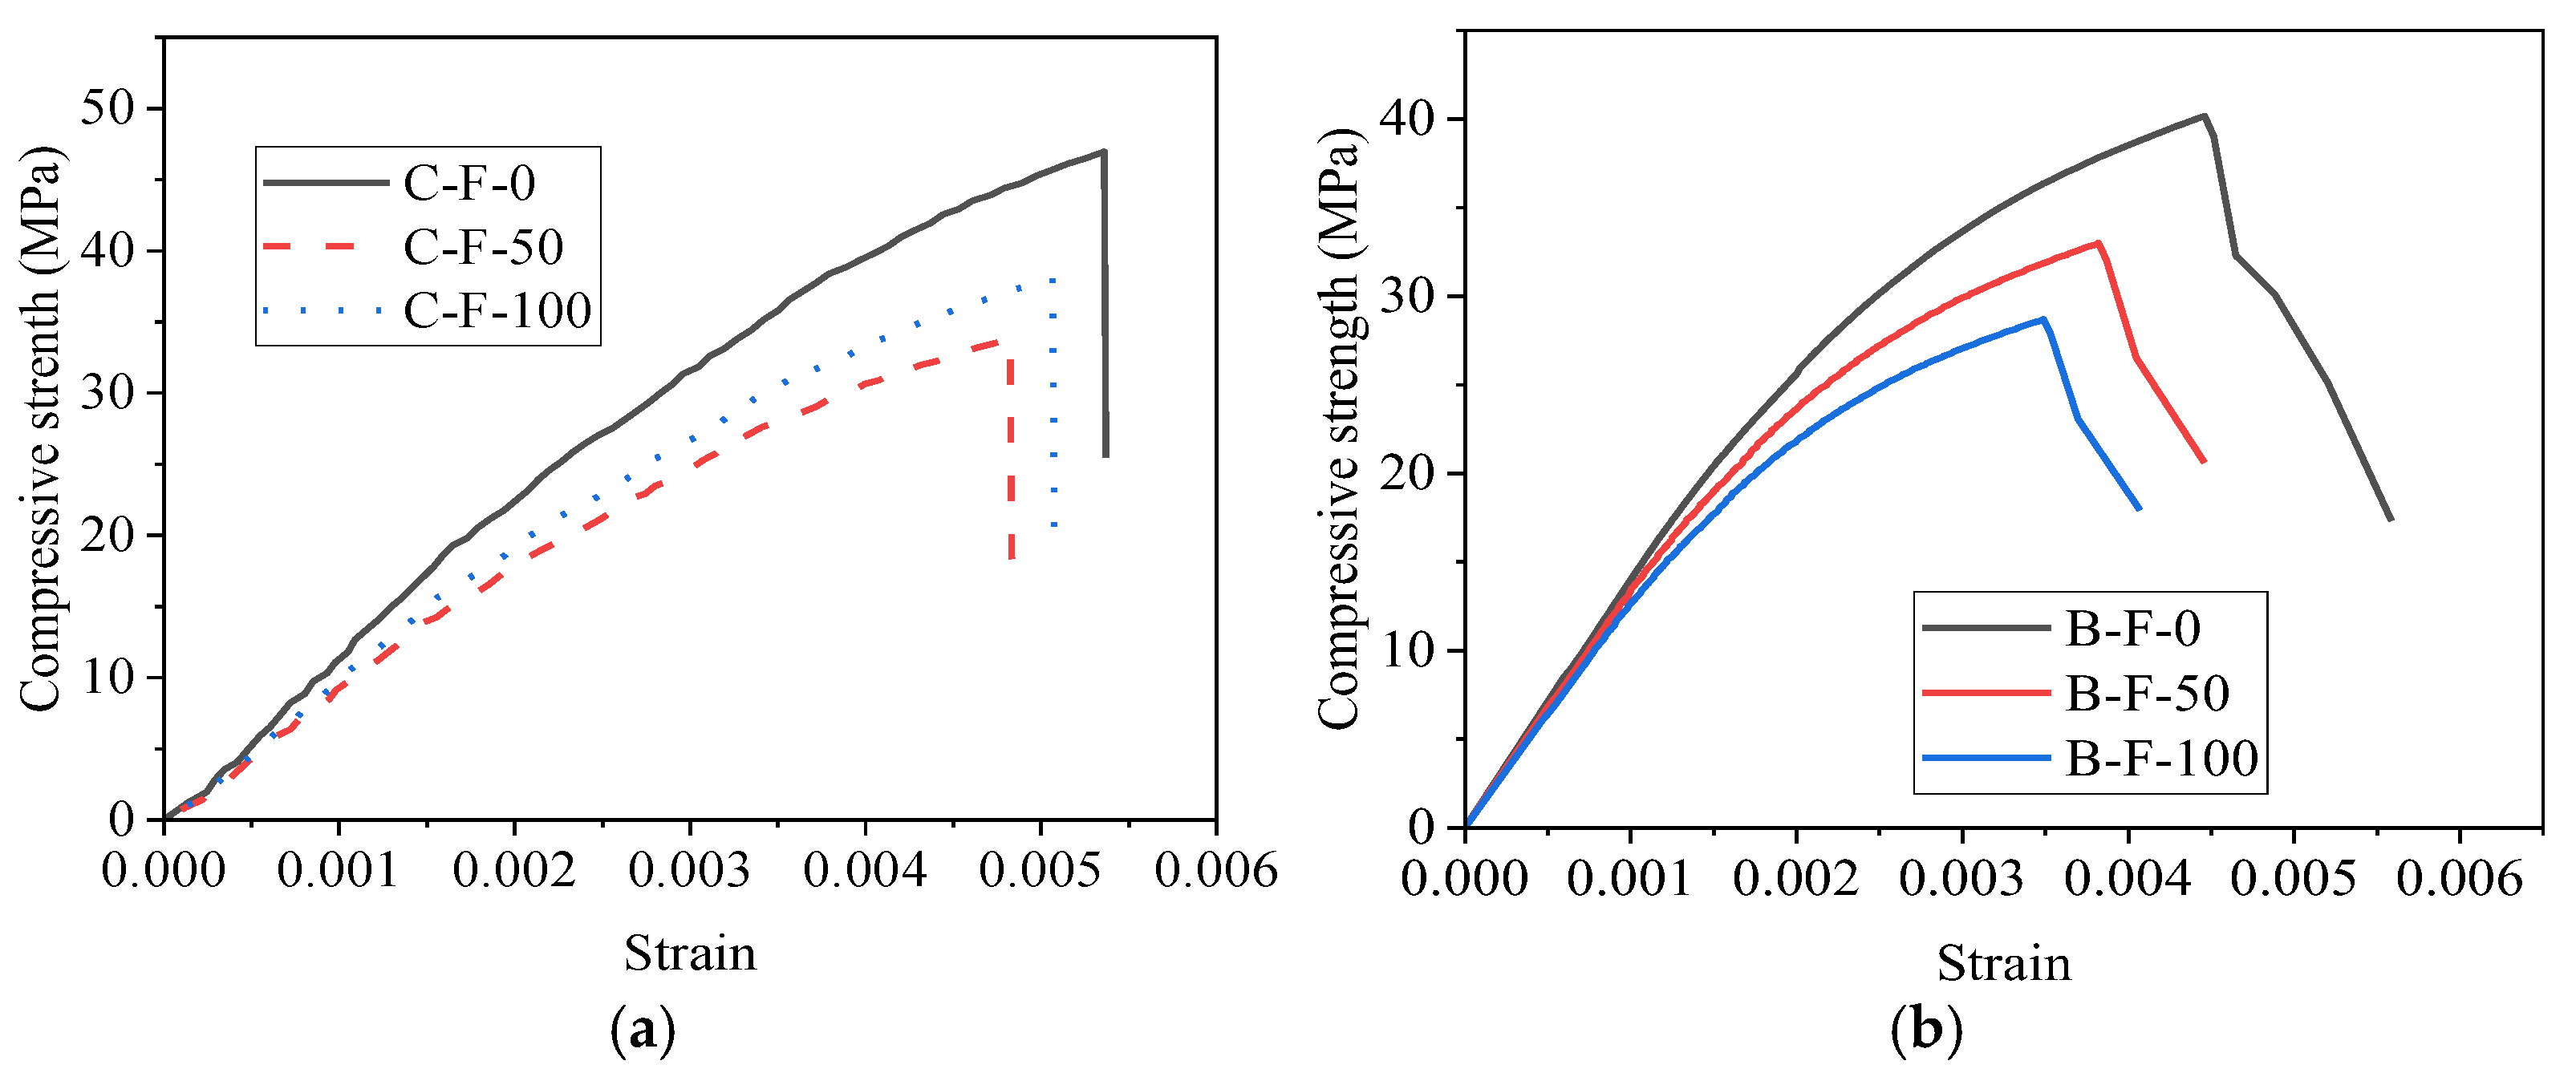
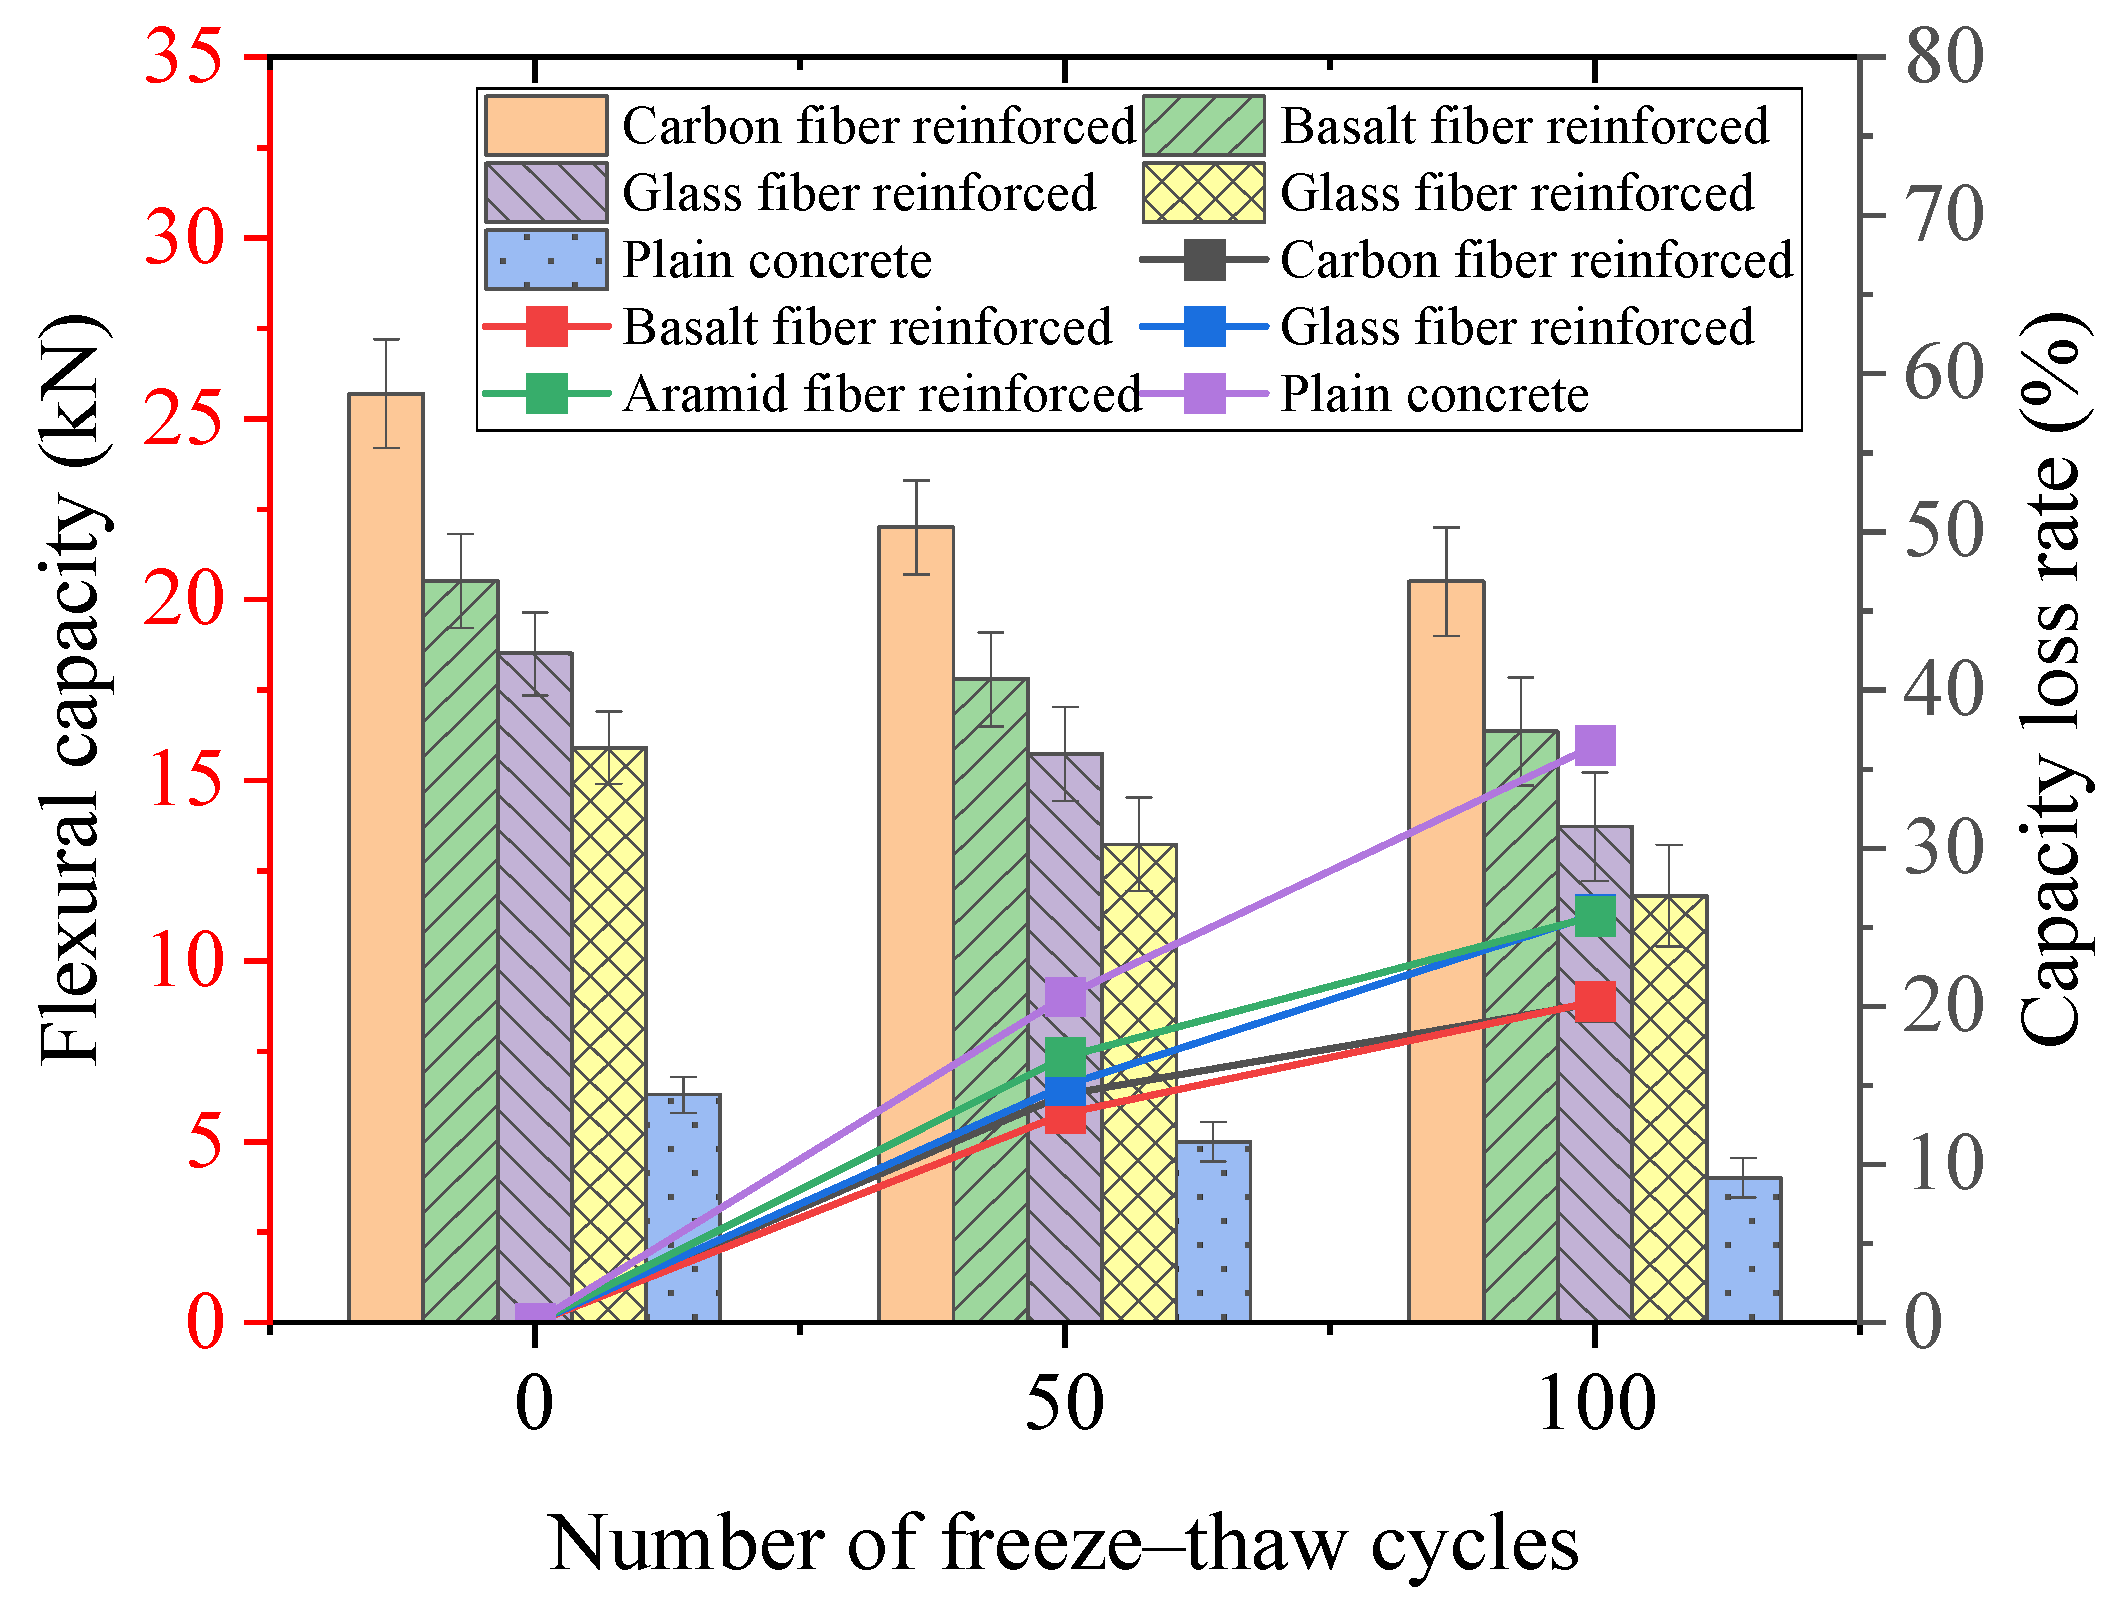
(4)
After 100 cycles of acid and freeze–thaw action, compared to the initial strength at 0 cycles, the strength loss rate, in ascending order, was CFRP-reinforced specimens < BFRP-reinforced specimens < AFRP-reinforced specimens < GFRP-reinforced specimens < plain specimens. The ranking from best to worst regarding compressive strength plasticity was as follows: AFRP-reinforced specimens > GFRP-reinforced specimens > control group > BFRP-reinforced specimens > CFRP-reinforced specimens. After 100 cycles of acid and freeze–thaw action, compared to the initial bearing capacity, the bearing capacity loss of each group, in ascending order, was CFRP-reinforced specimens (20.23%) < BFRP-reinforced specimens (20.3%) < AFRP-reinforced specimens (25.7%) < BFRP-reinforced specimens (25.8%) < plain concrete specimens (36.5%). The compressive strength and bearing capacity of each group increased compared to the control group, indicating that FRP provided good protection for the concrete during the freeze–thaw corrosion process.
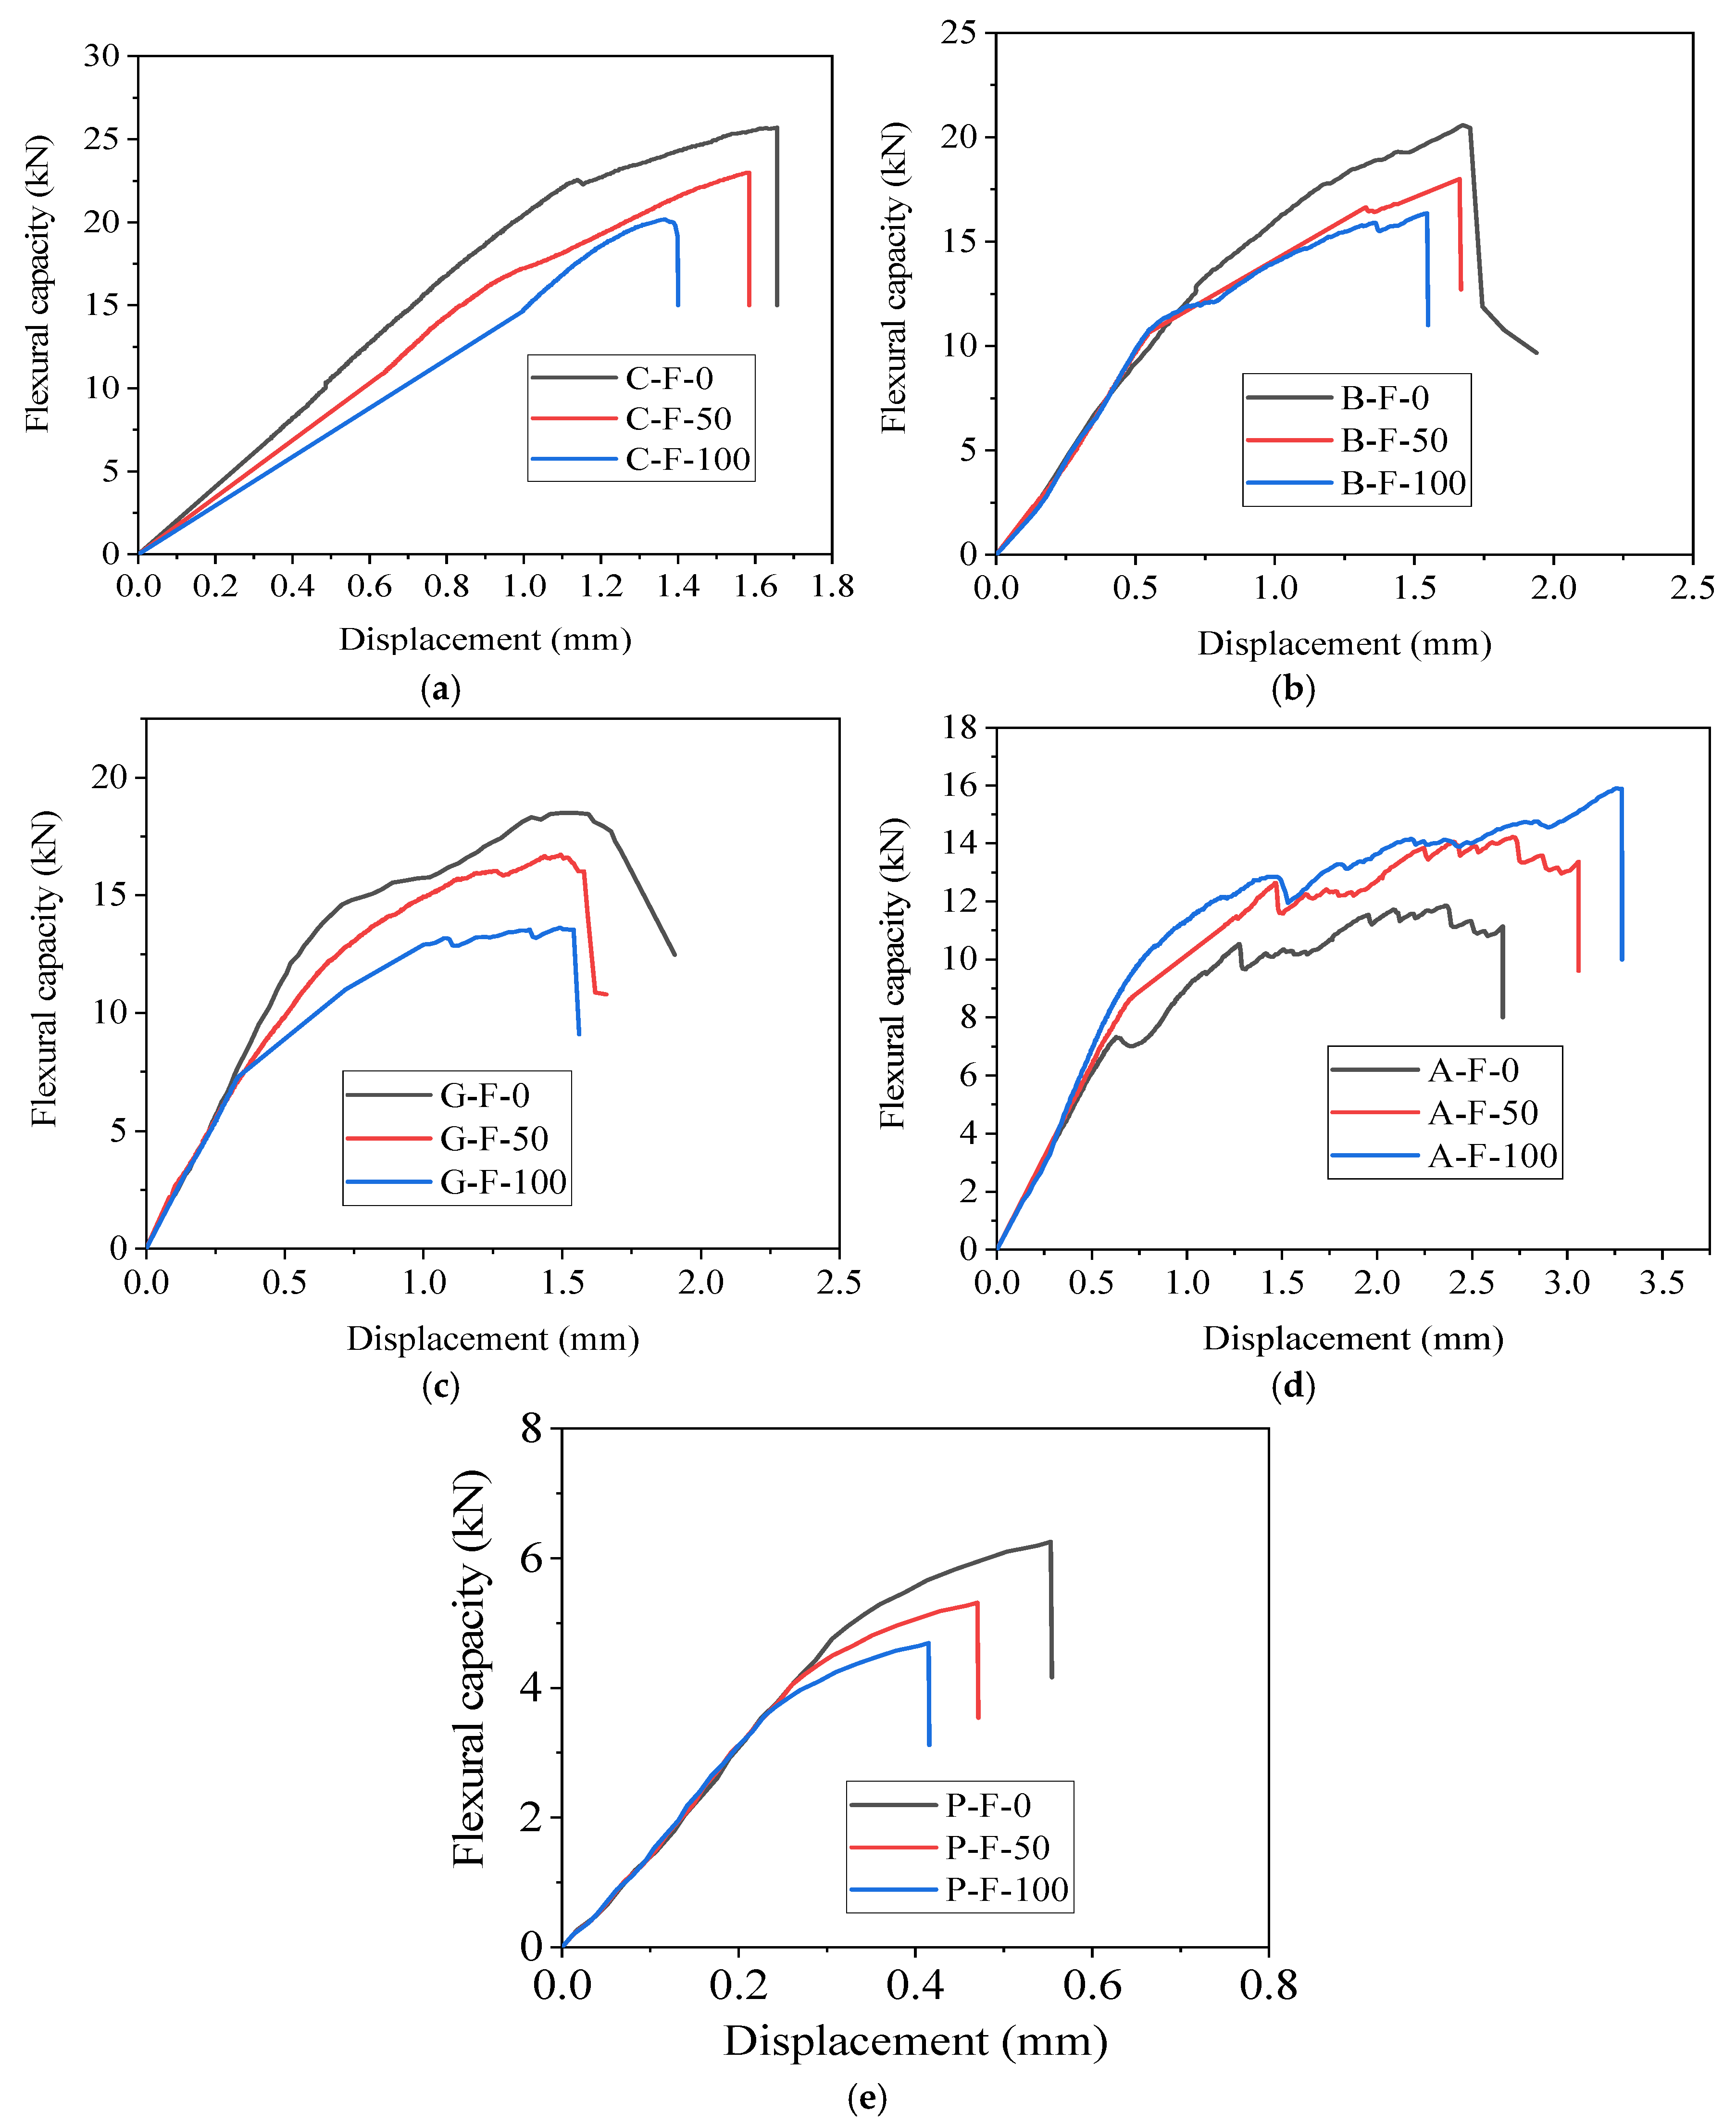
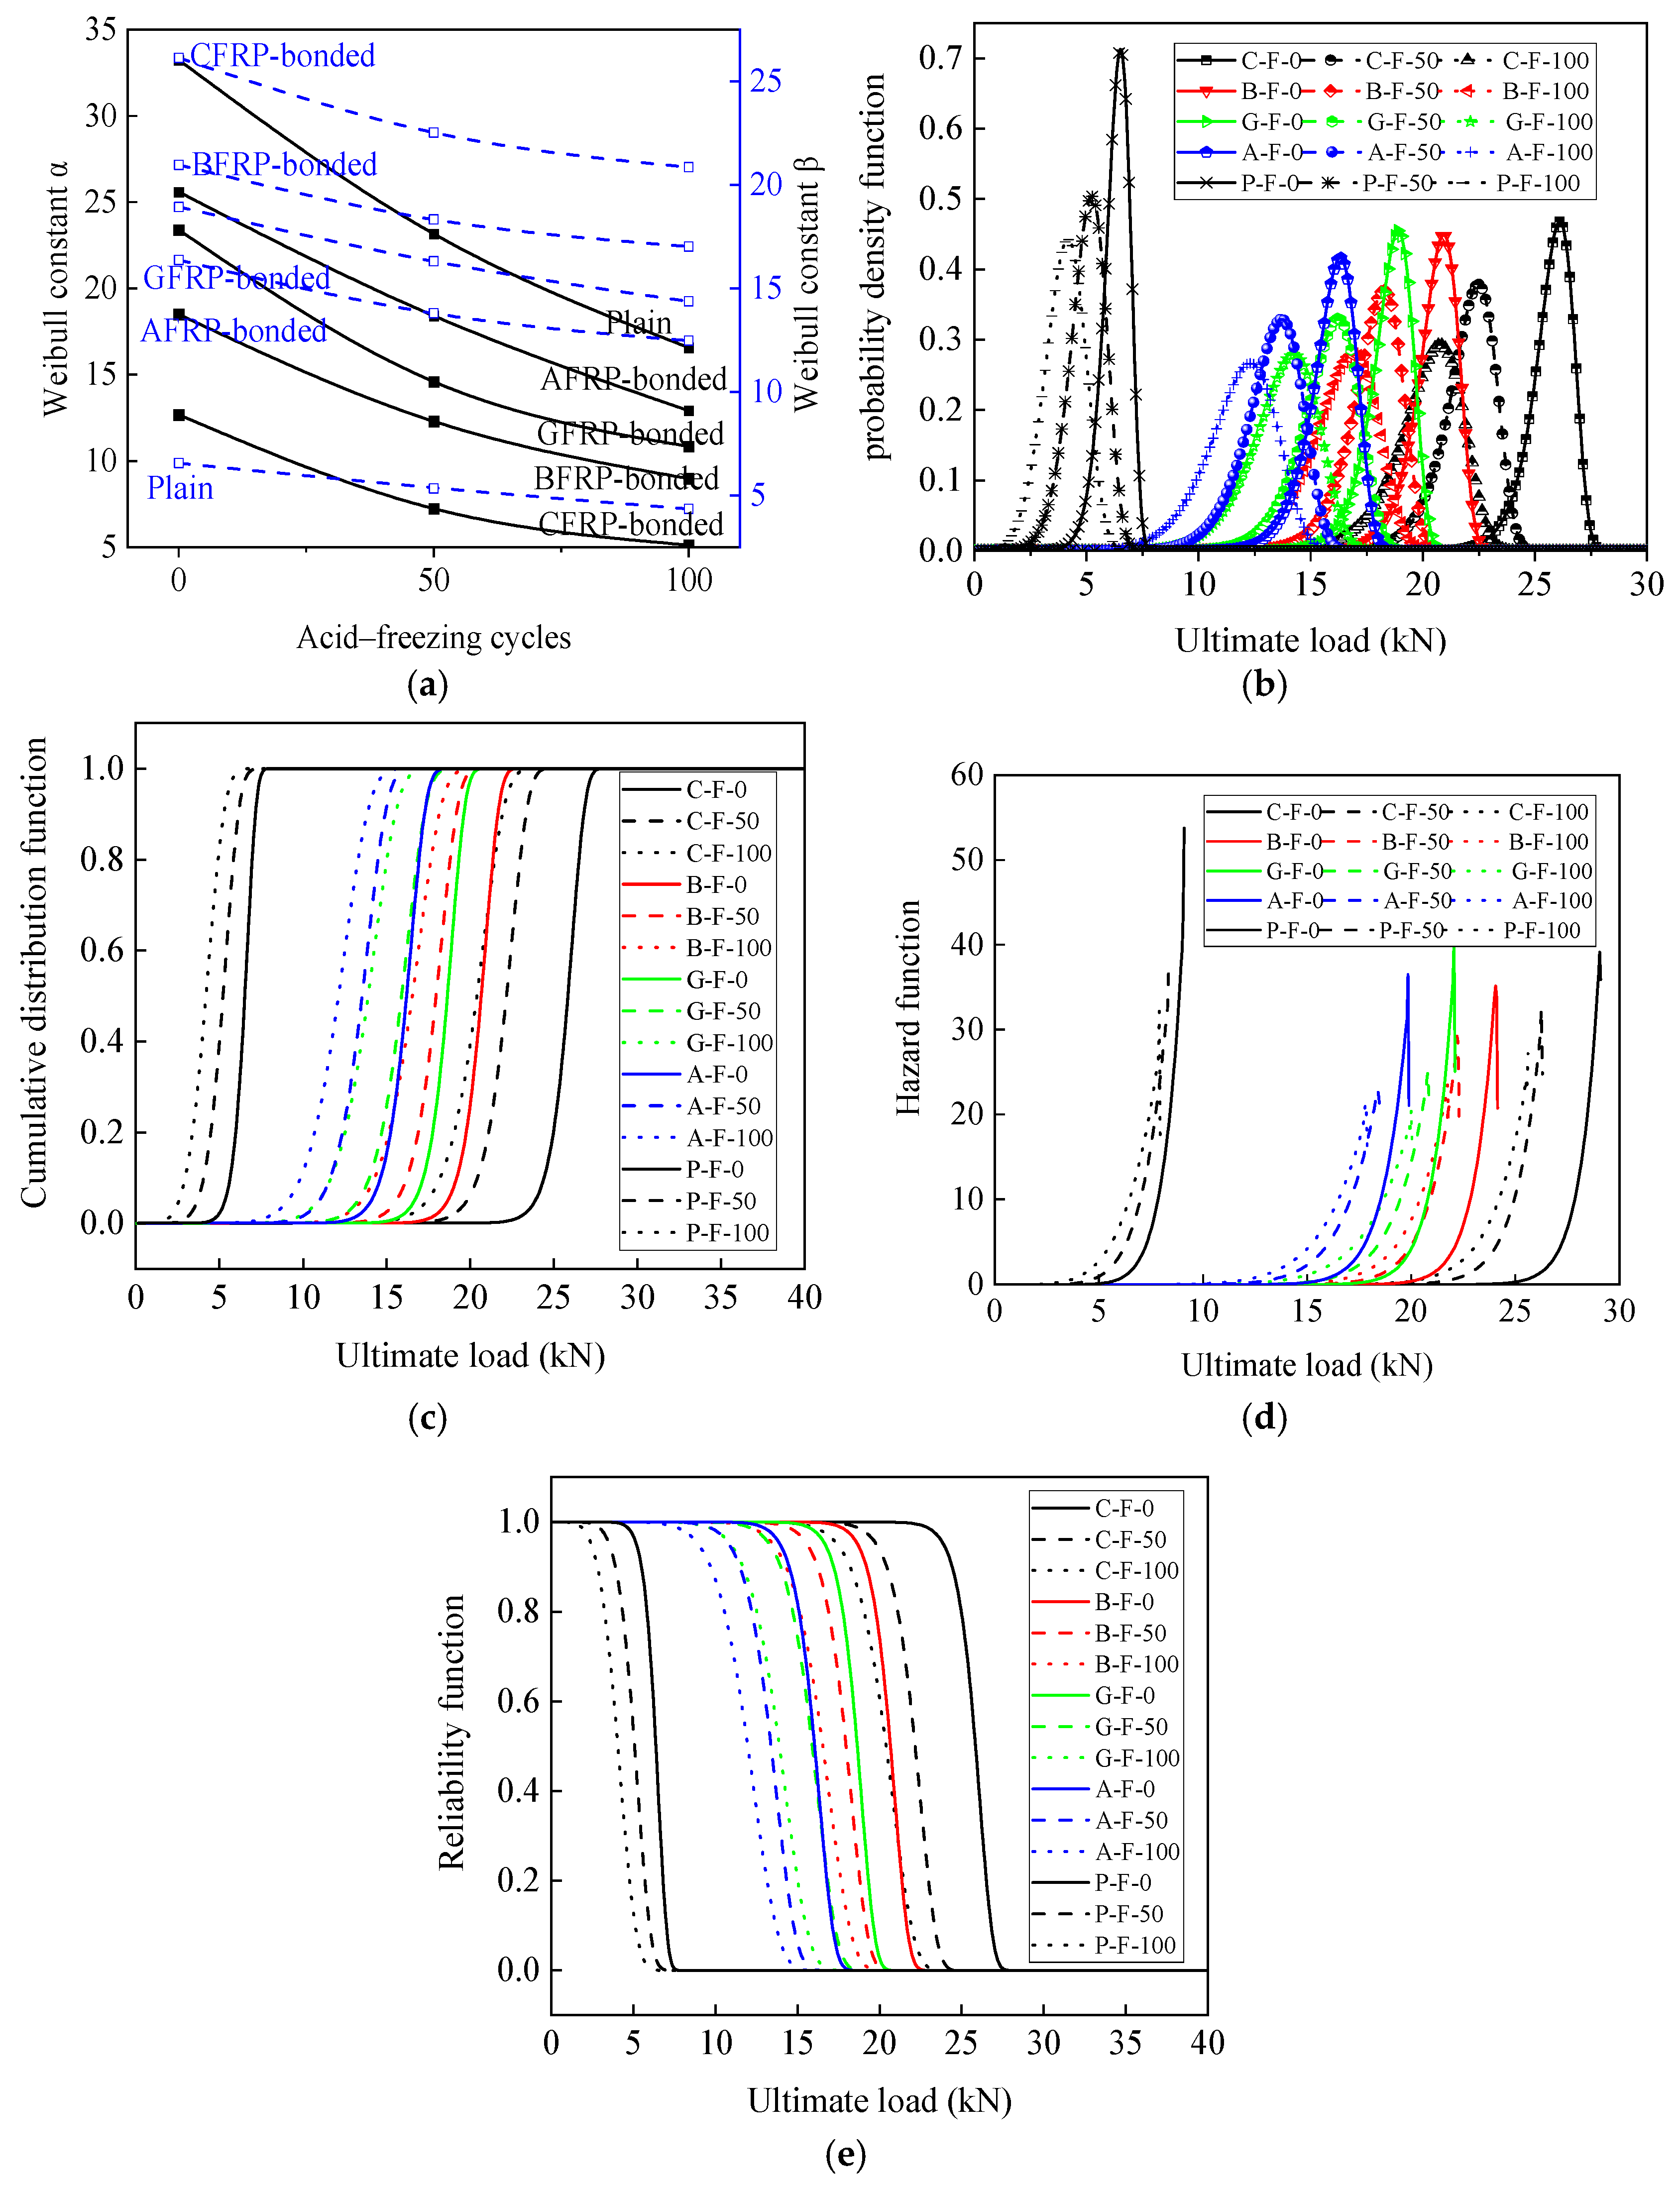
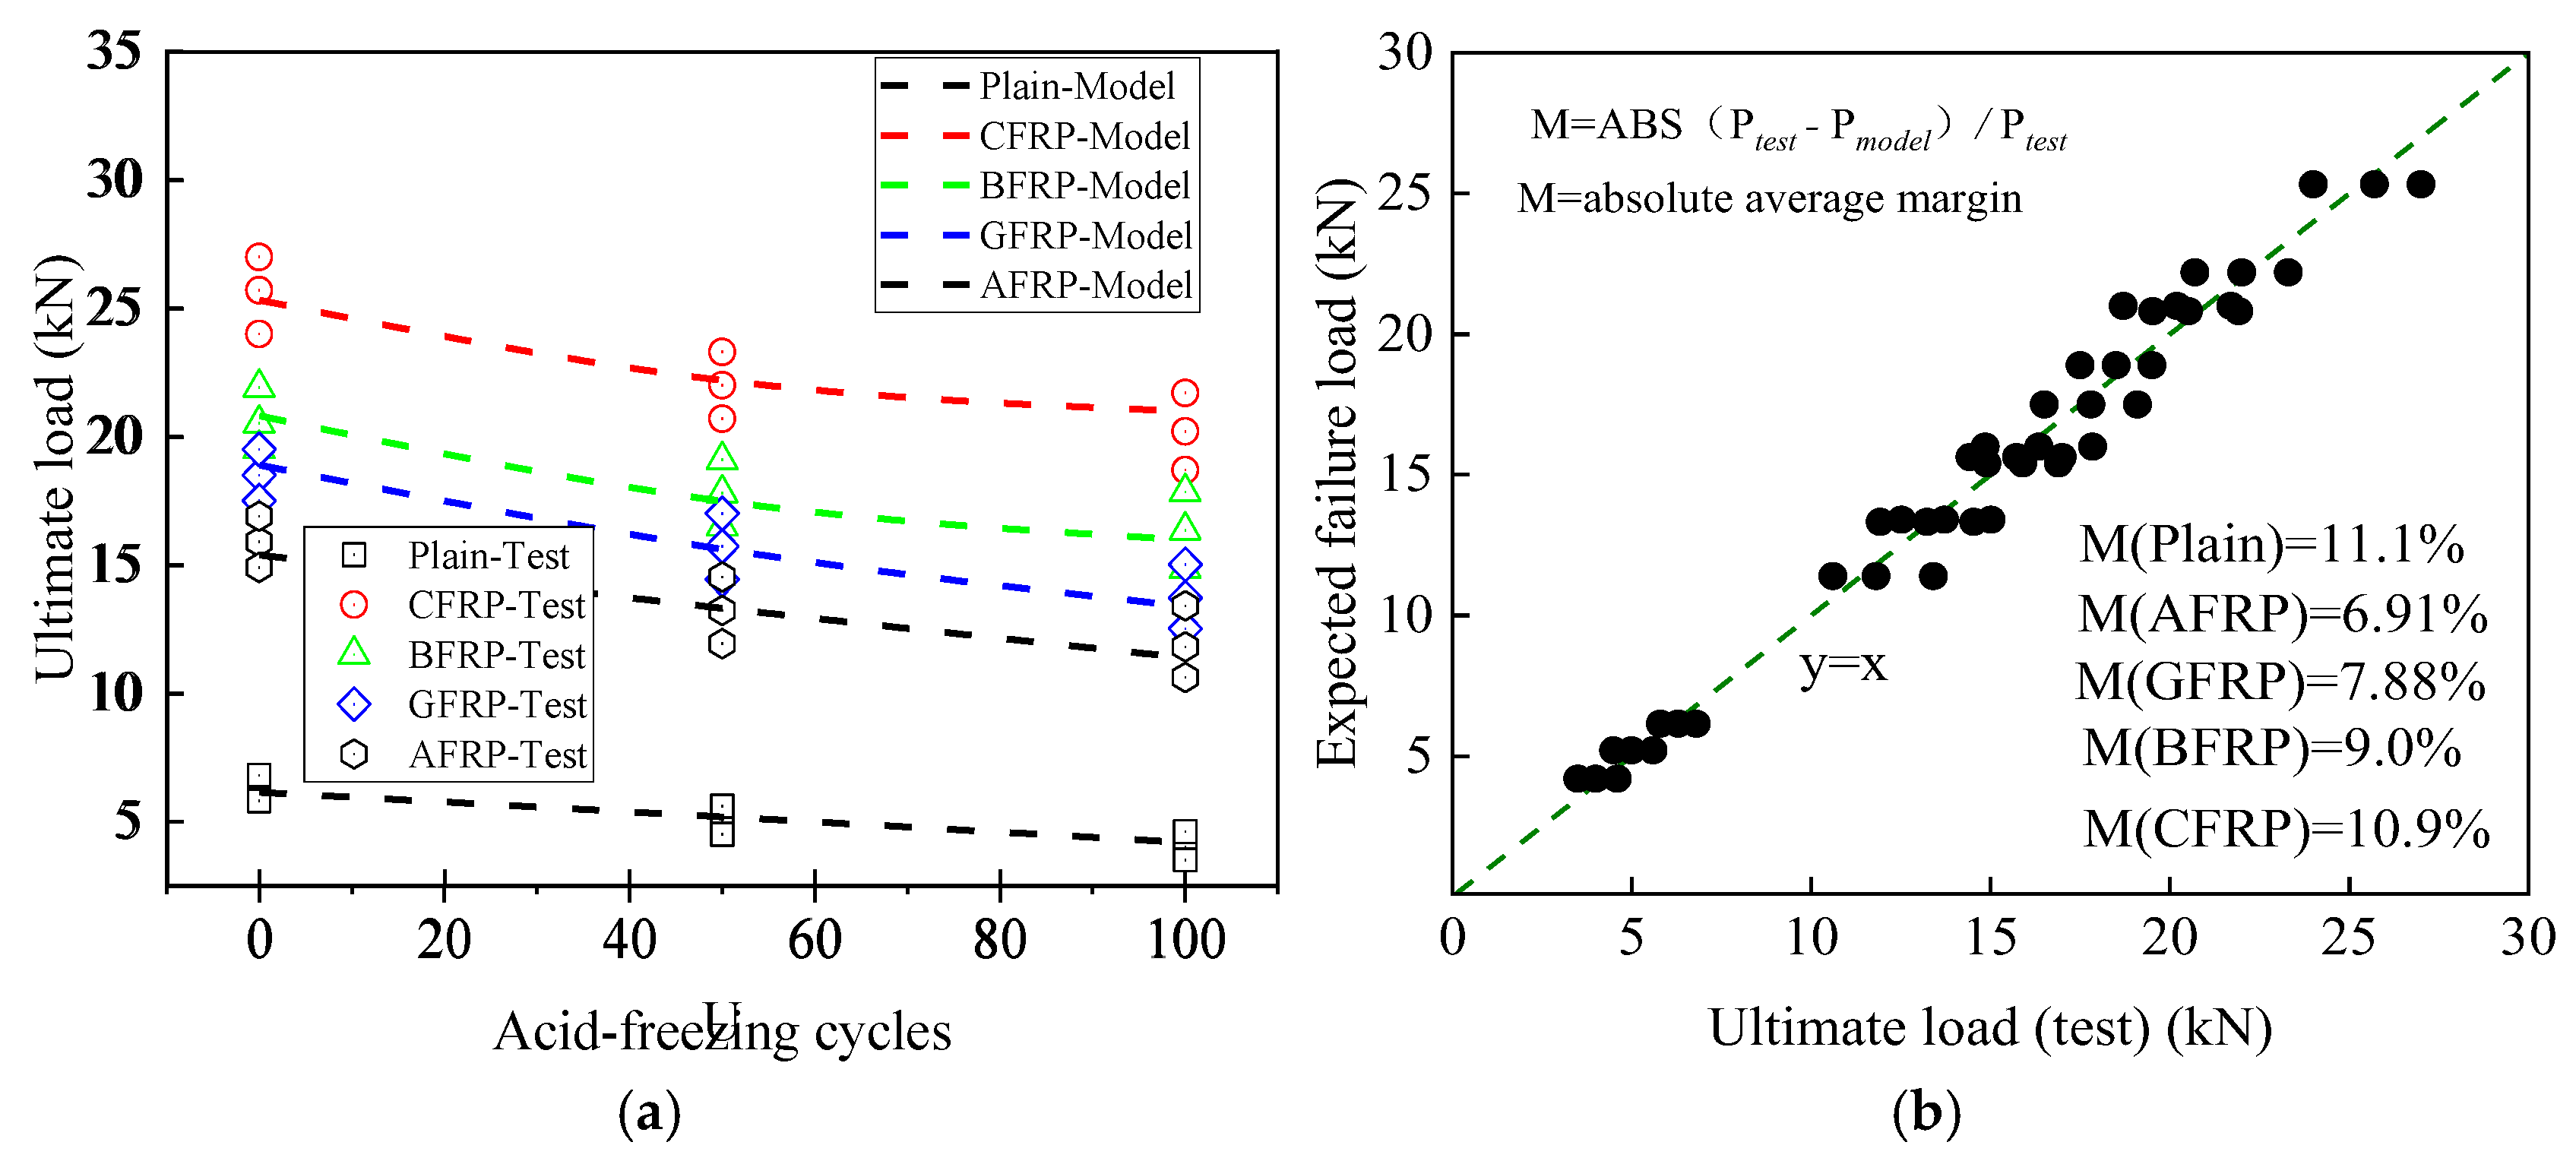
(5)
A probability-based model was developed to study the degradation of the FRP-reinforced and plain concrete under chemical action. As degradation progressed, the probability density of the ultimate load became more concentrated, confirming the weak points in concrete failure. H2SO4 increased the risk of damage, while FRP improved the reliability of concrete’s load-bearing capacity. After 100 acid–freeze–thaw cycles, the unreinforced specimens failed at 4.2 kN, whereas the CFRP-, BFRP-, GFRP-, and AFRP-reinforced specimens had failure loads of 21.0 kN, 16.0 kN, 13.4 kN, and 11.4 kN, respectively, demonstrating FRP’s effectiveness in enhancing durability.

Author Contributions

Conceptualization, S.J., P.C. and M.P.; methodology, F.L.; laboratory test and data acquisition, D.W. and W.L.; validation, F.L.; data processing and analysis, P.C. and F.L.; writing—original draft preparation, F.L.; writing—review and editing, W.L.; supervision, S.J. and D.W.; funding acquisition. All authors have read and agreed to the published version of the manuscript.

Funding

This research received no external funding.

Institutional Review Board Statement

Not applicable.

Informed Consent Statement

Not applicable.

Data Availability Statement

The datasets used and/or analyzed during the current study are available from the corresponding author on reasonable request.

Acknowledgments

Thanks to Wang Dayang and Li Wei for helping to complete the test of mechanical properties. Thanks to Cheng Peifeng and Jin Shenghao for reviewing this manuscript.

Conflicts of Interest

Author Fei Li were employed by the company Longjian Road & Bridge Co. The remaining authors declare that the research was conducted in the absence of any commercial or financial relationships that could be construed as a potential conflict of interest.

References

  1. Wang, R.; Zhang, Q.; Li, Y. Deterioration of concrete under the coupling effects of freeze–thaw cycles and other actions: A review. Constr. Build. Mater. 2022, 319, 126045. [Google Scholar] [CrossRef]
  2. Şahin, Y.; Akkaya, Y.; Taşdemir, M.A. Effects of freezing conditions on the frost resistance and microstructure of concrete. Constr. Build. Mater. 2021, 270, 121458. [Google Scholar] [CrossRef]
  3. Bespalhuk, K.J.; de Oliveira, T.J.C.; Valverde, J.V.P.; Gonçalves, R.A.; Ferreira-Neto, L.; Souto, P.C.S.; Silva, J.R.; de Souza, N.C. Fractal analysis of microstructures in Portland cement pastes—Effect of curing conditions. Constr. Build. Mater. 2023, 363, 129881. [Google Scholar] [CrossRef]
  4. Zhou, C.; Lan, G.; Cao, P.; Tang, C.; Cao, Q.; Xu, Y.; Feng, D. Impact of freeze-thaw environment on concrete materials in two-lift concrete pavement. Constr. Build. Mater. 2020, 262, 120070. [Google Scholar] [CrossRef]
  5. Nejad, A.F.; Salim, M.Y.B.; Koloor, S.S.R.; Petrik, S.; Yahya, M.Y.; Hassan, S.A.; Shah, M.K.M. Hybrid and synthetic FRP composites under different strain rates: A review. Polymers 2021, 13, 3400. [Google Scholar] [CrossRef]
  6. Mugahed Amran, Y.H.; Alyousef, R.; Rashid, R.S.M.; Alabduljabbar, H.; Hung, C.-C. Properties and applications of FRP in strengthening RC structures: A review. Structures 2018, 16, 208–238. [Google Scholar] [CrossRef]
  7. Qureshi, J. A Review of Recycling Methods for Fibre Reinforced Polymer Composites. Sustainability 2022, 14, 16855. [Google Scholar] [CrossRef]
  8. Yi, Y.; Guo, S.; Li, S.; Rahman, Z.; Zhou, L.; Shi, C.; Zhu, D. Effect of alkalinity on the shear performance degradation of basalt fiber-reinforced polymer bars in simulated seawater sea sand concrete environment. Constr. Build. Mater. 2021, 299, 123957. [Google Scholar] [CrossRef]
  9. Kim, H.Y.; Park, Y.H.; You, Y.J.; Moon, C.K. Short-term durability test for GFRP rods under various environmental conditions. Compos. Struct. 2008, 83, 37–47. [Google Scholar] [CrossRef]
  10. D’Antino, T.; Pisani, M.A.; Poggi, C. Effect of the environment on the performance of GFRP reinforcing bars. Compos. Part B Eng. 2018, 141, 123–136. [Google Scholar] [CrossRef]
  11. Li, P.D.; Wu, Y.F. Stress-strain behavior of actively and passively confined concreteunder cyclic axial load. Compos. Struct. 2016, 149, 369–384. [Google Scholar] [CrossRef]
  12. Wu, Y.F.; Cao, Y.G. Effect of load path on behavior of FRP-confined concretel. J. Compos. Constr. 2017, 21, 4017014. [Google Scholar] [CrossRef]
  13. Chen, Z.; Xu, R.; Liang, Y.; Xu, W.; Liang, Y. Experimental study and finite element analysis on axial compression performance of CFRP-PVC confined coral seawater and sea-sand concrete columns. Eng. Struct. 2024, 302, 117443. [Google Scholar] [CrossRef]
  14. Wu, Z.; Islam, S.M.; Said, H. A Three-Parameter Bond Strength Model for FRP—Concrete Interface. J. Reinf. Plast. Compos. 2008, 19, 2309–2323. [Google Scholar] [CrossRef]
  15. Mostefa, H.; Farid Bi Bensaid, B.; Tahar, H.D.; Selma, C.; Abderahim, L.; Sofiane, A. Experimental and numerical investigation on the deflection behavior of pre-cracked and repaired reinforced concrete beams with fiber-reinforced polymer. Constr. Build. Mater. 2020, 249, 118745. [Google Scholar]
  16. Umberto, D.M.; Daniele, G.; Fabrizio, G.; Paolo, L.; Andrea, P. The damage effect on the dynamic characteristics of FRP-strengthened reinforced concrete structures. Compos. Struct. 2023, 309, 116731. [Google Scholar]
  17. Song, M.; Wu, W.; Zhou, H. Experimental study on the mechanical properties of concrete confined by carbon fiber cloth under uniaxial compression at different strain rates. Compos. Sci. Eng. 2023, 80–87. [Google Scholar] [CrossRef]
  18. Golham, M.A.; Al-Ahmed, A.H.A. Behavior of GFRP reinforced concrete slabs with openings strengthened by CFRP strips. Results Eng. 2023, 18, 101033. [Google Scholar] [CrossRef]
  19. ELWakkad, N.Y.; Heiza, K.M.; Mansour, W. Experimental study and finite element modelling of the torsional behavior of self-compacting reinforced concrete (SCRC) beams strengthened by GFRP. Case Stud. Constr. Mater. 2023, 18, e02123. [Google Scholar] [CrossRef]
  20. Wang, H.; Wang, B.; Yang, X. Effect of acid, alkaline, and chlorine salt on the flexural behavior of reinforced concrete beams strengthened by basalt fiber cloth. Build. Struct. 2015, 45, 81–85+55. [Google Scholar] [CrossRef]
  21. Sena-Cruz, J.; Michels, J.; Correia, L.L.G.; Harmanci, Y.; Silva, P.M.; Gallego, J.; Fernandes, P.M.G.; Czaderski, C.; França, P. Recent contributions from UMinho and Empa on durability issues of flexural strengthening of RC slab with EB CFRP laminates. In Proceedings of the Fourth Conference on Smart Monitoring, Assessment and Rehabilitation of Structures (SMAR 2017), Zurich, Switzerland, 13–15 September 2017. [Google Scholar]
  22. Green, M.F.; Bisby, L.A.; Beaudoin, Y.; Labossière, P. Effect of freeze-thaw cycles on the bond durability between fibre reinforced polymer plate reinforcement and concrete. Can. J. Civ. Eng. 2000, 27, 949–959. [Google Scholar] [CrossRef]
  23. Harmanci, Y.E.; Michels, J.; Chatzi, E. Behaviour of Prestressed CFRP Anchorages during and after Freeze-Thaw Cycle Exposure. Polymers 2018, 10, 565. [Google Scholar] [CrossRef] [PubMed]
  24. Li, J.; Xie, J.; Lu, Z. Durability of interface between CFRP and damaged RC members under chloride environment. Ind. Constr. 2019, 49, 124–129. [Google Scholar] [CrossRef]
  25. Li, W.; Wang, D.; Xu, W.; Ji, Y. Investigation on damage evolution mechanism of various FRP strengthened concrete subjected to chemical-freeze-thaw coupling erosion. PLoS ONE 2024, 19, e0303645. [Google Scholar] [CrossRef]
  26. GB/T 50082-2009; Standard for Test Methods of Long-Term Performance and Durability of Ordinary Concrete. China Standard Press: Beijing, China, 2009.
  27. GB/T 50081-2019; Standard for Test Methods of Concrete Physical and Mechanical Poperties. China Standard Press: Beijing, China, 2019.
  28. Bensted, J.; Rbrough, A.; Page, M.M. Chemical degradation of concrete. In Durability of Concrete and Cement Composites; CRC Press: Boca Raton, FL, USA, 2007; pp. 86–135. [Google Scholar]
  29. Kumar, R.; Dev, N. Effect of acids and freeze–thaw on the durability of modified rubberized concrete with optimum rubber crumb content. J. Appl. Polym. Sci. 2022, 139, 52191. [Google Scholar] [CrossRef]
  30. Wang, C.; Li, Z.; Ge, G.; Li, X.; Rong, Z.; Xue, S. Experimental study on salt corrosion resistance of polypropylene fiber concrete under the linked action of composite salt erosion-drying-wetting. Concrete 2023, 4, 29–35+39. [Google Scholar]
  31. He, J.; Ding, X.; Yang, W.; Yang, H.; Liu, L. Predicting the Effect of the Loading Rate on the Fracture Toughness of Hydraulic Asphalt Concrete Based on the Weibull Distribution. Materials 2024, 17, 803. [Google Scholar] [CrossRef]
  32. Sakin, R.; Ay, I. Statistical analysis of bending fatigue life data using Weibull distribution in glass-fiber reinforced polyester composites. Mater. Des. 2008, 29, 1170–1181. [Google Scholar] [CrossRef]
  33. Wang, M.; Bian, W.; Jiang, Z. Effects of diameter itself on Weibull modulus and fracture toughness of panbased carbon fiber. Glass Fiber Reinf. Plast./Compos. Mater. 2017, 287, 19–24. [Google Scholar]
  34. Huang, B.T.; Li, Q.H.; Xu, S.L. Fatigue deformation model of plain and fiber-reinforced concrete based on Weibull function. J. Struct. Eng. 2019, 145, 04018234. [Google Scholar] [CrossRef]
Figure 1. Fiber-reinforced composites and epoxy resin adhesives [25].
Coatings 15 00759 g001
Figure 2. FRP–reinforced specimen: (a) prismatic specimen; (b) cylindrical specimen.
Coatings 15 00759 g002
Figure 3. Testing equipment: (a) rapid freeze–thaw testing machine, (b) pH measurement system, (c) cylinder test block weight test, (d) prism test block weight test, and (e) dynamic elastic modulus tester.
Coatings 15 00759 g003
Figure 4. Mechanical test device, (a) pressure testing machine, (b) displacement gauge arrangement, (c) loading head arrangement, and (d) strain gauge arrangement.
Coatings 15 00759 g004
Figure 5. Surface condition of the test blocks before and after acid freezing.
Coatings 15 00759 g005aCoatings 15 00759 g005b
Figure 6. Microstructure of concrete subjected to 100 cycles of acid–freeze–thaw cyclic coupling. (a) Microstructure of the surface at 250 times; (b) microstructure of the surface at 2500 times; (c) internal microstructure at 250 times; (d) internal microstructure at 2500 times.
Coatings 15 00759 g006
Figure 7. Micromorphology of GFRP before and after acid–freeze–thaw cycles. (a) Surface without erosion at 250 times; (b) surface without erosion at 2500 times; (c) surface with 50 cycles of erosion at 250 times; (d) surface with 50 cycles of erosion at 250 times; (e) surface with 100 cycles of erosion at 250 times; (f) surface with 100 cycles of erosion at 250 times; (g) fiber with 100 cycles of erosion at 250 times; (h) fiber with 100 cycles of erosion at 2500 times.
Coatings 15 00759 g007
Figure 8. EDS of the surface and inner concrete after 100 cycles of acid–freeze–thaw coupling. (a) Energy spectrum of surface concrete; (b) internal energy spectrum of concrete.
Coatings 15 00759 g008
Figure 9. pH change in the solution before and after acid freezing.
Coatings 15 00759 g009
Figure 10. Both the FRP-reinforced and plain concrete specimens exhibited variations in mass loss rates as the number of acid–freezing cycles increased.
Coatings 15 00759 g010
Figure 11. The mass loss rates of both the FRP-reinforced and plain concrete specimens exhibit variations with increasing acid–freezing cycles.
Coatings 15 00759 g011
Figure 12. Relative dynamic elastic modulus of each group of specimens.
Coatings 15 00759 g012
Figure 13. Compressive strength and strength loss rate of reinforced FRP specimens under different freeze–thaw times: (a) compressive strength; (b) strength loss rate.
Coatings 15 00759 g013
Figure 14. Uniaxial compression stress–strain curve of the test block [25]: (a) CFRP-reinforced; (b) BFRP-reinforced; (c) AFRP-reinforced; (d) GFRP–reinforced; (e) plain concrete.
Coatings 15 00759 g014aCoatings 15 00759 g014b
Figure 15. Variation in the flexural bearing capacity and loss rate of the test block with acid–freezing times [25].
Coatings 15 00759 g015
Figure 16. Load–displacement curves of the test block: (a) CFRP-reinforced; (b) BFRP-reinforced; (c) AFRP-reinforced; (d) GFRP reinforced; (e) plain concrete.
Coatings 15 00759 g016
Figure 17. Weibull distribution. (a) Characteristic constant; (b) probability density function of test block strength; (c) cumulative distribution function of test block strength; (d) risk function; (e) reliability function.
Coatings 15 00759 g017
Figure 18. Curves and test data points of the expected failure load: (a) compares the curve of the expected failure load with the experimental data points; (b) compares the expected and experimental failure loads.
Coatings 15 00759 g018
Table 1. Concrete mix ratio (kg/m3).
MaterialsWaterCementMedium SandNature Aggregate (5–10 mm)Nature Aggregate (10–20 mm)
Content209.0387.0635.0350.7818.3
Table 2. Properties of fiber composites and epoxy resin adhesives.
MaterialsStrength/MPaElastic Modulus/GPaElongation at Break/%
CFRP35202671.78
BFRP30001201.60
GFRP2500802.3
AFRP2106117.81.75
Epoxy resin adhesive54.32.72.25
Table 3. Mass change of the test block (kg).
Freeze–Thaw CyclesMass Change of Test Block (kg)
CFRP-ReinforcedBFRP-ReinforcedAFRP-ReinforcedGFRP-ReinforcedPlain
03.673.613.73.633.58
503.683.623.7053.6353.59
1003.7053.6553.763.693.58
Table 4. Transverse fundamental frequency of the test block.
Freeze–Thaw CyclesTransverse Fundamental Frequency of Specimens (Hz)
CFRP-ReinforcedBFRP-ReinforcedAFRP-ReinforcedGFRP-ReinforcedPlain
017301820173218671888
5016691774168518111828
10016011659160717001754
Table 5. Weibull function constant.
SpecimenConstantAcid–Freezing 0 TimesAcid–Freezing 50 TimesAcid–Freezing 100 Times
Plainα33.239 23.158 16.570
β26.131 22.521 20.855
CFRP α25.582 18.410 12.913
β20.962 18.324 17.016
BFRPα23.389 14.589 10.847
β18.934 16.304 14.373
GFRPα18.499 12.293 8.981
β16.366 13.794 12.473
AFRPα12.679 7.237 5.131
β6.561 5.336 4.350
Disclaimer/Publisher’s Note: The statements, opinions and data contained in all publications are solely those of the individual author(s) and contributor(s) and not of MDPI and/or the editor(s). MDPI and/or the editor(s) disclaim responsibility for any injury to people or property resulting from any ideas, methods, instructions or products referred to in the content.

