Abstract
To improve the performance of elastic current-carrying friction pairs, this study employs a wire–plate friction pair and investigates the effect of surface texture orientation on current-carrying friction performance using a self-made micro-sliding current-carrying friction wear tester. The following conclusions were drawn: The angle between texture orientation and friction direction primarily influences the friction pair’s lifespan. At 0°, the lifespan is the longest, exceeding 500 cycles, followed by 90° with a lifespan of 394 cycles, and the shortest lifespan is observed with multi-directional textures. The primary wear mechanisms during the lifespan are furrowing, adhesive tearing, arc erosion, oxidation, and material transfer. At 0°, the width of mechanical damage is confined to the furrows, and the arc erosion is minimal. At 90°, the mechanical damage width and arc erosion are moderate, while at 45°, 135°, and multi-directional orientations, the mechanical wear width and arc erosion are more severe, with the multi-directional texture having the widest mechanical wear. The texture orientation has a significant impact on the performance and running process of current-carrying friction pairs. An appropriate texture orientation can suppress wear, thereby enhance performance and extending service life.
1. Introduction
Electrical connectors are fundamental components in electrical systems, widely used in aerospace, transportation, weaponry, and automation fields [1,2,3]. A large system (such as a fighter jet) often uses numerous electrical connectors, which are frequently interconnected. The reliability requirements of the system result in very high performance demands for any pair of connectors [4]. The electrical connector plug pair is a typical current-carrying friction pair, with copper-based materials commonly used for the pairing, and the surface performance is further enhanced by plating with precious metals [5]. Their mechanical lifespan is generally only tens to thousands of cycles [6]. With the advancement of technology, the performance requirements for connector pairs are increasing, and it is difficult to address this using conventional empirical approaches.
Previous studies have extensively investigated the factors influencing the performance of connector pairs, such as materials, rough contact surfaces, insertion and extraction conditions, temperature, and corrosive environments [7,8]. N. Tyrer et al. [9] studied the tribological properties of tin–copper composite coatings with different thicknesses. They found that thin coatings with only copper and no tin layer exhibited the lowest wear, while thicker copper layers significantly increased wear. Xin Lei et al. [10] found that rough contact surfaces lead to increased electrical and thermal resistance between the contact interfaces of electrical connectors, significantly affecting their performance. Meng Zhu et al. [11] designed accelerated simulation tests combining insertion–extraction, corrosion, and vibration, and found that the insertion–extraction process and corrosive environments accelerated surface damage to the microstructure of the contact points. The damage’s synergistic effect significantly accelerated the connectors’ sensitivity to intermittent failures. Y. Mo et al. [12], through simulation analysis and experimental studies, proposed a method to reduce the impact of temperature rise on electrical connectors and established a quantitative relationship between environmental temperature and terminal current-carrying capacity. Kehong Lyu et al. [13], by establishing a micropore corrosion model and conducting salt spray corrosion tests, analyzed the impact of corrosion stress on contact resistance.
Previous research on the factors influencing the performance of current-carrying friction pairs has largely focused on materials and their pairings, working conditions, and environmental atmospheres. These factors are emphasized in classical tribological theory as having a significant impact on friction pair performance [14]. Due to the short mechanical lifespan of connector pairs and the constraints on their running-in (such as the very thin precious metal plating layers [6], often used directly), the approach in classical friction theory that relies on running-in to achieve the optimal serviceability of the friction pair overlooks the impact of the initial surface condition on performance, which is a limitation. Research on the impact of the initial surface condition on the performance of current-carrying friction pairs has been relatively underexplored.
The initial geometric state of the friction pair surface can be characterized using parameters such as initial surface roughness and texture orientation [15]. The author’s previous research explored the impact of initial surface roughness on the performance of friction pairs [16], and this paper further investigates the influence of initial surface texture orientation on their performance.
2. Materials and Methods
The experiment employed a wire–plate elastic friction pair, where the wire specimen was commercially available brass wire (H62, Luoyang Copper Processing Group Co., Ltd., Luoyang, China) with a diameter of 0.4 mm. The wire specimen was bent to form a 60° angle, with the arc apex perpendicular to the plate specimen, and the contact position with the plate specimen was an arc with a radius of 2.5 mm. The plate specimens were commercially available copper plates (T2, Luoyang Copper Processing Group Co., Ltd., Luoyang, China). The physical properties of the test materials are shown in Table 1. Before testing, the plate specimen surfaces were polished using W3.5 sandpaper (1400#) with the same method to obtain textures at 0°, 45°, 90°, and 135°, while multi-directional textures were obtained using a grinding and polishing machine (as shown in Figure 1). The surface roughness of the specimens was controlled at Ra 0.8 μm.

Table 1.
The physical properties of the test materials.
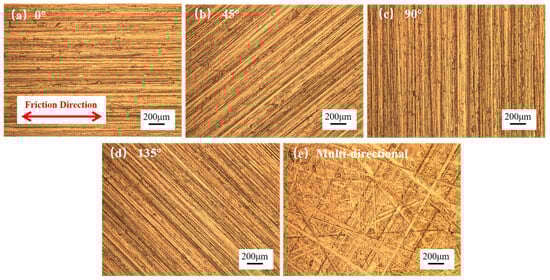
Figure 1.
Metallographic image of plate specimen: (a) 0°, (b) 45°, (c) 90°, (d) 135° and (e) multi-directional.
The experiments were conducted on a self-developed current-carrying friction and wear testing machine (Figure 2). The power supply was a DC constant current source, with the friction pair undergoing reciprocating sliding motion at a unidirectional stroke of 5 mm, frequency of 1 Hz, current of 3 A, duration of 500 s (500 reciprocating sliding cycles), and loads of 0.025 N, 0.05 N, and 0.075 N, respectively. After the friction and wear tests, the worn surfaces were observed using a JSM-5610LV scanning electron microscope (JEOL Ltd., Tokyo, Japan). EDS spectroscopy was used to detect elemental changes on the worn surfaces. The three-dimensional morphology of the worn surfaces was observed using an Rtec MFT-5000L three-dimensional profilometer (Rtec, San Jose, CA, USA), which has a vertical resolution of 0.1 nm and a lateral optical resolution of 0.05 μm.
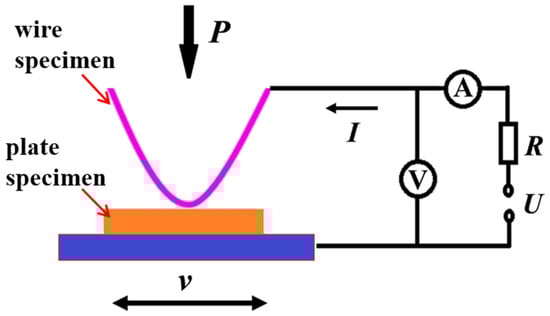
Figure 2.
Experimental schematic diagram [16].
3. Results
3.1. The Impact of Surface Texture Orientation on the Dynamic Performance of Current-Carrying Friction Pairs
Figure 3 shows the dynamic contact resistance curves for different texture orientations under a load of 0.025 N. From the Figure 3, it can be observed that in a single test, the contact resistance initially remains stable with minor fluctuations at low resistance values, and then suddenly shifts into a state of intense fluctuations. Statistically, during the small fluctuations at lower values, the mean fluctuates within the range of 0.015–0.069 Ω, while the standard deviation fluctuates within the range of 0.006–0.021 Ω. The number of cycles at lower values varies depending on the angle between the texture direction and the friction direction. When the angle between the texture direction and the friction direction is 0°, the longest duration is observed, lasting more than 500 cycles (with good performance at the end of the test); at 90°, the duration is 394 cycles; whereas in the case of multi-directional textures, it lasts only 0.6 cycles. Based on the requirements for the contact pair’s contact resistance, it can be concluded that when the system enters the stage of intense fluctuations, the conductivity of the pair has failed. Therefore, the number of cycles during which small fluctuations occur corresponds to the lifespan of the friction pair with good electrical conductivity.
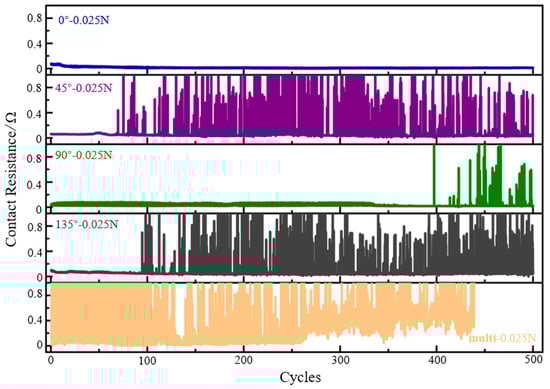
Figure 3.
Dynamic contact resistance.
Figure 4 shows the dynamic friction coefficient curves for different texture orientations under a load of 0.025 N. From the Figure 4, it can be seen that in a single test, the friction coefficient initially fluctuates around a lower value and then rapidly fluctuates. Statistically, in the lower value range, the mean fluctuates between 0.154 and 0.509, while the standard deviation lies within the range of 0.042 to 0.167. The higher values are often greater than 2. Under different angles between the texture direction and friction direction, the number of cycles at lower values varies. When the angle between the texture direction and friction direction is 0°, it lasts the longest, exceeding 500 cycles; at 90°, it lasts 346 cycles; under multi-directional textures, it lasts the shortest, with only 0.2 cycles. Compared to Figure 3, the dynamic trend of contact resistance mirrors that of the friction coefficient, but the transition into the intense fluctuation phase is slightly delayed.
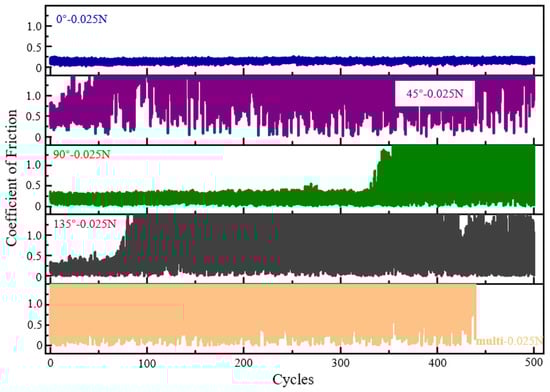
Figure 4.
Dynamic friction coefficient.
Figure 5 shows the curve of the number of cycles with small fluctuations in contact resistance at lower values under different load conditions. From the Figure 5, it can be seen that as the angle between the surface texture and friction direction increases, the number of cycles first decreases, then increases, and then decreases again. At the same time, as the load increases, the number of cycles gradually shortens. When the angle between the surface texture and friction direction is 0° and the load is 0.025 N, the number of cycles reaches its maximum, exceeding 500 cycles.
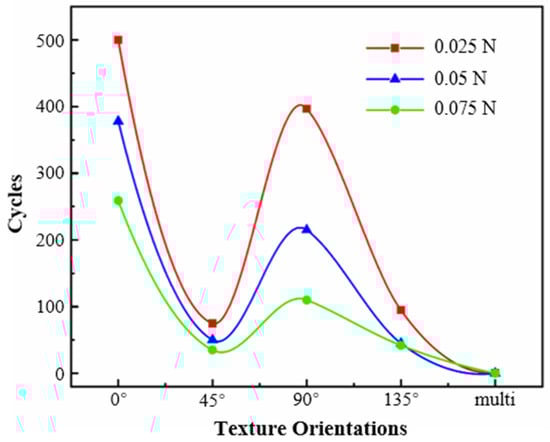
Figure 5.
Trend chart of the number of cycles of contact resistance.
3.2. The Impact of Surface Texture Orientation on Current-Carrying Friction Behavior
Figure 6a,b,d,f,h show the 3D morphology maps of the worn surfaces and the corresponding profile curves at specific positions after 500 test cycles under 0.025 N for different texture orientations. Figure 6c,e,g show the 3D morphology maps of the worn surfaces and the corresponding profile curves before the intense fluctuations of the contact resistance under 0.025 N for different texture orientations. Comparing Figure 6b,d,f,h, it can be observed that after the friction coefficient and contact resistance experience intense fluctuations, the worn surface becomes uneven. Multiple grooves appear on the same width section, and the grooves are uneven. There are even hemispherical protrusions (Figure 6f,h, arc erosion) and features higher than the original surface (Figure 6h, severe material transfer). It can be concluded that after the failure of contact resistance, the primary types of damage to the worn surface include furrowing, adhesive tearing, and molten splashing. Comparing Figure 6a,c,e,g, it can be observed that when the friction coefficient and contact resistance fluctuate slightly at lower values, the grooves on the worn surface are uniform, and the primary damage type is furrowing. Comparing Figure 6b,c,d,e, it can be seen that after the intense fluctuations, the wear marks noticeably widen and deepen, indicating a sharp increase in damage.
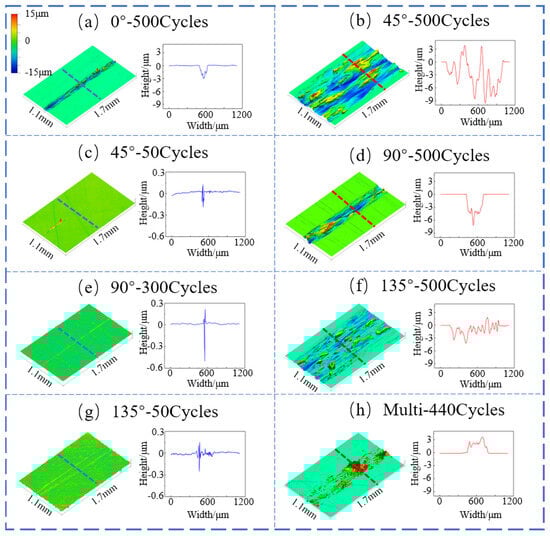
Figure 6.
Three-dimensional morphology of the plate specimen wear surface and profile curves at corresponding positions: (a) 0°-500 Cycles, (b) 45°-500 Cycles, (c) 45°-50 Cycles, (d) 90°-500 Cycles, (e) 90°-300 Cycles, (f) 135°-500 Cycles, (g) 135°-50 Cycles, and (h) Multi-500 Cycles.
Figure 7 shows the depth wear rate curve (the ratio of average wear depth to the number of cycles) under the experimental conditions of Figure 6. From the Figure 7, it can be observed that when the contact resistance fluctuates slightly at lower values, the wear rate first increases, then decreases, and then increases again as the texture orientation angle changes. The wear rate is lowest at 90°, at only 0.0017 μm/cycle, followed by 0° with 0.0023 μm/cycle. After entering intense fluctuations, the wear rate is significantly higher than during the small fluctuations, except for the case of multi-directional textures.
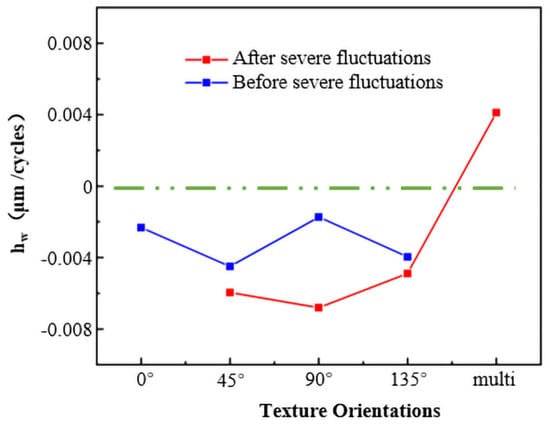
Figure 7.
Depth wear rate.
Figure 8 shows the SEM images of the worn surface under the same experimental conditions as in Figure 6. From Figure 8a,b,d,f,h, it can be observed that after 500 cycles, the wear mechanism with a texture angle of 0° to the friction direction is primarily furrowing [14,17,18], with a small amount of adhesive and tearing marks also visible [19,20,21]. When the texture orientations are 45°, 90°, and 135°, in addition to mechanical wear features such as adhesion, tearing, and furrowing, there are also arc erosion marks such as melting and splashing. Notably, the arc erosion marks at 45° and 135° are significantly stronger than those at 90°. The worn surface with multi-directional textures is almost entirely covered by arc erosion marks, such as molten splashing. Comparing Figure 8a,c,e,g, it can be seen that before the intense fluctuations of the contact resistance, the primary damage form on the worn surface is furrowing. Additionally, the wear marks at 45° and 135° are noticeably wider than those at 90°, and small amounts of adhesive wear marks are also observed under the 45° and 135° conditions.
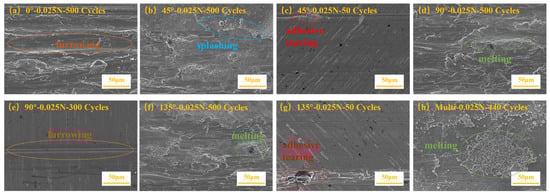
Figure 8.
Microscopic surface of the plate specimen wear surface: (a) 0°-500 Cycles, (b) 45°-500 Cycles, (c) 45°-50 Cycles, (d) 90°-500 Cycles, (e) 90°-300 Cycles, (f) 135°-500 Cycles, (g) 135°-50 Cycles, and (h) Multi-500 Cycles.
Figure 9 shows the SEM image of the worn surface after failure with a texture orientation of 135°. From the Figure 9, it can be seen that the worn area is mainly divided into mechanical wear and arc erosion regions. The mechanical wear region is primarily characterized by furrowing. The arc erosion region mainly consists of small splashes and large molten splashes. Small splashes are mainly distributed in the furrowing area, and noticeable repressing marks are visible. Large molten splashes gather in clusters and cover the traces of furrowing.
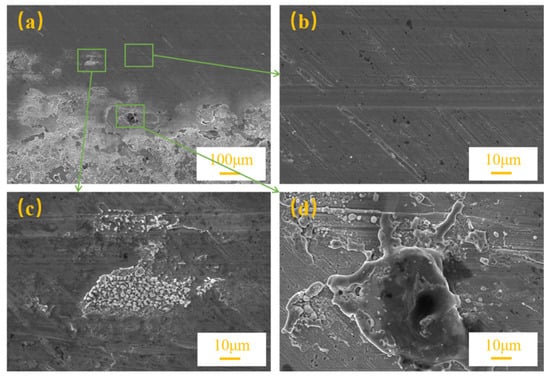
Figure 9.
SEM image of the worn surface with a texture orientation of 135°, (b–d) is the green trend of figure (a), which tends to enlarge.
Figure 10 shows the EDS spectral characteristics of the worn surface of the plate sample under different wear mechanism. Figure 10a shows the EDS spectrum of the worn surface of the plate sample under a texture orientation of 0°. Cu, Zn, and O elements were detected on the worn surface, with Zn having a mass fraction of 14.2%. Figure 10b shows the EDS spectrum of the worn surface of the plate sample under multi-directional texture conditions. Cu, Zn, and O elements were detected in three typical regions, with the region dominated by mechanical wear (Region II) having a Zn mass fraction of 24%. The region dominated by arc erosion (Region III) has a Zn mass fraction of 69.4%. This indicates that the material transfer in the arc erosion-dominated region is much more severe than in the mechanical wear-dominated region [22,23]. A small amount of oxygen was present in all four regions, suggesting slight oxidation [24].
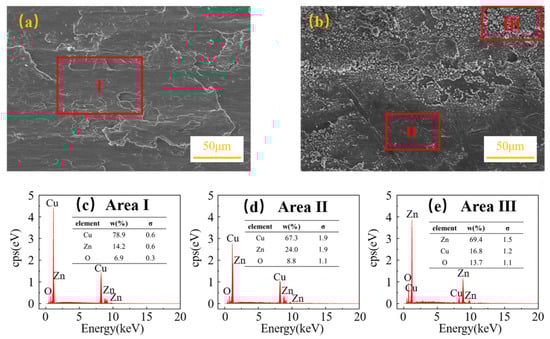
Figure 10.
EDS spectra of the plate specimen under different wear mechanisms: (a) mechanical wear area (b) arc erosion area. (c) Area I; (d) Area II; (e) Area III.
4. Discussion
For connector pairs with a mechanical lifespan of only tens to thousands of cycles, especially those with difficult surface running-in, it is necessary to consider the impact of the initial surface geometric information on their current-carrying friction performance. The initial surface geometric information of the friction pair includes surface waviness, surface roughness, texture orientation, etc. [15] Among them, texture orientation is the most fundamental information of the surface, including design requirements, processing methods, etc.
According to molecular–mechanical friction theory [14], the effect of texture orientation on the friction pair’s motion mainly influences its motion path. In the ideal case, when the texture orientation is 0°, the wire sample moves within the groove, and the relative motion at the contact point is smooth (Figure 11a). When the texture orientation is 90°, the contact point undergoes a process of “uphill” and “downhill” due to texture height variation (Figure 11b). When the texture orientation is other than 0° or 90°, the movement of the wire sample includes two processes: the “uphill” and “downhill” process due to texture height variation, and the process where the contact point deviates from the ideal position due to texture orientation, which later returns to the ideal position due to elastic forces (Figure 11c,d).
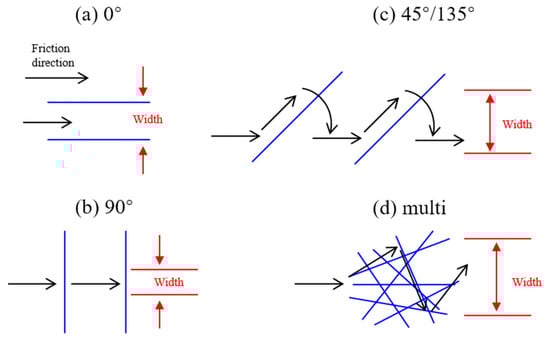
Figure 11.
Mechanism of the effect of texture orientation on the contact point: (a) 0°, (b) 90°, (c) 45°/135°, and (d) multi.
In the process where the wire sample moves within the groove and “climbs,” deviating from the ideal base point due to changes in texture orientation, the friction pair has a good conductive foundation, with the main damage forms being furrowing and plastic deformation. When the climbing reaches the top and transitions to downhill, the wire sample may experience bouncing, contact failure, and arc erosion. When the contact point deviates from the ideal position due to texture orientation and then returns to the ideal position, the wire sample may experience bouncing, contact failure, and arc erosion. Bouncing caused by both height orientation and texture orientation occurs simultaneously, leading to a superimposed effect. Therefore, at 0°, the width of mechanical damage is confined within the groove, and arc erosion is minimal. At 90°, the width of mechanical damage and arc erosion is second, while at 45°, 135°, and multi-directional textures, mechanical wear and arc erosion are more severe, with the widest mechanical wear occurring in multi-directional textures.
The test results show that the lifetime (number of cycles with good performance) and depth wear rate of the pair are consistent with the trend of the ideal situation described above. At the same time, the damage to the plate sample material is also influenced by material transfer. The results in Figure 10 show that material transfer caused by arc erosion far exceeds that caused by mechanical damage, even resulting in an increase in material mass (Figure 6h). From an engineering perspective, the texture angle has an important impact on the performance and operation of current-carrying friction pairs. A reasonable texture angle can suppress damage, improving performance and lifespan. This result is confirmed by the design requirements for the motion track in the design of the conductive slip ring for the brush wire [25].
5. Conclusions
This paper uses a wire–plate friction pair and employs a micro-sliding current-carrying friction wear test machine to study the impact of texture orientation on the current-carrying friction wear performance. Under the experimental conditions, the following conclusions were drawn:
(1) The impact of texture and friction direction angle on the friction pair’s performance is primarily reflected in the friction pair’s lifespan. The longest lifespan is observed at 0°, exceeding 500 cycles, followed by 90° with a lifespan of 394 cycles, and the shortest lifespan occurs with multi-directional textures. The friction motion is most stable at 0°, followed by 90°, and is least stable in the case of multi-directional textures.
(2) The wear mechanisms during the lifespan are primarily furrowing, adhesive tearing, and arc erosion, with oxidation and material transfer also present. At 0°, the width of mechanical damage is confined within the groove, and arc erosion is minimal. At 90°, mechanical damage and arc erosion are second, while at 45°, 135°, and multi-directional textures, mechanical wear and arc erosion are more severe, with the widest mechanical wear occurring in multi-directional textures.
(3) From an engineering perspective, the results of this study reveal the influence of surface texture orientation on the current-carrying friction and wear performance of elastic pairs, providing valuable reference for the design of current-carrying friction pairs, particularly those represented by electrical connectors. The texture angle has a significant impact on the performance and operational processes of current-carrying friction pairs, and an appropriate texture angle can suppress damage and improve performance and service life.
Author Contributions
Conceptualization, Z.Y. and W.L.; methodology, Z.Y.; validation, W.L., K.H. and X.T.; formal analysis, Z.Y. and X.W.; investigation, M.Z.; resources, Z.Y.; data curation, W.L.; writing—original draft preparation, Z.Y. and W.L.; writing—review and editing, W.L.; visualization, Z.Y. and W.L.; supervision, X.W. and Y.Z.; project administration, Z.Y.; funding acquisition, Z.Y. and Y.Z. All authors have read and agreed to the published version of the manuscript.
Funding
This work was supported by the National Natural Science Foundation of China (U1804252) and the Key Scientific Research Project of Henan Province (22A430021).
Institutional Review Board Statement
Not applicable.
Informed Consent Statement
Not applicable.
Data Availability Statement
The results will be provided upon request.
Conflicts of Interest
Author Xiaowei Wang was employed by the company Jonhon Optronic Technology Co., Ltd. The remaining authors declare that the research was conducted in the absence of any commercial or financial relationships that could be construed as a potential conflict of interest.
References
- Ji, R.; Gao, J.; Flowers, G.T.; Xie, G.; Cheng, Z.; Jin, Q. The Effect of Electrical Connector Degradation on High-Frequency Signal Transmission. IEEE Trans. Compon. Packag. Manuf. Technol. 2017, 7, 1163–1172. [Google Scholar] [CrossRef]
- Song, J.; Abhay, S.; Roman, P. The state of health of electrical connectors. Machines 2024, 12, 474. [Google Scholar] [CrossRef]
- Wang, L.; Tan, Y.; Zhao, Y.G.; Luo, Y.; He, J.X. Failure Analysis of Rectangular Electrical Connectors for Gold-plated Jack Surface Discoloring. In Proceedings of the 2019 International Conference on Quality, Reliability, Risk, Maintenance, and Safety Engineering (QR2MSE), Zhangjiajie, China, 6–9 August 2019; pp. 729–735. [Google Scholar]
- Andrusca, M.; Adam, M.; Burlica, R.; Munteanu, A.; Dragomir, A. Considerations regarding the influence of contact resistance on the contacts of low voltage electrical equipment. In Proceedings of the 2016 International Conference and Exposition on Electrical and Power Engineering (EPE), Iasi, Romania, 20–22 October 2016; pp. 123–128. [Google Scholar]
- Ren, W.B.; Wang, P.; Song, J.; Zhai, G.F. Effects of current load on wear and fretting corrosion of gold-plated electrical contacts. Tribol. Int. 2014, 70, 75–82. [Google Scholar] [CrossRef]
- GB/T 41036–2021; General Specification for Super High-Low Temperature Circular Electrical Connector for Space Applications. The Standardization Administration of the People’s Republic of China: Beijing, China, 2021.
- Liu, X.; Cai, Z.; Liu, S.; Wu, S.; Zhu, M. Influence of Wear Test Parameters on the Electrical Contact Performance of Brass Alloy/Copper Contactors Under Fretting Wear. J. Mater. Eng. Perform. 2019, 28, 817–827. [Google Scholar] [CrossRef]
- Wen, B.; Pan, J.; Qian, P.; Zhang, L.; Chen, W.; Zhang, J. Research on the Influence of the Closing Amount of Electrical Connector Contacts on Fretting Wear under a Vibration Environment. Electronics 2023, 12, 2469. [Google Scholar] [CrossRef]
- Tyrer, N.; Yang, F.; Barber, G.; Pang, B.; Wang, B. Tribological Behavior of Electrical Connector Coatings Under Recip-rocating Motion. J. Tribol. 2022, 144, 091401. [Google Scholar] [CrossRef]
- Lei, X.; Yu, Z.; Gao, Y.; Zhou, Y.; Xu, K.; Chen, Y.; Zhu, F. Investigation on Electrical and Thermal Performance of Electrical Connectors Under Rough Surface Contact. IEEE Trans. Compon. Packag. Manuf. Technol. 2024, 15, 281–287. [Google Scholar] [CrossRef]
- Zhu, M.; Jia, R.; Yang, Y. Research on the Mechanism of Intermittent Failure of Electrical Connectors in Marine Environments. In Proceedings of the 18th Annual Conference of China Electrotechnical Society, Nanchang, China, 11 March 2024; pp. 623–633. [Google Scholar]
- Mo, Y.; Zhang, T.; Wang, G.; Peng, C.; Xv, Z. Simulation Study on Influence of Environmental Temperature on Current-Carrying Capacity of Automotive Electrical Connector. SAE Int. J. Passeng. Cars Mech. Syst. 2021, 14, 215–221. [Google Scholar] [CrossRef]
- Lyu, K.; Wu, L.; Wu, X.; Qiu, J.; Liu, G. Contact Degradation Mechanism and Test Study of Electrical Connector under Micropore Corrosion. In Proceedings of the 2021 Global Reliability and Prognostics and Health Management (PHM), Nanjing, China, 15–17 October 2021; pp. 1–5. [Google Scholar]
- Wen, S.; Huang, P. Principles of Tribology, 5th ed.; Tsinghua University Press: Beijing, China, 2018. [Google Scholar]
- GB/T 33523.1–2020; Geometrical Product Specifications (GPS)—Surface Texture: Areal—Part 1: Indication of Surface Texture. State Administration for Market Regulation. Standardization Administration of the People’s Republic of China: Beijing, China, 2020.
- Yang, Z.; Li, W.; Zheng, X.; Zhao, M.; Zhang, Y. The Influence of Initial Surface Roughness on the Current-Carrying Friction Process of Elastic Pairs. Materials 2025, 18, 370. [Google Scholar] [CrossRef] [PubMed]
- Zhang, Y.Z.; Yang, Z.H.; Song, K.X.; Pang, X.J.; Bao, S.G. Triboelectric behaviors of materials under high speeds and large currents. Friction 2013, 1, 259–270. [Google Scholar] [CrossRef]
- Hao, W.; Xia, Y.Q.; Yi, Z. Curent carrying tribological properties of multi arc ion plated titanium nitride doped silver coating. Mater. Res. Express 2024, 11, 056401. [Google Scholar] [CrossRef]
- Zhao, L.J.; Li, Z.B.; Shi, K.Y.; He, J.J.; Li, H.J. Electrical properties of nanocrystalline CuCr25 contact material. IEEE Transactions on Components. Packaged. Manuf. Technol. 2012, 3, 625–632. [Google Scholar]
- Yang, Z.; Song, Y.; Jiao, J.; Li, W.; Shangguan, B.; Zhang, Y. Optimization of current-carrying friction and wear properties of copper-carbon composite materials based on damage. Tribol. Int. 2023, 191, 109074. [Google Scholar] [CrossRef]
- Zhang, Y.Z.; Song, K.X.; Du, S.M. Current-Carrying Tribology; Science Press: Beijing, China, 2016. [Google Scholar]
- Ren, W.B.; Wang, T.Y.; Zhang, X.; Zhao, M.; We, J.M. Research on the rolling and sliding behavior of making contact and as-sociated welding mechanism for low-current switching devices. Packag. Manuf. Technol. 2018, 9, 18–27. [Google Scholar]
- He, W.; Feng, Y.; Wu, S.; Wu, K.; Ye, J.; Wang, W. Numerical Simulation on The Effect of Current Intensity on Electrical Contact Performance of Electrical Connectors Subject to Micro-Slip Wear. Wear 2024, 542–543, 205270. [Google Scholar] [CrossRef]
- Liu, X.L.; Guan, X.; Zhang, T.M.; Zhong, Y.; Zhang, W.L.; Zhang, S.; Yang, W.B. A comparative investigation into the material matching performance of different friction pairs under current-carrying friction. Tribol. Int. 2023, 185, 108543. [Google Scholar] [CrossRef]
- JB/T 12252–2015; Brush for Wind Driven Generator. Ministry of Industry and Information Technology/National Energy Administration: Beijing, China, 2015.
Disclaimer/Publisher’s Note: The statements, opinions and data contained in all publications are solely those of the individual author(s) and contributor(s) and not of MDPI and/or the editor(s). MDPI and/or the editor(s) disclaim responsibility for any injury to people or property resulting from any ideas, methods, instructions or products referred to in the content. |
© 2025 by the authors. Licensee MDPI, Basel, Switzerland. This article is an open access article distributed under the terms and conditions of the Creative Commons Attribution (CC BY) license (https://creativecommons.org/licenses/by/4.0/).