Article

Influence of Alkaline Activator Properties on Corrosion Mechanisms and Durability of Steel Reinforcement in Geopolymer Binders

by
Mihail Chira
1,
Adrian-Victor Lăzărescu
1,*,
Andreea Hegyi
1,*,
Horatiu Vermesan
2,
Alexandra Csapai
1,
Bradut Alexandru Ionescu
1,
Tudor Panfil Toader
1 and
Carmen Florean
1
1
NIRD URBAN-INCERC Cluj-Napoca Branch, 117 Calea Florești, 400524 Cluj-Napoca, Romania
2
Faculty of Materials and Environmental Engineering, Technical University of Cluj-Napoca, 103–105 Muncii Boulevard, 400641 Cluj-Napoca, Romania
*
Authors to whom correspondence should be addressed.
Coatings 2025, 15(6), 734; https://doi.org/10.3390/coatings15060734
Submission received: 13 May 2025 / Revised: 10 June 2025 / Accepted: 13 June 2025 / Published: 19 June 2025

Abstract

:
The durability of steel reinforcement in geopolymer composites is significantly influenced by the chemical characteristics of the alkaline medium in which they are embedded. This research offers detailed insights into the corrosion kinetics and mechanisms of geopolymers derived from various fly ash and alkaline activator formulations, considering their inherent microstructural and chemical heterogeneity. This study investigates the effect of the molarity of sodium hydroxide (NaOH) solution and the ratio of sodium silicate to sodium hydroxide (Na2SiO3/NaOH) on the corrosion behavior of steel reinforcement in geopolymer matrix under the action of chloride ions. Corrosion of steel reinforcement embedded in geopolymer binder prepared by alkaline activation of fly ash with alkaline activator prepared with different Na2SiO3/NaOH ratios (1:1, 1:2, 2:1) and different molar concentrations of NaOH solution (6 M, 8 M and 10 M) was analyzed in terms of process kinetics using Open Circuit Potential (OCP) and Linear Polarization (LP) and mechanism by Electrochemical Impedance Spectroscopy (EIS). The study demonstrates that a Na2SiO3:NaOH ratio of 1:2 and an 8 M NaOH solution yield the most favorable combination of physical and mechanical properties and corrosion resistance, confirmed by the highest apparent density, lowest water absorption, and significantly reduced corrosion current densities (as low as 0.72 μA/cm2), as well as highlighting porosity and pH as key factors influencing steel protection in geopolymer matrices.

Graphical Abstract

1. Introduction

The continuous expansion of the built environment, driven by the escalating demands of human activity across industry, production, services, and transportation, has established cement, the primary component of cementitious composites and concrete, as the second most utilized resource globally, after water [1]. The production of cement is associated with a considerable environmental impact, primarily due to its substantial carbon dioxide (CO2) emissions. The emission ratio, which generally ranges from 0.6 to 0.8 tons of CO2 per ton of cement produced [2,3,4], contributes to the cement industry’s annual global CO2 emissions, which amount to 4%–7% of the total. Projections indicate that this contribution could escalate to 10%–15% within the next decade. [5,6,7,8]. Concrete constructions and cementitious composites are globally recognized for their exceptional durability, workability, architectural versatility, and well-established technological understanding. However, the cement industry also exerts a substantial environmental impact, particularly concerning resource consumption and energy expenditure. As a result, recent research efforts have placed increasing emphasis on the implementation of Circular Economy principles and the identification of more sustainable alternatives. A prominent solution in this pursuit involves the substitution of conventional concrete, wherever feasible, with composites derived from alkali-activated fly ash. These materials, which are broadly categorized as geopolymers, are particularly compelling given recent assessments suggesting their potential to reduce CO2 emissions by a significant margin, ranging from 26% to 45% and potentially up to 70%–80% [9,10,11,12,13,14,15,16,17,18,19,20]. Geopolymers derived from alkali-activated fly ash constitute a distinct class of materials synthesized through polymerization reactions. These reactions occur between specific oxides inherent to fly ash, including SiO2, Al2O3, CaO, Na2O, and Fe2O3, and an alkaline activator solution typically comprising hydroxides and alkali (Na/K) silicates.
While the current state of research has demonstrated the feasibility of producing geopolymers with commendable compressive strength, favorable fire resistance, and resilience in corrosive environments, their primary limitation lies in their inherently low tensile strength and susceptibility to cracking. One effective strategy to mitigate these disadvantages, analogous to practices in Portland cement-based concrete, is reinforcement. The implementation of reinforcement can be achieved through conventional methods, including the incorporation of long reinforcing bars, reinforcement mesh, or dispersed short steel fibers. Moreover, extant research suggests that the use of recycled steel derived from end-of-life automotive tires or the implementation of hybrid reinforcement systems combining steel fibers with polymeric fibers such as polypropylene (PP), polyethylene (PE), and polyvinyl alcohol (PVA) are viable approaches that result in enhanced geopolymer performance [20].
From a chemical compositional perspective, geopolymers are complex mixtures encompassing crystalline, semi-crystalline, and amorphous aluminosilicate phases. The specific characteristics of geopolymers are largely dependent on the nature of the raw materials and the preparation methodology. Despite the extensive research activity documented in the prevailing literature concerning the mechanisms of geopolymerization and the performance of these binder types, the predominant focus has been on microstructural characterization and its direct influence on physical and mechanical properties [10,11,21]. Research focusing on the behavior of steel reinforcements embedded in geopolymers is notably underrepresented in the specialized literature. This trend is evidenced by a recent database analysis (Figure 1), where studies addressing “geopolymer corrosion” constitute a significantly smaller proportion of the total body of work compared to broader searches for “geopolymer”, “rebar corrosion” or “concrete corrosion.”
Passivation of steel reinforcement in concrete is typically facilitated by the alkaline environment; however, this protective effect can be compromised by carbonation or chloride penetration [21,22]. In geopolymer matrices, the Cl/(OH) ratio, influenced by porosity and hydroxyl group concentration, is crucial for corrosion initiation [23,24,25,26]. While some studies suggest that geopolymers offer superior chloride impermeability and corrosion protection, others report similar or even lower protection compared to conventional concrete [24,25,27,28,29,30,31,32,33,34,35,36]. The incorporation of calcium oxide (CaO) into geopolymer binders has been demonstrated to reduce chloride permeability and stabilize pH by forming N-A-S-H and C-A-S-H type bonds, thereby enhancing reinforcement stability [37,38,39,40,41,42,43]. The characteristics of fly ash, including oxide composition and fineness, have been demonstrated to significantly impact the geopolymer’s microstructure and electrochemical performance [37,38,39,40,41,42,43]. A body of research suggests a correlation between increased compressive strength in Class F fly ash-based geopolymers and reduced chloride penetration. Furthermore, higher alkaline activator dosages have been shown to enhance corrosion resistance [44]. Geopolymers also maintain an alkaline pH for steel stability due to a pore electrolyte that is rich in carbonate/bicarbonate ions. This prevents galvanic cell formation and avoids the chloride accumulation that is observed at the binder-reinforcement inter-face in Portland cement [45,46,47,48,49,50]. Extensive research conducted under conditions of wet-dry cycling further corroborates the enhanced corrosion protection properties of geopolymers, attributable to their reduced porosity and augmented alkalinity [48]. The geopolymerization products and microstructure, influenced by fly ash characteristics and alkaline activator molarity, contribute to material densification and improved chloride resistance [51,52,53,54,55,56,57,58].
Tennakoon et al. [59] reported that the time required for the initiation of chloride-induced corrosion of embedded reinforcements in geopolymer matrices based on alkaline-activated fly ash can be up to 10 times longer compared to the time required for the initiation of corrosion of reinforcement in cementitious composites [59,60,61].
Experimental investigations utilizing low-calcium class F fly ash sourced from Australian thermal power plants for geopolymer synthesis have yielded significant findings regarding corrosion behavior. These studies reported corrosion current densities, a direct indicator of corrosion rate, of less than 1 µA/cm2 (with specific instances as low as 0.166 µA/cm2) in the absence of chloride ions. In the presence of chloride ions, corrosion current densities ranged from 0.5 to 3.5 µA/cm2. Furthermore, the formation of specific corrosion products, namely hematite [Fe2O3], akageneite [FeO(OH)] and lepidocrocite [c-FeO(OH)] [1,62]. Further research using geopolymer binders prepared by alkaline activation of class C fly ash demonstrated high resistance to chloride penetration, supporting the hypothesis that such binders afford a high degree of corrosion protection to the embedded reinforcement [26,63].
Long-term studies have shown that mortars prepared with 70% alkali-activated fly ash and 30% Portland cement offer good corrosion protection to embedded reinforcement over a one-year exposure period to 95% relative humidity, both in the absence or presence of chlorine ions introduced into the binder matrix at preparation (0.4%). Notably, this performance is comparable to that exhibited by conventional Portland cement-based mortars [21,43,45,64].
Electrochemical tests conducted using an electrochemical cell with a saturated calomel electrode (SCE) showed that, following only 12 h of binder curing, the corrosion potential of steel in OPC mortars increased, whereas in geopolymers it began to decrease irrespective of their strength class. The polarization resistance of reinforcement embedded in cementitious composites increased immediately, whereas for the reinforcements within geopolymers, this increase occurred with a delay, after 4–7 d. Subsequent to this 4–7 day period, the corrosion potential values of the reinforcement in geopolymers shifted to less negative values, becoming comparable to those in cement-based mortars, while polarization resistance values remained relatively stable. This behavior is attributed to a decrease in the alkalinity of geopolymers after the initial week of curing, resulting from the formation of non-alkaline products during the polymerization reaction [65], thus rendering the environment less aggressive towards the embedded reinforcement.
Therefore, geopolymers exhibit a tendency for delayed passivation of embedded reinforcement, with observed corrosion potentials stabilizing around −1500 mV/SCE. The initially low polarization resistance observed during the first week following reinforcement embedment in the geopolymer binder can be attributed to the exceptionally high initial alkalinity of the binder, which delays the formation of a passive layer on the steel surface. Galvanized reinforcement shows significantly better behavior, as zinc exhibits high reactivity in strong alkaline environments and the calcium oxide content of the binder favors the formation of passive zinc complexes.
Other influencing factors identified include those that impact the microstructure and overall properties of geopolymers, specifically the characteristics of raw materials and processing parameters [28,66,67,68,69,70,71,72,73,74]. While some studies aimed to mitigate chloride-induced corrosion by using high-calcium fly ash in the geopolymer binder, findings have conversely indicated that low-calcium fly ash yields better performance [28,75]. Furthermore, Criado et al. emphasize the critical role of strong adhesion at the reinforcement–geopolymer interface in achieving effective corrosion protection [76]. Therefore, thorough characterization of the physical and mechanical performance of the geopolymer embedding the reinforcement becomes essential for quickly assessing its behavior under chloride-induced corrosion.
A comprehensive review of the extant literature clearly indicates that the phenomenon of corrosion, pertaining to both iron and other metallic materials generally, is primarily characterized through experimental electrochemical methods. A universal requirement of these electrochemical approaches is the deployment of a testing station comprising a potentiostat and an electrochemical cell. In such setups, the material under investigation functions as the working electrode, while the reference and counter electrodes may vary depending on the specific experimental context. However, results are consistently reported in relation to their specific characteristics.
Among the frequently employed techniques for analyzing corrosion mechanisms, Electrochemical Impedance Spectroscopy (EIS) is widely utilized. The kinetics of the corrosion phenomenon are typically assessed through potentiodynamic polarization curves, which are then interpreted via the Tafel extrapolation method. The open-circuit potential (OCP) method is the most common approach for thermodynamic characterization. In addition to these electrochemical methodologies, materials are frequently subjected to specific spectroscopic and optical analyses [77,78,79,80].
Open-circuit polarization tests reported corrosion potential values of 87 mV, 133 mV, and 206 mV, depending on specimen curing duration (7 and 28 d, respectively) [81,82]. According to the criteria indicated by ASTM C876-09 [83] (Table 1), which provides a methodology for quantifying corrosion risk based on recorded corrosion potential, these values correspond, at most, to a low risk of corrosion. An alternative method for quantifying the corrosion stage of the reinforcement involves the correlation between corrosion current, corrosion rate and corrosion stage of steel reinforcement in concrete, according to ASTM C876-09 (Table 2).
Electrochemical studies conducted on specimens subjected to chloride ions by immersion in a 3.5% NaCl solution [50] revealed notable trends. Following just two days of exposure, the average corrosion potential (Ecor) values of reinforcements embedded in cement-based mortar rapidly declined from approximately 0.1 VSCE to values more negative than 0.276 VSCE, a threshold that, according to ASTM C876-09, indicates a high probability of active corrosion. A similar trend was observed after approximately 6 days of exposure for reinforcements embedded in geopolymer binders prepared with 12 M or 14 M NaOH solution, and after just 1 day for the geopolymer prepared with 16 M NaOH solution.
For prolonged exposure durations within a chloride-rich environment, the corrosion potential of reinforcement embedded in the studied geopolymer matrices ranged between −0.60 and −0.65 VSCE, with increasingly negative values corresponding to higher NaOH molarities. Reinforcement embedded in denser geopolymer matrices, particularly those produced with lower molarity NaOH solutions (12 M, 14 M), exhibits improved corrosion resistance, attributed to the hindered penetration of chloride ions into the steel–binder interface. Additionally, compared to reinforcements embedded in cementitious composites, those in denser geopolymer matrices benefit from enhanced protection, despite the higher critical chloride threshold observed in geopolymers (1%–1.7% vs. binder compared to 0.5% for cementitious matrices). This improved performance is attributed to the presence of silicate ions within the specific pore solution of geopolymer binders, which exert an inhibitory effect on the corrosion process.
In terms of corrosion morphology, for reinforcements embedded in geopolymer matrices, corrosion occurs in a diffuse manner across the metal surface, whereas in cement-based composites, corrosion is localized and exhibits deeper pitting [21]. This observation may have significant implications for the failure mode of the reinforcement and, consequently, for the overall durability of the reinforced structural element.
Therefore, considering the persistent controversies in the specialized literature—mainly due to the heterogeneity of precursors used in geopolymer synthesis, but not exclusively—the objective of this study is to evaluate the resistance to chloride-induced corrosion of steel reinforcement embedded in geopolymer binder paste. The novelty of this work stems from its comprehensive approach to this scholarly debate, addressing the escalating scientific interest in the field, as evidenced by the growing number of publications analyzed in Figure 1. Specifically, the study’s scientific contribution is multifaceted, focusing on how the particular characteristics of raw materials and processing parameters directly influence the geopolymer’s microstructural features and its physical and mechanical performance. The inherent characteristics of fly ash (FA), which vary significantly between thermal power plants based on the type of coal burned, its origin, as well as the plant’s specific technological features and the diverse nature and properties of alkaline activators (AA), including NaOH solution molarity and the Na2SiO3/NaOH ratio, induce substantial heterogeneity in geopolymer properties across microstructural, physical, and chemical levels. Given that pH and porosity, among other geopolymer indicators, are determinant factors in the kinetics and mechanism of corrosion, this research uniquely employs a deliberate selection of FA, specifically characterized by its production thermal power plant, alongside a comparative analysis of varying NaOH molarities (6 M, 8 M, and 10 M) and the NaOH/Na2SiO3 ratio in AA preparation, thereby directly influencing the observed corrosion indicators and contributing to a clearer understanding of this complex phenomenon.

2. Materials and Methods

To analyze the influence of the alkaline activator on the corrosion of reinforcement embedded in a geopolymer binder matrix—quantified as the resistance of steel reinforcement under chloride ion attack and in accordance with the scientific literature—the following research hypotheses were established:
Hypothesis 1.
The molarity of the NaOH solution and the Na2SiO3/NaOH ratio used for preparing the alkaline activator in the process of fly ash alkali activation influence the physical and mechanical properties of the geopolymer binder.
Direct, quantitative, measurable indicators of physical and mechanical performance include hardened-state density, compressive strength, flexural tensile strength, and capillary water absorption. These are correlated with optical microscopy analysis of the geopolymer matrix and are considered indirect, qualitative indicators of the porosity of the geopolymer binder matrix in which the reinforcement is embedded.
Hypothesis 2.
The porosity of the geopolymer matrix is a factor influencing the degree of corrosion protection it offers to the embedded reinforcement.
Direct, quantitative, measurable indicators of the corrosion process include corrosion potential, corrosion current, and anodic and cathodic slopes of the Tafel curve, which characterize the kinetics of the corrosion process, as well as the equivalent electrical circuit derived from electrochemical impedance spectroscopy (EIS) diagrams, which characterizes the corrosion mechanism.
Qualitative indicators of the corrosion process include the shape of open-circuit potential polarization curves, which describe the surface phenomenon of the reinforcement, specifically the formation or breakdown of the passive layer on the steel surface in the presence of chloride ions.
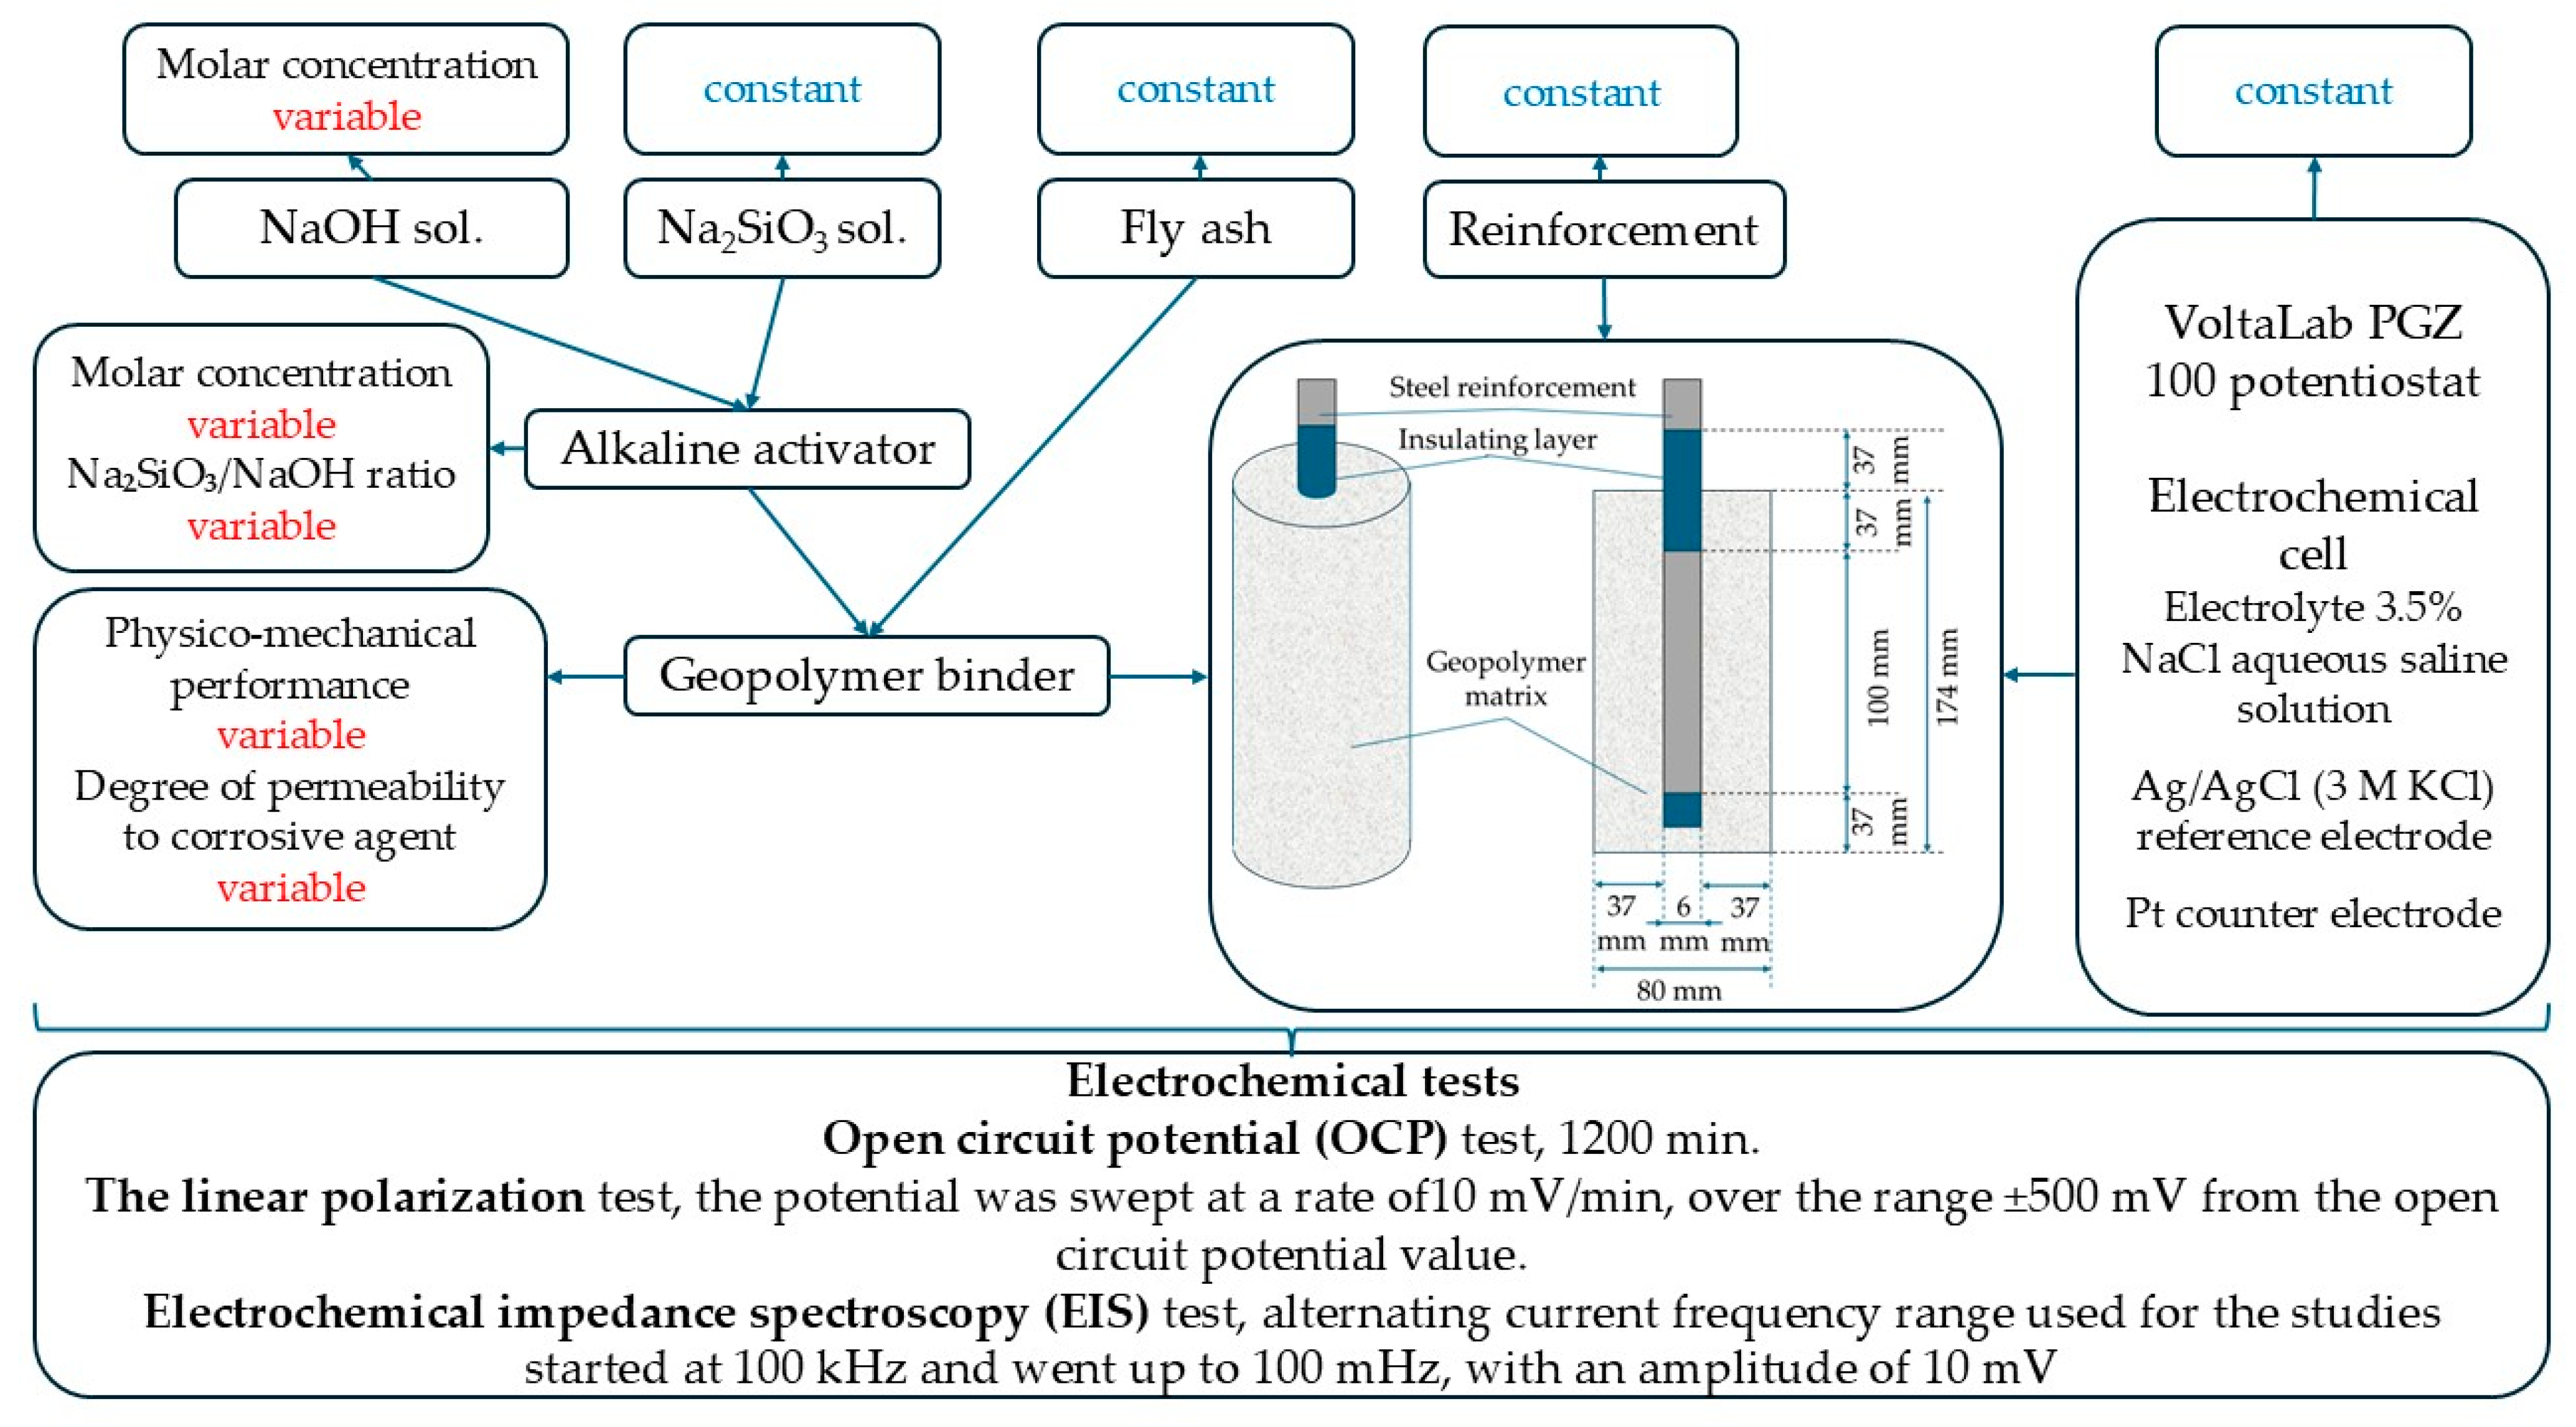
This hypothesis was established in accordance with reports from the scientific literature. In this regard, Monticelli et al. [46] report an inverse correlation between the molarity of the NaOH solution used in preparing the alkaline activator and the resultant compressive strength, manifested through a reduction in the Na2O/SiO2 ratio. Simultaneously, capillary water absorption is used as an indirect indicator of the material’s porosity (a capillary water absorption coefficient of approximately 0.43 kg/m2·min0.5 and a water absorption rate of about 7.2 kg/m2 are reported for all geopolymer compositions, regardless of the NaOH solution molarity, which ranged between 12M and 16 M). The experimental research methodology to validate/invalidate the research hypotheses is schematized in Figure 2.

2.1. Materials

To analyze the influence of the characteristics of the alkaline activator utilized in the preparation of the geopolymer binder on the behavior of steel reinforcement under chloride ion attack, specimens were made using the following materials:
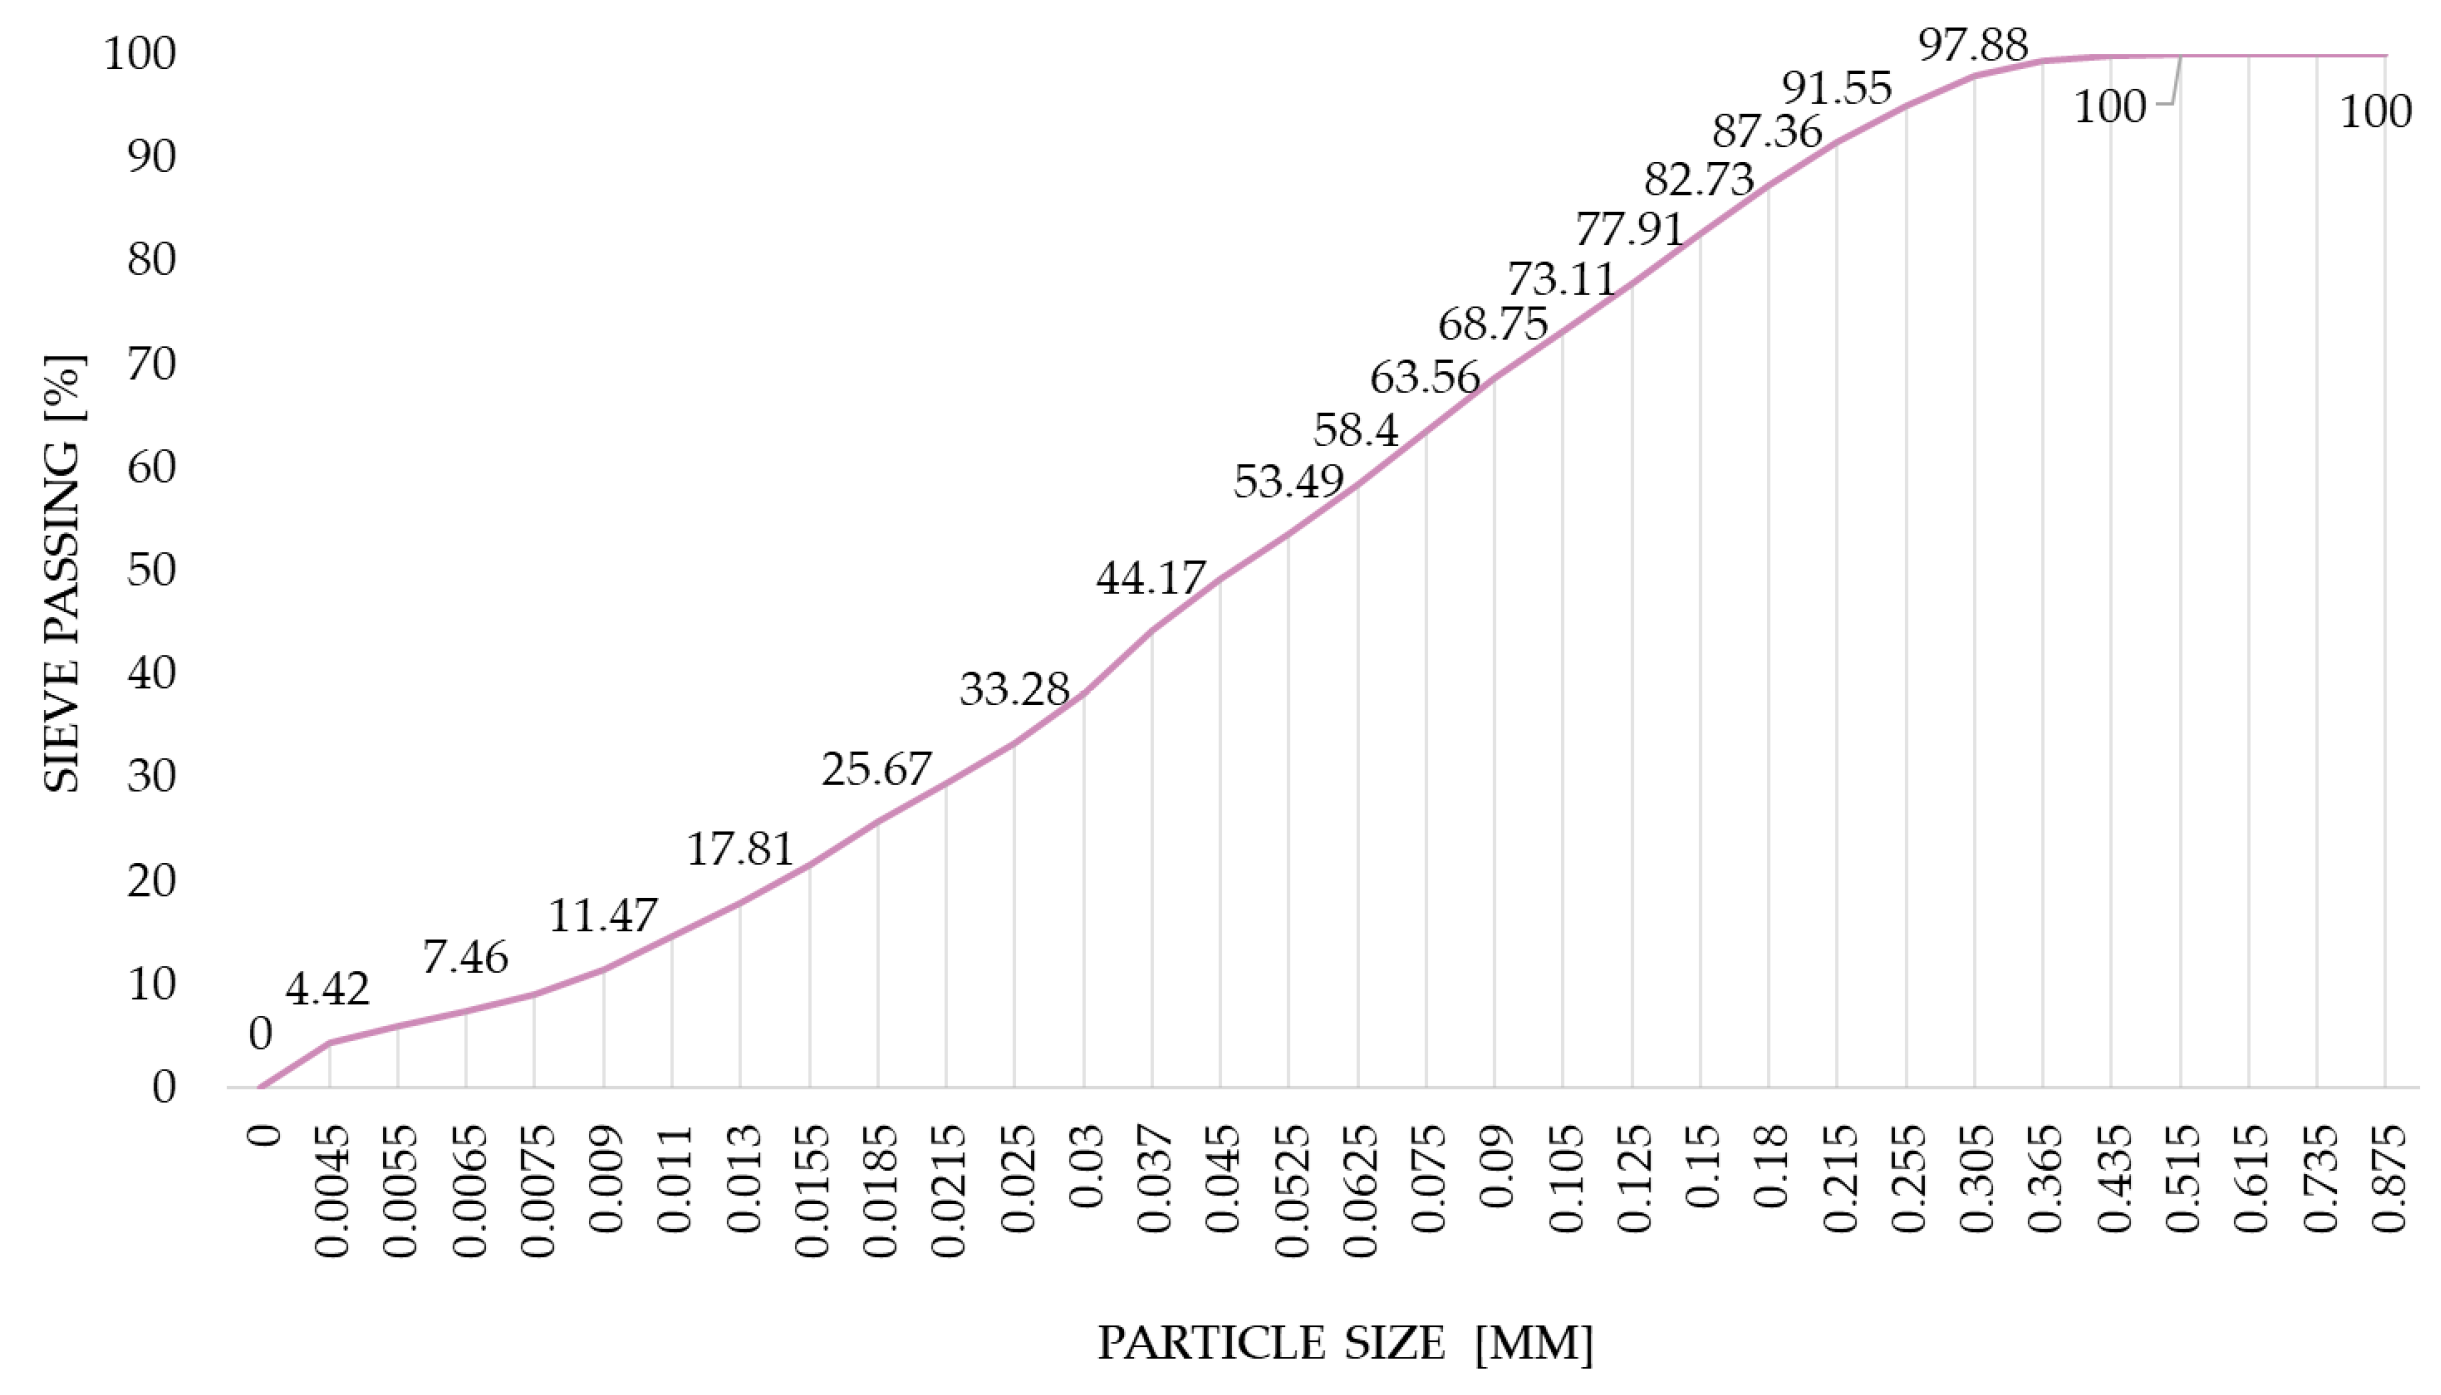
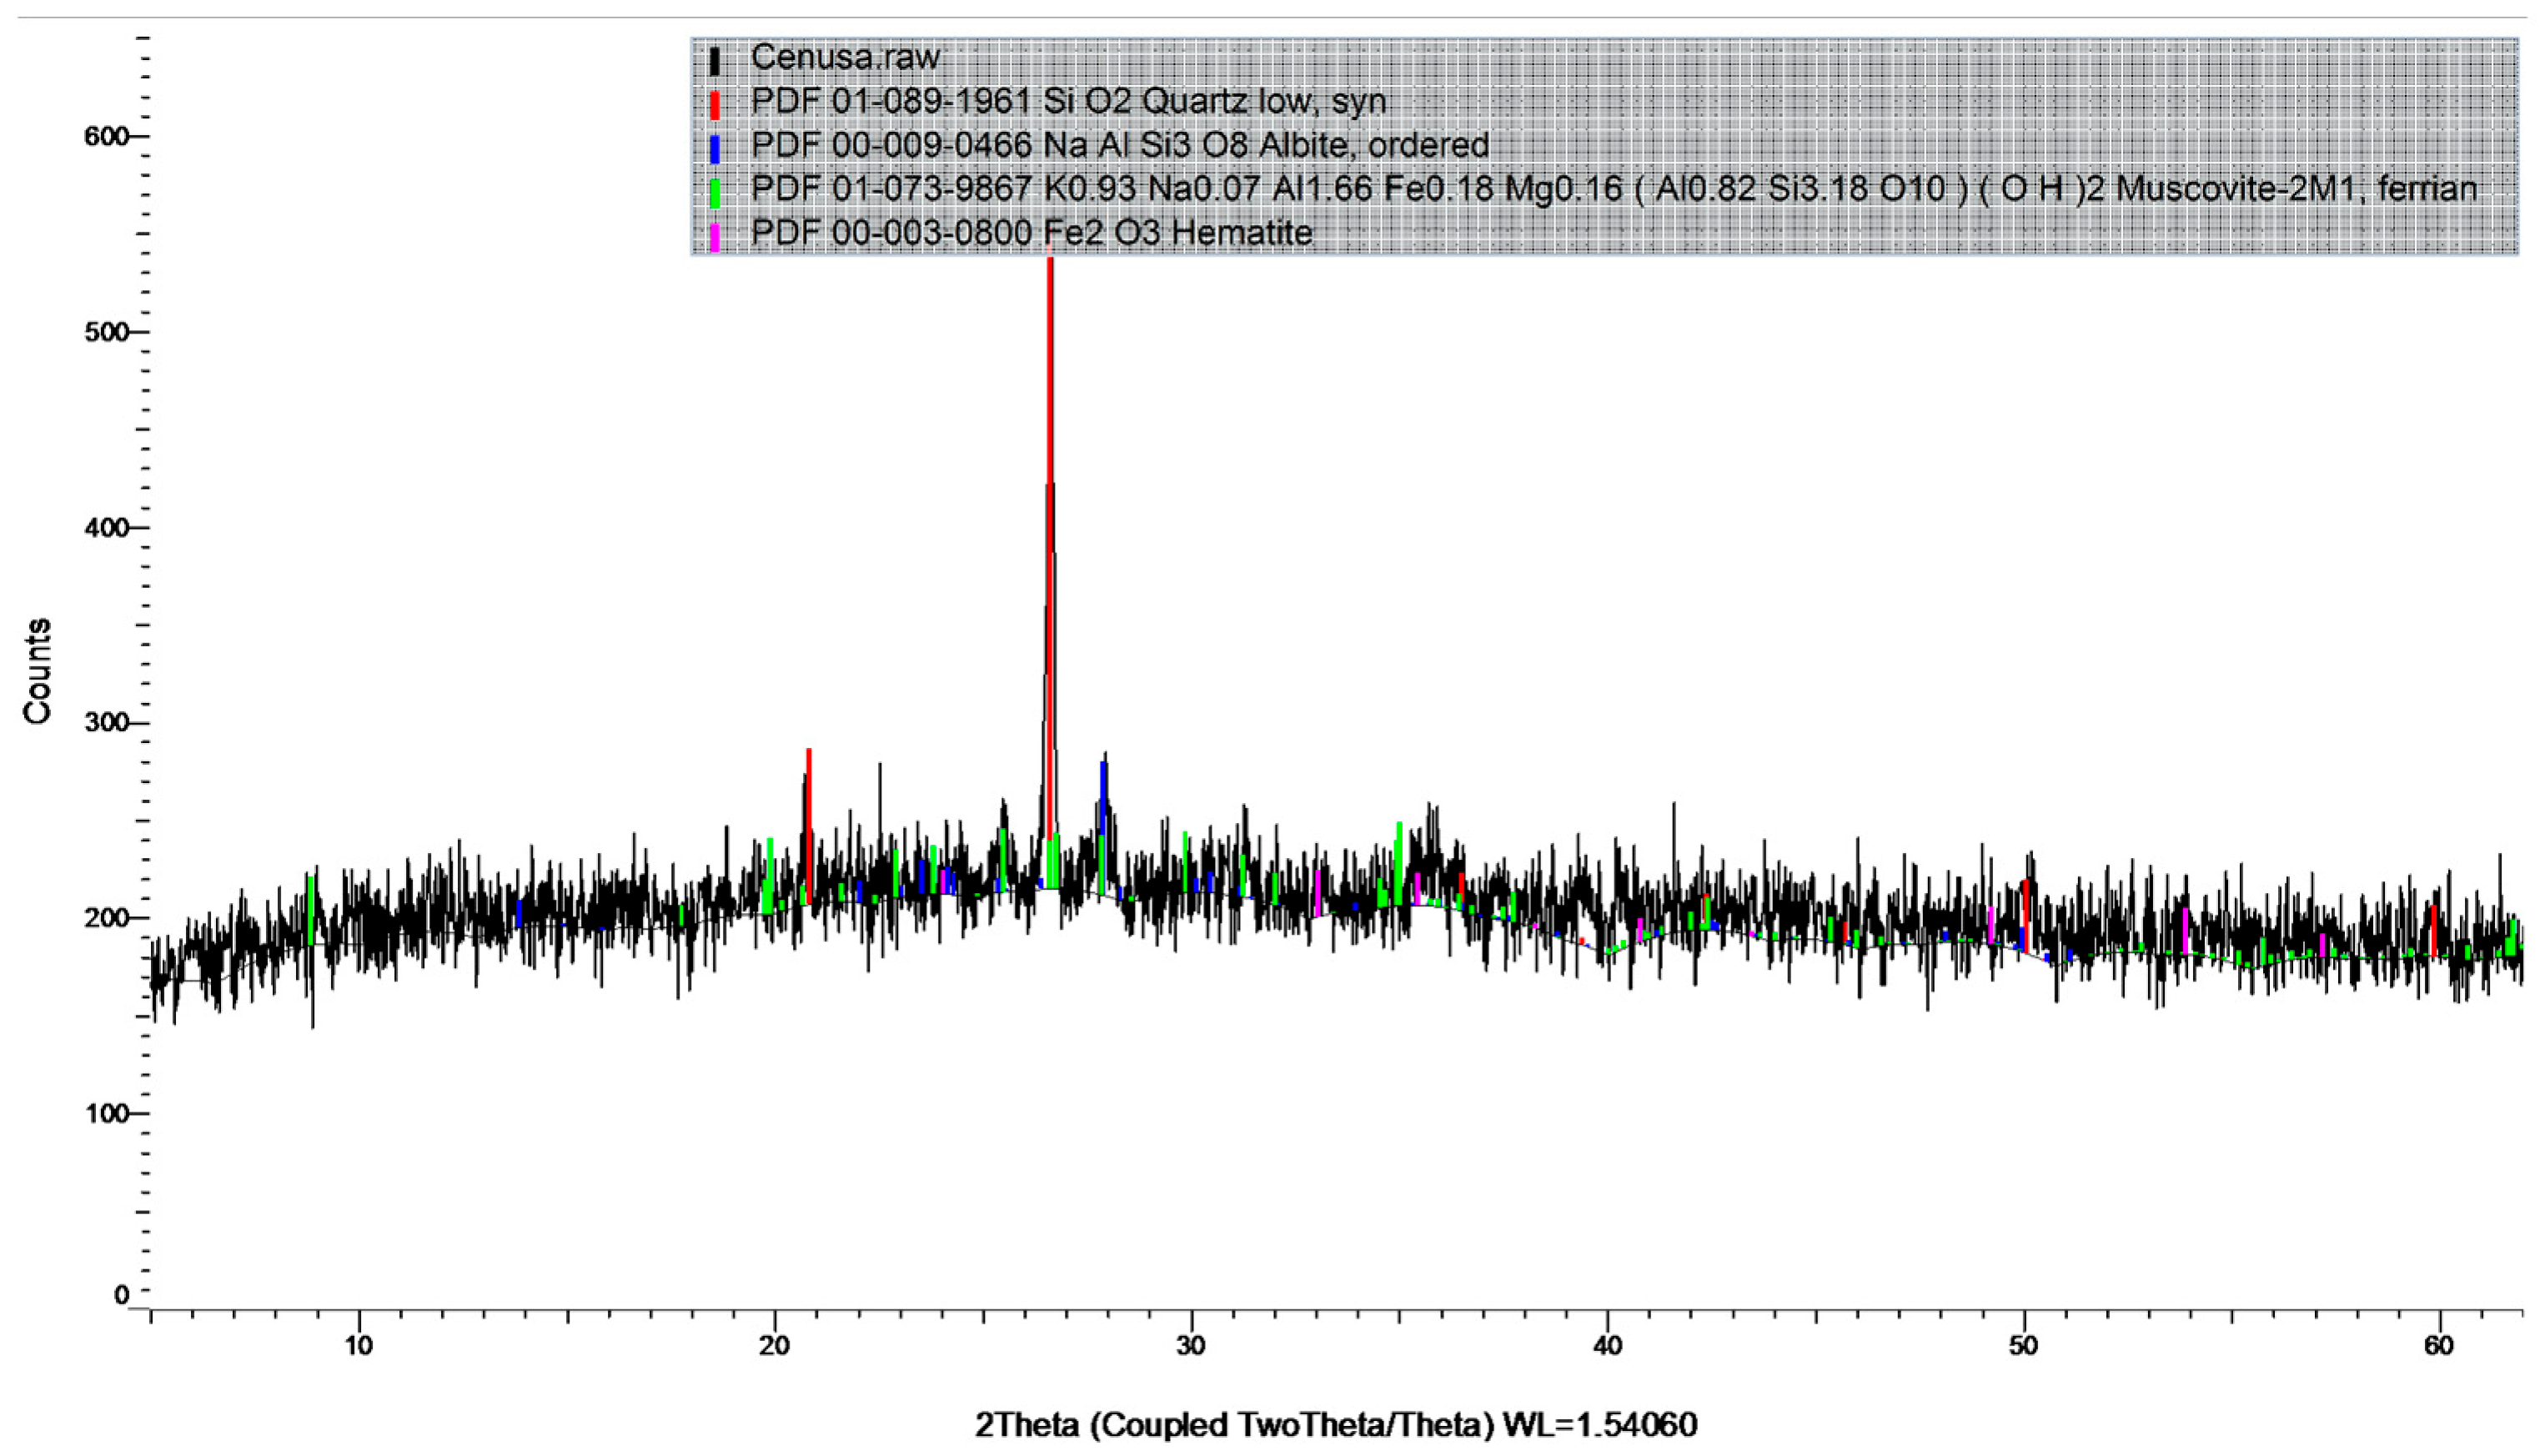
Fly ash sourced from the electrostatic precipitators of the Rovinari thermal power plant, Romania, was characterized in terms of its oxide and mineralogical composition as well as its particle size distribution, as presented in Table 3 and Figure 3 and Figure 4. The physical and chemical characterization of the fly ash was performed using X-ray fluorescence (XRF) analysis, employing a HELOS RODOS/L, R5 instrument (Sympatec GmbH, Clausthal-Zellerfeld, Germany) (Table 3). The mineralogical composition of the fly ash was analyzed by X-ray diffraction (XRD) using a Bruker D8 ADVANCE X-ray diffractometer (Bruker, Karlsruhe, Germany). Scans were recorded over a range of 5–60° (2θ) with a step size of 0.02° and a scan speed of 10 s per step (Figure 5).
As seen in Figure 5, The diffuse reflection peak for quartz was predominantly at 26.59° (2θ), with additional smaller peaks at 20.82 and 50.14° 2θ. Albite was detected at 13.88, 23.53 and 27.90° (2θ). Muscovite M1 was identified at various angles: 19.91, 22.93, 25.50, 26.78, 27.90, 29.84 and 35.06° (2θ). Hematite was identified by X-ray diffraction at angles of 24.02, 33.09, 35.47, 40.82, 49.28, 53.96 and 57.29° (2θ). The peak with the highest intensity at 2θmax, 26.59° (2θ), was assigned to quartz.
The alkaline activator solution used in the synthesis of the geopolymer binder was prepared from two components: sodium silicate (Na2SiO3) solution, acquired from (Polichim, Baia Mare Romania), used without any further modification, and sodium hydroxide. The molarity of the NaOH solution and the Na2SiO3/NaOH mass ratio were identified as primary variables for the alkaline activator’s formulation. These parameters were systematically varied to investigate their influence on both the geopolymer matrix characteristics and the corrosion behavior of embedded steel reinforcement. The specific compositions for each alkaline activator solution are outlined in Table 4. This serves as a reference in coding the geopolymer binder formulations for traceability and reproducibility.
Plain steel bars (type OB37) with a 6 mm diameter from PROMET STEEL JSC, Debelt, Bulgaria, commonly used for concrete reinforcement, were utilized in this study. This type of reinforcement possesses the following mechanical properties: yield strength of 255 N/mm2, tensile strength of 360 N/mm2, and minimum elongation at break of 25%, with a linear mass of 0.222 kg/m.
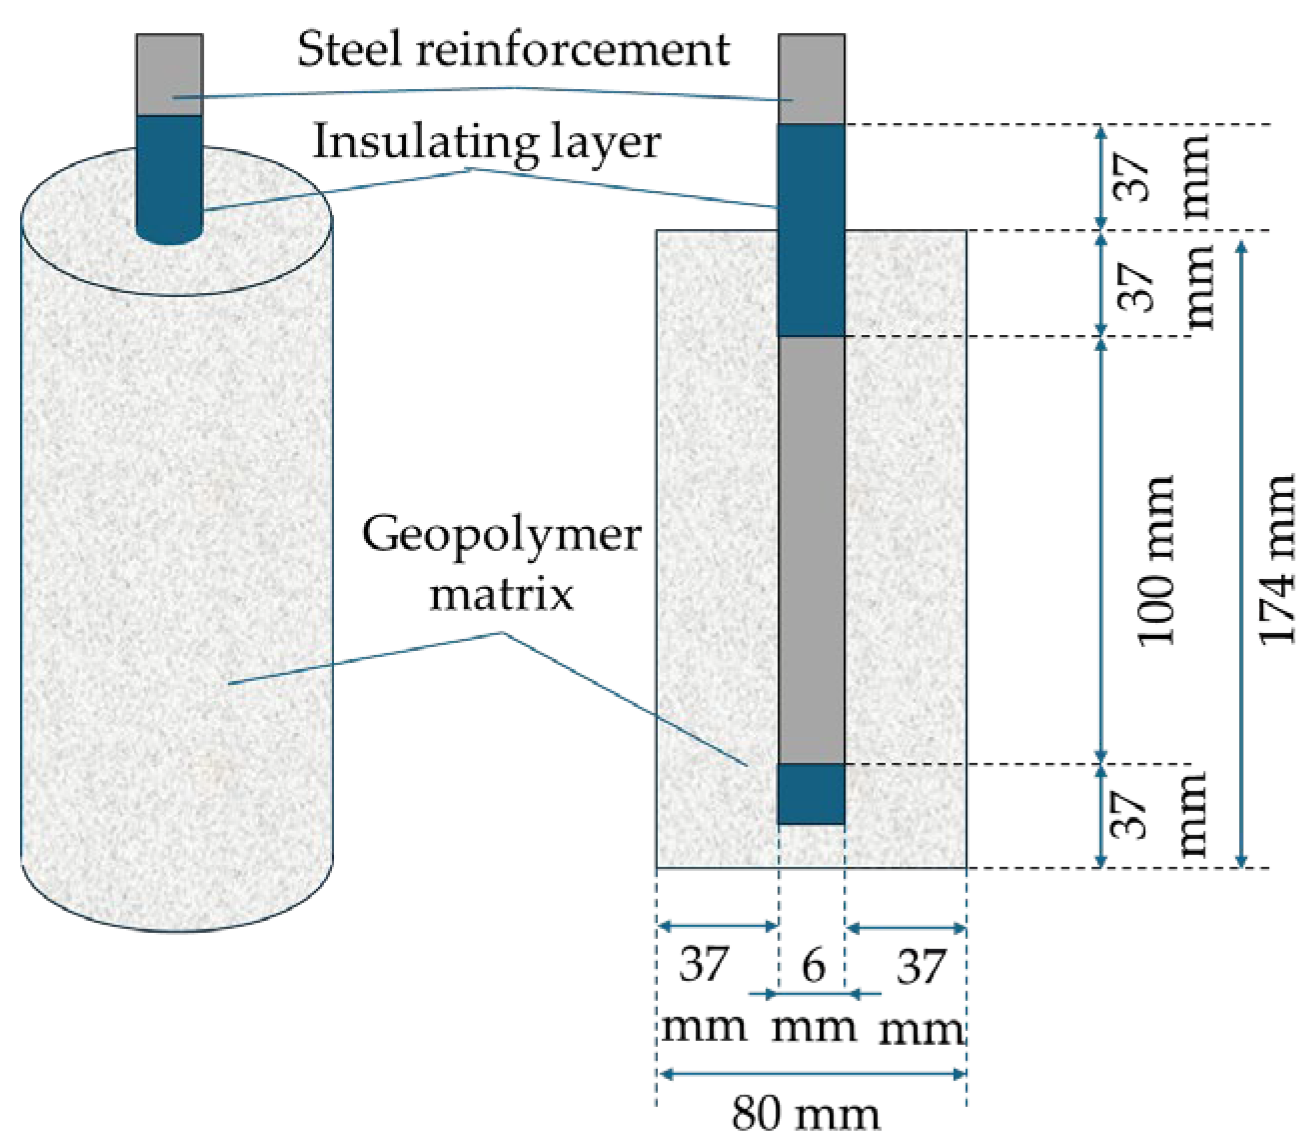
Prior to their incorporation, the steel specimens were prepared by cleaning and removing any pre-existing rust, sealing the lower end, and isolating the upper section that crosses the cementitious surface using an epoxy resin (Figure 6). These isolation procedures were carried out to ensure a uniform and controlled exposed metal surface area for all samples—specifically, 2512 mm2, corresponding to a cylinder with a height of 100 mm and a base diameter of 8 mm. The isolation was also essential to prevent differential aeration corrosion in the region where the reinforcement exits the geopolymer material, which would otherwise be in contact with the saline solution used as an electrolyte in the electrochemical cell.

2.2. Production of the Alkali-Activated Geopolymer Binder and Sampling

The raw materials were dosed using a KERN FKB 36K0.1 balance (KERN & SOHN GmbH, Balingen, Germany), with an accuracy of 0.1 g. Prior to use, all materials were stored for at least 24 h under laboratory conditions (temperature: 23 ± 1 °C and relative humidity: 65 ± 5%). The mass ratio of fly ash to the alkaline activator was maintained constant. Following precise proportioning, the raw materials were thoroughly mixed using an ELE paddle mixer (ELE International Ltd., Milton Keynes, UK).
For each type of geopolymer binder composition, prismatic specimens (40 × 40 × 160 mm3) were cast in metallic molds for the determination of the physical and mechanical properties. Simultaneously, cylindrical molds with an inner diameter of 80 mm and a height of 172 mm were used to cast the geopolymer binder. Into these molds, an OB37 steel reinforcement bar (Ø6 mm), prepared as detailed in Section 2.1 and depicted in Figure 6, was vertically centered and embedded.
Following casting, the specimens were heat cured for 24 h at 70 ± 2 °C in a thermostatic oven (MEMMERT ULE 500 chamber, MEMMERT GmbH + Co. KG, Schwabach, Germany) to complete the geopolymerization reactions. After demoulding, the specimens were stored under laboratory conditions for an additional 6 days (temperature: 23 ± 1 °C; relative humidity: 65 ± 5%).

2.3. Physico-Mechanical Characterization of Geopolymer Binder

To assess the physical and mechanical properties of the geopolymer binders and to highlight the influence of the alkaline activator, standardized testing methods were applied on prismatic specimens. Drawing from test standards applicable to mortars, the following properties were determined using the prismatic samples: apparent density in hardened state (according to EN 1015–10:2002 + A1:2007), compressive strength and flexural strength (according to EN 1015–11:2020) and capillary water absorption (according to EN 1015–18:2003). Although all fundamental principles and procedures specified in the standards were strictly followed, one notable deviation from standard mortar testing protocols was applied: geopolymer specimens were tested at 7 d after casting, instead of the 28-day testing period required for cement-based mortars. This modification is justified by literature findings [43,67], which indicate that alkali-activated fly ash-based geopolymers reach maturity and the geopolymerization reactions are substantially completed within 7 days, in contrast to cement-based mortars, where full hydration and hardening typically extend over a 28-day period.
An optical microscopy analysis was also performed on the fractured surfaces of the tested specimens to evaluate the pore size and distribution in the geopolymer matrix. This was performed using a LEICA SAPO optical microscope (Leica Microsystems GmbH, Wetzlar, Germany) connected to a computer, which enabled image capture for further documentation and analysis.

2.4. Electrochemical Analysis

The corrosion resistance of steel reinforcement embedded in the geopolymer binder was assessed using cylindrical specimens. For this purpose, an electrochemical cell was constructed, comprising the following components: a 3.5% NaCl aqueous solution as the electrolyte, the embedded steel rebar serving as the working electrode, an Ag/AgCl (3 M KCl) electrode (Radiometer Analytical, Copenhagen, Denmark) as the reference electrode, and a Platinum (Pt) electrode (Radiometer Analytical) as the counter electrode. The cylindrical geopolymer specimen with the vertically centered embedded steel reinforcement was immersed in the electrolyte such that the top surface of the geopolymer cylinder was covered with a sufficient layer of electrolyte. To prevent differential aeration corrosion, contact between the electrolyte and the epoxy-isolated region of the reinforcement was systematically avoided. The electrolyte level consistently extended 2–3 mm above the geopolymer surface to ensure that it would not reach the exposed metal area.
All electrodes were connected to a VoltaLab PGZ 100 potentiostat (Radiometer Analytical, Copenhagen, Denmark), while testing and data interpretation were carried out using Volta Master 4 Electrochemical Software and ZView Software (version 3.4). Prior to electrochemical testing, all specimens were immersed in the electrolyte for 24 h at 23 ± 1 °C.
Open circuit potential (OCP) monitoring
A thermodynamic, qualitative assessment of the corrosion process and identification of trends in passive oxide film formation and breakdown were obtained by monitoring the open circuit potential (OCP) over a period of 1200 min.
Linear polarization measurements
Quantitative information on the corrosion process and its kinetics was obtained using the linear polarization method. The potential was swept at a rate of 10 mV/min across a range of ±500 mV relative to the OCP. Tafel analysis of the polarization curves provided key kinetic parameters, including corrosion potential, corrosion current, corrosion rate, anodic and cathodic slopes, polarization resistance, and electrochemical impedance spectroscopy (EIS).
The mechanism of the corrosion process was further analyzed using EIS in a frequency range from 100 kHz to 100 mHz, with an amplitude of 10 mV. Impedance spectra at the open circuit potential were represented in both Bode plots (logarithmic plots of impedance modulus and phase angle vs. frequency) and Nyquist plots (imaginary vs. real impedance components).
The equivalent electrical circuit was determined using the Z-VIEW software (version 3.4). This process involved analyzing the fit between experimentally obtained impedance data and characteristic curves derived from various equivalent electrical circuits in the software library. Ultimately, the circuit that exhibited the highest degree of congruence (i.e., optimal superposition) between the experimental and fitted curves was selected (R2 values exceeding 0.85 were deemed to represent a good degree of curve fitting).
The reproducibility of the physical and mechanical indicators was ensured through experimental testing of a set of five samples. For this study, average values were reported, with all individual measurements falling within ±5% of the mean value.
Post-Test Microstructural Analysis
After electrochemical testing, a visual inspection of the reinforcement surface and the adjacent binder matrix was performed. The cylindrical specimens were split longitudinally (along the generatrix plane), and an optical microscopy analysis was conducted using a LEICA SAPO optical microscope (Leica Microsystems GmbH, Wetzlar, Germany) connected to a PC, allowing image capture. This step aimed to
-
Identify localized corrosion areas on the metal surface;
-
Detect signs of corrosion product migration into the binder adjacent to the reinforcement;
-
Environmental conditions and correlation with binder properties.
All tests were conducted under controlled laboratory conditions at a temperature of 23 ± 1 °C and 65% relative humidity.
The electrochemical corrosion tests were carried out in parallel with the physical and mechanical testing of the geopolymer binder. This approach was adopted due to the correlation between water absorption, apparent density and mechanical strengths, which collectively serve as an indirect indicator of the ease with which the chloride-containing saline solution can penetrate the binder matrix and reach the steel surface to initiate corrosion. This penetration occurs through the open porosity of the material. The use of this indirect indicator was deemed necessary due to the absence of direct porosity measurements (e.g., via mercury intrusion porosimetry) in the experimental study.

3. Results and Discussions

3.1. Influence of Alkaline Activator on the Physico-Mechanical Characteristics of Geopolymer Binder

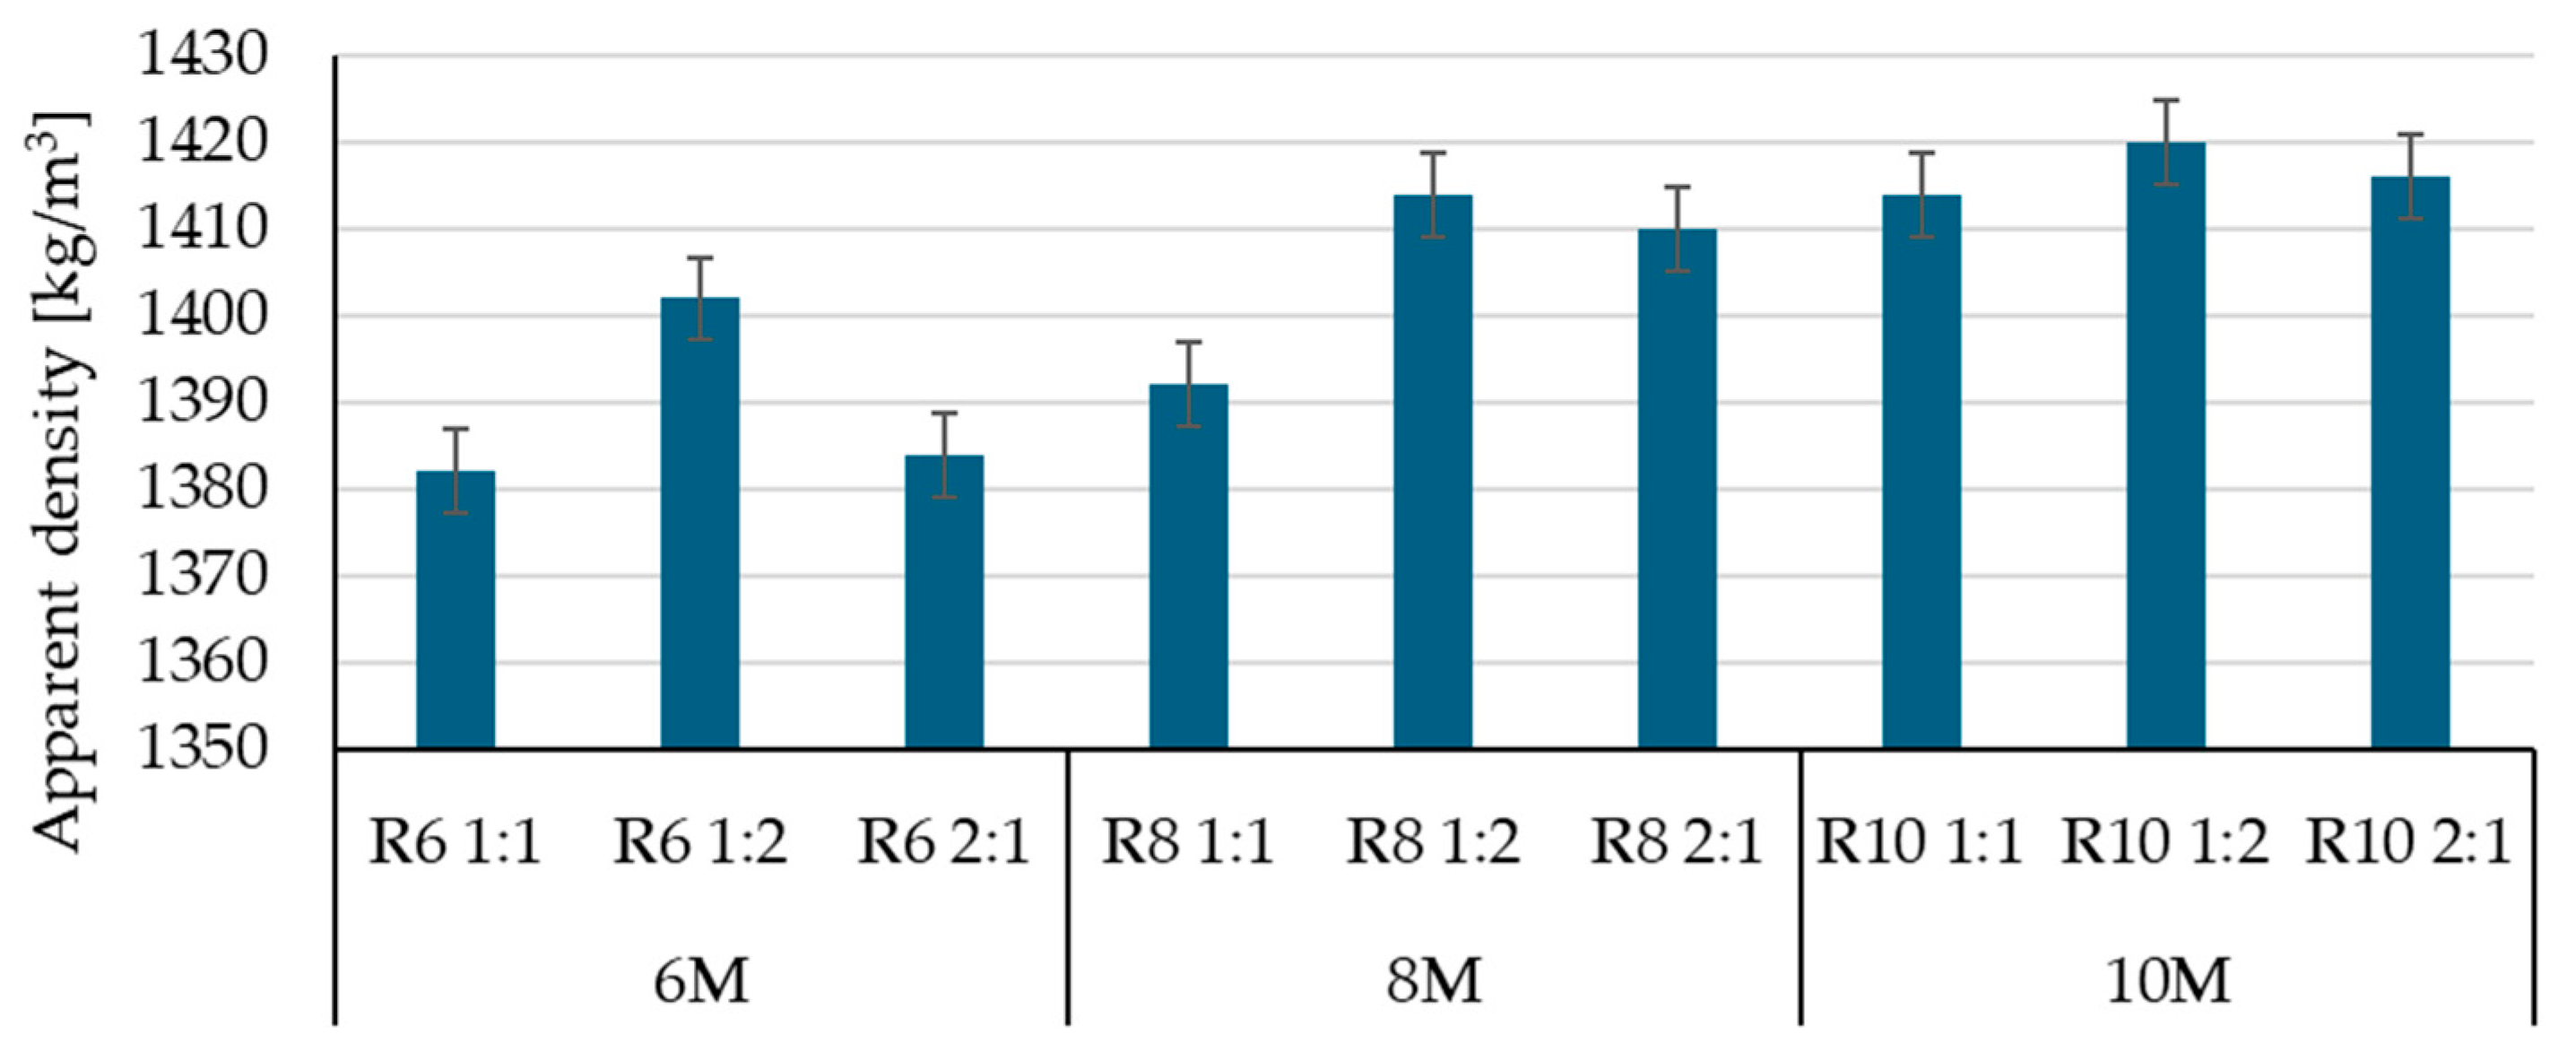
The apparent hardened density was subjected to comparative analysis, considering two primary variables: the ratio of Na2SiO3 to NaOH solutions utilized in the alkaline activator preparation (specifically, ratios of 1:1, 1:2, and 2:1 were investigated) and the molar concentration of the NaOH solution. It was observed that the samples with a 1:2 ratio (i.e., a higher amount of NaOH compared to Na2SiO3) exhibited the highest apparent density (Figure 7).
This increase in density can be attributed to several factors. Firstly, the higher concentration of NaOH promotes more efficient dissolution of the aluminosilicate precursor (e.g., fly ash), leading to the formation of a denser geopolymer gel with fewer pores. Secondly, a lower sodium silicate content reduces the amount of water introduced into the mix (due to the high-water content in Na2SiO3 solution), contributing to a more compact and less porous structure upon hardening. Thus, a higher NaOH content in the activator solution appears to favor the development of a denser microstructure, positively influencing the densification of the geopolymer matrix. This effect was consistently observed across the tested range of NaOH molar concentrations, as reflected in the higher measured bulk density values for this composition type.
This behavior aligns with data reported in the literature, where multiple authors have confirmed that a high Na2SiO3 to NaOH ratio in the activator solution leads to denser and more consolidated geopolymer materials. For example, the studies conducted by Hardjito and Rangan [85] showed that a higher NaOH ratio can lower the viscosity of the fresh paste, facilitating better homogeneity and more effective compacting, which translates into higher density in the hardened material. Similarly, Hamidi et al. [86] demonstrated that at high NaOH molarities (≥8 M), the excess OH ions accelerate the dissolution of reactive particles, resulting in the formation of a denser gel and a reduction in capillary porosity.
Therefore, the experimental results obtained in this study, showing that samples with a Na2SiO3:NaOH ratio of 1:2 exhibited the highest bulk densities regardless of the NaOH molarity (6 M, 8 M, or 10 M), align with established trends in the literature. These findings reinforce the hypothesis that the activator composition ratio plays a crucial role in defining the microstructure and final performance of geopolymer materials.
Moreover, when evaluating the bulk density values across all geopolymer compositions, it is evident that the variations are minimal, ranging between 1382 and 1420 kg/m³, with a maximum difference of only 38 kg/m³. From a construction materials perspective, this variation falls within a narrow range, indicating low dispersion.
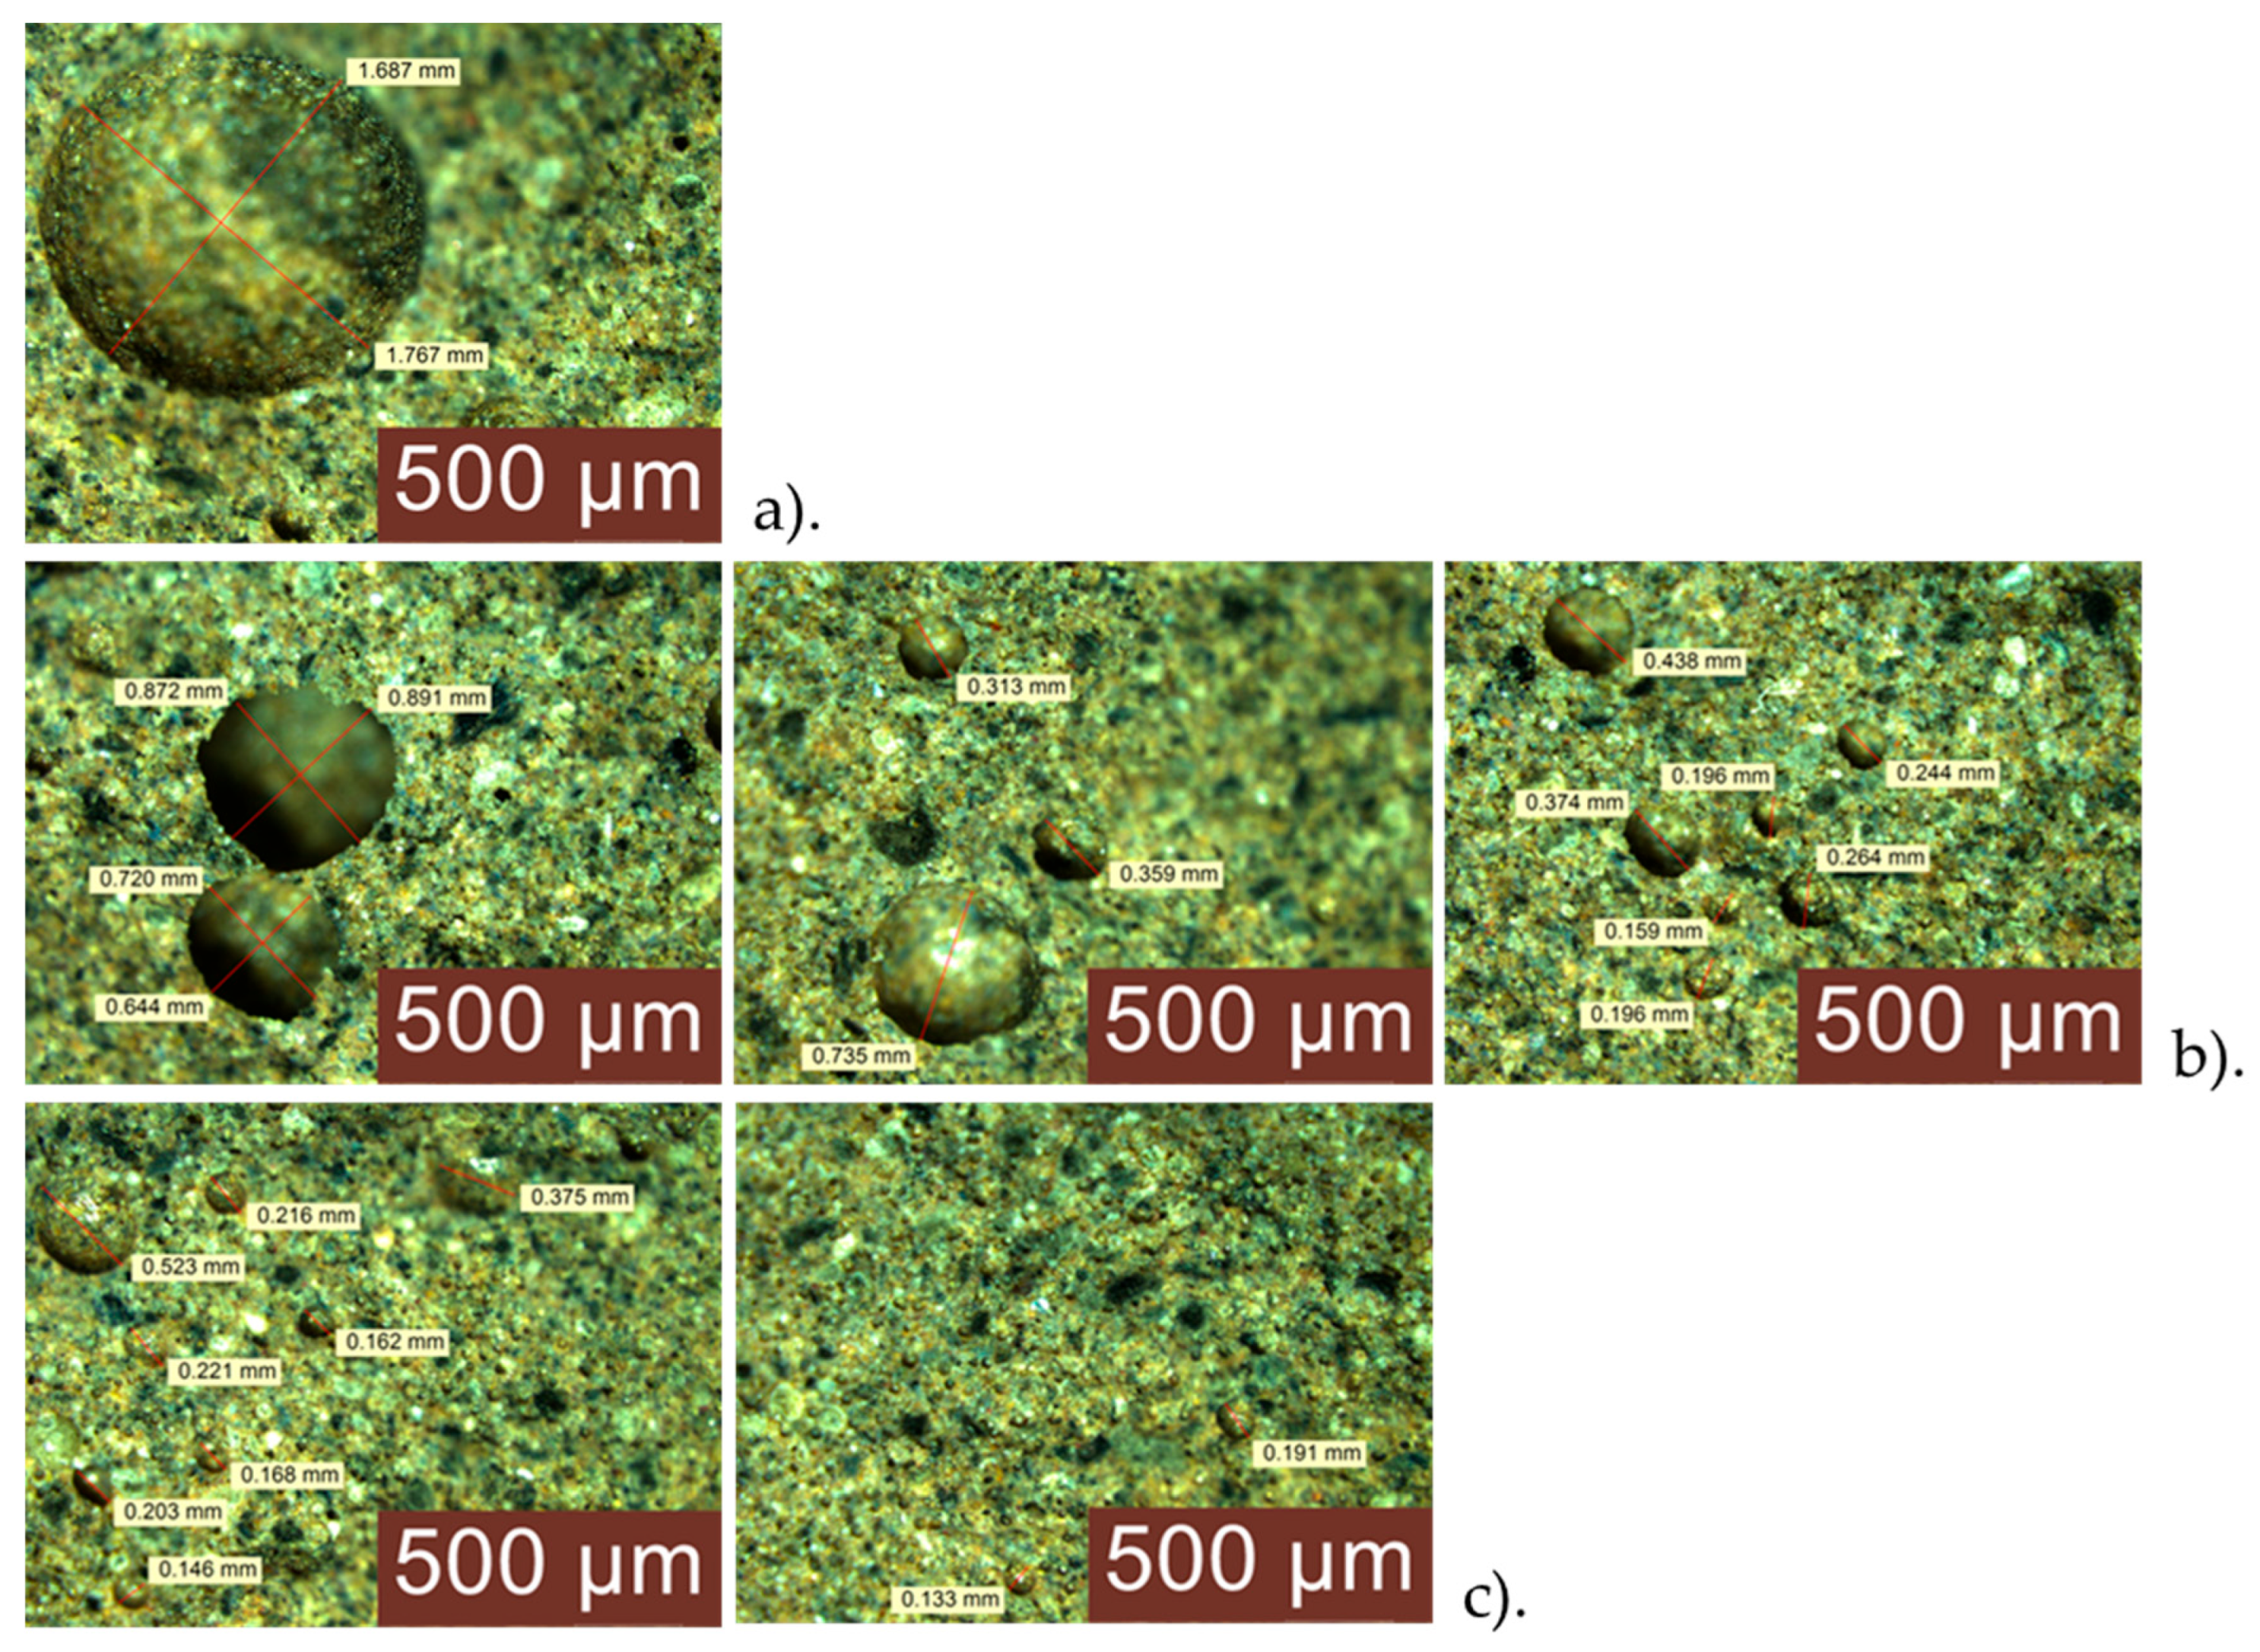
Microscopic analysis of the fractured geopolymer matrix supports these observations by highlighting differences in porosity. Figure 8 presents representative optical microscope images showing large pore sizes (>1.5 mm) in the sample prepared with 6 M NaOH, intermediate pore sizes (0.19 mm < diameter < 1 mm) for the 8 M NaOH composition, and reduced porosity with small pores (maximum 0.6 mm) and compact zones in the 10 M NaOH sample.
Considering that open porosity, quantified indirectly through the degree of material densification, significantly influences the ability of corrosive agents to penetrate and reach the surface of the embedded reinforcement, an initial indication can be made that the Na2SiO3:NaOH ratio of 1:2 in the alkaline activator formulation provides the most favorable scenario in terms of corrosion protection offered by the geopolymer binder.
The results obtained for flexural strength and compressive strength (Figure 9a,b) were correlated with the density values, analyzed in relation to both the Na2SiO3:NaOH ratio (1:1, 1:2, 2:1) and the molar concentration of the NaOH solution (6 M, 8 M, 10 M). It was observed that, for all tested combinations, the specimens with the 1:2 ratio exhibited the best mechanical performance—both in terms of flexural and compressive strength. Although these results consistently aligned with the highest measured bulk densities, suggesting a direct relationship between a denser microstructure and enhanced physical and mechanical behavior of geopolymer pastes, no strict mathematical correlation could be established. Rather, a general trend of improvement was identified.
These experimental results are consistent with findings reported in the literature, which indicate that the bulk density of geopolymer materials has a significant impact on both their mechanical performance and durability. For instance, Rovnaník [87] highlighted that higher density is associated with a more homogeneous internal structure and reduced capillary porosity, which leads to increased mechanical strength and decreased water absorption. Similarly, Temuujin et al. [88] emphasized the critical role of the Na2SiO3 to NaOH ratio in the development of the geopolymer network, noting that a higher proportion of NaOH promotes a more intense activation reaction, resulting in the formation of a denser and better-polymerized gel.
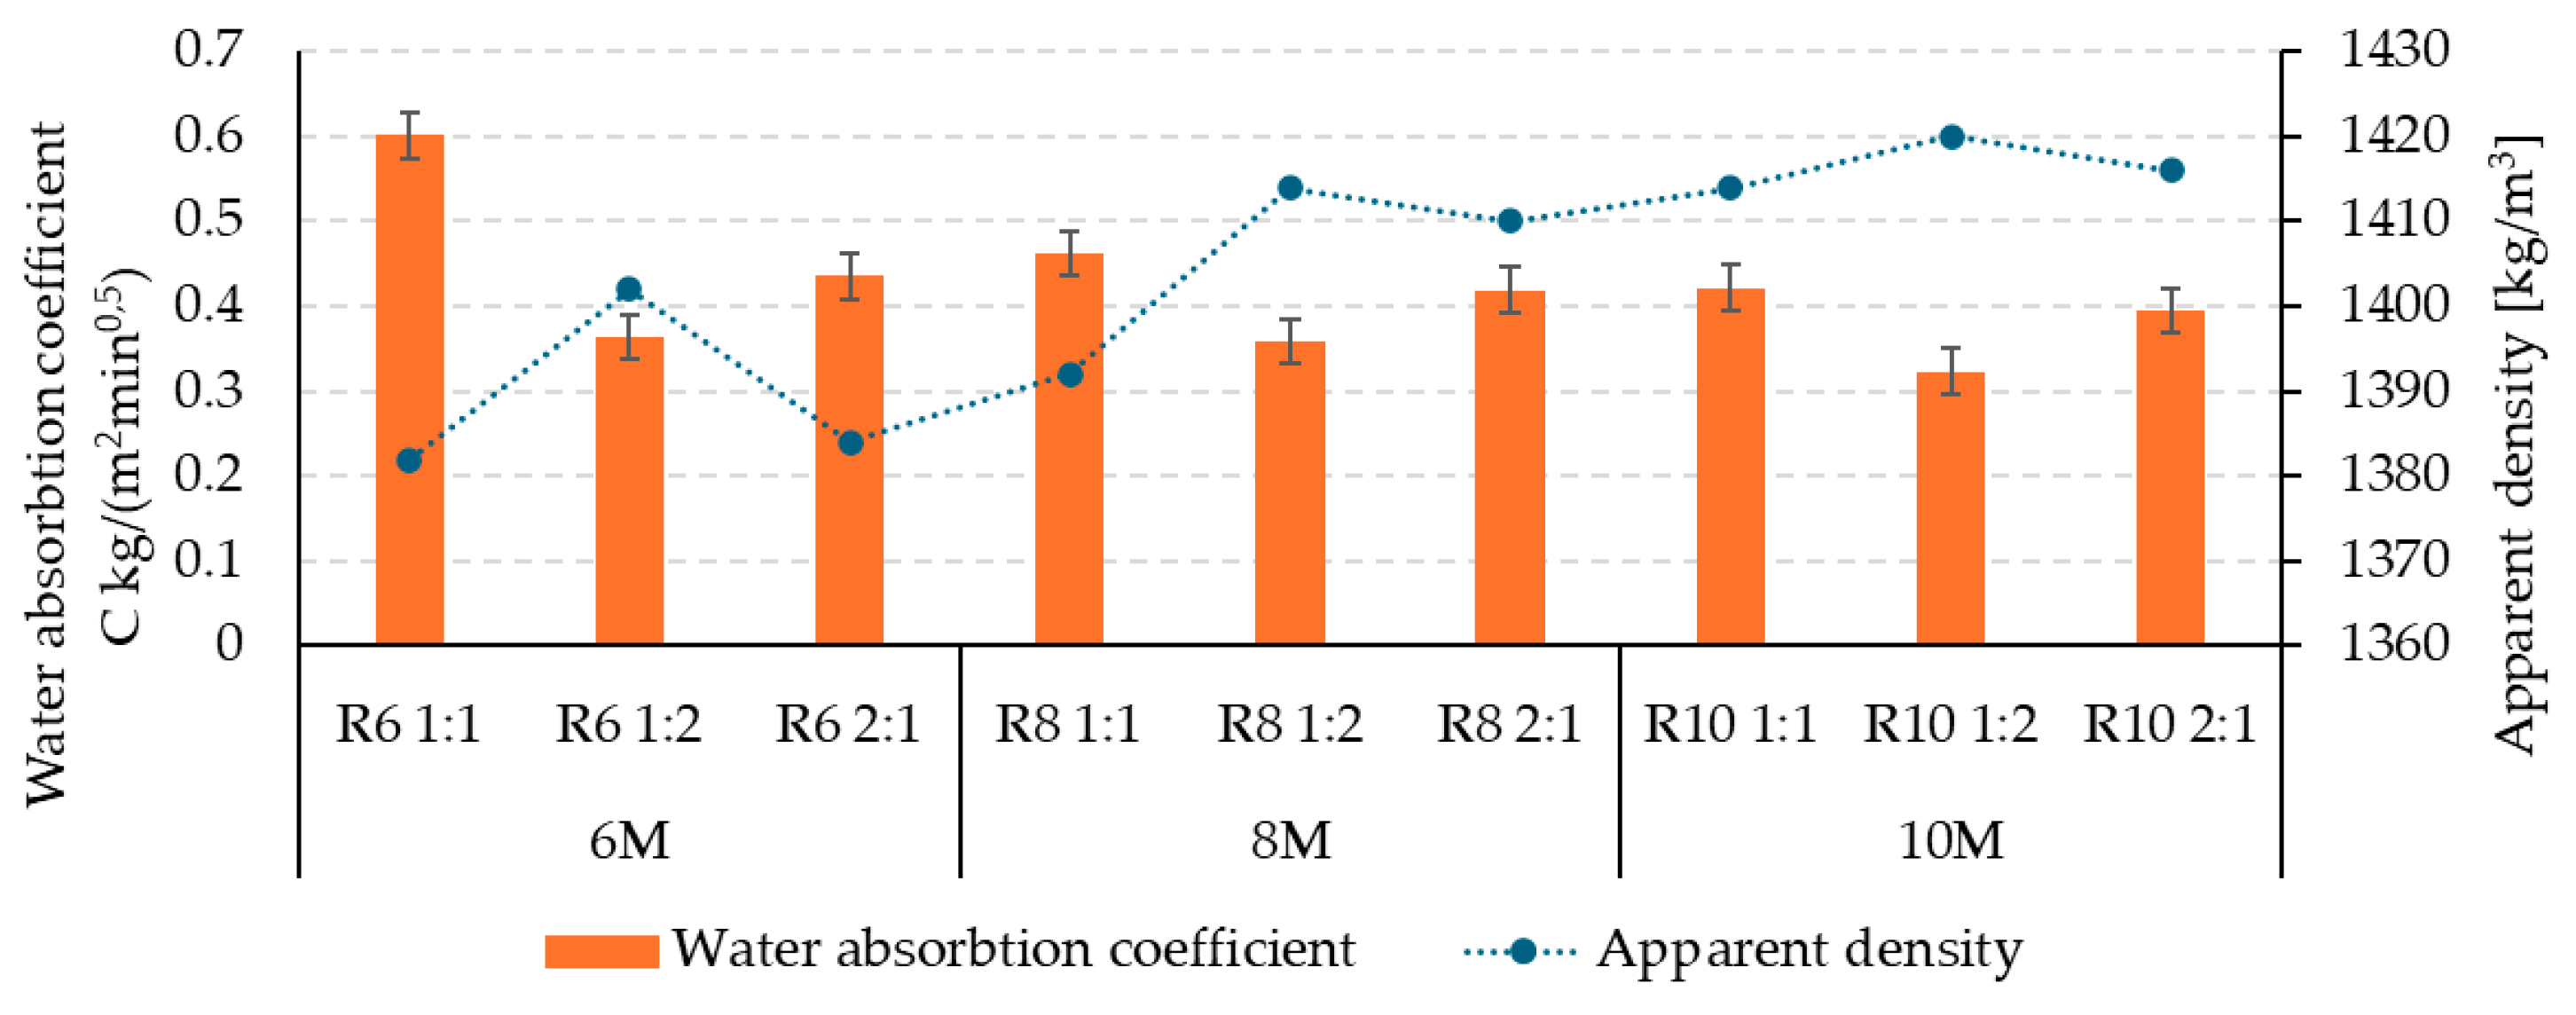
Regarding capillary water absorption (Figure 10), the experimental results—considering that this phenomenon occurs through the material’s open porosity, i.e., the interconnected open-pore network—support the hypothesis of porosity reduction and material densification as the availability of sodium hydroxide increases during the geopolymerization process. Specifically, increasing the concentration of the NaOH solution used as an alkaline activator leads to a decrease in capillary water absorption. Furthermore, for the same NaOH molar concentration, the use of a Na2SiO3:NaOH ratio of 1:2 in the alkaline activator also results in a reduction in the water absorption coefficient.
More concretely, when compared to the compositions prepared with an alkaline activator having a 1:1 Na2SiO3:NaOH ratio, the use of a 1:2 ratio led to reductions in capillary water absorption of 39.4% for R6, 22.3% for R8, and 23.5% for R10. On the other hand, increasing the NaOH molar concentration to 8 M and 10 M resulted in a decrease in the capillary water absorption coefficient by 23.1% and 29.8%, respectively, for compositions using a 1:1 Na2SiO3:NaOH activator. A less pronounced, yet still present, decrease was observed for the 1:2 ratio: 1.4% for NaOH 8 M and 11.3% for NaOH 10 M, compared to the 6 M solution. Similarly, in the case of the alkaline activator prepared with a 2:1 Na2SiO3:NaOH ratio, the capillary absorption coefficient decreased by 3.9% and 9.4%, respectively.
This evolution in results implicitly supports the assumption of reduced porosity. Specifically, the observed material densification reflects a reduction in total porosity, while the decrease in capillary water absorption indicates a corresponding reduction in open porosity.
The importance of these findings lies in the possibility of guiding the optimization process of geopolymer mix designs. The results suggest that selecting an appropriate ratio between the components of the activating solution, specifically, a higher proportion of NaOH, can lead to the production of materials with superior performance in terms of both mechanical strength and durability. Further support for selecting a Na2SiO3:NaOH ratio of 1:2 for the activating solution stems from visual observations. These observations indicate the presence of efflorescence on the surface of geopolymers prepared with an activating solution characterized by a Na2SiO3:NaOH ratio of 2:1, which suggests an excess of Na2SiO3 in that particular case (Figure 11). This phenomenon has also been described in the literature, where it was shown that a high sodium silicate content in the activator can promote efflorescence formation due to the migration of soluble ions to the surface during material curing [89].

3.2. Corrosion Kinetics of Steel Reinforcement Embedded in Geopolymer Binder

Corrosion of iron is known to involve two simultaneous reactions:
a)
The anodic iron oxidation reaction,
Fe(s) ―› Fe2+ + 2e;
b)
Cathodic reduction reaction of oxidizing species in the environment,
2H+ + 2e ―› H2.
Hydrogen depolarization corrosion in acidic environments.
O2 + 2H2O + 4e ―› 4OH.
Oxygen depolarization corrosion in neutral or alkaline environment.
In neutral and alkaline environments, the cathodic process involves the reduction in dissolved oxygen in the electrolyte.
From a thermodynamic point of view, the electrochemical corrosion of steel reinforcement embedded in geopolymer, by analogy with its behavior in concrete, occurs at the interface between the geopolymer and the reinforcement through two simultaneous characteristic reactions involving electron transfer specific to alkaline environments. As a result, an electric double layer forms at the steel–geopolymer interface, analogous to a charged capacitor. The metal, iron in this case, represents the negative side of the capacitor, while the adjacent medium constitutes the positive side. It is known that the standard potential of Fe2+/Fe is −0.441 V, and for the system characteristic of neutral and alkaline environments, O2/OH is +0.401 V. Under these thermodynamic conditions, iron corrosion takes place. In most environments, iron and its alloys are highly susceptible to corrosion. The thermodynamic prerequisite for corrosion is the continuous capture of excess electrons from the metallic substrate by an oxidizing species present within the electrolyte.
From both thermodynamic and kinetic perspectives, the corrosion phenomenon of steel reinforcement embedded in geopolymer material, prepared in the 9 variants (see Section 2.1), was analyzed using electrochemical methods, namely open circuit potential (OCP) and linear polarization interpreted by Tafel extrapolation. To validate the research hypotheses, FA with well-defined, production-specific characteristics was selected as the raw material. This selection was based on existing scientific literature indicating the significant heterogeneity of FA, which varies considerably in chemical and oxide composition, as well as in particle size distribution, depending on its origin and geographical location. These variations are known to significantly impact the geopolymerization process. A second critical factor impacting geopolymerization is the AA, particularly the concentration of its NaOH solution and the Na2SiO3/NaOH ratio. To thoroughly investigate these influences, three distinct NaOH molarities were used to prepare the AA, with each molarity yielding three AA variants characterized by different Na2SiO3 ratios (overall nine variations). All these parameters, which directly affect the geopolymerization process, are hypothesized to indirectly influence the kinetics and mechanism of embedded reinforcement corrosion. This complex phenomenon relies on the pH of the reinforcement’s immediate environment, how easily corrosive agents (specifically chloride ions) reach the steel surface, and how diffusive corrosion products are within the adjacent binder. These findings are in accordance with the scientific literature [77,78,79,80].
The analysis of open circuit potential evolution (Figure 12a,d) for the studied samples highlights the following: For the geopolymer samples prepared with a 6 M NaOH solution, NaOH, initial potential recordings indicated that sample R6–1:2 exhibited the most noble (least negative) corrosion potential, followed by R6–1:1, while R6–2:1 displayed the most active (most negative) potential. The potential of sample R6–1:2 decreased from −255 mV to −416 mV over 600 min, probably due to the release of iron ions into the solution from the adjacent geopolymer pores. After 600 min and up to the end of the testing period (1100 min), the potential stabilized. According to the pH-potential diagram (Pourbaix diagram for the Fe/H2O system) specific to iron in aqueous solutions, and in the context of the alkaline environment provided by the geopolymer (reference supporting the alkalinity of geopolymers), this stabilization was likely due to the formation of an oxide/hydroxide layer on the reinforcement surface. According to the Pourbaix equilibrium diagram for the Fe/H2O system, there are three characteristic behavior domains of iron in aqueous media, depending on pH: the immunity domain (potential range approx. −1 V to −1.4 V), where iron does not corrode (is immune) across a wide pH range (−2 to 14); the active corrosion domain, where iron corrodes depending on pH, with a potential range from −1.4 V to 2 V, corresponding to the metal’s active domain; and the passivation domain, which matches the passive domain in the anodic polarization diagram, where corrosion products remain on the metal surface, slowing or preventing access of the corrosive medium. The potential for sample R6–2:1 stabilized after 200 min, moving from −475 mV to −489 mV. The observed potential shift consistently remained in more negative value ranges when compared to the other two samples. This behavior was also attributed to the alkalinity of the geopolymer layer adjacent to the reinforcement, which varies depending on the Na2SiO3:NaOH ratio of the alkaline activator. The passivation (oxide/hydroxide layer formation) of the R6–1:1 sample occurred much later—after 800 min. Despite a more significant potential drop for R6–1:2 (161 mV) compared to R6–1:1 (93 mV) and R6–2:1 (14 mV), the final passivation potential of R6–1:2 remained in a more noble (less negative) range than that of the other samples. This indicates its superior performance, reflecting the lowest thermodynamic tendency for corrosion.
For the geopolymer samples prepared with an 8 M NaOH, the passivation potential of R8–1:2 was recorded at −329 mV, less negative in absolute value than those of R8–1:1 (−478 mV) and R8–2:1 (−572 mV). The placement of the R8–1:2 potential diagram in the more “positive” zone (lower absolute values). The consistent placement of the R8–1:2 potential diagram within this more noble zone, coupled with stable potential values without abrupt variations, indicates superior performance. This holds true even though the potential drop to reach passivation was greater for R8–1:2 (150 mV) than for R8–1:1 (26 mV) and R8–2:1 (102 mV). These observations suggest that the corrosion product layer formed on R8–1:2 is more stable and provides enhanced protection compared to the other samples.
For the geopolymer samples prepared with a 10 M NaOH solution, the potential evolution for sample R10–1:2 showed that during the first 480 min after the start of measurement, the potential dropped from −436 mV to −490 mV—behavior corresponding to the release of iron ions into the solution from the geopolymer pores. This was followed by a passivation period, corresponding to the formation of a corrosion product layer, in the time interval 480 to 690 min, after which the potential remained relatively constant at –460 mV, indicating the stabilization of the phenomenon. Passivation of the R10–1:1 reinforcement occurred after 600 min, reaching a passivation potential of –463 mV, while for R10–2:1, passivation occurred after 1000 min, with a passivation potential of –522 mV. The highest potential drop was recorded for sample R10–2:1, with a value of 83 mV.
Overall, it can be concluded that for a given NaOH solution molarity, the samples prepared with a sodium silicate to sodium hydroxide (Na2SiO3:NaOH) ratio of 1:2 exhibited the most favorable thermodynamic behavior, as indicated by the evolution of the open circuit potential. Additionally, for the (Na2SiO3:NaOH) = 1:2 ratio, the potential evolution of sample R8 was better than that of sample R6, which in turn was better than that of sample R10.
The positioning of the open circuit potential values recorded for the samples with a Na2SiO3:NaOH ratio of 2:1 in the most negative range—both for R8–2:1 and R10–2:1 (Figure 12c,d)—while the R6–2:1 diagram is located in an intermediate zone (Figure 12), suggests insights when interpreted within the context of the pH–potential (Pourbaix) diagram for iron in aqueous solutions. This configuration may indicate that the corrosion products formed (potentially leading to a passivating layer) predominantly consisted of Fe(OH)2 or Fe2O3, as evidenced by the observed tendency toward linearization after a certain testing duration. Concurrently, sample R6–2:1, characterized by a less alkaline pH due to the use of a lower-concentration NaOH solution in the preparation of the alkaline activator, may achieve partial formation of a passivating layer. This was also supported by the numerous spikes at the end of the characteristic OCP diagram, which indicated successive formation–breakdown events of the corrosion product layer.
In addition to this unsatisfactory potentiostatic behavior of the samples characterized by a Na2SiO3:NaOH ratio of 2:1, the presence of efflorescence on the surface of sample R10–2:1 (Figure 11) was a defining factor that eliminates the feasibility of these compositional variants. Meanwhile, the behavior of the samples with Na2SiO3:NaOH ratios of 1:1 or 1:2 was encouraging—both due to the absence of efflorescence on the surface and the recording of open circuit potential values that fell within the negative range but with lower absolute values.
Regarding the kinetics of the corrosion phenomenon of steel reinforcement embedded in geopolymer under the action of chloride ions, the experimental results obtained through linear polarization, interpreted using the Tafel method, are presented in Table 5 and Figure 13a,d. Analyzing the potentiodynamic polarization tests of the samples studied, the following observations can be made:
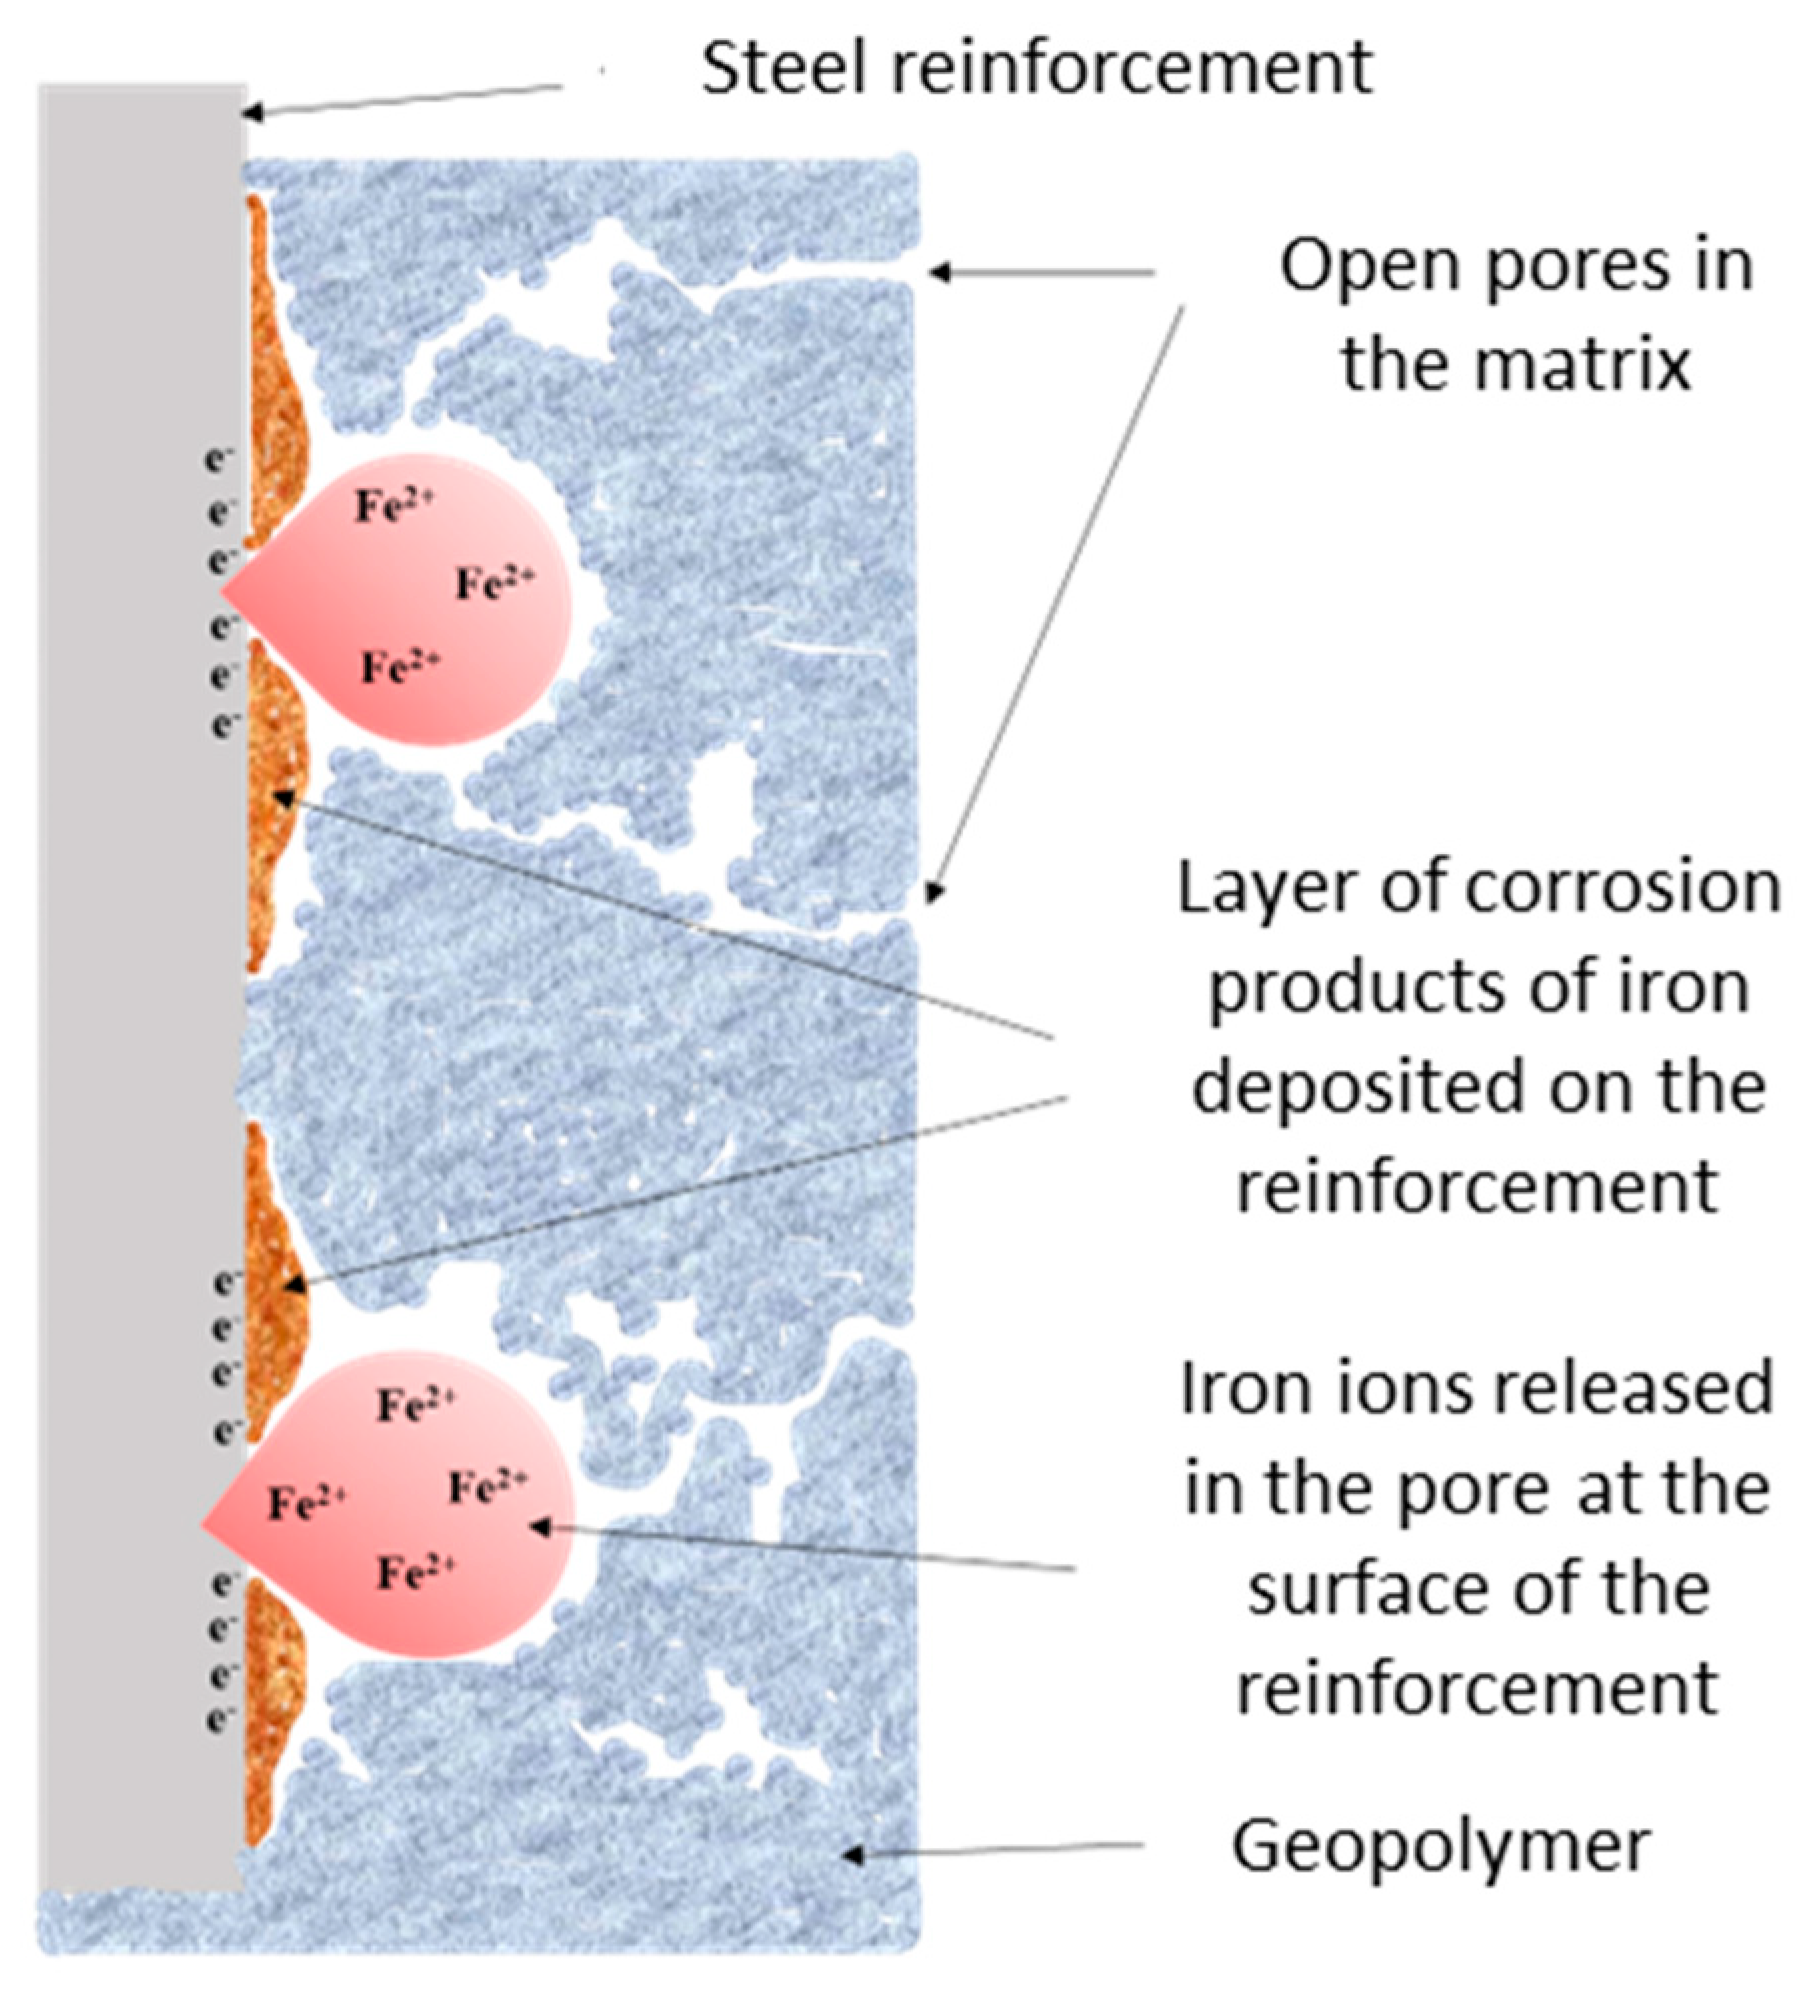
Sample R6–1:2 exhibited a lower corrosion current compared to samples R6–1:1 and R6–2:1 (Figure 13b), and its anodic slope was also lower than that of the other samples. This indicates that the activation energy for corrosion was higher. Additionally, the polarization resistance of this sample was higher, likely due to the release of iron ions into the solution within the pores of the geopolymer, which, on one hand, shielded the reinforcement and, on the other hand, contributed to the formation of a layer of corrosion products deposited on the reinforcement.
Structural modifications within the geopolymer (GP) matrix arising from variations in NaOH solution molarity and the alkaline activator’s (AA) compositional ratio (NaOH/Na2SiO3) were found to reduce the corrosion rate by impeding charge transfer to the reinforcement surface. Additionally, the consistent morphology of the cathodic Tafel branch suggests that GP modifications generally do not alter the mechanism of cathodic corrosion reactions.
Analysis of the Tafel curve positioning revealed a distinct grouping of specimens prepared with a 6 M NaOH solution (Figure 13b) within the cathodic potential region. As the molarity of the NaOH solution increased to 8 M (Figure 13c), a noticeable anodic shift in the characteristic Tafel curves was observed. This finding supports the significant influence of NaOH molarity on corrosion kinetics. However, increasing the NaOH concentration to 10 M caused a tendency to shift back towards the cathodic zone (Figure 13d). This suggests that the kinetic behavior of the phenomenon cannot be predicted based solely on NaOH concentration, as other factors also influence it. Furthermore, these findings indicate that an optimal NaOH solution concentration for corrosion performance is around 8 M.
For the samples with an 8 M NaOH solution in the alkaline activator, low corrosion current densities were observed. Notably, sample R8–1:1 showed the lowest corrosion current density, accompanied by a shallower anodic slope compared to the other samples. This suggests a higher activation energy for corrosion, a relationship substantiated by principles of electrochemical kinetics, particularly the Arrhenius and Tafel equations. Furthermore, the significantly higher polarization resistance of this sample indicates a reduced corrosion rate for the embedded steel reinforcement.
The samples prepared with a 10 M NaOH solution generally exhibited high corrosion current densities. An exception was sample R10–2:1, which also demonstrated a high polarization resistance and, consequently, a favorable corrosion resistance. The anodic slope of sample R10–2:1 was lower than that of samples R10–1:1 and R10–1:2, indicating a superior potentiodynamic behavior and a reduced tendency to corrode.
Overall, except for sample R8–1:2, the other samples prepared using an 8 M NaOH solution exhibited shallower anodic slopes than those prepared with 6 M and 10 M NaOH solutions, indicating a higher activation energy for corrosion for the samples prepared with an 8 M NaOH solution. Among the studied samples, sample R8–1:1 stands out by having the lowest corrosion current density, the shallowest anodic slope, and the highest polarization resistance. Therefore, it can be considered that R8–1:1 exhibited the best potentiodynamic behavior and the highest corrosion resistance.
Analysis of the experimental results within the context of ASTM C867–91 indicators (Table 1 and Table 2) would classify the experimental outcomes in high corrosion risk/stage for reinforcement embedded in geopolymer binders exposed to an aggressive chloride environment. However, this corrosion risk was significantly reduced for the specimens made with geopolymer binder prepared using 8 M NaOH solution as the alkaline activator. For the reinforcement embedded in the R8–1:1 geopolymer, evaluating the corrosion current density (0.72 μA/cm2) revealed a change in classification from a high to a moderate corrosion stage. Even for R10–2:1, the corrosion current density value approached the threshold between high and moderate corrosion (1.1 μA/cm2 recorded vs. 1.0 μA/cm2 as the threshold value). However, this classification change could not be confirmed due to the presence of efflorescence on the surface of the samples, which disqualified this composition as a feasible variant. In the case of the samples made with geopolymer prepared using the 6 M NaOH solution, all kinetic indicators suggested a high corrosion stage for the embedded reinforcement.
This analysis emphasizes the critical importance of the precursors used in geopolymer preparation in determining the level of protection the binder can provide to embedded steel reinforcement under chloride attack. However, it is crucial to acknowledge that all experimental results were obtained under conditions involving a 24 h pre-immersion of the specimens in a 3.5% NaCl saline solution prior to testing. This experimental design inherently assumed a severe chloride attack, both through the selection of a high electrolyte concentration and the pre-testing immersion protocol.

3.3. The Corrosion Mechanism of Steel Reinforcement Embedded in Geopolymer Binder

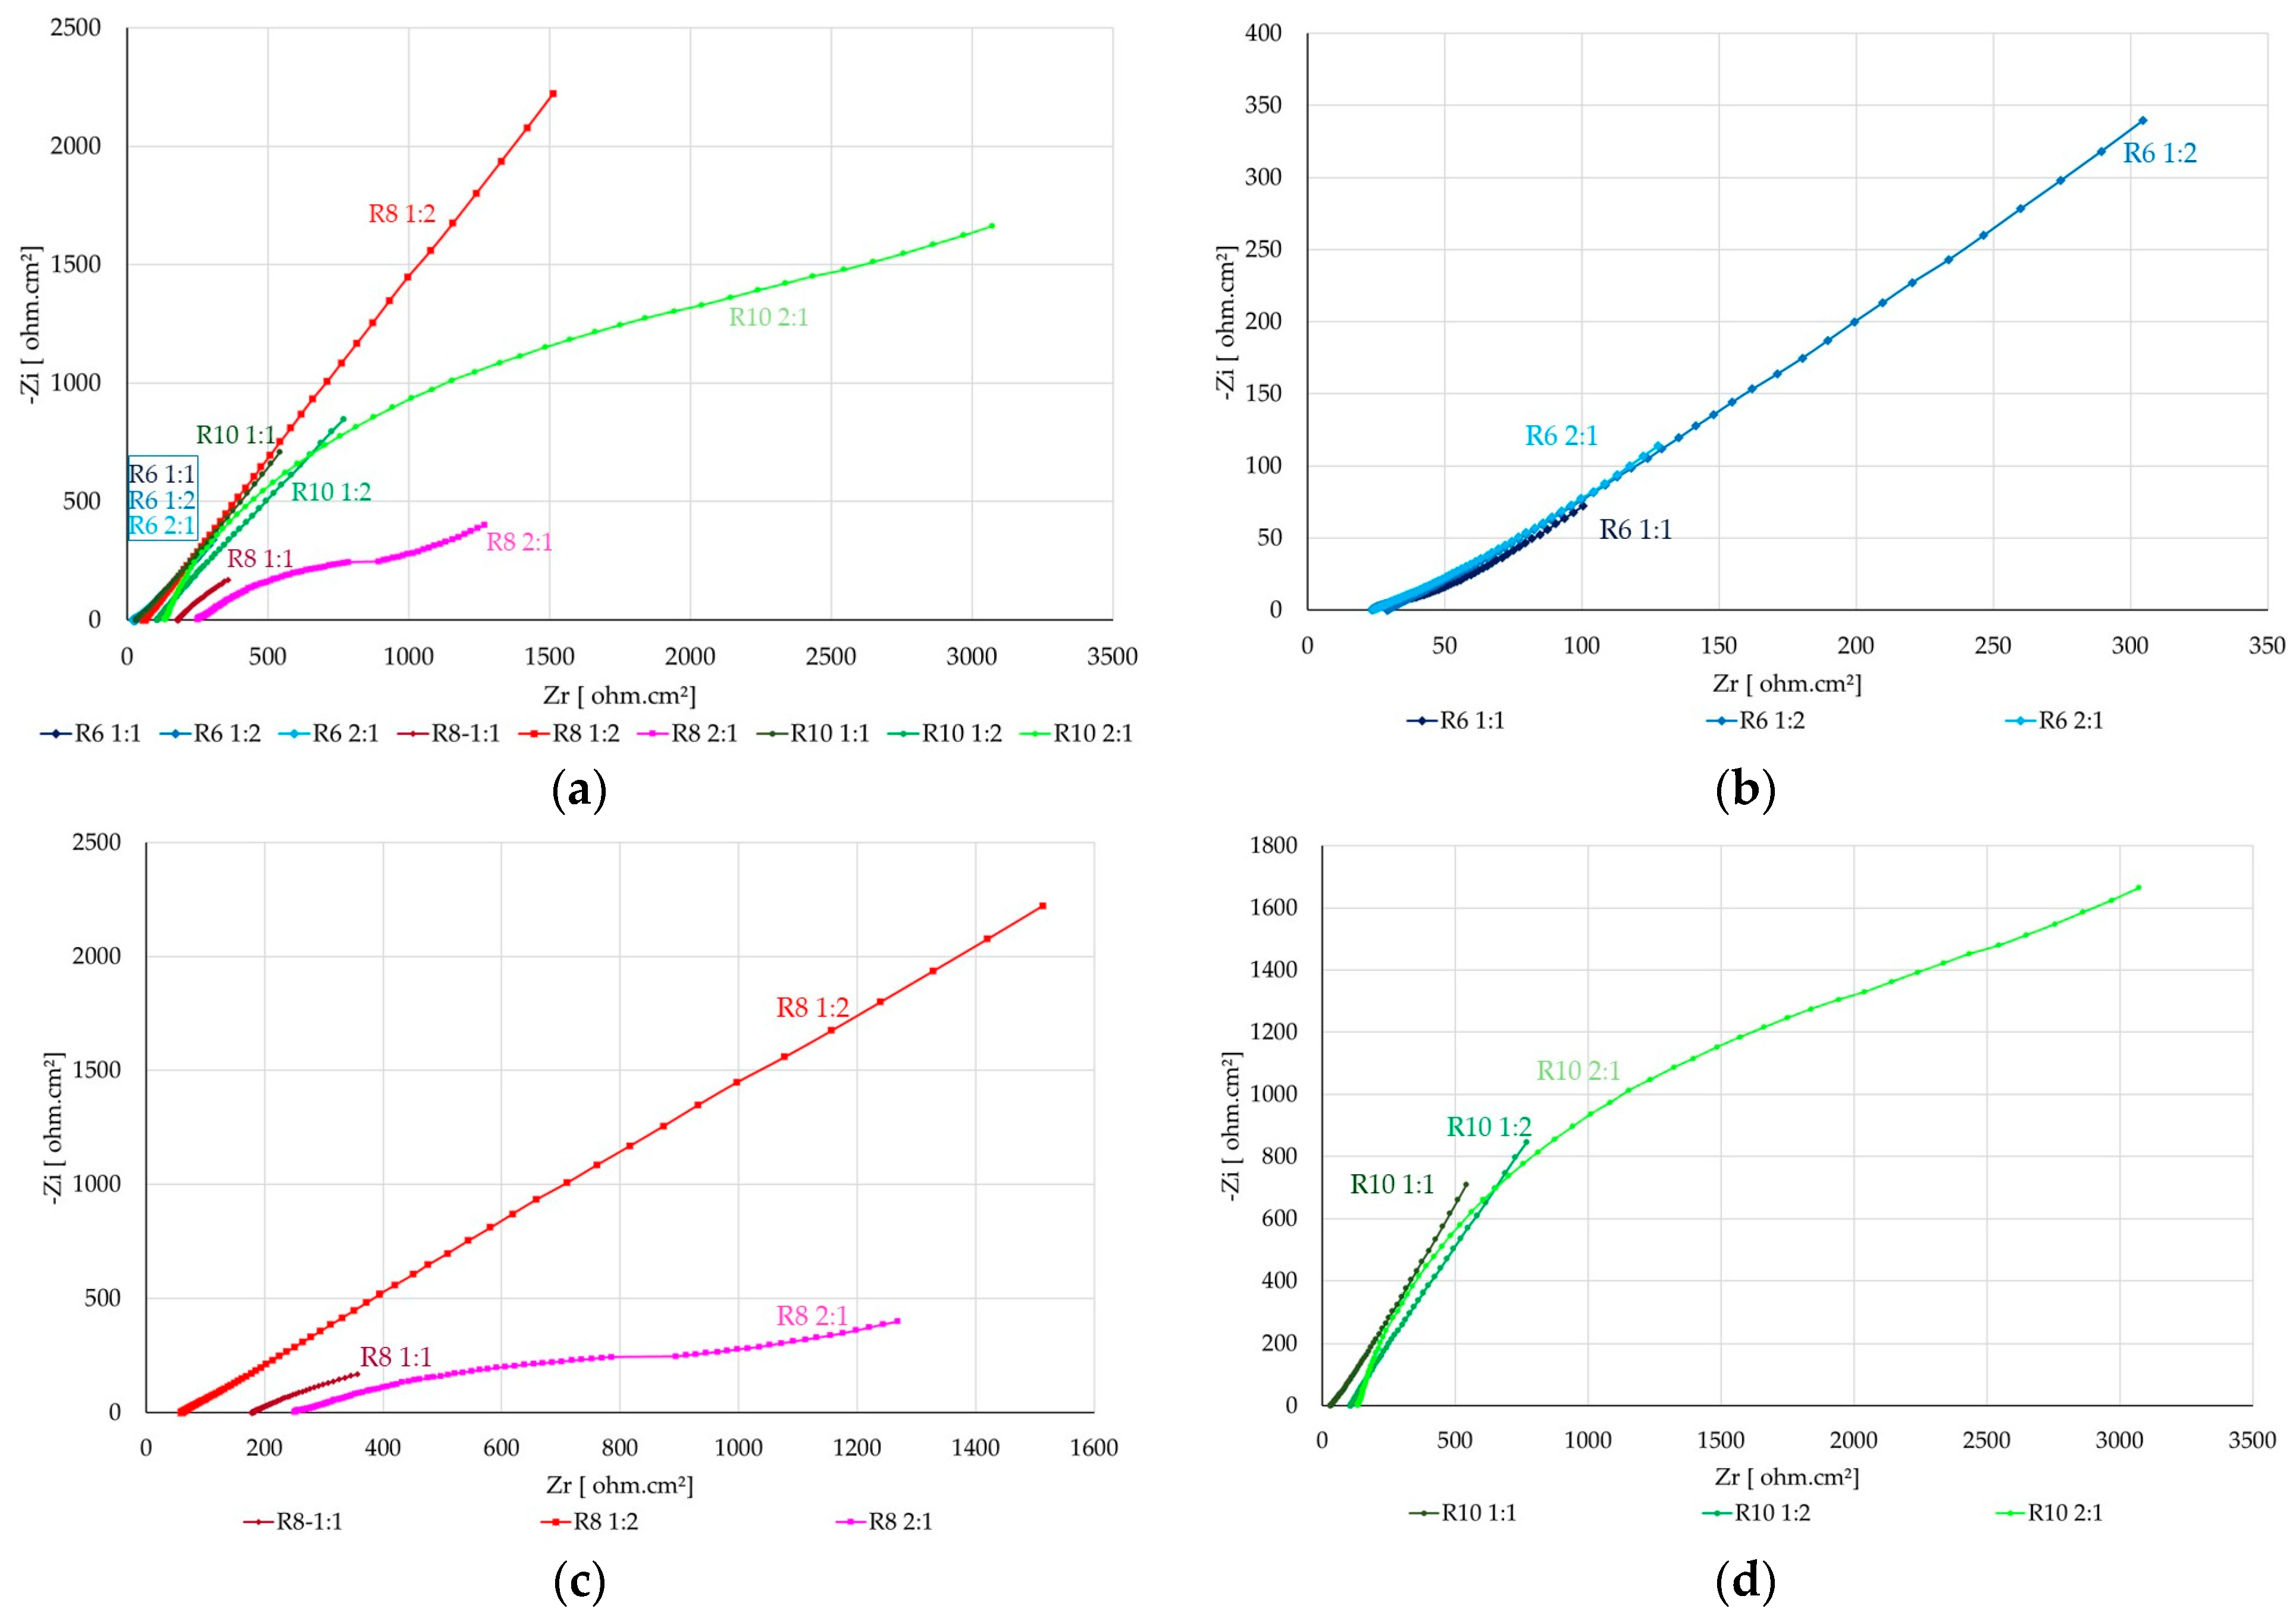
The interpretation of electrochemical impedance spectroscopy (EIS) spectra and the identification of a satisfactory equivalent circuit depend on a good understanding of the corrosion phenomena occurring at the surface of the sample. In the case of steel reinforcement embedded in the nine variants of geopolymers, the EIS spectra, in Nyquist representation, are shown in Figure 14.
From the analysis of the Nyquist diagrams (Figure 14a–d) for the studied samples, it can be observed that the semi-circle area, which represents the period during which the reaction kinetics is slow, with the formation of a protective oxide layer, is missing. The fact that the graphs are primarily characterized by a straight line indicates a high reaction rate, characterized by mass transfer. It can be appreciated that, once the geopolymer was poured into the mold and the reinforcement was embedded, due to the high alkalinity of the geopolymer composition, a layer of bi-/trivalent iron hydroxide formed on the surface of the reinforcement, providing some anticorrosive protection to the reinforcement, according to the following chemical reactions:
Fe + 2NaOH → Fe(OH)2 + 2Na,
Fe + 3NaOH → Fe(OH)3 + 3Na.
Additionally, by immersing the system of embedded reinforcement–geopolymer in the NaCl saline solution, it can be appreciated that, from a chemical point of view, an attack occurs both on the geopolymer and on the reinforcement. The iron ions released from the surface of the reinforcement into the solution in the geopolymer pore, located at the reinforcement–geopolymer interface, react with the sodium chloride in the electrolyte and form iron chloride, which in turn reacts with sodium hydroxide to form iron hydroxide, which precipitates on the reinforcement, according to the following equations:
Fe + 2NaCl → FeCl2 + 2Na,
Fe + 3NaCl → FeCl3 + 3Na,
FeCl3 + 3 NaOH = 3 NaCl + Fe(OH)3↓,
FeCl2 + 2 NaOH = 2 NaCl + Fe(OH)2↓.
Specialized literature indicates that at high concentrations and ambient temperatures (15–30 °C), the penetration of chloride ions into the pores of the geopolymer is typically accompanied by the formation of calcium hydroxide (Ca(OH)2) and calcium oxychloride salts (3CaOCaCl2·15H2O; CaO·CaCl2·H2O, and CaCl2·6H2O) [89]. The film formed on the surface of the reinforcement is not an ideal and fully compact layer, and the presence of pores in the corrosion products influences the electrochemical response of the system at low frequencies [90,91]. As reported in the specialized literature and derived from the characteristics of Nyquist diagrams, the proposed equivalent electrical circuit model posits that the passive layer does not fully encapsulate the metal surface and, consequently, cannot be quantified as a homogeneous layer. This perspective is consistent with extant literature, which indicates that neither the active surfaces of solids nor the passive layers on metallic substrates exhibit ideal homogeneity [92,93,94,95,96,97]. Consequently, the observed behavior of the diagrams was interpreted as a deviation from the expected performance characteristics of an ideal capacitor. This phenomenon, known as frequency dispersion, has been attributed to 2D or 3D local inhomogeneities within the dielectric material, porosity, mass transport, and relaxation effects. Consequently, constant phase elements (CPEs) were utilized as capacitive elements in the proposed model. Additionally, the Nyquist EIS diagrams’ overall appearance might also be interpreted as evidence of diffusion-controlled processes (e.g., Warburg impedance). Future studies will examine this in detail, taking into account that the Warburg element is typically used to interpret Nyquist diagrams when diffusive transport is a significant factor in the electrochemical process being studied. The Warburg element effectively models the influence of diffusive mass transport of chemical species to or from the electrode surface. Its presence is usually indicated by a 45-degree oblique line in the low-frequency region of the Nyquist plot. In this case, the behavior of the steel reinforcement in a geopolymer binder suggests that the Warburg element may be relevant. This is because the electrochemical processes occurring are likely influenced by diffusive transport of species such as oxygen or ions toward the steel surface [98].
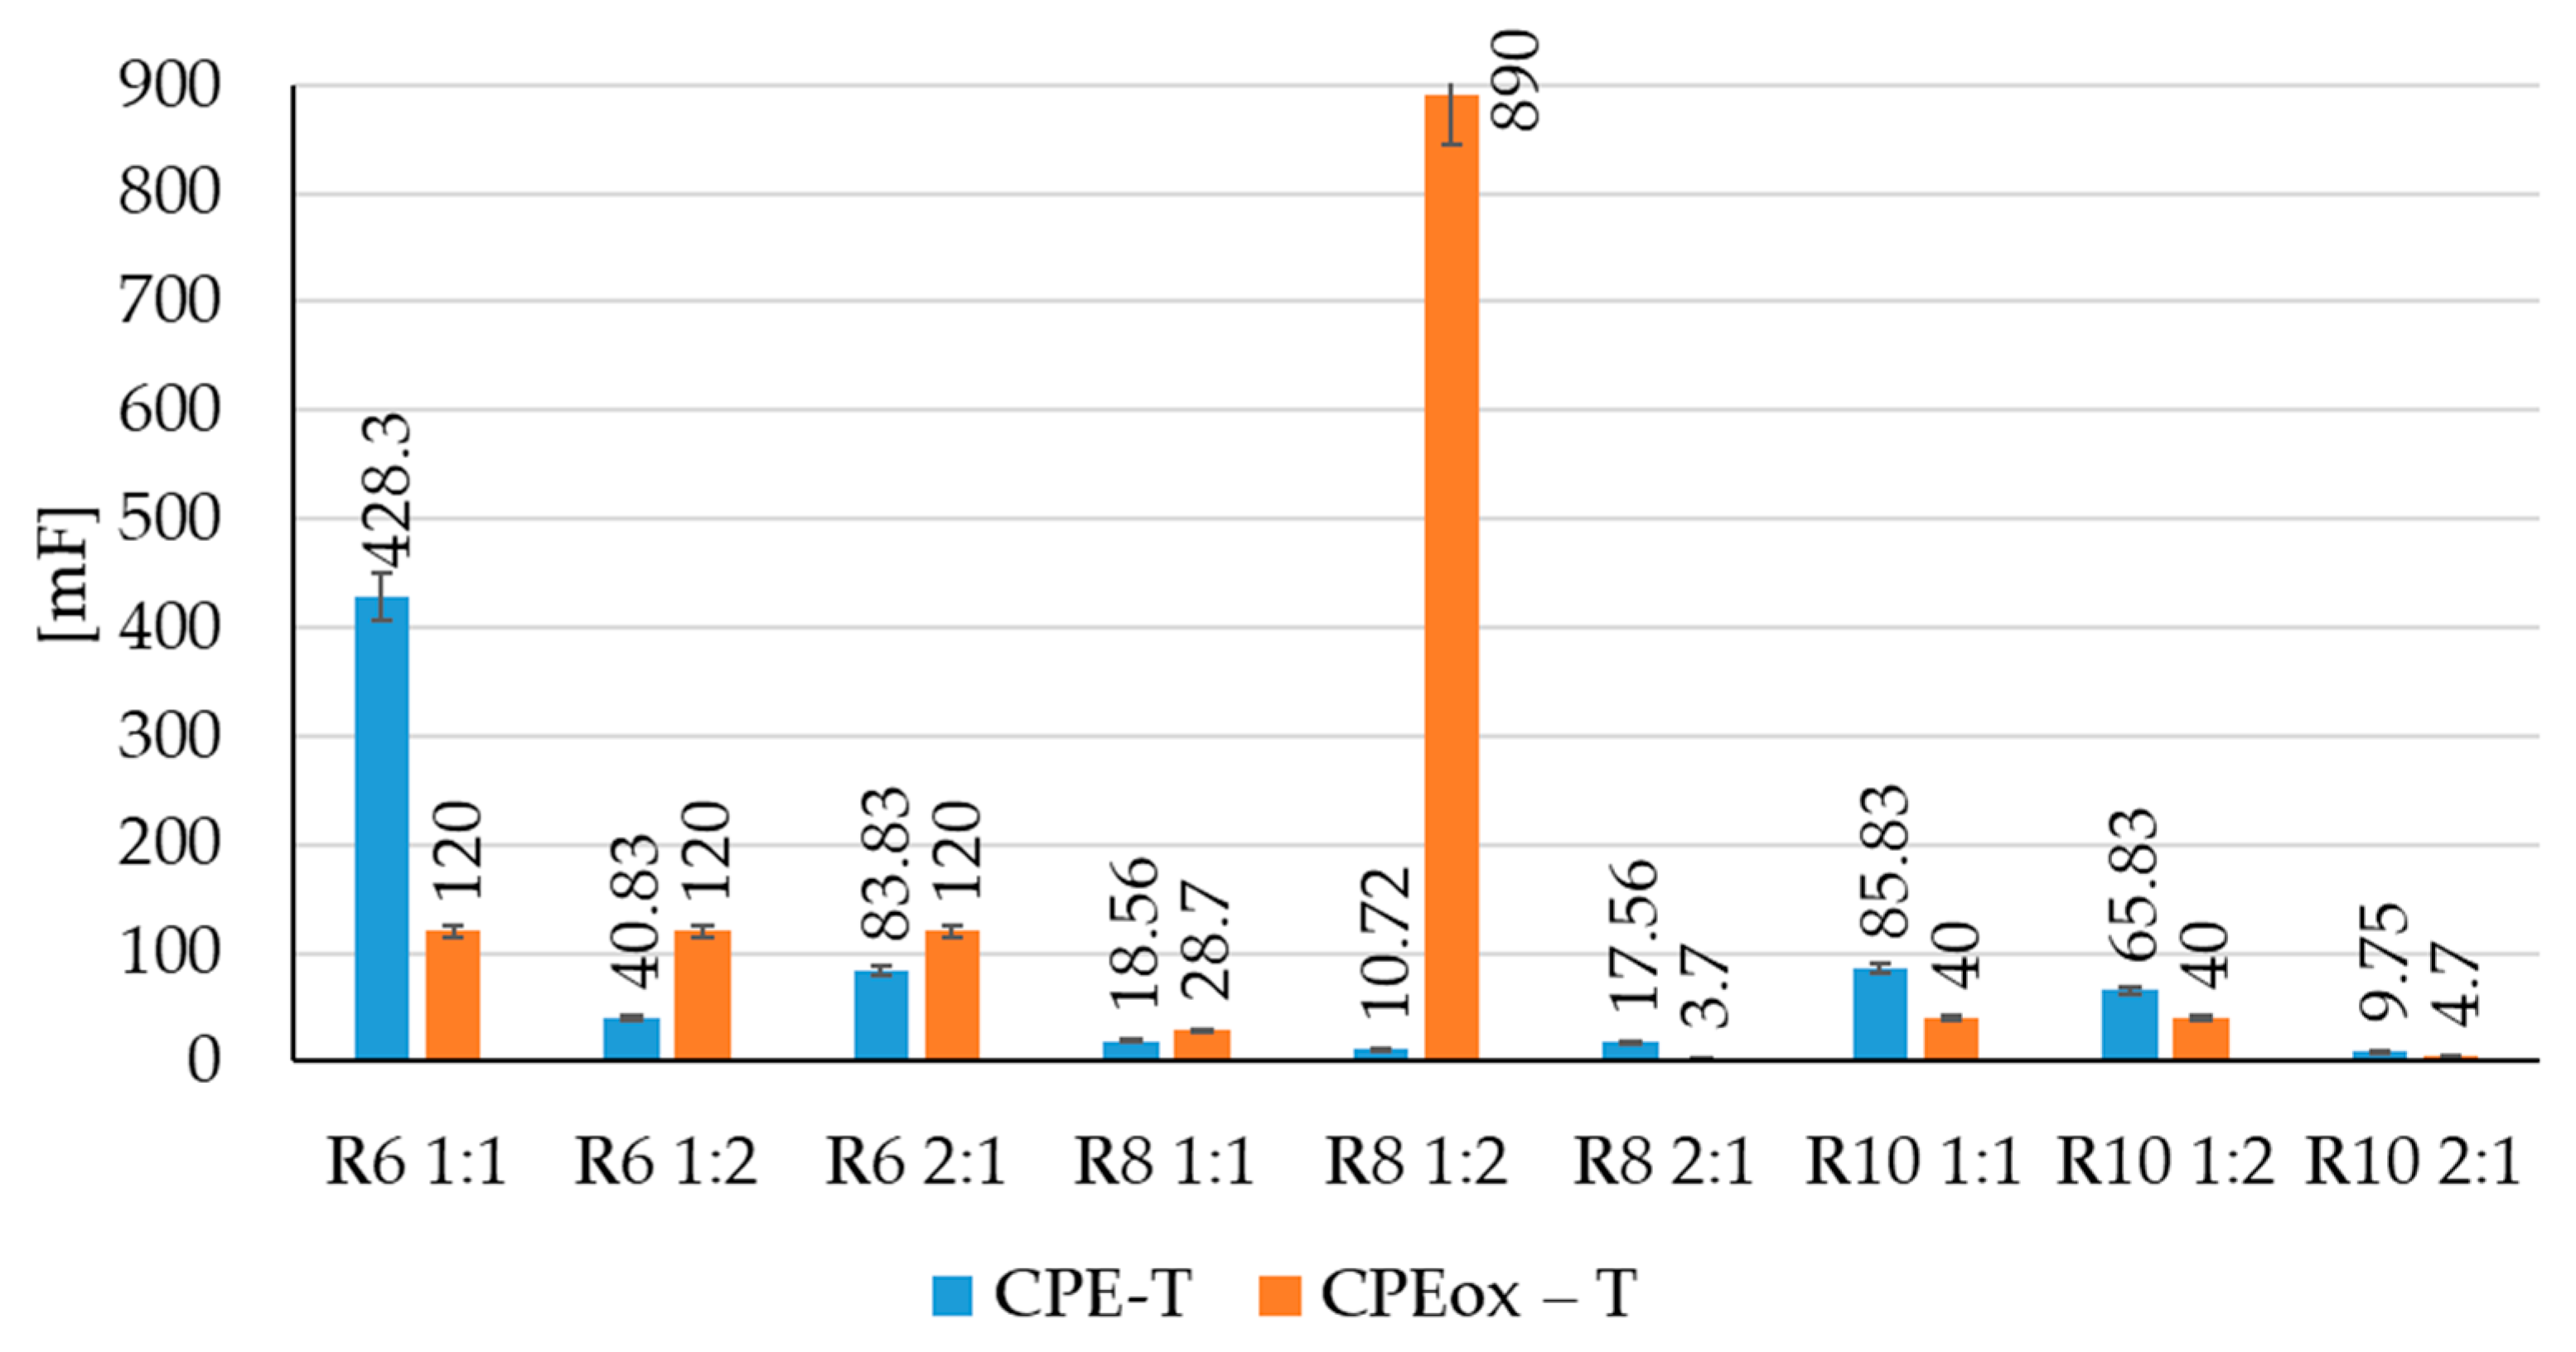
The equivalent circuit obtained using the Volta Master 4 Electrochemical Software and Z-View Software (version 3.4) for the electrochemical impedance spectra corresponding to the samples is shown in Figure 15, with the characteristic values presented in Table 6. The equivalent electrical circuit was determined to be consistent across all samples, indicating that the phenomenon is characterized by mass transfer. Figure 15b provides an illustrative example of the fitting process. Here, Rs represents the solution resistance, Rp represents the resistance of the oxide layer and the calcium oxychloride salts formed in the pores, Rox is the resistance induced by the presence of the "cloud" of iron ions released into the solution that screens the surface of the reinforcement (Figure 16), while CPE and CPEox are constant phase elements. CPE-T and CPEox-T have the dimensions of a capacitor whose plates are formed by the two surfaces of the oxide layer, respectively, from the iron ions near the reinforcement and the electrons left on the metal. The closer the CPE-P factor and CPEox-P are to unity, the more localized the electric charge is.
Using the relationship for the calculation of the capacitance of a parallel plate capacitor (C = ε0 * εr * S / d, where ε0 and εr are constants, S is the exposed surface area, and d is the thickness of the corrosion product layer dT, or the “cloud” of iron ions dTox), it can be qualitatively estimated that the thickness of the formed oxide layer and the “cloud” of released iron ions in the solution was inversely proportional to the capacitance (d~1/C). A qualitative estimate of the thickness of the corrosion product layer dT, respectively, the “cloud” of ions dTox, can be made in direct proportion to the values of the capacitive elements’ characteristic of the equivalent electrical circuits represented in Figure 16.
Based on the analysis of the circuit element values (Table 6) and Figure 14, Figure 15, Figure 16 and Figure 17, it is observed that although the corrosion current for samples R8 2:1 and R10 2:1 was low, this was attributed to the thickness of the “cloud” of iron ions that shielded the surface, thereby hindering the further release of iron ions. The thickness of the formed oxide layer was relatively small compared to the thickness of this iron ion cloud.
For the R6 samples (prepared using an alkaline activator based on NaOH solution with a molar concentration of 6 M), the thickness ratio of the oxide layer (dT) to the active zone layer (dTox), which reflects the extent of metal dissolution, was higher in the R6 1:2 sample. This indicates superior anticorrosive behavior in this sample.
Although the dT/dTox ratio was higher for sample R8 1:2, the resistance ratio of the oxide layer (Rp) to the active zone layer (Rox) was greater in sample R8 1:1. This suggests that the oxide layer in R8 1:1 was the most compact, and the metal dissolution zone was less electrochemically active compared to the other R8 samples (prepared using NaOH solution with a molar concentration of 8 M). Furthermore, preliminary research on geopolymer performance has indicated that the composition for sample R8–1:2 was among the most favorable for achieving a geopolymer with a highly homogeneous structure. This homogeneity facilitates uniform and consistently distributed geopolymerization reactions throughout the material mass, thereby significantly reducing the likelihood of unreacted material accumulating in isolated “islands.” The resultant structure was characterized by a compact morphology, accompanied by uniform porosity distribution. This porosity was further evidenced by its consistency across a range of physical and mechanical, chemical, and mineralogical indicators. This comprehensive homogeneity explains the observed variations in the recorded indicators for sample R8–1:2.
For all R10 samples (prepared with NaOH solution at 10 M), the dT/dTox ratio was below unity, and the Rp/Rox ratio was low, indicating that the oxide layer was porous and the metal dissolution zone exhibited high activity.
From the analysis of the equivalent circuit parameters for the studied samples, it can be concluded that the R8 1:1 sample exhibited the most compact and dense oxide layer, along with the lowest activity in the metal dissolution zone. Therefore, it demonstrated the best anticorrosive performance.

3.4. Analysis of the Geopolymer Reinforcement Interface After Experimental Testing Under Chloride-Induced Corrosive Conditions

Microscopic analysis of the geopolymer–steel reinforcement interface, following experimental testing using electrochemical methods, revealed, in accordance with the specialized literature [49], corrosion zones identified by the presence of corrosion products. These were observed as superficial and relatively continuous deposits, with few instances of localized (pitting) corrosion—typical of reinforcement corrosion in Portland cement-based concrete (Figure 18). As illustrated in Figure 18, the identification of corrosion products was accomplished through simple optical methodologies (i.e., microscopic evaluation), which were then corroborated by the theoretical aspects of iron corrosion. This approach enabled a qualitative assessment of the primary corrosion product while acknowledging the potential presence of other iron corrosion products.
The occurrence and extent of corrosion product zones were influenced by the characteristics of the geopolymer matrix. They were more pronounced in samples prepared using a 6 M NaOH solution and significantly reduced in those prepared with an 8 M NaOH solution.
From a durability standpoint, it can be suggested that geopolymer-reinforced systems offer a more advantageous alternative compared to traditional reinforced concrete. This hypothesis is based on a simple consideration: localized corrosion significantly reduces the cross-sectional area of the reinforcement in a specific region, creating a weak point within the structural element. In contrast, corrosion of equal total metal loss but distributed over a larger surface area results in a lesser reduction in cross-sectional area, thereby avoiding the formation of a pronounced weak spot. However, based on the results presented in this study, this hypothesis cannot be conclusively validated or invalidated. It has instead emerged throughout the experimental program as a consequence of microscopic observations and their correlation with the existing literature.

4. Conclusions

The aim of this study and its experimental program was to analyze the influence of the compositional design of the geopolymer binder—specifically, the Na2SiO3:NaOH ratio and the molar concentration of the NaOH solution used in preparing the alkaline activator—on the degree of protection it provides to embedded steel reinforcement under chloride-induced corrosion conditions.
A review of the scientific literature revealed numerous controversies and unresolved issues in the field, justifying the relevance of this research topic and highlighting its novelty and potential scientific contribution. However, due to the lack of direct porosity measurements for the geopolymer material, the research methodology was developed around two working hypotheses:
The compositional design of the geopolymer binder—Na2SiO3:NaOH ratio and NaOH solution molarity—influences the physical and mechanical characteristics of the geopolymer binder, which may serve as indirect indicators of porosity;
The porosity of the geopolymer matrix is a key factor influencing the level of corrosion protection it can provide to embedded steel reinforcement.
The experimental findings have demonstrated that geopolymer samples formulated with a Na2SiO3:NaOH ratio of 1:2 exhibit the highest apparent density. This density is further augmented with increasing NaOH molarity, suggesting that greater availability of NaOH promotes the formation of denser geopolymer matrices. This conclusion is substantiated by complementary analyses: microscopic examination revealed a reduction in pore size corresponding to increased NaOH concentration, while capillary water absorption tests indicated decreased water uptake. The latter signifies a reduction in open porosity and, consequently, enhanced resistance to chloride ion attack for embedded reinforcement. Furthermore, geopolymer binder formulation significantly impacted the mechanical performance, with a Na2SiO3:NaOH ratio of 1:2 consistently producing the highest tensile and compressive strengths. This is attributed to enhanced geopolymerization kinetics driven by increased NaOH availability, which in turn validates the initial hypothesis. Conversely, a 2:1 Na2SiO3:NaOH ratio was found to be unfavorable, notably evidenced by the formation of surface efflorescence.
Electrochemical analyses consistently demonstrated that geopolymer samples with a Na2SiO3:NaOH ratio of 1:2 exhibited the most favorable thermodynamic behavior, characterized by the lowest corrosion tendency; the R8 1:2 sample showed the optimal performance within this group. Kinetic investigations revealed that 8 M NaOH solutions yielded the most favorable corrosion kinetics, while 6 M NaOH solutions resulted in the least favorable, with observed current densities spanning from 0.72 to 102.7 µA/cm2. While the 1:2 ratio generally exhibited advantageous properties in terms of corrosion mechanisms, sample R8 1:1 demonstrated the highest oxide layer resistance, suggesting the presence of a denser and more compact protective layer. In contrast, 10 M NaOH samples were associated with porous oxide layers. A complementary microscopic examination of the geopolymer–reinforcement interface corroborated these findings, showing fewer and more uniformly distributed corrosion products in specimens prepared with a 1:2 Na2SiO3:NaOH ratio.
The correlation between the electrochemical and physical and mechanical experimental results indicates a partial consistency, suggesting that denser material structures generally correspond to diminished electrochemical corrosion indicators. This observation serves to validate the second working hypothesis, albeit with the important clarification that open porosity is not the sole determinant of corrosion resistance for embedded reinforcement in geopolymer matrices. It has been demonstrated that additional factors, such as the pH of the geopolymer matrix, which is directly influenced by raw material selection and binder compositional design, appear to significantly affect reinforcement behavior from initial embedding through the completion of geopolymerization reactions. This emphasizes a pivotal area for future research: the examination of reinforcement behavior from the initial contact with fresh geopolymer up to the complete geopolymerization process.

Author Contributions

Conceptualization, M.C. and A.H.; methodology, M.C., A.H. and H.V.; software, M.C., A.H. and C.F.; validation, M.C., A.-V.L., A.H. and H.V.; formal analysis, A.-V.L., A.H. and A.C.; investigation, M.C., A.-V.L., A.H., A.C., B.A.I., T.P.T. and C.F.; resources, A.-V.L. and A.H.; data curation, A.H., A.C. and C.F.; writing—original draft preparation, A.H.; writing—review and editing, M.C., A.-V.L. and H.V.; visualization, A.-V.L. and A.C.; supervision, M.C., A.H. and H.V.; project administration, M.C., A.-V.L., A.H., B.A.I. and T.P.T.; funding acquisition, A.-V.L. and A.H. All authors have read and agreed to the published version of the manuscript.

Funding

This research was funded by the Romanian Government Ministry of Research, Innovation and Digitalization, project No. PN 23 35 05 01, “Innovative sustainable solutions to implement emerging technologies with cross-cutting impact on local industries and the environment, and to facilitate technology transfer through the development of advanced, eco-smart composite materials in the context of sustainable development of the built environment”.

Institutional Review Board Statement

Not applicable.

Informed Consent Statement

Not applicable.

Data Availability Statement

Data is contained within the article.

Conflicts of Interest

The authors declare no conflict of interest.

References

  1. Gunasekara, C.; Law, D.; Bhuiyan, S.; Setunge, S.; Ward, L. Chloride Induced Corrosion in Different Fly Ash Based Geopolymer Concretes. Constr. Build. Mater. 2019, 200, 502–513. [Google Scholar] [CrossRef]
  2. Gartner, E. Industrially Interesting Approaches to Low-CO2 Cements. Cem. Concr. Res. 2004, 34, 1489–1498. [Google Scholar] [CrossRef]
  3. Meyer, C. The Greening of the Concrete Industry. Cem. Concr. Compos. 2009, 31, 601–605. [Google Scholar] [CrossRef]
  4. Chen, C.; Habert, G.; Bouzidi, Y.; Jullien, A. Environmental Impact of Cement Production: Detail of the Different Processes and Cement Plant Variability Evaluation. J. Clean. Prod. 2010, 18, 478–485. [Google Scholar] [CrossRef]
  5. Peng, J.; Liu, J.; Shen, L.; Dong, H.; Tan, H. Modeling of Carbon Dioxide Measurement on Cement Plants. Adv. Mater. Res. 2013, 610–613, 2120–2128. [Google Scholar] [CrossRef]
  6. Li, C.; Li, Y.; Guo, J.; Pang, Y. CO2 Emissions Due to Cement Manufacture. Mater. Sci. Forum 2011, 685, 181–187. [Google Scholar] [CrossRef]
  7. Huntzinger, D.N.; Eatmon, T.D. A Life-Cycle Assessment of Portland Cement Manufacturing: Comparing the Traditional Process with Alternative Technologies. J. Clean. Prod. 2009, 17, 668–675. [Google Scholar] [CrossRef]
  8. Mahasenan, N.; Smith, S.; Humphreys, K. The Cement Industry and Global Climate Change: Current and Potential Future Cement Industry CO2 Emissions. In Proceedings of the 6th International Conference on Greenhouse Gas Control Technologies, Kyoto, Japan, 1–4 October 2002; pp. 995–1000. [Google Scholar]
  9. Aïtcin, P.C. Cements of Yesterday and Today: Concrete of Tomorrow. Cem. Concr. Res. 2000, 30, 1349–1359. [Google Scholar] [CrossRef]
  10. Sandu, A.V. Obtaining and Characterization of New Materials. Materials 2021, 14, 6606. [Google Scholar] [CrossRef]
  11. Luhar, I.; Luhar, S.; Abdullah, M.M.A.B.; Razak, R.A.; Vizureanu, P.; Sandu, A.V.; Matasaru, P.D. A State-of-the-Art Review on Innovative Geopolymer Composites Designed for Water and Wastewater Treatment. Materials 2021, 14, 7456. [Google Scholar] [CrossRef]
  12. Burduhos Nergis, D.D.; Abdullah, M.M.A.B.; Sandu, A.V.; Vizureanu, P. XRD and TG-DTA Study of New Alkali Activated Materials Based on Fly Ash with Sand and Glass Powder. Materials 2020, 13, 343. [Google Scholar] [CrossRef] [PubMed]
  13. Jamaludin, L.; Razak, R.A.; Abdullah, M.M.; Vizureanu, P.; Bras, A.; Imjai, T.; Sandu, A.V.; Abd Rahim, S.Z.; Yong, H.C. The Suitability of Photocatalyst Precursor Materials in Geopolymer Coating Applications: A Review. Coatings 2022, 12, 1348. [Google Scholar] [CrossRef]
  14. Habert, G.; d’Espinose de Lacaillerie, J.B.; Roussel, N. An Environmental Evaluation of Geopolymer Based Concrete Production: Reviewing Current Research Trends. J. Clean. Prod. 2011, 19, 1229–1238. [Google Scholar] [CrossRef]
  15. Turner, L.K.; Collins, F.G. Carbon Dioxide Equivalent (CO2-e) Emissions: A Comparison between Geopolymer and OPC Cement Concrete. Constr. Build. Mater. 2013, 43, 125–130. [Google Scholar] [CrossRef]
  16. Junaid, M.T.; Kayali, O.; Khennane, A.; Black, J. A Mix Design Procedure for Low Calcium Alkali Activated Fly Ash-Based Concretes. Constr. Build. Mater. 2015, 79, 301–310. [Google Scholar] [CrossRef]
  17. Warid Wazien, A.Z.; Mustafa, M.; Abdullah, A.B.; Razak, R.A.; Rozainy, M.M.A.Z.R.; Faheem, M.; Tahir, M.; Faris, M.A. Review on Potential of Geopolymer for Concrete Repair and Rehabilitation. In Proceedings of the 2nd International Conference on Green Design and Manufacture 2016 (IConGDM 2016), Phuket, Thailand, 7 October 2016. [Google Scholar] [CrossRef]
  18. Nath, S.K.; Maitra, S.; Mukherjee, S.; Kumar, S. Microstructural and Morphological Evolution of Fly Ash based Geopolymers. Constr. Build. Mater. 2016, 111, 758–765. [Google Scholar] [CrossRef]
  19. Weil, M.; Dombrowski, K.; Buchwald, A. Life-Cycle Analysis of Geopolymers. In Geopolymers: Structures, Processing, Properties and Industrial Applications; Provis, J.L., Van Deventer, J.S.J., Eds.; Woodhead Publishing: Cambridge, UK, 2009; pp. 194–210. [Google Scholar]
  20. Figiela, B.; Šimonová, H.; Korniejenko, K. State of the Art, Challenges, and Emerging Trends: Geopolymer Composite Reinforced by Dispersed Steel Fibers. Rev. Adv. Mater. Sci. 2022, 61, 1–15. [Google Scholar] [CrossRef]
  21. Monticelli, C.; Natali, M.E.; Balbo, A.; Chiavari, C.; Zanotto, F.; Manzi, S.; Bignozzi, M.C. Corrosion Behavior of Steel in Alkali-Activated Fly Ash Mortars in the Light of Their Microstructural, Mechanical and Chemical Characterization. Cem. Concr. Res. 2016, 80, 60–68. [Google Scholar] [CrossRef]
  22. Alexander, M.; Thomas, M. Service Life Prediction and Performance Testing—Current Developments and Practical Applications. Cem. Concr. Res. 2015, 78, 155–164. [Google Scholar] [CrossRef]
  23. Glass, G.K.; Buenfeld, N.R. The Presentation of the Chloride Threshold Level for Corrosion of Steel in Concrete. Corros. Sci. 1997, 39, 1001–1013. [Google Scholar] [CrossRef]
  24. Badar, M.S.; Kupwade-Patil, K.; Elchalakani, M.; Nematollahi, B.; Sanjayan, J.G. Corrosion of Steel Bars Induced by Accelerated Carbonation in Low and High Calcium Fly Ash Geopolymer Concretes. Constr. Build. Mater. 2014, 61, 79–89. [Google Scholar] [CrossRef]
  25. Gunasekara, C.; Law, D.W.; Setunge, S. Long Term Permeation Properties of Different Fly Ash Geopolymer Concretes. Constr. Build. Mater. 2016, 124, 352–362. [Google Scholar] [CrossRef]
  26. Kupwade-Patil, K.; Allouche, E.N. Examination of Chloride-Induced Corrosion in Reinforced Geopolymer Concretes. J. Mater. Civ. Eng. 2012, 25, 1465–1476. [Google Scholar] [CrossRef]
  27. Ganesan, N.; Abraham, R.; Raj, S.D. Durability Characteristics of Steel Fibre Reinforced Geopolymer Concrete. Constr. Build. Mater. 2015, 93, 471–476. [Google Scholar] [CrossRef]
  28. Zhang, J.; Shi, C.; Zhang, Z.; Ou, Z. Durability of Alkali-Activated Materials in Aggressive Environments: A Review on Recent Studies. Constr. Build. Mater. 2017, 152, 598–613. [Google Scholar] [CrossRef]
  29. Nguyen, K.T.; Le, T.A.; Lee, K. Evaluation of the Mechanical Properties of Sea Sand-Based Geopolymer Concrete and the Corrosion of Embedded Steel Bar. Constr. Build. Mater. 2018, 169, 462–472. [Google Scholar] [CrossRef]
  30. Babaee, M.; Castel, A. Chloride-Induced Corrosion of Reinforcement in Low-Calcium Fly Ash-Based Geopolymer Concrete. Cem. Concr. Res. 2016, 88, 96–107. [Google Scholar] [CrossRef]
  31. Chaparro, W.A.; Ruiz, J.H.B.; Gómez, R.J.T. Corrosion of Reinforcing Bars Embedded in Alkali-Activated Slag Concrete Subjected to Chloride Attack. Mater. Res. 2012, 15, 57–62. [Google Scholar] [CrossRef]
  32. Noushini, A.; Castel, A. A Resistivity-Based Approach to Indicate Chloride Permeability of Geopolymer Concrete. In Proceedings of the Concrete Institute of Australia Conference, Melbourne, Australia, 2 September 2015. [Google Scholar]
  33. Olivia, M.; Nikraz, H. Durability of Fly Ash Geopolymer Concrete in a Seawater Environment. In Proceedings of the Concrete 2011 Conference, Perth, Australia, 12 October 2011. [Google Scholar]
  34. Fernández-Jiménez, A.; García-Lodeiro, I.; Palomo, A. Durability of Alkali-Activated Fly Ash Cementitious Materials. J. Mater. Sci. 2007, 42, 3055–3065. [Google Scholar] [CrossRef]
  35. Pasupathy, K.; Sanjayan, J.G.; Law, D.W.; Setunge, S.; Keerthiprasad, H.K.; Gunasekara, C. Durability of Low-Calcium Fly Ash-Based Geopolymer Concrete Culvert in a Saline Environment. Cem. Concr. Res. 2017, 100, 297–310. [Google Scholar] [CrossRef]
  36. Muntingh, Y. Durability and Diffusive Behaviour Evaluation of Geopolymeric Material. Ph.D. Thesis, University of Stellenbosch: Stellenbosch, South Africa, 2006. [Google Scholar]
  37. Lloyd, R.R.; Provis, J.L.; van Deventer, J.S.J. Pore Solution Composition and Alkali Diffusion in Inorganic Polymer Cement. Cem. Concr. Res. 2010, 40, 1386–1392. [Google Scholar] [CrossRef]
  38. Long, L.; Zhao, Y.; Lv, G.; Duan, Y.; Liu, X.; Jiang, X. Improving Stabilization/Solidification of Mswi Fly Ash with Coal Gangue Based Geopolymer via Increasing Active Calcium Content. Sci. Total Environ. 2023, 854, 158594. [Google Scholar] [CrossRef] [PubMed]
  39. Prusty, J.K.; Pradhan, B. Evaluation of Durability and Microstructure Evolution of Chloride Added Fly Ash and Fly Ash-Ggbs Based Geopolymer Concrete. Constr. Build. Mater. 2023, 401, 132925. [Google Scholar] [CrossRef]
  40. Maradani, L.S.R.; Pradhan, B. Evaluation of Electrochemical Behavior of Steel in Pore Solution of Geopolymer Concrete and Microstructural Characteristics Under Aggressive Environment, and Correlating with Geopolymerization Process. Constr. Build. Mater. 2025, 480, 141540. [Google Scholar] [CrossRef]
  41. Miranda, J.; Alarcón, M.; De Gutiérrez, R.; Delvasto, S. Corrosion Resistance in Activated Fly Ash Mortars. Cem. Concr. Res. 2005, 35, 1210–1217. [Google Scholar] [CrossRef]
  42. Osio-Norgaard, J.; Gevaudan, J.P.; Srubar, W.V. A Review of Chloride Transport in Alkali-Activated Cement Paste, Mortar, and Concrete. Constr. Build. Mater. 2018, 186, 191–206. [Google Scholar] [CrossRef]
  43. Bastidas, D.M.; Fernández-Jiménez, A.; Palomo, A.; González, J.A. A Study on the Passive State Stability of Steel Embedded in Activated Fly Ash Mortars. Corros. Sci. 2008, 50, 1058–1065. [Google Scholar] [CrossRef]
  44. Shaikh, F.U.A. Effects of Alkali Solutions on Corrosion Durability of Geopolymer Concrete. Adv. Concr. Constr. 2014, 2, 109–123. [Google Scholar] [CrossRef]
  45. Giner, J.B. Chloride and Carbonation Induced Corrosion of Steel in Fly Ash Geopolymer Pore Solution. Master’s Thesis, The University of Akron, Akron, OH, USA, 2021. [Google Scholar]
  46. Monticelli, C.; Criado, M.; Fajardo, S.; Bastidas, J.M.; Abbottoni, M.; Balbo, A. Corrosion Behavior of a Low Ni Austenitic Stainless Steel in Carbonated Chloride-Polluted Alkali-Activated Fly Ash Mortars. Cem. Concr. Res. 2014, 55, 49–58. [Google Scholar] [CrossRef]
  47. Criado, M.; Monticelli, C.; Fajardo, S.; Gelli, D.; Grassi, V.; Bastidas, J.M. Organic Corrosion Inhibitor Mixtures for Reinforcing Steel Embedded in Carbonated Alkali-Activated Fly Ash Mortar. Constr. Build. Mater. 2012, 35, 30–37. [Google Scholar] [CrossRef]
  48. Tittarelli, F.; Mobili, A.; Giosuè, C.; Belli, A.; Bellezze, T. Corrosion Behaviour of Bare and Galvanized Steel in Geopolymer and Ordinary Portland Cement Based Mortars with the Same Strength Class Exposed to Chlorides. Corros. Sci. 2018, 134, 64–77. [Google Scholar] [CrossRef]
  49. Mundra, S.; Criado, M.; Bernal, S.A.; Provis, J.L. Chloride-Induced Corrosion of Steel Rebars in Simulated Pore Solutions of Alkali-Activated Concretes. Cem. Concr. Res. 2017, 100, 385–397. [Google Scholar] [CrossRef]
  50. Mundra, S.; Bernal, S.A.; Provis, J.L. Chloride-Induced Corrosion of Steel in Alkali-Activated Cements: A Review. In Proceedings of the 71st RILEM Annual Week & ICACMS 2017, Chennai, India, 3–8 September 2017; pp. 147–154. [Google Scholar]
  51. Wan, X.; Cui, Y.; Jin, Z.; Gao, L. Chloride Transport and Related Influencing Factors of Alkali-Activated Materials: A Review. Materials 2023, 16, 3979. [Google Scholar] [CrossRef] [PubMed]
  52. Nuaklong, P.; Sata, V.; Chindaprasirt, P. Influence of Recycled Aggregate on Fly Ash Geopolymer Concrete Properties. J. Clean. Prod. 2016, 112, 2300–2307. [Google Scholar] [CrossRef]
  53. Nuaklong, P.; Sata, V.; Chindaprasirt, P. Properties of Metakaolin–High Calcium Fly Ash Geopolymer Concrete Containing Recycled Aggregate from Crushed Concrete Specimens. Constr. Build. Mater. 2018, 161, 365–373. [Google Scholar] [CrossRef]
  54. Winnefeld, F.; Leemann, A.; Lucuk, M.; Svoboda, P.; Neuroth, M. Assessment of Phase Formation in Alkali Activated Low and High Calcium Fly Ashes in Building Materials. Constr. Build. Mater. 2010, 24, 1086–1093. [Google Scholar] [CrossRef]
  55. Aldawsari, S. Mechanical, Microstructural, and Durability Characterization of Fly Ash/Slag-Based Geopolymer with Limited OPC and Different Alkaline Activator Ratios. Ph.D. Thesis, The Florida State University, Tallahassee, FL, USA, 2022. [Google Scholar]
  56. Chindaprasirt, P.; Chalee, W. Effect of Sodium Hydroxide Concentration on Chloride Penetration and Steel Corrosion of Fly Ash-Based Geopolymer Concrete under Marine Site. Constr. Build. Mater. 2014, 63, 303–310. [Google Scholar] [CrossRef]
  57. Fang, S.; Lam, E.S.S.; Li, B.; Wu, B. Effect of Alkali Contents, Moduli and Curing Time on Engineering Properties of Alkali Activated Slag. Constr. Build. Mater. 2020, 249, 118799. [Google Scholar] [CrossRef]
  58. Najimi, M.; Ghafoori, N.; Sharbaf, M. Alkali-Activated Natural Pozzolan/Slag Mortars: A Parametric Study. Constr. Build. Mater. 2018, 164, 625–643. [Google Scholar] [CrossRef]
  59. Tennakoon, C.; Shayan, A.; Sanjayan, J.G.; Xu, A. Chloride Ingress and Steel Corrosion in Geopolymer Concrete Based on Long Term Tests. Mater. Des. 2017, 116, 287–299. [Google Scholar] [CrossRef]
  60. Nath, S.K.; Kumar, S. Role of Particle Fineness on Engineering Properties and Microstructure of Fly Ash Derived Geopolymer. Constr. Build. Mater. 2020, 233, 117294. [Google Scholar] [CrossRef]
  61. Weng, L.; Sagoe-Crentsil, K.; Brown, T.; Song, S. Effects of Aluminates on the Formation of Geopolymers. Mater. Sci. Eng. B 2005, 117, 163–168. [Google Scholar] [CrossRef]
  62. Zhang, R.; Castel, A.; François, R. Influence of Steel–Concrete Interface Defects Owing to the Top-Bar Effect on the Chloride-Induced Corrosion of Reinforcement. Mag. Concr. Res. 2011, 63, 773–781. [Google Scholar] [CrossRef]
  63. Jiao, Z.; Li, X.; Yu, Q.; Yao, Q.; Guan, X.; Hu, P. Chloride Resistance of Class C/Class F Fly Ash-Based Geopolymer Mortars with Different Strength Grades. Case Stud. Constr. Mater. 2023, 18, e01811. [Google Scholar] [CrossRef]
  64. Rashad, A.M.; Zeedan, S.R. The Effect of Activator Concentration on the Residual Strength of Alkali-Activated Fly Ash Pastes Subjected to Thermal Load. Constr. Build. Mater. 2011, 25, 3098–3107. [Google Scholar] [CrossRef]
  65. Bernal, S.A. Effect of the Activator Dose on the Compressive Strength and Accelerated Carbonation Resistance of Alkali Silicate-Activated Slag/Metakaolin Blended Materials. Constr. Build. Mater. 2015, 98, 217–226. [Google Scholar] [CrossRef]
  66. Ismail, I.; Bernal, S.A.; Provis, J.L.; San Nicolas, R.; Brice, D.G.; Kilcullen, A.R.; Hamdan, S.; van Deventer, J.S.J. Influence of Fly Ash on the Water and Chloride Permeability of Alkali-Activated Slag Mortars and Concretes. Constr. Build. Mater. 2013, 48, 1187–1201. [Google Scholar] [CrossRef]
  67. Chen, R.; Hu, J.; Ma, Y.; Guo, W.; Huang, H.; Wei, J.; Yin, S.; Yu, Q. Characterization of the passive film formed on the reinforcement surface in alkali activated fly ash: Surface analysis and electrochemical evaluation. Corros. Sci. 2020, 165, 108393. [Google Scholar] [CrossRef]
  68. Tchakoute, H.K.; Elimbi, A.; Yanne, E.; Djangang, C.N. Utilization of Volcanic Ashes for the Production of Geopolymers Cured at Ambient Temperature. Cem. Concr. Compos. 2013, 38, 75–81. [Google Scholar] [CrossRef]
  69. Criado, M.; Fernández-Jiménez, A.; De la Torre, A.G.; Aranda, M.A.G.; Palomo, A. An XRD Study of the Effect of the SiO2/Na2O Ratio on the Alkali Activation of Fly Ash. Cem. Concr. Res. 2007, 37, 671–679. [Google Scholar] [CrossRef]
  70. Criado, M.; Martínez-Ramírez, S.; Fajardo, S.; Gómez, P.P.; Bastidas, J.M. Corrosion Rate and Corrosion Product Characterisation Using Raman Spectroscopy for Steel Embedded in Chloride Polluted Fly Ash Mortar. Mater. Corros. 2013, 64, 372–380. [Google Scholar] [CrossRef]
  71. Duxson, P.; Provis, J.L.; Lukey, G.C.; Mallicoat, S.W.; Kriven, W.M.; van Deventer, J.S.J. Understanding the Relationship between Geopolymer Composition, Microstructure and Mechanical Properties. Colloids Surf. A Physicochem. Eng. Asp. 2005, 269, 47–58. [Google Scholar] [CrossRef]
  72. Fernández-Jiménez, A.; Miranda, J.M.; González, J.A.; Palomo, A. Steel Passive State Stability in Activated Fly Ash Mortars. Mater. Constr. 2010, 60, 51–65. [Google Scholar] [CrossRef]
  73. Navarro, R.; Alcocel, E.G.; Sánchez, I.; Garcés, P.; Zornoza, E. Corrosion Resistance of Steel Reinforcements Embedded in Alkali Activated Ground Granulated SiMn Slag Mortars. Constr. Build. Mater. 2020, 230, 116917. [Google Scholar] [CrossRef]
  74. Bernal, S.A.; Provis, J.L. Durability of Alkali-Activated Materials: Progress and Perspectives. J. Am. Ceram. Soc. 2014, 97, 997–1008. [Google Scholar] [CrossRef]
  75. Zhang, X.; Long, K.; Liu, W.; Li, L.; Long, W.J. Carbonation and Chloride Ions’ Penetration of Alkali-Activated Materials: A Review. Molecules 2020, 25, 5074. [Google Scholar] [CrossRef]
  76. Criado, M.; Sobrados, I.; Bastidas, J.M.; Sanz, J. Corrosion Behaviour of Coated Steel Rebars in Carbonated and Chloride-Contaminated Alkali-Activated Fly Ash Mortar. Prog. Org. Coat. 2016, 99, 11–22. [Google Scholar] [CrossRef]
  77. Tan, B.; Liu, Y.; Zhao, W.; Gong, Z.; Li, X.; Li, W.; Li, X.; Guo, L.; Zhang, W.; Zhao, S.; et al. Insight into Anti-Corrosion Mechanism of Copper in 0.5 M Sulfuric Acid Solution Via Microwave-Assisted Synthesis of Carbon Quantum Dots as Novel Inhibitors. Sustain. Mater. Technol. 2025, 43, e01305. [Google Scholar] [CrossRef]
  78. Tan, B.; Ren, H.; Yin, C.; Li, X.; Li, X.; Wang, R.; Guo, L.; Zhang, Y.; Al-Sadoon, M.K. Nepeta cataria L. Leaf Extracts as Eco-Conscious Corrosion Inhibitor for Copper in H2so4 Medium. Colloids Surf. A Physicochem. Eng. Asp. 2025, 711, 136399. [Google Scholar] [CrossRef]
  79. Tan, B.; Ren, H.; Zhang, R.; Wang, R.; Ma, L.; Li, X.; Li, W.; Guo, L.; Al-Sadoon, M.K. A Novel Corrosion Inhibitor for Copper in Sulfuric Acid Media: Complexation of Iodide Ions with Benincasa Hispida Leaf Extract. Colloids Surf. A Physicochem. Eng. Asp. 2025, 705, 135710. [Google Scholar] [CrossRef]
  80. Tan, B.; Ren, H.; Liu, Y.; Li, X.; Wang, R.; Sun, J.; Cao, X.; Dai, Q.; Guo, L.; Liu, H.; et al. Insight into the Anti-Corrosion Performance of Crop Waste as a Degradable Corrosion Inhibitor for Copper in Sulfuric Acid Medium. Ind. Crops Prod. 2024, 222, 119654. [Google Scholar] [CrossRef]
  81. Shaharudin, F.S.; Zainal, F.F.; Hayazi, N.F.; Parimin, N.; Nadzri, N.I.M.; Hastuty, S.; Kusbiantoro, A. Investigation of Corrosion Behaviour of Mild Steel Embedded in Geopolymer Paste with Curing and Non-Curing Process. Arch. Metall. Mater. 2023, 68, 1603–1607. [Google Scholar] [CrossRef]
  82. Zainal, F.F.; Amli, S.F.M.; Hussin, K.; Rahmat, A.; Abdullah, M.M.A.B. Corrosion Studies of Fly Ash and Fly Ash-Slag Based Geopolymer. IOP Conf. Ser. Mater. Sci. Eng. 2017, 209, 012026. [Google Scholar] [CrossRef]
  83. ASTM C876-09; Standard Test Method for Corrosion Potentials of Uncoated Reinforcing Steel in Concrete. ASTM International: West Conshohocken, PA, USA, 2009.
  84. Hardjito, D.; Rangan, B.V. Development and Properties of Low-Calcium Fly Ash-Based Geopolymer Concrete; Research Report GC 1; Curtin University of Technology: Perth, Australia, 2005. [Google Scholar]
  85. Lăzărescu, A.-V.; Hegyi, A.; Csapai, A.; Popa, F. The Influence of Different Aggregates on the Physico-Mechanical Performance of Alkali-Activated Geopolymer Composites Produced Using Romanian Fly Ash. Materials 2024, 17, 485. [Google Scholar] [CrossRef]
  86. Hamidi, R.M.; Man, Z.; Azizli, K.A. Concentration of NaOH and the Effect on the Properties of Fly Ash Based Geopolymer. Proc. Eng. 2016, 148, 189–193. [Google Scholar] [CrossRef]
  87. Rovnaník, P. Effect of Curing Temperature on the Development of Hard Structure of Metakaolin-Based Geopolymer. Constr. Build. Mater. 2010, 24, 1176–1183. [Google Scholar] [CrossRef]
  88. Temuujin, J.; Williams, R. Effect of Mechanical Activation of Fly Ash on the Properties of Geopolymer Cured at Ambient Temperature. J. Mater. Process. Technol. 2009, 209, 5276–5280. [Google Scholar] [CrossRef]
  89. Zhao, R.; Sanjayan, J.G.; Collins, F. Effect of Sodium Silicate on Efflorescence Formation and Strength of Geopolymers. Cem. Concr. Compos. 2014, 57, 15–22. [Google Scholar]
  90. Birnin-Yauri, U.A.; Garba, S. The Effect and Mechanism of Chloride Ion Attack on Portland Cement Concrete and the Structural Steel Reinforcement. Ife J. Sci. 2006, 8, 131–134. [Google Scholar] [CrossRef]
  91. Singh, D.D.N.; Yadav, S.; Saha, J.K. Role of Climatic Conditions on Corrosion Characteristics of Structural Steels. Corros. Sci. 2008, 50, 93–110. [Google Scholar] [CrossRef]
  92. Zhao, W.; Zhao, J.; Zhang, S.; Yang, J. Application of Electrochemical Impedance Spectroscopy to Evaluate the Corrosion Behavior of 2304 Duplex Stainless Steel Reinforced Rebar in Concrete Exposed in Chloride-Rich Environment. Int. J. Electrochem. Sci. 2019, 14, 8039–8047. [Google Scholar] [CrossRef]
  93. Guitián, B.; Nóvoa, X.R.; Puga, B. Electrochemical Impedance Spectroscopy as a Tool for Materials Selection: Water for haemodialysis. Electrochim. Acta 2011, 56, 7772–7779. [Google Scholar] [CrossRef]
  94. Maeda, M.; Li, X.; Ooi, A.; Tada, E.; Nishikata, A. Passivation Mechanism of Galvanized Steel Rebar in Fresh Concrete. ISIJ Int. 2020, 60, 337–345. [Google Scholar] [CrossRef]
  95. Hoshi, Y.; Watanabe, S.; Tokieda, H.; Shitanda, I.; Itagaki, M. Evaluation of Chloride Ion Concentration and Ph on Depassivation of Steel Rebar in Concrete Investigated by Electrochemical Impedance Measurement of Probe Electrodes. Mater. Trans. 2021, 62, 655–660. [Google Scholar] [CrossRef]
  96. Kocijan, A.; Merl, D.K.; Jenko, M. The Corrosion Behaviour of Austenitic and Duplex Stainless Steels in Artificial Saliva with the Addition of Fluoride. Corros. Sci. 2011, 53, 776–783. [Google Scholar] [CrossRef]
  97. Luo, H.; Dong, C.F.; Xiao, K.; Li, X.G. Characterization of Passive Film on 2205 Duplex Stainless Steel in Sodium Thiosulphate Solution. Appl. Surf. Sci. 2011, 258, 631–639. [Google Scholar] [CrossRef]
  98. Abdo, H.S.; Seikh, A.H.; Mohammed, J.A.; Luqman, M.; Ragab, S.A.; Almotairy, S.M. Influence of Chloride Ions on Elec-Trochemical Corrosion Behavior of Dual-Phase Steel over Conventional Rebar in Pore Solution. Appl. Sci. 2020, 10, 4568. [Google Scholar] [CrossRef]
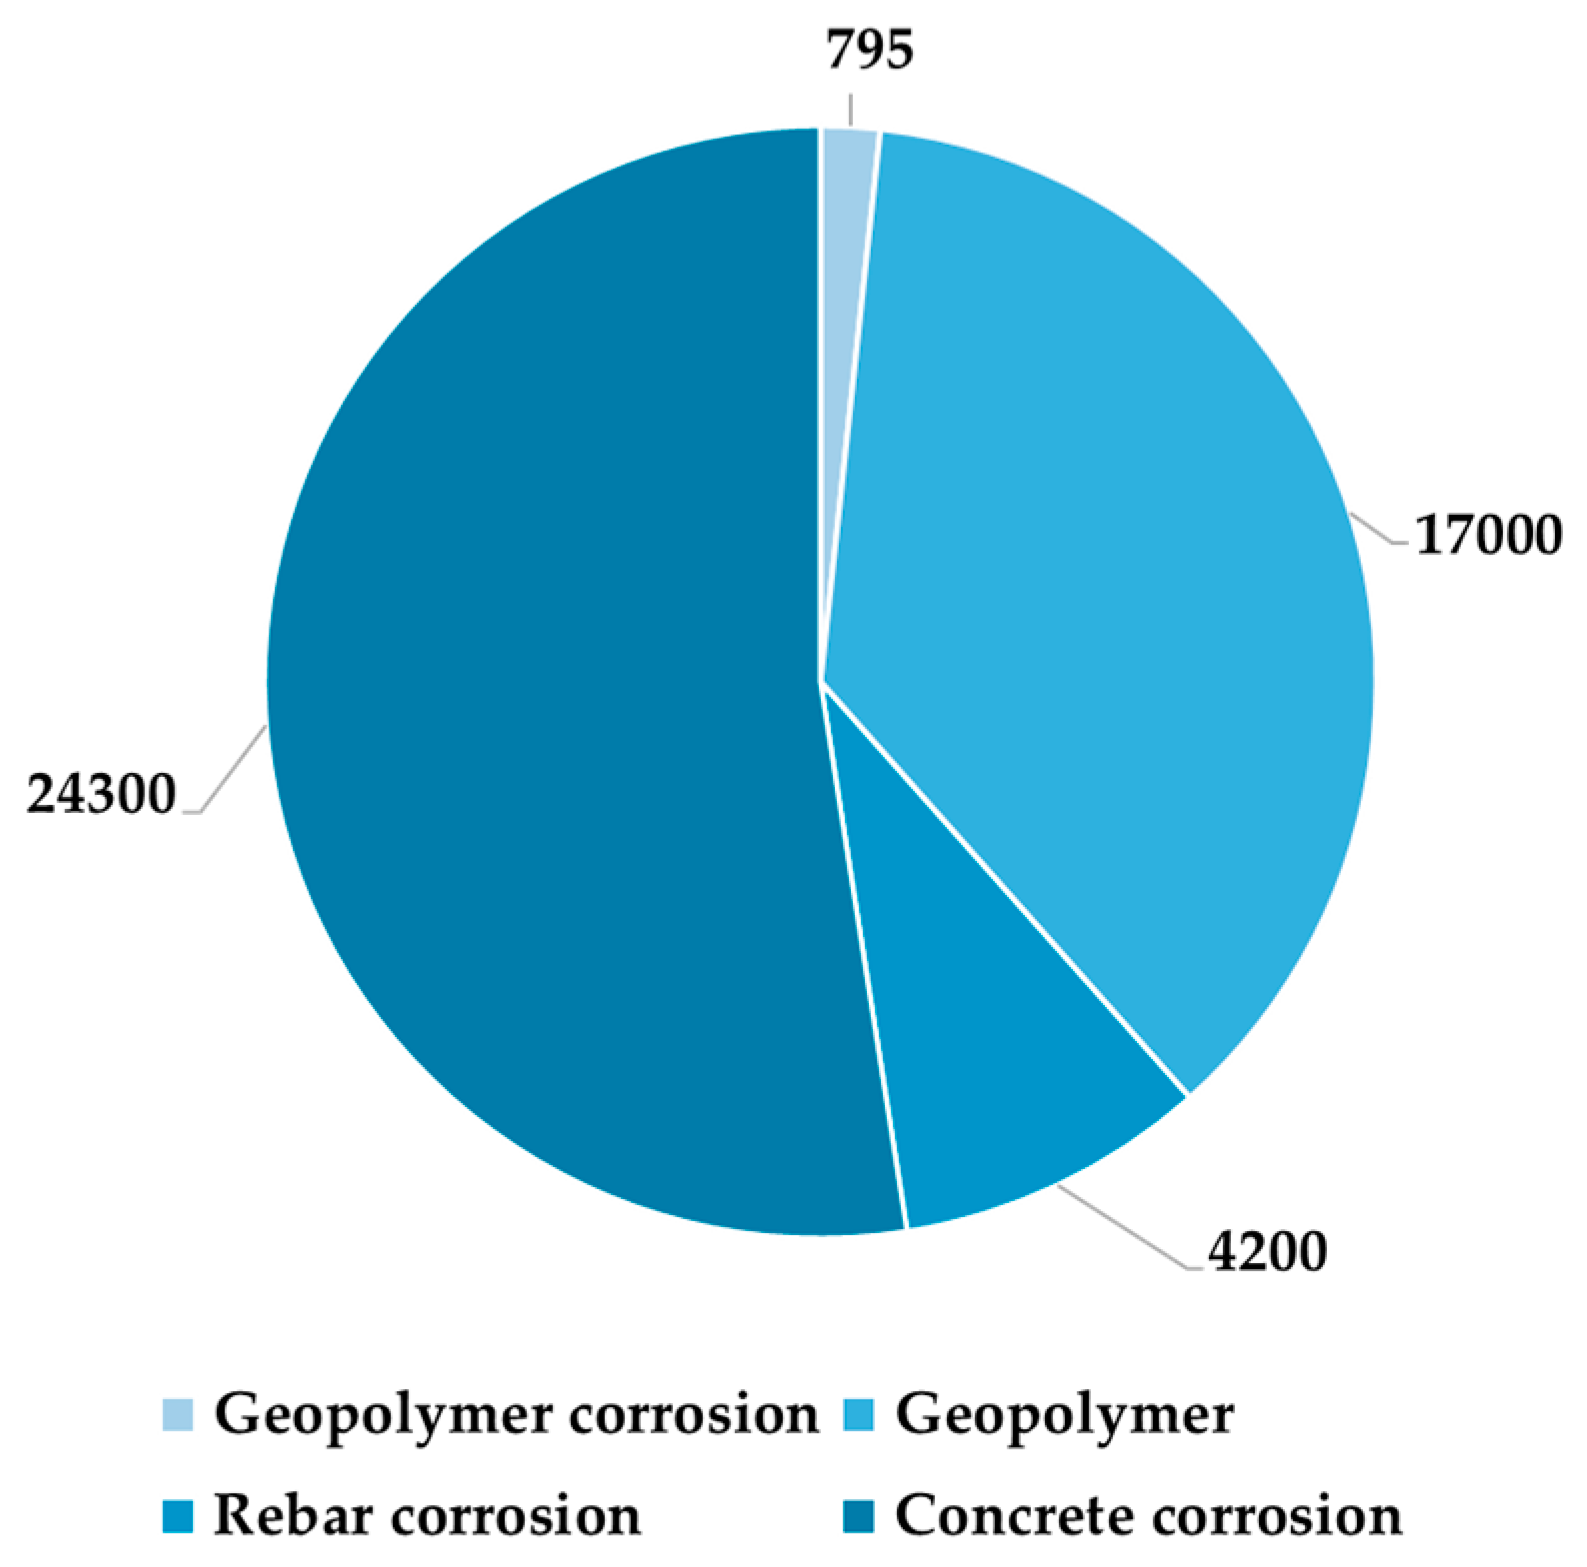
Figure 1. Distribution of research publications on corrosion topics, based on the following search terms: “geopolymer corrosion”, “geopolymer”, “rebar corrosion”, and “concrete corrosion”.
Coatings 15 00734 g001
Figure 2. Schematic representation of the experimental research methodology for the evaluation of the corrosion behavior of geopolymer-binder-embedded reinforcement.
Coatings 15 00734 g002
Figure 3. Particle size distribution of fly ash.
Coatings 15 00734 g003
Figure 4. Distribution density of fly ash.
Coatings 15 00734 g004
Figure 5. Screenshot of XRD spectra for the fly ash powder [84].
Coatings 15 00734 g005
Figure 6. Schematic representation of the preparation of the alkali-activated geopolymer samples.
Coatings 15 00734 g006
Figure 7. Graphical representation of the variation in apparent density as a function of NaOH molar concentration and Na2SiO3/NaOH ratio.
Coatings 15 00734 g007
Figure 8. Optical microscopy images (4×) for geopolymer binder: (a) R6 1:2, (b) R8 1:2 and (c) R10: 1:2.
Coatings 15 00734 g008
Figure 9. Graphical representation of the mechanical strength of the alkali-activated geopolymer samples: (a) flexural strength and (b) compressive strength.
Coatings 15 00734 g009
Figure 10. Graphical representation of the capillary water absorption of the alkali-activated geopolymer samples.
Coatings 15 00734 g010
Figure 11. Illustrative images of efflorescence formation on the surface of specimens prepared with alkaline activator Na2SiO3:NaOH = 2:1, R10 2:1: (a,b) prismatic samples; (c) microscopic assessment.
Coatings 15 00734 g011
Figure 12. Open-circuit potential (OCP) evolution diagrams for all analyzed samples (a) showing the influence of the concentration of NaOH solution used for the preparation of the alkaline activator: (b) 6 M, (c) 8 M and (d) 10 M.
Coatings 15 00734 g012aCoatings 15 00734 g012b
Figure 13. Linear polarization diagrams in Tafel interpretation for: (a) all samples; (b) samples prepared with a 6 M NaOH solution; (c) prepared with a 8 M NaOH solution; (d) prepared with a 10M NaOH solution.
Coatings 15 00734 g013
Figure 14. EIS diagrams in Nyquist representation for: (a) all samples; (b) samples prepared with a 6 M NaOH solution; (c) prepared with a 8 M NaOH solution; (d) prepared with a 10M NaOH solution.
Coatings 15 00734 g014
Figure 15. (a) Equivalent circuit for interpreting EIS plots corresponding to samples; (b) Example of the equivalent circuit fitting for the EIS data validation.
Coatings 15 00734 g015
Figure 16. Schematic representation of the formation in the pores of the geopolymer at the interface with the reinforcement of the “cloud” of iron ions in the active zone of metal dissolution and the oxide layer in the adjacent zone.
Coatings 15 00734 g016
Figure 17. The values of the capacitive elements in the equivalent electrical circuit corresponding to the corrosion product layer and the “cloud” of ions serve as qualitative indicators for assessing the thickness of the formed corrosion product layer and the extent of the iron ion “cloud” released into the pore solution of the geopolymer matrix.
Coatings 15 00734 g017
Figure 18. Example of optical microscopy images of the appearance of the reinforcement or reinforcement–geopolymer interface area: (a) corrosion on R6 1:1 geopolymer after removal of the reinforcement; (b) corrosion on R6 1:1 geopolymer after removal of the reinforcement; (c) R8 2:1 geopolymer embedded reinforcement surface.
Coatings 15 00734 g018
Table 1. ASTM C876-09 criteria for reinforcement corrosion risk, based on recorded corrosion potential [83].
Cu/CuSO4Ag/AgClSHESCECorrosion Condition
>−200 mV>−100 mV+120 mV>−80 mVLow (10% risk of corrosion)
−200 to −350 mV−100 to −250 mV+1200 to −30 mV−80 to −230 mVIntermediate corrosion risk
<−350 mV<−250 mV<−30 mV<−230 mVHigh (>90% risk of corrosion
<−500 mV<−400 mV<−180 mV<−380 mVSevere corrosion
Table 2. Corrosion stage of steel reinforcement in concrete, according to ASTM C876-09 [83].
Corrosion Current [µA/cm2]Corrosion Rate [µm/year]Corrosion Stage of the Reinforcement
<0.1<1.17Passive
0.1–0.51.17–5.85Low
0.5–1.05.85–11.7Moderate
>1.0>11.7High
Table 3. Fly ash chemical composition.
Oxide
Composition
(%)
SiO2Al2O3Fe2O3CaOMgOSO3Na2OK2OP2O5
46.9423.8310.0810.722.630.450.621.650.25
TiO2Cr2O3Mn2O3ZnOSrOCO2L.O.I.SiO2+Al2O3
0.920.020.060.020.03-2.1170.77
R0.04531.40
Table 4. Mix design ratio of the alkali-activated geopolymer samples.
Geopolymer Mixture CodeR6 1:1R6 1:2R6 2:1R8 1:1R8 1:2R8 2:1R10 1:1R10 1:2R10 2:1
NaOH solution molar concentration (M)6810
Na2SiO3/NaOH ratio1:11:22:11:11:22:11:11:22:1
Alkaline activator to fly ash ratio (mass)0.95
Table 5. Indicators of the kinetics of the corrosion process under the action of chlorine ions for steel reinforcement embedded in geopolymer.
SampleE (i = 0)
(mV)
Rp
(Ωcm2)
icor
(μA/cm2)
βa
(mV)
βc
(mV)
vcorr
(μm/Y)
R6–1:1−928.3236.62101.2298.5−88.31184
R6–1:2−823.1467.7339.4259.9−67.0461.3
R6–2:1−874.3220.97102.7267.5−87.01201
R8–1:1−484.8287000.72110.9−117.98.43
R8–1:2−726.651604.2563.5−69.246.6
R8–2:1−565.1150702.2143.5−151.726.1
R10–1:1−880.0348.2141.7175.8−55.4487.5
R10–1:2−871.9804.7123.5310.7−65.7275.3
R10–2:1−613.1212601.1159.3−193.912.9
Table 6. Circuit element values corresponding to the equivalent circuit.
SampleRs (Ω)CPE-T (mF)CPE-PRp (Ω)Rox (Ω)CPEox-T (mF)CPEox-P
R6–1:122428.30.6599550020001200.2939
R6–1:22940.830.5599950020001200.2939
R6–2:12383.830.4599950020001200.2939
R8–1:16418.560.5899850020028.70.5839
R8–1:25310.720.68991250010008900.7839
R8–2:125117.560.589925006003.70.6839
R10–1:12585.830.759988001800400.5939
R10–1:210565.830.785988001800400.5939
R10–2:11349.750.7899550014004.70.5839
Rs—solution polarization resistance, Rp—polarization resistance of the armature, Rox—oxide layer polarization resistance CPE-T—dimension of the capacitor corresponding to the armature, CPE-P—characterization factor for the CPE, CPEox-T—dimension of the oxide layer formed, CPEox-P—characterization factor for the CPEox.
Disclaimer/Publisher’s Note: The statements, opinions and data contained in all publications are solely those of the individual author(s) and contributor(s) and not of MDPI and/or the editor(s). MDPI and/or the editor(s) disclaim responsibility for any injury to people or property resulting from any ideas, methods, instructions or products referred to in the content.