Article

Investigation of Superhydrophobic, Drag-Reducing and Anti-Icing Properties of Swimming Goggles

1
Department of Physical Education, Civil Aviation Flight University of China, Guanghan 618307, China
2
College of Physical Education, South China University of Technology, Guangzhou 510641, China
3
College of Civil Aviation Safety Engineering, Civil Aviation Flight University of China, Guanghan 618307, China
4
Department of Aerospace Medicine, Air Force Military Medical University, Xi’an 710038, China
*
Author to whom correspondence should be addressed.
These authors contributed equally to this work.
Coatings 2025, 15(6), 664; https://doi.org/10.3390/coatings15060664
Submission received: 11 April 2025 / Revised: 17 May 2025 / Accepted: 26 May 2025 / Published: 30 May 2025

Abstract

Swimming goggles still face numerous challenges in practical use, including deterioration and failure of anti-fog coatings, residual water marks on lens surfaces, and relatively short service life in complex environments. When swimming outdoors during winter, goggles also present an icing problem. To address these problems and enhance the performance of swimming goggles, this study employs a combination of plasma cleaning and mechanical spraying methods, utilizing HB-139 SiO2 to modify the surface of goggle lenses, thereby fabricating lenses with superhydrophobic properties. The changes in lens surfaces before and after friction and immersion treatments were characterized using three-dimensional profilometry and scanning electron microscopy, further investigating the hydrophobic, drag-reducing, wear-resistant, and anti-icing properties of the lenses. Experimental results demonstrate that SiO2 can enhance the hydrophobic, drag-reducing, durability, and anti-icing performance of the lenses. Under standard conditions, the contact angle of modified samples reached 162.33 ± 3.15°, representing a 48.77 ± 2.15% improvement over original samples. Under friction conditions, modified samples exhibited a 45.86 ± 2.53% increase in contact angle compared to original samples, with Sa values decreasing by 58.64 ± 3.21%. Under immersion conditions, modified samples showed a 54.37 ± 2.44% increase in contact angle relative to original samples. The modified samples demonstrated excellent droplet bouncing performance at temperatures of −10 °C, 10 °C, and 30 °C. De-icing efficiency improved by 14.94 ± 2.37%. Throughout the experimental process, SiO2 demonstrated exceptional hydrophobic, drag-reducing, durability, and anti-icing capabilities. This establishes a robust foundation for the exemplary performance of swimming goggles in both training and competitive contexts.

1. Introduction

Polycarbonate, abbreviated as PC with the chemical formula (C15H16O2)n, is a high-performance thermoplastic material [1]. Due to its excellent impact resistance, lightweight characteristics, and transparency, it has been widely adopted across numerous fields, with sporting equipment being a notable application [2,3,4,5]. Among the most common implementations are swimming goggles and protective eyewear for water and ice sports [6]. The evolution of athletic equipment generally represents an extension of developments in the sports themselves [7,8,9]. The progression of swimming as a competitive discipline has similarly propelled advancements in related swimming apparatus, particularly in the design and functionality of swimming goggles [10,11]. Swimming goggles first appeared approximately in the 14th century, when polished turtle shells were fashioned into thin slices and strung together with cords, constituting the rudimentary prototype of modern swimming goggles. Following the commencement of mass production of polycarbonate in 1953, this material progressively supplanted glass as the predominant constituent of swimming goggle lenses. While swimming goggles currently enjoy widespread application, they continue to exhibit certain deficiencies. The waterproof coating on many goggles deteriorates during usage, the lenses are susceptible to abrasion, and water residue accumulates on the lenses as users repeatedly enter and exit aquatic environments, thereby compromising visibility. Outdoor swimming facilities typically contain water of inferior quality, characterized by substantial concentrations of Cl, ClO, NH3+, urea, dust, and various contaminants, while being subjected to prolonged direct solar radiation—environmental conditions that significantly diminish lens durability. In response to these challenges, researchers have conducted several investigations. Jesús et al. examined the impact of swimming goggles on ocular tear film [12]. Ye et al. investigated the anti-fogging properties of medical protective eyewear [13,14]. Ding et al. fabricated super-hydrophobic racket handles utilizing SiO2. The surface contact Angle reached 152.54° [15]. Guo et al. explored methodologies for ice prevention and removal on glass surfaces [16]. Nevertheless, research simultaneously addressing the enhancement of super-hydrophobicity, durability, drag reduction, and anti-icing capabilities in swimming goggles remains scarce. Consequently, the development of swimming goggles concurrently exhibiting super-hydrophobic, durable, drag-reducing, and anti-icing properties holds substantial significance.
The physicochemical properties of SiO2 are stable, with a relatively high melting point (1723 °C) and boiling point (2230 °C) [17,18]. Silicon dioxide demonstrates exceptional chemical resistance to most reagents; under standard temperature and pressure conditions, it exhibits negligible water solubility and remains chemically inert in aqueous environments, rendering it the preferred material for superhydrophobic applications. Superhydrophobic materials primarily composed of SiO2 manifest excellent self-cleaning capabilities and directional liquid transport properties. These characteristics have facilitated their widespread adoption across multiple domains, including anti-fouling coatings, microfluidic devices, and environmental protection technologies [19,20,21,22,23]. The distinctive surface properties of these materials confer superior performance in practical applications. Li et al. developed a superhydrophobic composite coating on basalt fiber fabrics through spray deposition and thermal curing methodologies. The resultant coating exhibited exceptional water repellency, ice-phobic properties, and remarkable mechanical durability [24]. He et al. reported a triple-conversion strategy inspired by superhydrophobicity, photothermal conversion, and electrothermal conversion, yielding an all-weather, highly efficient, low-energy anti-icing surface comprising hydrophobic group-inspired superhydrophobic domains. The optimized anti-icing surface demonstrated exceptional efficiency in ice repellency, delayed freezing, ice prevention, and de-icing functionalities [25]. In additional work, He employed spray deposition techniques utilizing micro/nanoscale graphite to construct coating microstructures, while incorporating PDMS as a binding agent to enhance the durability of the superhydrophobic architecture. The fabricated superhydrophobic coating exhibited favorable electrical conductivity concurrent with substantial mechanical stability and chemical resistance [26]. Zhang et al. prepared composite superhydrophobic surfaces on glass substrates via wet chemical etching processes. These robust, UV-resistant, and self-cleaning superhydrophobic glass surfaces effectively address efficiency degradation in solar cells resulting from dust accumulation [27]. Wang et al. manufactured superhydrophobic surfaces using femtosecond laser ablation coupled with chemical fluorination, subsequently quantifying six distinct adhesion forces. This investigation provided an efficacious methodology for characterizing water droplet adhesion on superhydrophobic surfaces [28]. From a biomimetic perspective, superhydrophobic materials can emulate the surfaces of lotus leaves and certain insect wings while simultaneously facilitating directional liquid transport [29,30,31]. This functionality enables superhydrophobic swimming goggles to rapidly repel water droplets from their surfaces in practical applications.
The investigation and development of hydrophobic materials represents a prominent area of contemporary research, with such materials finding extensive applications across medical, engineering, and agricultural sectors [32,33,34]. Presently, numerous studies utilize modification techniques to synthesize rubber composites with favorable comprehensive performance characteristics [35,36]. The application of this technology in sporting equipment remains insufficiently explored, particularly considering the unique material requirements within the sports industry. Currently, there exists a notable dearth of research literature concerning the hydrophobicity, wear resistance, drag reduction, and ice prevention capabilities of swimming goggles, presenting substantial challenges in establishing comparative frameworks with existing studies. Therefore, developing swimming goggles that simultaneously exhibit superhydrophobic, durable, drag-reducing, and anti-icing properties holds significant importance.
This paper employs a combined approach of plasma cleaning and mechanical spraying to conduct surface modification of polycarbonate (PC) swimming goggle lenses, resulting in the production of superhydrophobic, drag-reducing, and anti-icing swimming goggle lenses. Through comparative analyses of surface contact angle measurements, scanning electron microscopy, and three-dimensional topography, we demonstrate that the modified goggle lenses exhibit superhydrophobic, drag-reducing, wear-resistant, and anti-icing properties. This research provides a viable solution for enhancing performance while maintaining cost-effectiveness in swimming goggle materials.

2. Experimental Section

2.1. Main Materials

The main materials included SWANS-45 swimming goggles, SPEEDO-U swimming goggles, ARENA-F swimming goggles (Speedo [China] Sporting Goods Co., Ltd., Shanghai, China) (all lens materials are polycarbonate PC), anhydrous ethanol, water-based polyurethane, silicon dioxide SiO2 (HB-139), and anhydrous ethanol. All distilled water used in the experiments were produced internally.

2.2. Sample Preparation

During the experimental process, personal protective equipment was worn, including safety goggles, chemical-resistant gloves, and gas masks (when using organic solvents). Simultaneously, adequate ventilation conditions were ensured in the working area, and emergency flushing equipment and related materials were prepared. Swimming goggle lenses were first cleaned with a soft brush to remove loose contaminants from the surface, followed by rinsing with distilled water. Subsequently, Simple Green All-Purpose Cleaner (neutral detergent) was used to wipe the lenses, followed by another rinse with distilled water. The lenses were then wiped with anhydrous ethanol using a lint-free cloth. A KQ-500DE programmable ultrasonic cleaner (Kunshan Ultrasonic Instruments Co., Ltd., Shanghai, China) was employed for washing, after which the lenses were dried in a DHG-9070 forced-air drying oven (Shanghai Hengke Instrument Co., Ltd., Shanghai, China). Anhydrous ethanol, HB-139 SiO2 powder, water-based polyurethane (PU), NaClO, and distilled water were obtained. A 3.5% mass fraction of SiO2 ethanol dispersion was prepared, with 1 mL of water-based polyurethane added to increase its viscosity and consistency. This mixture was stirred for 1 h at 650 r/min using a magnetic stirrer (Shanghai Lichen Bangxi Instrument Technology Co., Ltd. (DF-101 S), Shanghai, China). Additionally, in accordance with the “Swimming Pool Water Quality Hygienic Standard” (GB 37488-2019), a 1.0 mg/L sodium hypochlorite (NaClO) solution was prepared and stirred for 1 h using a magnetic stirrer.
The cleaned original lens samples were placed flat on microscope slides. Subsequently, they were subjected to plasma cleaning, after which the previously prepared SiO2-ethanol-water-based polyurethane dispersion was uniformly sprayed onto the swimming goggle sample surface using an air compressor. The samples were then placed in a forced-air drying oven for setting. Finally, modified lens samples with superhydrophobic characteristics were successfully prepared. The improved sample preparation flowchart is shown in Figure 1.

2.3. Experimental Procedure

We selected ten sets each of original lens specimens and improved lens specimens, and employed a contact angle goniometer (Theta Flex, Biolin Scientific, Göteborg, Sweden) to quantify the static contact angle, contact angle hysteresis, and roll-off angle for each sample. For static contact angle measurements, we utilized a 4 μL droplet dispensed at a pump rate of 1 μL/s. When assessing contact angle hysteresis, a 5 μL droplet was employed, with both advancing and receding rates precisely controlled at 0.2 μL/s. The procedural methodology entailed initially depositing a 5 μL droplet on the specimen surface, then subsequently inserting the needle into the droplet’s epicenter, and incrementally augmenting the fluid volume at 0.2 μL/s until the contact line achieved equilibrium, at which point the advancing angle was documented. Following this, fluid was systematically withdrawn at an equivalent rate of 0.2 μL/s until the contact line re-stabilized, whereupon the receding angle was recorded. For roll-off angle determinations, a 10 μL droplet was employed with the platform rotating at a controlled angular velocity of 0.5°/s; the roll-off angle was registered at the precise moment of droplet mobilization, after which the corresponding data and images were systematically collected and archived.
To simulate wear effects during usage, ten groups of original lens samples and ten groups of modified lens samples were placed horizontally on 1500-grit sandpaper, with a 100 g standard weight positioned above each sample, and pulled uniformly across a distance of 1 m. Ten groups of original lens samples and ten groups of modified samples were completely immersed in the prepared NaClO solution for 24 h. After removal, samples were dried in a forced-air drying oven. Upon completion of the aforementioned abrasion and immersion experiments, we utilized identical instrumentation and methodological protocols to quantify the static contact angle, contact angle hysteresis, and roll-off angle, with subsequent systematic collection and archival of the corresponding data and images.
Fourier Transform Infrared Spectroscopy (FTIR, IRTracer-100, Shimadzu Corporation, Kyoto, Japan) was employed to detect molecular groups of particles on the sample surfaces. Scanning electron microscopy (SEM, NOVA NANOSEM 450, Thermo Fisher Scientific, Waltham, MA, USA) was utilized to characterize and observe the microscopic morphology of sample surfaces. Energy Dispersive Spectroscopy (Octane Super EDAX, Pleasanton, CA, USA) was used to examine sample surfaces and observe elemental distribution. A three-dimensional surface profilometer (NANOVEA ST 400, NANOVEA Inc., Irvine, CA, USA) was employed to characterize the three-dimensional structure of sample surfaces.
We selected ten enhanced specimens for comprehensive analysis, conducting contact angle measurements and three-dimensional topographical characterization. Utilizing a precision coating thickness gauge (QNIX4500, Automation Dr. Nix GmbH and Co. KG, Cologne, Germany), we determined that at a thickness of 6 ± 1 µm, the coating maintains optimal hydrophobicity, durability, and drag-reducing properties. To ensure experimental rigor and reproducibility, we maintained consistent coating thickness across all samples throughout the experimental protocol, thereby eliminating thickness-induced variability as a potential confounding factor in our analysis.
Original lens samples and modified lens samples were selected and simultaneously released from the same height into the same water tank. An ACS-3 M16 high-speed camera (Chengdu Libo Photoelectric Co., Ltd.; Chengdu, China) was used to record experimental data, videos, and images. The droplet temperature is 25 ± 1 °C. When releasing, it was ensured that the outer surface of the mirror was always placed downward. The lens were release in the same direction each time. The experiment was repeated 10 times for both the original sample and the improved sample.
A 5 mm high mold was placed on the sample surface and put it in a freezer at −10 ± 1 °C for 1 h to prepare the ice layer. The samples were taken out and the thickness was measured using a thickness tester (QNIX4500, Automation Dr. Nix GmbH and Co. KG, Cologne, Germany), and the data were statistically analyzed. Then, the standard deviation was calculated to be 5.0 ± 0.2 mm.
Ten groups of original lens samples and ten groups of modified lens samples were subjected to surface droplet bouncing tests under conditions of −10 °C, 10 °C, and 30 °C, with a high-speed camera recording experimental data, videos, and images. Original lens samples and modified lens samples were placed in a freezer at −10 °C until a 5 mm ice layer formed on their surfaces. After removal, samples were placed on a room temperature test bench, and an infrared thermal imager (Tis 60+, Fluke Corporation, Everett, WA, USA) was used to monitor the temperature changes on the experimental sample surfaces in real time.

3. Results and Discussion

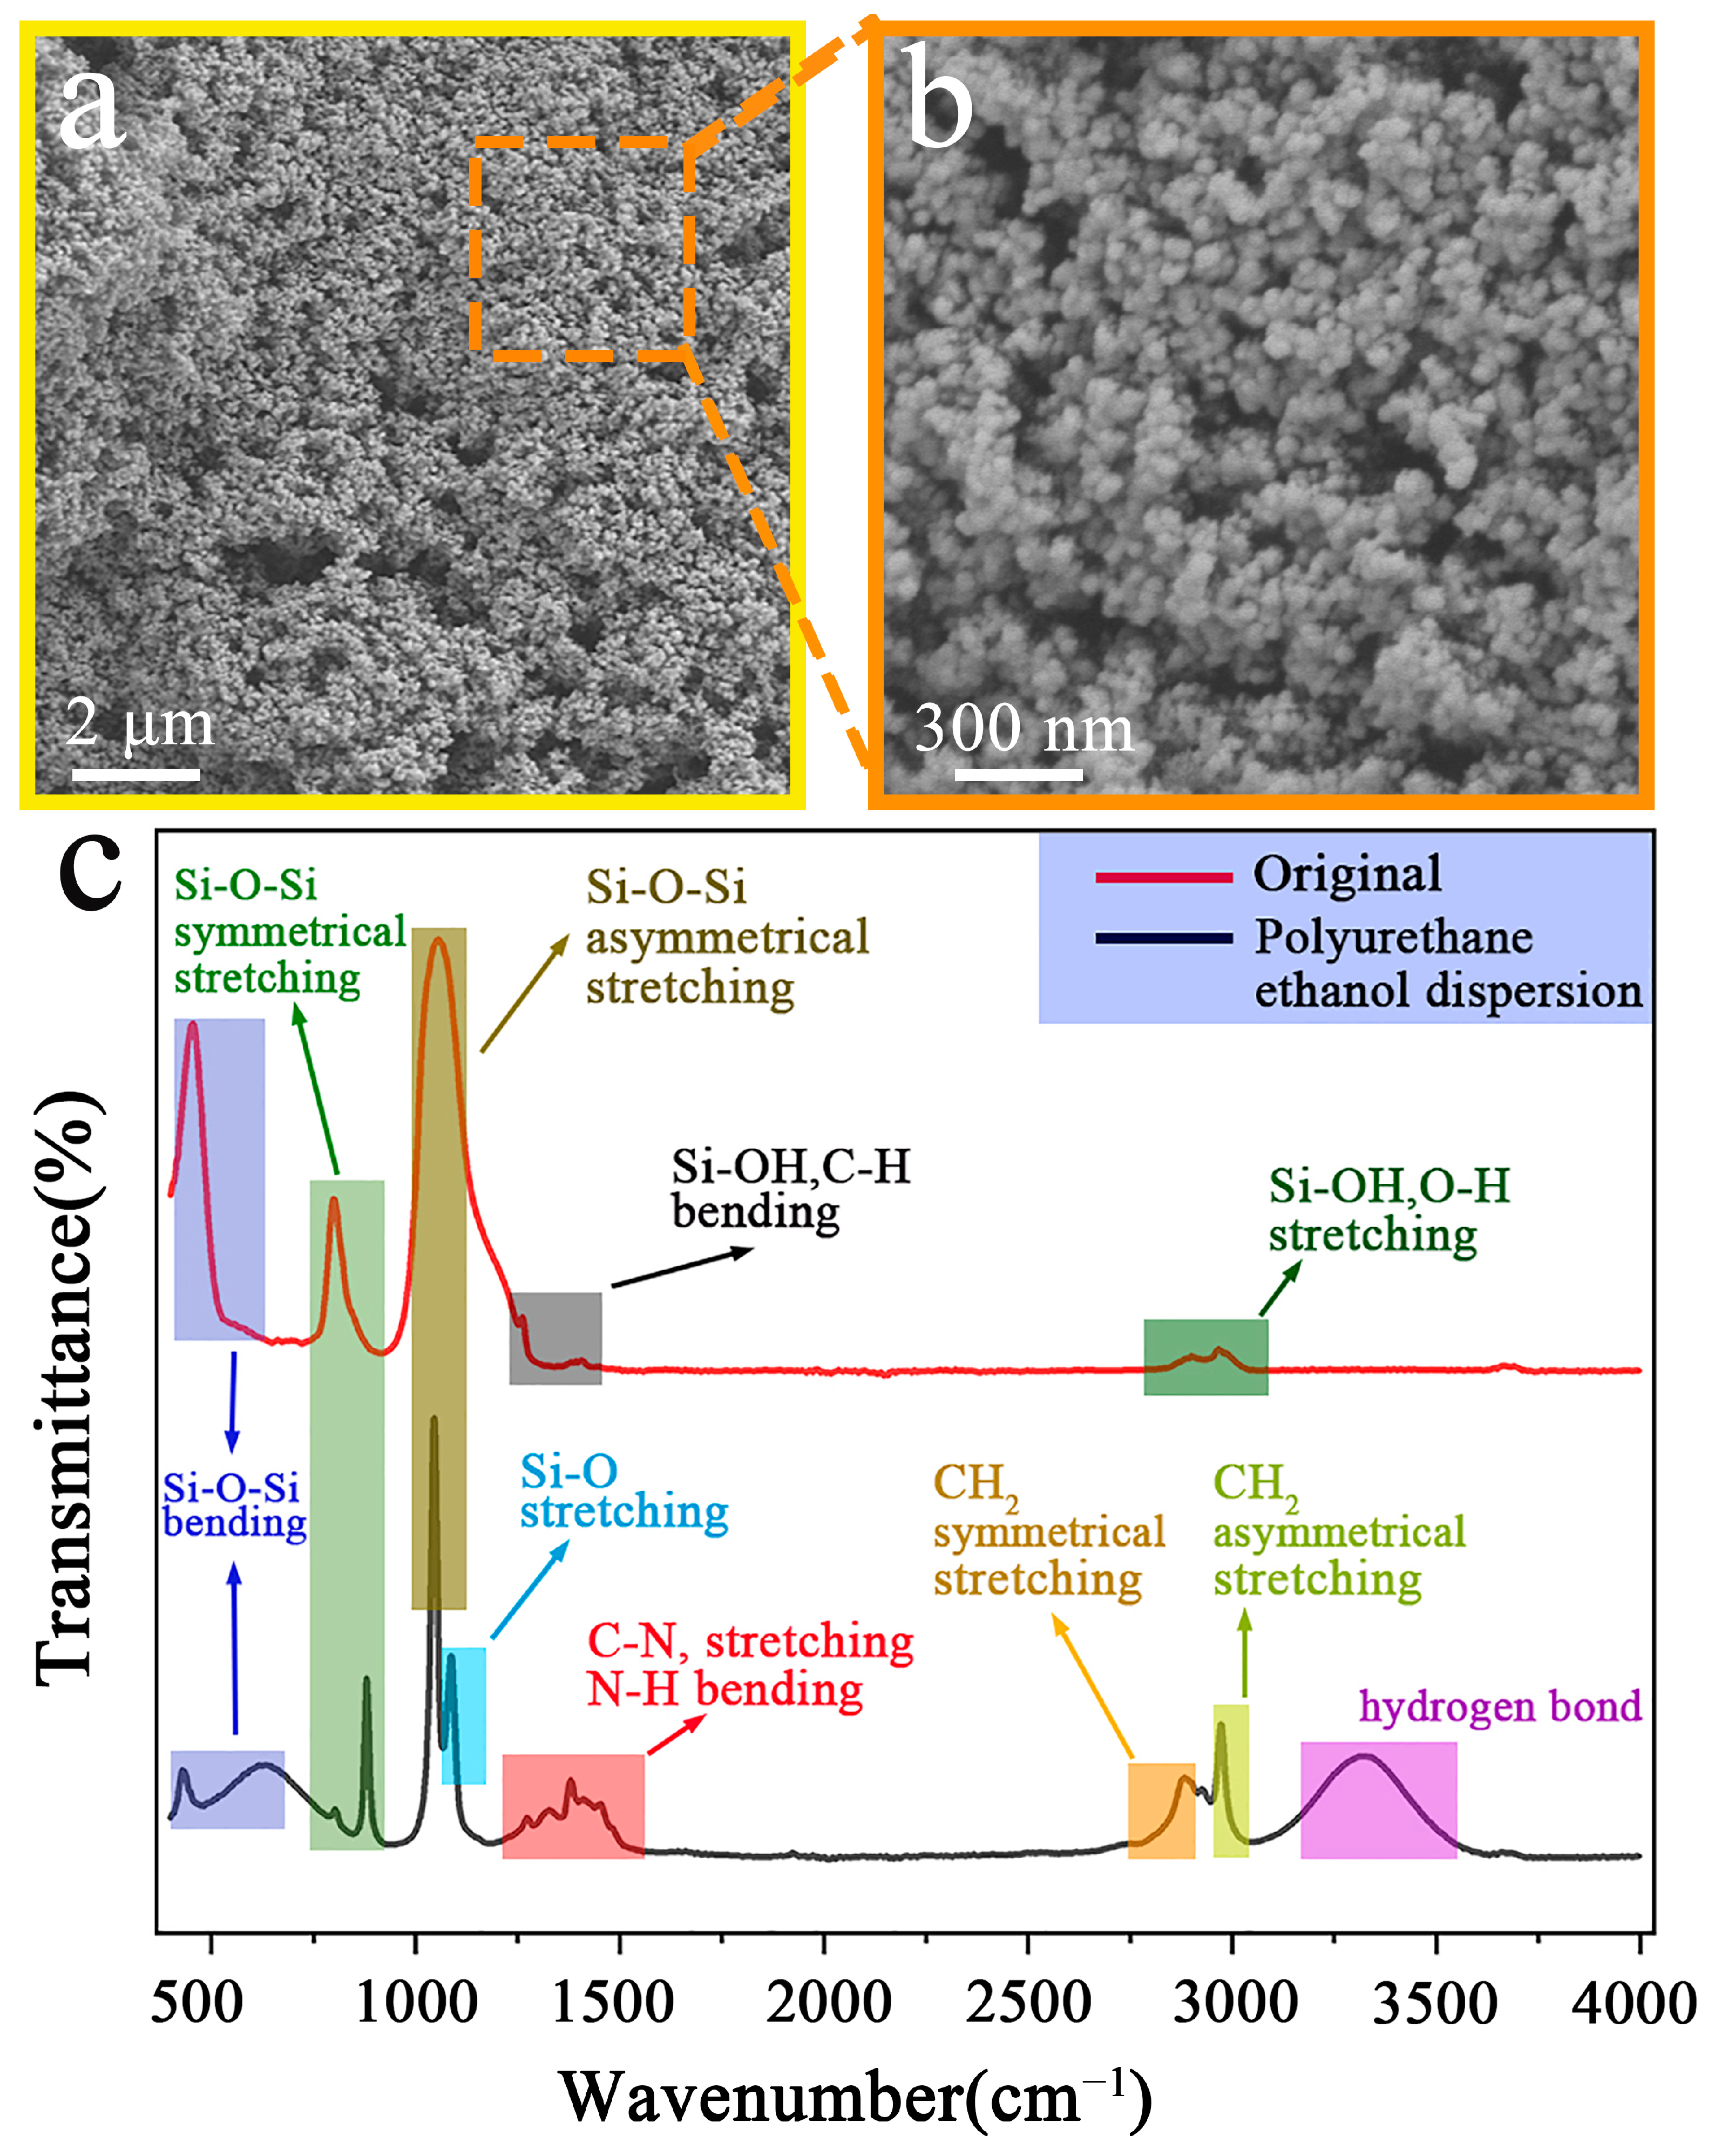
3.1. SiO2 Particle Characterization and Infrared Spectroscopy Analysis

Figure 2 presents scanning electron microscopy (SEM) images of SiO2 (HB-139) nanoparticles, with Figure 2a showing a 5000× magnification micrograph and Figure 2b displaying a 30,000× magnification micrograph. A highly uniform distribution of spherical SiO2 nanoparticles can be observed. The particles exhibit remarkable morphological homogeneity with a distinct hierarchical structure. Individual particles form interconnected clusters, creating a three-dimensional network with consistent particle size distribution.
Figure 2c illustrates a comparative infrared spectroscopy analysis between SiO2 (HB-139) powder and the SiO2 water-based polyurethane ethanol dispersion. The red curve represents the infrared spectrum of SiO2 (HB-139) powder, displaying multiple characteristic absorption peaks in the 400–4000 cm−1 range, generally exhibiting typical features of the silicon dioxide basic skeletal structure, accompanied by the presence of organic impurities. From the baseline stability perspective, the overall sample homogeneity is excellent. A significantly strong absorption peak is observed at 455 cm−1, attributed to the bending vibration of Si-O-Si in the SiO2 (HB-139) framework. A medium-intensity absorption peak appears at 799 cm−1, corresponding to Si-O-Si stretching vibration and Si-OH bending vibration. The strongest absorption peak occurs at 1056 cm−1, originating from Si-O-Si stretching vibration and Si-O stretching vibration in surface Si-OH groups. The sharp peak shape and maximum intensity of this peak indicate good structural regularity of SiO2, consistent with the standard characteristics of SiO2 (HB-139), reflecting the integrity of the silicon dioxide network structure. The black curve represents the infrared spectrum of the SiO2 water-based polyurethane ethanol dispersion. The sharp absorption peak observed at 428 cm−1 can be attributed to the bending vibration mode of Si-O-Si groups. The medium-intensity peak at 879 cm−1 corresponds to Si-O-Si stretching vibration, while the strongest absorption peak at 1044 cm−1 belongs to Si-O-Si stretching vibration and Si-O stretching vibration of Si-OH groups. The sharpness and intensity of the peak indicate good structural regularity of the silicon dioxide framework. Multiple peak combinations appear in the 1200–1400 cm−1 range, attributed to C-N stretching vibration, N-H bending vibration, and CH2 deformation vibration in water-based polyurethane. The relatively weak absorption in the 1500–2500 cm−1 range can be attributed to C = O stretching vibration in polyurethane. The stability of the baseline in this range further confirms the high-purity characteristics of the sample. The characteristic double peaks appearing in the 2800–3000 cm−1 range originate from CH2 symmetric stretching vibration and CH2 asymmetric stretching vibration. These peaks primarily derive from methylene units in the polyurethane molecular chains. The broad peak in the 3200–3500 cm−1 region reflects a complex hydrogen bond network, attributed to intermolecular hydrogen bonds formed between surface Si-OH and NH/OH groups in water-based polyurethane. The broadening feature of the peak indicates the presence of multiple hydrogen bond interactions.
The surface of SiO2 predominantly exhibits terminal hydroxyl (-OH) functional groups, which engage in non-specific, non-covalent interactions with biological macromolecules such as proteins, primarily mediated through hydrogen bonding and van der Waals forces. This mode of interaction precludes denaturation of biomolecules or disruption of cellular membranes, thereby ensuring excellent biocompatibility. SiO2 has garnered recognition as a safe material by multiple international regulatory bodies: the U.S. Food and Drug Administration has designated it as a Generally Recognized As Safe (GRAS) substance; the European Chemicals Agency (ECHA) has assigned no hazard classification; and the Joint FAO/WHO Expert Committee on Food Additives (JECFA) has established no Acceptable Daily Intake (ADI) limitations.
Spectroscopic analysis of the infrared spectrum presented in Figure 2c reveals an absence of absorption peaks at the characteristic isocyanate band (2270 cm−1). The surface coating is devoid of free isocyanate groups, which constitute the primary source of toxicity in conventional polyurethane formulations. This molecular configuration enables polymer chain formation within aqueous dispersion systems. Upon complete polymerization, all reactive functional groups have been fully consumed, thereby precluding the release of deleterious substances.
From the comparative infrared spectroscopy analysis, it can be clearly determined that no new substances were generated, indicating that SiO2, water-based polyurethane, and ethanol did not undergo chemical reactions. The water-based polyurethane successfully bonded to the SiO2 surface, functioning as an adhesive and enhancing the durability of the superhydrophobic coating. This demonstrates the formation of a stable hydrogen bond network in the SiO2 water-based polyurethane ethanol dispersion system, which contributes to a more robust overall material performance.

3.2. Performance Analysis

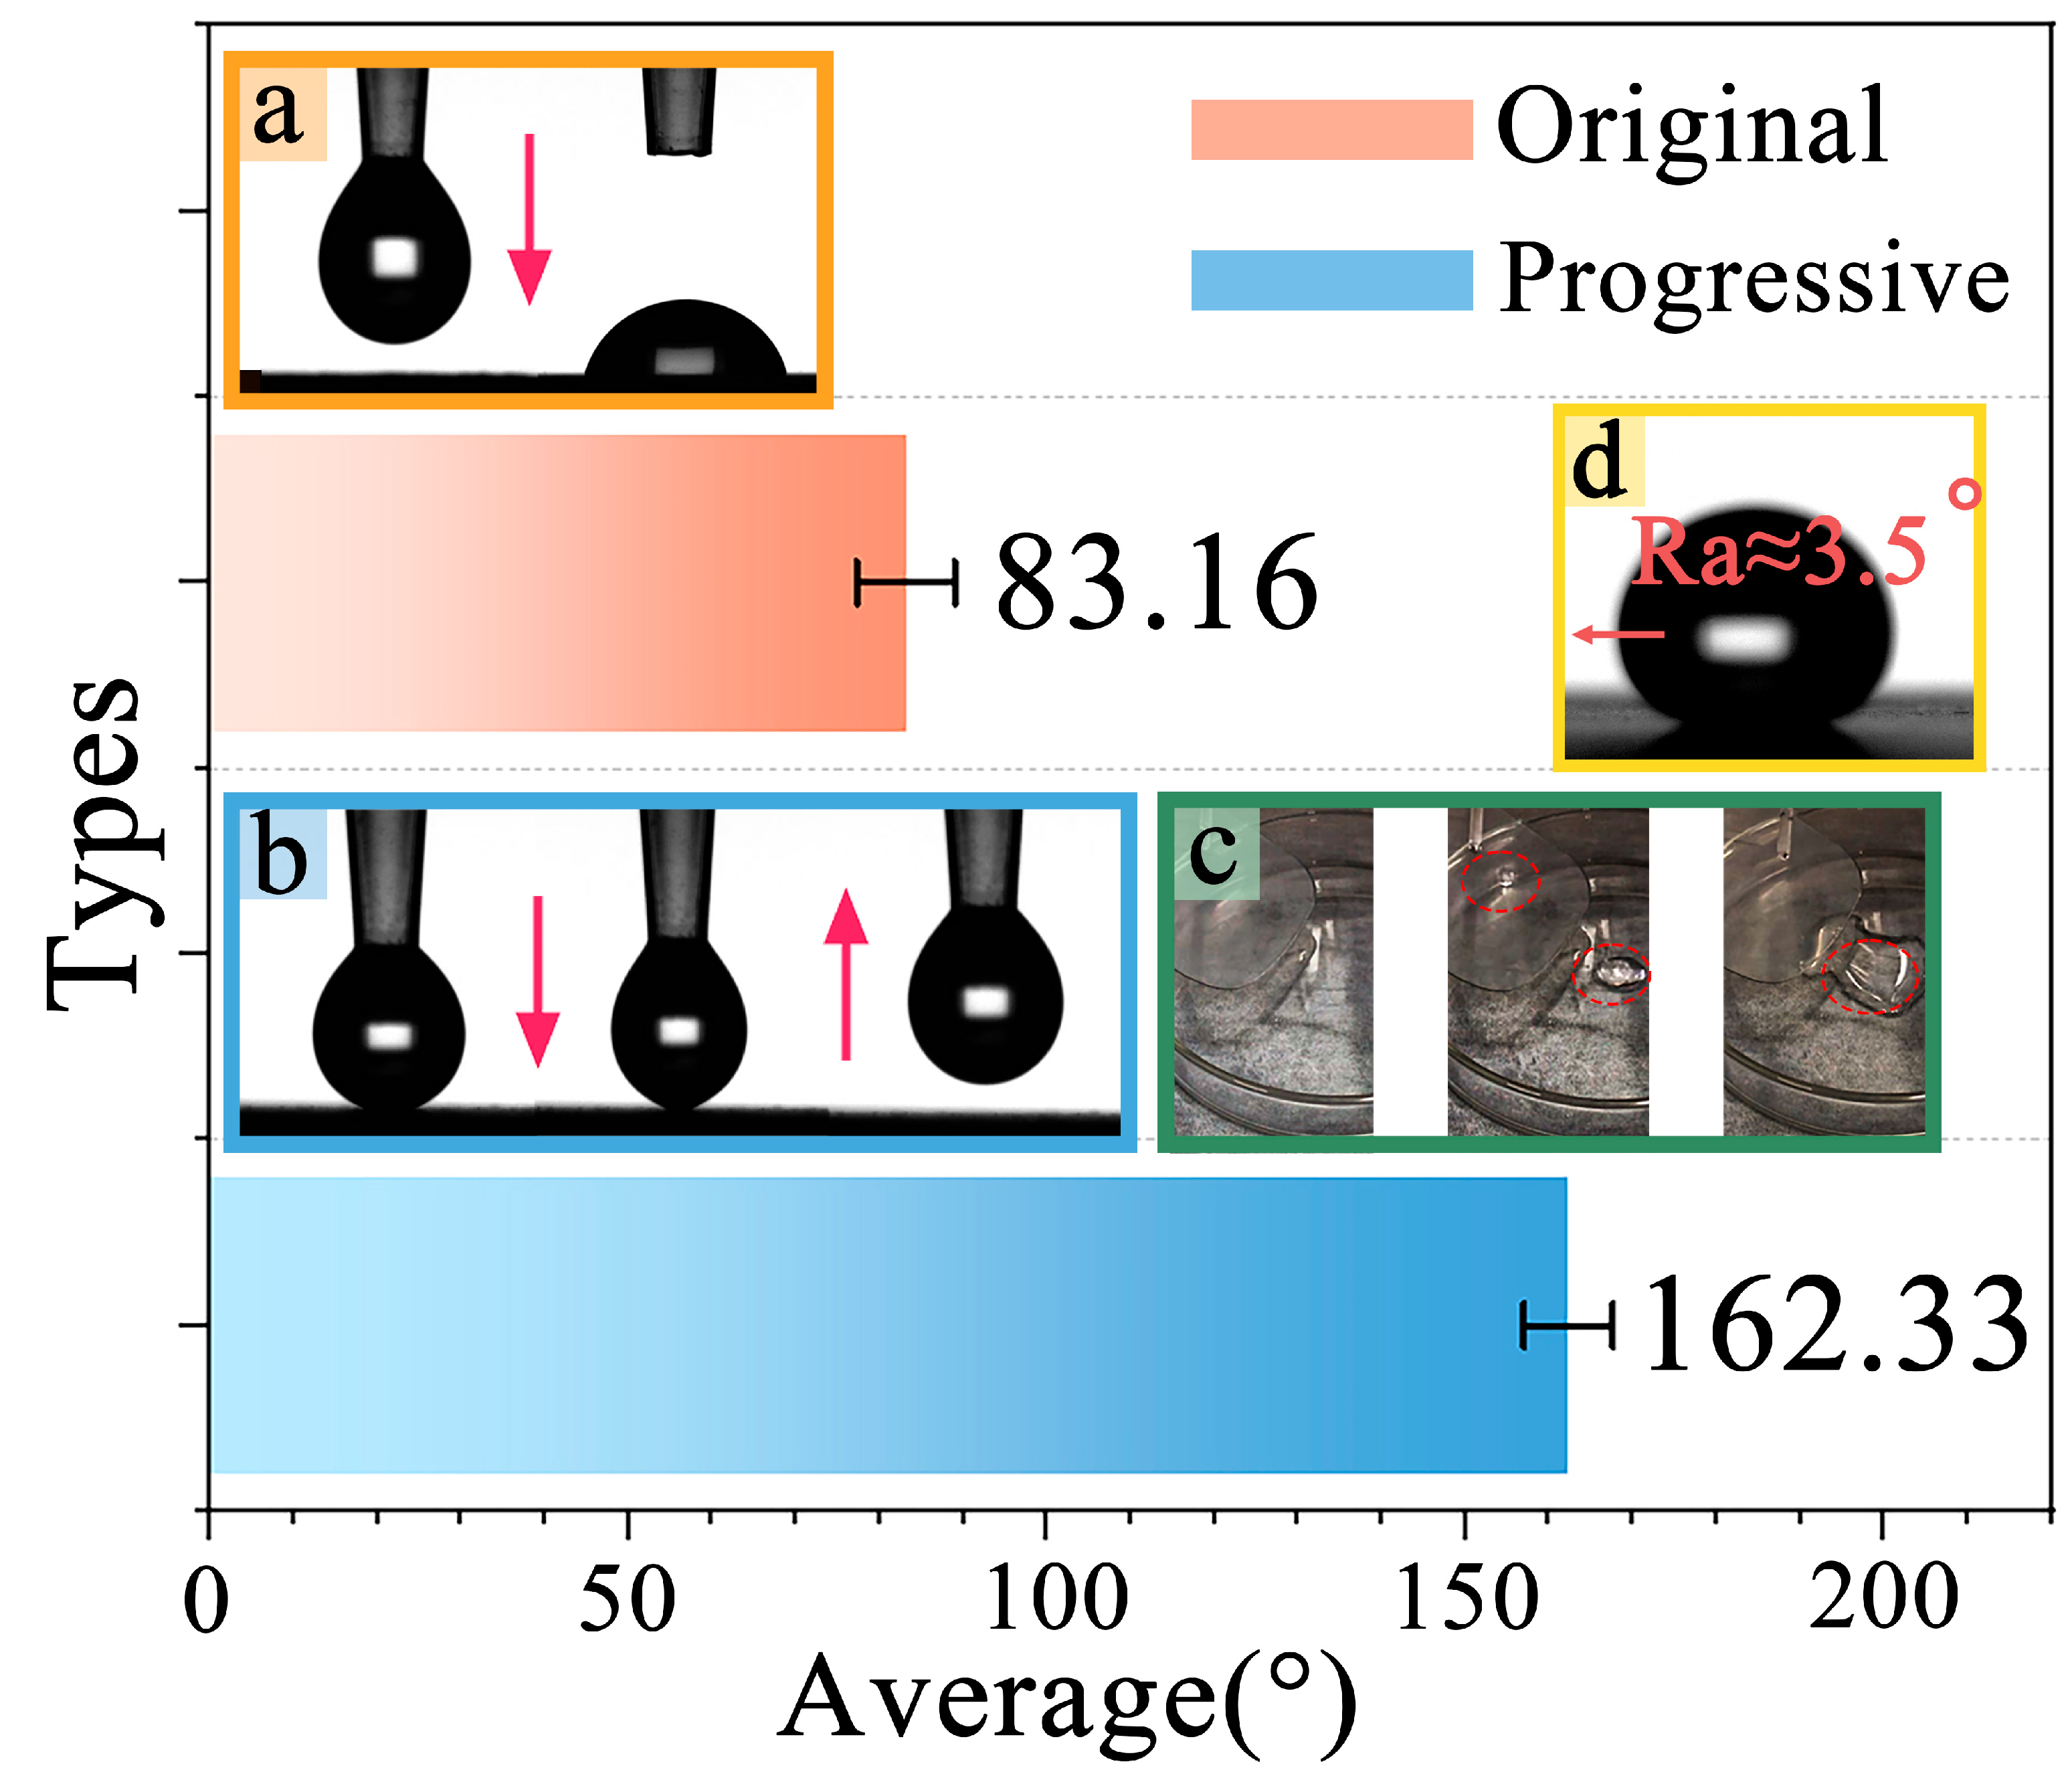
3.2.1. Hydrophobicity Analysis of Original Samples

Figure 3 demonstrates that under standard conditions, the original lens samples exhibited relatively low hydrophobicity with an average contact angle of 83.16 ± 2.75°, whereas the modified lens samples achieved superhydrophobic properties with an average contact angle of 162.33 ± 3.15°. The volume of the droplet is 4 μL. Figure 3a presents an actual image of water droplets in contact with the original lens sample surface, where it can be observed that water droplets spread out upon landing on the original sample surface rather than maintaining a highly cohesive form. Figure 3b displays an actual image of water droplets in contact with the modified lens sample surface. It can be observed that when the instrument needle of the contact angle meter, carrying a water droplet, makes contact with the modified lens sample surface and is subsequently lifted, the water droplet does not adhere to the modified sample surface but instead follows the needle upward. On the modified sample surface, water droplets maintain complete integrity and can freely roll without leaving water marks. Figure 3c shows an actual image of distilled water being dripped onto the modified sample surface using a rubber-tipped dropper. It can be observed that water droplets directly bounce off the modified sample surface without residual adhesion. The experiments confirm that SiO2 effectively enhances the surface hydrophobicity of the samples.
Statistical analysis of data compiled from ten replicate trials revealed that the enhanced specimen surface exhibited a mean advancing contact angle of 163.79 ± 2.81°, a mean receding contact angle of 161.06 ± 1.22°, a contact angle hysteresis of 2.75 ± 1.59°, and a roll-off angle of 3.5° ± 1.1°—properties that unequivocally demonstrate superhydrophobicity.
From these observations, it can be inferred that in practical applications, water droplets would not adhere to the lens surface and leave water marks that obstruct vision, thereby expanding the visual field of swimming goggles and potentially contributing to improved athletic performance.

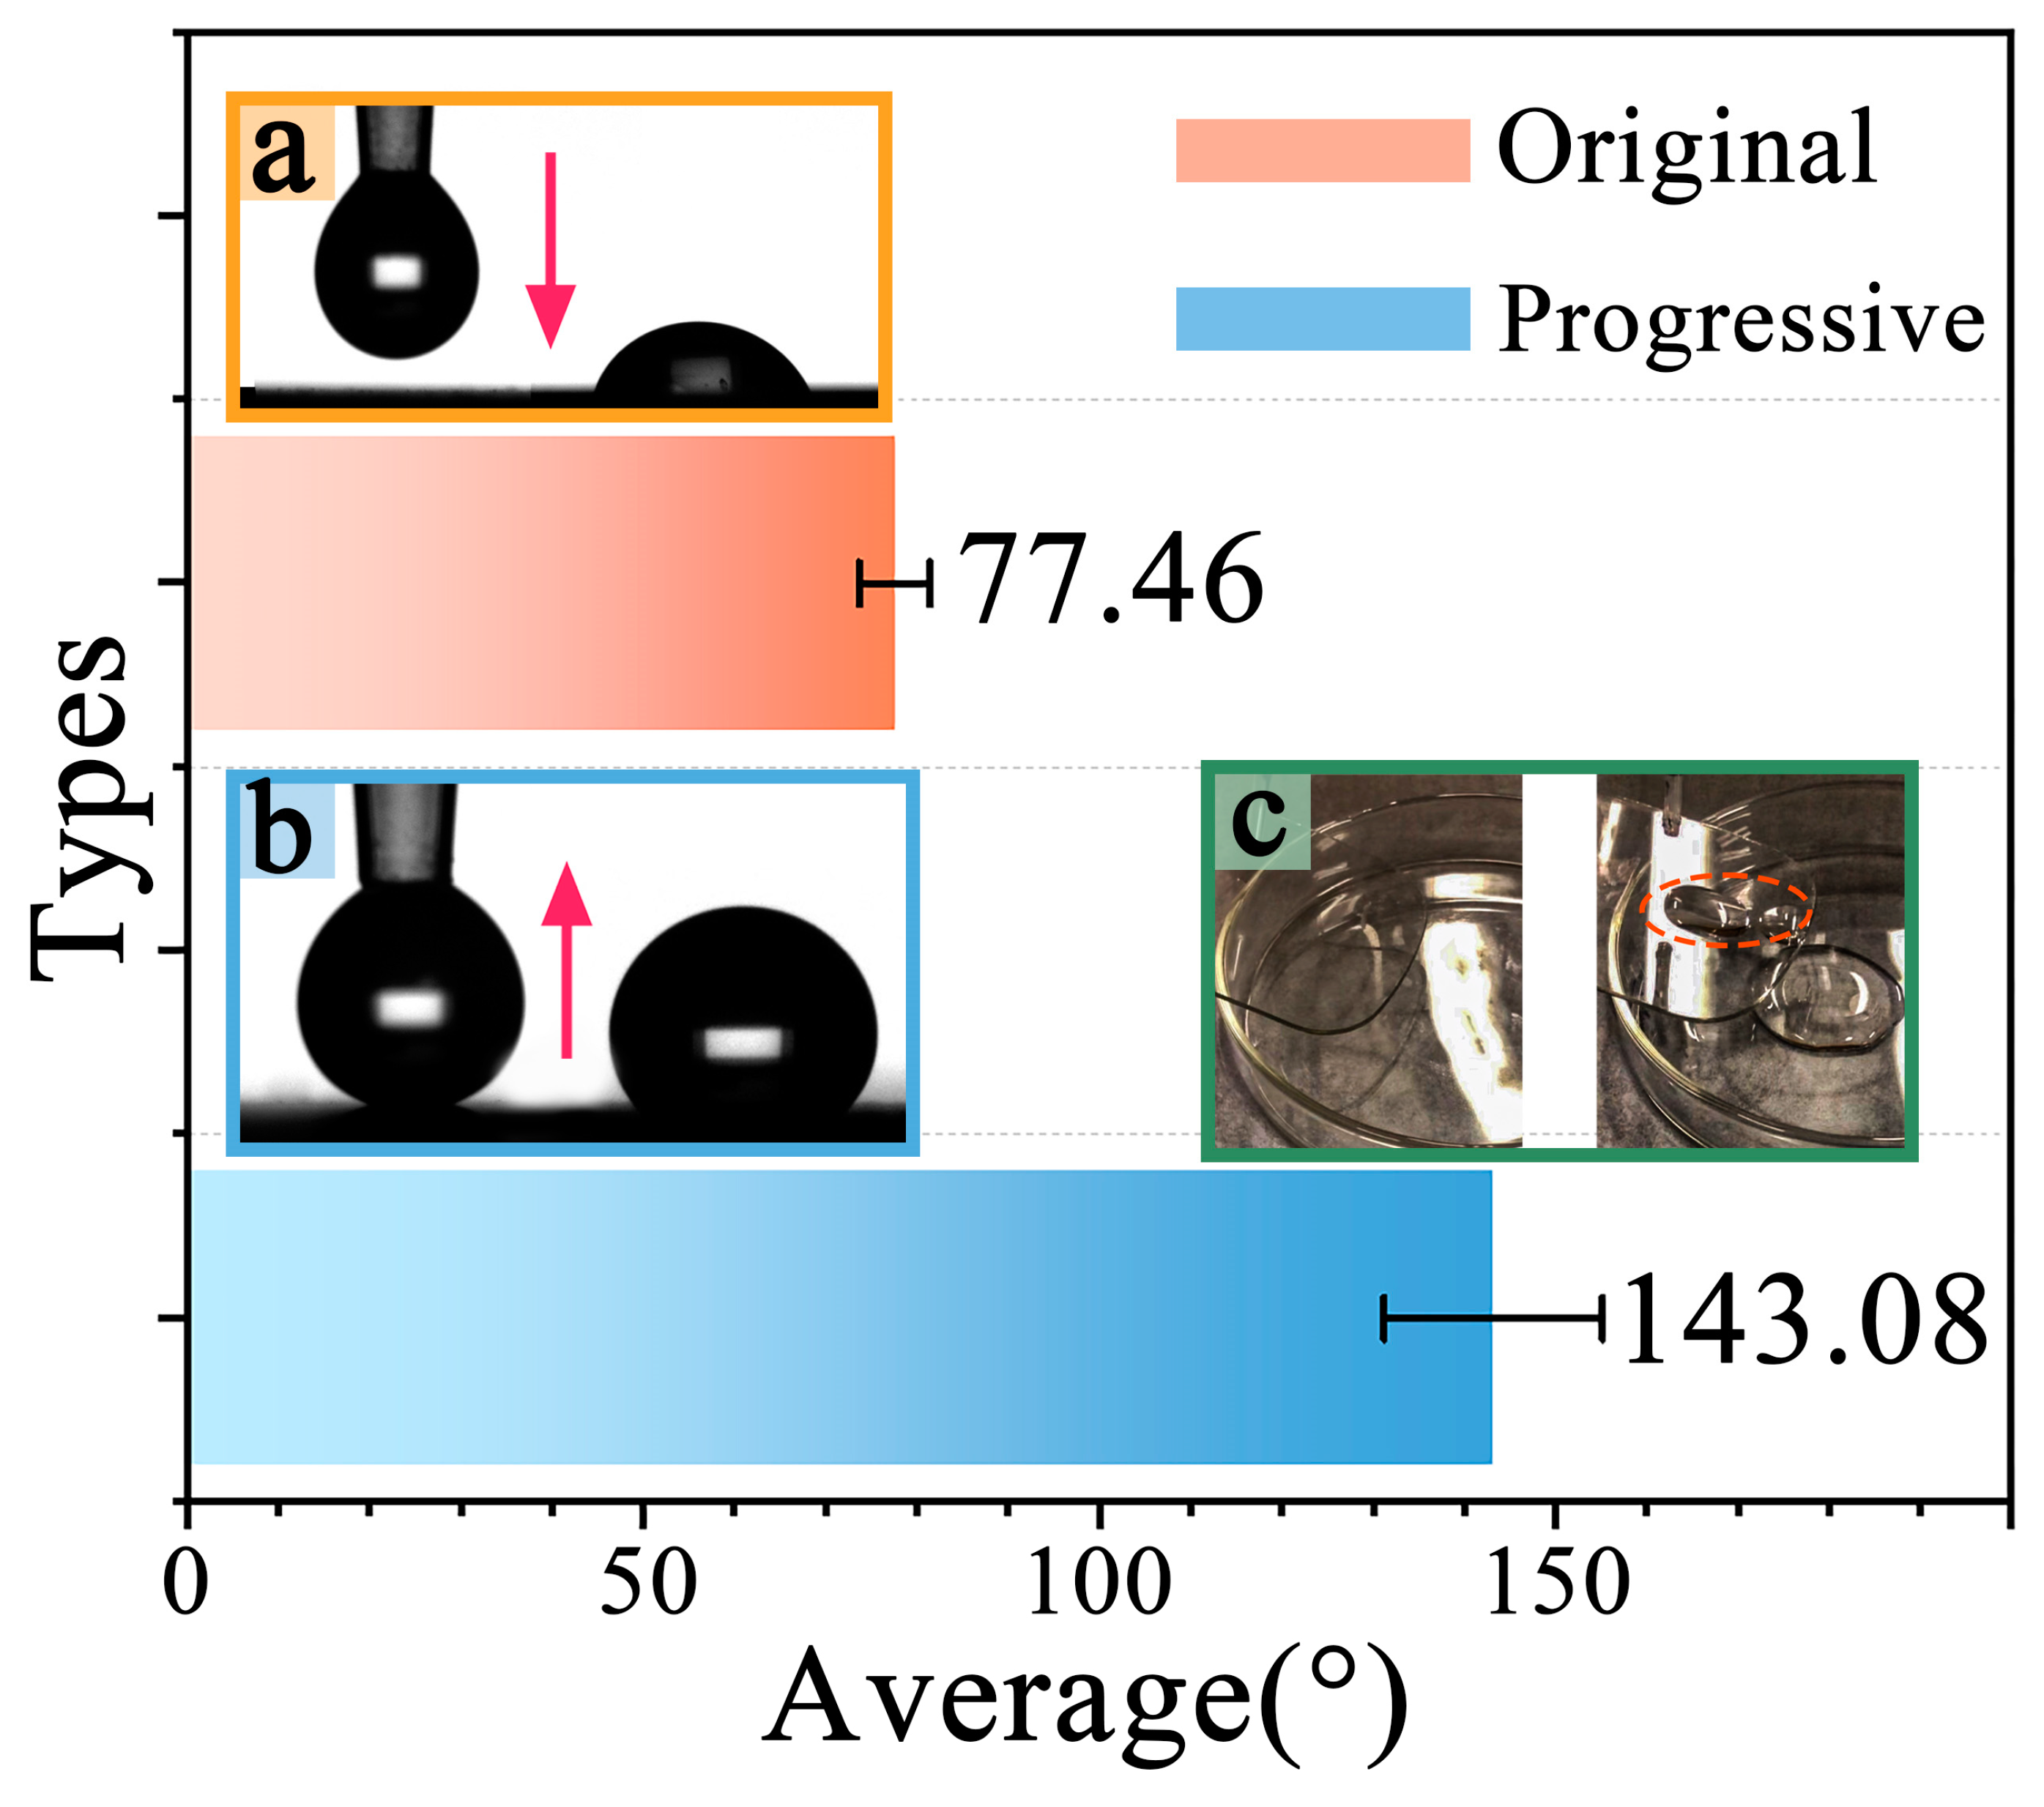
3.2.2. Hydrophobicity Analysis of Wear-Tested Samples

As illustrated in Figure 4, the original samples exhibited an average contact angle of 77.46 ± 2.61° after wear testing, while the modified samples maintained an average contact angle of 143.08 ± 3.31° following the same testing procedure. The sandpaper abrasion simulated various wear conditions that lenses might encounter during actual use. Surface structures of both original and modified samples sustained certain degrees of damage; compared to their normal state, the average contact angle of original samples decreased by approximately 6.85 ± 1.75%. However, in comparison with the original samples, the modified samples still retained substantial hydrophobicity, with their average contact angle exceeding that of the original samples by approximately 45.86 ± 2.53%. Figure 4a presents an actual photograph of the contact angle on the wear-tested original sample. It can be observed that when water droplets are placed on the surface of the original sample, they disperse over a larger area than before wear testing. Figure 4b displays an actual photograph of the contact angle on the wear-tested modified sample. It can be observed that water droplets maintain a relatively intact droplet formation on the modified sample surface. Figure 4c shows an actual image of the original sample, where water droplets can be observed to immediately disperse and adhere to the lens surface upon contact.
Following the abrasion experiments, the improved specimen surfaces exhibited a contact angle hysteresis of 6.50 ± 1.69° and a roll-off angle of 7.5 ± 0.8°. While the abrasion testing induced some degradation to the coating, resulting in a marginal diminution of the hydrophobic properties of the improved specimens, they nonetheless maintained superior hydrophobic performance relative to the original specimens. The abrasion experiments have demonstrated that this coating possesses a certain degree of wear resistance. It can be inferred that modified lenses would maintain relatively high performance after sustaining certain degrees of wear during practical use, enabling them to withstand the effects of various frictional damage environments.

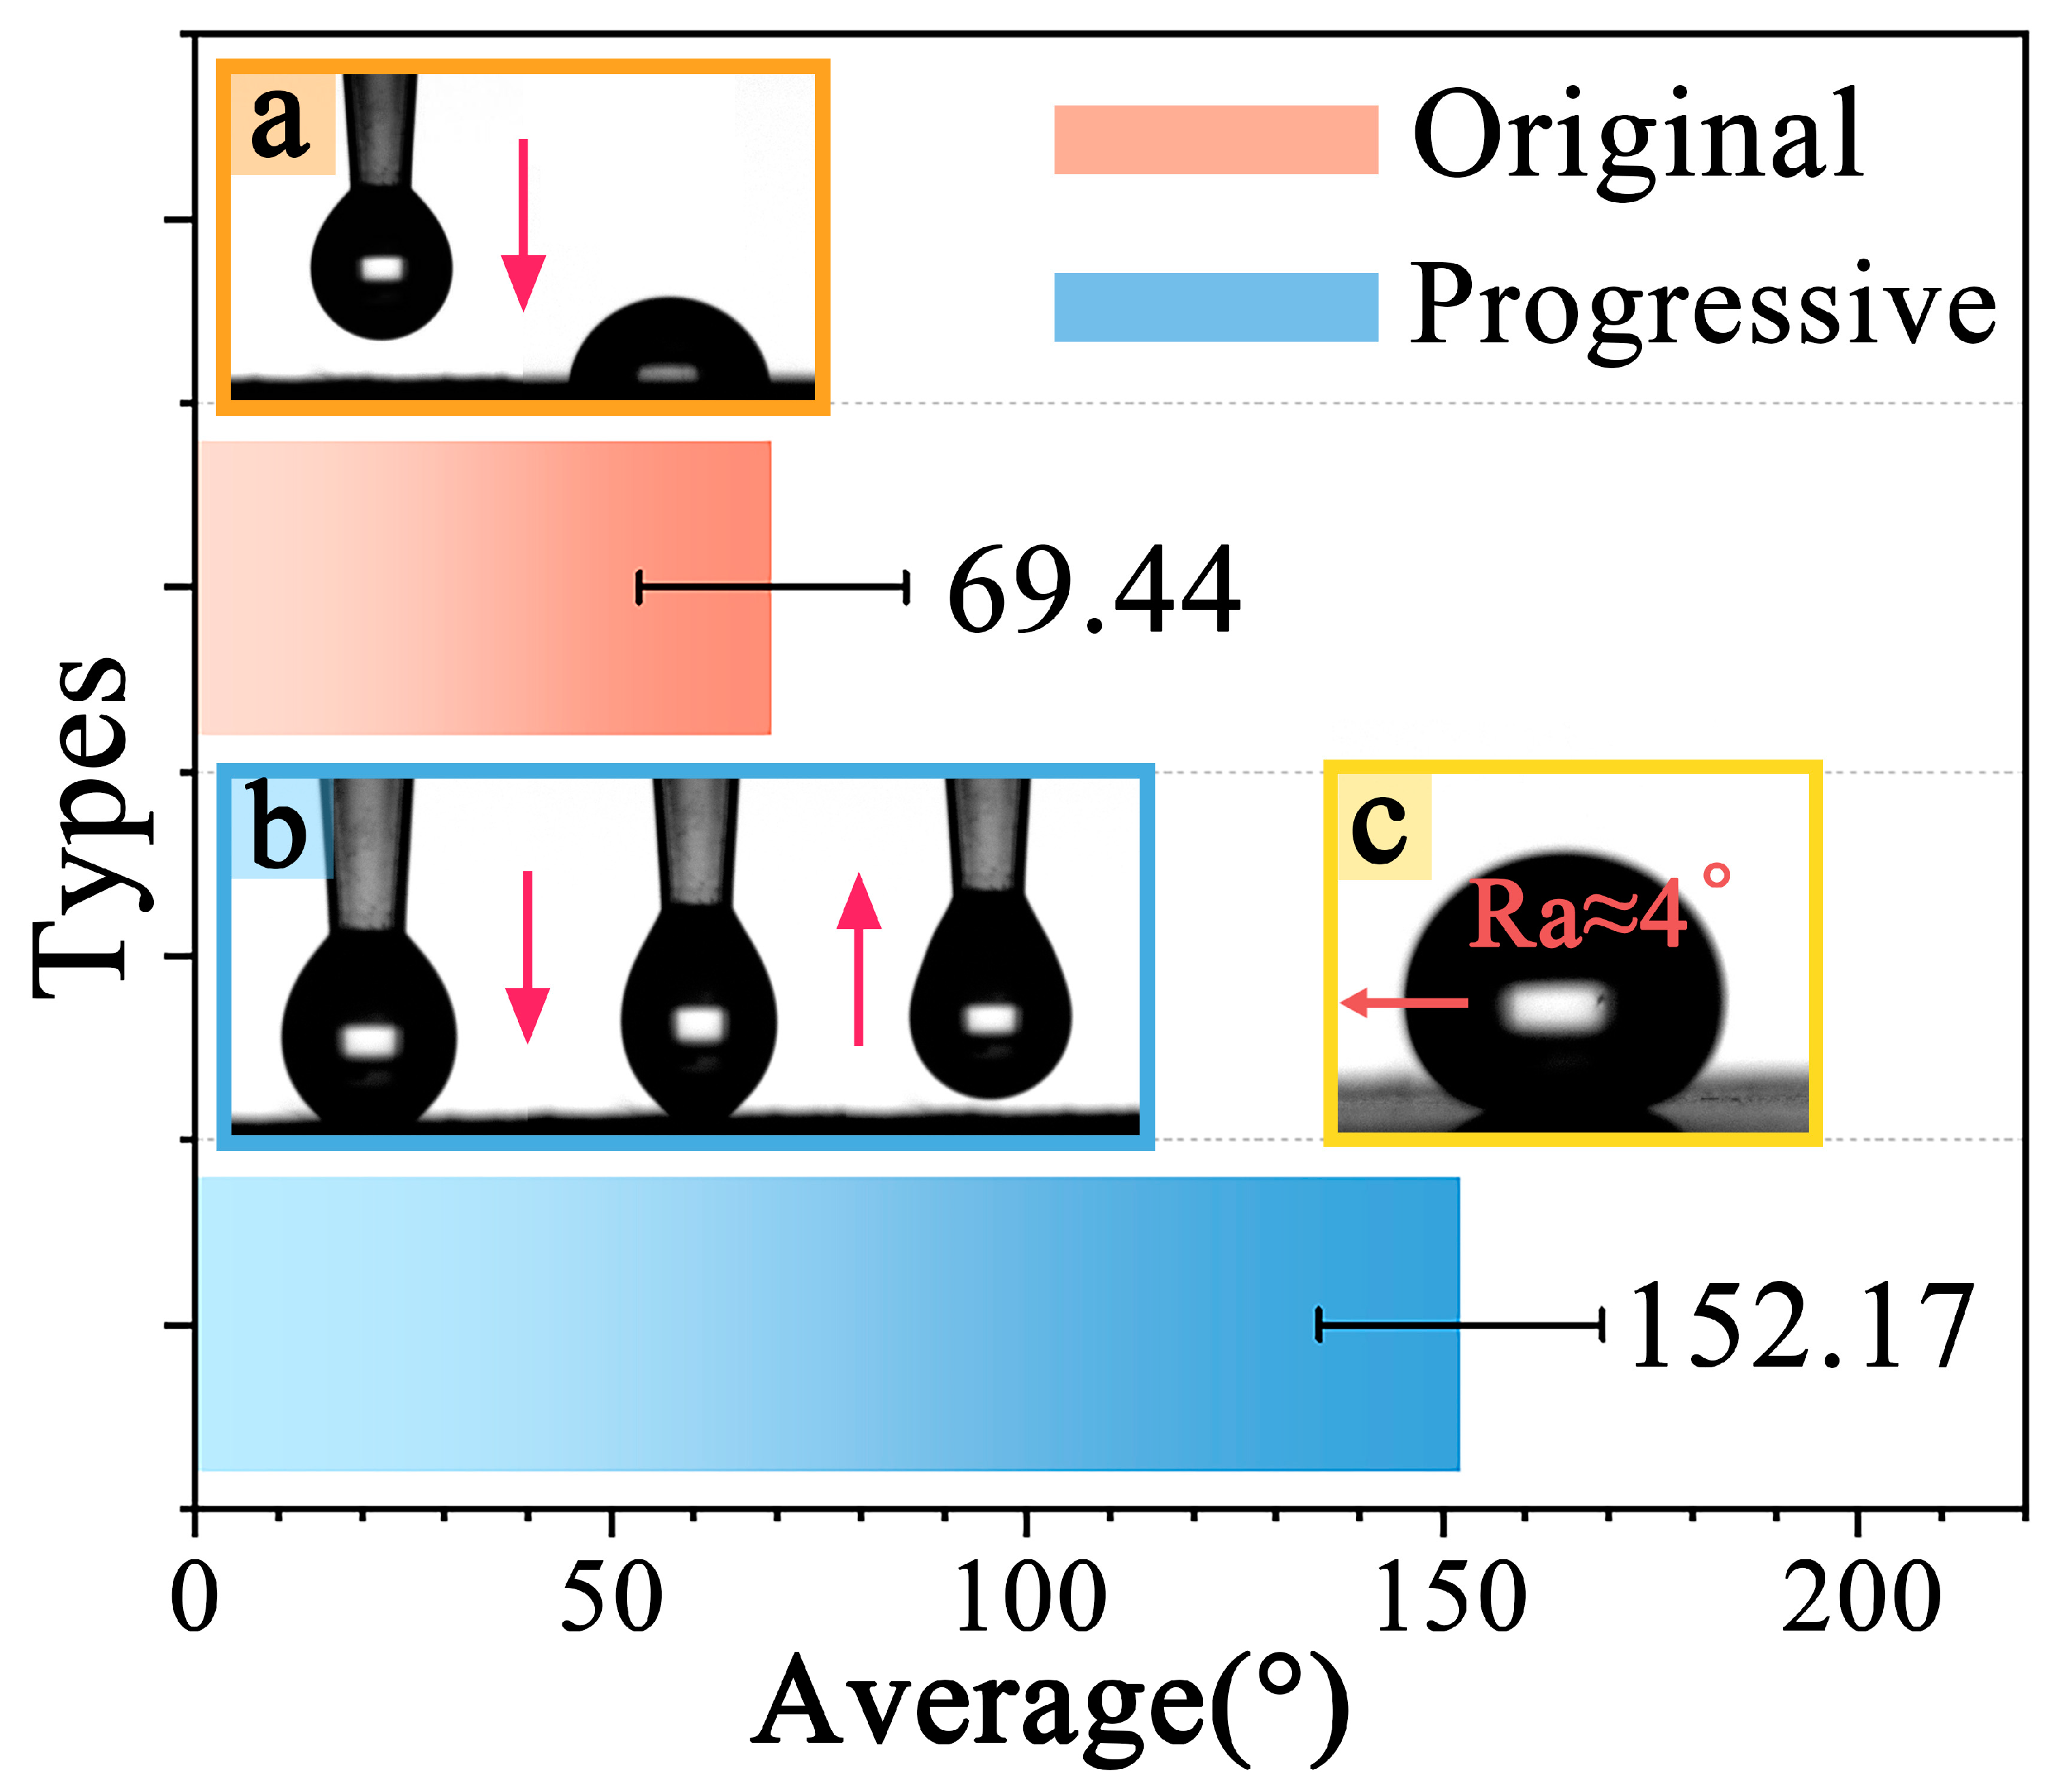
3.2.3. Hydrophobicity Analysis of Immersion-Tested Samples

As depicted in Figure 5, the original samples exhibited an average contact angle of 69.44 ± 3.75° following NaClO immersion testing, whereas the modified samples maintained an average contact angle of 152.17 ± 2.16° after identical immersion testing, thus retaining superhydrophobic properties. Figure 5a presents an actual photograph of the contact angle on the immersion-tested original sample surface, where it can be observed that water droplets continue to disperse upon contact with the original sample surface. Figure 5b displays an actual photograph of the contact angle on the immersion-tested modified sample surface. It can be observed that when the instrument needle of the contact angle meter, carrying a water droplet, makes contact with the modified lens sample surface and is subsequently lifted, the water droplet does not adhere to the modified sample surface but instead follows the needle upward. On the modified sample surface, water droplets maintain complete integrity and can freely roll without leaving water marks. Statistical analysis was performed on data compiled from ten replicate trials. Following immersion testing, the enhanced specimens were subjected to comprehensive wettability characterization. The post-immersion surfaces exhibited a mean advancing contact angle of 153.33 ± 2.12°, a mean receding contact angle of 150.07 ± 2.24°, a contact angle hysteresis of 3.26 ± 1.15°, and a roll-off angle of 4.0 ± 0.8°—parameters that collectively demonstrate the preservation of superhydrophobic properties.
The experiments demonstrate that following NaClO immersion testing, the average contact angle of modified samples exceeded that of original samples by approximately 54.37 ± 2.44%, indicating significantly enhanced performance advantages in the modified samples. The NaClO immersion test simulates the effects of swimming pool disinfectants on lens surfaces, from which it can be inferred that, in practical applications, these swimming goggles would maintain relatively high performance even after prolonged exposure to disinfectant solutions.

3.3. Scanning Electron Microscopy and EDS Analysis

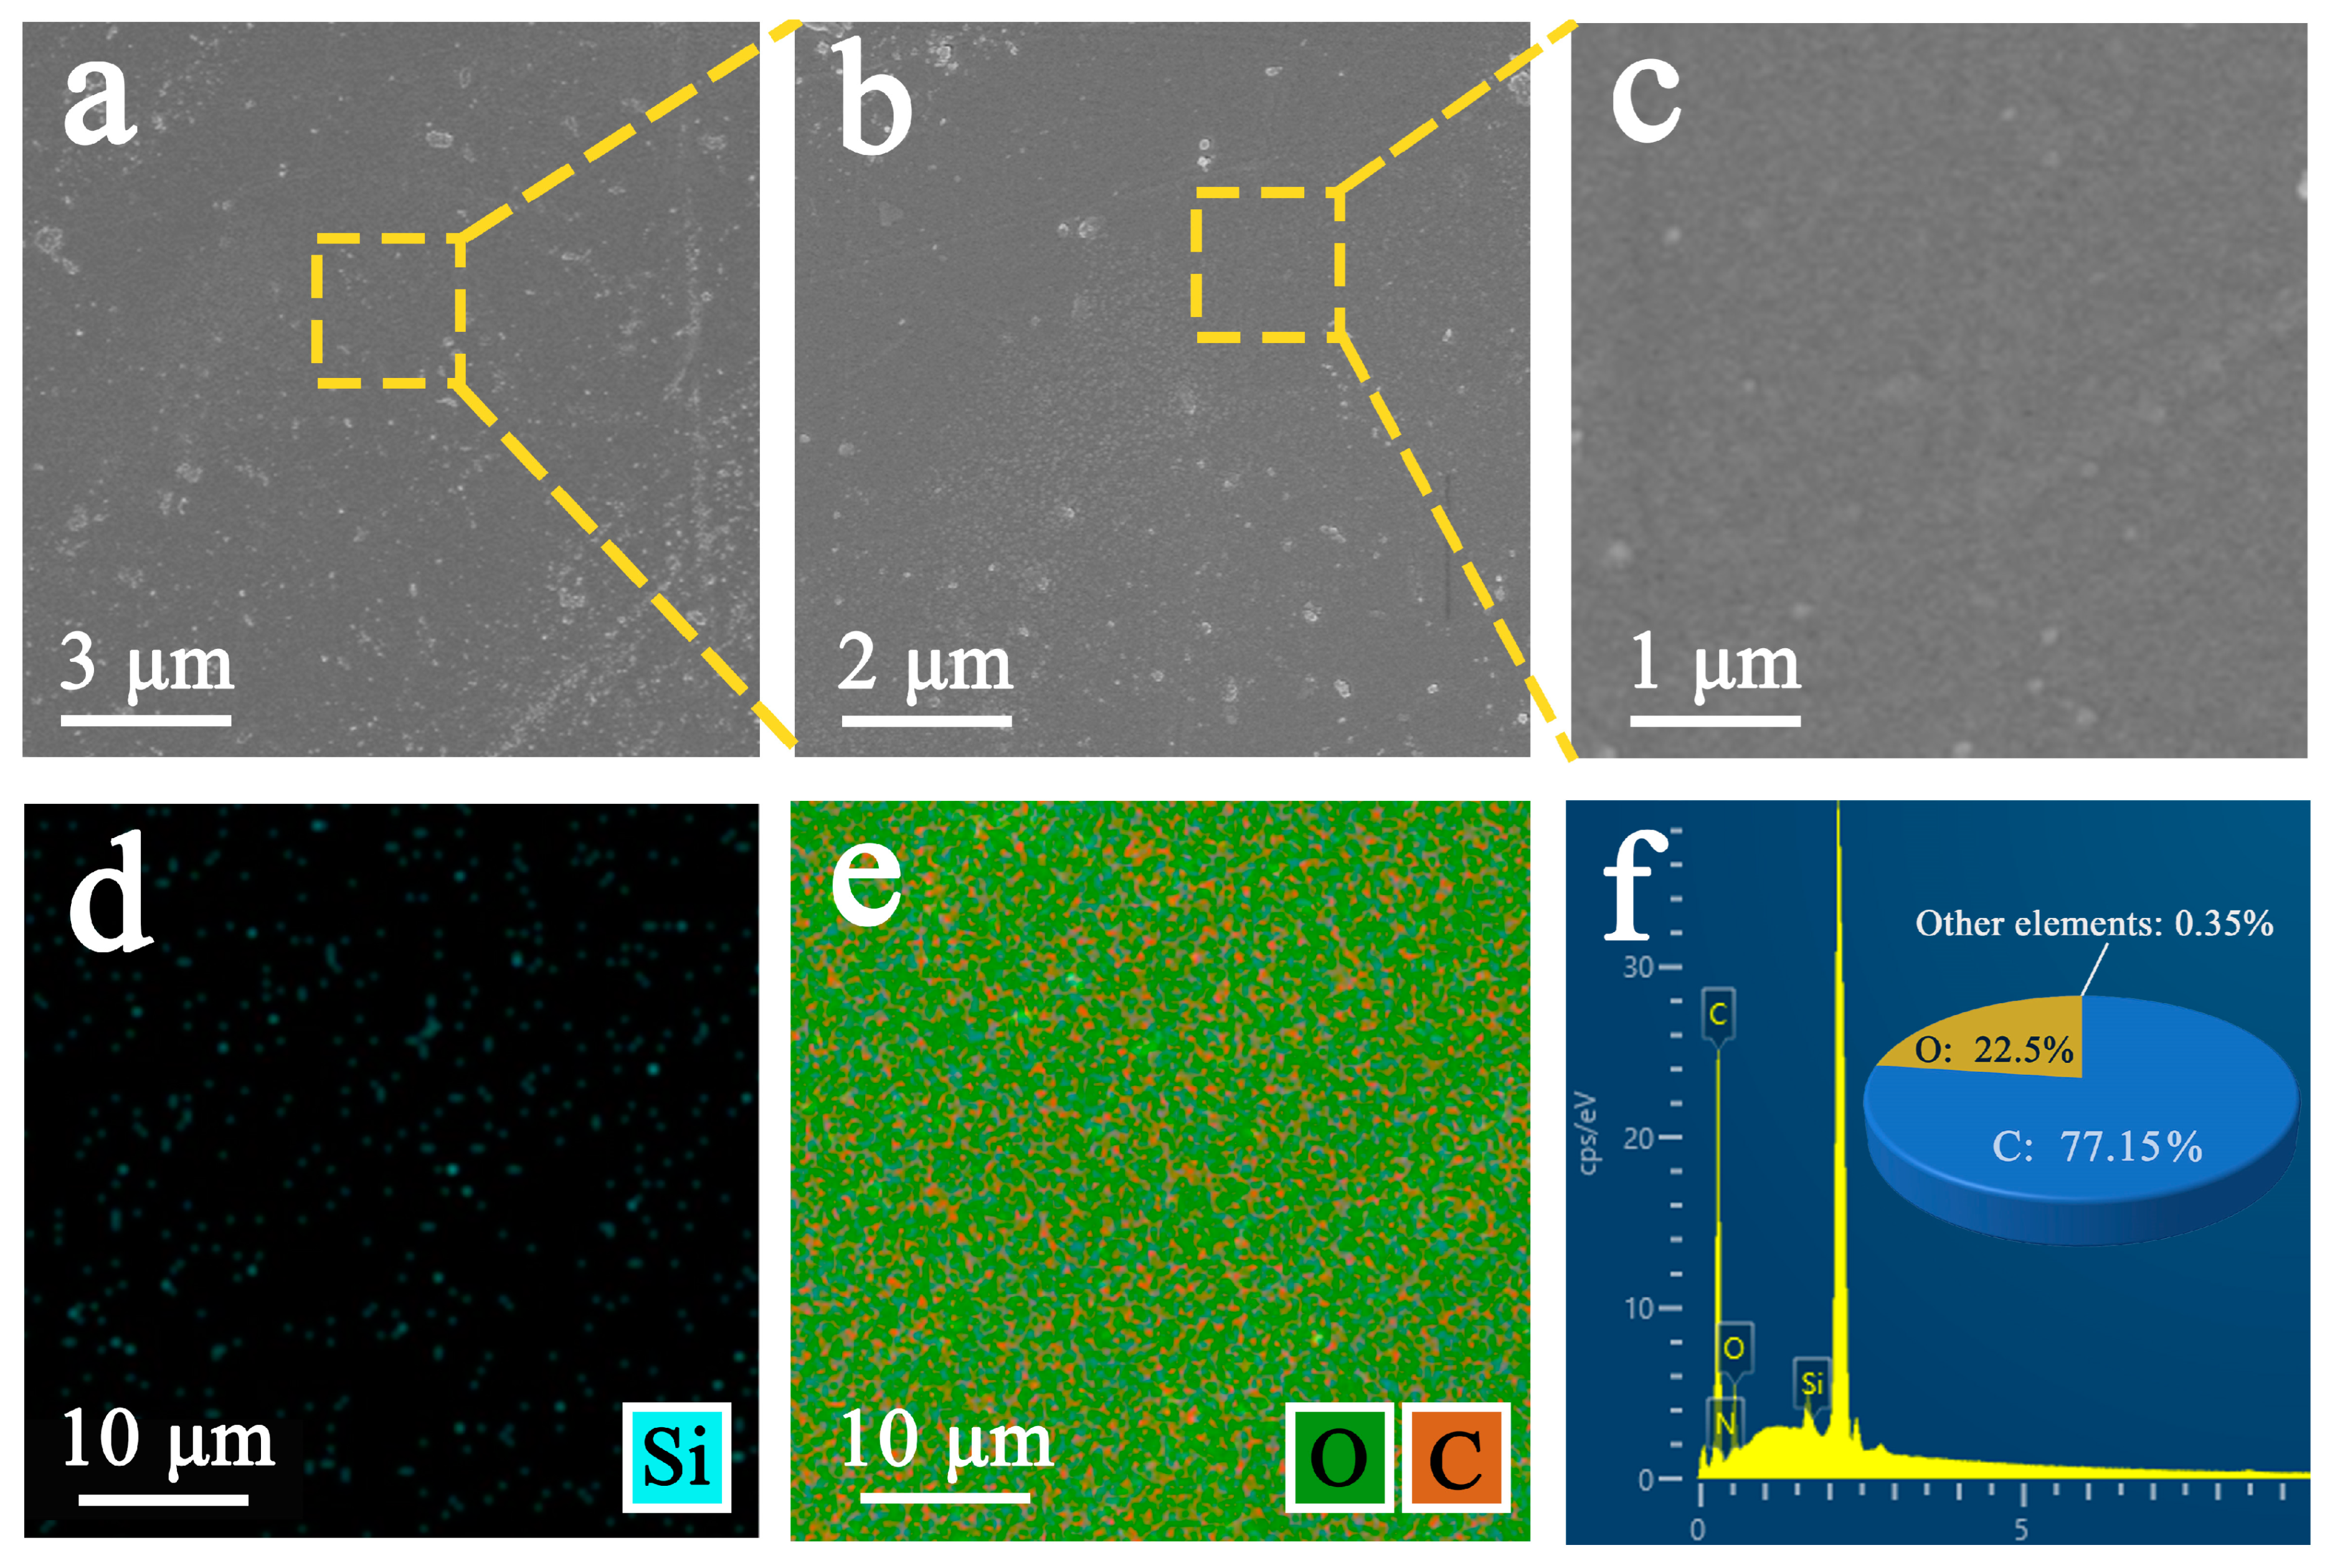
3.3.1. Analysis of Original Samples

Figure 6a–c present scanning electron micrographs of the original samples at magnifications of 2000×, 5000×, and 10,000×, respectively. Observation shows that the surface of the original sample is relatively smooth, which indicates that during actual use, water residues may remain on the lens, which may cause visual impairment problems. Figure 6d,e illustrate the distribution maps of Si, O, and C elements in the original samples, while Figure 6f displays the energy-dispersive X-ray spectroscopy (EDS) spectrum of the original sample under scanning electron microscopy. Observations indicate that the original samples contain high proportions of C and O elements with relatively random distribution patterns and exhibit an almost complete absence of Si elements. This composition is not conducive to forming superhydrophobic structures, thus impeding improvements in hydrophobic and drag-reducing performance.

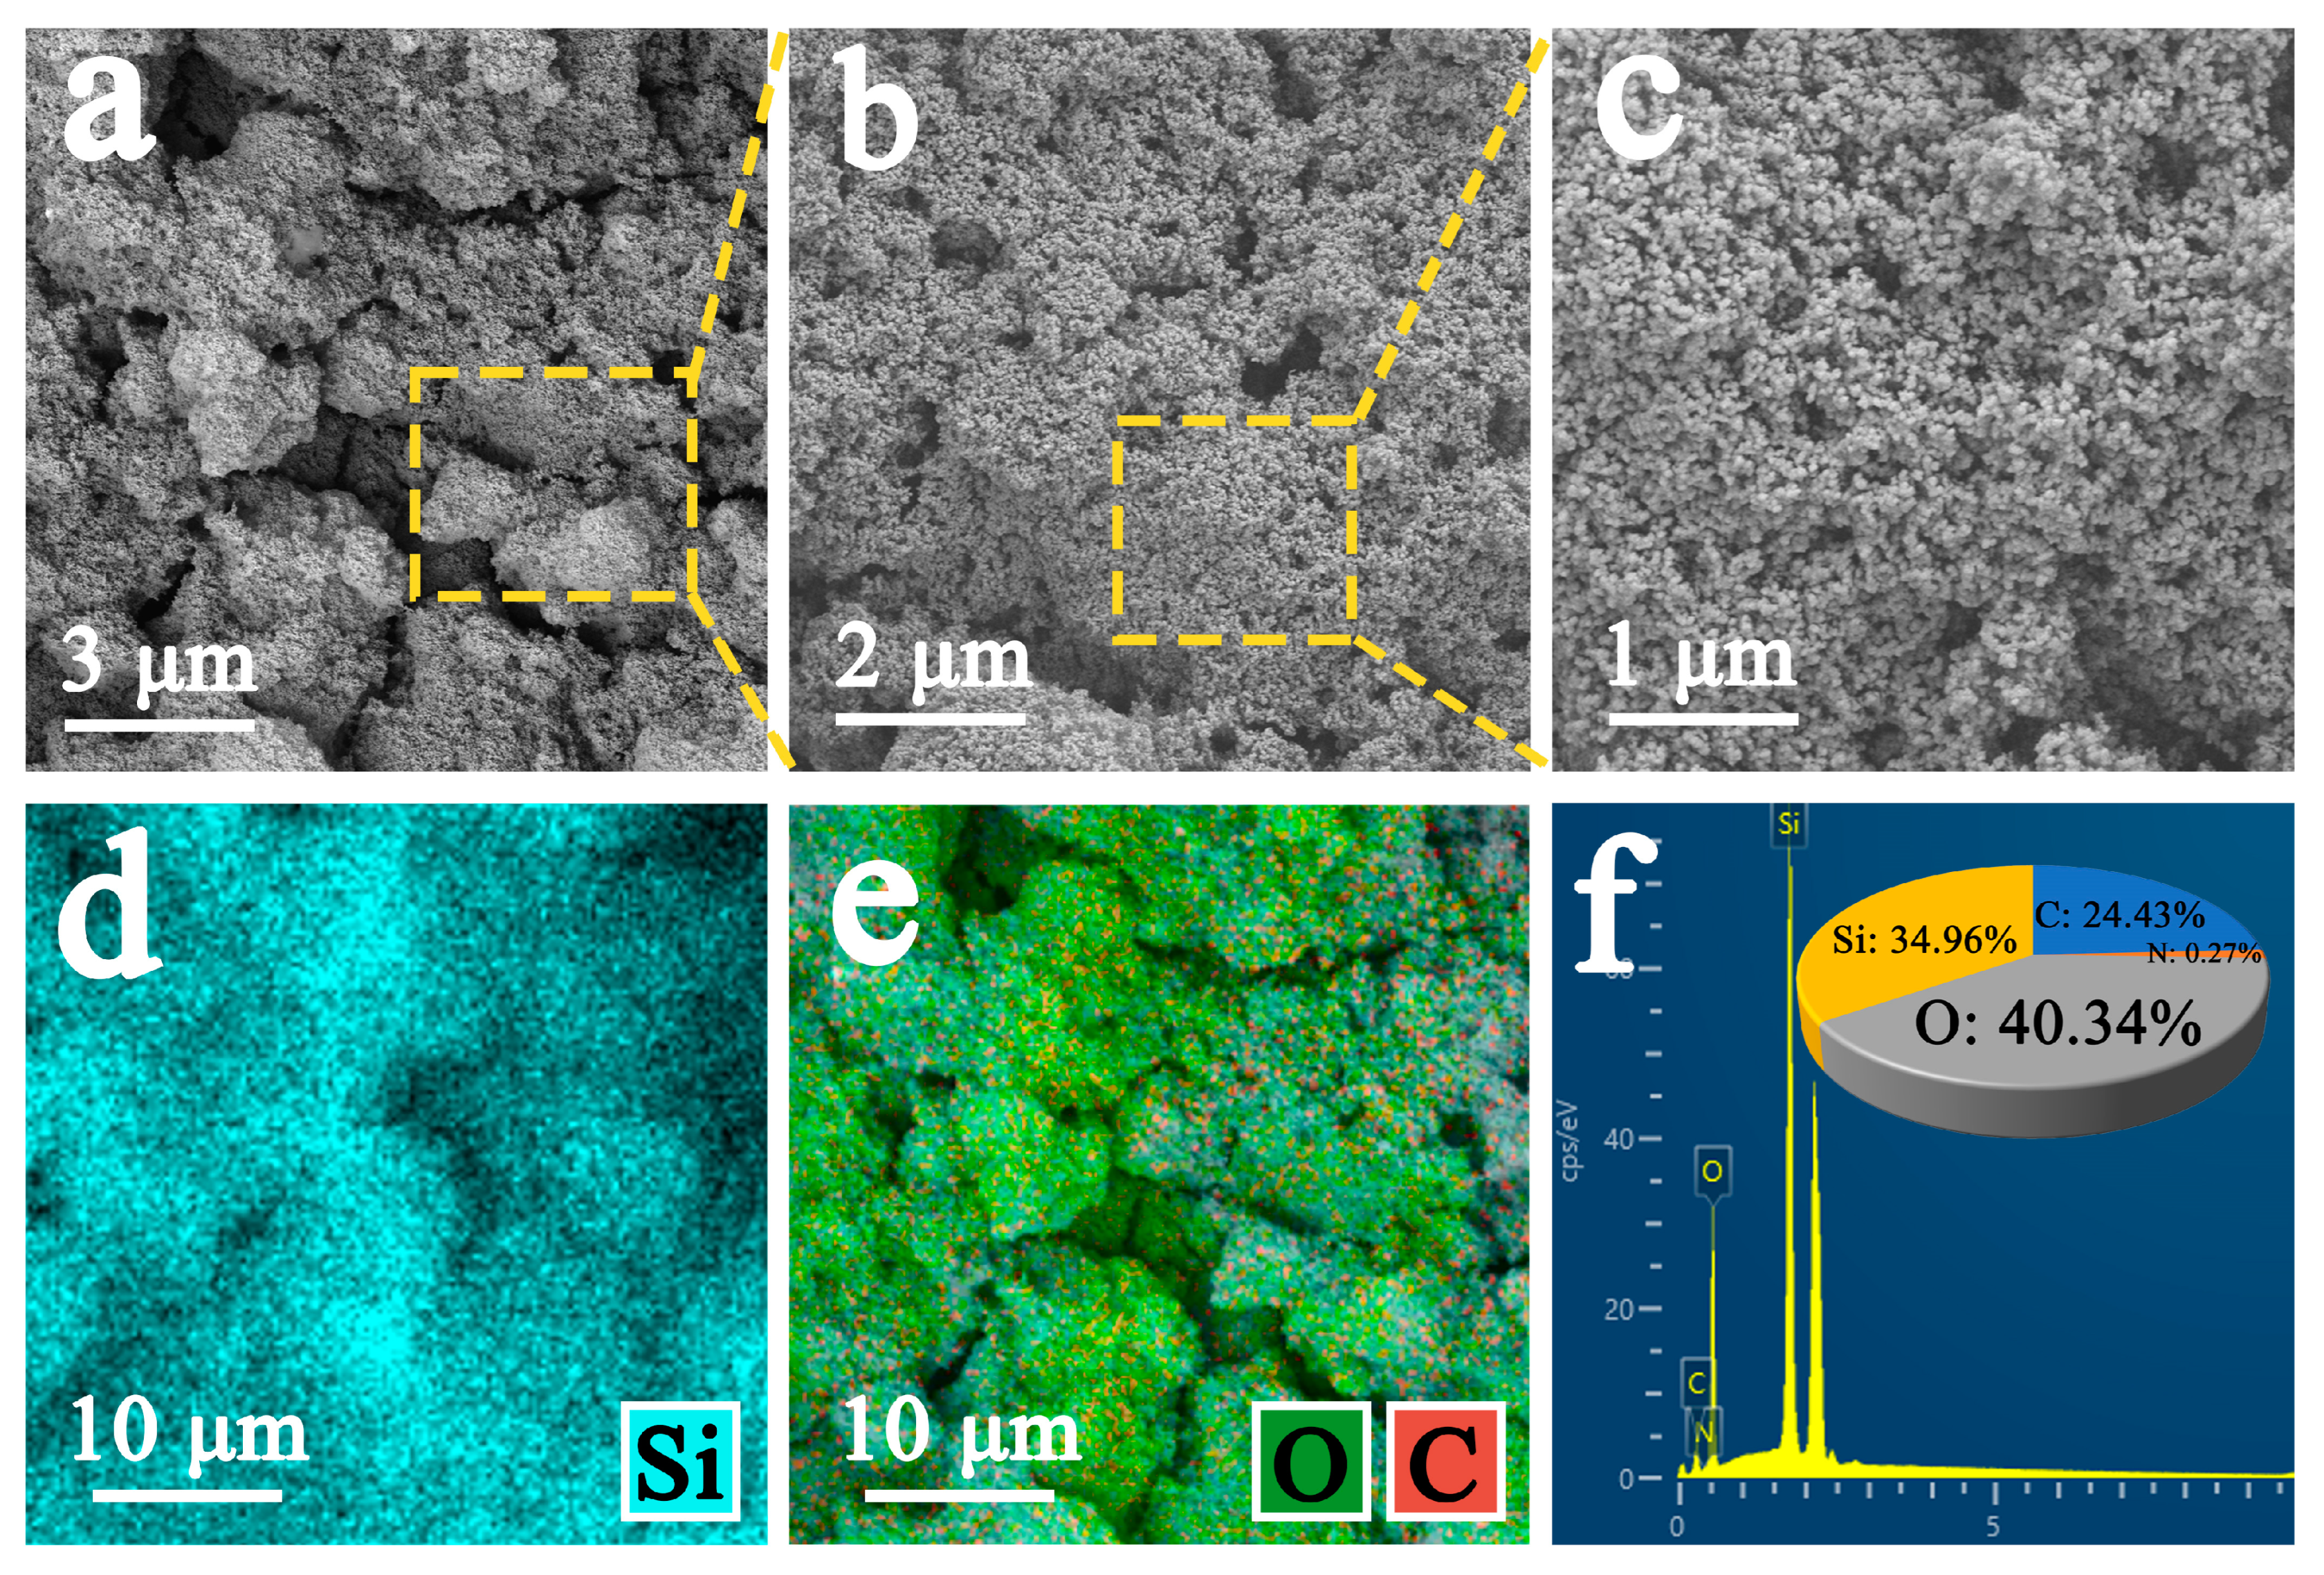
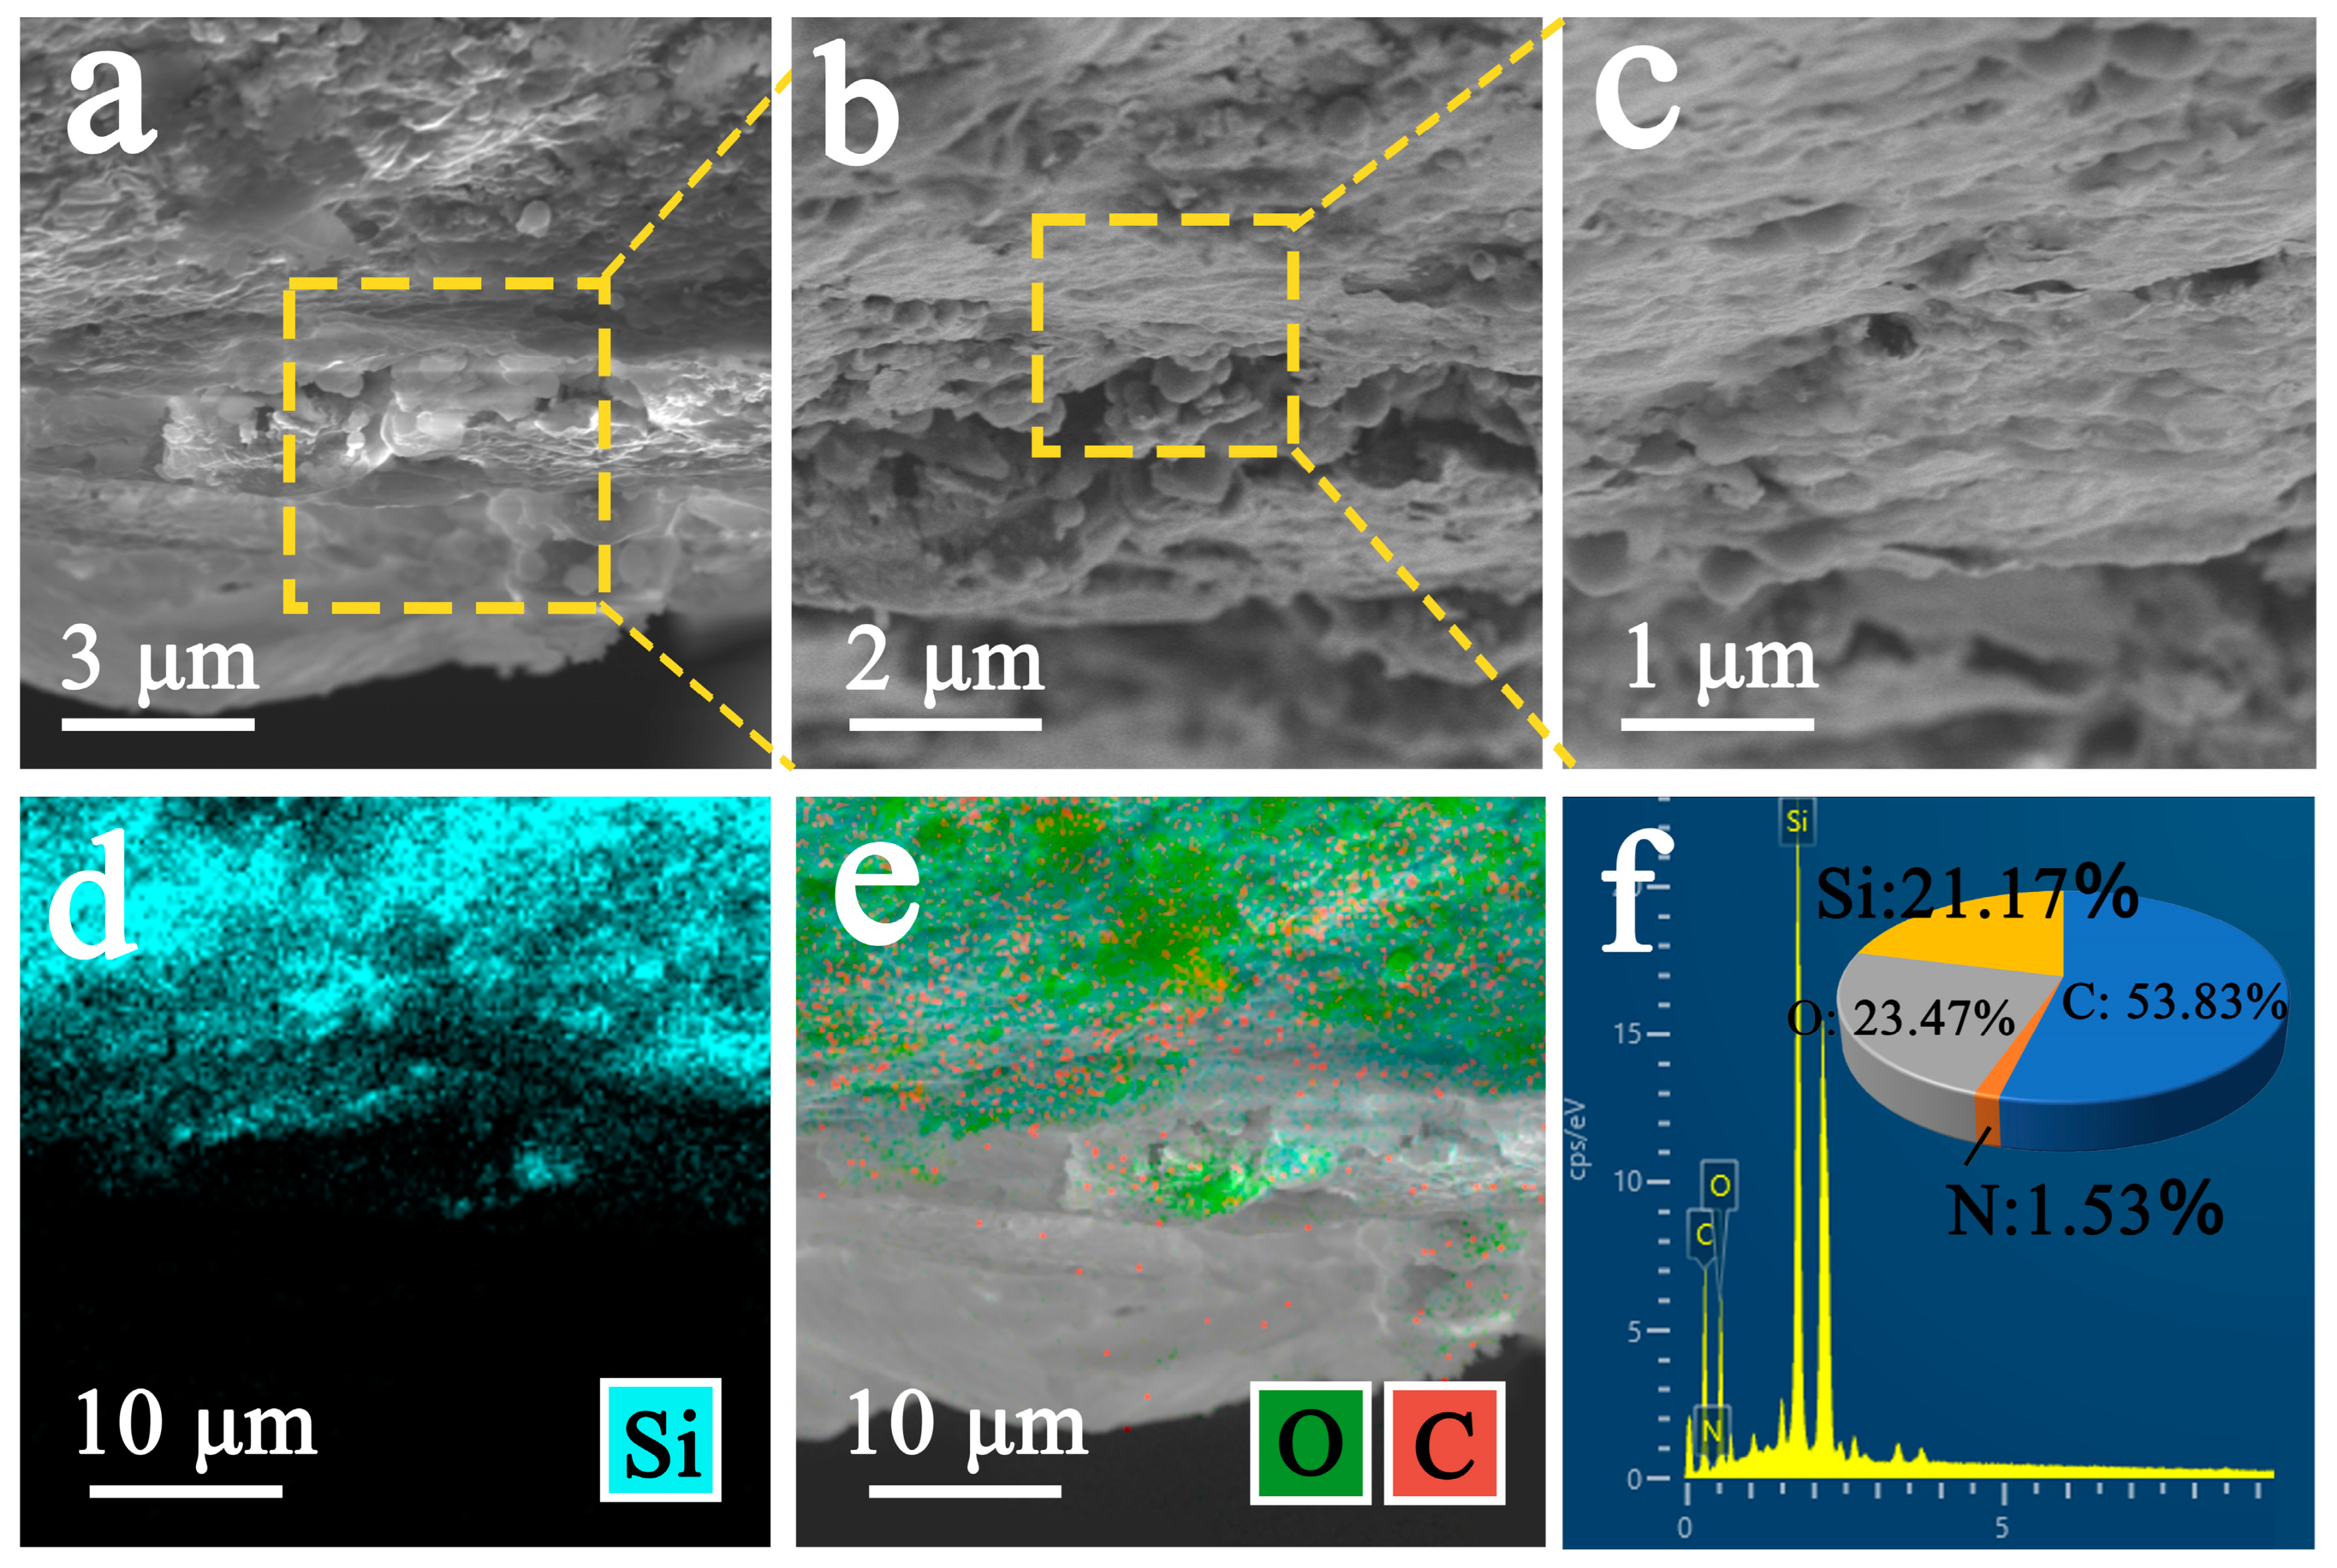
3.3.2. Analysis of Improved Sample

Figure 7a–c presents frontal electron microscope images of the improved sample at 2000×, 5000×, and 10,000× magnification, respectively. Observations reveal that Figure 7a exhibits a spherical particle-like convex–concave structure, conducive to forming the Cassie–Baxter state, which is crucial for the development of superhydrophobic coatings. This structure provides suspension points for water droplets, thereby reducing the solid–liquid contact area. The uniform distribution of particles indicates well-controlled coating preparation, establishing the foundation for superhydrophobic properties. Further magnification in Figure 7b demonstrates that the surface remains relatively uniform, indicating consistent coating quality at the nanoscale. Small pores and voids are locally visible, with irregular arrangements between particle connections. These discontinuous features reduce the spreading tendency of droplets, thus enhancing hydrophobicity.
In Figure 7c, nanoscale protrusions and textures are clearly observable on the particle surfaces. These structures are essential for superhydrophobic performance, as they work in conjunction with microscale structures to create micro-nano hierarchical architectures that exhibit superhydrophobic characteristics with low adhesion. Figure 7d, e illustrate the distribution of Si, O, and C elements in the improved sample. Compared to the original sample, the Si content has increased to 34.96% with no emergence of new elements, confirming that silicon dioxide and water-based polyurethane have not undergone chemical reactions but rather adhere tightly to the sample surface, thereby providing a stable foundation for superhydrophobic conditions.
Figure 8a–c depicts lateral electron microscopy images of the improved sample at 2000×, 5000×, and 10,000× magnification, respectively. Observations reveal that from Figure 8a–c, the coating exhibits distinct irregular layered textures. This irregular configuration of protrusions and depressions facilitates the formation of the Cassie–Baxter state, wherein water droplets predominantly rest on surface protrusions while air pockets remain trapped in the intervening cavities. This configuration substantially reduces the actual contact area between water and the surface. The contact angle hysteresis of the improved sample is 2.75 ± 1.59°, with a rolling angle of 3.5 ± 1.1°. This indicates that air trapped within the microstructures effectively reduces the solid–liquid contact area, significantly enhancing hydrophobic performance. The SiO2 particles within the coating provide relatively stable hydrophobic properties. The particulate morphology evident in the micrograph demonstrates the efficacious dispersion of SiO2 particles within the polyurethane and ethanol matrix, a characteristic that is instrumental in maintaining consistent superhydrophobic properties. These structural attributes suggest that the coating imparts robust water-repellent functionality through the dual mechanisms of minimizing solid–liquid interfacial contact and facilitating the formation of gaseous cavities at the interface.
Figure 8d,e illustrate the distribution of Si, O, and C elements in the lateral view of the improved sample. A notably dense arrangement of Si and O elements can be observed on the lateral surfaces of the coating. Compared to the original sample, the Si content has increased to 21.17% with no emergence of new elements, confirming that the silicon dioxide, water-based polyurethane, and ethanol dispersion can form a stable coating, further enhancing superhydrophobic performance.

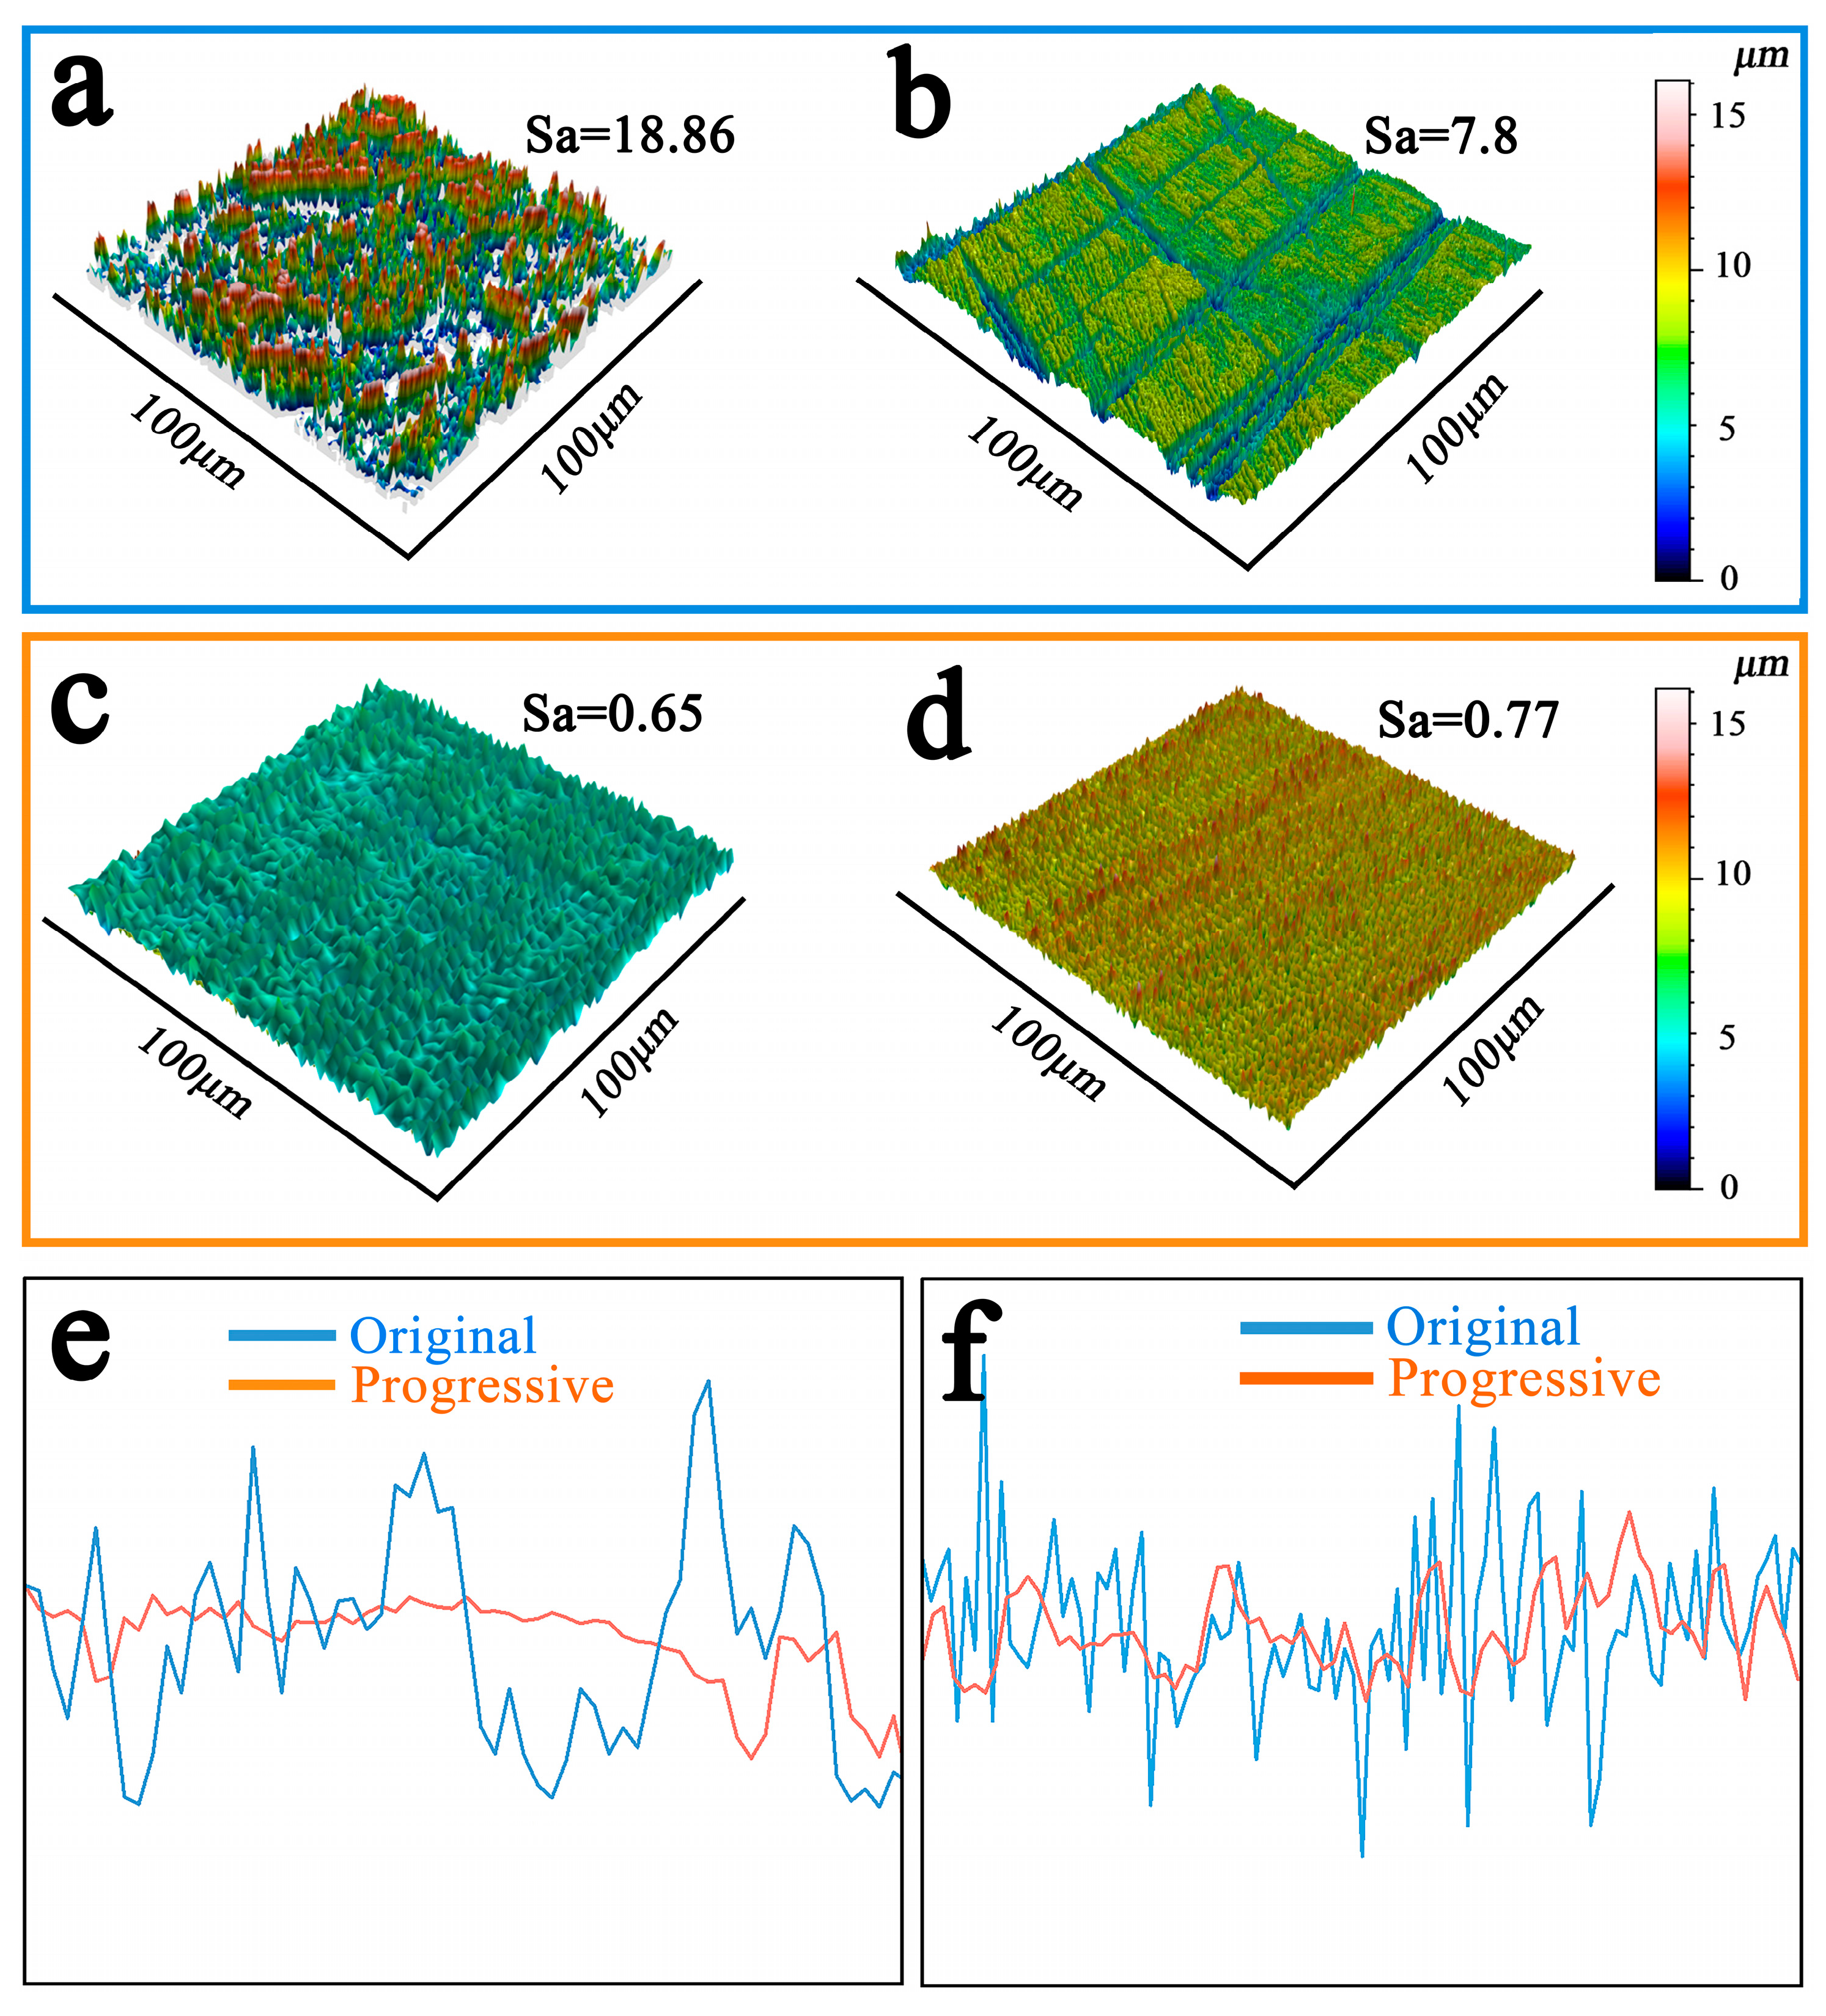
3.4. Three-Dimensional Morphological Analysis

Figure 9 presents a composite of three-dimensional morphological structures for both the original and improved samples. Figure 9a illustrates the three-dimensional morphological structure of the original sample after wear testing, while Figure 9b depicts the corresponding structure for the improved sample following identical testing conditions. Observations reveal that, following wear testing, the original sample exhibited more severe damage, with an arithmetic mean roughness (Sa) of 18.86. The damage degree of the improved sample is relatively mild, and the roughness Sa is 7.8. Post-friction testing, the improved sample maintains a smoother surface with fewer peak-valley formations, indicating superior friction resistance. These findings suggest that the original sample, lacking a protective layer, experienced direct structural degradation of the lens surface during wear testing. Conversely, the improved sample’s surface, having been treated to form a SiO2 coating, provides substantial protection to the underlying lens. While Figure 9b does reveal some surface scratches, the SiO2 coating on the improved sample demonstrably shields the lens from significant damage. Therefore, it can be inferred that under practical swimming goggle usage conditions—involving prolonged touching, wiping, and abrasion—the improved goggles would maintain superior durability and performance compared to the original design. Figure 9c presents the three-dimensional morphological structure of the original sample after immersion testing, while Figure 9d shows the corresponding structure for the improved sample. Observations indicate that, following immersion testing, the original sample exhibited an arithmetic mean roughness Sa of 0.65, while the improved sample showed an Sa of 0.77. This suggests that the SiO2 coating on the improved sample’s surface provides effective superhydrophobic properties.
Figure 9e provides a comparative three-dimensional cross-sectional profile of the original and improved samples after wear testing, while Figure 9f presents a similar comparison following immersion testing. Examination of Figure 9e reveals that the blue curve representing the original sample exhibits significantly more undulations compared to the red curve, with more pronounced peak values and deeper valley positions. This indicates that the original sample’s surface experiences had more substantial fluctuations and performance degradation after wear testing. While the improved sample also shows some undulations following wear testing, its surface remains comparatively smoother than the original sample, likely due to the protective function of the coating. Similarly, Figure 9f demonstrates that the original sample’s curve exhibits more irregular patterns than that of the improved sample, suggesting that the coating on the improved sample’s surface provides protection that enhances performance during immersion testing.
These experimental results confirm that under practical swimming goggle usage conditions—involving prolonged touching, wiping, and abrasion—the improved goggles maintain superior durability and performance compared to the original design.

3.5. Drag Reduction Analysis

Figure 10 presents a comparative analysis of the descent velocities of the improved and original samples in water, along with a schematic illustration of the forces acting upon them in an aqueous environment. Figure 10a depicts the descent process of the improved sample, while Figure 10b illustrates the corresponding process for the original sample. Observational evidence demonstrates that the improved sample maintains significantly greater stability during descent, exhibiting minimal lateral oscillations. When submerged from identical heights, the improved sample makes complete contact with the pool bottom at frame 600, whereas the original sample requires 900 frames to achieve equivalent contact. These experimental findings provide compelling evidence that the improved sample descends more rapidly through water while maintaining enhanced stability throughout the entire descent process.
Figure 10c, d represent the underwater force analysis diagrams for the improved and original samples, respectively.
The parameter h denotes the water tank height, h = 0.3 m; G (mg) denotes the gravitational force exerted on the sample, where g = 9.8 m/s2; and Fb indicates the buoyancy force experienced by the samples underwater. The variables fa and fb denote the drag forces exerted on the improved and original samples underwater, respectively, while ta and tb represent the total descent times required for the improved and original samples to complete the entire process. Finally, a ¯ a and a ¯ b signify the average acceleration rates of the improved and original samples throughout the complete process. V0 indicates the initial velocity, V0 = 0; ρ symbolizes water density, ρ = 1000 kg/m3; C refers to the drag coefficient contingent upon object morphology; and A characterizes the cross-sectional area of the object perpendicular to the fluid flow direction.
The descent processes of the improved and original samples can be represented as follows:
h = v 0 t a + 1 2 a ¯ a t a 2
h = v 0 t b + 1 2 a ¯ b t b 2
Since both samples were released from a stationary position, v 0 = 0
a ¯ a t a 2 = a ¯ b t b 2
The experimental evidence demonstrated that the improved sample first makes contact with the substrate, ta < tb
a ¯ a > a ¯ b
The force analysis for the improved sample and the original sample can be represented as follows:
m g F b f a = m a ¯ a
m g F b f b = m a ¯ b
a ¯ a > a ¯ b It can be deduced that:
f a < f b
As established by Newton’s drag formula:
f = 1 2 C ρ A v 2
wherein C represents the drag coefficient, which is contingent upon the object’s geometry. ρ denotes the density of water, approximately 1000   kg m 3 . A signifies the cross-sectional area of the object perpendicular to the flow direction. The parameter ν corresponds to the object’s velocity.
Substituting the condition t a < t b , ν a > ν b one can derive the following:
A a < A b
Through image analysis and statistics, it was found that both improved samples and original samples underwent small lateral oscillations during the descent process. The oscillation amplitude of the improved samples was approximately 2.5 ± 0.4 mm, while that of the original samples was about 6.0 ± 0.8 mm. The improved samples produced an average of 12 ± 3 visible bubbles during the descent process, while the original samples produced 30 ± 4 visible bubbles. The original samples produced more bubbles during descent and had larger oscillation amplitudes, which is consistent with the formula reasoning and proves the drag reduction effect of the coating. This validates that the SiO2 coating effectively reduces the drag experienced by samples during underwater movement, thus significantly enhancing the drag reduction performance of swimming goggles.

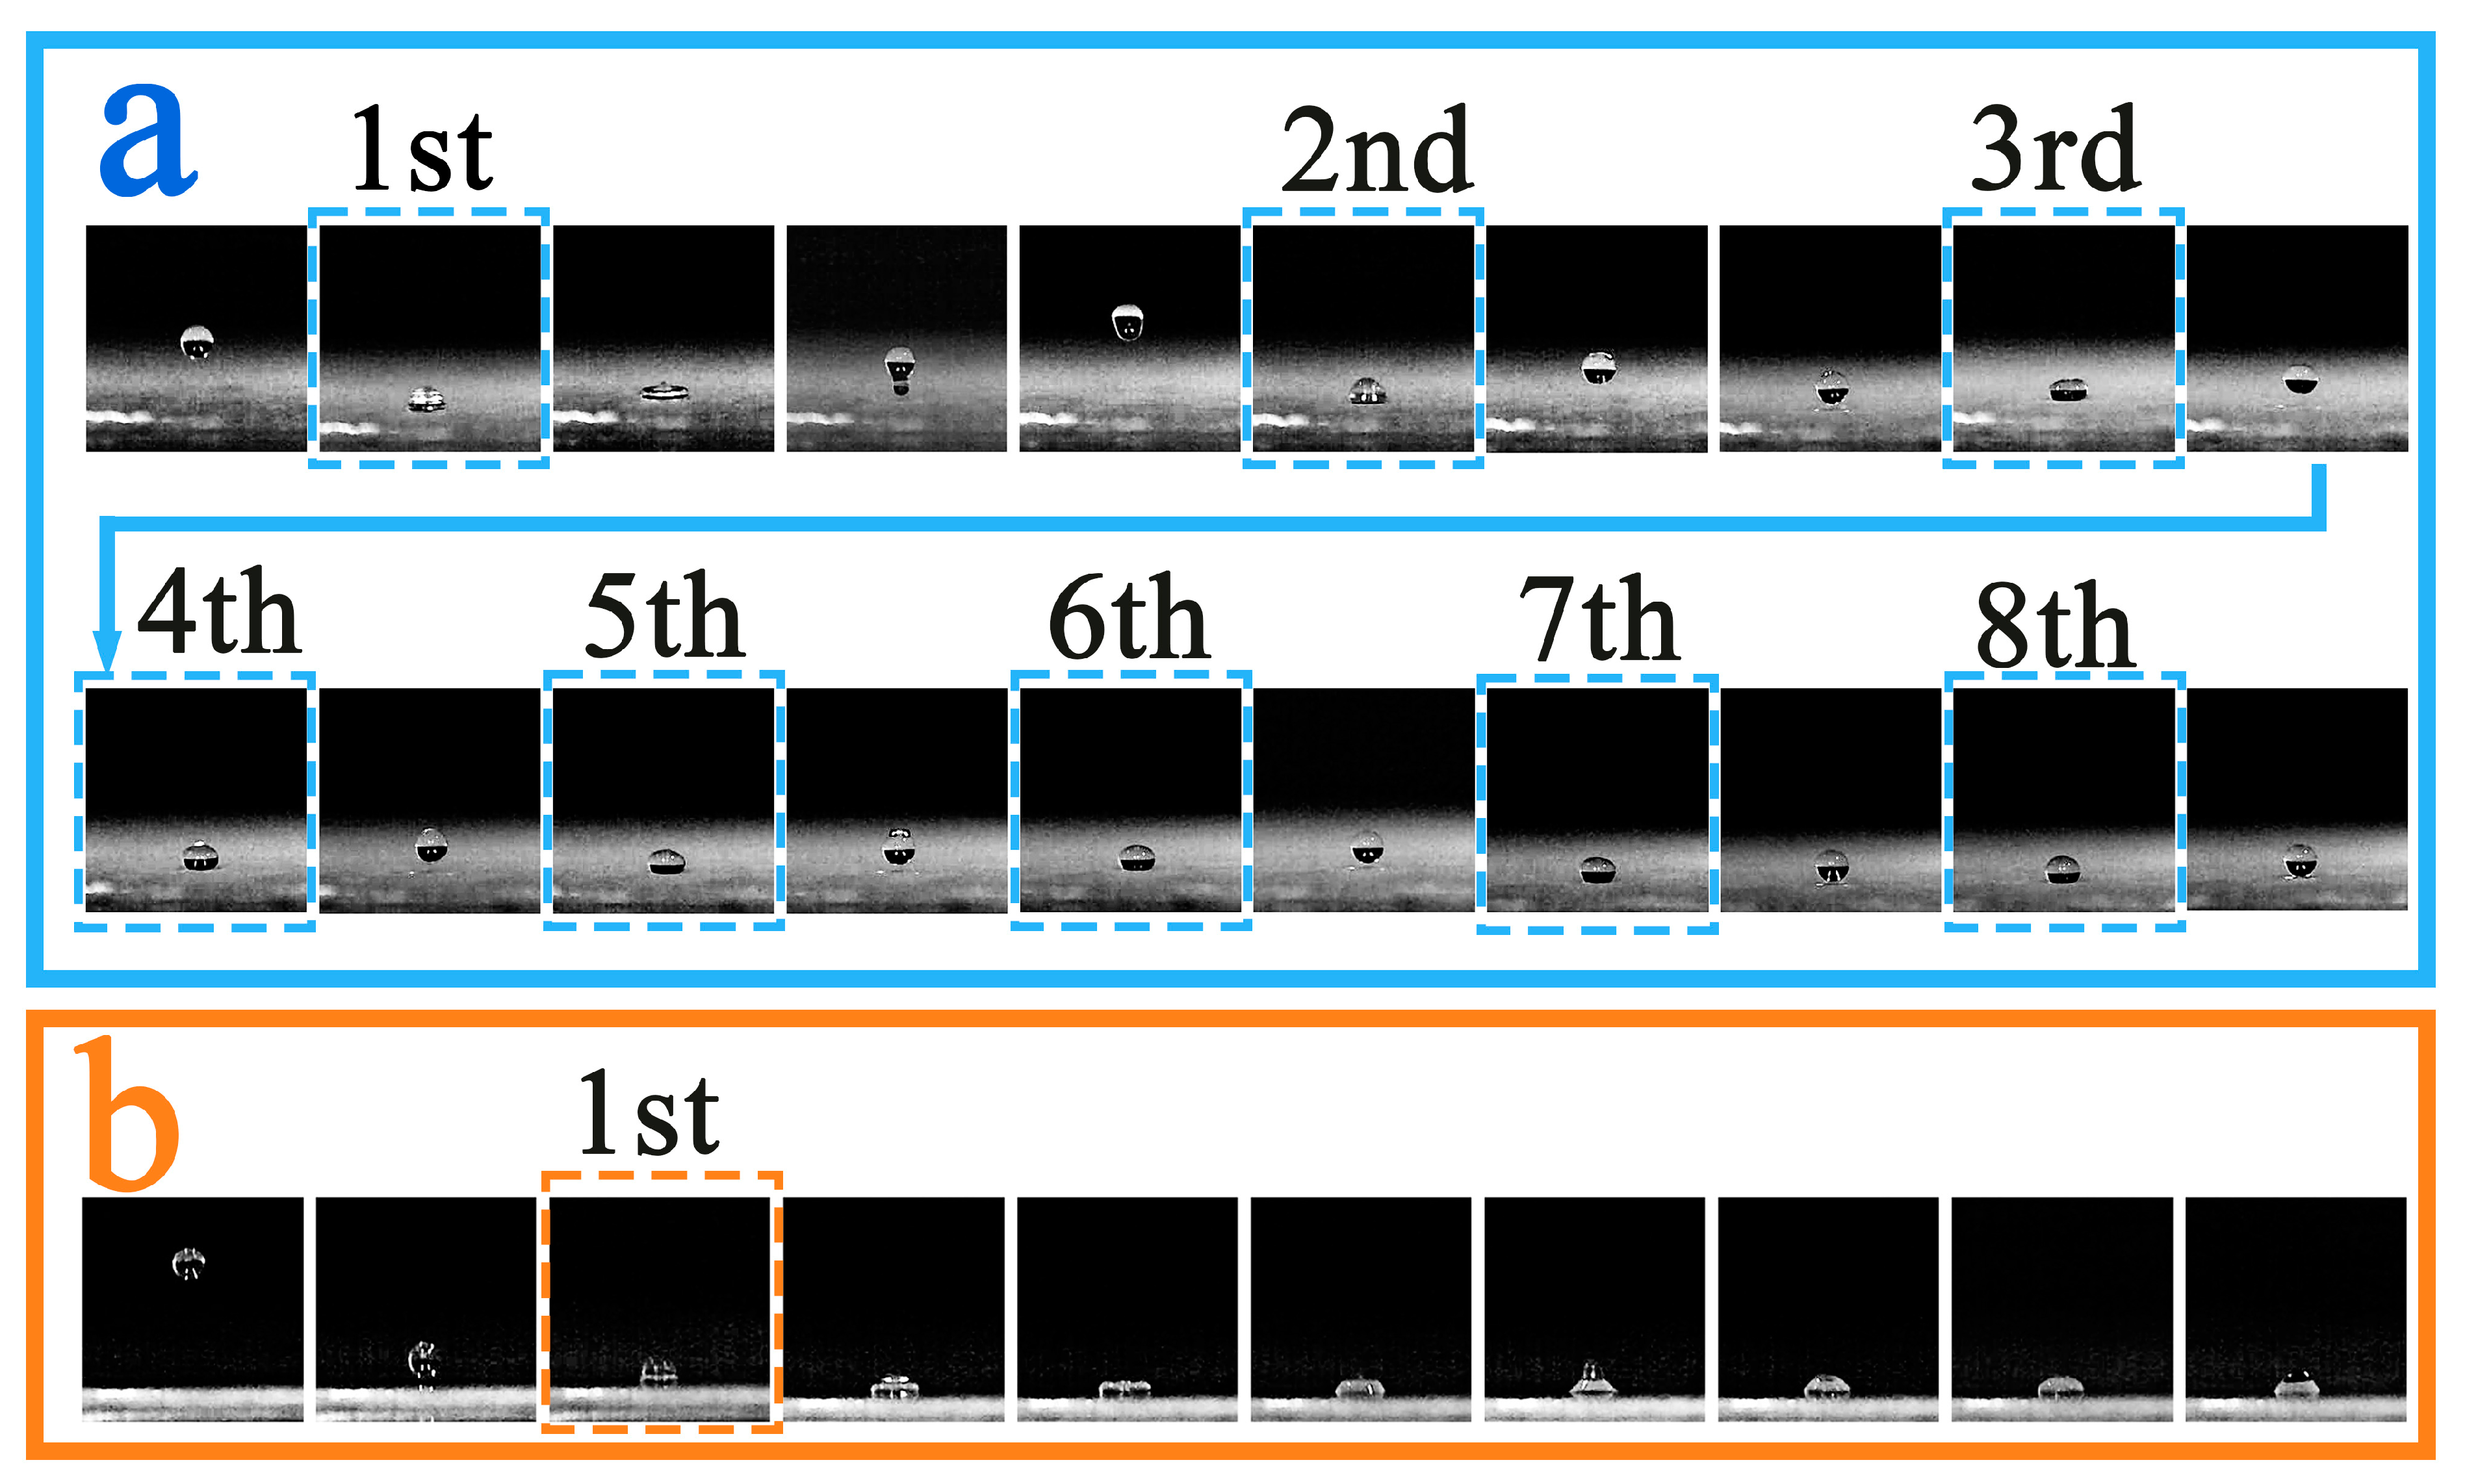
3.6. Droplet Rebound Analysis

3.6.1. Experimental Temperature 10 °C

Figure 11a presents photographic documentation of droplet rebound phenomena on the improved sample surface at 10 °C. Observational analysis reveals that water droplets executed eight consecutive rebounds on the improved sample surface, maintaining relatively stable spherical morphology during their aerial trajectory. Experimental evidence indicates diminished adhesive interactions between water droplets and the improved sample surface, accompanied by reduced surface energy, conditions conducive to the establishment of a stable Cassie–Baxter state. The sequential rebound sequence demonstrates notably abbreviated contact duration between droplets and the improved sample surface, a characteristic of considerable significance for self-cleaning and anti-icing/de-icing applications. Figure 11b illustrates droplet rebound characteristics on the original sample surface at 10 °C. The original sample exhibits markedly inferior rebound performance, with water droplets adhering directly to the sample surface and displaying irregular spherical morphology. From these observations, it can be reasonably postulated that in practical applications, improved swimming goggles lenses would effectively repel water droplets during repeated immersion and emergence from water, maintaining clean lens surfaces. This property would consequently enhance the user’s visual field and augment the overall performance of the swimming goggles.

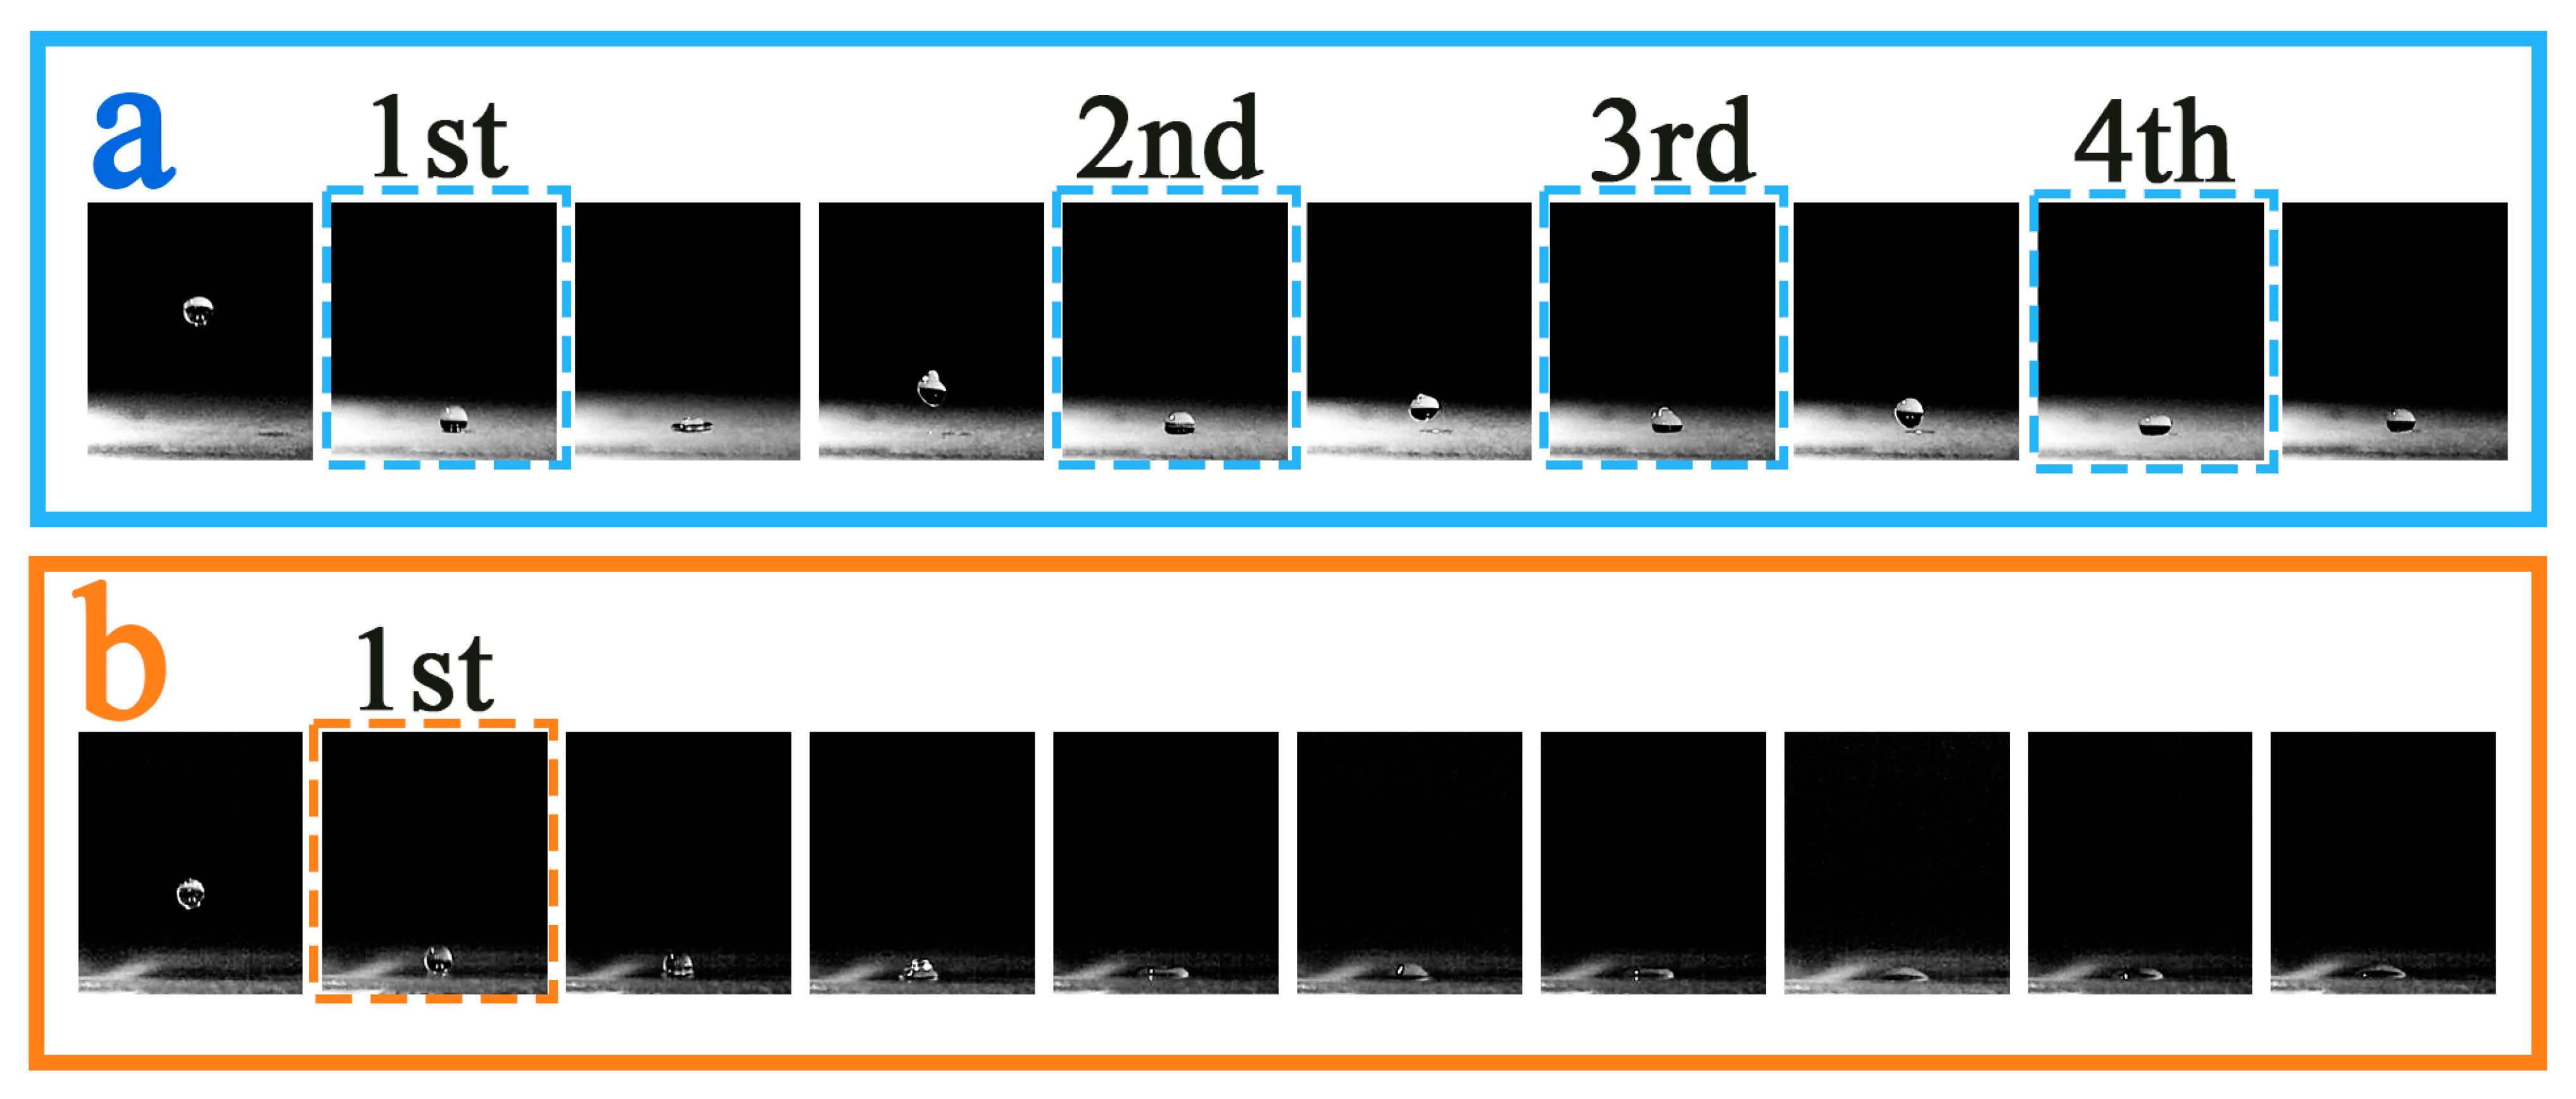
3.6.2. Experimental Temperature −10 °C

Figure 12a presents photographic documentation of droplet rebound phenomena on the improved sample surface at −10 °C. Observational analysis reveals that water droplets executed four consecutive rebounds on the improved sample surface, maintaining relatively stable spherical morphology during their aerial trajectory. Compared to the performance at 10 °C, the number of rebounds decreased by half, which can be attributed to temperature-dependent degradation of mechanical properties, decelerated molecular mobility, ice nuclei formation, and elevated viscosity and surface tension of water. The increased viscosity potentially impedes rapid droplet retraction, consequently affecting rebound frequency. Figure 12b illustrates droplet rebound characteristics on the original sample surface at −10 °C. The original sample exhibits substantially inferior rebound performance, with water droplets immediately spreading upon contact with the surface. In comparison to the original sample, the improved sample demonstrates reduced surface adhesion and superior droplet rebound capabilities. From these observations, it can be reasonably postulated that in practical applications, even in frigid winter conditions with sub-zero ambient temperatures, improved swimming goggles lenses would maintain superior performance relative to their original counterparts.

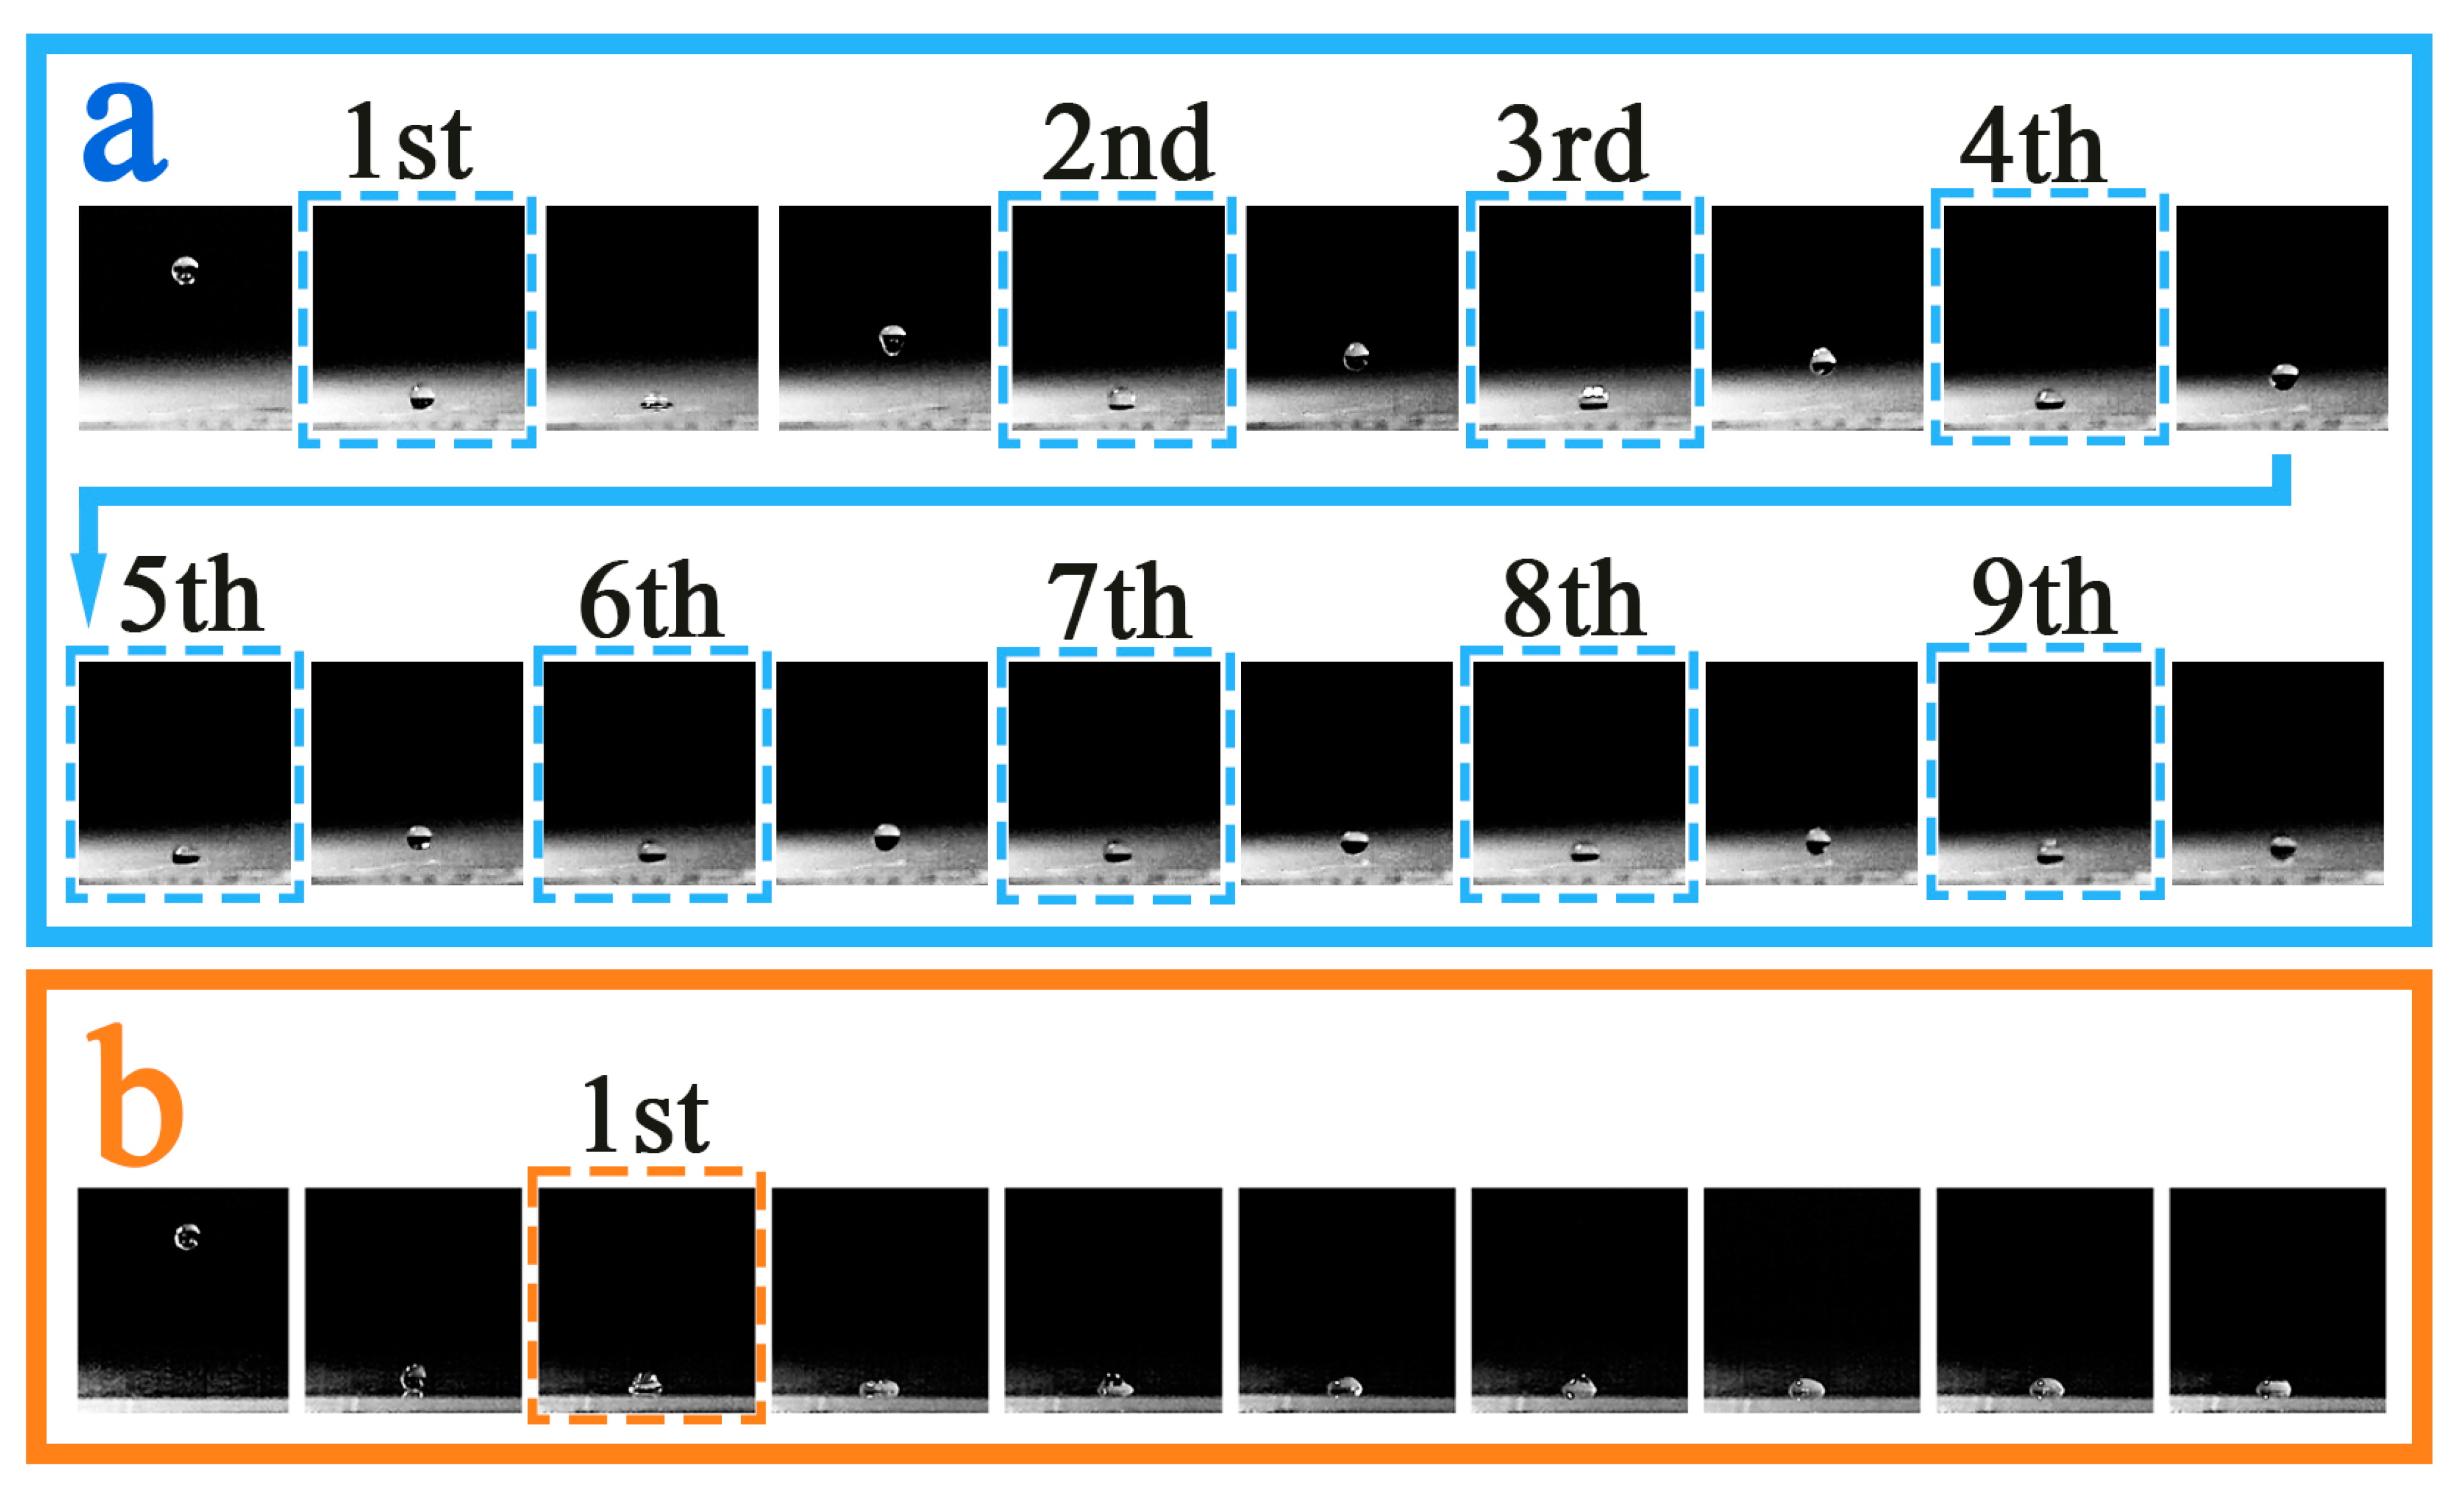
3.6.3. Experimental Temperature: 30 °C

Figure 13a presents photographic documentation of a water droplet bouncing on the improved sample surface at 30 °C. Observation reveals that water droplets consecutively bounced nine times on the improved sample surface, maintaining a relatively stable spherical configuration during each aerial phase. Compared to experimental results at 10 °C, the improved sample at 30 °C demonstrated an additional bounce, which may be attributed to elevated temperature conditions. The increase in temperature corresponds with decreases in both viscosity and surface tension properties of water. Reduced viscosity potentially facilitates more rapid droplet retraction, thereby enhancing bounce frequency. Figure 13b illustrates water droplet bouncing behavior on the original sample surface at 30 °C. Analysis indicates that water droplets adhere directly to the sample surface, exhibiting substantially inferior bouncing performance. At this time, the droplet temperature is 25 ± 1 °C and the droplet height is 10 ± 1 mm. We use a numerical control bench to control the droplet volume to be 10 μL. Using the formula We = ρv2L/σ. (ρ is the density of water, v is the fluid velocity, L is the characteristic length, and σ is the surface tension) The Weber number is calculated to be approximately 7.26 ± 0.73. Ten experiments were conducted at each temperature, and the experimental results were collected for statistical analysis: the standard deviation of the number of bounces under all different temperature conditions is ±1 time.
Comparative assessment demonstrates that the improved sample significantly outperforms the original sample in bouncing characteristics across all tested temperatures (−10 °C, 10 °C, and 30 °C). These findings suggest that in practical applications, the improved swimming goggles lens would maintain exceptional water-repellent properties across diverse temperature conditions. Users of the improved swimming goggles would benefit from consistently clear visual fields during repeated water immersion and emersion, potentially contributing to enhanced athletic performance.

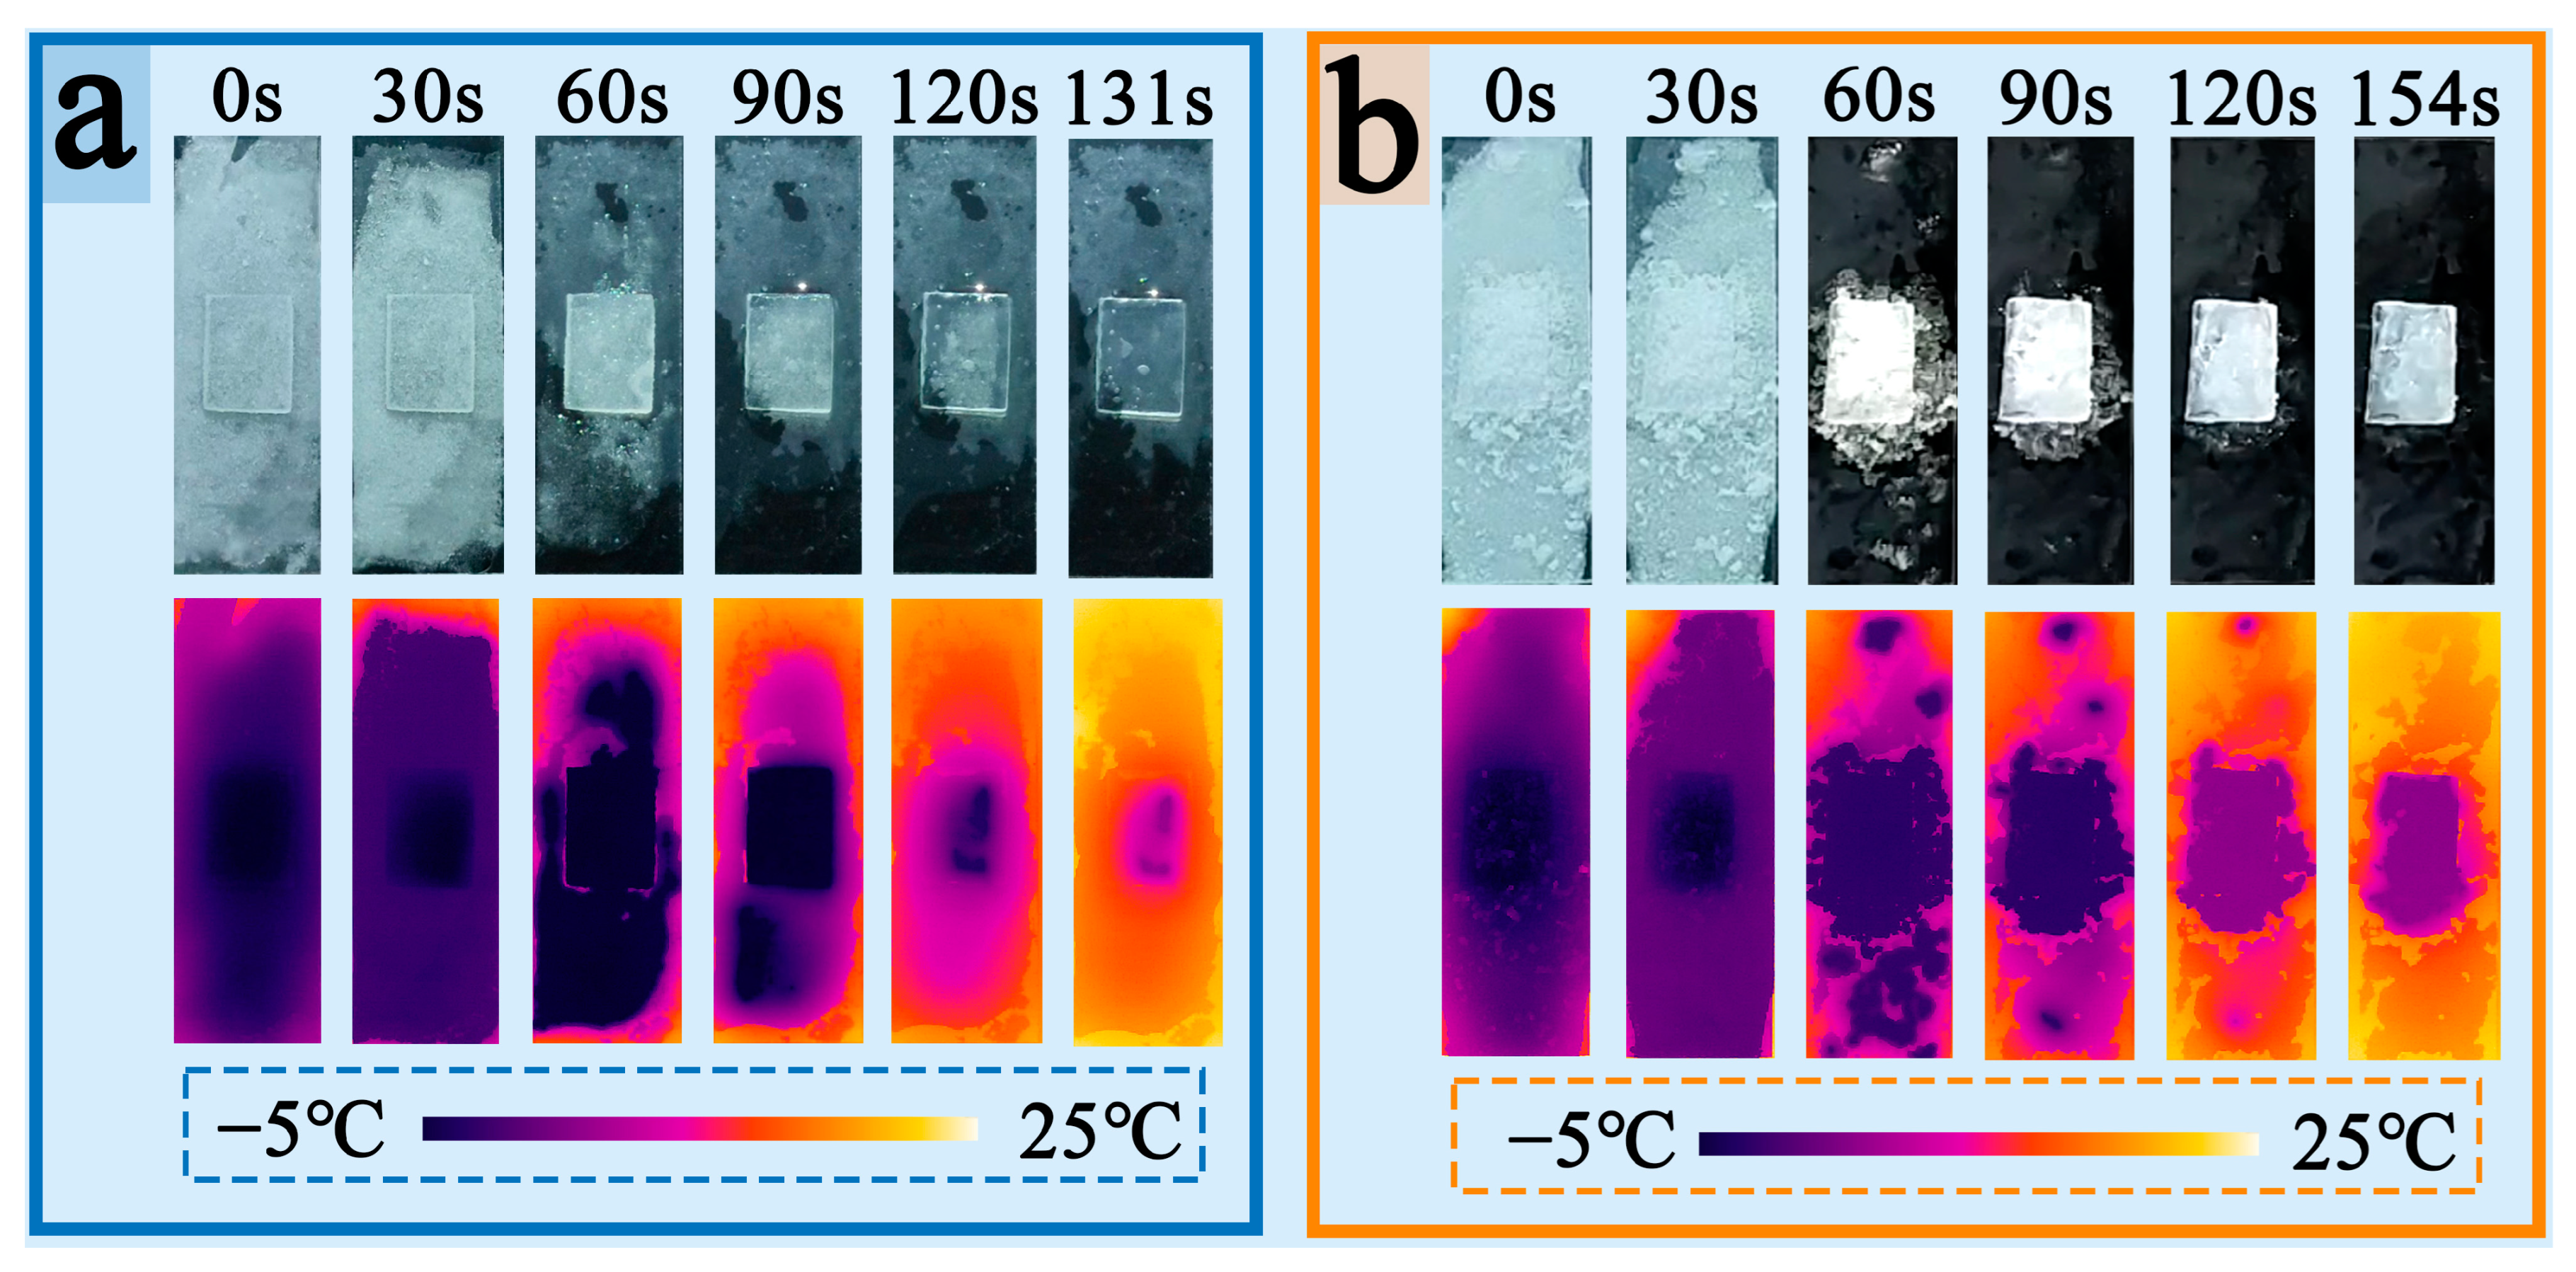
3.7. Anti-Icing Performance Analysis

The de-icing time refers to the time from when the sample is taken out of the refrigerator and placed at room temperature (25 ± 1 °C) to when the ice layer completely disappears, as determined by visual inspection and thermal imaging. Figure 14a presents photographic documentation and thermal imaging of the improved sample’s anti-icing capabilities, while Figure 14b illustrates the de-icing process and thermal imaging of the original sample. Observational analysis reveals that the improved sample completed the de-icing process in 131 s, whereas the original sample required 154 s, representing a 14.94 ± 2.37% reduction in defrosting time. This demonstrates the superior de-icing efficiency of the improved sample surface. The ice layer on the improved sample surface melted more uniformly, without notable ice–water mixture regions. The ice layer exhibited a more pronounced separation tendency from the surface, particularly after 60 s, when the melting rate at the ice layer periphery accelerated considerably. Conversely, the ice layer on the original sample surface melted non-uniformly, developing distinct ice–water mixture regions after 60 s, with evident temperature heterogeneity that impeded heat transfer toward the center and slowed the de-icing process. During the 60–90 s interval, heat transfer toward the ice layer’s center progressed more rapidly on the improved sample surface compared to the original sample. After 90 s, the overall temperature increase rate of the improved sample was markedly higher than that of the original sample. We hypothesize that the superhydrophobic coating on the improved sample surface, with its hierarchical micro-nano structure, facilitates the formation of a Cassie–Baxter state. This structural configuration significantly reduces the actual contact area between the ice layer and the solid surface. Consequently, the adhesion force between the ice layer and the surface decreases, enhancing heat transfer efficiency between the solid and ice media. This reduces the interfacial energy between ice-water and the surface, diminishing the initial formation strength of the ice layer and enhancing the surface’s drainage properties, allowing melted water to be expelled through the superhydrophobic coating and reducing the probability of refreezing. Due to the reduced contact area, heat transfer to the solid–ice interface becomes more concentrated. The superhydrophobic structure of the surface likely creates more effective heat transfer pathways, accelerating ice layer melting. These findings suggest that in practical applications, improved swimming goggles could effectively address the problem of ice–water mixture adhesion on goggle surfaces when athletes swim outdoors during winter. This provides an important theoretical foundation and experimental support for enhancing swimming goggle performance and developing superhydrophobic anti-icing and de-icing functionalities.

4. Conclusions

The comparative analysis of hydrophobic properties and wear resistance between original samples and SiO2-improved samples under standard conditions, abrasion conditions, and immersion corrosion conditions yields significant findings. The SiO2-improved samples demonstrate exceptional hydrophobic properties, achieving superhydrophobic performance under both standard and immersion conditions. Under standard conditions, the improved samples exhibit optimal surface contact angles of 162.33°. Furthermore, the Sa values of improved samples remain consistently lower than those of original samples under both abrasion and immersion conditions, indicating superior wear resistance. Additionally, the improved samples demonstrate enhanced drag reduction performance, exceeding that of the original samples by 33.33 ± 3.56%. Comparative evaluation of liquid droplet bouncing performance at varying temperatures (−10 °C, 10 °C, and 30 °C) reveals that SiO2-improved samples possess superior droplet bouncing characteristics, with maximum bounce frequency occurring at 30 °C. Moreover, the improved samples exhibit enhanced anti-icing properties, with de-icing rates accelerated by 14.94 ± 2.37% compared to the original samples. In summary, the SiO2-improved samples demonstrate substantial enhancements in hydrophobic properties, wear resistance, drag reduction performance, and anti-icing capabilities relative to the original samples. These significant improvements will considerably facilitate the widespread adoption of superhydrophobic, drag-reducing, anti-icing swimming goggles.

Author Contributions

Conceptualization, J.D.; methodology, J.D. and X.G.; data statistics, J.D. and Y.J.; formal analysis, J.D.; investigation, J.D. and G.W.; data curation, J.D.; writing—original draft preparation, J.D; writing—review and editing, J.D. and L.T.; funding acquisition, L.T. and H.L. All authors have read and agreed to the published version of the manuscript.

Funding

1. Aviation Sports Research Institute Project of Civil Aviation Flight University of China (25CAFUC09023); 2. Humanities and Social Sciences Program of the Ministry of Education of the People’s Republic of China (20YJCZH090); 3. Education Science Planning Project of Guangdong Province (2023GXJK214).

Institutional Review Board Statement

Not applicable.

Informed Consent Statement

Not applicable.

Data Availability Statement

The original contributions presented in the study are included in the article, further inquiries can be directed to the corresponding authors.

Conflicts of Interest

The authors declare no conflicts of interest.

References

  1. Pasini, E.V.; Durand, J.; Camy, S. High pressure equilibrium data of CO2/cyclohexene oxide and CO2/limonene oxide systems in the context of polycarbonate synthesis using CO2 as a co-monomer. Fluid Phase Equilibria 2025, 595, 114406. [Google Scholar] [CrossRef]
  2. Sridharan, S.; Rao, J.S.; Omkar, S.N. Finite element analysis of cricket ball impact on polycarbonate-EVA sandwich. Procedia Eng. 2015, 112, 28–33. [Google Scholar] [CrossRef]
  3. Gohil, M.; Joshi, G. Perspective of polycarbonate composites and blends properties, applications, and future development: A review. In Green Sustainable Process for Chemical and Environmental Engineering and Science: Green Composites: Preparation, Properties, and Allied Applications; Elsevier: Amsterdam, The Netherlands, 2022; pp. 393–424. [Google Scholar] [CrossRef]
  4. Daly, M.; Chihi, M.; Bouraoui, C.; Tarfaoui, M. Advancing composite materials: Exploring thermomechanical properties of Aerosil/polycarbonate composites via additive manufacturing. J. Manuf. Process. 2024, 131, 1770–1783. [Google Scholar] [CrossRef]
  5. Huang, G.; Guo, Y.; Lee, B.; Chen, H.; Mao, A. Research Advances and Future Perspectives of Superhydrophobic Coatings in Sports Equipment Applications. Molecules 2025, 30, 644. [Google Scholar] [CrossRef]
  6. Park, J.; Mehrubeoglu, M.; Kim, J.; Park, J. Comparison of design characteristics and customization protocols for swimming goggles. Electronics 2020, 9, 992. [Google Scholar] [CrossRef]
  7. Berg, B.K.; Irwin, C.C.; Wright, P.M.; Irwin, R.L.; Hutchinson, M. An unacceptable status quo: A sport development case study of swimming and drownings. Sport Manag. Rev. 2016, 19, 454–465. [Google Scholar] [CrossRef]
  8. Zhang, Y.; Li, X.; Zheng, J.; Kang, J.; Cai, G. Research on interactive sports game experience in physical training system based on digital entertainment technology and sensor devices. Entertain. Comput. 2025, 52, 100866. [Google Scholar] [CrossRef]
  9. Bharath, K.N.; Joshi, A.G.; Taj, A.; Gouda, P.S.; Nagamadhu, M. Evolution and recent advancements of composite materials in sports applications. In Applications of Composite Materials in Engineering; Elsevier Science Ltd.: Amsterdam, The Netherlands, 2025; pp. 219–228. [Google Scholar]
  10. Carr, K.E. Shifting Currents: A World History of Swimming; Reaktion Books: London, UK, 2022. [Google Scholar]
  11. Wu, G.; Liu, H.B.; Ma, C.; Xu, H.M.; Ren, X.Z.; Sun, W. Developments and application of fish school swimming model in recirculating aquaculture systems. Ocean Eng. 2025, 319, 120196. [Google Scholar] [CrossRef]
  12. Vera, J.; Redondo, B.; Molina, R.; Jiménez, R. Effects of wearing swimming goggles on non-invasive tear break-up time in a laboratory setting. J. Optom. 2022, 15, 154–159. [Google Scholar] [CrossRef]
  13. Hongjiang, Y.; Xiaoqiong, H.; Yue, K.; Ping, C.; Jing, C.; Yunhua, Y. Effectiveness of 2 Pretreatment Methods in Antifogging of Goggles in a COVID-19 Isolation Ward: A Randomized Controlled Trial. J. Emerg. Nurs. 2022, 48, 571–582. [Google Scholar] [CrossRef]
  14. Chang, C.C.; Huang, F.H.; Chang, H.H.; Don, T.M.; Chen, C.C.; Cheng, L.P. Preparation of water-resistant antifog hard coatings on plastic substrate. Langmuir 2012, 28, 17193–17201. [Google Scholar] [CrossRef] [PubMed]
  15. Ding, J.; He, X. Research on super-hydrophobic surface treatment and performance of tennis hand glue. J. Polym. Res. 2022, 29, 185. [Google Scholar] [CrossRef]
  16. Guo, W.; Liu, C.; Li, N.; Xi, M.; Che, Y.; Jiang, C.; Zhang, S.; Wang, Z. A highly transparent and photothermal composite coating for effective anti-/de-icing of glass surfaces. Nanoscale Adv. 2022, 4, 2884–2892. [Google Scholar] [CrossRef]
  17. Kanzaki, M. Melting of silica up to 7 GPa. J. Am. Ceram. Soc. 1990, 73, 3706–3707. [Google Scholar] [CrossRef]
  18. LaRoche, J.R.; Ren, F.; Lothian, R.; Hong, J.; Pearton, S.J.; Lambers, E.; Hsu, C.H.; Wu, C.S.; Hoppe, M. Thermal stability and etching characteristics of electron beam deposited SiO and SiO2. J. Vac. Sci. Technol. B Microelectron. Nanometer Struct. Process. Meas. Phenom. 2000, 18, 283–287. [Google Scholar] [CrossRef]
  19. Wang, D.; Sun, Q.; Hokkanen, M.J.; Zhang, C.; Lin, F.Y.; Liu, Q.; Zhu, S.P.; Zhou, T.; Chang, Q.; He, B.; et al. Design of robust superhydrophobic surfaces. Nature 2020, 582, 55–59. [Google Scholar] [CrossRef]
  20. Irajizad, P.; Al-Bayati, A.; Eslami, B.; Shafquat, T.; Nazari, M.; Jafari, P.; Kashyap, V.; Masoudi, A.; Araya, D.; Ghasemi, H. Stress-localized durable icephobic surfaces. Mater. Horiz. 2019, 6, 758–766. [Google Scholar] [CrossRef]
  21. Li, R.; Li, M.; Wu, X.; Yu, H.; Jin, R.; Liang, J. A pine needle-like superhydrophobic Zn/ZnO coating with excellent mechanochemical robustness and corrosion resistance. Mater. Des. 2023, 225, 111583. [Google Scholar] [CrossRef]
  22. Liu, C.; Li, Y.; Lu, C.; Liu, Y.; Feng, S.; Liu, Y. Robust slippery liquid-infused porous network surfaces for enhanced anti-icing/deicing performance. ACS Appl. Mater. Interfaces 2020, 12, 25471–25477. [Google Scholar] [CrossRef]
  23. Liu, L.; Xie, Z.; Wen, L.; Pi, P.; Qian, Y.; Wang, S.; Wen, X. Efficient collection and directional transport of condensate on superhydrophilic-hydrophobic surfaces with bioinspired hierarchical wedge-shaped channels. Surf. Interfaces 2024, 55, 105473. [Google Scholar] [CrossRef]
  24. Li, A.; Li, G.; Xu, Y.; Jia, Y.; Liu, Y. Superhydrophobic surface with good anti-icing properties and high durability. Colloids Surf. A Physicochem. Eng. Asp. 2024, 698, 134539. [Google Scholar] [CrossRef]
  25. He, Q.; Jia, Y.; Wang, H.; He, J.; Wang, J.; Xu, Y.; Liu, Y.; Li, A. Triple conversion strategy to build anti-de-icing sheets for the leading edge of the rotor blade. Mater. Des. 2024, 237, 112516. [Google Scholar] [CrossRef]
  26. He, Q.; Du, Z.; Jia, Y.; Liu, Y.; Xu, Z.; Xu, Y.; Li, A. Preparation of superhydrophobic conductive micro/nano-graphite/PDMS films on paper by simple spraying method. J. Appl. Polym. Sci. 2024, 141, e55160. [Google Scholar] [CrossRef]
  27. Zhang, M.; Li, H. Robust and UV-durable superhydrophobic SiO2/ZnO/micro-structures on glass substrate with high transmittance. Mater. Chem. Phys. 2025, 338, 130634. [Google Scholar] [CrossRef]
  28. Wang, L.; Zheng, Z.; Yan, S.; Dong, S. Adhesion force characterization method of water-droplet sliding on superhydrophobic surface. Surf. Interfaces 2025, 60, 106073. [Google Scholar] [CrossRef]
  29. Li, A.; Wang, G.; Ma, Y.; Zhao, C.; Zhang, F.; He, Q.; Zhang, F. Study on preparation and properties of superhydrophobic surface of RTV silicone rubber. J. Mater. Res. Technol. 2021, 11, 135–143. [Google Scholar] [CrossRef]
  30. Rao, A.V.; Kulkarni, M.M.; Bhagat, S.D. Transport of liquids using superhydrophobic aerogels. J. Colloid Interface Sci. 2005, 285, 413–418. [Google Scholar]
  31. Xu, C.; Feng, R.; Song, F.; Wu, J.M.; Luo, Y.Q.; Wang, X.L.; Wang, Y.Z. Continuous and controlled directional water transportation on a hydrophobic/superhydrophobic patterned surface. Chem. Eng. J. 2018, 352, 722–729. [Google Scholar] [CrossRef]
  32. Wang, Y.; Xu, Y.; Su, F. Damage accumulation model of ice detach behavior in ultrasonic de-icing technology. Renew. Energy 2020, 153, 1396–1405. [Google Scholar] [CrossRef]
  33. Wen, R.; Ma, X.; Lee, Y.C.; Yang, R. Liquid-vapor phase-change heat transfer on functionalized nanowired surfaces and beyond. Joule 2018, 2, 2307–2347. [Google Scholar] [CrossRef]
  34. Durán, I.R.; Laroche, G. Water drop-surface interactions as the basis for the design of anti-fogging surfaces: Theory, practice, and applications trends. Adv. Colloid Interface Sci. 2019, 263, 68–94. [Google Scholar] [CrossRef] [PubMed]
  35. Wang, P.; Qi, X.; Fang, X.; Teng, C.; Guo, Y.; Liu, C.; Chen, X.; Cui, H. Durable self-cleaning anti-fog and antireflective micro-nano structures fabricated by laser marker ablation of Si coated glass. Ceram. Int. 2024, 50, 31402–31417. [Google Scholar] [CrossRef]
  36. Sethi, S.K.; Manik, G. Recent progress in super hydrophobic/hydrophilic self-cleaning surfaces for various industrial applications: A review. Polym.-Plast. Technol. Eng. 2018, 57, 1932–1952. [Google Scholar] [CrossRef]
Figure 1. Schematic diagram of the sample preparation process.
Coatings 15 00664 g001
Figure 2. (a,b) Scanning electron micrographs of SiO2 particles. (c) Comparative Fourier transform infrared spectroscopy analysis.
Coatings 15 00664 g002
Figure 3. Statistical chart of contact angles for original and modified samples. (a) Contact angle photograph of original sample surface. (b) Contact angle photograph of modified sample surface. (c) Actual hydrophobicity demonstration of modified sample. (d) Rolling Angle of the modified sample.
Coatings 15 00664 g003
Figure 4. Statistical chart of contact angles for original and modified samples after wear testing. (a) Contact angle photograph of original sample surface. (b) Contact angle photograph of modified sample surface. (c) Actual photograph of original sample.
Coatings 15 00664 g004
Figure 5. Statistical chart of contact angles for original and modified samples after immersion testing. (a) Contact angle photograph of original sample surface. (b) Contact angle photograph of modified sample surface. (c) Rolling Angle of the modified sample.
Coatings 15 00664 g005
Figure 6. (ac) Scanning electron micrographs of original samples. (df) Elemental distribution maps of original samples.
Coatings 15 00664 g006
Figure 7. (ac) Improved sample electron microscopy images. (df) Elemental distribution maps of the improved sample.
Coatings 15 00664 g007
Figure 8. (ac) Cross-sectional electron microscopy images of the improved sample. (df) Elemental distribution maps of the improved sample cross-section.
Coatings 15 00664 g008
Figure 9. (a,b) Three-dimensional morphological images of original and improved samples after wear testing. (c,d) Three-dimensional morphological images of original and improved samples after immersion testing. (e,f) Cross-sectional profile trends of original and improved samples.
Coatings 15 00664 g009
Figure 10. (a) Descent photographs of the improved sample in water. (b) Descent photographs of the original sample in water. (c,d) Underwater force analysis diagrams of the improved and original samples.
Coatings 15 00664 g010
Figure 11. (a) Photographic documentation of droplet rebound phenomena on the improved sample surface at 10 °C. (b) Photographic documentation of droplet rebound phenomena on the original sample surface at 10 °C.
Coatings 15 00664 g011
Figure 12. (a) Droplet bouncing photographs on the improved sample at −10 °C. (b) Droplet bouncing photographs on the original sample at −10 °C.
Coatings 15 00664 g012
Figure 13. (a) Droplet bouncing photographs on the improved sample at 30 °C. (b) Droplet bouncing photographs on the original sample at 30 °C.
Coatings 15 00664 g013
Figure 14. (a) Photographs and thermal imaging of the icing and de-icing process for the modified sample. (b) Photographs and thermal imaging of the icing and de-icing process for the original sample.
Coatings 15 00664 g014
Disclaimer/Publisher’s Note: The statements, opinions and data contained in all publications are solely those of the individual author(s) and contributor(s) and not of MDPI and/or the editor(s). MDPI and/or the editor(s) disclaim responsibility for any injury to people or property resulting from any ideas, methods, instructions or products referred to in the content.

