1. Introduction
Graphene, a two-dimensional material composed of a single layer of carbon atoms arranged in a hexagonal lattice, has garnered significant attention due to its exceptional electrical, mechanical, and thermal properties. Among the various methods developed for graphene synthesis, chemical vapor deposition (CVD) has emerged as one of the most promising techniques for producing high-quality, large-area graphene films. Central to the success of CVD-based graphene growth is the choice of substrate, with copper (Cu) being one of the most widely utilized materials. This preference stems from copper’s low carbon solubility, which facilitates the self-limiting growth of monolayer graphene, and its suitability for clean, straightforward transfer processes. Notably, the Cu(111) crystallographic surface offers an atomic lattice that closely matches that of graphene, making it particularly conducive to uniform graphene nucleation and growth. Recent studies have also investigated aromatic hydrocarbons on Cu(111) and showed that their adsorption and stepwise dehydrogenation contribute to graphene formation [
1].
Understanding the fundamental thermodynamic and kinetic mechanisms that govern graphene growth on Cu(111) is essential for optimizing the synthesis parameters and improving the material quality. Methane (CH4) is commonly used as the carbon precursor in CVD processes, and its decomposition into active carbon species on the copper surface is a key step in graphene formation. However, the detailed energetics and atomistic pathways of methane dissociation and subsequent carbon cluster nucleation remain areas of active investigation.
While previous studies have provided valuable insights into the adsorption behavior of hydrocarbon precursors and the catalytic role of Cu(111) surfaces, comprehensive investigations integrating thermodynamic modeling with atomic-level simulations remain limited. The present study distinguishes itself by coupling density functional theory (DFT), molecular dynamics (MD), and kinetic Monte Carlo (KMC) simulations with thermodynamic analysis, thereby offering a multiscale approach to understanding both the equilibrium and kinetic aspects of graphene growth. This integrated framework enables a more detailed and predictive understanding of how process parameters influence deposition mechanisms, which is crucial for advancing controllable CVD synthesis strategies.
In this work, we employed density functional theory (DFT) to analyze the dissociation of methane and the adsorption behavior of carbon clusters on the Cu(111) surface. Molecular dynamics (MD) simulations were used to optimize atomic configurations and compute reaction energies. Furthermore, kinetic Monte Carlo (KMC) simulations provided insight into the time-resolved dynamics of carbon atom diffusion and graphene nucleation. To complement these atomistic models, a thermodynamic analysis based on equilibrium composition data was conducted to explore the impact of temperature, pressure, and the CH4/H2 partial pressure ratio on the deposition rate. Together, these methods offer a comprehensive understanding of the CVD graphene growth mechanism on Cu(111), with implications for process optimization and controlled synthesis.
3. Graphene Growth Mechanism Based on Kinetic Monte Carlo Method
Due to the copper substrate surface, the gas flow is divided into two mechanisms: a mass transfer mechanism and surface reaction mechanism [
18]. The kinetic Monte Carlo model (KMC) method was further utilized to simulate the growth of graphene using the CVD method to calculate the mass transport coefficient,
, of the reactant gas in the mass transport process using methane as the carbon source.
where
is the gas diffusion coefficient and satisfies
where
= 273 K,
is the standard atmospheric pressure,
is the diffusion coefficient constant. Here,
= 4.86 × 10
−5 and
= 1.81; substituting these into the
expression, we obtain Equation (12):
where the average boundary layer thickness is set as
= 0.02 m. The mass transport coefficient
of the reacting gases at different growth temperatures and pressures was numerically simulated for a horizontal reactor (as shown in
Figure 6, with a chamber length of 140 cm, a base surface of 6 cm, and a diameter of 8 cm), which is commonly used in laboratories today [
19]. Each gas component at the inlet was set to CH
4:H
2 = 15:7 (sccm), and the growth temperature was 1310 K. The results of calculating the changes in methane concentration at both atmospheric pressure (101,325 pa) and low pressure (660 pa) with the time step set to 1 s are shown in
Figure 7 and
Figure 8.
To improve the accuracy and robustness of the results, a sensitivity analysis was carried out to investigate the influence of the boundary layer thickness () on the mass transfer behavior. The simulations were repeated with values of 0.005 m, 0.01 m, 0.02 m, and 0.03 m to evaluate their impact on the calculated mass transfer coefficient hg and the spatial distribution of the methane concentration. The results revealed that significantly affects the mass transport dynamics, particularly under low-pressure conditions, where slight variations in led to noticeable differences in gas concentration gradients. This finding underscores the importance of considering the dependence on in mass transfer modeling, as fixed values may underestimate the boundary layer’s influence on the reaction kinetics. Incorporating this analysis enhances the reliability and physical relevance of the simulation outcomes.
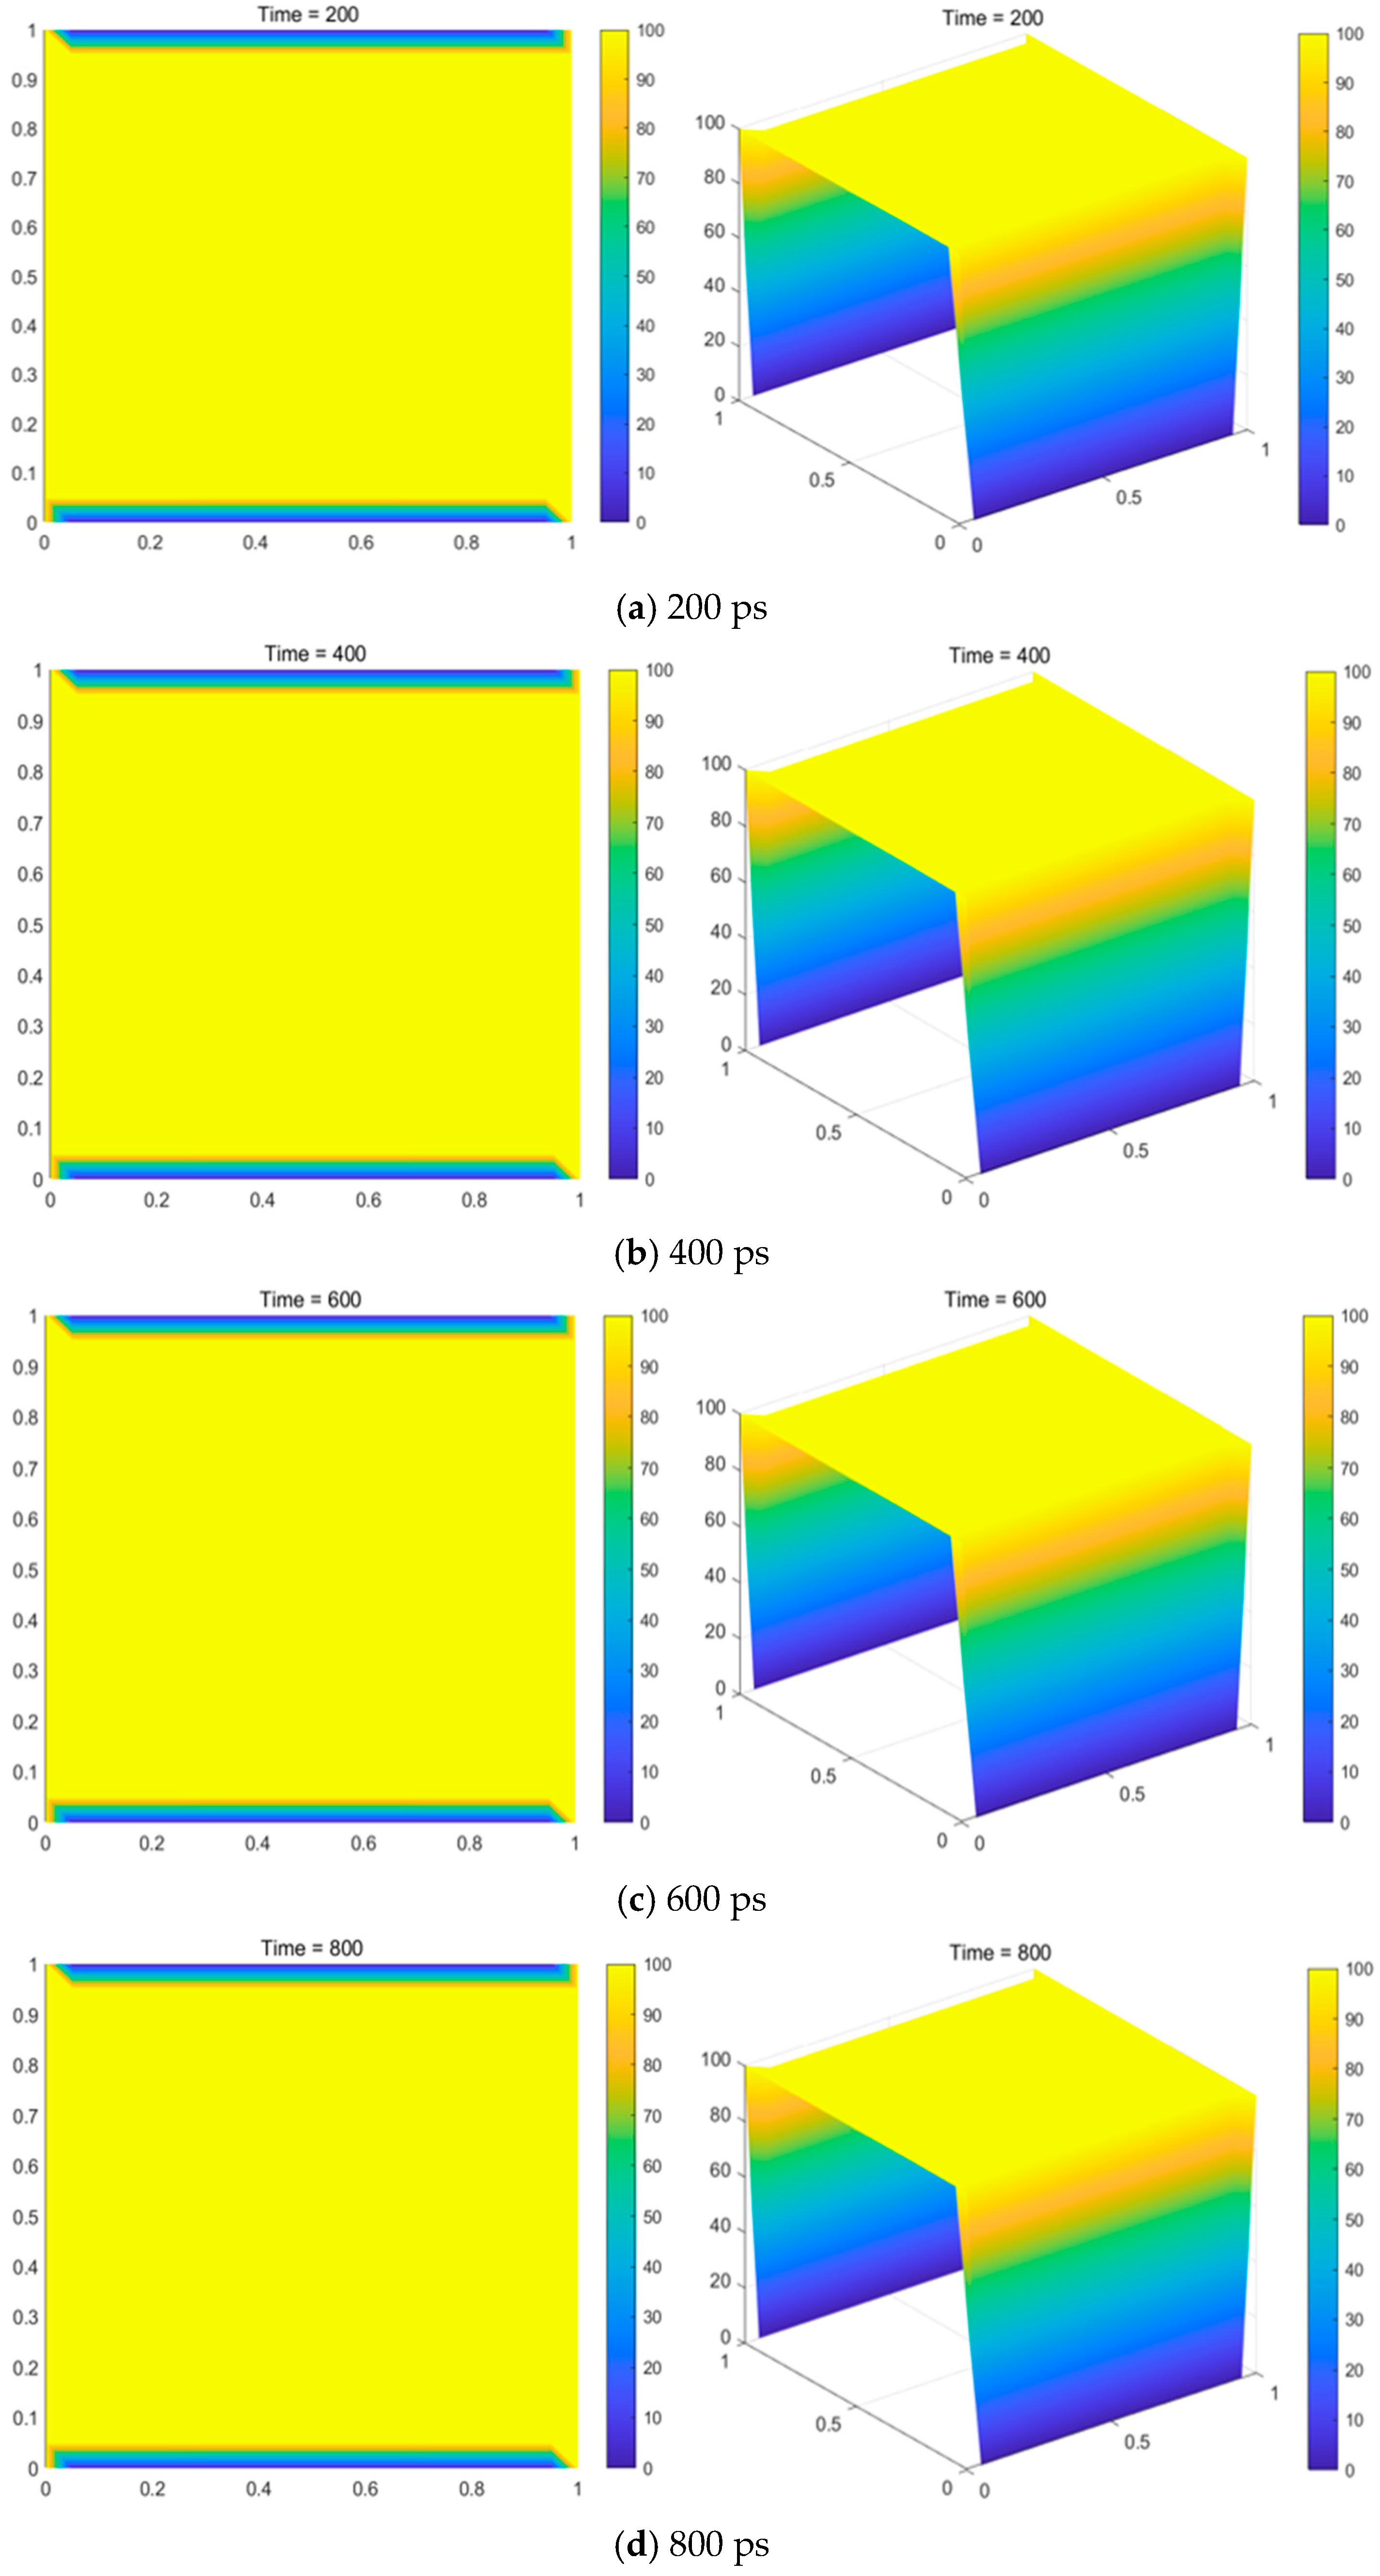
From
Figure 7, it can be observed that under atmospheric pressure conditions, as the time step increases, the voids between the graphene sheets were gradually filled by carbon atoms. However, the rate of graphene film formation was slow. This was due to the relatively high pressure, which caused the transport coefficient h
g of methane to decrease with increasing pressure. Consequently, this process is limited by mass transport control. The variation in CH
4 concentration with the time step at a pressure of 660 Pa is shown in
Figure 8.
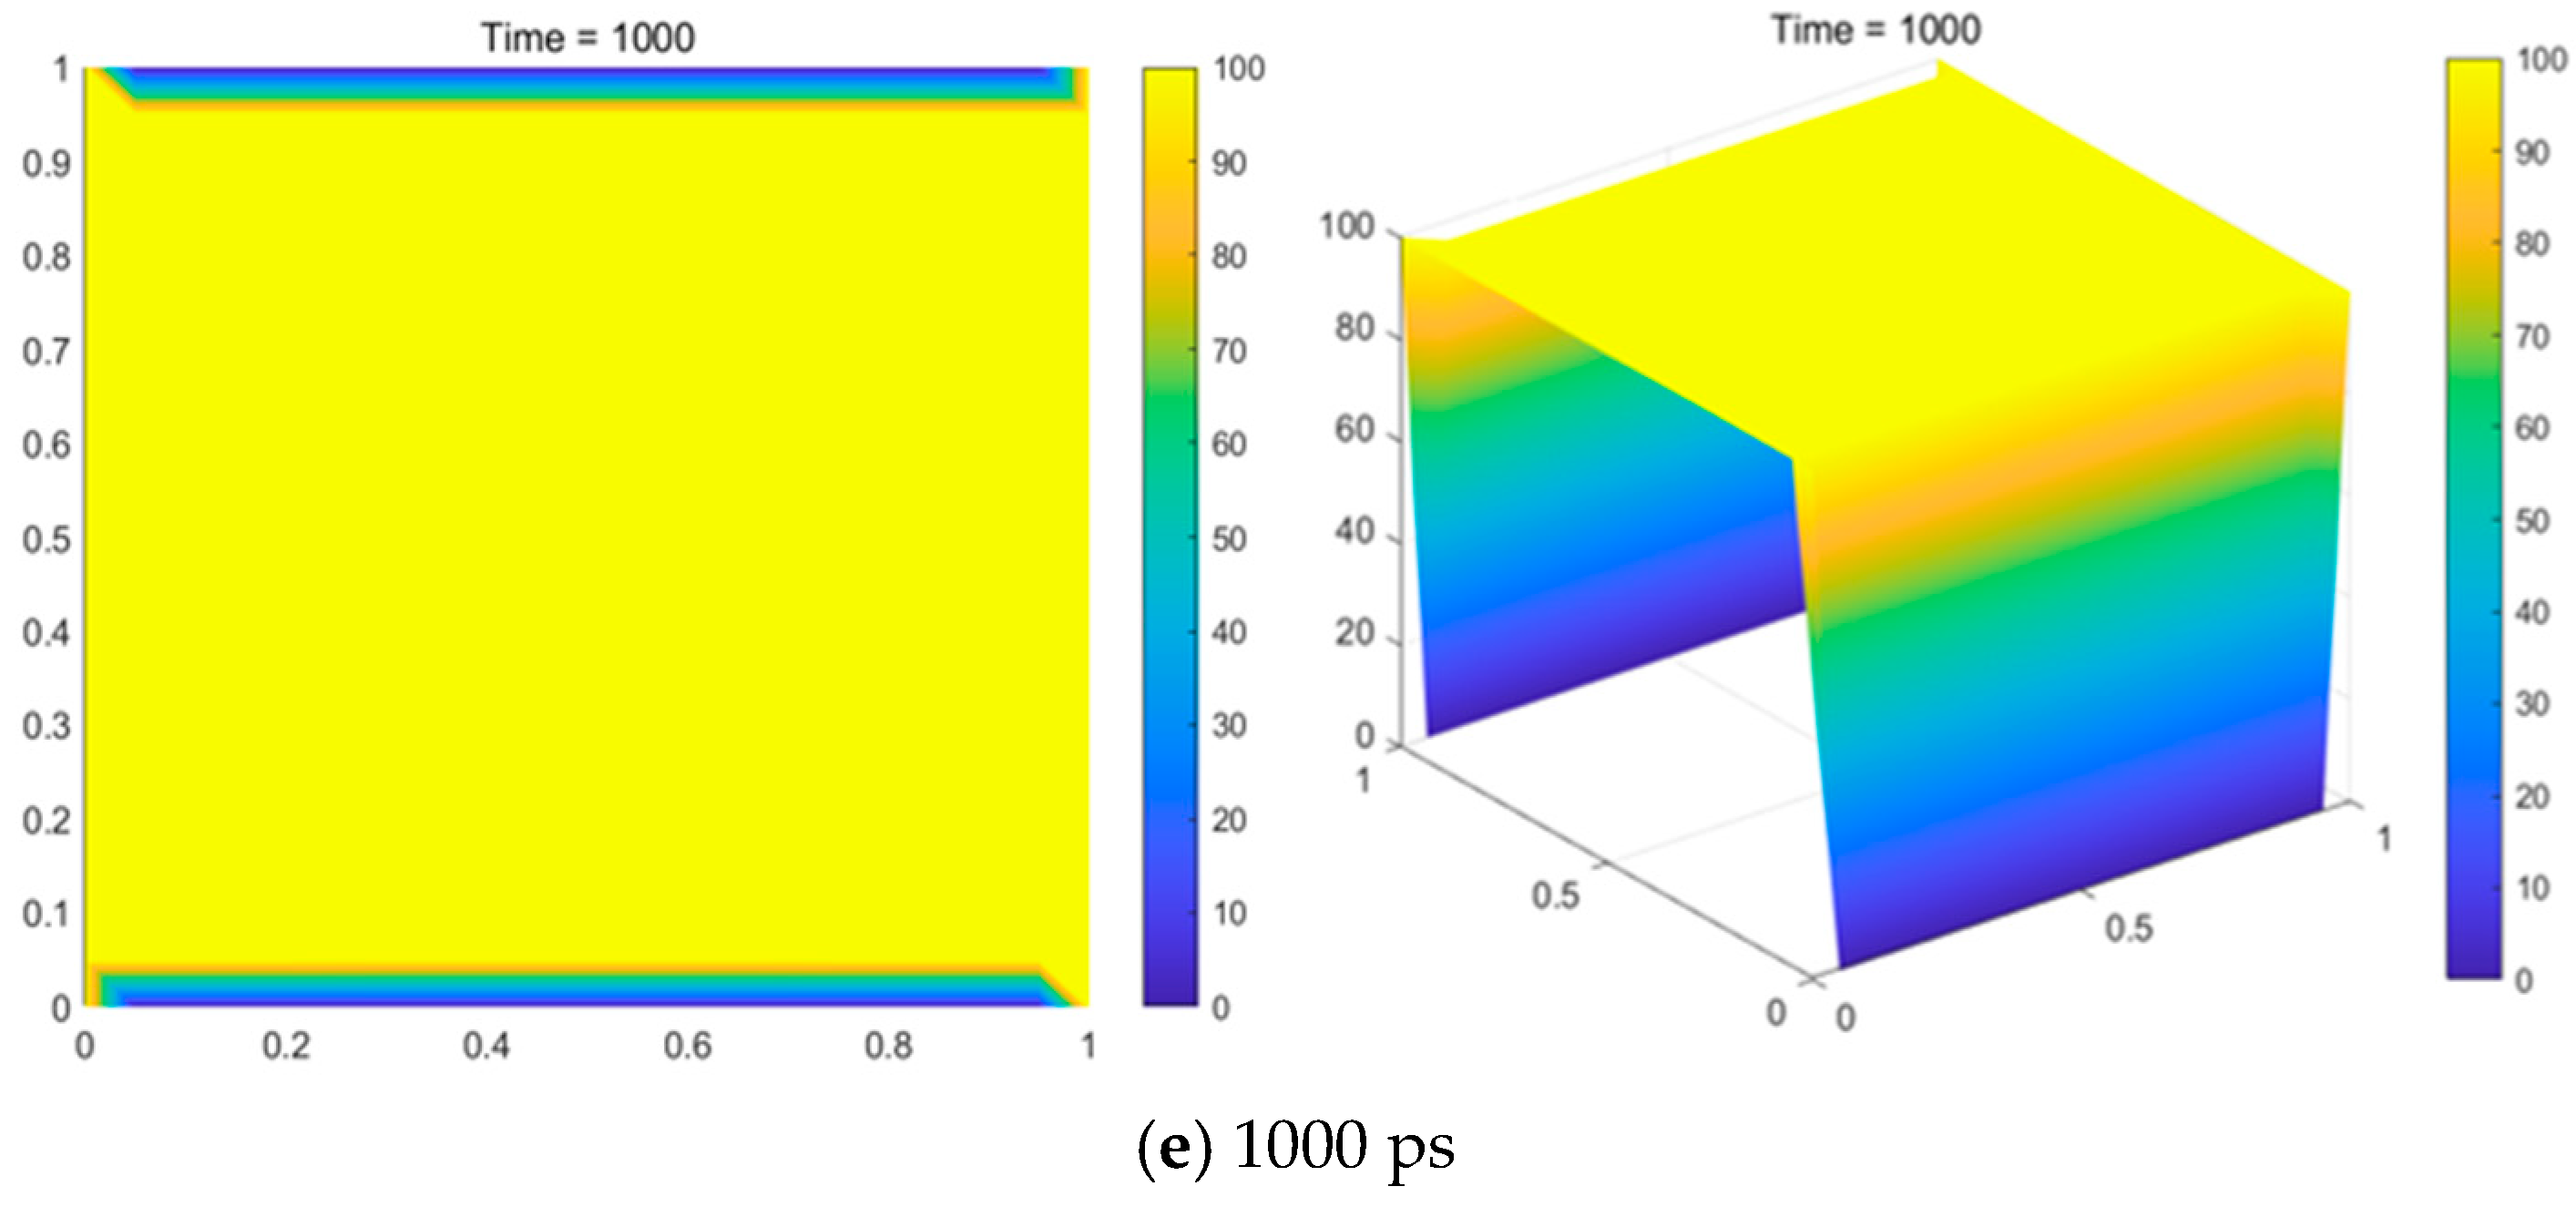
The change in CH
4 concentration with the time step under low-pressure conditions is shown in
Figure 8. It can be seen that under low-pressure conditions, the CH
4 concentration on the surface of the copper foil increased with time. As the CH
4 partial pressure rose, the nucleation rate of graphene accelerated, and a larger graphene coverage area formed on the copper foil surface within a certain time period. This led to a rapid decrease in the catalytic activity of the substrate [
20]. Due to the low gas flow rate in the confined space, the thickness of the boundary layer on the copper substrate surface increased. Over time, this boundary layer will cover the entire copper surface. As the boundary layer thickness (δ) increased, h
g approached k
s, at which point, the growth of graphene was limited by both the surface chemical reaction and mass transport mechanisms. With increasing CH
4 concentration over time, the diffusive flow inside the confined reactor gradually dominated and became uniformly distributed, with the process eventually being controlled by surface chemistry.
It can be observed from
Figure 7 and
Figure 8 that both high temperature and high pressure, or high temperature and low pressure, promoted the CH
4 pyrolysis reaction and accelerated the overall reaction rate. Additionally, higher temperatures and lower pressures enhanced the mass transport ability of the CH
4 gas. However, for the typical straight tube model, under low-pressure conditions, a higher CH
4 concentration led to a higher deposition rate on the graphene surface over the same period of time, making it easier to prepare large-area graphene compared to atmospheric pressure conditions. However, as the CH
4 concentration increased, the graphene nucleation density also rose, which is unfavorable for the production of high-quality graphene. To achieve a lower nucleation density and improve the quality of the graphene, it is necessary to reduce the partial pressure of methane.
4. Dynamics Monte Carlo Simulation Results and Discussion
4.1. Microscopic Processes of Graphene Growth at Different Times
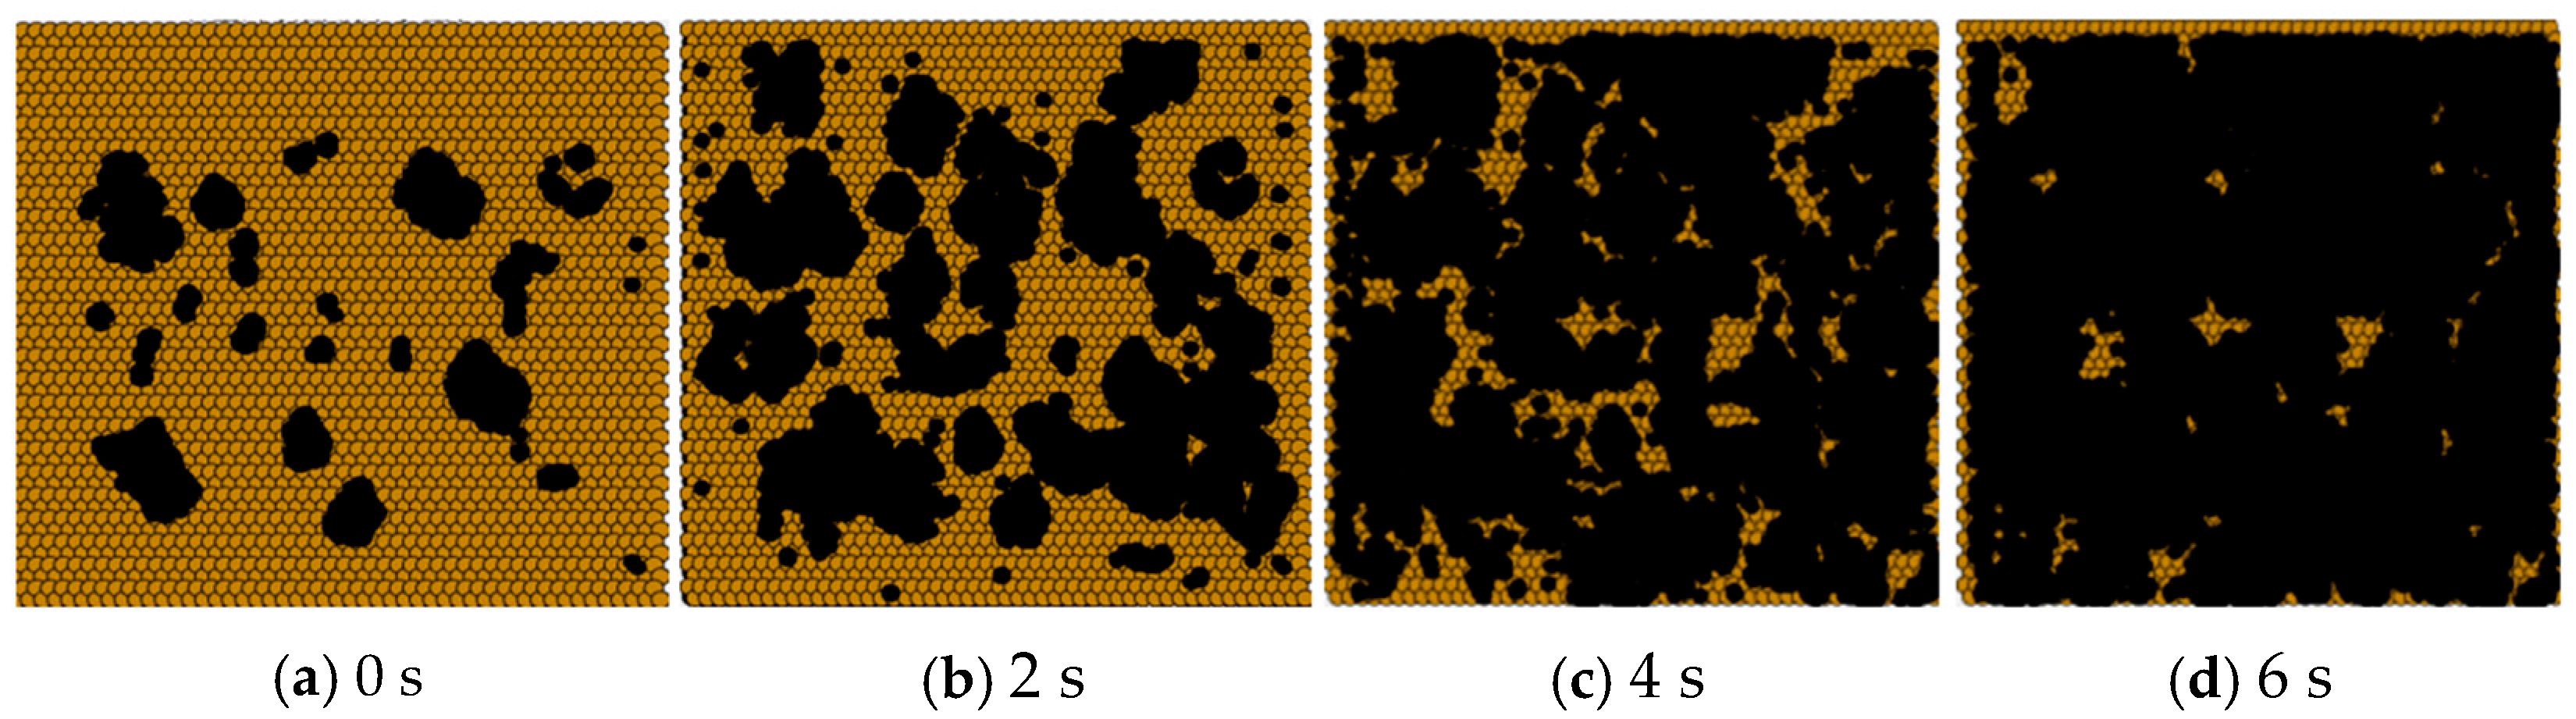
In
Figure 9, the brown atoms represent Cu atoms, the black atoms represent carbon atoms, and the partial pressure ratio of methane to hydrogen was 1:5 at a temperature of T = 1310 K and a pressure of P = 101,325 Pa. The simulation of the graphene growth process showed that in the early stages, carbon clusters primarily aggregated to form graphene islands (
Figure 9a). As the growth time increased, these graphene islands gradually adsorbed more carbon atoms from the surroundings, forming a lamellar structure with varied shapes (
Figure 9b). With continued growth, the voids between the graphene flakes gradually filled with carbon atoms, eventually leading to the formation of a more complete graphene film (
Figure 9c,d).
4.2. Effect of Temperature on the Growth Rate of Graphene
To investigate the effect of temperature on graphene growth, simulations were carried out at temperatures of T = 1230 K, 1250 K, 1270 K, 1290 K, 1310 K, and 1330 K. The pressure was set to 101,325 Pa, and the partial pressure ratio of methane to hydrogen was 1:5. It was found that the dehydrogenation reaction of methane on the Cu(111) surface, the migration of carbon atoms, and polymerization were all influenced by the growth temperature, which in turn affected graphene growth. At high temperatures, the catalytic cracking ability of copper on methane was enhanced, leading to more methane dehydrogenation and the formation of carbon atoms. This provides more carbon for graphene growth. This process is controlled by surface chemical reactions, and as the diffusion of carbon atoms accelerates, the growth of graphene on the copper surface becomes faster, leading to an increased coverage of graphene on the copper foil.
Figure 10 shows the variation in surface coverage with graphene at different temperatures at P = 101,325 Pa. It can be seen in the figure that an increase in temperature can increase the growth rate of graphene.
4.3. Effect of CH4/H2 Ratio on Graphene Growth Rate
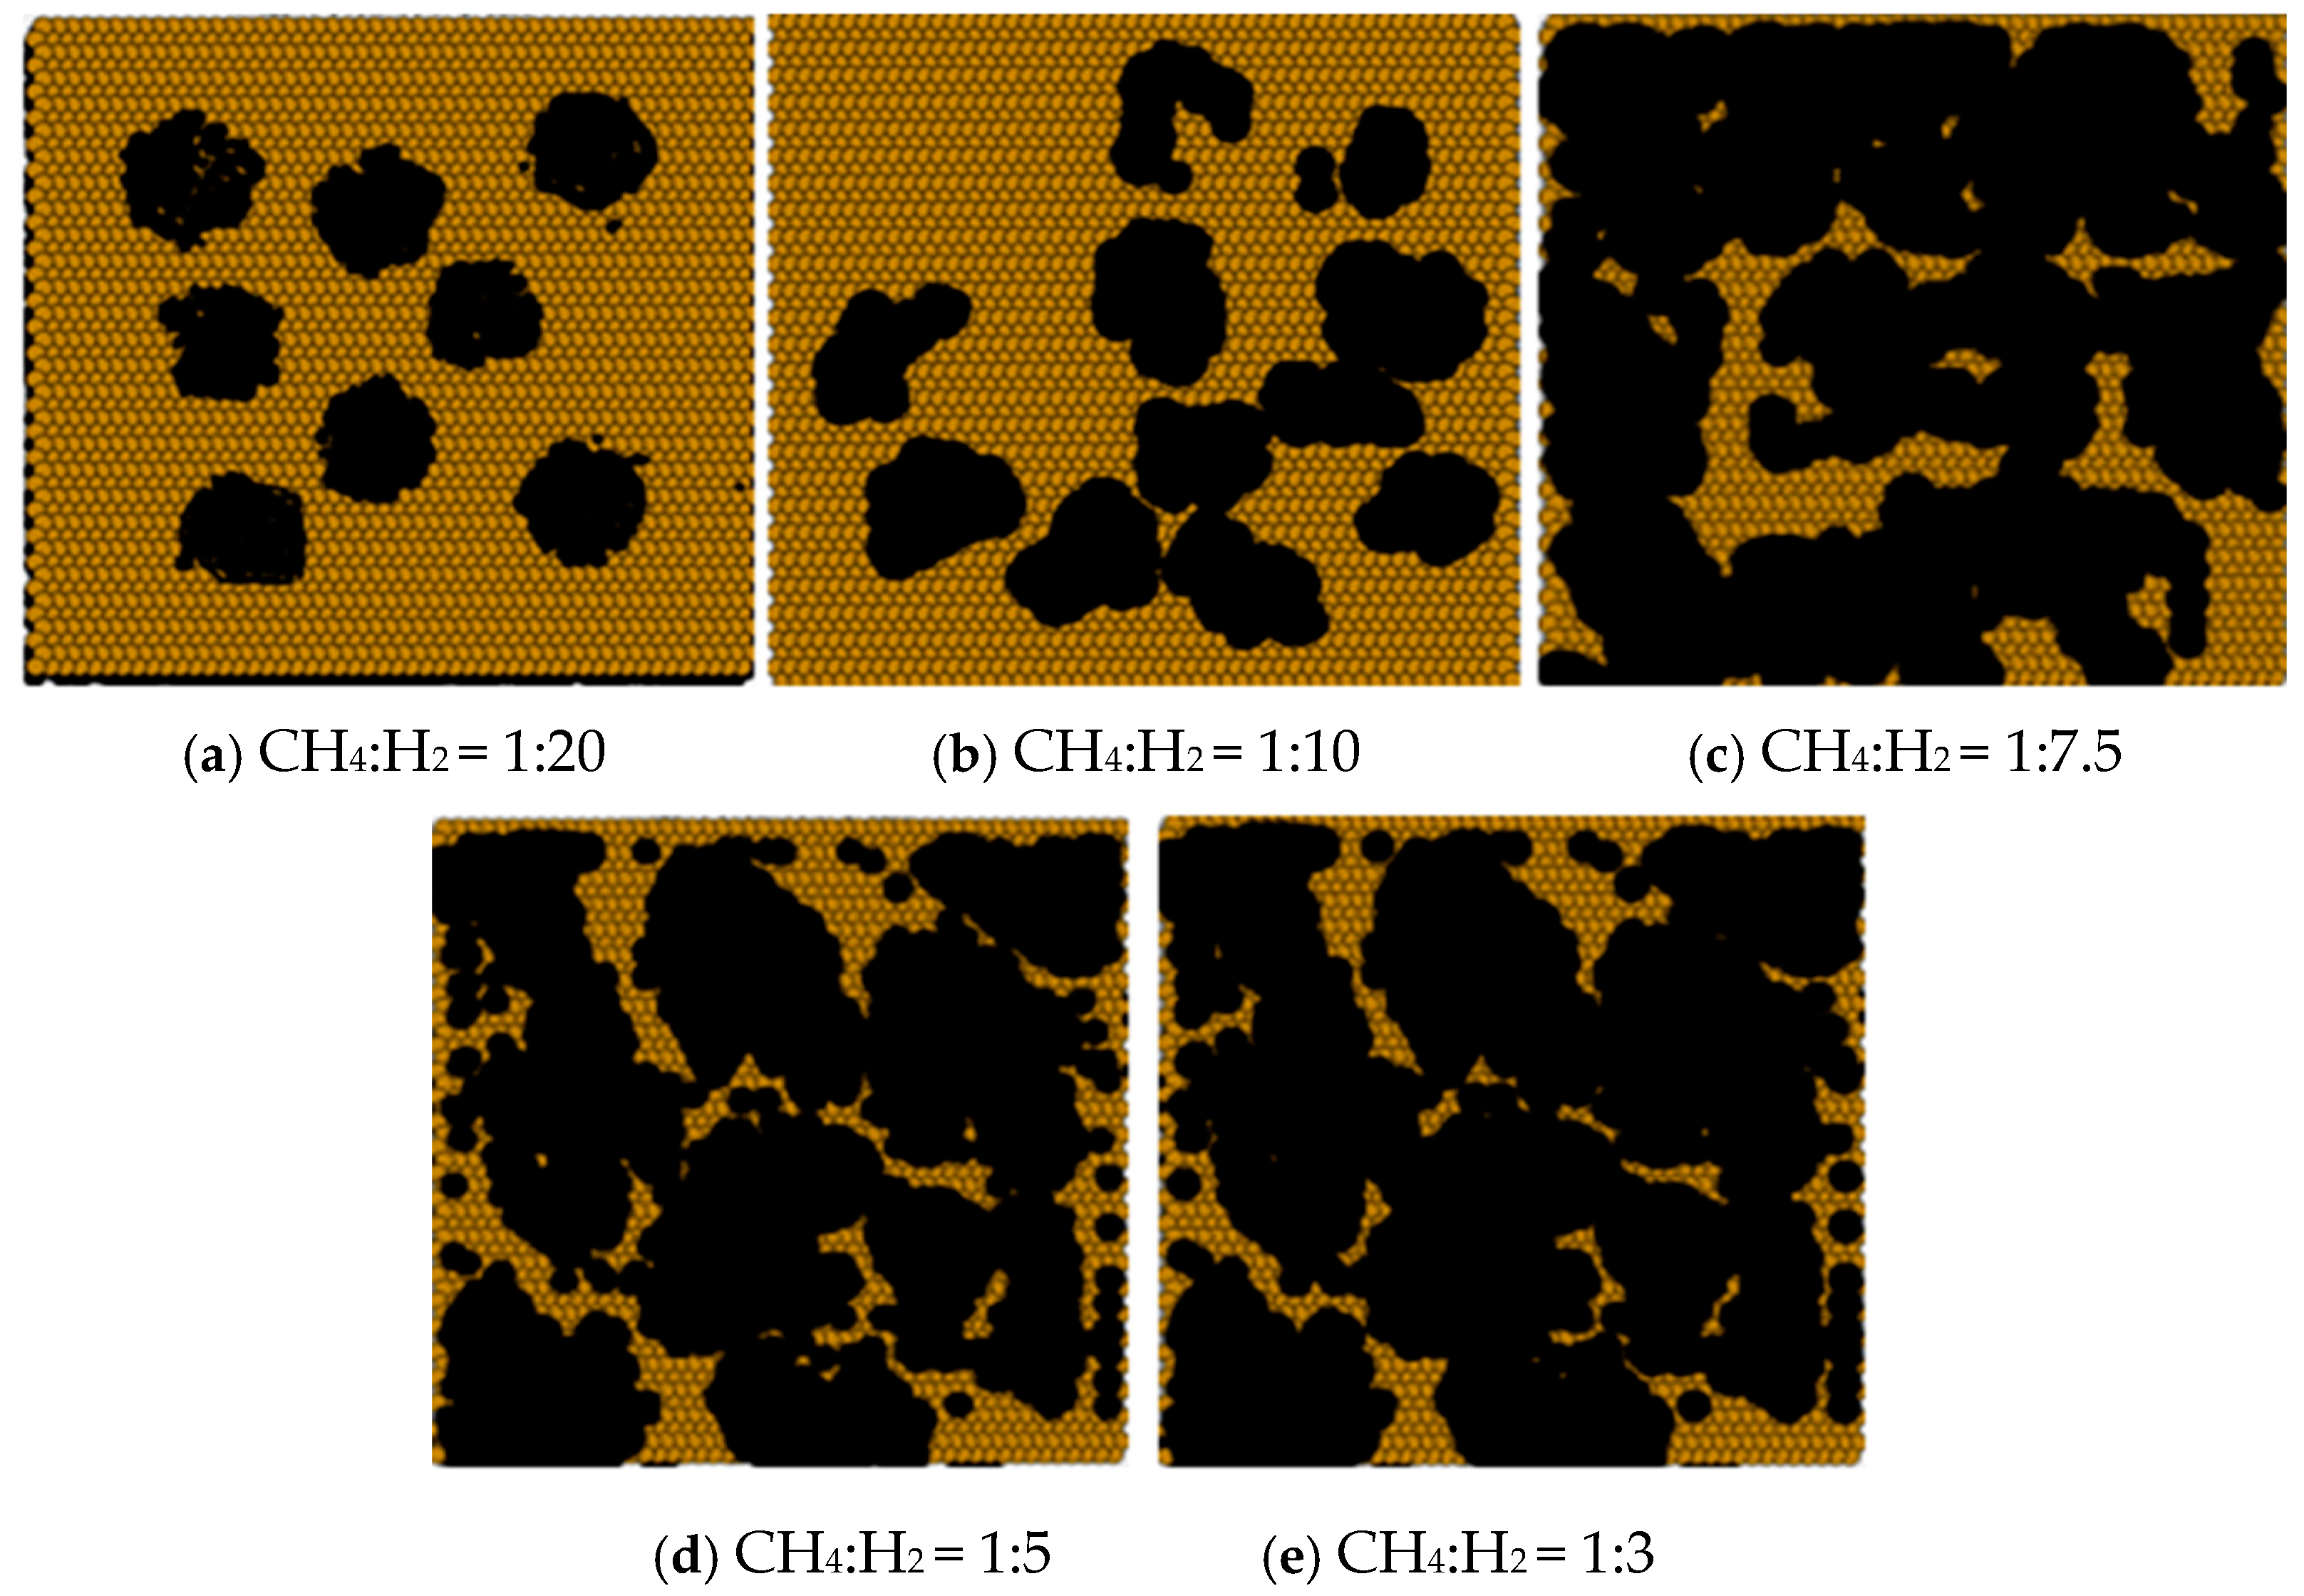
The effect of different partial pressure ratios of CH
4 and H
2 (1:20, 1:10, 1:7.5, 1:5, and 1:3) on the morphology of graphene was simulated at a set pressure of 101,325 Pa and a temperature of 1310 K. The surface morphology of the graphene obtained using the various CH
4:H
2 ratios is shown in
Figure 11.
It was found that as the methane to hydrogen partial pressure ratio increased, the graphene morphology transitioned from a more regular hexagonal shape (
Figure 11a) to an irregular lamellar structure (
Figure 11b,c), and eventually to a blade-like shape with a larger area (
Figure 11d,e). At low CH
4:H
2 partial pressure ratios, the etching effect of hydrogen on the graphene was stronger than the diffusive deposition rate of carbon atoms, resulting in the formation of a regular hexagonal graphene structure. At higher CH
4:H
2 partial pressure ratios, the surface diffusion deposition of carbon atoms became dominant, leading to faster graphene growth. This enhanced the diffusion of carbon atoms, causing the graphene to form a larger, irregular blade-like shape.
In summary, the growth rate of graphene accelerates with increasing temperature, and the nucleation density on the graphene surface is reduced. At a temperature of T = 1310 K, a large area of graphene can be obtained, which enhances the graphene surface deposition rate. The diffusion of carbon atoms is promoted under a high CH4:H2 ratio, leading to graphene exhibiting a large, leaf-like, and irregular shape. In contrast, at a low CH4:H2 ratio, graphene tends to form a smaller area with a more regular hexagonal shape. Therefore, a low CH4:H2 ratio facilitates the formation of uniform single-layer graphene in the typical model.
5. Thermodynamic Analysis of Carbon Deposition
5.1. Equilibrium Gas-Phase Components
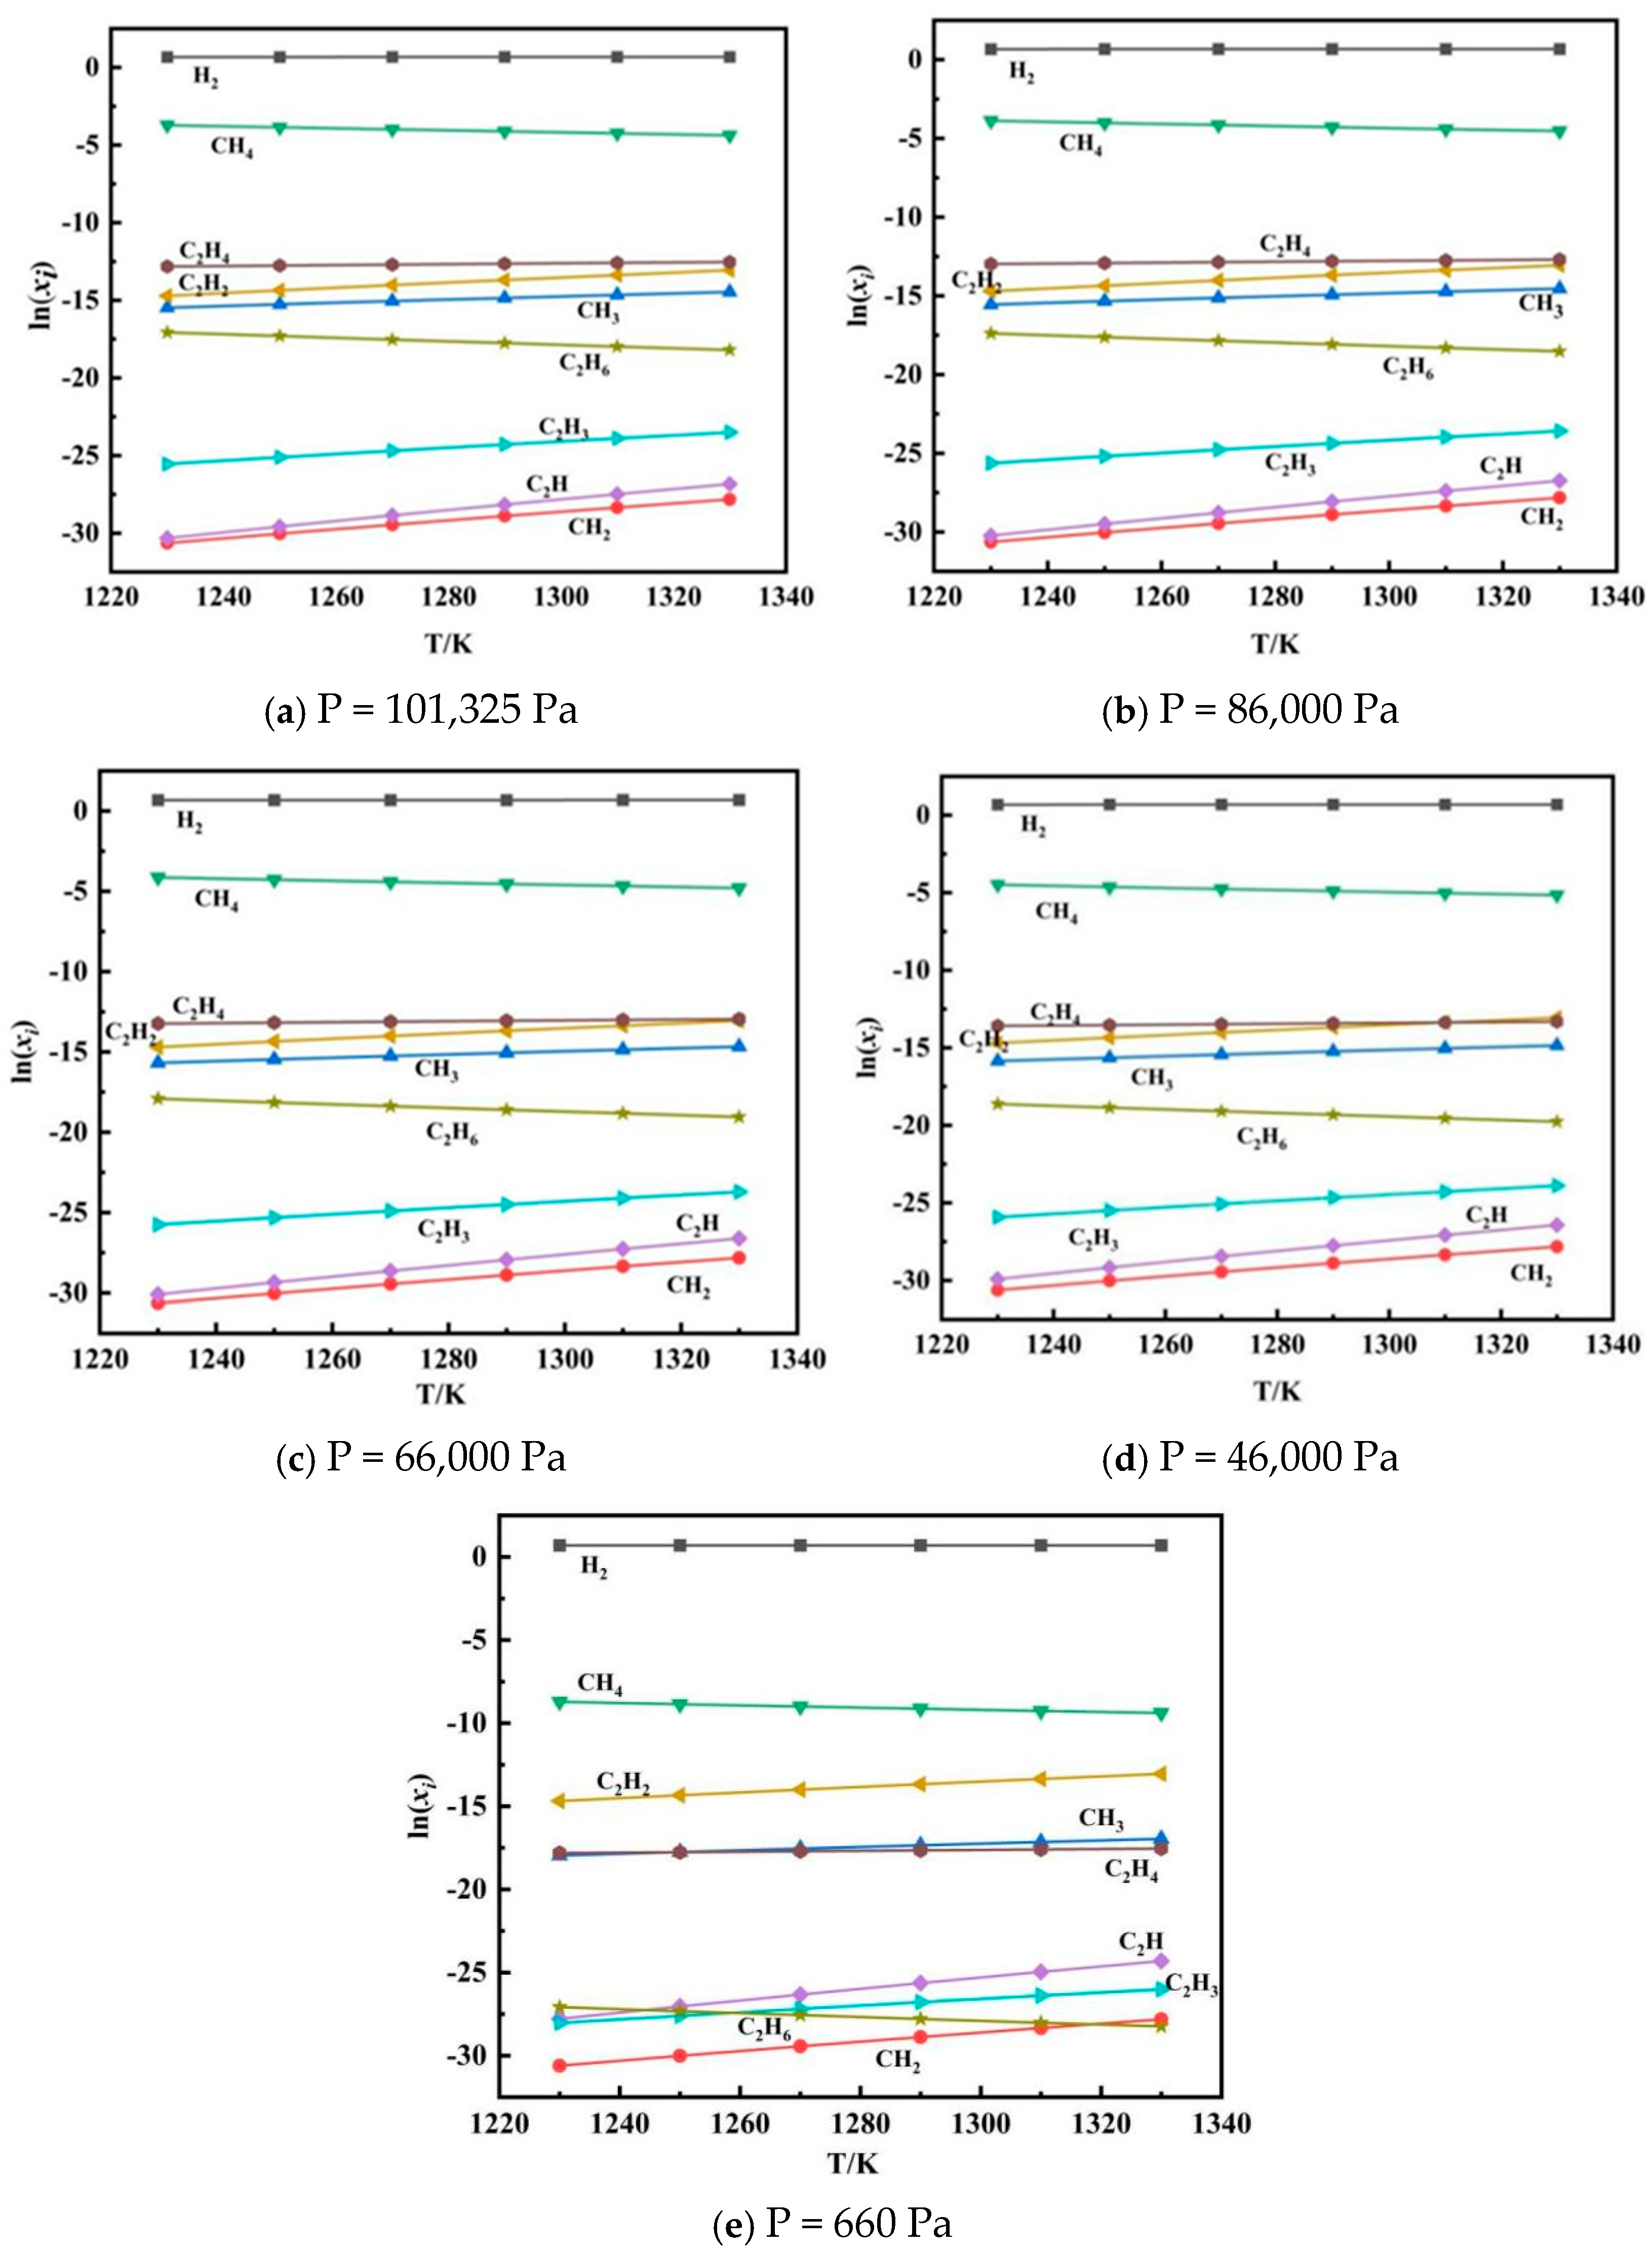
Since the equilibrium gas-phase components can be used to illustrate the concentrations of each gas-phase species when the reaction reaches equilibrium, the changes in each gas-phase component with temperature were investigated. The simulations were carried out with 1 mol of methane at the inlet and pressures of 101,325 Pa, 86,000 Pa, 66,000 Pa, 46,000 Pa, and 660 Pa. Given that the contents of H, C, CH, C
2, C
3, C
4, and C
5 are much lower than those of H
2, CH
4, C
2H
4, C
2H
2, CH
3, C
2H
6, C
2H
3, C
2H, and CH
2, the equilibrium mole fractions (x
i) of the first nine gas-phase components were primarily analyzed. Here, x
i represents the mole fraction of the ith component when the reaction reaches equilibrium. The results are shown in
Figure 12.
As shown in
Figure 12, the content of H
2 remained relatively stable with increasing temperature. CH
4 and C
2H
6 showed a gradual decline rather than a sharp decrease. The content of C
2H
4 exhibited a nearly constant trend, with only slight fluctuations. In contrast, the contents of C
2H
2, CH
3, C
2H, C
2H
3, and CH
2 exhibited a more noticeable increase with temperature. At low temperatures, the main components were CH
4 and C
2H
6, but as the temperature increased, the main components shifted to C
2H
2 and CH
3. Additionally, C
2H
2 decomposed into C and H
2 again in the hydrogen-rich atmosphere at the outlet of the reactor at lower temperatures.
For pressures of 101,325 Pa, 86,000 Pa, 66,000 Pa, 46,000 Pa, and 660 Pa, the trends in the equilibrium gas-phase components were generally similar. However, a key difference was observed: as the pressure decreased, the intersection of the curves shifted to the left, indicating that the content of C2H4 changed more noticeably at lower pressures. This suggests that a low pressure is favorable for the carbon deposition process. This study shows that high temperature, excess hydrogen, and a relatively low pressure are favorable conditions for increasing the carbon yield.
5.2. Effect of Temperature and Pressure on Carbon Deposition Rate
The variation in the carbon deposition rate with temperature was calculated with 1 mol of methane at the inlet and pressures of 101,325 Pa, 86,000 Pa, 66,000 Pa, 46,000 Pa, and 660 Pa. The results are shown in
Figure 13.
As shown in
Figure 13, the carbon yield increased significantly with rising temperature. However, when the temperature exceeded 1310 K, the curve began to stabilize. This indicates that beyond a certain temperature, further increases in temperature do not enhance the carbon deposition rate, but rather reduce it. Therefore, in actual production processes, controlling the temperature is crucial for optimizing the carbon deposition rate. Additionally, higher temperatures lead to higher energy consumption in the production process, which directly increases production costs. As a result, in the practical production of graphene, it is recommended to maintain the reactor’s internal temperature around 1310 K.
Figure 13 also shows that at the same temperature, as the pressure decreased, the carbon yield increased significantly. However, when the pressure reached a certain level, increasing the temperature no longer led to a significant change in the carbon yield. At this point, although increasing the temperature raises energy consumption, the curves exhibited a peak. As the pressure increased, the peak shifted to the right, meaning that with higher pressure, the temperature at which the carbon yield peaks also increases, but the peak value itself noticeably decreases. Therefore, without considering the special structure of the equipment in CVD graphene production, lowering the pressure favors carbon deposition. However, this comes with higher equipment requirements and increased energy consumption.
The study shows that in actual production, the main reasons for a decrease in the carbon deposition rate are as follows: (1) The instability of the control over the operating temperature, pressure, and feed ratio, especially the temperature, which has a significant impact on carbon yield. At high temperatures, side reactions are more likely to occur, resulting in a lower carbon yield. (2) The heat transfer phenomenon in the reactor causes a temperature gradient on the surface of the metal substrate, leading to a non-uniform carbon yield. (3) Due to mass transfer effects, the molar concentration of reactive gases on the surface of the carbon in the reactor is uneven, which affects the carbon yield. (4) Carbon deposition on the walls of the CVD reactor occurs, and this carbon, being of lower purity, cannot be fully recovered [
21]. Among these factors, unstable production conditions are the primary reason for the low carbon yield. Therefore, improving the operating conditions, optimizing the reactor structure, and enhancing equipment control can further improve the carbon yield.
5.3. Effect of CH4/H2 Ratio on Carbon Deposition Rate
It has been reported that H
2 can catalyze both methane cracking and the etching of graphene, while methane serves as a source of carbon atoms. A high methane concentration will increase the graphene growth rate and make the graphene morphology tend to be irregular, whereas a higher hydrogen concentration will lead to the etching of graphene [
22,
23]. Therefore, the change in the morphology of the graphene surface is, to some extent, a result of the interplay between the pyrolysis of the carbon source gas and the etching effect of the hydrogen gas.
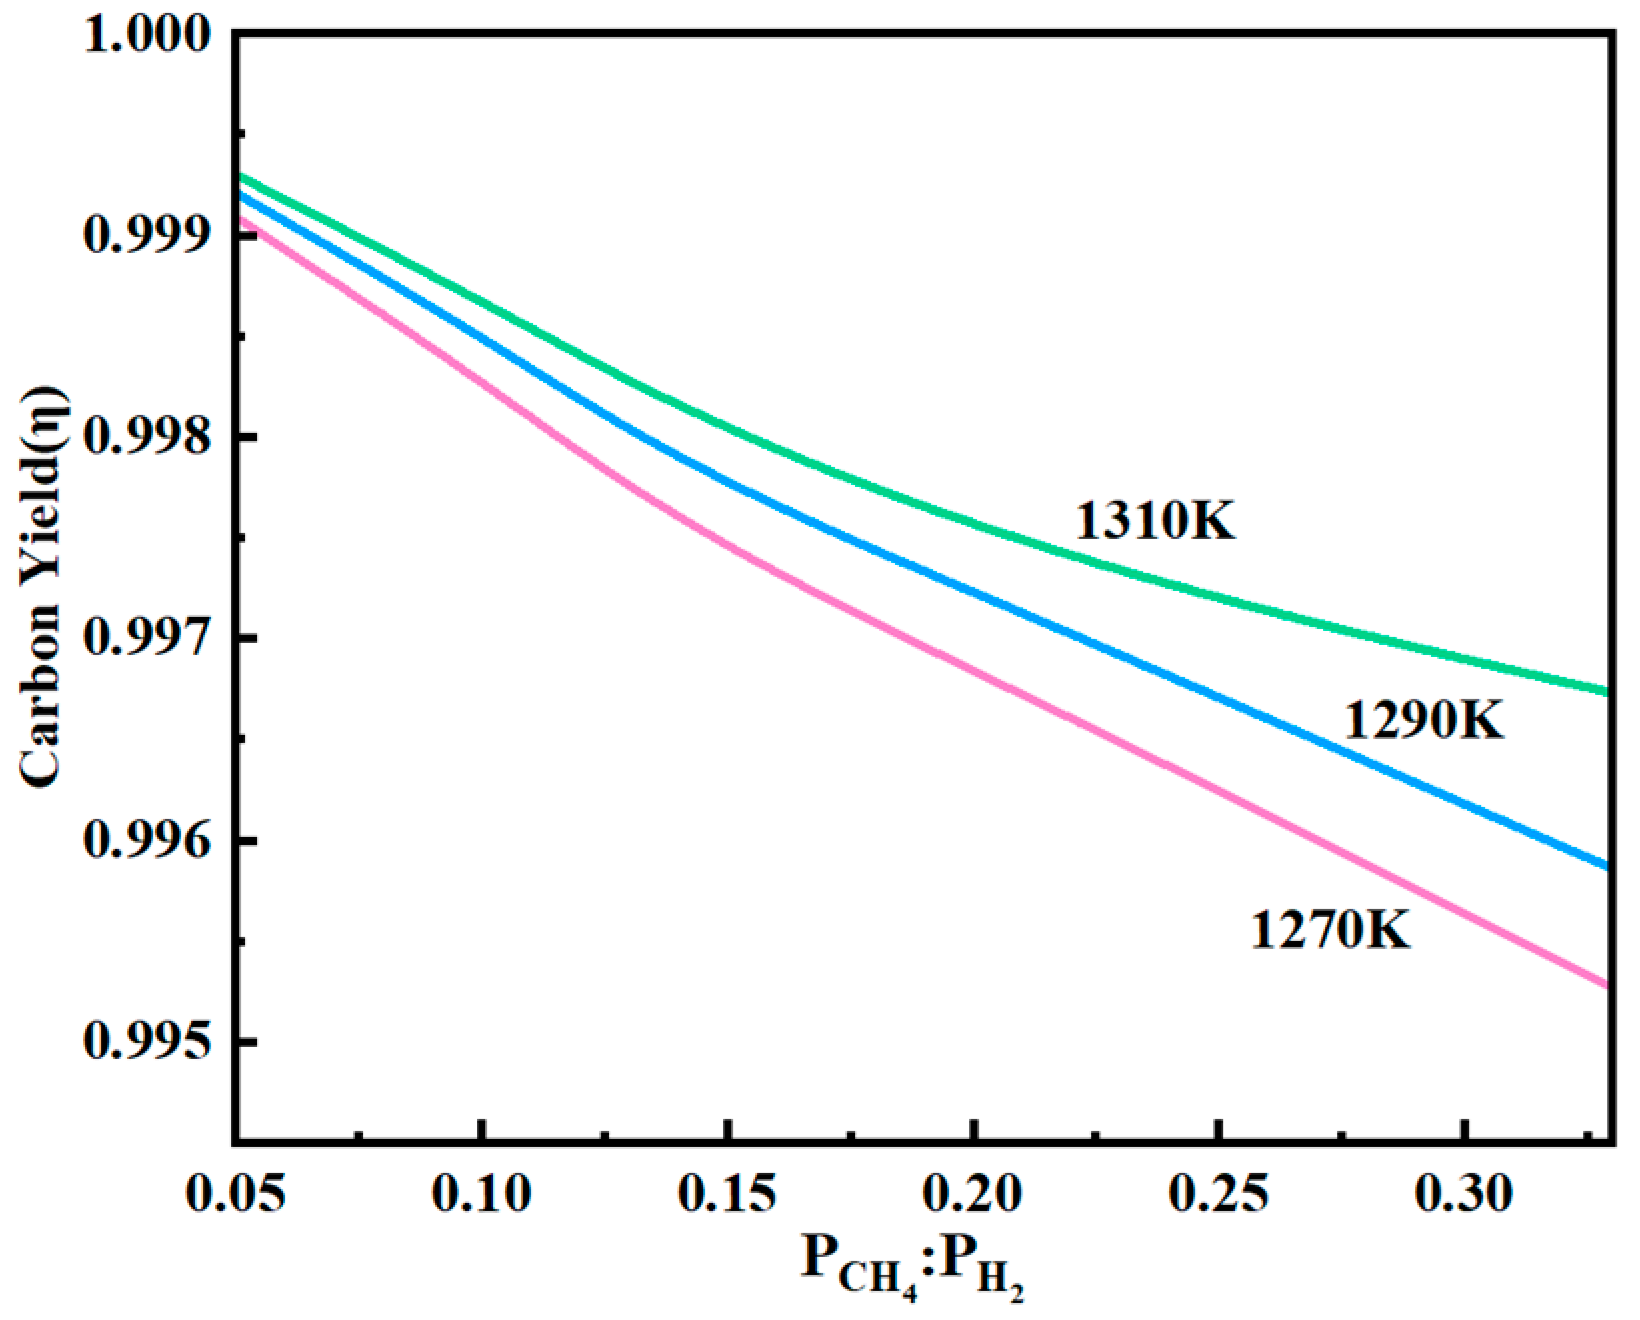
To investigate the effect of the partial pressure ratio of CH
4 and H
2 on the deposition rate of graphene, the growth of graphene was examined by setting the partial pressure ratio of CH
4 and H
2 to 1:20, 1:10, 1:7.5, 1:5, and 1:3, under pressures of 101,325 Pa and temperatures of 1270 K, 1290 K, and 1310 K. The changes in carbon deposition with the varying partial pressure ratios of CH
4:H
2 are shown in
Figure 14.
As shown in
Figure 14, the carbon deposition rate decreased significantly with increasing CH
4:H
2 partial pressure ratio. Therefore, maintaining an excess of hydrogen is essential during graphene growth when using the CVD method. When the temperature was raised to 1310 K, the carbon yield curve flattened with increasing CH
4:H
2 ratio, indicating that the partial pressure ratio has minimal influence on the carbon yield at this stage. This occurs because at a total pressure of 101,325 Pa (or slightly above), an excessively high H
2 molar fraction at the inlet results in a relatively low CH
4 concentration, thereby limiting the availability of carbon for deposition. Consequently, the carbon production rate becomes CH
4-limited. Additionally, an excessive H
2 concentration leads to a high H
2 content in the exhaust gas, which presents two practical issues: (1) an increased volume of tail gas requiring more complex separation and processing, and (2) elevated energy consumption for H
2 recovery and recycling. These factors collectively contribute to a significant rise in production costs. Thus, although excess hydrogen is necessary to suppress unwanted reactions and promote high-quality graphene formation, a very low CH
4:H
2 ratio can adversely affect process efficiency. At low CH
4:H
2 ratios, the etching effect of hydrogen outweighed the deposition of carbon atoms, underscoring the need to carefully balance the gas ratio. To optimize the carbon yield and graphene quality while minimizing operational costs, the CH
4:H
2 partial pressure ratio must be appropriately selected. This requires further investigation through a detailed kinetic model of the gas-phase transport and surface reaction mechanisms.
The thermodynamic analysis indicated that the optimal operating temperature for graphene preparation via the CVD method is 1310 K under atmospheric pressure conditions (101,325 Pa). When the CH4/H2 ratio was fixed, the carbon deposition rate increased with temperature, highlighting the critical role of temperature control in ensuring a high carbon yield. Thus, maintaining a stable temperature is essential in practical production to avoid yield fluctuations.
At a constant temperature, increasing the CH4/H2 partial pressure ratio led to a decline in carbon yield. Specifically, a higher hydrogen partial pressure suppressed the dehydrogenation of methane, thereby reducing the availability of active carbon species and limiting graphene growth. While a moderate excess of hydrogen is necessary to control graphene morphology and suppress unwanted reactions, an excessive hydrogen content decreases both the carbon deposition rate and overall carbon productivity. Consequently, low-pressure CVD processes are often employed to enhance carbon deposition efficiency and graphene quality. However, implementing low-pressure techniques imposes more stringent demands on the reactor design, equipment sealing, and process control. These requirements typically lead to increased energy consumption and higher production costs. As a result, developing atmospheric-pressure CVD processes for high-quality graphene growth has become a key focus for industrial-scale production, aiming to balance performance, cost-efficiency, and equipment feasibility.
6. Conclusions
In this study, the growth kinetics of graphene on Cu(111) surfaces was investigated through first-principles calculations and transition state search methods to determine the energy barriers associated with methane dehydrogenation. The influence of the key operating parameters—temperature, pressure, and the CH4/H2 partial pressure ratio—on graphene deposition via chemical vapor deposition (CVD) was explored based on thermodynamic equilibrium analyses. The main conclusions are as follows:
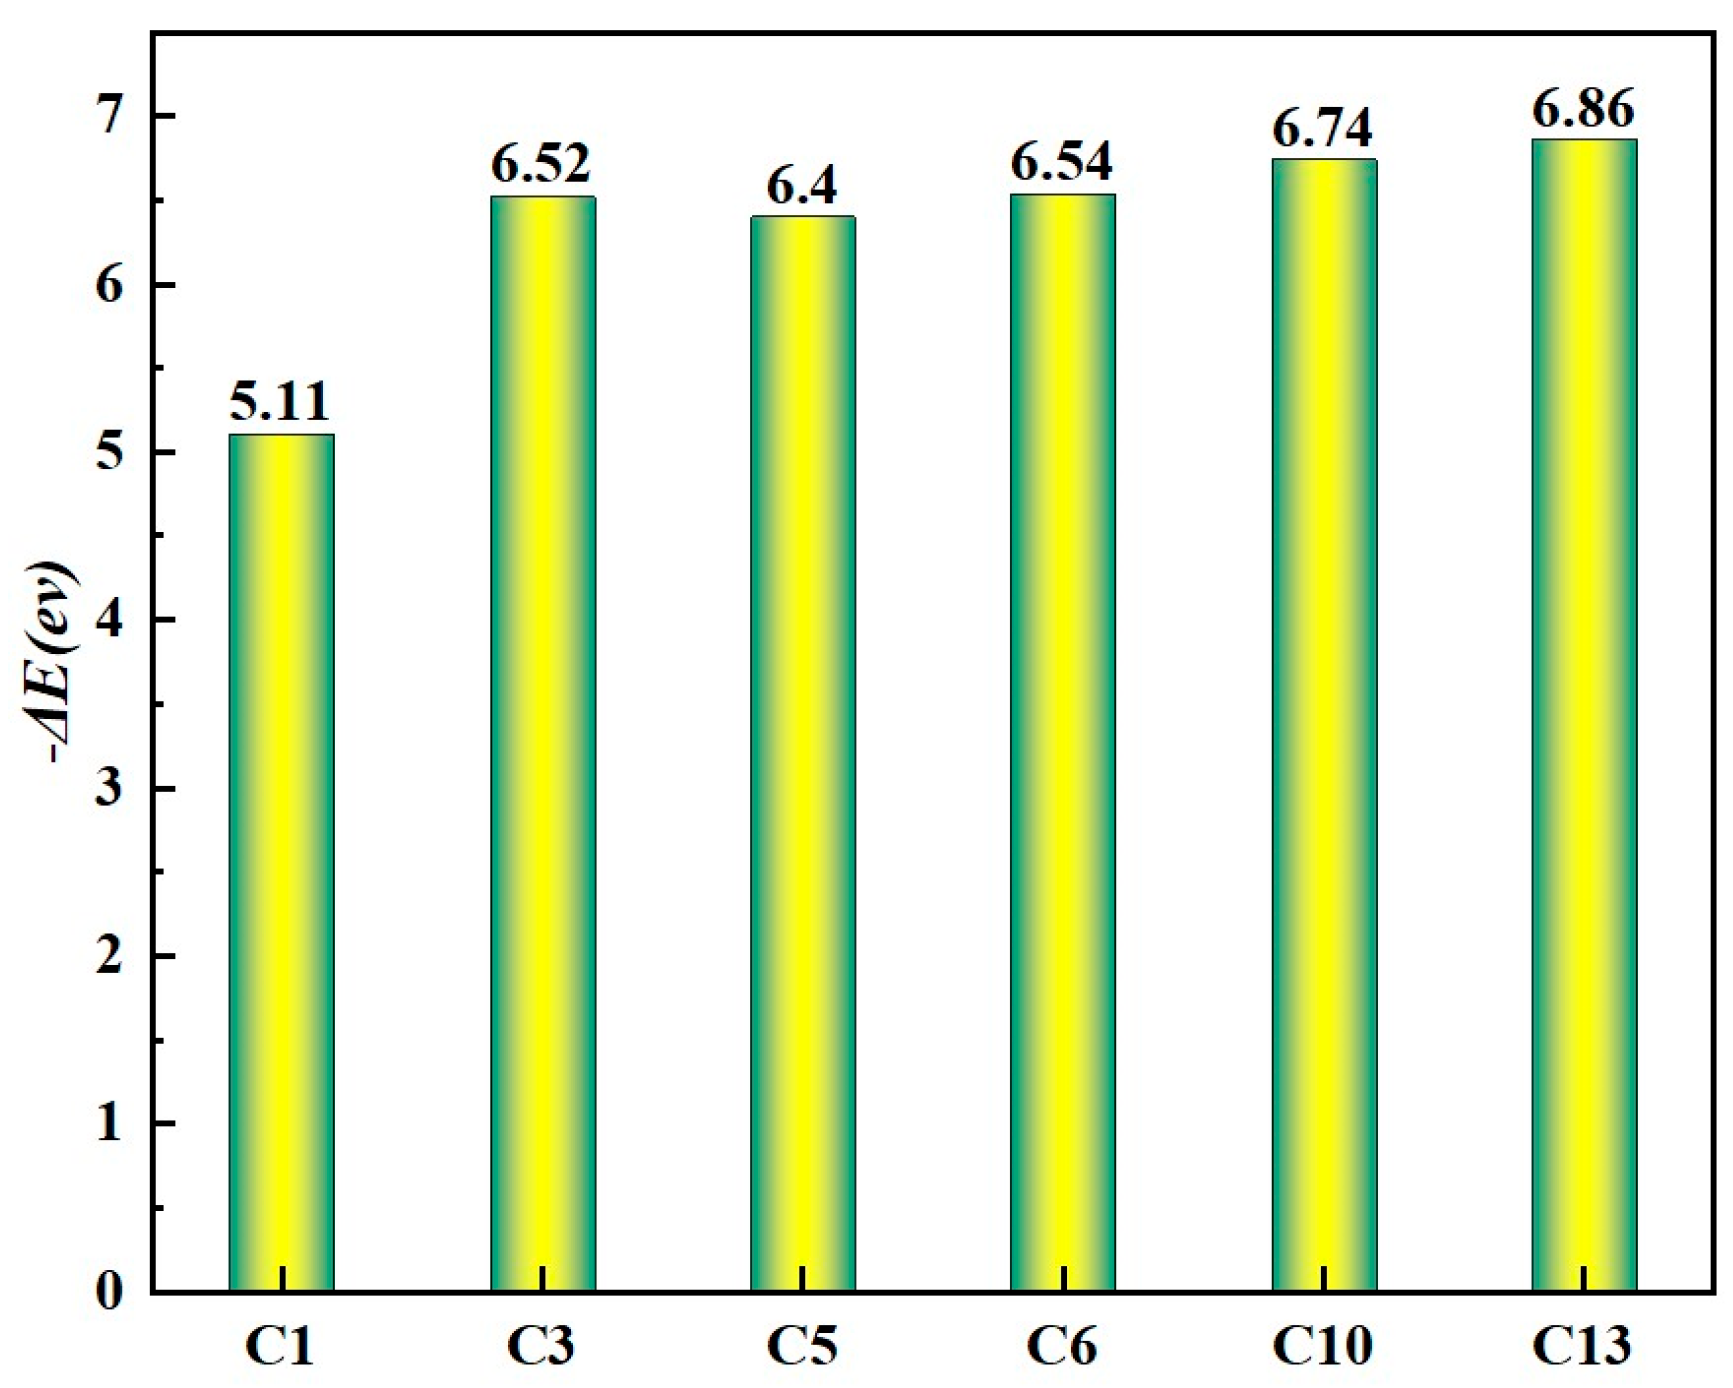
- (1)
The final product energy of C + 4H is 3.09 eV higher than that of adsorbed CH4, indicating that methane dehydrogenation to carbon atoms is energetically demanding. In particular, the dehydrogenation step from CH to C requires an energy input of 1.23 eV. This suggests that intermediate CHn (n = 1–4) species are more directly involved in graphene formation, and that reducing the dehydrogenation barriers is key to accelerating the graphene growth rate.
- (2)
An increase in temperature enhances the graphene growth rate, reduces the surface nucleation density, and promotes surface carbon deposition. At high CH4:H2 ratios, the enhanced diffusion of carbon atoms results in the formation of large, irregular, leaf-like graphene domains. In contrast, low CH4:H2 ratios favor the formation of smaller, uniform hexagonal domains, making them more suitable for single-layer graphene growth under typical CVD conditions.
- (3)
The thermodynamic analysis of equilibrium gas-phase compositions revealed that high temperatures, an excess of hydrogen, and a relatively low pressure promote carbon deposition. The carbon yield increases with temperature, but when the temperature exceeds 1310 K, the yield curve flattens or even decreases. Therefore, maintaining a reactor temperature near 1310 K is optimal for balancing the carbon yield and energy efficiency.
- (4)
At a constant temperature, decreasing the system pressure significantly increases the carbon yield. However, once the pressure falls below a certain threshold, further increases in temperature do not substantially improve the deposition rate. Additionally, the temperature corresponding to peak carbon yield shifts with increasing pressure, while the peak value itself decreases. Thus, although low-pressure conditions are beneficial for carbon deposition, they also demand more advanced equipment and have a higher energy consumption.
- (5)
As the partial pressure ratio of CH4 to H2 increases, the carbon deposition rate decreases. While a moderate excess of hydrogen supports graphene growth by preventing unwanted side reactions, excessively high hydrogen concentrations reduce CH4 availability and limit carbon production. Moreover, excess hydrogen complicates tail gas separation and increases the energy demand for gas recycling. Therefore, in practical production settings, the CH4/H2 ratio must be carefully optimized. Although low-pressure techniques are preferred for high-quality graphene growth, achieving efficient atmospheric-pressure CVD remains a critical goal for scalable, cost-effective industrial production.
This work provides valuable insights by combining first-principles calculations with multiscale kinetic and thermodynamic analyses, which enrich the current understanding of graphene growth mechanisms on Cu(111). The comprehensive approach employed here not only clarifies the rate-limiting steps and the effect of process parameters but also offers practical guidance for optimizing CVD conditions in industrial applications. Moreover, the study opens up new perspectives for future research, including the exploration of catalyst surface modifications and alternative precursor gases to further enhance graphene quality and growth efficiency.
Although direct experimental data comparisons are limited, the available experimental findings qualitatively support our theoretical predictions regarding growth trends and parameter effects. Future work will include more systematic validation against experimental results to further strengthen the model’s applicability and reliability.

