1. Introduction
Aluminum alloy AA6082 (Al-Si-Mg alloy) offers great mechanical properties, including toughness, high strength, stiffness and fatigue resistance, combined with low specific density, high formability and recyclability. For all these reasons, it is one of the most employed alloys in the aerospace and automotive fields [
1,
2,
3]. However, the performance of AA6082 is affected by poor corrosion resistance to localized phenomena in marine and atmospheric environments. The most common type of corrosion is the intergranular one, promoted by the presence of intermetallic precipitates at the grain boundaries [
2,
4]. Depending on the specific type of precipitates, galvanic corrosion could occur between them and the Al matrix, leading to the dissolution of the intergranular precipitates (Mg-rich particles) or of the surrounding Al matrix (Si-rich and Cu-containing particles) [
5,
6].
To improve the corrosion resistance of AA6082, a surface treatment as plasma electrolytic oxidation (PEO) can be performed, in order to produce a protective coating on the surface of the metallic substrate. PEO coatings have already proved to increase the corrosion resistance of the base metal in chloride-rich environments [
7,
8,
9]. PEO is an oxidation process based on applying high voltages between the component to be treated (the anode) and a counter electrode [
10,
11]. The process occurs in aqueous electrolytes, most commonly at an alkaline pH. The addition of specific chemicals (e.g., Na
2SiO
3, NaAlO
2, Na
3PO
4) optimizes the structure of PEO coatings and reduces the ignition potential of plasma discharges. Indeed, all these chemicals not only participate in the plasma events and are incorporated in the growing oxide, but they also decrease the ignition (or breakdown) potential by increasing the conductivity of the electrolytic solution [
10,
12,
13]. At the beginning of the PEO treatment, a thin oxide film is generated, as in standard DC anodizing. As PEO proceeds, the applied voltage increases, reaching and overcoming the dielectric breakdown potential of the oxide film. Once this condition is achieved, plasma discharges are produced. These phenomena cause a local rise in temperature (in the order of 1000–10,000 K) and pressure (100 MPa). The thermally activated metallic ions are then ejected from the substrate, reacting with the oxygen dissolved in the electrolyte and producing new oxides [
10,
11,
14]. At the end of the PEO treatment, a well-adherent, thick, corrosion- and wear-resistant coating is produced.
Discharge initiation is due to the dielectric breakdown of the oxide film into micropores. At the beginning, discharges are small and do not last long, but later they gradually increase their intensity and lifetime. Even though discharges become larger and more powerful with time, their frequency and spatial density are reduced. Plasma events are classified into sparks, microarcs and arcs, with the last two having a destructive effect. The intensity of discharges depends on both electrical and chemical PEO process parameters. Regarding titanium alloys, the addition of metasilicates (SiO
32−) has been proved to reduce the intensity of micro-discharges, leading to compact and dense oxides [
15]. The electrolyte composition and concentration also demonstrated to influence the microstructure of PEO coatings. In aluminum alloys, phosphate-based electrolytes determine a larger breakdown voltage than silicate systems, resulting in larger pores and pancake-like structures [
16]. In general, a longer coating treatment is associated with more intense and lasting micro-discharges, causing more microdefects. Since destructive discharges are expected to increase with time, their partial suppression is desirable, for instance, through the formation of soft plasma. This condition can be reached by choosing a bipolar current regime instead of unipolar waveforms—the latter is linked to more defective oxides with pancake-like structures. The bipolar current regime is reported to alter the discharge mechanism, producing homogeneous and compact coatings [
14,
17].
The properties of PEO coatings can be optimized by tuning the electrical parameters selected for the PEO process, specifically the electrical mode, the applied voltage, the current density, the duty cycle and the frequency. Several studies [
18,
19,
20,
21] reported that the AC (alternate current) bipolar mode improves the corrosion resistance of the coatings promoting the formation of compact and thick oxide layers. The thickness of the coatings is observed to grow even for rising applied voltages or current densities. On the other hand, PEO coatings produced at more intense potential or current are generally characterized by higher levels of surface roughness and the presence of larger defects. Such drawbacks are related to the generation of extremely energetic sparks and copious gas evolution at high voltages and currents [
18,
22].
The literature presents two different models to describe the plasma discharge mechanism: discharges can originate from the dielectric breakdown of the oxide film or from gases into micropores. In general, when the breakdown voltage of the oxide layer overcomes that of the gas envelope, discharges tend to be generated from gases inside micropores, and the second model becomes predominant. In this case, more elements arising from the electrolyte contribute to the formation of the oxide structure. Conversely, when the main mechanism is oxide breakdown, the coating will be mainly constituted by substrate elements [
15]. A proper optimization of electrical and chemical process variables is useful to suppress intense and long-lasting discharges [
12,
16].
According to the literature, voltage has the greatest impact on coating properties among the electrical process parameters: a growing voltage increases the coating thickness and may increase its corrosion resistance. However, the combined influence of the three main electrical factors (voltage, frequency and duty cycle) should be considered. High frequencies and low duty cycles favor the formation of oxide layers with small defects, enhancing the corrosion protection offered by the PEO coatings [
9,
23,
24]. There is evidence of the fact that low voltage, small duty cycle and high frequency enhance the coating resistance to chlorides, in case of aluminum alloys—the reason is arc extinguishing phenomena which produce a compact oxide structure. In particular, the combined impact of voltage and frequency seems predominant with respect to the duty cycle. Conversely, high voltage, low frequency and large duty cycle increase the reaction rate, the coating thickness and the corrosion resistance under acidic conditions [
25]. Therefore, the thickness growth and the porosity reduction seem to be counteracting.
This study focuses on the evaluation of the electrical input effect on coating microstructure and corrosion resistance. Potentiostatic short PEO processes, lasting five minutes, have been carried out at a maximum effective anodizing potential 350 V. During the treatment, this fixed voltage is reached through different combinations of ramp (gradual increase of the potential) and maintenance (constant applied voltage) phases. The influence of the relative duration of the two phases on the structure of PEO coatings has been evaluated through XRD, SEM and EDS analyses. Their corrosion resistance has been assessed using linear polarization resistance (LPR), potentiodynamic polarization (PDP) and electrochemical impedance spectroscopy (EIS) tests. The innovative character of this research work lays in the evaluation of the combined effect of the anodizing voltage and of its evolution with time on the PEO coating properties and microstructure. Specifically, these parameters are typical of the PEO processes in voltage control, and cannot be investigated in the more diffused current control anodizing. Other electrical factors such as frequency, duty cycle and waveform, are instead fixed. Given the limited information about the optimization of electrical variables and the complexity of their interactions for potentiostatic PEO treatments, the analysis of various voltage tendencies with time carried out in this work becomes of particular interest, even though further work will be necessary for clarifying the role of parameters which, in this study, were fixed.
2. Materials and Methods
2.1. PEO Coatings
PEO treatments were performed on aluminum AA6082 disks, 10 mm in diameter, 5 mm thick; the total surface area is equal to 3 cm
2. Samples were manually polished with silicon carbide abrasive papers using 100, 320 and 600 grits. Treatments were performed in an alkaline solution containing 0.014 M KOH and 0.076 M NaOH, with the addition of 10 g/L sodium metasilicate (Na
2SiO
3) and 10 g/L glycerin (C
3H
8O
3), using an activated titanium as counter-electrode. The coating process was executed with a California Instruments Asterion 751 series AC/DC power supply. The electrical input was applied in potentiostatic control at a maximum anodic effective voltage equal to 350 V. A pulsed bipolar regime was imposed, at 1000 Hz frequency and a total treatment duration of 300 s. The chosen duty cycle consists of 60% anodic polarization, 40% cathodic, and the cathodic voltage peak corresponded to 7% of the anodic signal [
13,
20,
26]. The whole active surface of 3 cm
2 was coated.
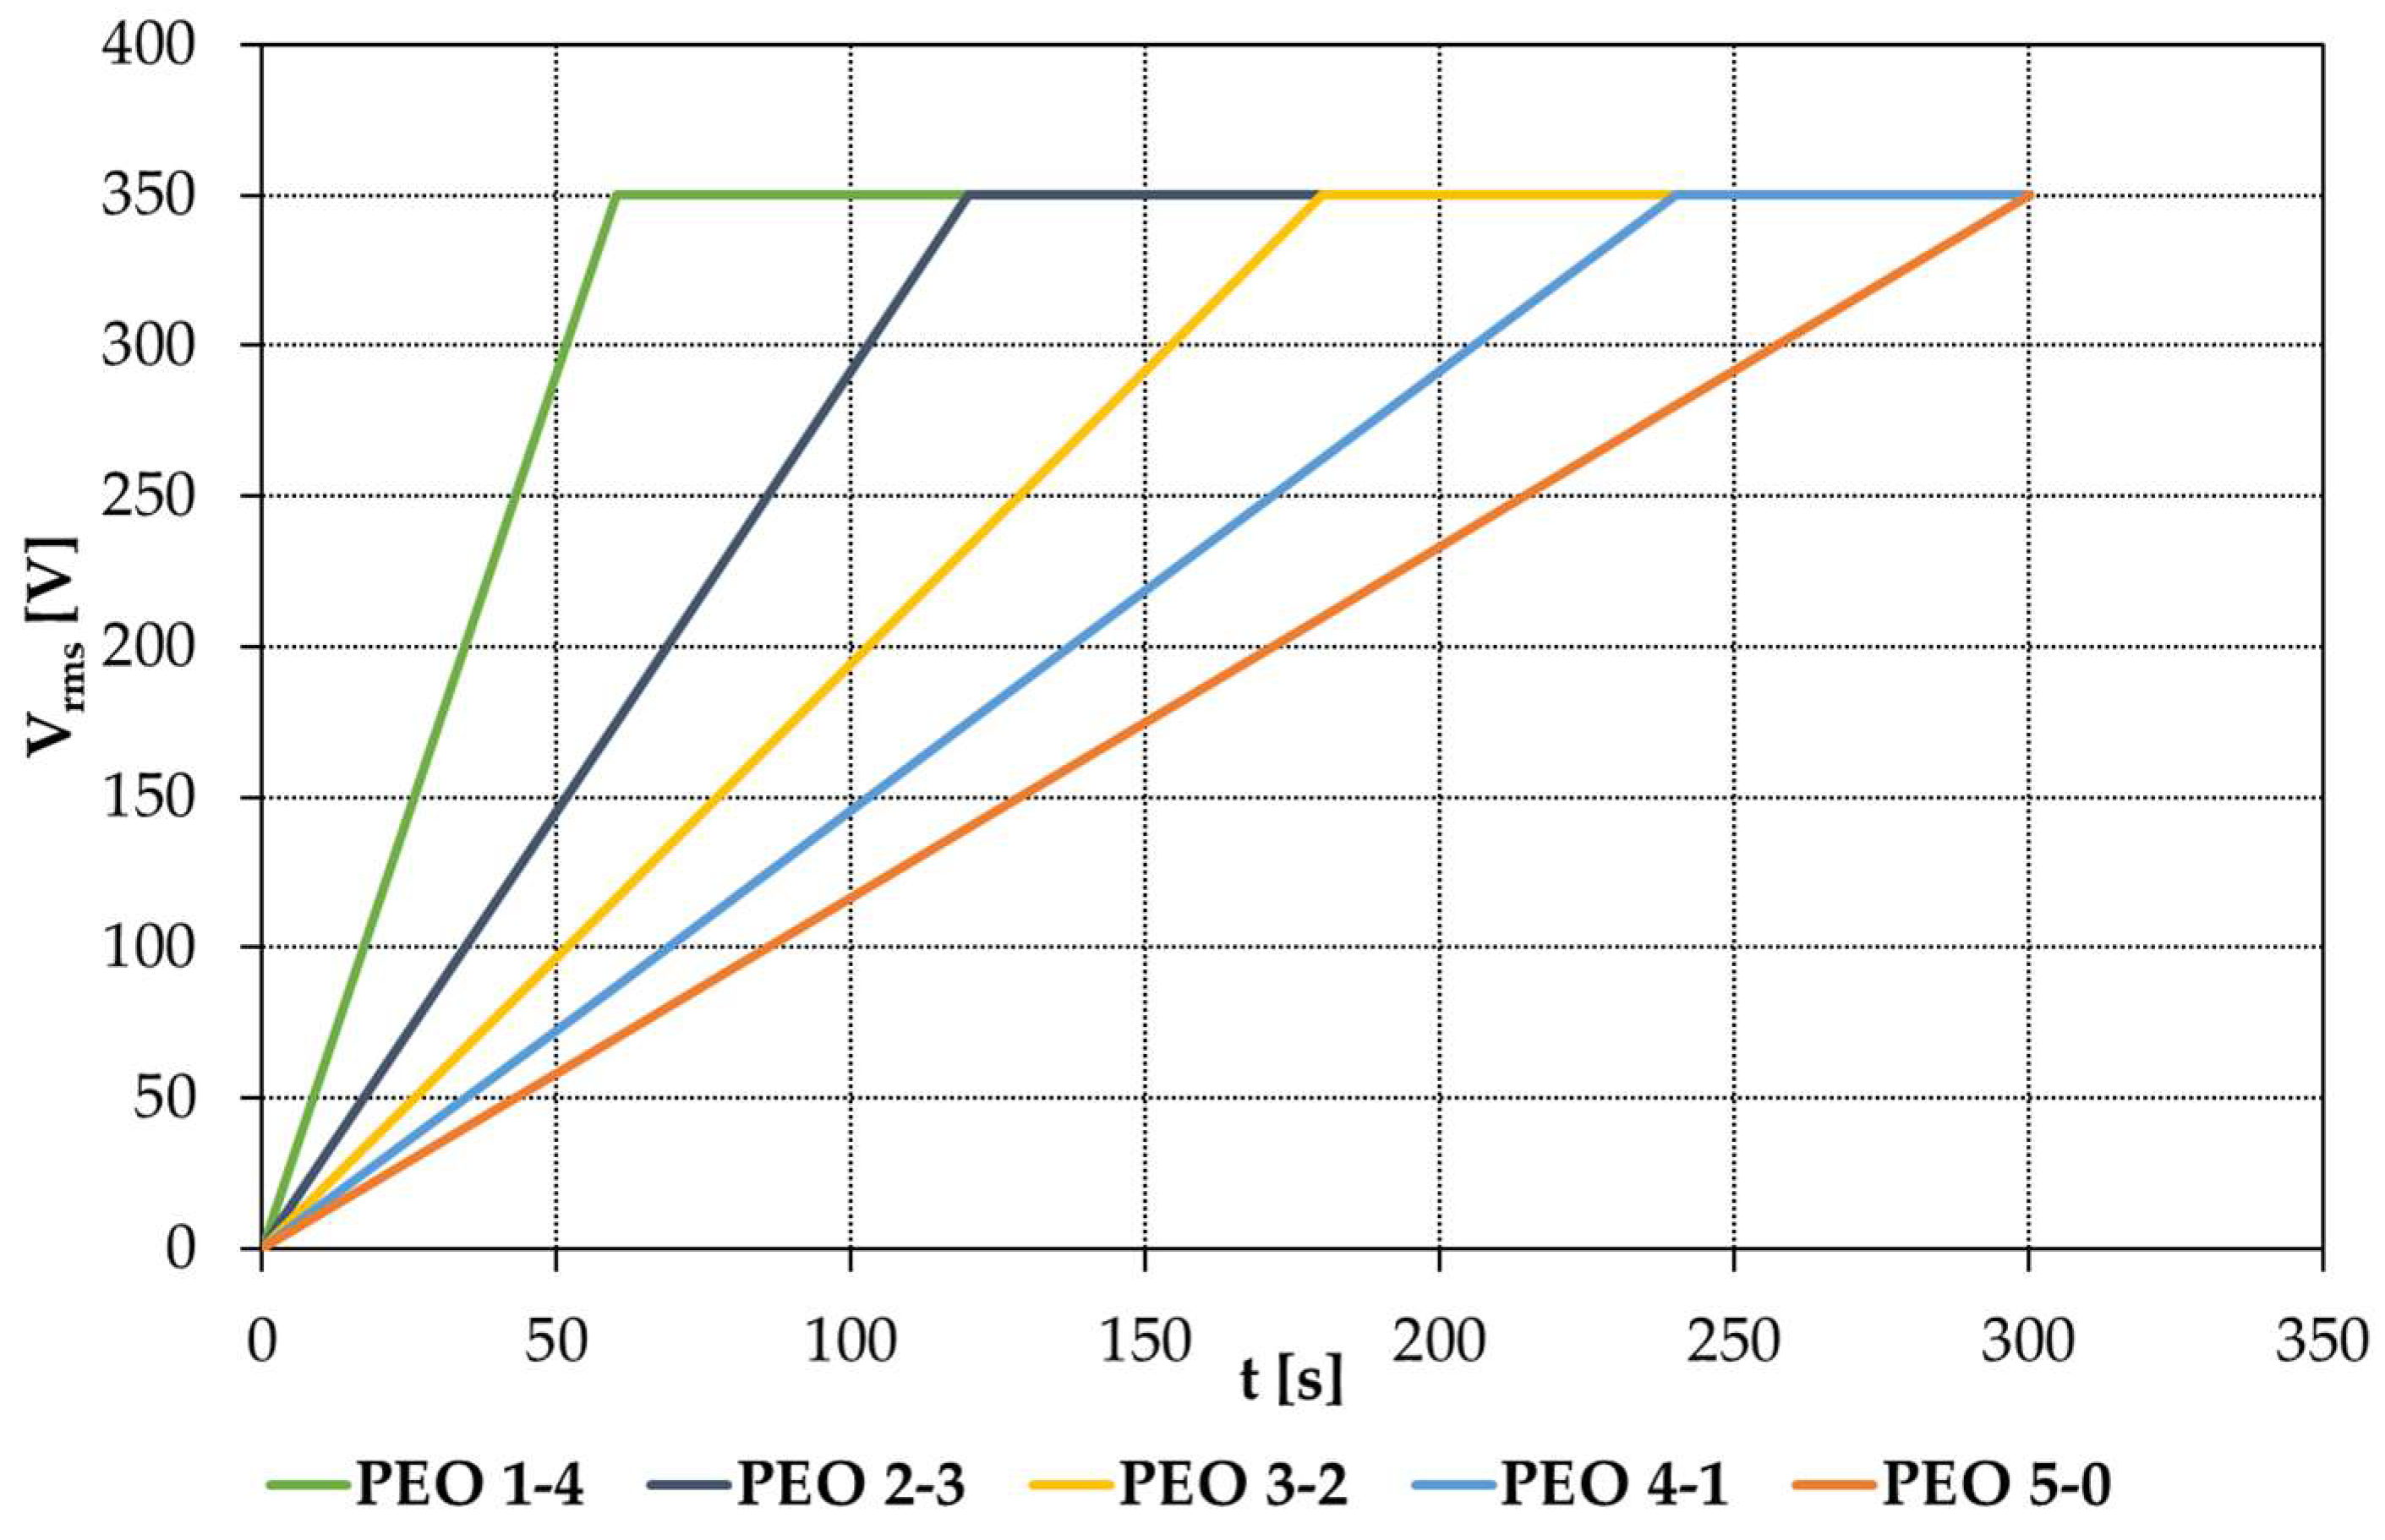
Five different electrical inputs were selected, including a rising ramp and a maintenance interval at the effective tension of 350 V:
5 min ramp: PEO 5-0
4 min ramp and 1 min maintenance: PEO 4-1
3 min ramp and 2 min maintenance: PEO 3-2
2 min ramp and 3 min maintenance: PEO 2-3
1 min ramp and 4 min maintenance: PEO 1-4
Each coating process was repeated eight times.
The applied rms potential versus time of each of the five processes are reported in
Figure 1.
The voltage trend with time was monitored with a Tektronix TBS-1072B-EDU oscilloscope.
2.2. Coating Characterization
The corrosion behavior of PEO oxides is studied through electrochemical techniques such as potentiodynamic polarization test (PDP), electrochemical impedance spectroscopy (EIS) and linear polarization resistance (LPR). All tests are executed in a solution with 3.5% mass fraction of NaCl, at room temperature; the entire surface area of 3 cm2 is immersed in the solution. Two series of EIS, LPR and PDP tests are performed per sample. A conventional three-electrode cell setup is employed, constituted by a platinum counter electrode and a silver/silver chloride (SSC) reference electrode (Amel Electrochemistry, Milan, Italy), saturated with KCl salts (+0.197 V SHE). EIS and LPR analyses are carried out with a Metrohm Autolab PGSTAT (Metrohm Italiana Srl, Origgio, Itlay). A scan rate of 10 mV/min is selected for PDP inspections, and the sample is polarized from −300 mV to +500 mV with respect to the free corrosion potential, Ecorr. The same scan rate is used for LPR investigations, where the sample is polarized from −10 mV to +10 mV with respect to Ecorr. The chosen potential range is ±20 mV around Ecorr for LPR analysis. EIS is performed by applying a sinusoidal input of amplitude 10 mVrms around Ecorr, with a frequency ranging from 105 to 10−2 Hz and 10 collected points per decade of frequency. The equivalent electric circuits (EECs) to model PEO coatings are found using the software ZView to elaborate EIS experimental data. Both PDP and EIS are executed after 60 min of immersion.
The coating thickness is measured with a portable DUALSCOPE FMP100 (Helmut Fisher Srl, Milan, Italy).
The morphology of PEO oxides is observed with a Carl Zeiss EVO 50VP SEM (ZEISS, Oberkochen, Germany), equipped with a Bruker X-ray spectrometer for energy dispersive spectroscopy (EDS).
The image analysis software ImageJ 1.53t (public domain,
https://imagej.net/ij/index.html, accessed on 29 April 2025) is used to determine defects dimension and the surface porosity percentage.
The crystalline structure of PEO coatings is studied through X-ray diffraction (XRD), exploiting a Philips PW3020 goniometer (Philips, Milan, Italy) with Cu Kα1 radiation (1.54058 Å).
3. Results
3.1. Current Density and Voltage During PEO
The voltage trend versus time is recorded during the entire coating process of 300 s.
Current and voltage acquisitions are also collected at two key moments: 20 s before the end of the ramp (
Figure 2, the single curves are displayed in
Figure A2) and 20 s before the end of the maintenance period and the coating treatment (
Figure 3, the single curves are displayed in
Figure A2). The comparison of different current outputs is interesting, as the PEO has been performed under potentiostatic conditions.
About
Figure 2, curves are obtained at different applied voltages so they cannot be compared directly. This occurs because the five voltage ramps have different slopes, since they cover different time spans, from 5 min to 1 min, sharing the same initial and final voltage. Therefore, the maximum effective voltage of 350 V is reached after different times, according to the chosen ramp. Consequently, each curve was captured at a different applied voltage (
Figure A1): 330 V
rms for PEO 5-0, 320 V
rms for PEO 4-1, 311 V
rms for PEO 3-2, 292 V
rms for PEO 2-3, and 233 V
rms for PEO 1-4.
For this reason, PEO 1-4 and PEO 2-3 exhibit a low current value measured 20 s before the end of the ramp. Although it does not correspond to the highest voltage, PEO 3-2 shows the largest current output. Conversely, PEO 5-0 and PEO 4-1, captured at the largest applied voltages, do not display the highest current—they share a similar current output, rather large, but not the greatest. This phenomenon may be justified by the growth of the insulating oxide, almost completely formed at the moment of the acquisition, if it is considered that for PEO 5-0 and PEO 4-1 the instant of acquisition is placed rather at the end of the process (20 s before for PEO 5-0, 80 s before for PEO 4-1). The acquisition of PEO 3-2 is obtained at a potential very close to the one of PEO 4-1, but it may be less conditioned by the presence of a resistive oxide layer; therefore, it produces the largest current output.
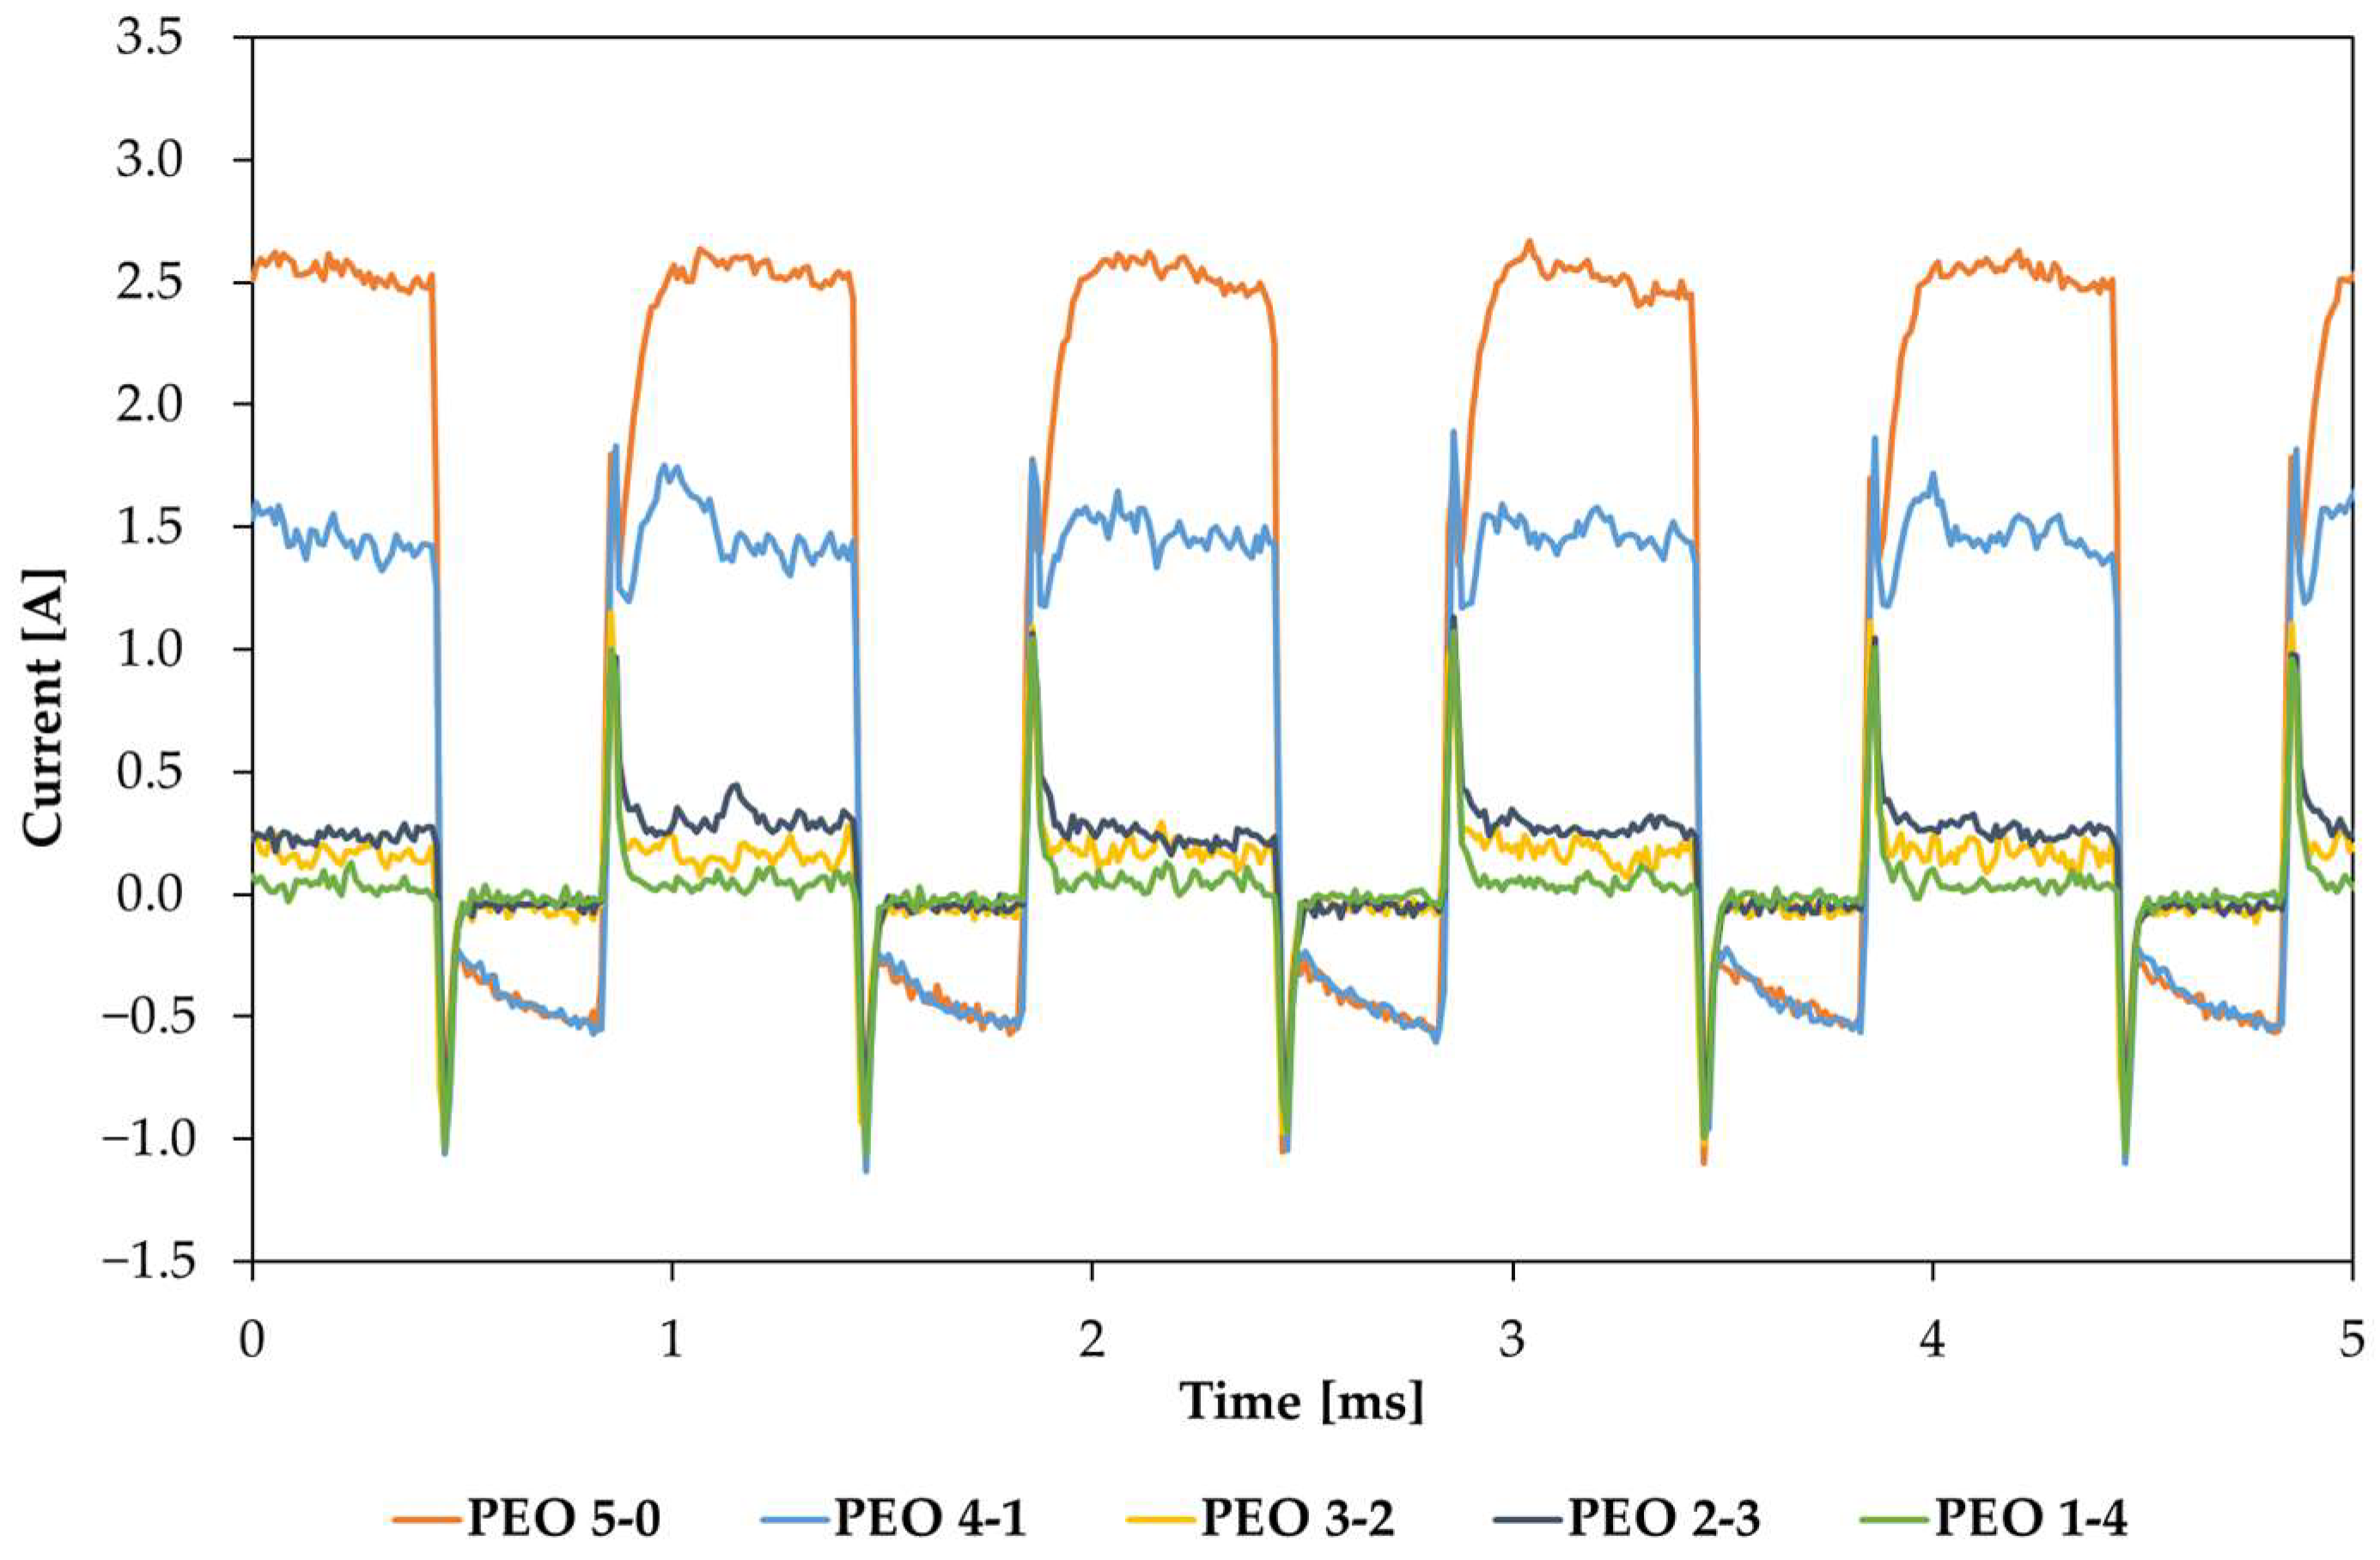
Different from
Figure 2, curves of
Figure 3 share the same applied voltage of 350 V
rms, apart from PEO 5-0, captured at 330 V
rms. It can be noticed that the measured current output tends to decrease with increasing maintenance times. The only exception is represented by PEO 2-3, having a slightly larger current than PEO 3-2, but the values appear similar, and the trend seems the same. PEO 5-0 and PEO 4-1 are characterized by much larger currents than the other three samples. Specimens produced after a maintenance period of 2, 3 and 4 min share almost the same current, which can be considered low compared to PEO 5-0 and PEO 4-1. By extending the maintenance time, the duration of low-voltage anodizing reduces, resulting in a faster growth of the PEO coating; while the oxide forms, a resistive layer is created, leading to a lower number and distribution of discharges. Consequently, measured current values are expected to decrease by increasing the maintenance time.
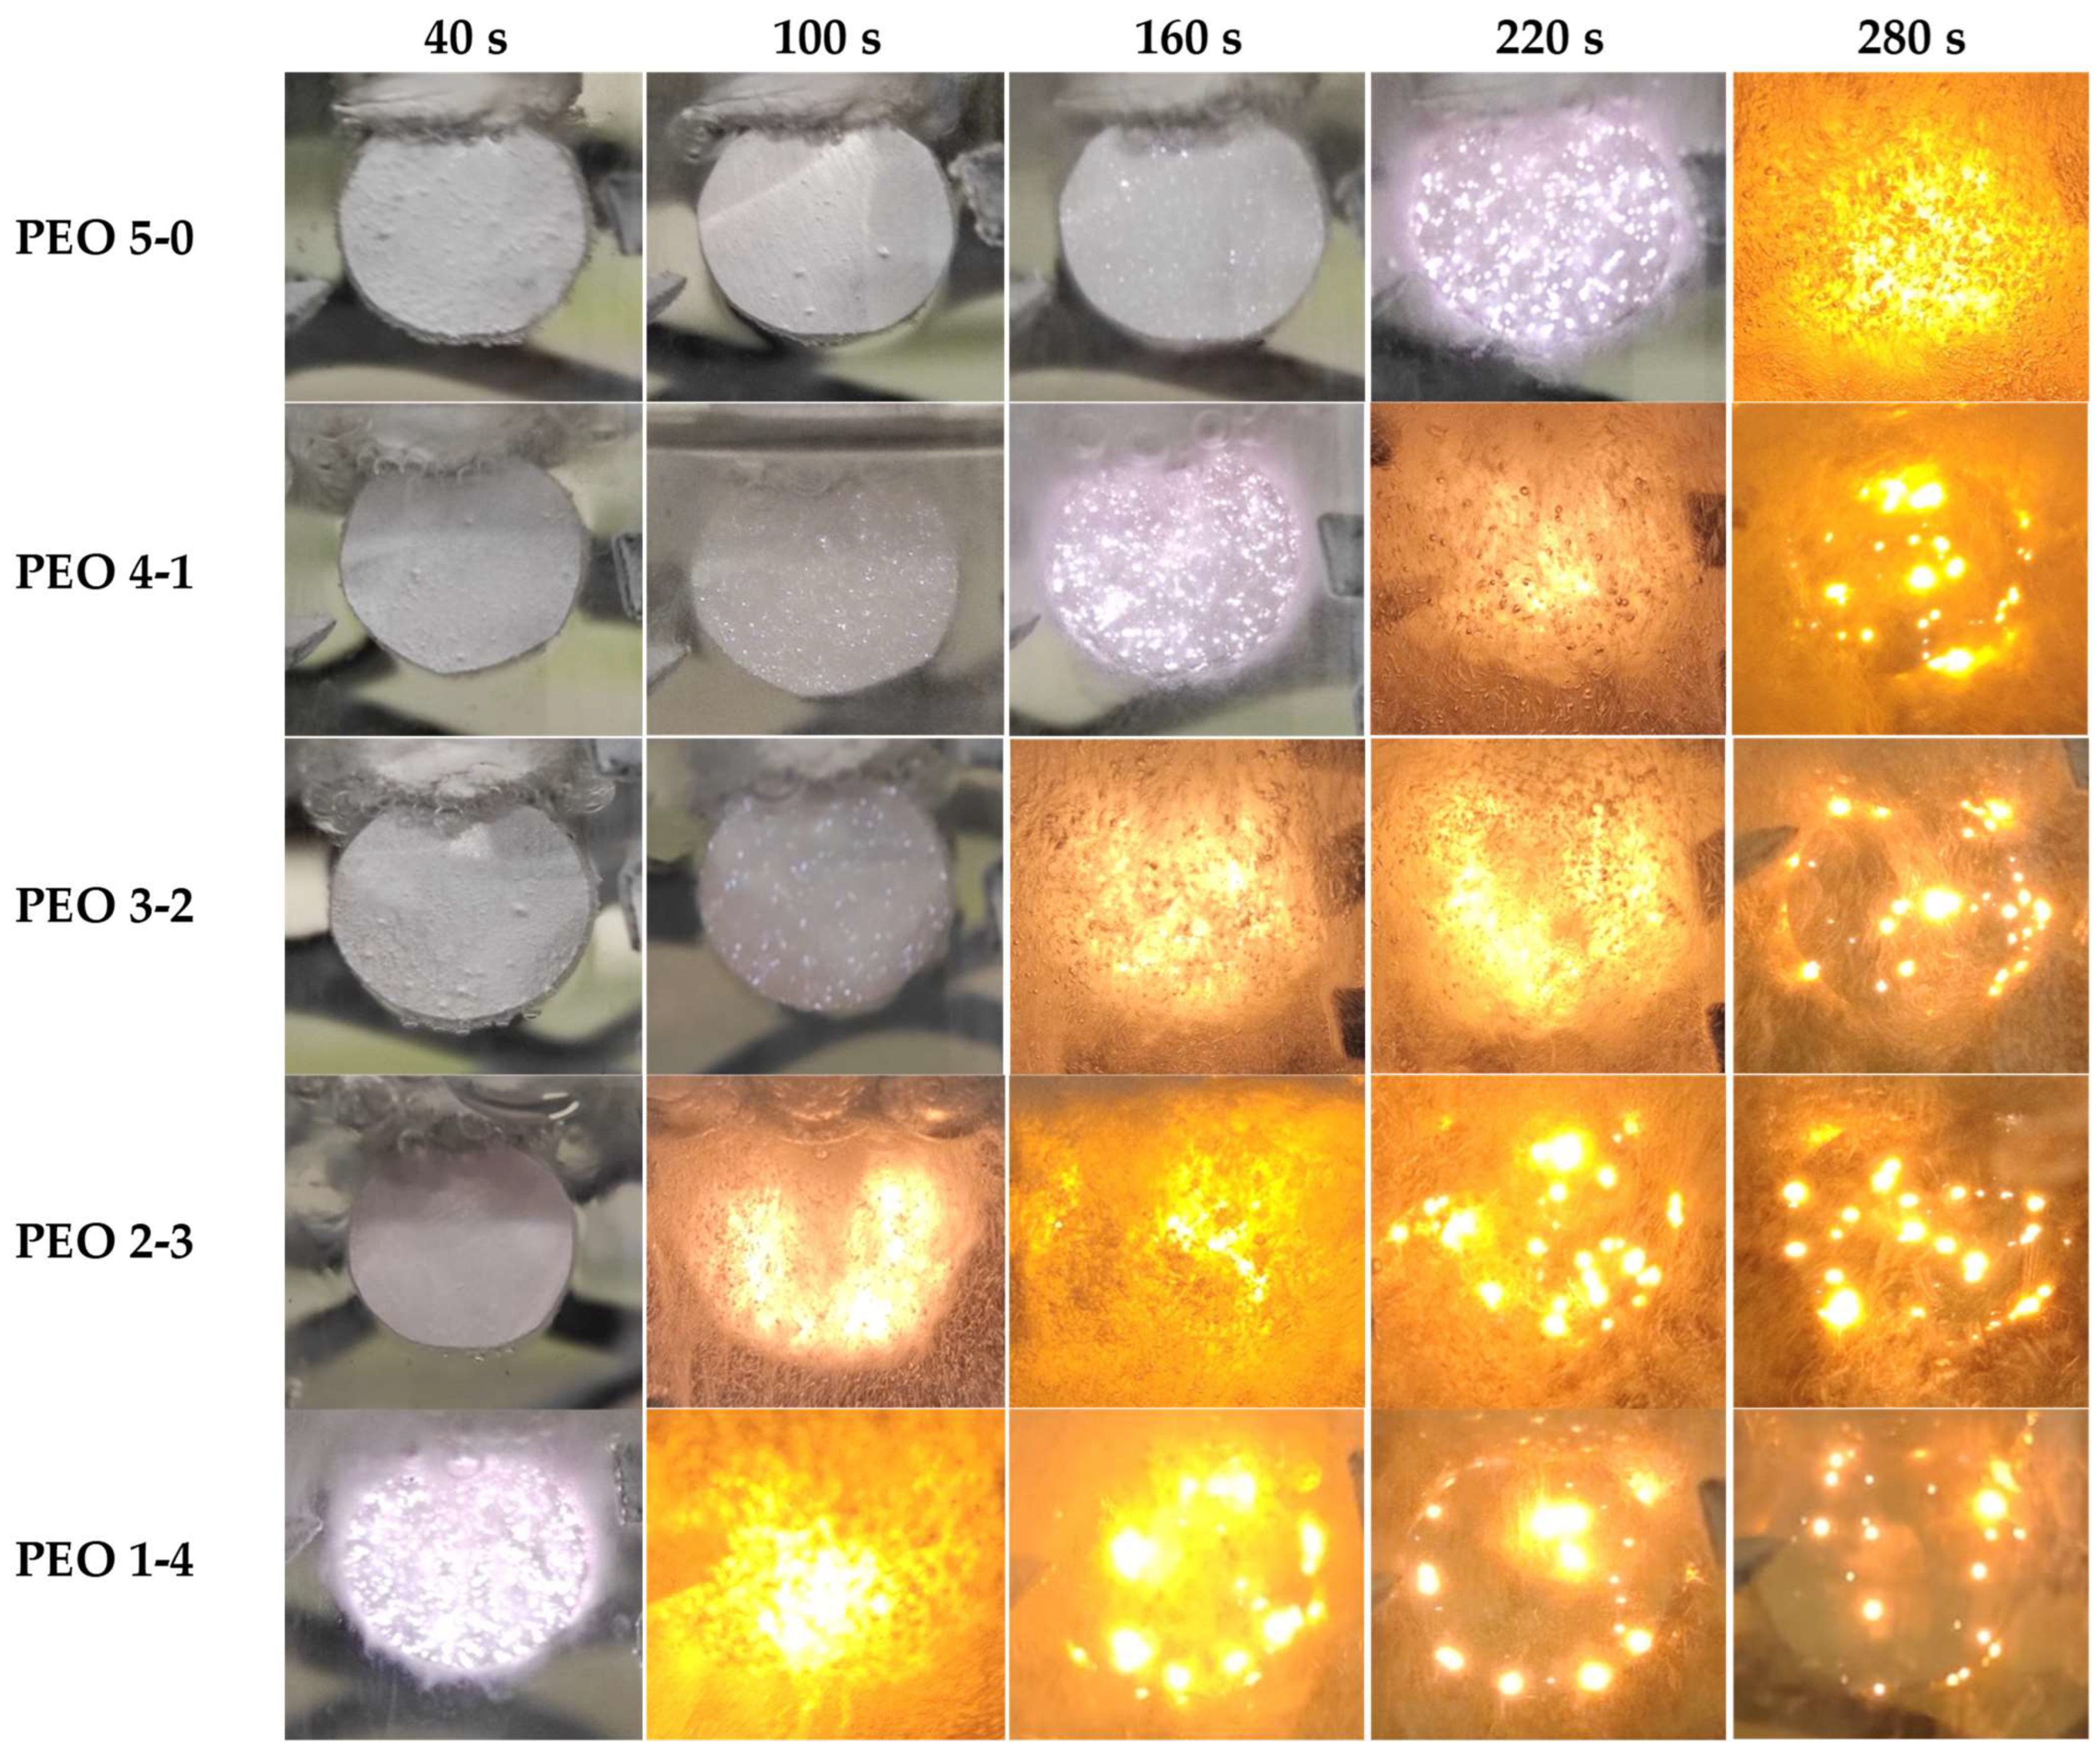
Figure 4 reports the progressive evolution of PEO treatment over time. Samples PEO 5-0, PEO 4-1, PEO 3-2, PEO 2-3 and PEO 1-4 are monitored at five fixed time frames: 40 s, 100 s, 160 s, 220 s and 280 s. The scope is understanding the discharge features and evolution, thus studying their effect on the coating structure. The intensity and surface distribution of plasma discharges is indeed essential to predict the oxide morphology and properties.
Regarding PEO 5-0, some sparks are already visible at 160 s, but their number increases at 220 s. Discharges exhibit a very high intensity at 280 s, 20 s before reaching the maximum effective voltage of 350 V. At this time, gas evolution also becomes important. About PEO 4-1, the first sparks can be detected after 100 s, before growing in terms of intensity and spatial density at 160 s. A very high intensity can be observed after 220 s, together with remarkable gas evolution. Discharges become bigger but less frequent after 280 s, 40 s after reaching the maximum effective voltage of 350 V. In PEO 3-2, the first sparks are visible at 100 s, similarly to PEO 4-1, but with a higher number. Discharges become suddenly very intense after 160 s, and a large quantity of gas is produced. A similar situation is kept at 220 s, 40 s after reaching the maximum effective voltage. At 280 s, arc discharges are less frequent and less distributed across the surface, but larger in size. PEO 2-3 is featured by a high intensity of discharges already after 100 s, which further increases at 160 s. The copious gas evolution reduces after 220 s and 280 s, when large discharges form with a lower spatial density. Regarding PEO 1-4, very dense sparks manifest already after 40 s, while at 100 s, they have become more intense, with an important gas evolution. At 160 s, discharges are still very strong but less frequent; very large sparks can be seen along the edge of the sample. Their spatial density and size decrease after 220 s; however, some large spots can be noticed, especially at the borders. After 280 s, discharges tend to become quite rare, less strong and with a limited distribution.
3.2. Coating Thickness
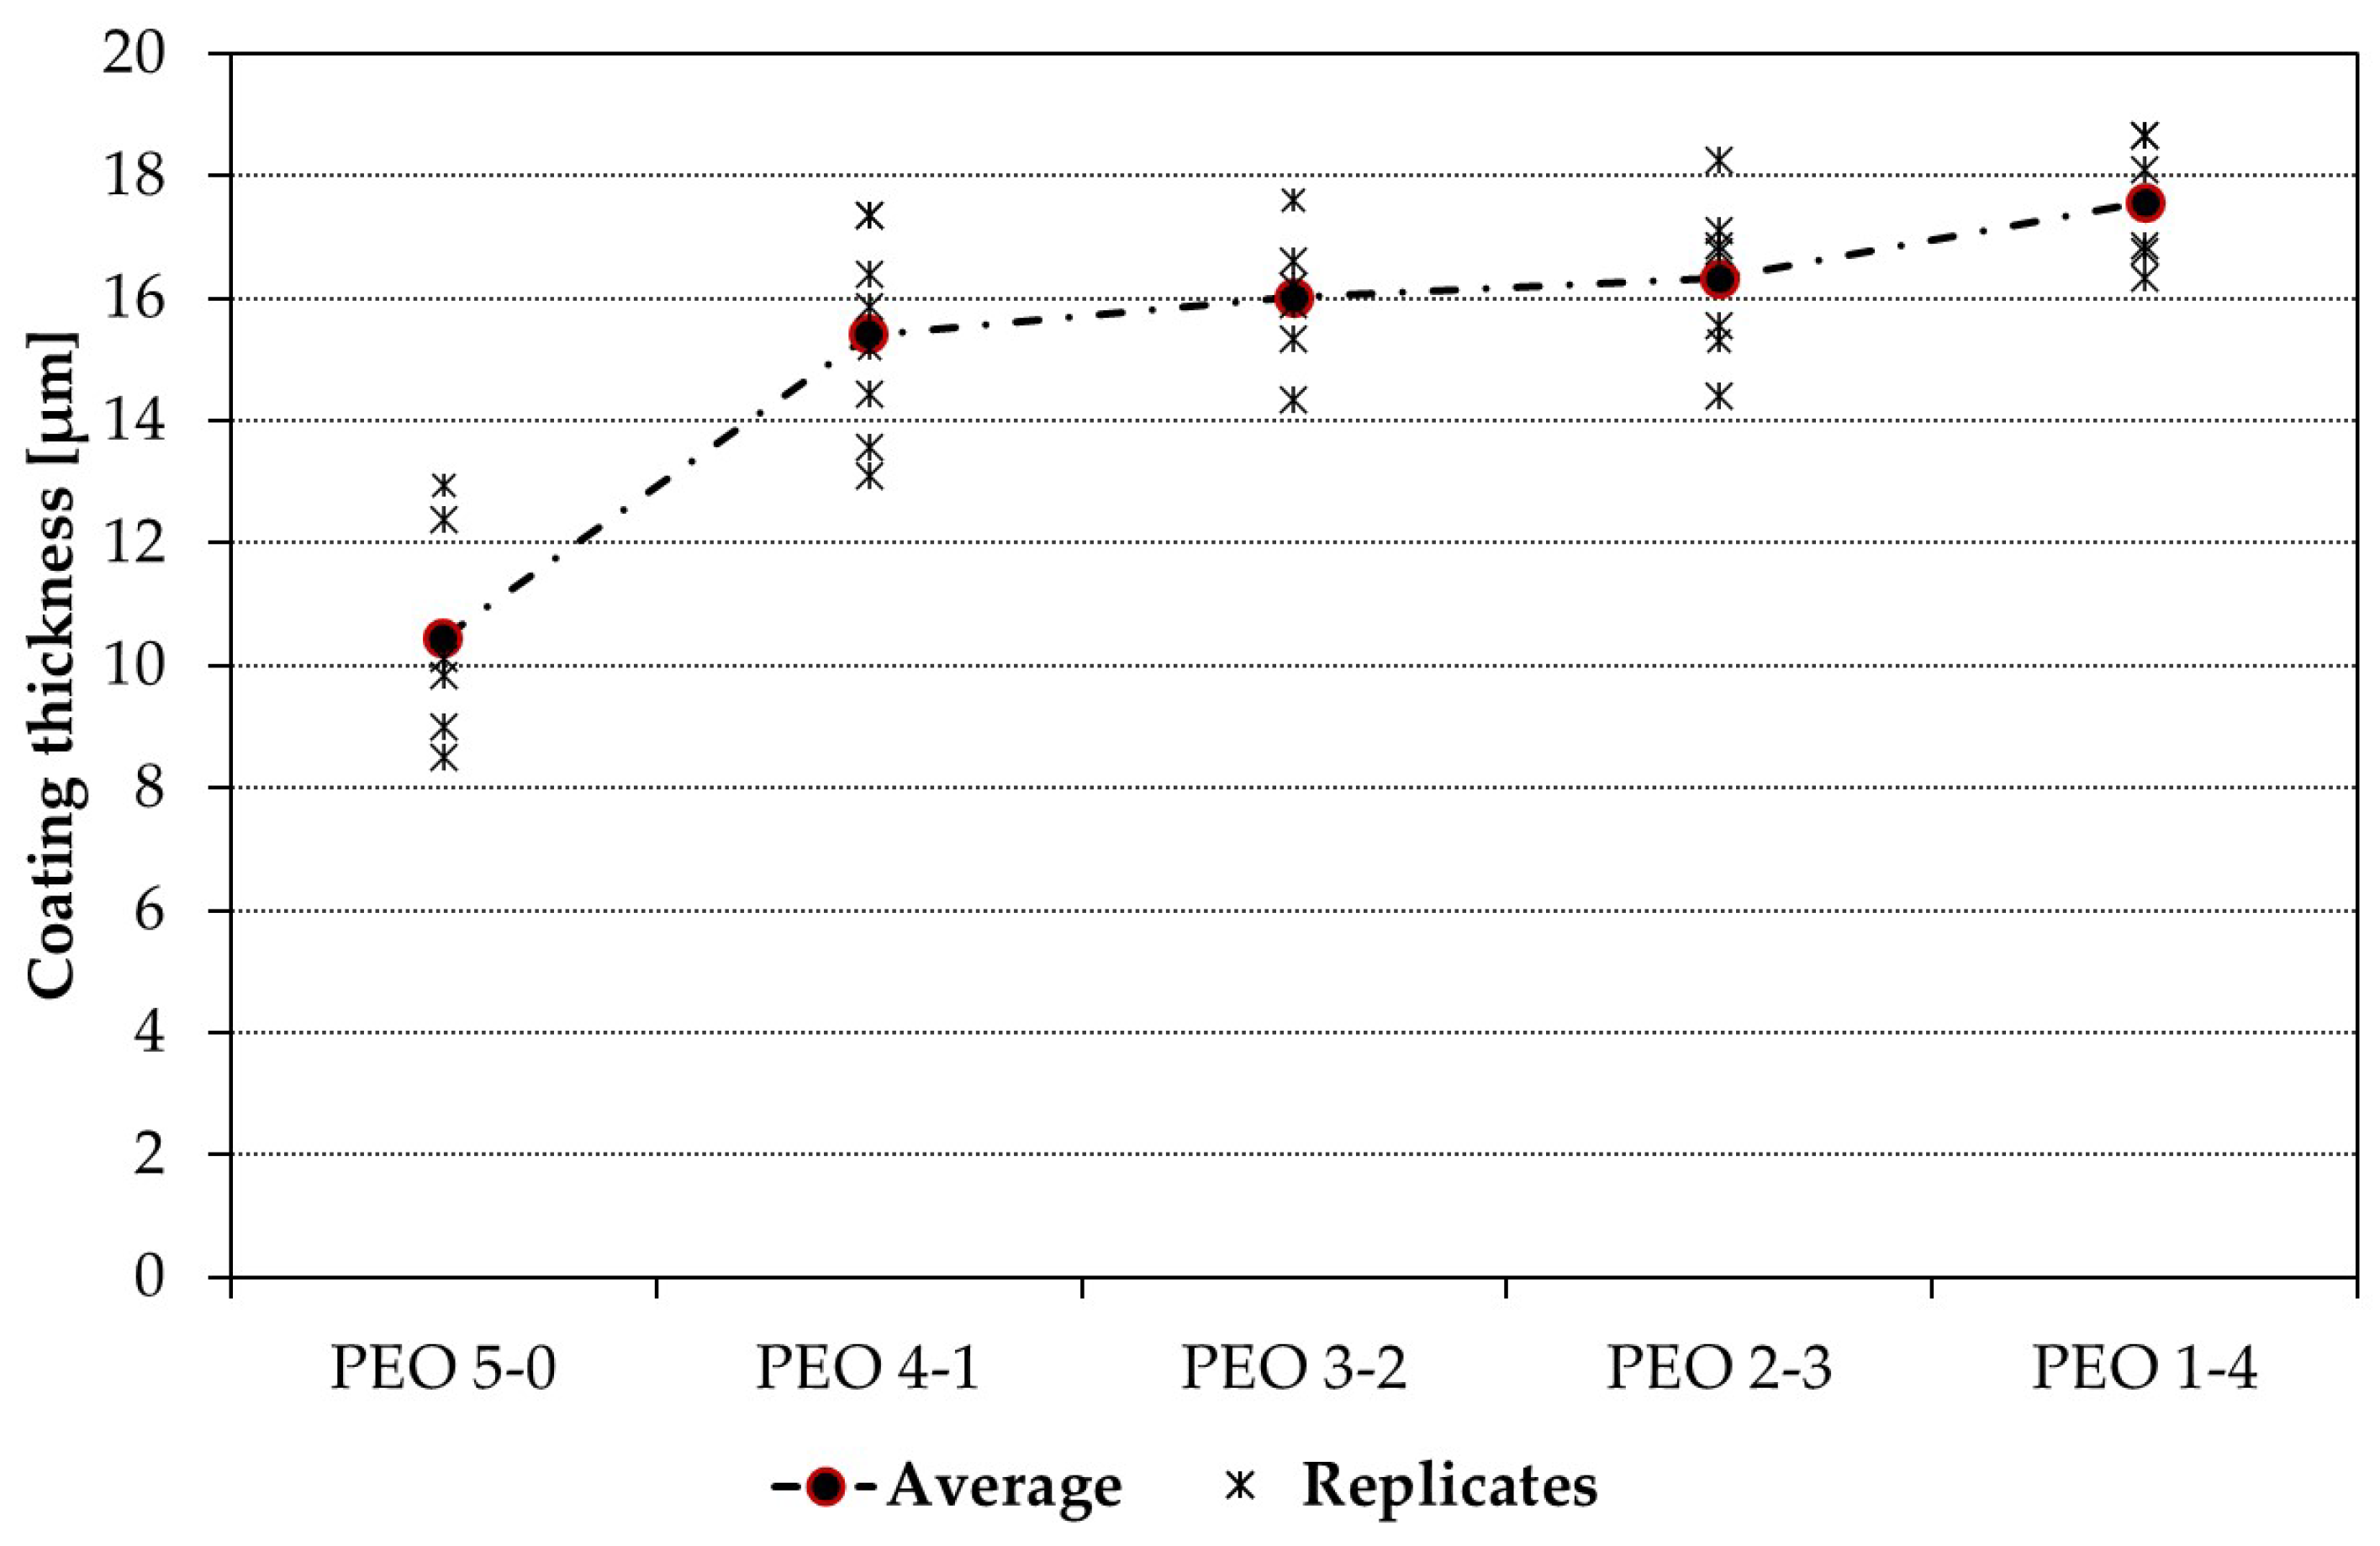
Coating thickness after PEO was measured with a portable DUALSCOPE FMP100. Thirty thickness readings were performed on each of the eight replicates of the samples; thus, for each of the five PEO processes, 240 measures were taken. Results are summarized in
Figure 5: the longer the high-voltage anodizing periods, the greater the oxide growth rate, and the thicker the coatings. Coating thickness grows monotonically as the maintenance time is extended.
However, if the coating thickness grows by almost 70% passing from the PEO 5-0 specimen to the PEO 1-4 one, around 70% of this gain is obtained just by introducing a maintenance time of one minute (PEO 4-1 sample). By further extending it, however, only minor thickness changes are observed, passing from the 15.40 µm obtained with PEO 4-1 to the 17.56 µm of PEO 1-4.
On the other hand, if the thickness of single replicates is considered, a progressive and constant reduction of the dispersion of results can be observed as the maintenance time is extended.
3.3. XRD
The diffractograms of PEO samples are shown in
Figure 6.
All the specimens had in common the presence of Al (card: 01-085-1327) and γ-Al
2O
3 (card: 00-001-1303) signals. The Al-lines are especially intense in the case of PEO 5-0 and PEO 4-1 (the signals in
Figure 6a,b are cut). This may be justified by a lower thickness of the two coatings which did not properly shield the Al substrates, making the acquired signals more intense. Another characteristic common to all specimens, apart from PEO 4-1, was the presence of structures containing silicon. SiO
2 was found in PEO 2-3 in the form of zeolite (card: 98-017-0511) and as cristobalite (card: 00-027-0605) in PEO 5-0 and PEO 1-4. XRD spectra of PEO 3-2 and PEO 1-4 show some peaks which can be attributed to magnesium silicate. However, its signal has a very low intensity; therefore, its presence cannot be confirmed for sure, even though the composition of substrate and electrolyte could allow for its formation (Mg provided from the substrate, silicate ions from the electrolyte). In the latter two coatings, even aluminum–magnesium structures were found.
PEO-coated surfaces have thus a heterogeneous nature because all the oxides of metals constituting the alloy are present, together with Al-Mg non-stoichiometric intermetallic traces of magnesium silicate. Silicon compounds can also originate from the electrolyte, containing metasilicates. Apart from possible random local deviations in terms of composition, a certain trend is detected according to the applied electrical input. Silicon-based structures are found with the increase of maintenance periods up to 2, 3 and 4 min, thus suggesting that the incorporation of silicate anions through discharge channels becomes easier at higher voltage. This phenomenon is further detailed in
Section 4.
3.4. SEM—EDS
The oxide surface of all the samples (
Figure 7) displays a morphology typical of PEO coatings, with the presence of both rounded and elongated pores and even volcano-like structures. The average dimension of the pores is 3.7 ± 1.3 μm for PEO 5-0, while it increases to about 5.7 ± 1.4 μm in the case of PEO 4-1, PEO 3-2 and PEO 2-3. The largest average dimension was observed for PEO 1-4—6.1 ± 2.3 μm. In addition to these large pores, even finer porosity could be noted on all the oxide surfaces, whose order of magnitude is one micrometer or lower.
An estimation of the surface porosity percentage was provided using ImageJ. A chromatic threshold level is chosen according to the picture scale to separate porosities from the solid matrix. Dimensional filters can be added to include or exclude some voids. The following values do not take into account the porosity of the entire oxide thickness. PEO 5-0 shows the lowest porosity (about 3.2%). Similar values are obtained for PEO 4-1, PEO 3-2, and PEO 1-4, for which the porosity percentages were 4.1%, 4.6% and 4.5%, respectively. Finally, PEO 2-3 shows the highest porosity, close to 6.1%. Although SEM images are representative of local surface conditions, it seems clear that PEO 5-0 has the largest average dimension of pores and PEO 1-4 the smallest. It is more difficult to discriminate between the other three intermediate samples, characterized by similar defect size and distribution. The following figures may reflect the entire coating surface state.
The EDS maps (in
Figure A3, PEO 3-2 EDS map is given as an example) highlighted that all the chemical elements present into the electrolytic bath (K, Na, C, Si, O) participated in the oxide growth in all five PEO processes. Even the metallic elements (Al, Si, Mg) present in the AA6082 substrate were found in the coating, meaning that they took part in the plasma and electrochemical reactions. All the elements displayed a uniform and quite homogeneous distribution over the oxides’ surface, apart from Si, which appeared more concentrated in some spots, especially in samples PEO 3-2, PEO 2-3 and PEO 1-4.
3.5. Potentiodynamic Polarization Tests
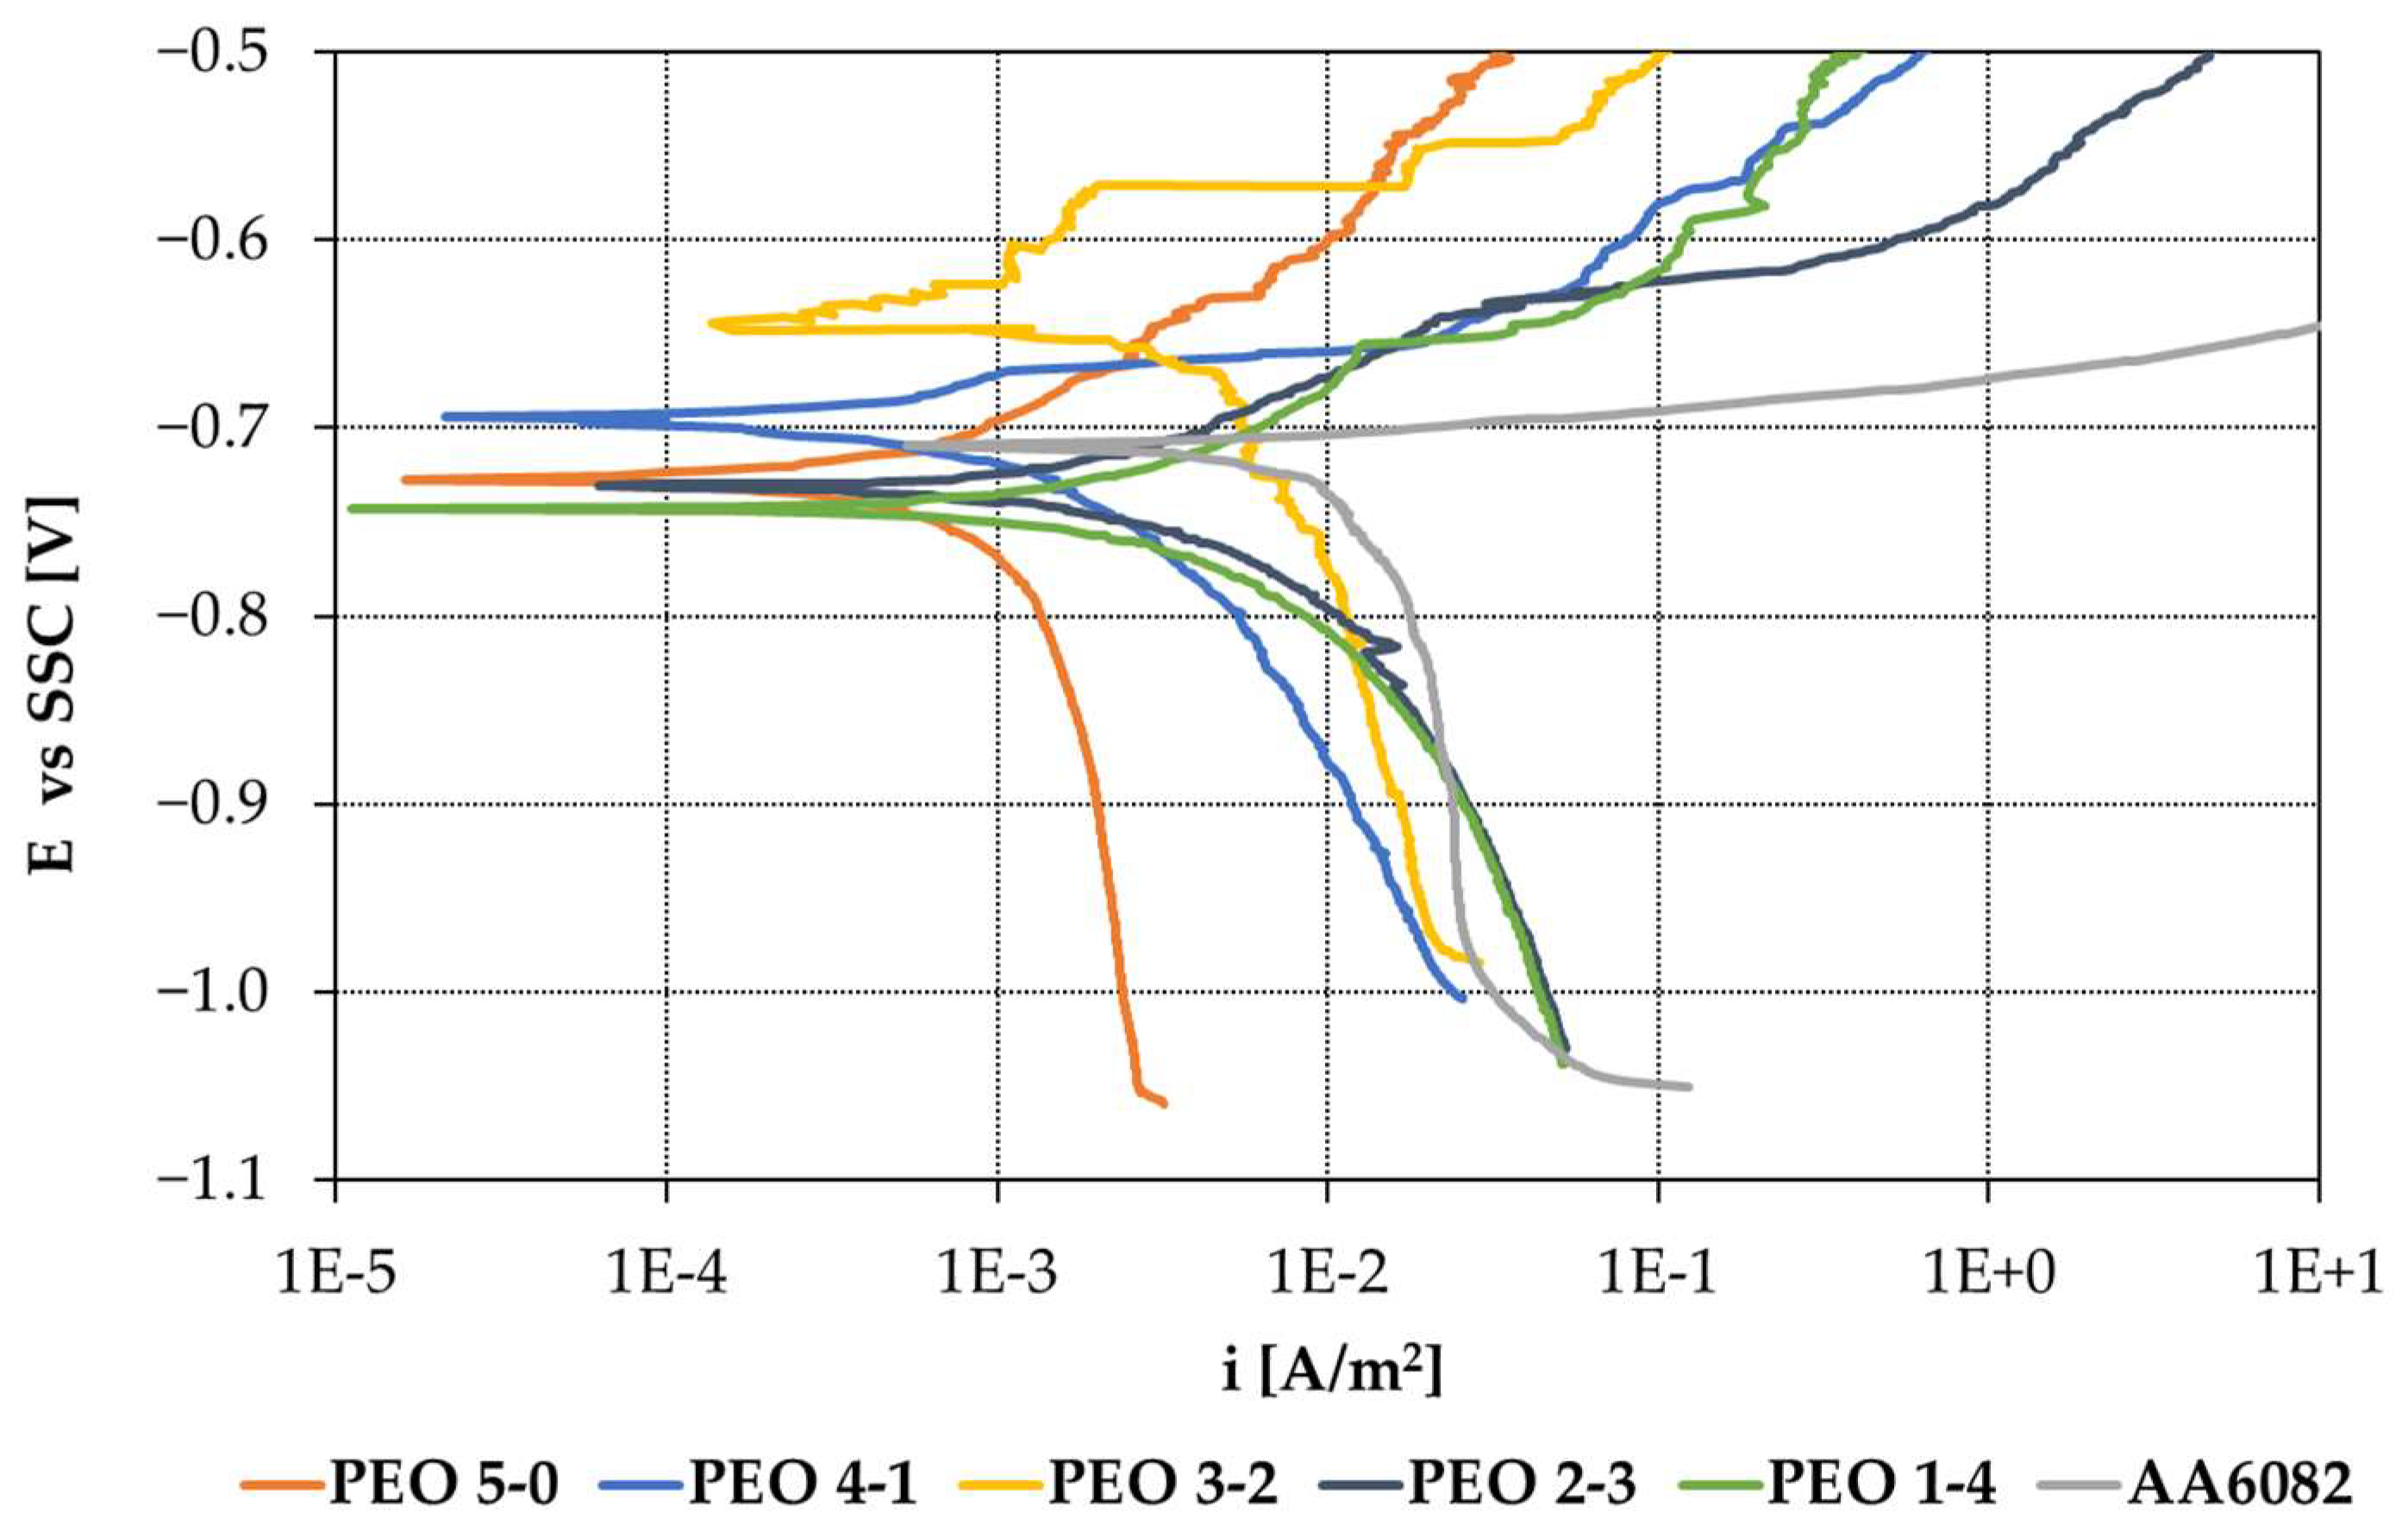
Potentiodynamic polarization tests were carried out in a 3.5% mass fraction of NaCl aqueous solution after one hour of free corrosion potential stabilization. The most representative curves for each of the five coatings are reported in
Figure 8. Almost all the coatings share a free corrosion potential (E
corr) ranging between −0.750 V and −0.650 V SSC. The shape and slopes of the anodic and cathodic branches of the curves are different, and thus have different values of corrosion current density (i
corr). Potentiodynamic polarization curves are analyzed through Tafel extrapolation: the fit is performed over a range of 20 mV, taken from +50 mV to +100 mV with respect to E
corr for the anodic fit and from −50 mV to −100 mV with respect to E
corr for the cathodic fit.
Numerical data of the coatings characteristic curves obtained from the
Figure 8 plot and from the other replicates are given in
Table 1.
PEO coatings produced with longer maintenance periods show a lower value of the anodic slope (ba), especially from the PEO 2-3 specimen. Indeed, PEO 5-0, PEO 4-1 and PEO 3-2 show a passive-like behavior in the initial part of the anodic branch, while PEO 2-3 and PEO 1-4 display an active characteristic, with no indication of passivity. Specimens displaying an initial passive behavior, however, also show the interruption of passivity, with a sudden current increase, due to the combined effects of the aggressive testing solution and of the polarization imposed. In particular, PEO 3-2 is the one featuring the longest survival of passivity, which breaks only at around +100 mV over Ecorr.
The higher the treatment duration, the higher the limit current density of oxygen reduction (iL): the value measured on PEO 5-0 is one order of magnitude smaller than the one on PEO 1-4 coating.
Accordingly, the corrosion current density (icorr) grows with maintenance durations, passing from the average value of 0.98 mA/m2 for the PEO 5-0 coating to the 3.51 mA/m2 for PEO 1-4. However, treatment PEO 4-1 does not follow this trend, displaying a higher icorr value.
3.6. Electrochemical Impedance Spectroscopy
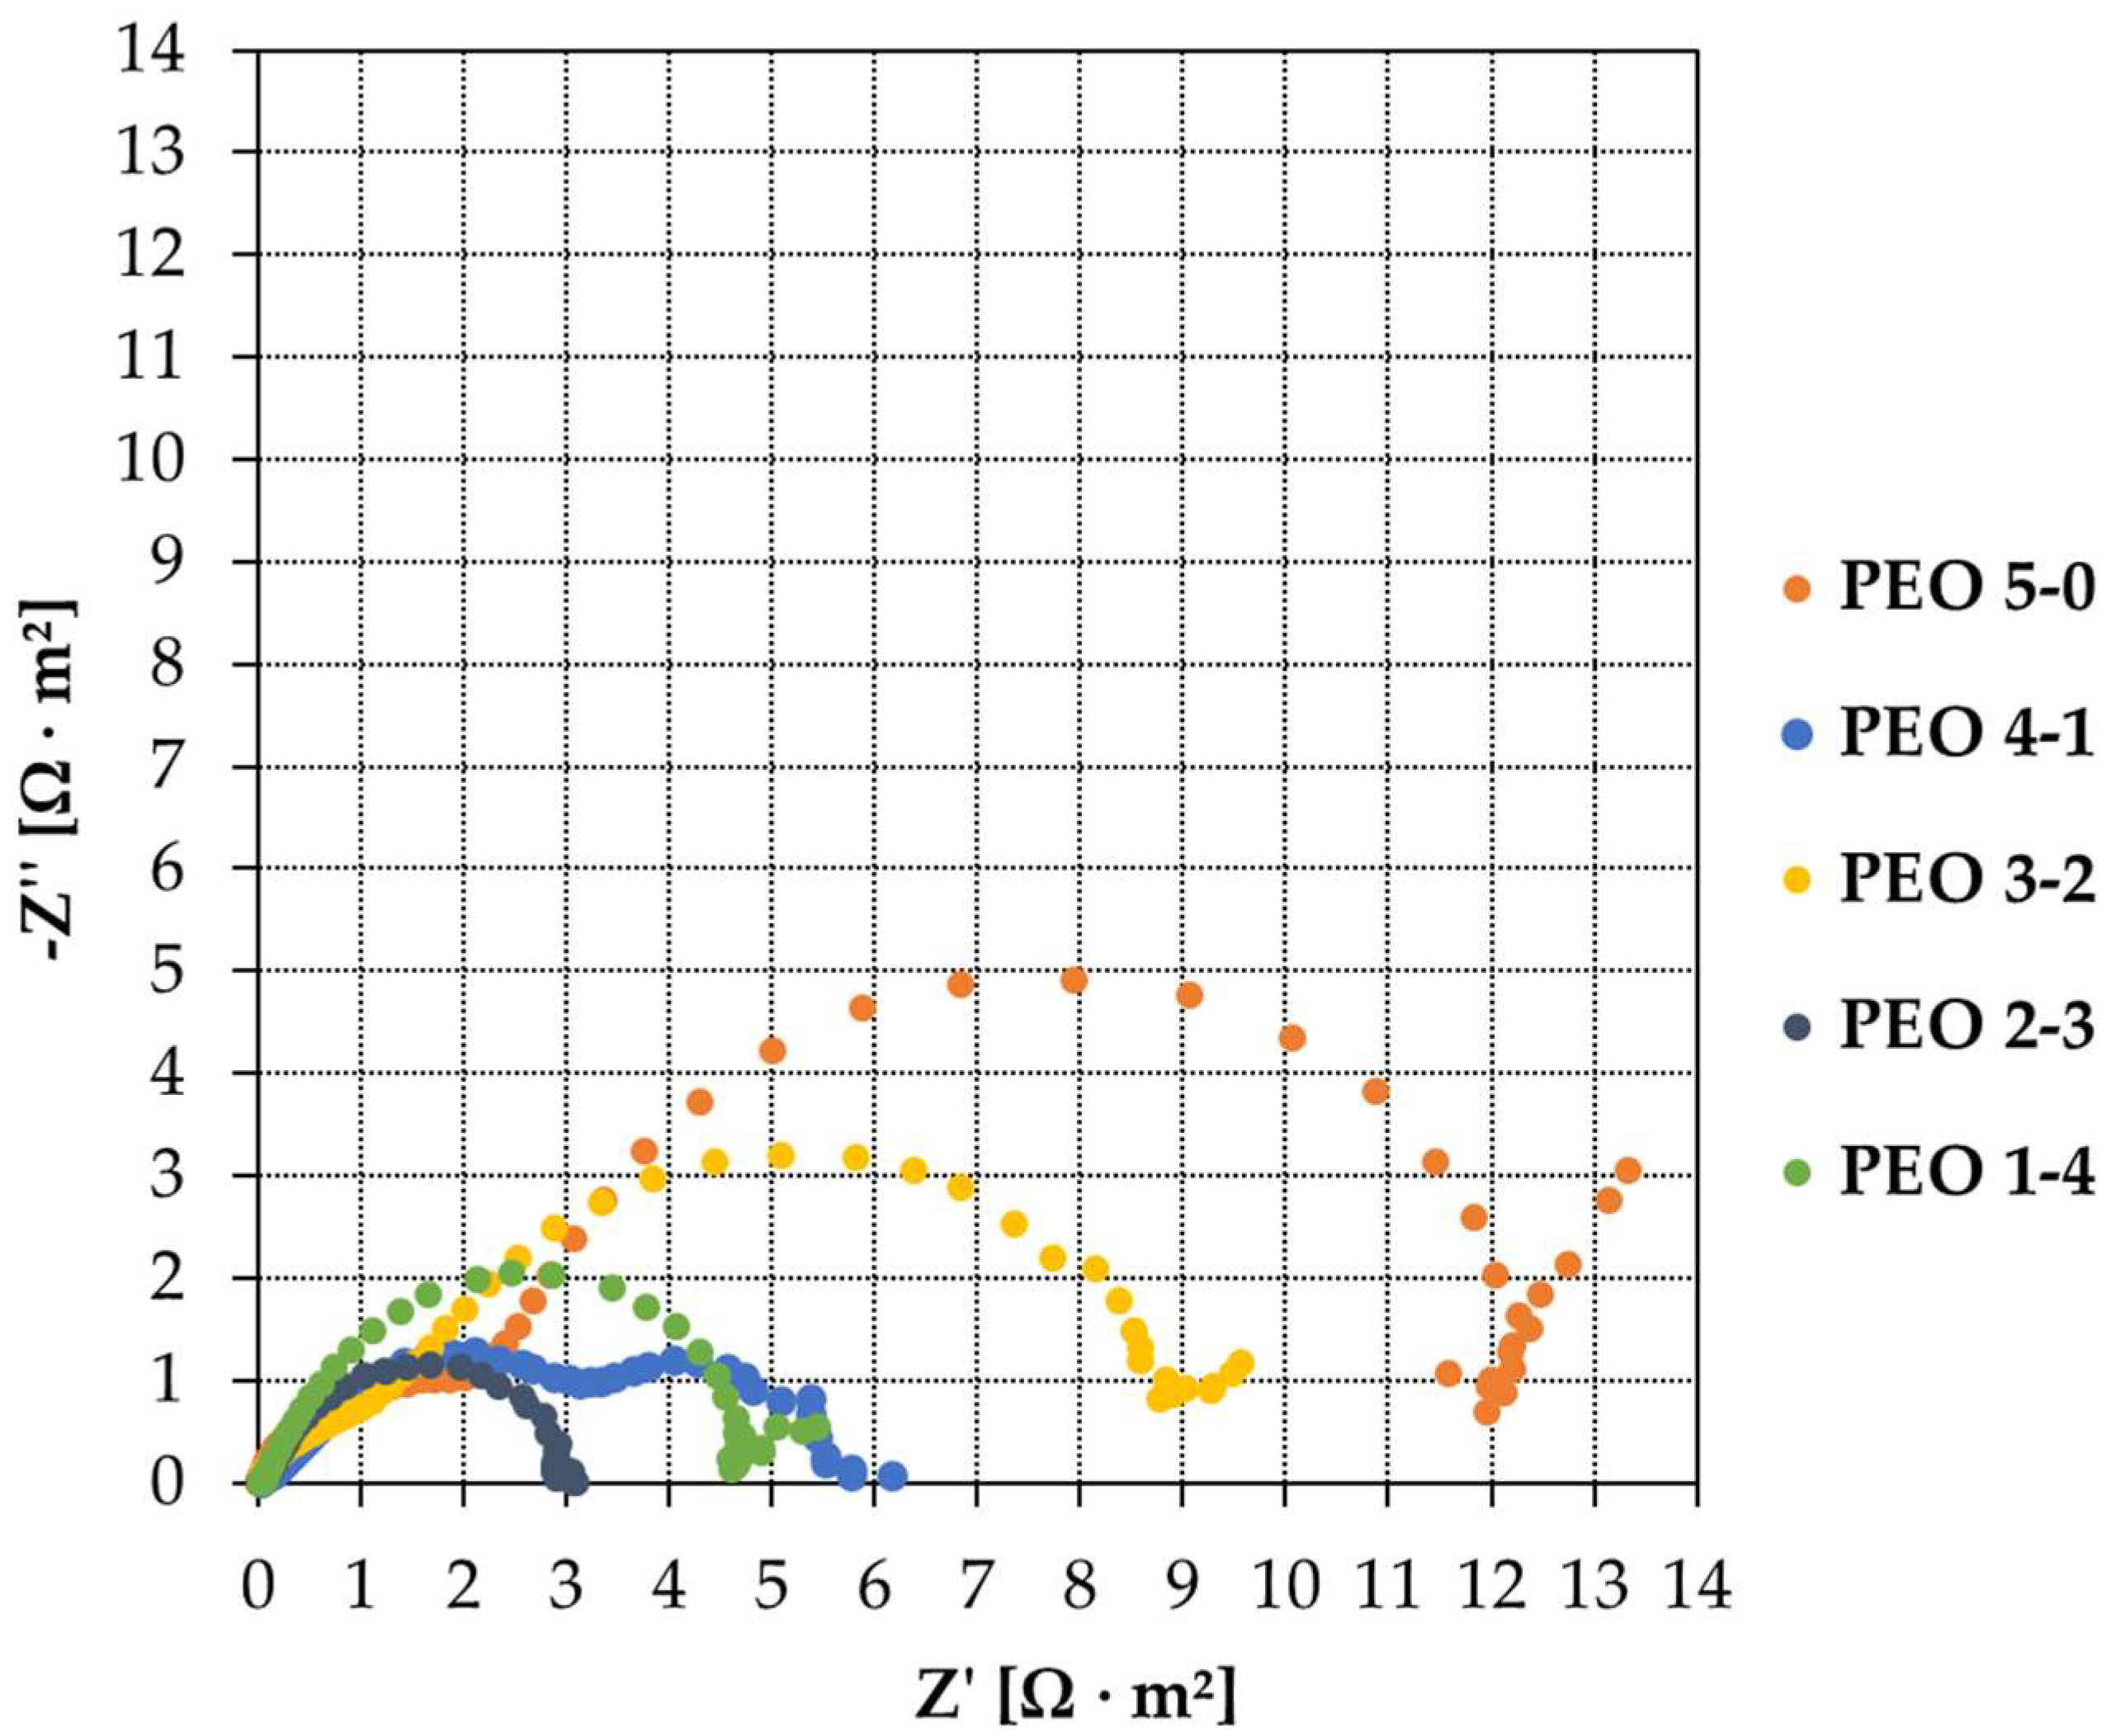
The impedance data are reported through Nyquist plots (
Figure 9). The intersection of the semicircles with the axis of real impedances allows us to obtain graphically the polarization resistance values, R
p. Values are reported in
Table 2: the fit is executed over the entire frequency spectrum. EIS is performed on all samples: PEO 5-0, PEO 4-1, PEO 3-2, PEO 2-3 and PEO 1-4. The tests are repeated three times per sample to verify the reproducibility of the results. All samples are characterized by multiple capacitive loops. More precisely, PEO 1-4 and PEO 2-3 show a principal capacitive semicircle followed by a second one, which is incomplete. PEO 5-0 and PEO 3-2 show an additional loop in the high frequency range with a diameter lower than the principal capacitive loop. Finally, PEO 4-1 shows two capacitive loops, one at high and the second one at low frequencies, having almost the same diameter. Two capacitive loops may reflect the duplex structure of PEO coatings, featured by an inner barrier layer and an outer porous layer. However, the two capacitive loops may also indicate the presence of a third layer in the PEO coating [
21,
27]. If that is the case, the principal capacitive loop would account for the typical duplex structure of PEO coatings, with the inner barrier layer and the outer porous layer, while the second loop would refer to the third layer. This topic will be further deepened in
Section 4, where equivalent electric circuits are displayed.
The highest Rp is associated with PEO 5-0, produced through a complete voltage ramp and no maintenance period. A quite large Rp is detected for PEO 3-2, while lower polarization resistance values are found for the other three specimens. The lowest Rp belongs to PEO 2-3, and similar polarization resistances feature PEO 1-4 and PEO 4-1. Excluding the sample PEO 4-1, behaving differently from all others because of its peculiar Nyquist shape, the Rp value tends to decrease by increasing the maintenance time. By extending the maintenance period up to 3 and 4 min, the polarization resistance seems to be reducing. Conversely, the highest polarization resistances arise from shorter maintenance times: 2 min and 0 min (complete voltage ramp, no maintenance).
3.7. Linear Polarization Resistance (LPR)
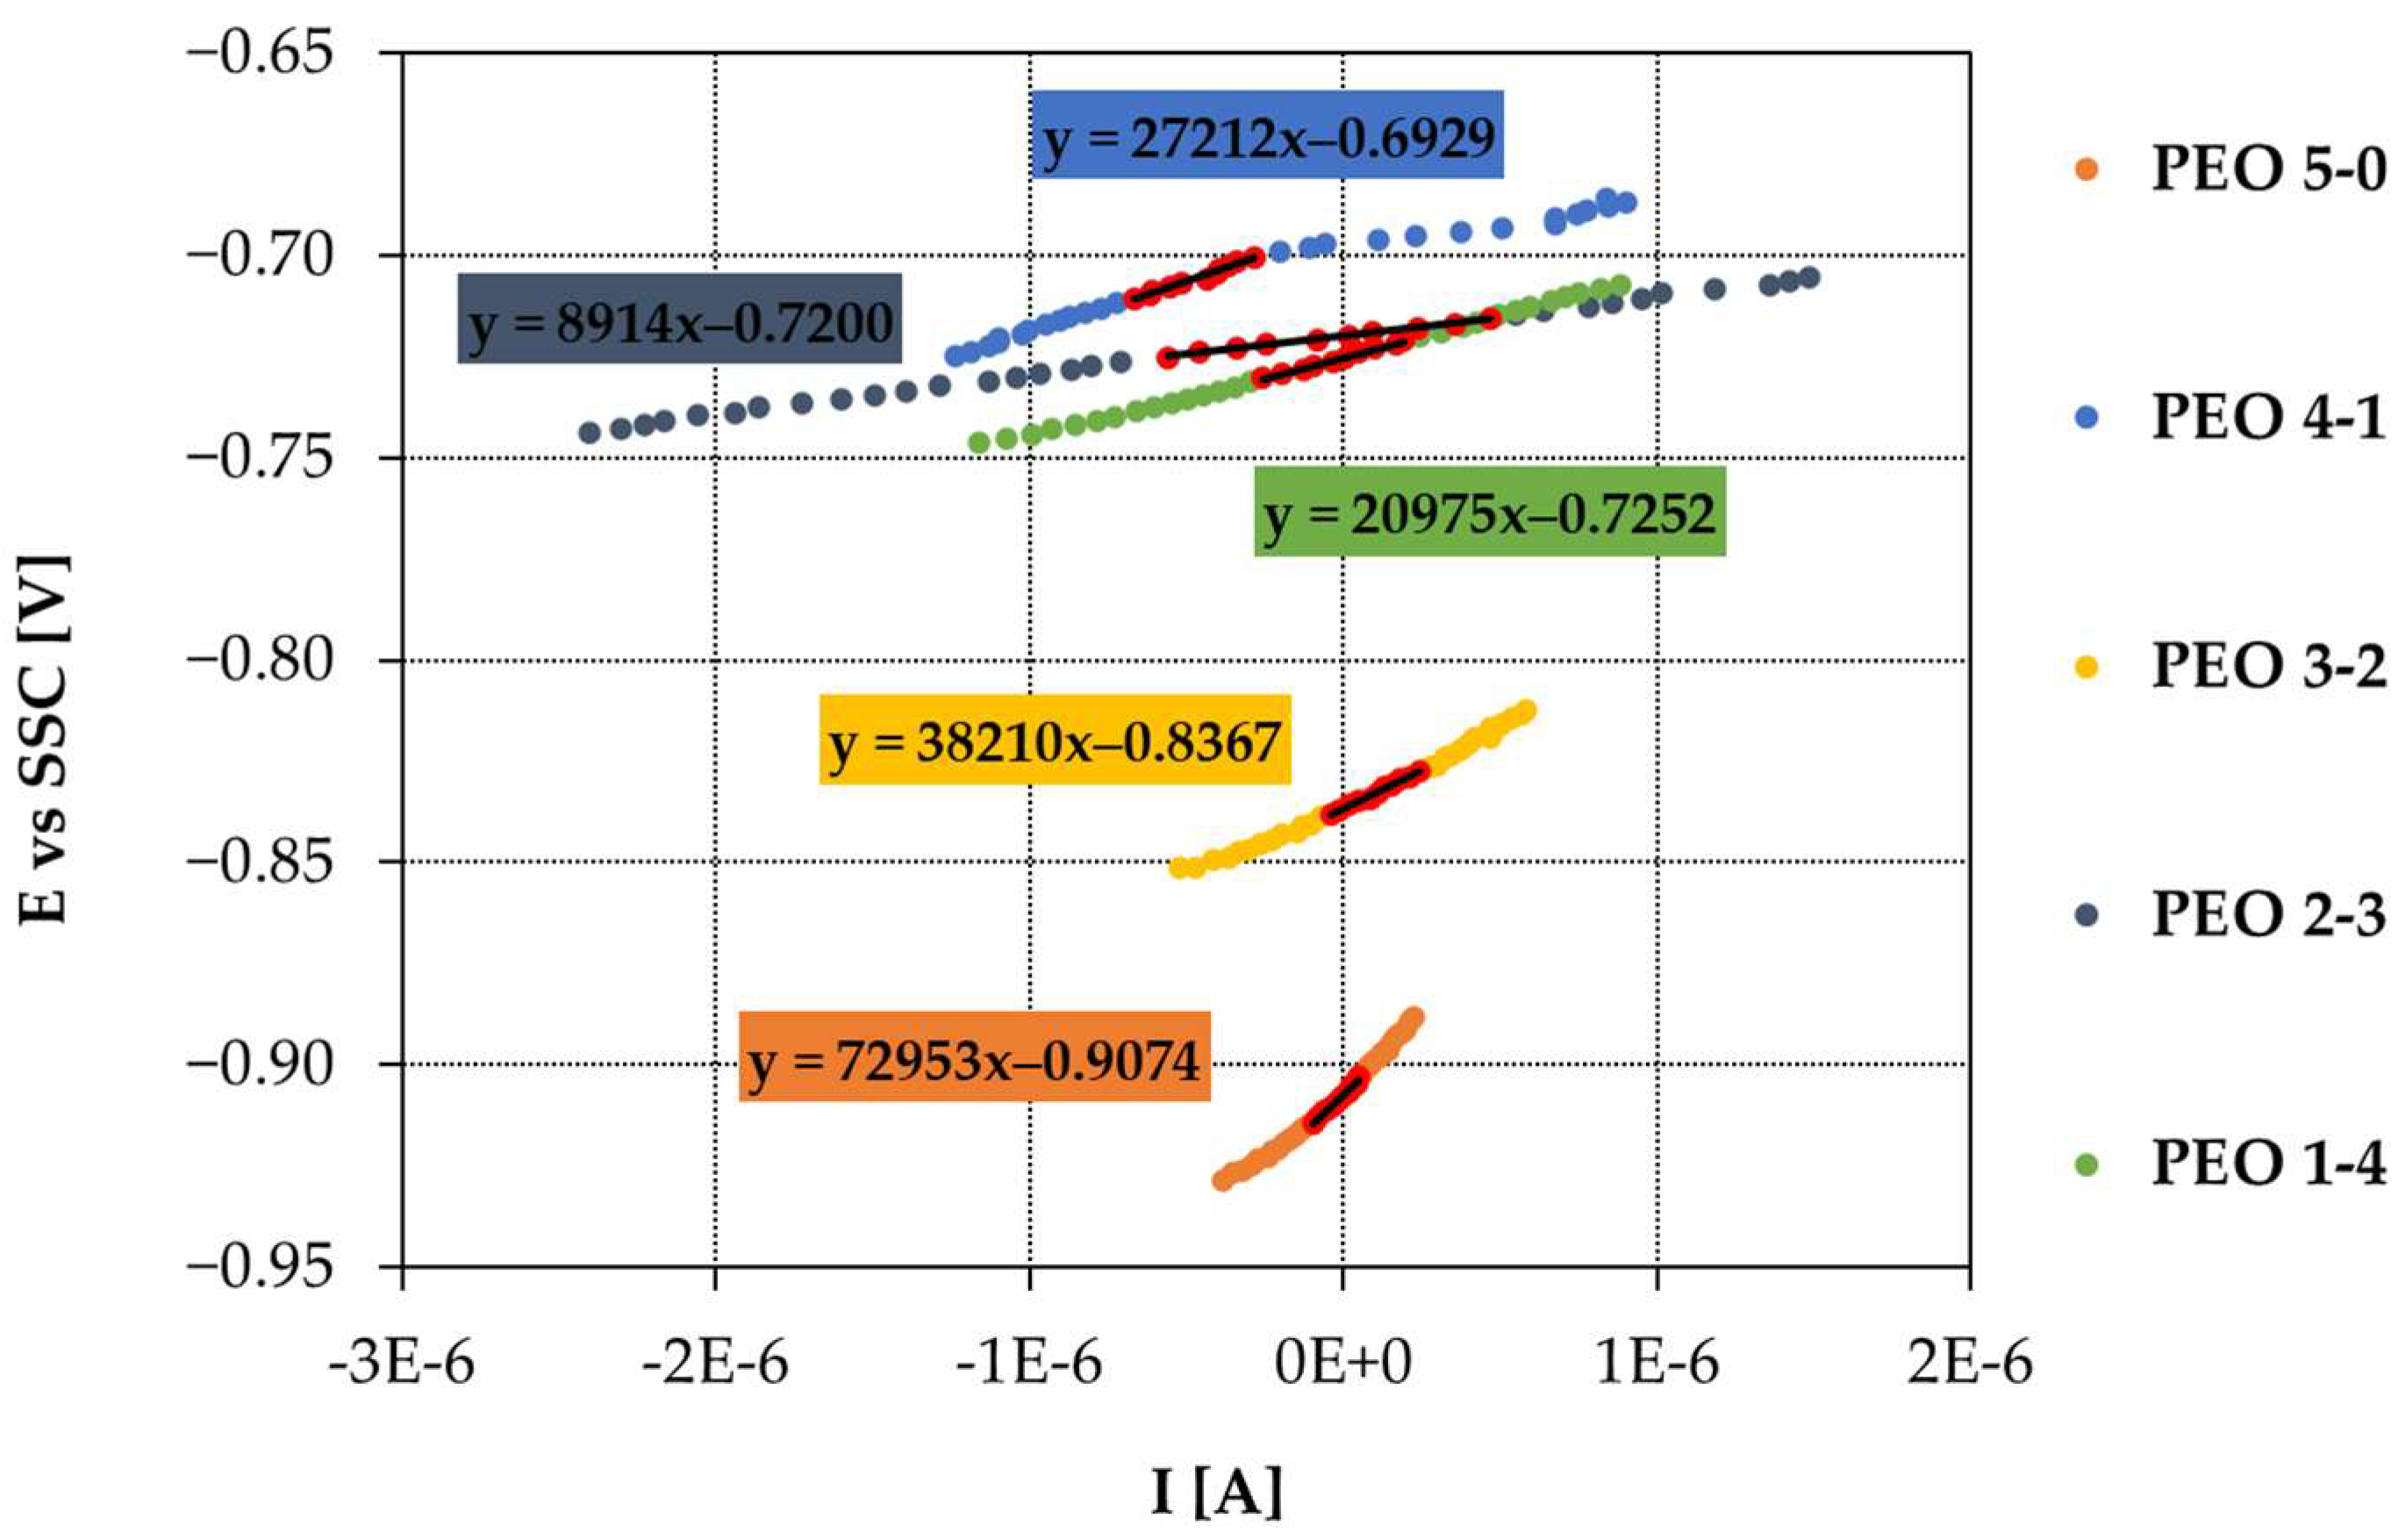
Polarization resistance was also estimated by calculating the slope in the linear graph potential vs. current (
Figure 10). The obtained values are reported in
Table 2 and compared with the ones acquired from Nyquist diagrams. The chosen potential range is ±20 mV around E
corr.
Given polarization resistance and Tafel slopes, the corrosion current is calculated through Stern–Geary equation. Tafel slopes arise from potentiodynamic polarization curves, the polarization resistance from EIS and LPR tests. The Stern–Geary equation is presented (1).
Anodic and cathodic Tafel slopes ba and bc are expressed in mV/decade, the polarization resistance Rp in Ω·m2. The corrosion current icorr can be expressed in mA/m2. Corrosion currents are calculated by using both Rp values, one from Nyquist plots and one from LPR graphs; results do not vary significantly. The average corrosion current icorr is reported in the following table.
LPR tests exhibit similar Rp values compared to Nyquist plots, resulting in a very good consistency between EIS and LPR outcome. LPR findings display larger Rp values with respect to EIS, in four cases out of five. PEO 2-3 is the only sample showing a lower Rp derived from LPR tests than the Rp acquired from Nyquist graphs. Regarding PEO 5-0, the Rp calculated from LPR is much larger than the one obtained from Nyquist plots. Overall, differences do not appear significant, and similar Rp results are found between LPR and EIS; in addition, the same trend is maintained.
Corrosion currents are converted into corrosion rates by using Faraday’s law [
28], and the values are reported in
Table 3. In the presence of any PEO treatment, the corrosion rate is about one order of magnitude less than the values measured on bare aluminum AA 6082, thus confirming the efficiency of the treatment in increasing corrosion resistance.
4. Discussion
4.1. Effect of Electrical Parameters on Process Characteristics
Figure 2 reports the current acquisition during the five different processes, all captured 20 s before the end of the input potential ramp. Since the five ramps applied have different slopes, having the same initial and final voltage, but a progressively shorter duration (from 5 min to 1 min), these curves cannot be compared directly, since they are captured at different applied potentials.
For PEO 5-0, the capture occurs around 330 V
rms, which is almost the final voltage, while potentials are lower for the other processes: 320 V
rms, 311 V
rms, 292 V
rms and 233 V
rms, respectively. This partially justifies the different current values of
Figure 2, and especially the fact that PEO 1-4 and PEO 2-3 present a very low current value at this time interval. Furthermore, this hypothesis can also find confirmation in
Figure 4, giving the surface aspect of samples at the corresponding time frames: for PEO 1-4, after 40 s, it is possible to observe the initiation of sparking, characterized by many small, low-power discharges.
PEO 5-0 and PEO 4-1, although having the highest potential values at the moment of the acquisition, do not display the highest current values. This might occur because both, before the acquisition time, have already undergone a sparking period long enough to create a resistive layer of oxides. Looking at
Figure 4, it might be visible that in both processes, sparking starts at least 120 s before the current acquisition (at 280 s for PEO 5-0 and at 220 s for PEO 4-1). This long sparking time could justify the reduction of the output current observed in
Figure 2. PEO 3-2, instead, shows the largest current value because it is captured in one of the most intense moments of plasma discharges, as also confirmed by
Figure 4 (160 s).
Figure 3, instead, reports the current acquisition during the five different processes, all captured 20 s before the end of the process. Unlike
Figure 2, all five PEO processes share the same potential of 350 V
rms, except for PEO 5-0, which has a potential around 330 V
rms. In this case, it can be observed that the measured current value becomes lower with increasing maintenance times. This may be justified by the fact that the PEO coating grows during sparking, making its breakdown more difficult at the fixed potential. Consequently, the number of discharge sites decreases, being concentrated only at the oxide defects, and the measured current value decreases. Furthermore, a significant current difference is observed during maintenance periods from 0 s to 120 s, while beyond 120 s, all processes share almost the same current within this time frame. This is also confirmed by thickness data of
Figure 5: the largest thickness differences are observed by passing from PEO 5-0 to PEO 4-1, while the last three processes are almost aligned at the same thickness.
Despite the current decrease during maintenance times, it must be observed that this does not correspond to a discharge intensity decrease but it is more likely to be due to a great discharge number reduction. Indeed, by comparing frames obtained in the five processes (
Figure 4), it can be observed that where a maintenance period is present, the last image, captured at the same time as the current measurement of
Figure 3, displays a limited number of extended discharges compared to the ones of early sparking. These localized discharge events are promoted by the growth of the oxide coating, reaching a thickness at which the breakdown is possible only in coating defects. This mechanism seems to be more violent with respect to plasma discharges typical of earlier PEO stages, leading to a larger heat dissipation, an abundant generation of gas bubbles and, eventually, coloring the electrolytic solution around the surface.
The longer is the maintenance period, the faster the oxide growth and, thus, the earlier the onset of these localized phenomena: this becomes evident by comparing the captures of processes PEO 5-0 and PEO 1-4 (
Figure 4).
4.2. Effect of Process Characteristics on Coating Microstructure
Energetic discharge events produce a more disordered oxide, with an increased surface roughness and a larger diameter of the pores, as visible in the SEM micrographs (
Figure 7). The formation of larger pores with longer maintenance periods is also confirmed by the limit current density values in the potentiodynamic polarization tests of
Figure 8. Analyzing in more detail the morphology of PEO coatings (
Figure 7), the presence of both large pores and fine porosity on the surface of all PEO coatings is highlighted. This perfectly agrees with the generation of small sparks during the first phases of PEO process (
Figure 4), responsible for small pores, followed by larger and more energetic discharges, leading, as already explained, to the formation of the larger defects. The latter type of sparks appears earlier and lasts for a longer time, the longer the maintenance phase, since during this period the highest potential is applied, favoring the plasma events. A second consequence of this is the different average dimension of pores that increases for longer maintenance times; indeed, the maximum pore diameter (6.1 ± 2.26 μm) is found for samples produced after 4 min of constant voltage. Porosity may also be generated by the release of gas bubbles from the molten material; indeed, a copious gas evolution is observed during all PEO processes.
Further noted morphological features are volcano-like structures. Their formation is due to the ejection of molten material from discharge channels. The material rapidly solidifies, producing boundaries around the channels. A pore is generally observed at the center of such structures, unless the defect has been filled by new molten material coming from other discharges [
3,
18].
Considering the combination of SEM and EDS analyses, it is possible to note the presence of other peculiar features. Indeed, the EDS maps (
Figure A3) show that Si is more concentrated in some spots (especially for samples PEO 2-3, PEO 3-2 and PEO 4-1); in correspondence with such spots, globular structures are generally observed. Their formation is due to the copious gas bubbles production during PEO process, entrapped within the molten oxide and leading to globules generation. This mechanism is typically promoted by the presence of highly viscous oxide as SiO
2. This agrees with XRD (
Figure 6) results, according to which the most numerous SiO
2 signals were found for maintenance periods of 2, 3 and 4 min.
One main outcome of XRD analysis is exactly the larger content of Si-containing compounds in the three samples produced using longer maintenance times. This trend depends on the incorporation of silicate anions occurring through discharge channels under the action of the applied electric field. During treatments with longer maintenance phases, the applied potential is kept at its maximum effective values for longer times, and larger and long-lived sparks are generated. Thus, SiO32− could be easily withdrawn through the discharge channels.
4.3. Effect of Microstructure and Process Parameters on Corrosion Behavior
Potentiodynamic polarization tests show, in general, a decrease in coating protectiveness with increasing maintenance times. This is in good agreement with SEM-EDS results discussed above: indeed, if longer maintenance times at higher anodizing potentials favor the appearance of larger pores, the resulting coating will be less protective.
Furthermore, it might be stated that the increase in coating defectiveness dominates the beneficial effect of the oxide thickness growth reported in
Section 3.2. Indeed, a thicker coating would be expected to provide greater protection, but the potentiodynamic polarization results highlight an opposite trend.
A connection between the coating porosity and the limit current density of oxygen reduction may also be found. It is well known that this last parameter is controlled by the diffusion of molecular oxygen, dissolved in the electrolyte, toward the metallic surface where the cathodic reaction takes place. Thus, oxygen molecules are forced to pass through the coating pores and their arrival onto the metallic surface will be slower if the pores are narrow and the coating is thick. From
Figure 8, it can be noted that the limit current density value grows with the maintenance period: this finds agreement with the enlargement of pores diameter observed for longer maintenance times in
Section 3.4.
Considering the polarization resistance outcome acquired from EIS tests (Nyquist plots), the sample produced after a complete voltage ramp shows the largest Rp and the highest corrosion resistance compared to all others. A similar result is obtained for a maintenance time of 3 min, featured by a slightly lower Rp and a comparable corrosion response. On the contrary, the lowest Rp values regard samples with maintenance times of 2 and 4 min, more prone to corrosion. Intermediate behavior is found for a maintenance period of 1 min.
It can be noted that PEO 4-1 has a particular behavior compared to all the other samples; indeed, its Nyquist curve is the only one showing two evident capacitive loops. This could be better appreciated considering the equivalent electric circuits modeling the PEO coatings (
Figure 11); the relative data are listed in
Table 4.
All PEO coatings are described by a circuit containing three R-CPE parallels, two with a cascade configuration and the third one in the series. These R-CPE elements probably correspond to the response on the internal barrier layer and the external porous layer typical of PEO coatings, with the response of the electrochemical double layer (EDL). It could be observed that R4, associated with the inner layer, progressively decreases with longer maintenance times (apart from the case of PEO 4-1, which, as already mentioned, shows a better corrosion response than PEO 2-3). This shows that longer maintenance times during PEO coating lead to the development of larger and more concentrated discharges, as also highlighted by the current acquisitions during the process, which favor the creation of a disordered oxide, richer in defects, rather than a compact layer. Smaller and more distributed discharges, instead, typical of the PEO 5-0 process, help in forming a less defective coating, able to provide a higher degree of protection from corrosion. This has also been evidenced by SEM micrographs.
Concerning PEO 4-1, an additional R-CPE element is observed instead. This may be due to the presence of an additional layer [
21,
27] in the coating structure, showing a resistance comparable to that of the other two layers.
EIS results are coherent with PDP graphs, whose related corrosion currents exhibit the same trend and similar values. LPR experiments show comparable Rp values with respect to Nyquist plots, leading to a good consistency between EIS and LPR results. In addition, LPR tests have produced slightly larger Rp values compared to EIS, as observed in four cases out of five. However, the same tendency is maintained, and differences appear quite limited. Starting from EIS and LPR plots, corrosion currents have been calculated through the Stern–Geary equation by exploiting linear polarization resistance. Corrosion currents are all in the range of 1.0–2.5 mA/m2 according to Stern–Geary, rather close to PDP findings.
The three main electrochemical tools for corrosion study (EIS, LPR and PDP) can be seen as complementary; thus, they are all useful for comparison with the aim of verifying the consistency of results. LPR is a fast and simple technique with low perturbation, but it may be less effective with passive layers and not ideal for localized corrosion or pitting, as in the case of aluminum. EIS is more suitable for barrier layers like PEO coatings, and it is highly sensitive; nonetheless, the interpretation of data is complex and not always intuitive. PDP offers more complete information about the detailed corrosion mechanism; however, it is destructive, dependent on the scan rate and may alter passivity and surface chemistry. Overall, EIS and PDP are both suitable for oxide coatings. EIS results might be more reliable because this kind of test is sensitive to porosities and multilayer (duplex) coatings, and it is able to detect barrier properties against chlorides.


