Article

Effect of Fe2O3@SiO2 Core–Shell Nanoparticle Doping Ratio on Color Appearance of Synthetic Opal Films Inspired by Natural Fire Opal

by
Bowen Li
1,2 and
Andy Hsitien Shen
1,2,*
1
Gemmological Institute, China University of Geosciences, Wuhan 430074, China
2
Hubei Gems and Jewelry Engineering Technology Research Center, Wuhan 430074, China
*
Author to whom correspondence should be addressed.
Coatings 2025, 15(6), 646; https://doi.org/10.3390/coatings15060646
Submission received: 22 April 2025 / Revised: 23 May 2025 / Accepted: 25 May 2025 / Published: 27 May 2025
(This article belongs to the Special Issue Modification and Technology of Nanoparticles and Thin Films)

Abstract

:
Synthetic opal-based photonic materials with tunable optical properties not only exhibit significant application potential but also provide valuable models in terms of understanding color formation mechanisms in natural gemstones. Inspired by natural fire opals containing small amounts of Fe2O3 nanoparticle inclusions (0 wt%~0.23 wt%), we fabricated short-range ordered opal films doped with low concentrations (0 wt%~2.00 wt%) of Fe2O3@SiO2 core–shell nanoparticles using a modified vertical deposition method. The Fe2O3@SiO2 nanoparticles were synthesized via a sol–gel process to encapsulate the Fe2O3 core with a 10-nm-thick SiO2 shell, preventing agglomeration and enhancing the chemical stability. Experimental results show that even small amounts of doping significantly affect the reflection peak intensity of the films, leading to notable color appearance changes. Combined with numerical simulations, we attribute this modulation to both light absorption and backward scattering effects introduced by the doped nanoparticles. Moreover, the numerical simulation results for Fe2O3 nanoparticles and Fe2O3@SiO2 nanoparticles (with a 10 nm silica shell and similar particle size) show comparable optical properties, suggesting that such inclusions may contribute similarly to the color formation mechanisms in natural fire opals. This work demonstrates that low-concentration Fe2O3@SiO2 NP doping provides an effective strategy to tune the color appearance of opal films, with implications for both structural color material development and gemological research.

1. Introduction

Structural color materials based on opal structures have attracted significant research interest due to their tunable optical properties and broad application potential [1]. These synthetic opal-based materials are currently utilized in ceramic glazes [2,3], wood coatings [4,5], 3D printing [6,7], sensors [8,9], and anti-counterfeiting technologies [10,11]. As research progresses, attention has shifted beyond perfectly periodic structures to amorphous photonic structures with short-range order, valued for their low angular dependence in structural coloration [12,13]. While non-iridescent structural colors offer desirable angle independence, they typically suffer from low saturation and brightness due to incoherent scattering [14]. Incorporating nanoparticle pigments into these assembled structures is an effective approach to address the low saturation and brightness issues inherent in non-iridescent structural color materials [15]. Current research primarily focuses on black pigments (carbon black, iron oxide, melanin, and polydopamine), which absorb scattered light across the visible spectrum, enhancing the color purity and visibility [16,17,18,19]. Beyond the use of black pigments, an alternative doping strategy involves the incorporation of colored nanoparticle pigments [12,20,21]. Unlike black additives that uniformly absorb across the visible spectrum, colored nanoparticle pigments exhibit dual functionality: within their absorption ranges, they act like black additives by suppressing incoherent scattering to enhance structural color saturation, while, in non-absorption wavelengths, they contribute their inherent hues, creating a synergistic effect between structural and chemical coloration [22]. However, this saturation enhancement is not without limitations. Previous studies have shown that pigment doping must be carefully optimized to avoid excessive absorption, which compromises the structural brightness. For example, Lee et al. demonstrated that, while low concentrations of graphene oxide effectively enhanced the color purity, higher loadings led to diminished reflectance and broadened spectral features due to scattering disruption and over-absorption [23]. Similarly, Sai et al. reported that increasing the pigment content in multilayered Bragg reflectors improved the reflectance only up to a threshold (~40 wt%), beyond which the enhancement plateaued or even reversed due to the reduced absorption length and interference breakdown [13]. These findings indicate that structural color saturation can be effectively tuned via the pigment concentration, but within a defined range, limited by optical and material constraints. Despite these constraints, when properly optimized, such pigment-doped structural color systems can achieve optical effects that are difficult to achieve through a single mechanism alone. Such material systems not only exhibit tunable optical properties and broad application potential but are also particularly relevant to gemological research, serving as experimental models enabling an understanding of the color formation mechanisms in natural precious opals.
Precious fire opal, a highly valued gemstone with significant commercial importance, is a typical natural material that exhibits the combined effects of structural coloration and nanoparticle-induced coloration, providing an example for the study of this hybrid color generation mechanism. Fire opal is a distinctive variety of gem-quality opal characterized by its red–orange–yellow intrinsic color (body color). The most valuable subtype of fire opals, known as precious fire opal, exhibits a combination of body color and structural color (play of color). This feature results in distinctive esthetic value and sets it apart from other opals [24]. Previous studies have identified the presence of Fe2O3 nanoparticle inclusions in the fire opal structure [25]. These inclusions are suggested to play an important role in influencing the body colors of fire opals, with the iron content in natural fire opals reported to range from 2 ppm to 1648 ppm, corresponding to approximately 0 wt% to 0.23 wt% Fe2O3 [26,27]. However, the effect of Fe2O3 nanoparticles (Fe2O3 NPs) on the final color appearance of fire opals in the presence of structural color remains to be further explored. Studies on other material systems have demonstrated that nanoparticles can affect both the structural color and the overall color appearance of materials [28,29]. Previous work has investigated opal films fully infiltrated with Fe2O3 NPs in all porous spaces, achieving high filling fractions and significant shifts in reflection peak positions [30]. However, how variations in the concentration of small amounts of Fe2O3 NPs, as observed in natural fire opals, influence the resulting color expression remains to be further investigated. Addressing this question would not only deepen our understanding of the color formation mechanisms in natural fire opals but also provide valuable insights for the design of structural color materials that reflect the unique esthetic characteristics of fire opal. A promising approach to investigate this effect is to synthesize a series of opal-like materials with varying Fe2O3 NP doping ratios.
For the synthesis of opals, self-assembly is one of the most recognized methods developed by researchers [31]. The self-assembly process refers to the behavior of nanoparticles achieving an equilibrium-ordered structure governed by the principles of statistical physics, through driving forces such as van der Waals interactions, capillary forces, electrostatic forces, and gravity [32,33,34]. Depending on the dominant driving force in the assembly process, methods for the synthesis of opals can be classified into sedimentation, electrodeposition, horizontal deposition, vertical deposition, physical confinement, and sonication-assisted drying [35]. Among the various self-assembly methods, the vertical deposition method is the most suitable for investigating the factors influencing the color changes of opals under controlled variable conditions, as it can generate highly ordered structures or amorphous photonic structures, with precise control over the thickness (number of deposition layers) [36]. In the vertical deposition method, where a hydrophilic substrate is vertically dipped into a colloidal suspension, a meniscus forms near the contact interface, where a solvent evaporation-induced convective fluid flow draws closely packed microspheres into its top region, resulting in a thin film of ordered stacked spheres [37]. This method not only offers a simple and environmentally friendly preparation process but also allows precise control over the coverage rate and particle ordering of films in a single deposition by adjusting parameters such as the angle of inclination, pressure, temperature, suspension concentration, and solvent volatility [36,38].
Fe2O3 NPs have long been recognized as effective inorganic pigments, and their use dates back centuries [39,40]. However, introducing Fe2O3 NPs into synthetic opal systems would face several challenges. Firstly, Fe2O3 NPs exhibit significant agglomeration tendencies in dispersion systems, which would affect their uniform dispersion during the fabrication process [41,42]. In addition, under high-temperature reduction conditions, Fe2O3 NPs transform into Fe3O4, causing undesirable dark red chromatic shifts [43]. Furthermore, due to the voids within the opal structure, Fe2O3 NPs are prone to reaction and color fading under chemical pollution effects. To address these limitations, surface modification through SiO2 shell encapsulation is effective in preventing particle aggregation, optimizing the interparticle spacing in the assembled structures, enhancing the chemical stability of the Fe2O3 core, and maintaining chromatic integrity in synthetic fire opal systems [40,44]. Therefore, Fe2O3 core–SiO2 shell structure nanoparticles (Fe2O3@SiO2 NPs) are highly suitable as doping pigments for the synthesis of fire opals.
In this study, inspired by Fe2O3 NP inclusions in natural fire opals, we synthesized and investigated the influence of the Fe2O3@SiO2 NP doping ratio (0 wt%~2.00 wt%) on the color appearance of short-range ordered opal films. Unlike previous research that focused on the reflection properties of synthetic opals with Fe2O3 NPs completely infiltrated throughout all porous spaces, our work examined the color effects under low doping ratios with varying concentrations. Monodisperse SiO2 nanoparticles (SiO2 NPs) and Fe2O3@SiO2 NPs with uniform dimensions were synthesized via a sol–gel method based on silane hydrolysis [45]. Using a modified vertical deposition self-assembly technique, short-range ordered opal films were fabricated under controlled conditions. We studied the correlations and underlying mechanisms between the doping ratios and color appearance by integrating experimental characterization, theoretical calculations, and numerical simulations. The theoretical calculations established the correlation between the reflection peak positions and close-packed crystal planes. The numerical simulations determined the optical properties of the Fe2O3 NPs and Fe2O3@SiO2 NPs and the multiple scattering characteristics of the SiO2 NPs. Our findings reveal that both the absorption and backscattering capabilities of Fe2O3@SiO2 NPs affect the opal film’s color performance. In addition, the numerical simulation results indicate that a 10-nm-thick SiO2 shell coating slightly enhances the light-modulating properties of Fe2O3 NPs while preserving their intrinsic optical characteristics [12], allowing the doping effects of Fe2O3@SiO2 NPs to approximate those of Fe2O3 NPs. This work not only provides insights into the design of nanoparticle-doped structural color materials with natural opal-like optical properties but also contributes to the theoretical understanding of the optical mechanisms in natural fire opals through controlled synthesis approaches.

2. Materials and Methods

2.1. Materials

All chemicals for our synthesis experiments were analytical-grade reagents and used as received, without further purification. Tetraethyl orthosilicate (TEOS) was purchased from Anhui Senrise Technology Co., Ltd. (Anqing, China). Ammonia hydroxide (NH4OH, 35%), ethyl alcohol (EtOH, 99%), and polyvinylpyrrolidone (PVP) were purchased from Xilong Scientific Co., Ltd. (Chengdu, China). Fe2O3 NPs were purchased from Shanghai Macklin Biochemical Co., Ltd. (Shanghai, China). Hydrophilic glass slides were purchased from Haimen Changlong Instrument Co., Ltd. (Nantong, China).

2.2. Synthesis Process of Samples

2.2.1. Synthesis of Fe2O3@SiO2 NPs

The core–shell structure Fe2O3@SiO2 NPs were obtained by coating the SiO2 shell on surface-modified Fe2O3 NPs based on the sol–gel method, referring to previous studies [40,43]. Firstly, Fe2O3 NPs were functionalized with PVP and stirred for 12 h at 25 °C in water before being collected (Figure 1a—①, ②). Then, 2.5 mL of NH4OH was added to the EtOH dispersion of PVP-modified Fe2O3 NPs (100 mL). Subsequently, TEOS (2.5 mL) was injected into the mixture at a rate of 25 µL/min (Figure 1a—③). The reaction mixture was stirred for 3 h at 25 °C. Fe2O3@SiO2 NPs were then collected by a centrifuge at 6000 rpm for 1 h, washed repeatedly with EtOH, and redispersed in EtOH.

2.2.2. Synthesis of SiO2 NPs

SiO2 NPs were also synthesized based on a sol–gel method [46]. For this experiment, we kept the volume ratio of NH4OH, TEOS, and water at 8:6:3, while the size of the SiO2 NPs was controlled by the volume of EtOH (Figure 1a—④). Firstly, anhydrous ethanol, aqueous ammonia, and DI water were mixed with vigorous stirring in a flat-bottomed flask at 60 °C in a water bath. TEOS was then added to the solution under continuous stirring for 3 h, with the volume of TEOS to EtOH at a ratio of 1:12 (i.e., VTEOS:VEtOH = 1:12). The SiO2 NPs were then collected through centrifugation and rinsed with anhydrous ethanol. Finally, the resulting products were dispersed in EtOH at 5.00 wt% and prepared for the fabrication of opal films.

2.2.3. Fabrication of Opal Films

Opal films with or without Fe2O3@SiO2 NPs were fabricated using a modified vertical deposition method, following previous studies [35,37]. Compared with other commonly used self-assembly techniques for the fabrication of long-range ordered structures and amorphous photonic structures—such as drop casting [47], spray coating [48], electrophoretic deposition [49], spin coating [50], and microfluidic fabrication [51]—vertical deposition offers several key advantages. These include a controllable film thickness, high reproducibility due to a steady solvent evaporation rate, and good compatibility with a wide range of nanoparticle systems. These features make it especially advantageous for experiments requiring systematic control of the doping variables while maintaining consistent structural parameters. A suspension with different weight percentages of SiO2 NPs and Fe2O3@SiO2 NPs was introduced into a glass container equipped with a conduit at the bottom, which was linked to a peristaltic pump through rubber tubing to control the dropping velocity of the liquid surface (Figure 1b—⑤). The flow rate of the pump was set to 3.5 mL/min, resulting in a liquid drawing rate of 16 μm/s on the glass slide substrate. The bottom of the container was heated by a heating platform, maintaining a constant temperature of 50 °C. A clean glass microslide was used as a deposit substrate. The glass substrates were immersed over inclined surfaces at a 75° angle in the colloidal suspension using an adjustable fixture (Figure 1b—⑥). These assembly parameters (75° angle and 50 °C temperature) were selected based on the ranges explored in previous studies [36] and experimentally validated to achieve an optimal balance between film coverage and flatness, ensuring high-quality opal films for our investigation. The opal film thickness was controlled by performing 5 deposition cycles in this experiment. After the deposition, the samples were dried at 80 °C in an oven for 12 h. This moderate-temperature treatment ensured complete solvent removal and improved both the substrate–film attachment and mechanical stability through enhanced van der Waals interactions between nanoparticles, while avoiding higher-temperature structural modifications that could alter the original colloidal arrangement and optical properties under investigation.

2.3. Characterization Method

The morphologies of the SiO2 NPs and Fe2O3@SiO2 NPs were characterized by scanning electron microscopy (SEM, ZEISS GeminiSEM 300, Zeiss GmbH, Oberkochen, Germany). The size distribution of the nanoparticles was measured and analyzed using the ImageJ software (version 1.54f). The core–shell structure of the Fe2O3@SiO2 NPs was confirmed by high-resolution transmission electron microscopy (TEM, FEI Talos F200S, Thermo Fisher Scientific, Hillsboro, OR, USA), which was integrated with energy-dispersive X-ray spectroscopy (EDS). The samples for TEM analysis were prepared by drop-casting a dilute solution of the Fe2O3@SiO2 NPs onto ultrathin, C-coated copper grids. The crystal structure of the nanoparticles was analyzed using X-ray diffraction (XRD, Rigaku SmartLab SE, Tokyo, Japan) with a Cu target at a generator voltage of 40 kV, a generator current of 30 mA, and a scanning rate of 0.1 °/min. The surface composition of the Fe2O3@SiO2 NPs was characterized by X-ray photoelectron spectroscopy (XPS, Thermo Scientific K-Alpha, Waltham, MA, USA). The reflectance spectra were measured by ultraviolet–visible spectroscopy (UV–Vis, Skyray Gem UV-100, Skyray Instrument Co., Ltd., Kunshan, China) from 300 to 800 nm. The incident light was perpendicular to the opal film surface, and the diameter of the light spot was 5 mm.

2.4. Numerical Simulation

In this work, the optical properties of a single Fe2O3 nanoparticle and a single Fe2O3@SiO2 nanoparticle were numerically simulated using PyMieLab v1.0 (https://gitlab.com/Climb12/pymielab, accessed on 24 March 2025), an open-source software program based on Mie theory, used for the calculation of the light scattering and absorption of spherical particles [52]. This software provides a comprehensive database of particle refractive indices and a reliable platform for optical property calculations, enabling accurate simulations of light–matter interactions in single-nanoparticle systems. The refractive indices of the SiO2 NPs and Fe2O3 NPs used in the simulation were obtained from Gao et al. [53] and Querry [54], respectively. Additionally, the multiple scattering of SiO2 NPs was simulated using the polydisperse distributions mode of the open-source software Mie Simulator GUI v1.3 (https://github.com/VirtualPhotonics/MieSimulatorGUI, accessed on 24 November 2024), another open-source tool based on the Lorentz–Mie solution with the BHMIE code. The simulation was performed for 100 spherical SiO2 NPs with a packing fraction of 74%, which represents the typical face-centered cubic (FCC) packing structure of opal films.

3. Results and Discussion

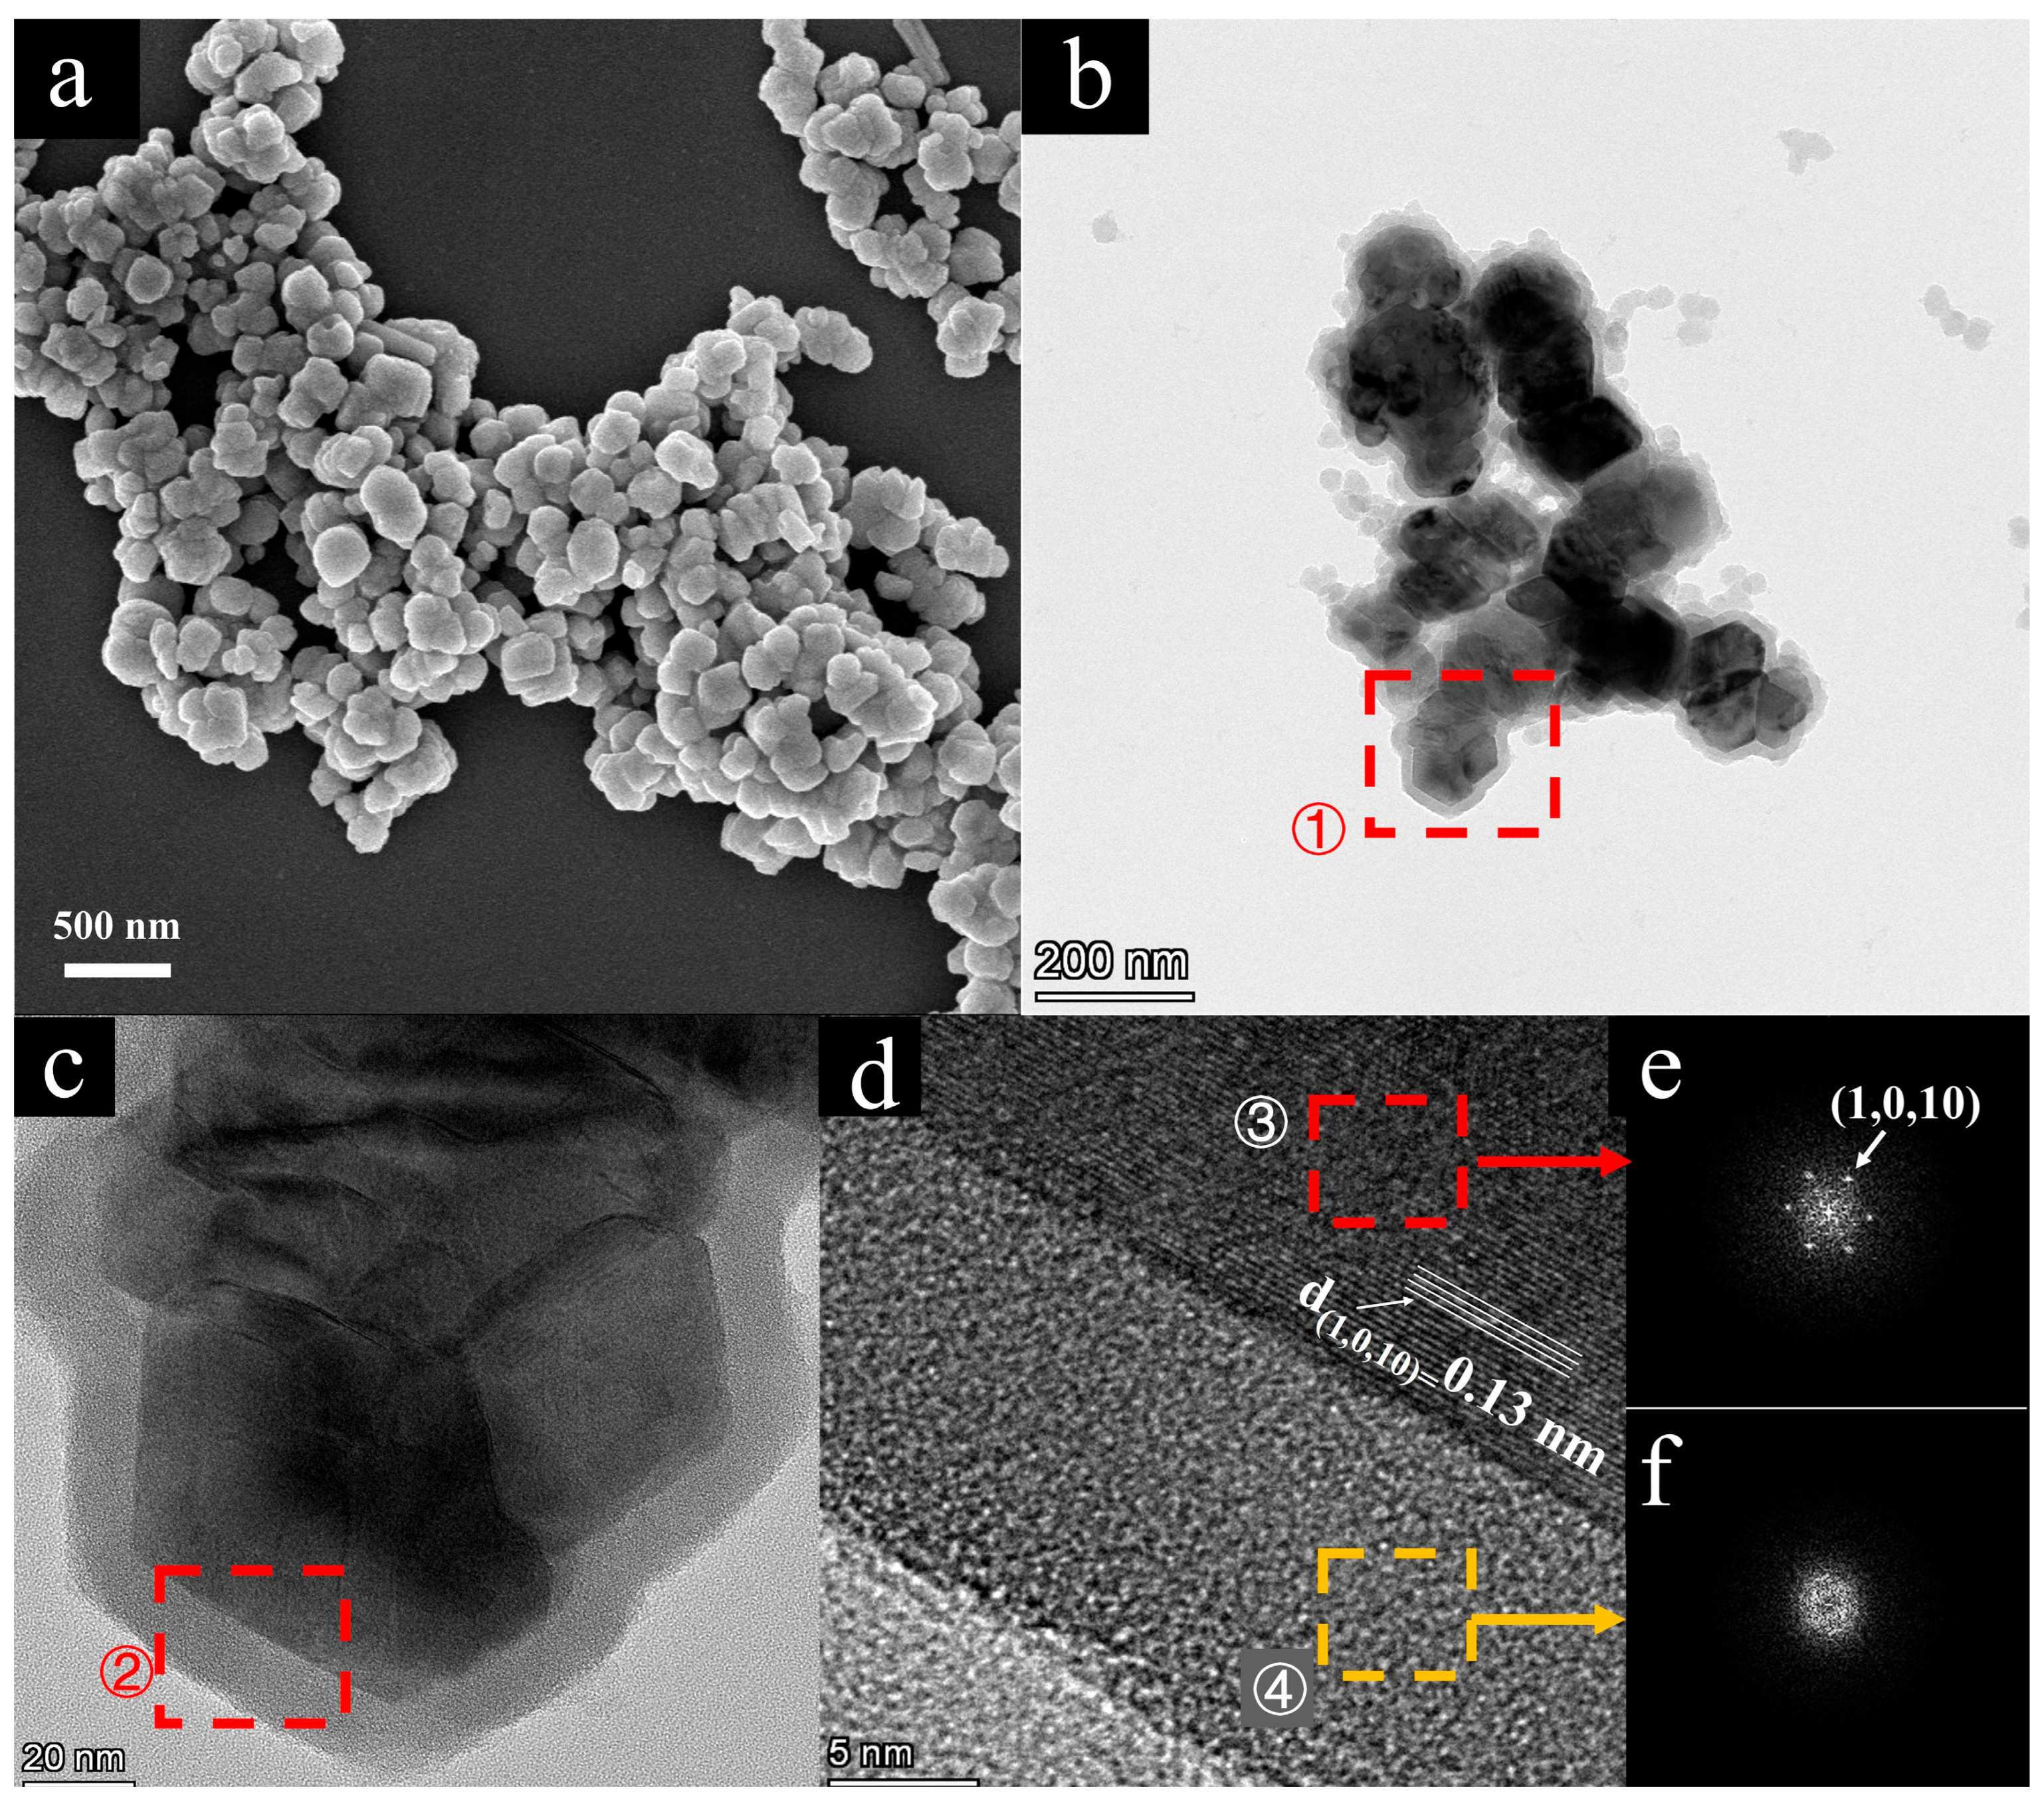
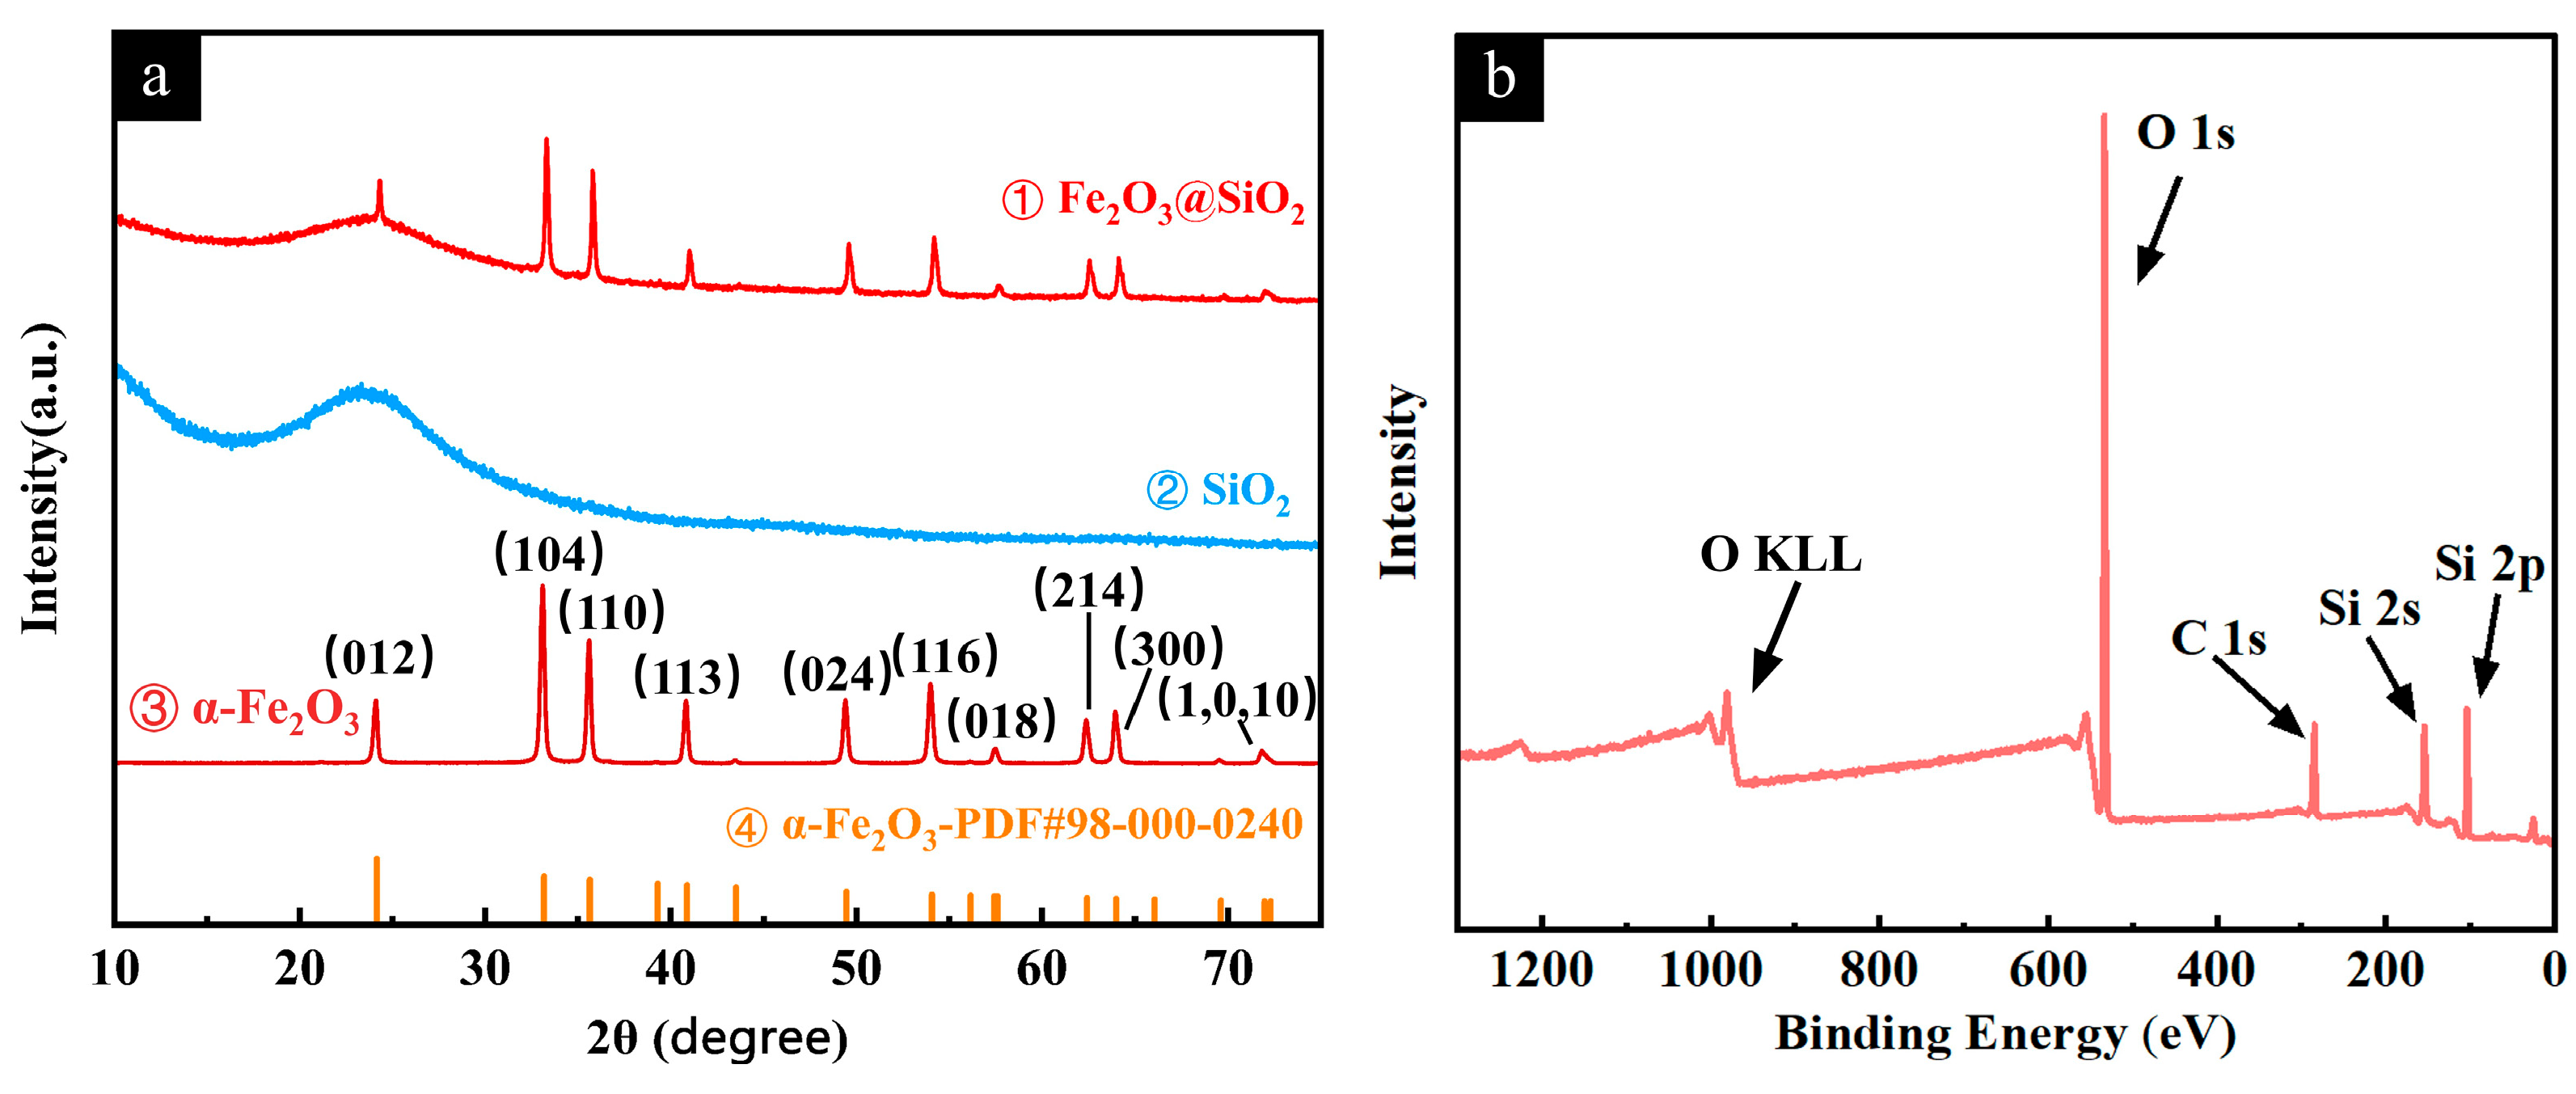
3.1. Characterization of Nanoparticles for Opal Film Fabrication

As expected, the sol–gel method produced well-dispersed SiO2 and Fe2O3@SiO2 NPs, demonstrating the positive effects of silica coating in terms of uniform doping. This effect was attributed to the surface chemistry properties of the SiO2 shells and SiO2 NPs [55]. Visual observation confirmed that the colloidal dispersions of Fe2O3@SiO2 NPs, SiO2 NPs, and their mixtures remained sufficiently stable without visible precipitation for 3 h (longer than the duration of the self-assembly experiments) at room temperature (Figure 2a—①, 2b—①; Figure 2c). The SEM analysis showed SiO2 NPs with a uniform spherical morphology, with an average diameter of 273 ± 26 nm (Figure 2a—②, ③). After the coating process, the Fe2O3@SiO2 NPs showed good monodispersity and a slight increase in particle size compared to the Fe2O3 NPs, with a mean diameter of 225 ± 55 nm (Figure 2b—②, ③). While the majority of the coated particles were monodispersed and spherical with similar dimensions, a minor fraction (2.5%) presented as near-spherical structures with larger diameters of approximately 500 nm. This size variation and large standard deviation likely resulted from the aggregation of the Fe2O3 NPs during the coating process, leading to the formation of larger particles and a broader size distribution.
To verify the successful formation of the core–shell structure, we characterized the detailed structure of the Fe2O3@SiO2 NPs using TEM. Before the SiO2 shell coating experiment, SEM images revealed that the Fe2O3 core exhibited a near-spherical particle shape, as shown in Figure 3a. The TEM images clearly showed a distinct core–shell structure (Figure 3b–d), where the crystalline Fe2O3 core with well-ordered lattice fringes was encapsulated in a 10-nm-thick amorphous silica shell. The high-resolution TEM image of the core–shell interface region (Figure 3d) reveals clear lattice fringes in the core, with a measured d-spacing of 0.13 nm, corresponding to the (1,0,10) lattice plane of α-Fe2O3. The two-dimensional Fast Fourier Transform patterns (2D-FFT) obtained from the Fe2O3 core (Region ③ marked by red dashed line in Figure 3d, shown in Figure 3e) and from the SiO2 shell (Region ④ marked by yellow dashed line in Figure 3d, shown in Figure 3f) further confirmed the crystalline characteristics of the Fe2O3 core and the amorphous phase of the SiO2 shell, respectively.
To further confirm the core–shell structure, EDS elemental mapping was performed (Figure 4). The elemental mapping clearly visualized the spatial distribution of constituent elements, with Fe signals (Figure 4b) precisely confined to the core region, exhibiting a well-defined spherical distribution that corresponded to the Fe2O3 core. In contrast, both Si (Figure 4c) and O (Figure 4d) signals extended uniformly throughout the entire particle, with a noticeable enhancement in the signal intensity in the shell region. This distribution pattern provides conclusive evidence of the successful formation of the Fe2O3@SiO2 core–shell structure, with the complete encapsulation of the Fe2O3 core by the SiO2 shell, consistent with the TEM observations.
The crystal structure and phase composition of the samples were investigated by XRD analysis (Figure 5a). The sharp diffraction peaks of the Fe2O3 NPs (Figure 5a—①) matched well with the standard α-Fe2O3 phase (PDF#98-000-0240), which belongs to the hexagonal crystal system with space group R-3c (167). This good agreement indicates the high phase purity of the sample. The broad peak centered at around 2θ = 15°~25° in Figure 5a—② corresponded to amorphous SiO2. After core–shell formation, the Fe2O3@SiO2 NPs exhibited the characteristic peaks of both the α-Fe2O3 and SiO2 phases (Figure 5a—③), showing the superposition of the sharp diffraction peaks from crystalline α-Fe2O3 and the broad peak from amorphous SiO2. The presence of only these two phases indicates that the SiO2 was merely coated on the surfaces of the α-Fe2O3 NPs, without forming any new phases. This confirms the successful synthesis of the intended core–shell structure. The XPS spectrum analysis (Figure 5b) revealed no Fe2O3-related peaks on the surface, confirming the complete encapsulation of the nanoparticles and validating the successful formation of the core–shell structure through surface chemical composition analysis.
These results demonstrate that the Fe2O3 NPs were completely encapsulated in the SiO2 shell through the sol–gel method, forming a dense and non-porous coating with a uniform thickness. The SiO2 shell in this structure effectively protects the Fe2O3 core and enables the uniform dispersion of the nanoparticles by preventing agglomeration and providing compatible surface chemistry with the opal matrix.

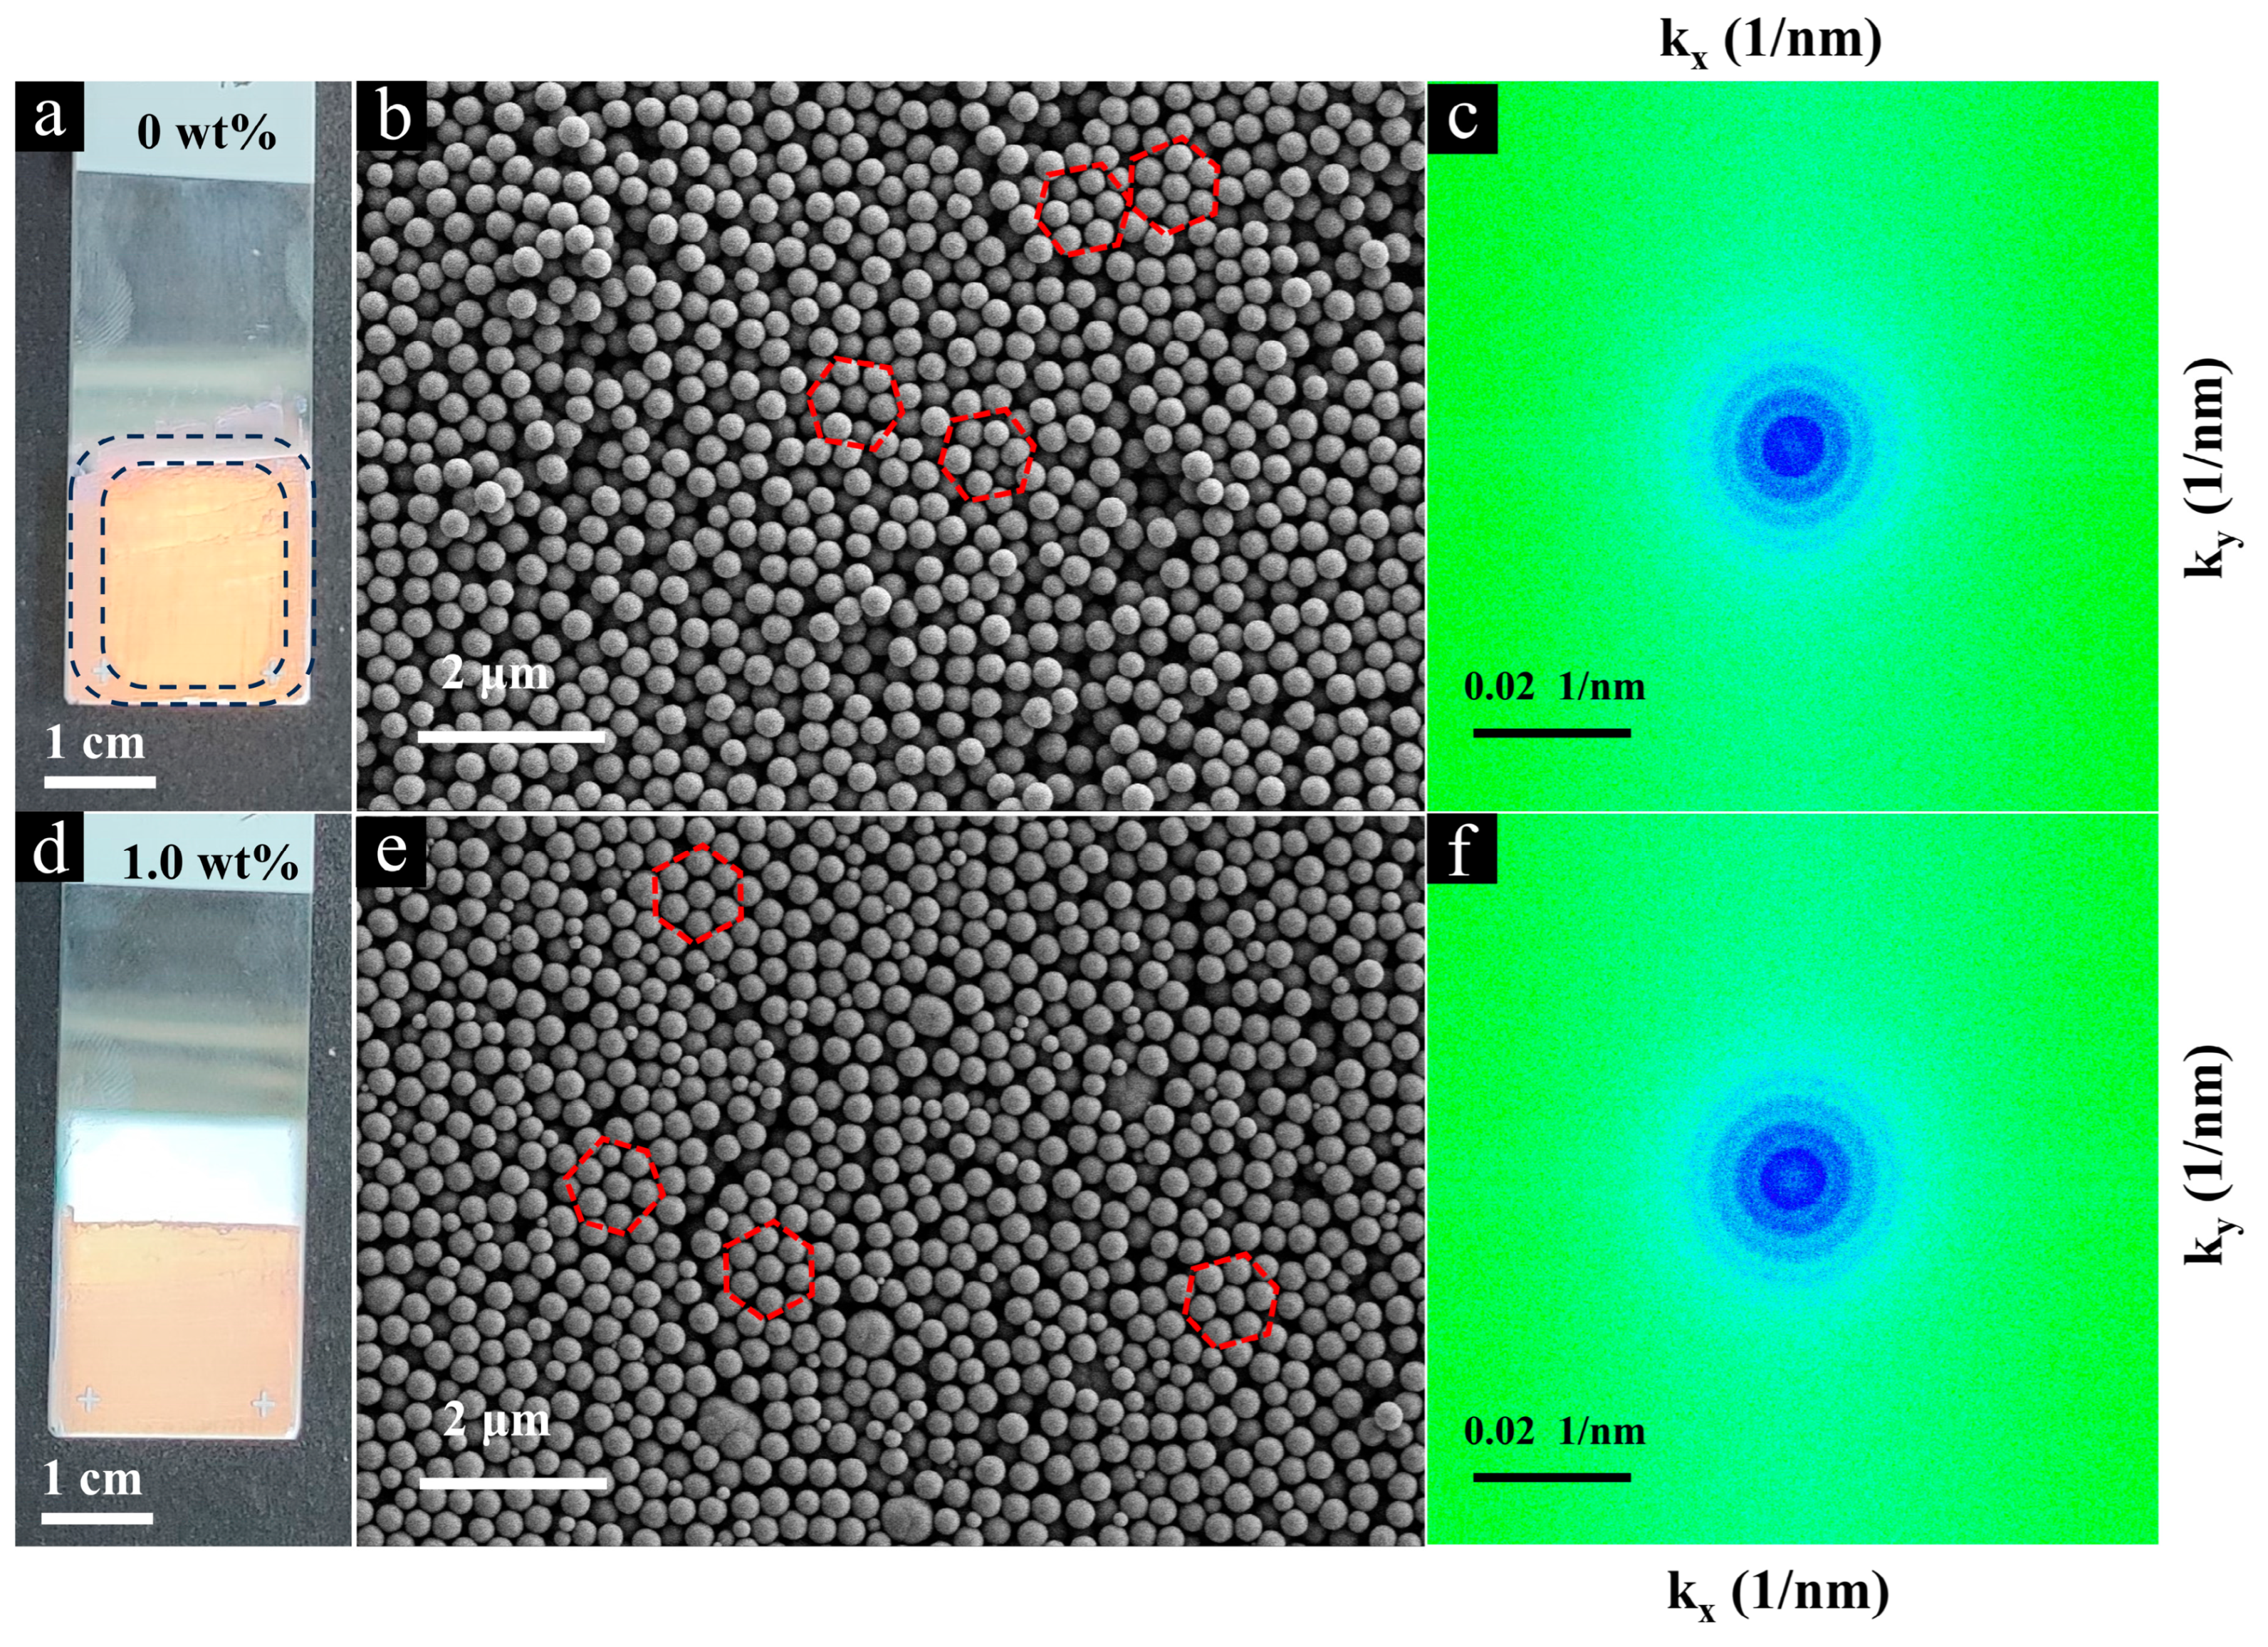
3.2. Characterization of Opal Films

Figure 6 shows the structural features of the opal films assembled with pure SiO2 NPs (Figure 6a–c) and the mixture of SiO2 NPs and Fe2O3@SiO2 NPs (Figure 6d–f). The self-assembly process resulted in opal films with a uniform thickness, exhibiting distinct structural colors under normal-incidence sunlight illumination (Figure 6a,d). The undoped opal film exhibited a yellow–orange structural color in the central region and a pink–red body color in the edge region (Figure 6a). As shown in Figure 6b,e, the SiO2 NPs exhibited a hexagonal close-packed arrangement in localized areas, revealing their dense packing behavior in the face-centered cubic (FCC) structure or hexagonal closed packed (HCP) structure. The corresponding 2D-FFT images (Figure 6c) present discrete concentric circle patterns, providing firm evidence of the isotropic and short-range order of the opal films [56]. After mixing with Fe2O3@SiO2 NPs (1.00 wt%), the doped film maintained its structural integrity while exhibiting a modified color appearance (Figure 6d,e). The 2D-FFT pattern (Figure 6f) remained unchanged, demonstrating that the opal film maintained the periodic structure of the colloidal crystal at the low doping ratio of Fe2O3@SiO2 NPs.

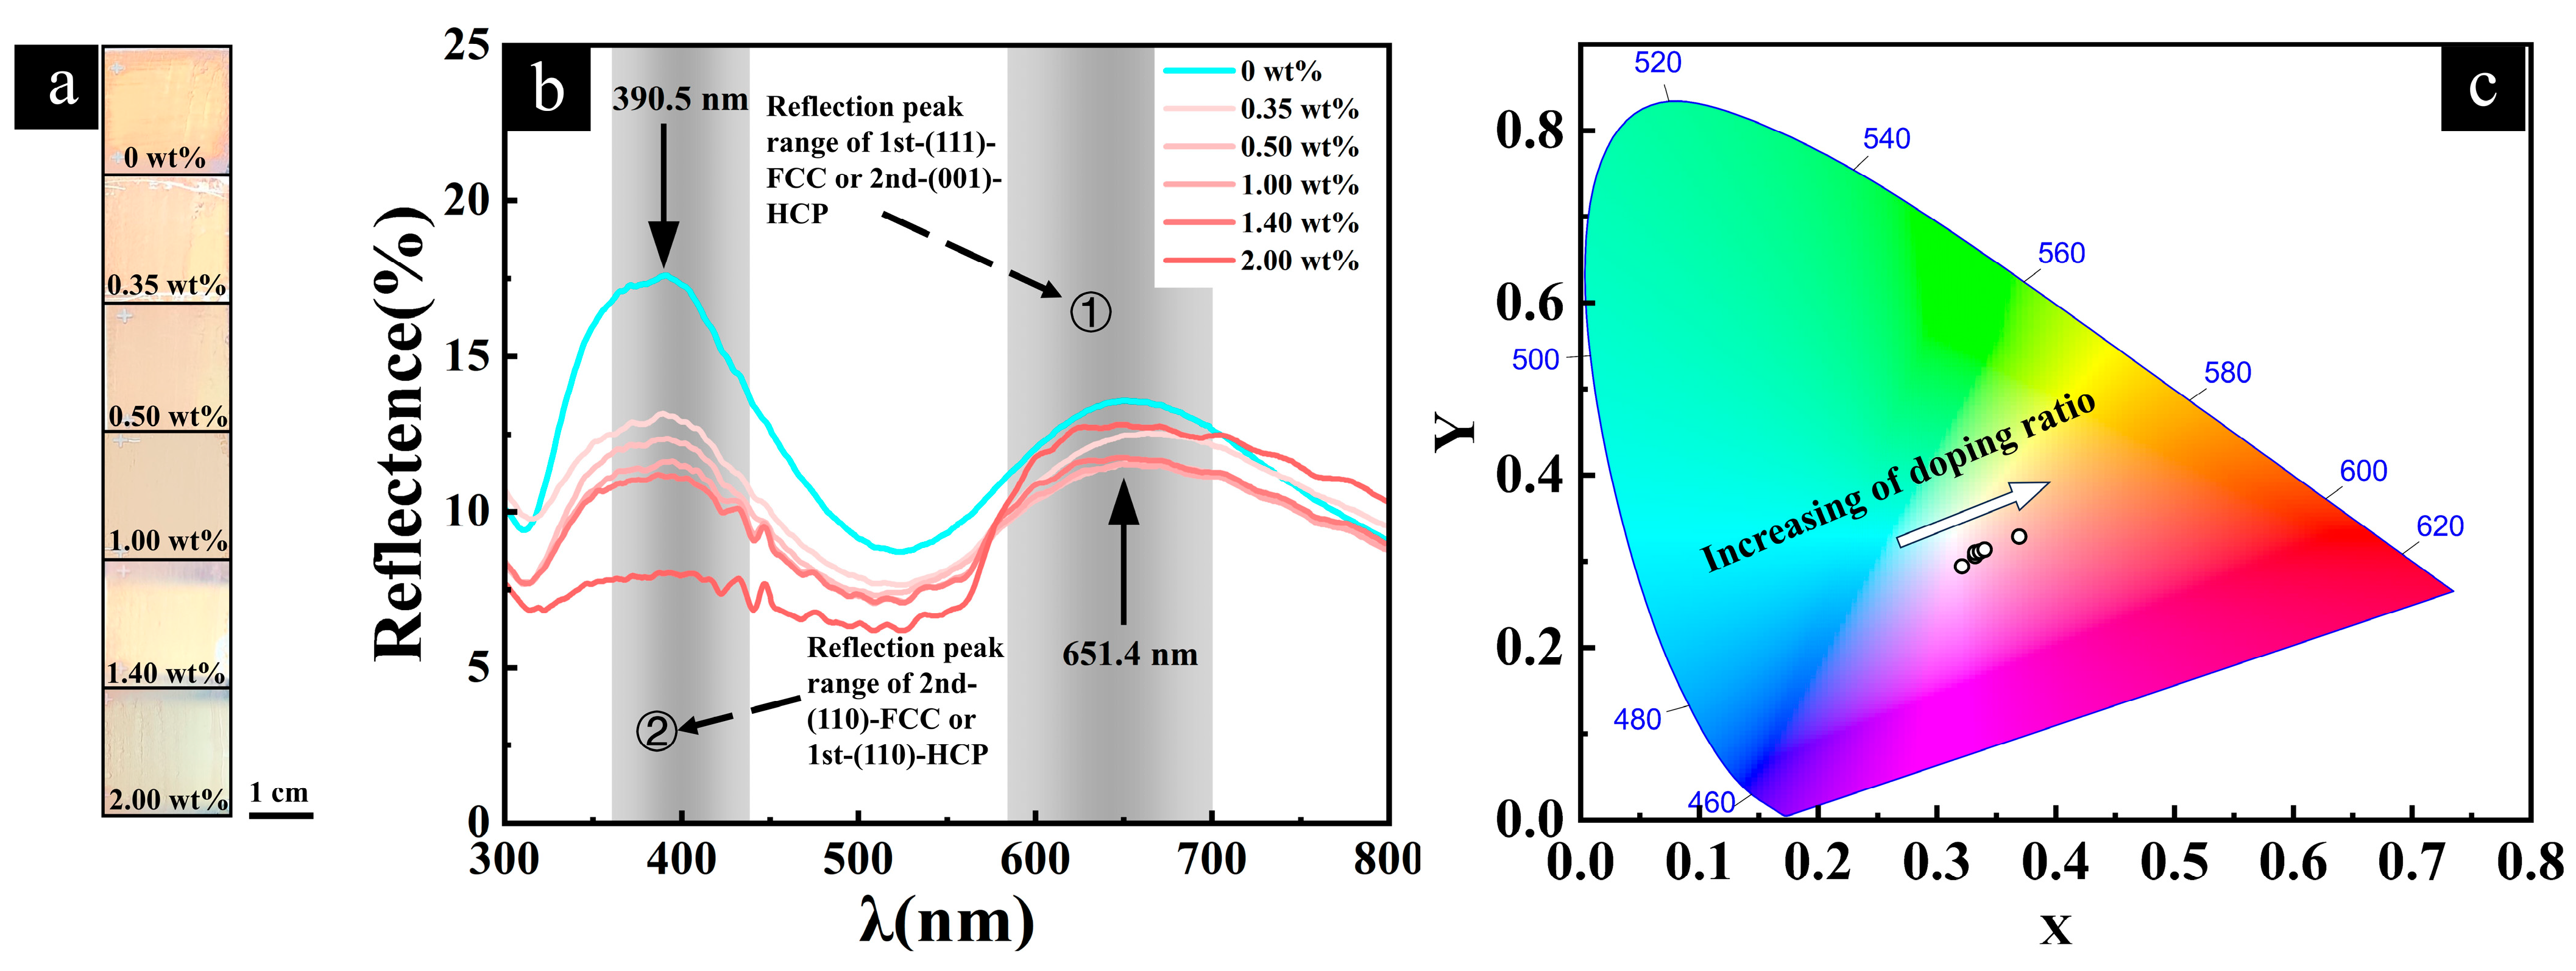
3.3. Color Effects of Fe2O3@SiO2 NP Doping Ratio

The variation in the Fe2O3@SiO2 NP doping concentration led to clear color evolution in the visual appearance of the opal films (Figure 7a). As the doping ratio increased from 0 wt% to 2.00 wt%, the films exhibited a gradual structural color transition. This color evolution was quantitatively analyzed through reflection spectroscopy (Figure 7b). The reflection spectrum of the undoped film showed dual peaks, with a dominant peak at 390.5 nm and a secondary peak at 651.4 nm. Previous studies have reported similar double reflection peaks in opals as exhibited by our samples, attributing them to distinct Bragg reflections originating from different crystallographic planes within the close-packed structure [3]. With increasing Fe2O3@SiO2 NP content up to 2.00 wt%, the reflectance intensity at 390.5 nm decreased consistently from 17.6% to 8.0%. At 651.4 nm, the reflectance intensity exhibited a more complex trend: it first decreased from 13.6% to 11.5% as the doping ratio increased from 0% to 0.5% and then returned to the same reflectance intensity of 11.5% at a 1% doping concentration, and it finally increased to 12.8% at a 2% doping concentration. The overall downward trend in the reflectance intensity from a 0% to 0.5% doping ratio, followed by an identical reflectance value at a 1% concentration, suggests that the minimum reflectance intensity likely occurred at an approximately 0.75% doping ratio.
The color coordinates derived from the reflection spectra provided a visual representation of the color evolution in the CIE 1931 chromaticity space (Figure 7c). The significant shift in the chromaticity coordinates with increasing doping concentrations demonstrates that the precise control of the Fe2O3@SiO2 NP concentration could effectively modulate the optical reflection properties of opal films. To quantitatively assess the significance of these color shifts, we calculated the total color difference (ΔE*) in the CIELAB color space (see Supplementary Information for calculation details).
The ΔE* calculations reveal substantial color shifts with Fe2O3@SiO2 NP doping ratio variation: from undoped 0 wt% to 0.35 wt%, ΔE* = 19.47; from 0.35 wt% to 0.50 wt%, ΔE* = 6.67; from 0.50 wt% to 1.00 wt%, ΔE* = 3.85; from 1.00 wt% to 1.40 wt%, ΔE* = 3.81; and from 1.40 wt% to 2.00 wt%, ΔE* = 27.10. According to established color difference interpretation standards [57], ΔE* values between 3.5 and 5 represent noticeable color differences, while values above 5.0 indicate that observers perceive two distinctly different colors. The cumulative color shift from undoped to 2.00 wt% Fe2O3@SiO2 NPs is remarkably large (ΔE* = 52.79), demonstrating the significant range of color tunability achievable through precise control of the Fe2O3@SiO2 NP concentration. This significant chromaticity shift demonstrates that Fe2O3@SiO2 NPs can effectively modulate the optical reflection properties of opal films. The color shifts could be further enhanced by optimizing the size distribution of SiO2 nanoparticles to better align with the Fe2O3@SiO2 NPs’ optical properties, exploring core–shell nanoparticles with higher refractive index contrast, or investigating core materials with stronger selective absorption characteristics.
The Bragg–Snell equation is an effective formula for the prediction of the reflection peak positions of opals (Equation (1)). This theoretical framework provides reliable predictions that show excellent agreement with experimental measurements [58]. While traditionally applied to perfectly periodic structures, research has demonstrated that the Bragg–Snell equation maintains validity for systems with short-range order but limited long-range periodicity, like our Fe2O3@SiO2 NP-doped opal structures. As Ono’s work showed [3], even in quasi-ordered silica arrays with significant aperiodicity, the values calculated using this approach can correlate strongly with experimental measurements (R2 ≈ 0.99). This applicability stems from the coherent scattering within local ordered domains, primarily from planes with the highest packing density, albeit with characteristic effects like peak broadening and reduced angular dependence compared to perfect crystals.
To comprehend the underlying mechanism, we applied the Bragg–Snell equation to calculate the theoretical positions of the reflection peaks in the opal films and determine the optical characteristics of the nanoparticles embedded within these opal films. Within this theoretical framework, we utilized the Bragg–Snell law to determine the corresponding crystal planes responsible for each reflection peak. This approach enabled us to establish a direct correlation between the structural parameters and optical properties.
The position of the reflection peak (λ) for a close-packed plane with Miller indices (hkl) can be determined using the Bragg–Snell law [59]:
m λ peak = 2 d hkl n ave 2 sin 2 θ
where d(h,k,l) is the interplanar distance of the close-packing plane (hkl), m is the order of the Bragg reflection, nave denotes the average refractive index of the opal film, and θ is the angle of observation measured relative to the normal of the reflecting surface, which is 0° in this research.
nave is determined using the following equation:
n ave = = f SiO 2 n SiO 2 2 + f air n air 2  
where f SiO 2 is the volume fraction of SiO2, f air is the volume fraction of air, n SiO 2 is the refractive index of SiO2, and n air is the refractive index of air.
The interplanar distance d(hkl) of the FCC close-packing structure can be calculated by the following equation:
d hkl = D 2 h 2 + k 2 + l 2
where D is the diameter of the SiO2 nanoparticle.
The interplanar distance d(hkl) of the HCP close-packing structure can be calculated by the following equation:
d hkl = 1 4 3 h 2 + hk + k 2 a 2 + l c 2
where a and c are the lattice parameters, with a = D and c = 2 2 / 3 D for ideal HCP-packed SiO2 NPs of diameter D.
Based on the Bragg–Snell law calculations for SiO2 spheres (273 ± 26 nm) in close-packing opal films in Table 1, the reflection peaks at 390.5 nm can be attributed to the second-order Bragg diffractions from the (110) close-packing planes in the FCC structure (2nd-(110)-FCC) or the first-order Bragg diffractions from the (110) close-packing planes in the HCP structure (1st-(110)-HCP). Moreover the reflection peak at 651.4 nm can be attributed to the first-order Bragg diffractions from the (111) close-packing planes in the FCC structure (1st-(111)-FCC) or the second-order Bragg diffractions from the (001) close-packing planes in the HCP structure (2nd-(001)-HCP). At first, the 2nd-(110)-FCC (or 1st-(110)-HCP) exhibits a higher intensity than the 1st-(111)-FCC (or 2nd-(001)-HCP). With increasing Fe2O3@SiO2 NP doping ratios, the 2nd-(110)-FCC (or 1st-(110)-HCP) decreases continuously, while the reflection intensity of the 1st-(111)-FCC (or 2nd-(001)-HCP) shows minimal variation, with an initial decrease followed by an increase. Figure 6c,f demonstrate that the opal film maintains its short-range order structure under low doping concentrations of similarly sized Fe2O3@SiO2 NPs; these intensity variations likely originate from the optical properties of the incorporated Fe2O3@SiO2 NPs, rather than structural changes.
While Table 1 presents theoretical estimates based on Bragg diffraction theory, it is important to acknowledge that the Fe2O3@SiO2-doped silica opal films exhibit significant aperiodicity, as is evident in the SEM images. In such quasi-ordered structures, Bragg diffraction theory remains applicable primarily to local domains with preserved short-range order. The SEM images reveal hexagonal close-packed arrangements within these local domains, which correspond to planes with the highest packing density. These domains support coherent scattering despite the absence of long-range periodicity. The experimental full width at half-maximum values, exceeding the theoretical predictions for perfectly crystalline structures, provide direct evidence of this structural aperiodicity. Nevertheless, the good agreement between the measured peak positions and theoretical calculations confirms that the short-range periodicity within local domains remains sufficient to generate the observed structural colors. The broader peaks and reduced angle dependence in our samples compared to long-range ordered structures are characteristic features of such quasi-ordered systems, where local domains rather than long-range order dominate the optical response.
Previous studies have demonstrated that both Bragg diffraction and the absorption/scattering properties of nanoparticles influence the optical behavior of doped opal systems [8]. Given the critical role of scattering in light–matter interactions, which has been widely investigated in core–shell systems across different spectral regions—including the visible to near-infrared (NIR) range [60], the mid-infrared to terahertz (THz) range [61], the broadband optical range for localized plasmons [62], and microwave to infrared [63]—it is important to further examine how scattering contributes to the optical response in our core–shell nanoparticle-doped opal system. Therefore, we compared the optical properties of 225 nm Fe2O3 nanoparticles and Fe2O3@SiO2 nanoparticles (with a 10 nm shell thickness) by simulating their absorption, scattering, and extinction spectra (Figure 8a). The spectral features remained unchanged after SiO2 coating, with only enhanced intensities observed. The SiO2 shell enhanced the absorption and scattering properties of Fe2O3 nanoparticles, leading to an increase of up to 13% in the absorption cross-section and a 15% enhancement in the scattering cross-section. The electric field distributions revealed an enhanced light–matter interaction around the core–shell-structured nanoparticle at 650 nm (Figure 8b,c), especially in the negative direction of incident light (backscattering), as demonstrated by a 15% increase in the scattering cross-section. In the wavelength range of 300 nm~500 nm, the scattering and absorption cross-sections were comparable. However, in the range of 500 nm~800 nm, the scattering effect of Fe2O3@SiO2 nanoparticles became dominant, with the scattering cross-section being up to seven times greater than the absorption cross-section at its maximum difference. This indicates that the SiO2 shell shows a stronger effect on the scattering properties of the nanoparticles. These results suggest that Fe2O3@SiO2 NPs can effectively replace Fe2O3 NPs in practical applications, offering improved processability while maintaining comparable optical performance. The changes in the optical properties of opal thin films caused by the doping of Fe2O3@SiO2 NPs can be considered equivalent to those induced by Fe2O3 NPs under the same doping conditions. While our simulations show comparable optical effects between Fe2O3 nanoparticles and Fe2O3@SiO2 nanoparticles (with a 10 nm shell thickness), it is important to determine which functionalities can be achieved with core-only particles versus those that require the core–shell structure. The Fe2O3 core alone contributes the primary light absorption properties (particularly in the 300 nm~550 nm range), the fundamental color contribution, and the basic modulation of the reflection peak intensities. However, the SiO2 shell provides several critical advantages: improved colloidal stability, preventing agglomeration during assembly; enhanced chemical stability, protecting against environmental factors and undesired transformations under reducing conditions; and optical property enhancement, with an up to 15% increased scattering cross-section while maintaining the characteristic absorption profile of the Fe2O3 nanoparticles. These benefits of the core–shell design offer both practical fabrication advantages and optimized optical performance that would be difficult to achieve with bare Fe2O3 NPs.
Combining the above findings, we compared the optical properties (i.e., absorption and backscattering) of the nanoparticles with the reflection peak regions of opal films to gain insights into the color effect mechanism (Figure 9). The key feature of Fe2O3@SiO2 NPs is their strong absorption in the short-wavelength range (300 nm~550 nm), as well as their significant backscattering abilities, with the backscattering cross-section being nearly four times than that of the absorption at 630 nm. The backscattering peak of Fe2O3@SiO2 NPs falls within the reflection peak range of the 1st-(111)-FCC or the 2nd-(001)-HCP of the opal film, although it is slightly offset from the center position at 651.4 nm. While the Fe2O3@SiO2 NPs exhibited absorption and backscattering contributions, the pure SiO2 NPs showed predominantly scattering behavior. In the reflection peak region of the 2nd-(110)-FCC or the 1st-(110)-HCP, multiple scattering simulations for SiO2 NPs indicate that the scattering cross-section exceeds the absorption cross-section and decreases with the wavelength. However, the backscattering cross-section constitutes only a small fraction of the total scattering cross-section, indicating the presence of incoherent scattering driven by complex multiple scattering interactions. These findings suggest that the relatively higher reflection peak intensity at 390.5 nm compared to 651.4 nm in undoped opal films may be attributed to multiple contributing factors. These include the 2nd-(110)-FCC or 1st-(110)-HCP, the multiple backscattering of SiO2 NPs, and the incoherent scattering of SiO2 NPs. In contrast, the 651.4 nm reflection peak appears to primarily arise from the 1st-(111)-FCC or 2nd-(001)-HCP. As the doping concentration increases, both peaks decrease, with the 390.5 nm peak showing a more significant reduction. This is likely due to the strong absorption of incoherent scattering by Fe2O3@SiO2 NPs [64], which dominates the reflection at this wavelength. The 651.4 nm reflection peak exhibits an initial decrease followed by an increase with higher Fe2O3@SiO2 NP doping concentrations, potentially due to the contribution of Fe2O3@SiO2 nanoparticle backscattering to the peak intensity.
The experimental and simulation results demonstrate how Fe2O3@SiO2 NPs influence the optical properties of synthetic opal films. These core–shell nanoparticles function through dual optical mechanisms, i.e., wavelength-selective absorption and enhanced backscattering, which modify the reflection spectra in a concentration-dependent manner. The reflection peak width characteristics observed in our samples result primarily from the SiO2 nanoparticle size distribution (273 ± 26 nm), consistent with predictions from the Bragg–Snell equation. The inherent polydispersity creates slight variations in the reflection wavelengths, leading to peak broadening, which corresponds with our structural characterization showing multi-scale ordering. Importantly, our simulation results indicate that Fe2O3@SiO2 NPs exhibit optical properties similar to those of Fe2O3 NPs, suggesting that the color mechanisms identified may parallel those in natural fire opals containing Fe2O3 nanoparticle inclusions. The Fe2O3@SiO2 NPs provide a tunable parameter for the control of the reflection peak intensities across the visible spectrum, with distinctive effects at different wavelengths, determined by the balance between absorption and backscattering contributions. The interplay between Bragg diffraction from the SiO2 NP assembly and the localized optical responses (absorption and backscattering) of Fe2O3@SiO2 NP dopants demonstrates that the structural colors of synthetic opal films can be systematically tuned through controlled doping concentrations.
In relation to earlier investigations on doped opal films, our results offer additional insights into how low-concentration Fe2O3@SiO2 NP doping (0~2.00 wt%) modulates the color appearance of opal structures. Unlike previous studies that focused on opal films fully infiltrated with Fe2O3 NPs in all porous spaces [30], achieving high filling fractions and significant shifts in the reflection peak positions, our work specifically investigated the effects of small amounts of Fe2O3@SiO2 NP doping on the color appearance of opal films. This concentration range is particularly relevant as it more closely aligns with the iron content reported in natural fire opals (0 wt%~0.23 wt%) [26,27]. Furthermore, while previous research on doped opals has primarily focused on either structural or pigmentary effects separately, our work uniquely combined experimental characterization with theoretical calculations and numerical simulations to elucidate the dual mechanisms (both absorption and backscattering) through which Fe2O3@SiO2 NPs modulate the structural color. By demonstrating that the 10 nm SiO2 shell coating enhances the optical properties of Fe2O3 NPs while maintaining their core characteristics, we provide new insights into how such core–shell structures contribute to color formation in both synthetic systems and potentially in natural gemstones. The similarity in the simulated optical properties of 225 nm Fe2O3 NPs and Fe2O3@SiO2 NPs (with a 10 nm shell thickness) suggests that Fe2O3 nanoparticle inclusions may contribute similarly to the color formation mechanisms in natural fire opals. This approach bridges the gap between synthetic material design and natural gemology, with implications for both photonic material development and our understanding of the color mechanisms in natural fire opals.

4. Conclusions

In this study, we successfully synthesized Fe2O3@SiO2 NPs by coating a SiO2 shell on Fe2O3 NPs through the sol–gel method. The Fe2O3@SiO2 NPs were applied as pigments to fabricate fire opal films with SiO2 NPs. A series of opal films with short-range ordered and long-range disordered structures were fabricated with controlled doping ratios to investigate the influence of Fe2O3@SiO2 NPs on color appearance. We observed that the Fe2O3@SiO2 NPs could affect the color appearance by changing the reflection peak intensity within our investigated doping range (0 wt%~2.00 wt%). Specifically, for our synthetic opal films (273 ± 26 nm SiO2 NPs, short-range ordered), the short-wavelength reflection peak (390.5 nm) decreased continuously with increased doping. Meanwhile, the long-wavelength peak (651.4 nm) followed a non-monotonic trend, decreasing to the minimum intensity at around 0.75% before increasing. This wavelength-selective modulation produced the distinctive color transitions observed in our samples. A comparison with numerical simulation results revealed that the Fe2O3@SiO2 NPs influenced the color appearance through the combined effects of absorption and backscattering. The similarity in the simulated optical properties of Fe2O3 NPs and Fe2O3@SiO2 NPs (with a 10 nm silica shell and similar particle sizes) suggests that the same mechanisms and trends may operate in natural fire opals containing Fe2O3 NPs. This work demonstrates the potential applications of Fe2O3@SiO2 NPs in the design of synthetic fire opals and other related structural color materials. Additionally, it advances our theoretical understanding of the color formation mechanisms in natural fire opals through a controlled synthesis and characterization approach.
Based on the findings of this study, our future research will focus on several aspects. First, opal films with different SiO2 particle sizes should be synthesized to investigate how Fe2O3@SiO2 NP doping affects the color properties of opals with varying reflection characteristics, especially when the main reflection peaks do not align with the backscattering peak range of Fe2O3@SiO2 NPs. Additionally, exploring the development of Fe2O3@SiO2 NPs with different core sizes and shell thicknesses could provide more opportunities to tune the optical properties. The influence of the Fe2O3@SiO2 NPs’ morphology on their absorption and scattering properties, and how these factors affect the overall color appearance of synthetic opals, warrants further investigation. Moreover, advanced assembly conditions that offer better control over the opal structure and spatial distribution of Fe2O3@SiO2 NPs could lead to more precise color control. Finally, incorporating other types of core–shell nanoparticles with distinct optical properties may expand the range of achievable colors and functionalities in synthetic opals.

Supplementary Materials

The following supporting information can be downloaded at: https://www.mdpi.com/article/10.3390/coatings15060646/s1. Detailed calculation methods for color difference (ΔE*) in the CIELAB color space and interpretation guidelines for ΔE* values. Table S1: CIE chromaticity coordinates (x, y) and CIELAB color space parameters (L*, a*, b*) for SiO2 opal films with different Fe2O3@SiO2 doping ratios. Table S2: Calculated color differences (ΔE*) for SiO2 opal films with various Fe2O3@SiO2 doping ratio variations.

Author Contributions

Conceptualization, B.L. and A.H.S.; methodology, B.L.; calculation and simulation, B.L.; writing—original draft preparation, B.L.; writing—review and editing, B.L. and A.H.S. All authors have read and agreed to the published version of the manuscript.

Funding

This research was funded by the Hubei Gems and Jewelry Engineering Technology Research Center (grant number CIGTXM-04-S202201).

Institutional Review Board Statement

Not applicable.

Informed Consent Statement

Not applicable.

Data Availability Statement

The authors confirm that the data supporting the findings of this study are available within the article.

Acknowledgments

We acknowledge the open-source software resources offered by the Virtual Photonics Technology Initiative, at the Beckman Laser Institute, University of California, Irvine.

Conflicts of Interest

The authors declare no conflicts of interest.

References

  1. Armstrong, E.; O’Dwyer, C. Artificial opal photonic crystals and inverse opal structures—Fundamentals and applications from optics to energy storage. J. Mater. Chem. C 2015, 3, 6109–6143. [Google Scholar] [CrossRef]
  2. Wu, Y.T.; Liu, Q.J.; Li, M.L.; Zhang, X.M.; Hei, X.P. Bright Structural Color and High Hydrophobic Properties of Photonic Crystal Films on the Ceramic Glaze Layer via Vertical Deposition Self-Assembly Method. Chemistryselect 2021, 6, 10986–10990. [Google Scholar] [CrossRef]
  3. Ono, Y. Application of silica opals to ceramic pottery. J. Asian Ceram. Soc. 2020, 8, 578–585. [Google Scholar] [CrossRef]
  4. Liu, Y. Self-assembly of poly(styrene-methyl methacrylate-acrylic acid) (P(St-MMA-AA)) colloidal microspheres on wood surface by thermal-assisted gravity deposition. Wood Sci. Technol. 2021, 55, 403–417. [Google Scholar] [CrossRef]
  5. Liu, Y.; Hu, J.; Wu, Z. Fabrication of Coatings with Structural Color on a Wood Surface. Coatings 2020, 10, 32. [Google Scholar] [CrossRef]
  6. Siegwardt, L.; Gallei, M. Complex 3D-Printed Mechanochromic Materials with Iridescent Structural Colors Based on Core–Shell Particles. Adv. Funct. Mater. 2023, 33, 2213099. [Google Scholar] [CrossRef]
  7. Zhao, C.F.; Wang, J.; Zhang, Z.Q.; Chi, C.C. Research Progress on the Design of Structural Color Materials Based on 3D Printing. Adv. Mater. Technol. 2022, 8, 2200257. [Google Scholar] [CrossRef]
  8. Liu, H.; Wang, Y.; Shi, Z.; Tan, D.; Yang, X.; Xiong, L.; Li, G.; Lei, Y.; Xue, L. Fast Self-Assembly of Photonic Crystal Hydrogel for Wearable Strain and Temperature Sensor. Small Methods 2022, 6, 2200461. [Google Scholar] [CrossRef]
  9. Wang, Z.; Xue, M.; Zhang, H.R.; Meng, Z.H.; Shea, K.J.; Qiu, L.L.; Ji, T.T.; Xie, T.S. Self-assembly of a nano hydrogel colloidal array for the sensing of humidity. RSC Adv. 2018, 8, 9963–9969. [Google Scholar] [CrossRef]
  10. Lee, H.S.; Shim, T.S.; Hwang, H.; Yang, S.M.; Kim, S.H. Colloidal Photonic Crystals toward Structural Color Palettes for Security Materials. Chem. Mater. 2013, 25, 2684–2690. [Google Scholar] [CrossRef]
  11. Liu, H.L.; Xie, D.; Shen, H.Y.; Li, F.Y.; Chen, J.J. Functional Micro-Nano Structure with Variable Colour: Applications for Anti-Counterfeiting. Adv. Polym. Technol. 2019, 2019, 6519018. [Google Scholar] [CrossRef]
  12. Tran, V.T.; Kim, J.; Oh, S.; Jeong, K.J.; Lee, J. Rapid Assembly of Magnetoplasmonic Photonic Arrays for Brilliant, Noniridescent, and Stimuli-Responsive Structural Colors. Small 2022, 18, 2200317. [Google Scholar] [CrossRef]
  13. Sai, T.; Froufe-Perez, L.S.; Scheffold, F.; Wilts, B.D.; Dufresne, E.R. Structural color from pigment-loaded nanostructures. Soft Matter 2023, 19, 7717–7723. [Google Scholar] [CrossRef] [PubMed]
  14. Lim, C.H.; Kang, H.; Kim, S.H. Colloidal Assembly in Leidenfrost Drops for Noniridescent Structural Color Pigments. Langmuir 2014, 30, 8350–8356. [Google Scholar] [CrossRef]
  15. Zhu, X.W.; Li, Y.J.; Wei, T.C.; Li, Y.C.; Xing, T.L.; Shawkey, M.D.; Chen, G.Q. TA-Fe(iii) complex coated PS nanospheres for non-iridescent structural coloration of cotton fabric. J. Mater. Chem. C 2022, 10, 17472–17480. [Google Scholar] [CrossRef]
  16. Wang, F.; Zhang, X.; Lin, Y.; Wang, L.; Zhu, J.F. Structural Coloration Pigments based on Carbon Modified ZnS@SiO2 Nanospheres with Low-Angle Dependence, High Color Saturation, and Enhanced Stability. ACS Appl. Mater. Interfaces 2016, 8, 5009–5016. [Google Scholar] [CrossRef]
  17. Takeoka, Y.; Yoshioka, S.; Takano, A.; Arai, S.; Nueangnoraj, K.; Nishihara, H.; Teshima, M.; Ohtsuka, Y.; Seki, T. Production of colored pigments with amorphous arrays of black and white colloidal particles. Angew. Chem. Int. Ed. Engl. 2013, 52, 7261–7265. [Google Scholar] [CrossRef] [PubMed]
  18. Forster, J.D.; Noh, H.; Liew, S.F.; Saranathan, V.; Schreck, C.F.; Yang, L.; Park, J.G.; Prum, R.O.; Mochrie, S.G.; O’Hern, C.S.; et al. Biomimetic isotropic nanostructures for structural coloration. Adv. Mater. 2010, 22, 2939–2944. [Google Scholar] [CrossRef]
  19. Teshima, M.; Seki, T.; Kawano, R.; Takeuchi, S.; Yoshioka, S.; Takeoka, Y. Preparation of structurally colored, monodisperse spherical assemblies composed of black and white colloidal particles using a micro-flow-focusing device. J. Mater. Chem. C 2015, 3, 769–777. [Google Scholar] [CrossRef]
  20. Lee, K.Y.; Chun, J.; Lee, J.H.; Kim, K.N.; Kang, N.R.; Kim, J.Y.; Kim, M.H.; Shin, K.S.; Gupta, M.K.; Baik, J.M.; et al. Hydrophobic sponge structure-based triboelectric nanogenerator. Adv. Mater. 2014, 26, 5037–5042. [Google Scholar] [CrossRef]
  21. Vogel, N.; Utech, S.; England, G.T.; Shirman, T.; Phillips, K.R.; Koay, N.; Burgess, I.B.; Kolle, M.; Weitz, D.A.; Aizenberg, J. Color from hierarchy: Diverse optical properties of micron-sized spherical colloidal assemblies. Proc. Natl. Acad. Sci. USA 2015, 112, 10845–10850. [Google Scholar] [CrossRef] [PubMed]
  22. Zhang, B.; Zhu, J.F.; Shi, P.; Wang, F.; Wang, J.H.; Ren, Z. Achieving tunable sky-blue copper glaze and coloring mechanism by the introduction of phosphorus. J. Eur. Ceram. Soc. 2019, 39, 1925–1931. [Google Scholar] [CrossRef]
  23. Lee, C.H.; Yu, J.; Wang, Y.; Tang, A.Y.L.; Kan, C.W.; Xin, J.H. Effect of graphene oxide inclusion on the optical reflection of a silica photonic crystal film. RSC Adv. 2018, 8, 16593–16602. [Google Scholar] [CrossRef]
  24. Emerson, D. Opal: The Queen of Gems. Preview 2016, 2016, 37–45. [Google Scholar] [CrossRef]
  25. Fritsch, E.; Gaillou, E.; Rondeau, B.; Barreau, A.; Albertini, D.; Ostroumov, M. The nanostructure of fire opal. J. Non-Cryst. Solids 2006, 352, 3957–3960. [Google Scholar] [CrossRef]
  26. Simoni, M.; Caucia, F.; Adamo, I.; Galinetto, P. New Occurrence of Fire Opal from Bemia, Madagascar. Gems Gemol. 2010, 46, 114–121. [Google Scholar] [CrossRef]
  27. Wu, J.; Ma, H.; Ma, Y.; Ning, P.; Tang, N.; Li, H. Comparison of Natural and Dyed Fire Opal. Crystals 2022, 12, 322. [Google Scholar] [CrossRef]
  28. Wang, X.; Cao, Y. Characterizations of absorption, scattering, and transmission of typical nanoparticles and their suspensions. J. Ind. Eng. Chem. 2020, 82, 324–332. [Google Scholar] [CrossRef]
  29. Pursiainen, O.L.J.; Baumberg, J.J.; Winkler, H.; Viel, B.; Spahn, P.; Ruhl, T. Nanoparticle-tuned structural color from polymer opals. Opt. Express 2007, 15, 9553–9561. [Google Scholar] [CrossRef]
  30. Grudinkin, S.A.; Kaplan, S.F.; Kartenko, N.F.; Kurdyukov, D.A.; Golubev, V.G. Opal-Hematite and Opal-Magnetite Films: Lateral Infiltration, Thermodynamically Driven Synthesis, Photonic Crystal Properties. J. Mater. Chem. C 2008, 112, 17855–17861. [Google Scholar] [CrossRef]
  31. Lange, B.; Fleischhaker, F.; Zentel, R. Chemical approach to functional artificial opals. Macromol. Rapid Commun. 2007, 28, 1291–1311. [Google Scholar] [CrossRef]
  32. Manoharan, V.N. Colloidal matter: Packing, geometry, and entropy. Science 2015, 349, 1253751. [Google Scholar] [CrossRef] [PubMed]
  33. Vogel, N.; Retsch, M.; Fustin, C.A.; del Campo, A.; Jonas, U. Advances in Colloidal Assembly: The Design of Structure and Hierarchy in Two and Three Dimensions. Chem. Rev. 2015, 115, 6265–6311. [Google Scholar] [CrossRef]
  34. Wu, M.F.; Zhang, C.Y.; Wei, F.J.; An, H.F.; Wang, X.Q.; Li, D.; Wang, H.Y.; Wen, K.X.; Lin, Q.Y.; Duan, Y.X. A self-assembly based on a hydrogel interface: Facile, rapid, and large-scale preparation of colloidal photonic crystals. Mater. Chem. Front. 2020, 4, 2409–2417. [Google Scholar] [CrossRef]
  35. Marlow, F.; Muldarisnur; Sharifi, P.; Brinkmann, R.; Mendive, C. Opals: Status and Prospects. Angew. Chem. Int. Ed. 2009, 48, 6212–6233. [Google Scholar] [CrossRef]
  36. Diaz-Marin, C.D.; Shetty, R.M.; Cheung, S.; Vaartstra, G.; Gopinath, A.; Wang, E.E. Rational Fabrication of Nano-to-Microsphere Polycrystalline Opals Using Slope Self-Assembly. Langmuir 2021, 37, 12568–12576. [Google Scholar] [CrossRef] [PubMed]
  37. Castaneda-Uribe, O.A.; Mendez-Pinzon, H.A.; Salcedo-Reyes, J.C. Controlling the quality of SiO2 colloidal crystals by temperature ramping on the vertical convective self-assembly method. Opt. Mater. Express 2021, 11, 2686–2699. [Google Scholar] [CrossRef]
  38. Zhang, Y.X.; Quan, M.H.; Zhao, W.D.; Yang, Z.; Wang, D.; Cao, H.; He, W.L. Preferential self-assembly behavior of polydisperse silica particles under negative pressure. Colloids Surf. A 2017, 529, 832–839. [Google Scholar] [CrossRef]
  39. Jose, S.; Joshy, D.; Narendranath, S.B.; Periyat, P. Recent advances in infrared reflective inorganic pigments. Sol. Energy Mater. Sol. Cells 2019, 194, 7–27. [Google Scholar] [CrossRef]
  40. Chen, S.; Cheng, M.; Lang, Y.; Tian, C.; Wei, H.; Wang, C.A. Preparation and characterization of monodispersed spherical Fe2O3@SiO2 reddish pigments with core-shell structure. J. Adv. Ceram. 2019, 8, 39–46. [Google Scholar] [CrossRef]
  41. Shiomi, S.; Kawamori, M.; Yagi, S.; Matsubara, E. One-pot synthesis of silica-coated copper nanoparticles with high chemical and thermal stability. J. Colloid Interface Sci. 2015, 460, 47–54. [Google Scholar] [CrossRef] [PubMed]
  42. Shahabadi, N.; Falsafi, M.; Feizi, F.; Khodarahmi, R. Functionalization of gamma-Fe2O3@SiO2 nanoparticles using the antiviral drug zidovudine: Synthesis, characterization, in vitro cytotoxicity and DNA interaction studies. RSC Adv. 2016, 6, 73605–73616. [Google Scholar] [CrossRef]
  43. Zhang, Y.; Rao, P.; Lu, M.; Zeng, D.Z.; Wu, J.Q. Synthesis and Color Evolution of Silica-Coated Hematite Nanoparticles. J. Am. Ceram. Soc. 2009, 92, 1877–1880. [Google Scholar] [CrossRef]
  44. Obaidullah, M.; Bahadur, N.M.; Furusawa, T.; Sato, M.; Sakuma, H.; Suzuki, N. Microwave assisted rapid synthesis of Fe2O3@SiO2 core-shell nanocomposite for the persistence of magnetic property at high temperature. Colloids Surf. A 2019, 572, 138–146. [Google Scholar] [CrossRef]
  45. Faustini, M.; Grosso, D.; Boissière, C.; Backov, R.; Sanchez, C. “Integrative sol–gel chemistry”: A nanofoundry for materials science. J. Sol-Gel Sci. Technol. 2014, 70, 216–226. [Google Scholar] [CrossRef]
  46. Silva, A.S.; Santos, J.H.Z. Stober method and its nuances over the years. Adv. Colloid Interface Sci. 2023, 314, 102888. [Google Scholar] [CrossRef]
  47. Zhang, Y.; Dong, B.; Chen, A.; Liu, X.; Shi, L.; Zi, J. Using Cuttlefish Ink as an Additive to Produce Non-Iridescent Structural Colors of High Color Visibility. Adv. Mater. 2015, 27, 4719–4724. [Google Scholar] [CrossRef]
  48. Ge, D.; Yang, L.; Wu, G.; Yang, S. Spray Coating of Superhydrophobic and Angle-Independent Coloured Films. Chem. Commun. 2014, 50, 2469–2472. [Google Scholar] [CrossRef] [PubMed]
  49. Liu, Z.; Zhang, Q.; Wang, H.; Li, Y. Structurally Colored Carbon Fibers with Controlled Optical Properties Prepared by a Fast and Continuous Electrophoretic Deposition Method. Nanoscale 2013, 5, 6917–6922. [Google Scholar] [CrossRef]
  50. Fang, Y.; Phillips, B.M.; Askar, K.; Choi, B.; Jiang, P.; Jiang, B. Scalable bottom-up fabrication of colloidal photonic crystals and periodic plasmonic nanostructures. J. Mater. Chem. C 2013, 1, 6031–6047. [Google Scholar] [CrossRef]
  51. Park, J.G.; Kim, S.H.; Magkiriadou, S.; Choi, T.M.; Kim, Y.S.; Manoharan, V.N. Full-Spectrum Photonic Pigments with Non-Iridescent Structural Colors through Colloidal Assembly. Angew. Chem. Int. Ed. 2014, 53, 2899–2903. [Google Scholar] [CrossRef] [PubMed]
  52. Ma, D.; Tuersun, P.; Cheng, L.; Zheng, Y.; Abulaiti, R. PyMieLab_V1.0: A software for calculating the light scattering and absorption of spherical particles. Heliyon 2022, 8, 11469. [Google Scholar] [CrossRef] [PubMed]
  53. Gao, L.; Lemarchand, F.; Lequime, M. Refractive index determination of SiO2 layer in the UV/Vis/NIR range: Spectrophotometric reverse engineering on single and bi-layer designs. J. Eur. Opt. Soc.-Rapid 2013, 8, 13010. [Google Scholar] [CrossRef]
  54. Querry, M.R. Optical Constants, Contractor Report CRDC-CD-85034; U.S. Army: Aberdeen Proving Ground, Maryland, 1985. [Google Scholar]
  55. Metin, C.O.; Lake, L.W.; Miranda, C.R.; Nguyen, Q.P. Stability of aqueous silica nanoparticle dispersions. J. Nanopart. Res. 2010, 13, 839–850. [Google Scholar] [CrossRef]
  56. Demirörs, A.F.; Manne, K.; Magkiriadou, S.; Scheffold, F. Tuning disorder in structurally colored bioinspired photonic glasses. Soft Matter 2024, 20, 1620–1628. [Google Scholar] [CrossRef]
  57. Mokrzycki, W.S.; Tatol, M. Colour difference ∆E—A survey. Mach. Graph. Vis. 2011, 20, 383–411. [Google Scholar]
  58. Vos, W.L.; Sprik, R.; van Blaaderen, A.; Imhof, A.; Lagendijk, A.; Wegdam, G.H. Strong effects of photonic band structures on the diffraction of colloidal crystals. Phys. Rev. B 1996, 53, 16231–16235. [Google Scholar] [CrossRef]
  59. Aguirre, C.I.; Reguera, E.; Stein, A. Tunable Colors in Opals and Inverse Opal Photonic Crystals. Adv. Funct. Mater. 2010, 20, 2565–2578. [Google Scholar] [CrossRef]
  60. Averitt, R.D.; Westcott, S.L.; Halas, N.J. Linear optical properties of gold nanoshells. J. Opt. Soc. Am. B 1999, 16, 1824–1832. [Google Scholar] [CrossRef]
  61. Cakmak, A.O.; Colak, E.; Serebryannikov, A.E. Using Thin Films of Phase-Change Material for Active Tuning of Terahertz Waves Scattering on Dielectric Cylinders. Materials 2024, 17, 260. [Google Scholar] [CrossRef]
  62. Christensen, T.; Jauho, A.P.; Wubs, M.; Mortensen, N.A. Localized plasmons in graphene-coated nanospheres. Phys. Rev. B 2015, 91, 125414. [Google Scholar] [CrossRef]
  63. Goncharenko, A.V.; Venger, E.F.; Chang, Y.C.; Pinchuk, A.O. Arrays of core-shell nanospheres as 3d isotropic broadband ENZ and highly absorbing metamaterials. Opt. Mater. Express 2014, 4, 2310–2322. [Google Scholar] [CrossRef]
  64. Shi, P.; Wang, F.; Zhu, J.F.; Yang, H.B.; Wang, Y.; Fang, Y.; Zhang, B.; Wang, J.H. Amorphous photonic crystals and structural colors in the phase separation glaze. J. Eur. Ceram. Soc. 2018, 38, 2228–2233. [Google Scholar] [CrossRef]
Figure 1. Schematic of procedures to synthesize nanoparticles and opal films: (a) schematic of procedures to synthesize Fe2O3 core–SiO2 shell structure nanoparticles (Fe2O3@SiO2 NPs) (①−③) and SiO2 nanoparticles (SiO2 NPs) (④); (b) schematic of procedures to synthesize SiO2 opal film doped with Fe2O3@SiO2 NPs (⑤, ⑥).
Coatings 15 00646 g001
Figure 2. (a) Digital photograph of as-synthesized SiO2 NP dispersion (a—①), scanning electron microscopy (SEM) image showing the morphology of SiO2 NPs (a—②), and corresponding particle size distribution histogram (a—③). (b) Digital photograph of as-synthesized Fe2O3@SiO2 NP dispersion (b—①), SEM image revealing the core–shell structure of Fe2O3@SiO2 NPs (b—②), and corresponding particle size distribution histogram (b—③). (c) Digital photographs showing the color evolution of mixed dispersions with increasing Fe2O3@SiO2 NP doping ratios in SiO2 NP dispersion (from left to right: 0.35 wt%~2.00 wt%).
Coatings 15 00646 g002
Figure 3. (a) Scanning electron microscopy (SEM) image of Fe2O3 NPs before coating; (b) transmission electron microscopy (TEM) image of Fe2O3@SiO2 NPs after silica coating; (c) high-magnification TEM image of single Fe2O3@SiO2 NP; (d) high-resolution TEM image showing interface structure between SiO2 shell and Fe2O3 core (with d-spacing of 0.13 nm); (e) two-dimensional Fast Fourier Transform (2D-FFT) patterns obtained from Fe2O3 core (Region ③ marked in (d) with red dashed line); (f) 2D-FFT patterns obtained from SiO2 shell (Region ④ marked in (d) with yellow dashed line).
Coatings 15 00646 g003
Figure 4. (a) The EDS elemental spatial distribution mapping images of Fe, Si, and O; (bd) the individual elemental distribution maps of Fe (b), Si (c), and O (d) are presented, respectively.
Coatings 15 00646 g004
Figure 5. (a) X-ray diffraction (XRD) patterns of Fe2O3 NPs (①), SiO2 NPs (②), and Fe2O3@SiO2 NPs(③); (b) XPS survey spectrum of Fe2O3@SiO2 NPs.
Coatings 15 00646 g005
Figure 6. (a) Digital photograph of undoped opal film under sunlight illumination; (b) the corresponding SEM image showing the structural arrangement (red circles: examples of hexagonal close-packed regions); and (c) the 2D-FFT pattern derived from (b). (d) Digital photograph of doped opal film (1.0 wt%) under sunlight illumination; (e) the corresponding SEM image revealing the structural arrangement (red circles: examples of hexagonal close-packed regions); and (f) the 2D-FFT pattern derived from (e).
Coatings 15 00646 g006
Figure 7. (a) Digital photographs of opal films with varying Fe2O3@SiO2 NP doping concentrations under sunlight illumination (from top to bottom: 0 wt%~2.00 wt%). (b) Reflection spectra of opal films with different Fe2O3@SiO2 NP doping concentrations, showing the evolution of the reflection peaks with increasing doping concentrations. The theoretical reflection peak positions for different crystallographic planes are marked for comparison. (c) CIE 1931 chromaticity coordinates calculated from the reflection spectra of opal films, demonstrating the color evolution with increasing Fe2O3@SiO2 NP doping concentrations.
Coatings 15 00646 g007
Figure 8. (a) The simulated absorption (Abs), scattering (Sca), and extinction (Ext) spectra of 225 nm Fe2O3 nanoparticles and Fe2O3@SiO2 nanoparticles; (b,c) the simulated near-field electric field intensity ( E 2 / E 0 2 ) distributions around Fe2O3 nanoparticles (b) and Fe2O3@SiO2 nanoparticles (c) at 650 nm.
Coatings 15 00646 g008
Figure 9. Comparison between nanoparticle optical cross-sections (absorption (Cabs) and backscattering (Cb) for Fe2O3@SiO2 NPs; multiple scattering (CMsca) and backscattering (CMbacksca) for SiO2 NPs) and reflection peak regions of opal films.
Coatings 15 00646 g009
Table 1. Theoretical ranges and main positions of reflection peaks of SiO2 opal films.
Close-Packing Plane
(hkl)
1st-Order Diffraction Peak Range (nm)Main 1st-Order Diffraction Peak Position (nm)2nd-Order Diffraction Peak Range (nm)Main 2nd-Order Diffraction Peak Position (nm)
FCC (111)588.9~712.9650.9294.4~356.4325.4
FCC (100)1020.0~1234.71127.4509.9~617.4563.7
FCC (110)721.2~873.1797.2360.6~436.5398.6
HCP (001)1177.8~1452.71301.8588.9~712.9650.9
HCP (100)624.6~756.1690.4312.3~378.1345.2
HCP (101)551.8~668.0609.9275.9~334.0305.0
HCP (110)360.6~436.5398.6180.3~218.3199.3
HCP (111)344.8~417.4381.1172.4~208.7190.6
SiO2 sphere diameter D = 273 ± 26 nm; volume fraction of SiO2 f SiO 2 = 74%.
Disclaimer/Publisher’s Note: The statements, opinions and data contained in all publications are solely those of the individual author(s) and contributor(s) and not of MDPI and/or the editor(s). MDPI and/or the editor(s) disclaim responsibility for any injury to people or property resulting from any ideas, methods, instructions or products referred to in the content.

