3.2. Analysis of Microstructures
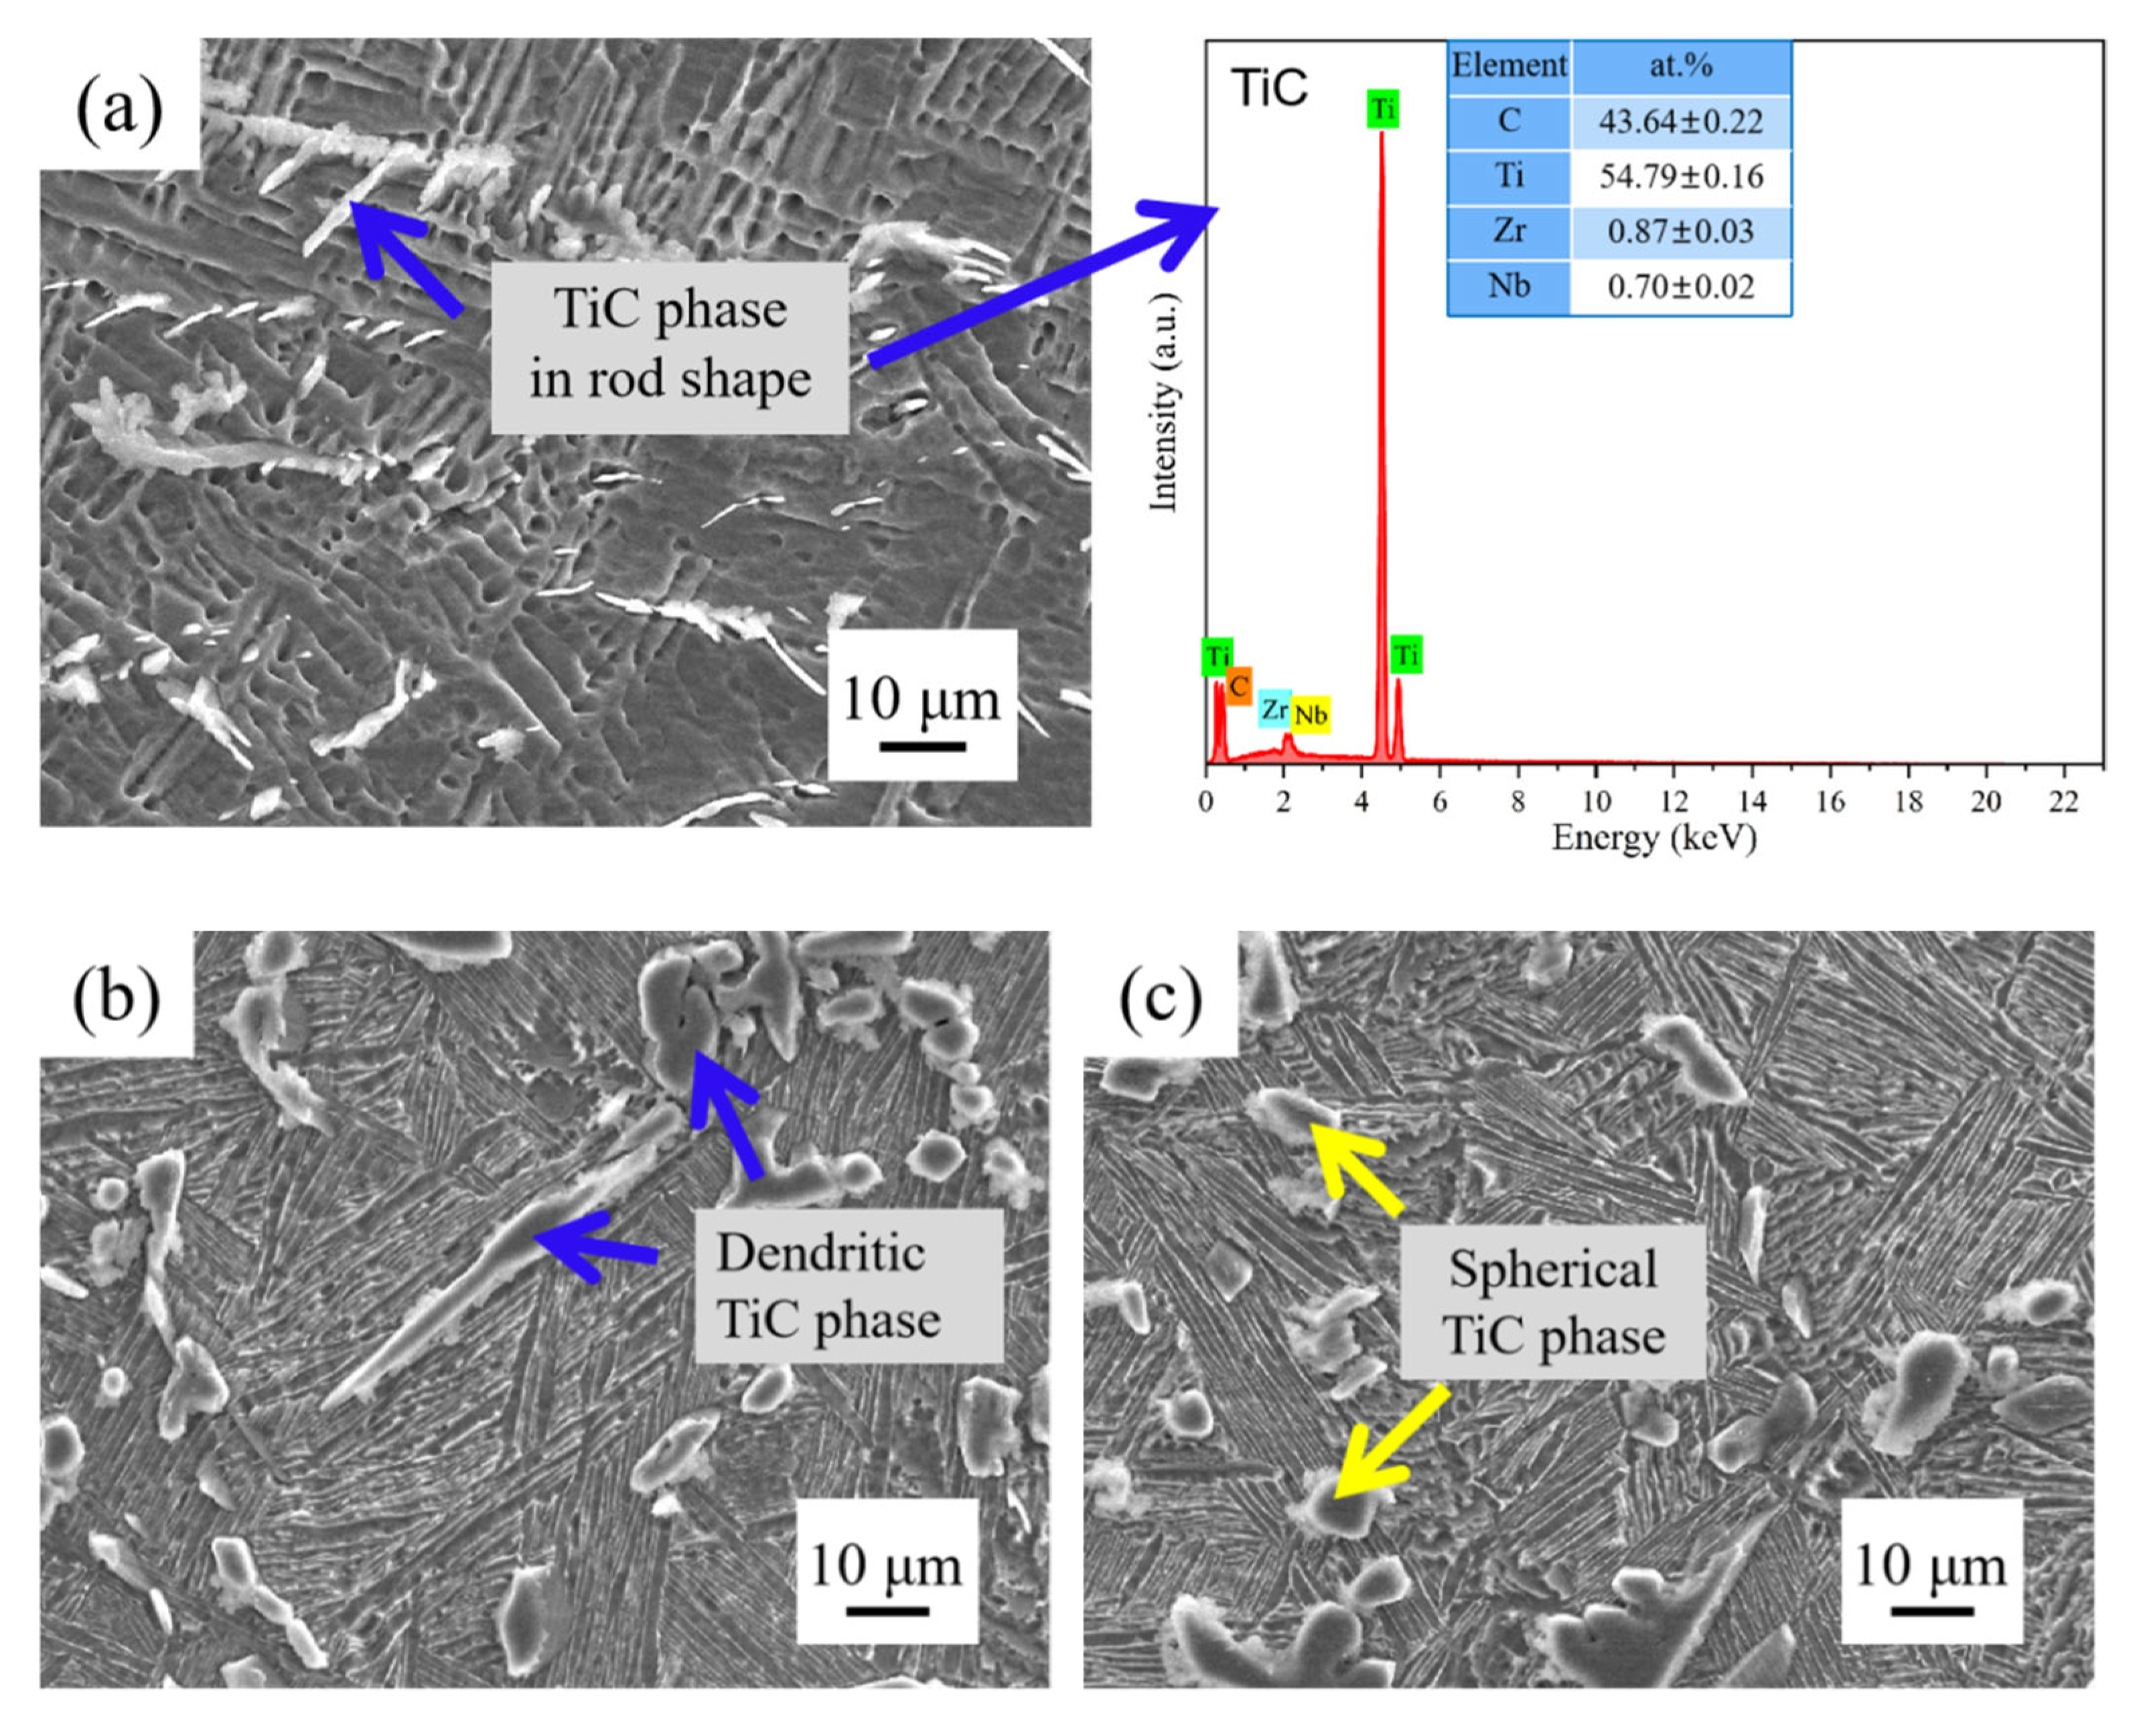
Figure 4 presents the microstructural morphologies of the composites with different niobium carbide (NbC) additions. It can be observed that the TiC phase exhibits diverse morphological characteristics in the composites and undergoes significant changes with the variation in the NbC addition. In TMC1 (0 wt% NbC), it exists in the form of eutectic titanium carbide, manifesting as fine particles or short rods, which are dispersedly distributed along the grain boundaries and between lamellae, with a relatively sparse quantity. This is attributed to the limited content of C atoms in the system and the lack of NbC to facilitate its formation.
When the NbC addition is increased to 3 wt% (TMC2), needle-like microstructures and a small amount of ellipsoidal granular TiC emerge, with enhanced regularity and an increased quantity due to the additional C elements brought by the NbC introduction. In TMC3 (6 wt% NbC), the TiC is mostly granular or approximately spherical, uniformly distributed and arranged in an orderly way at the grain boundaries, and its quantity is further increased, optimizing the distribution state. However, in TMC4 (9 wt% NbC), the TiC aggregates massively, appearing as dendrites or coarse rods with obvious agglomeration. Although the quantity increases, the excessive aggregation leads to a deteriorated uniformity of distribution.
Simultaneously, in conjunction with
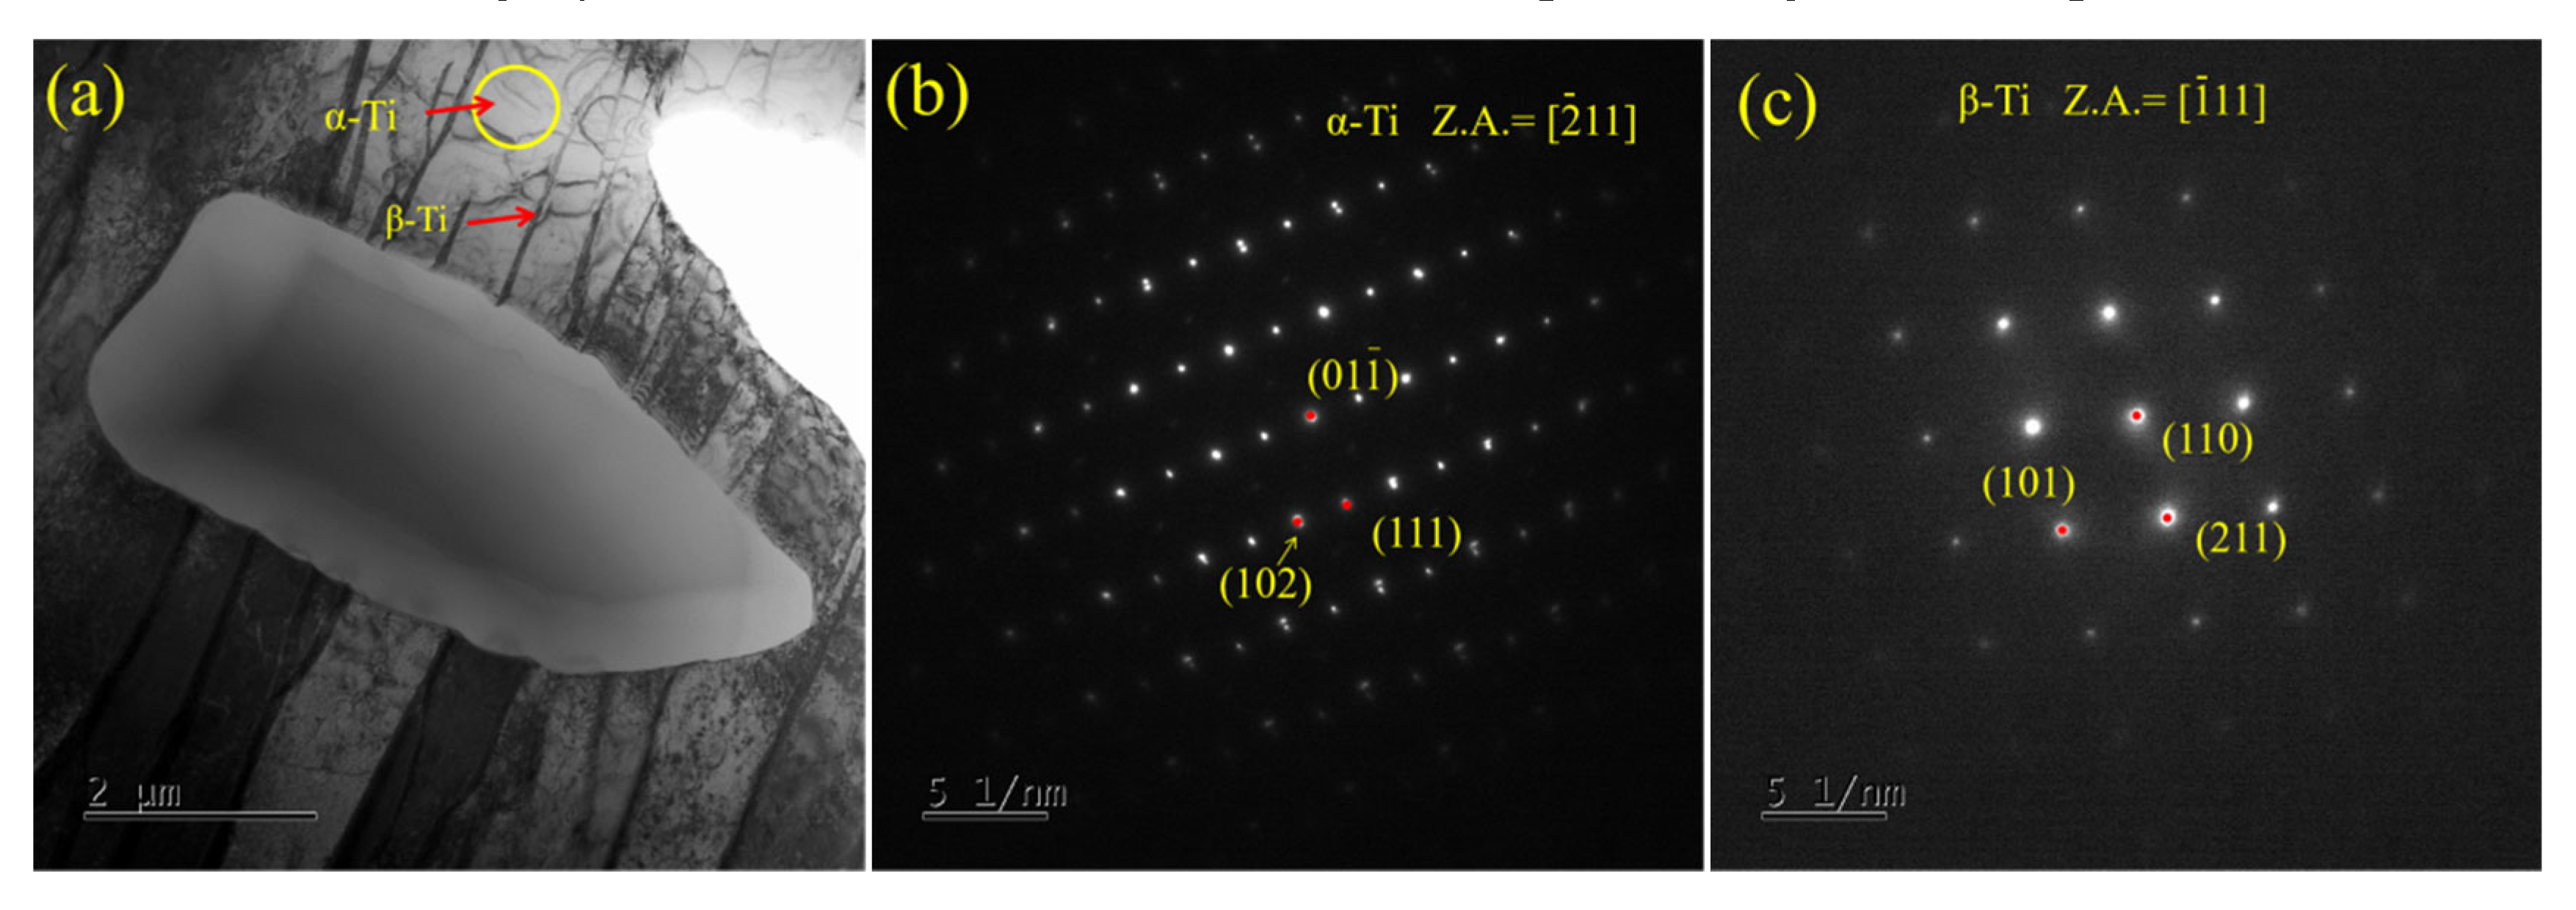
Figure 5, it is observed that the α-Ti phase in the composites is mainly in the form of lamellar particles (α′ phase), and its characteristics change with the amount of the NbC addition. In TMC1, the α′ phase is in the form of white-contrast lamellae with prominent bundling characteristics. The lamellar width is 5.7 ± 0.3 μm, and the bundle size reaches 23.5 μm. The lamellae within the same bundle are parallel, and this structure dominates in the matrix.
When the NbC addition increases to 3 wt% (TMC2), the width of the lamellar α′ phase narrows, the bundle size decreases, and the angle between the different bundles of the α′ phase changes to 60° or 120°, while the lamellae within the same bundle remain parallel. The quantity of the α-Ti phase decreases because NbC promotes the transformation of the α-Ti phase to the β-Ti phase.
In TMC3, the α-Ti phase is affected by the TiC phase and exhibits a specific distribution around and at the grain boundaries. Its lamellar characteristics are locally deformed, and the quantity continues to decrease due to the further stabilization and increase in the β-Ti phase.
When the NbC content reaches 9 wt% (TMC4), the lamellar structure of the α-Ti phase is damaged, and the distribution becomes disordered. It coexists with a large amount of the aggregated TiC phase and an increased β-Ti phase. The quantity of the α-Ti phase decreases significantly, and most of it is transformed into the β-Ti phase. The diffraction pattern calibration of the light gray area in the TEM determines it as the α-Ti phase, which helps to clarify its properties in different states.
Studies have shown that the morphology, distribution, and quantity of the β-Ti phase in the composites change significantly with the NbC addition amount, which has a profound impact on the material properties. In TMC1, the β-Ti phase is distributed along the lamellae, presenting a black contrast and a linear arrangement. It is mainly located between the bundles of the α′ phase, with a relatively small quantity, laying the foundation for the initial microstructure of the material.
When the NbC addition amount increases to 3 wt% (TMC2), the β-Ti phase is distributed between the lamellae and constitutes the matrix together with the lamellae and the needle-like α′ phase. The quantity increases due to the solid solution stabilization effect of NbC, optimizing the matrix structure.
In TMC3, the β-Ti phase is uniformly distributed and intertwined with the α-Ti phase and TiC phase. The quantity increases stably, and it cooperates with other phases to optimize the material properties, forming a stable matrix structure.
When the NbC content reaches 9 wt% (TMC4), the β-Ti phase exists in a large amount, but there is a tendency of segregation around the TiC particles. Although the quantity increases significantly, the overall performance of the material is weakened due to the non-uniformity of the microstructure. The β-Ti phase is determined by the dark gray area in the TEM characterization, providing microscopic evidence for its existence.
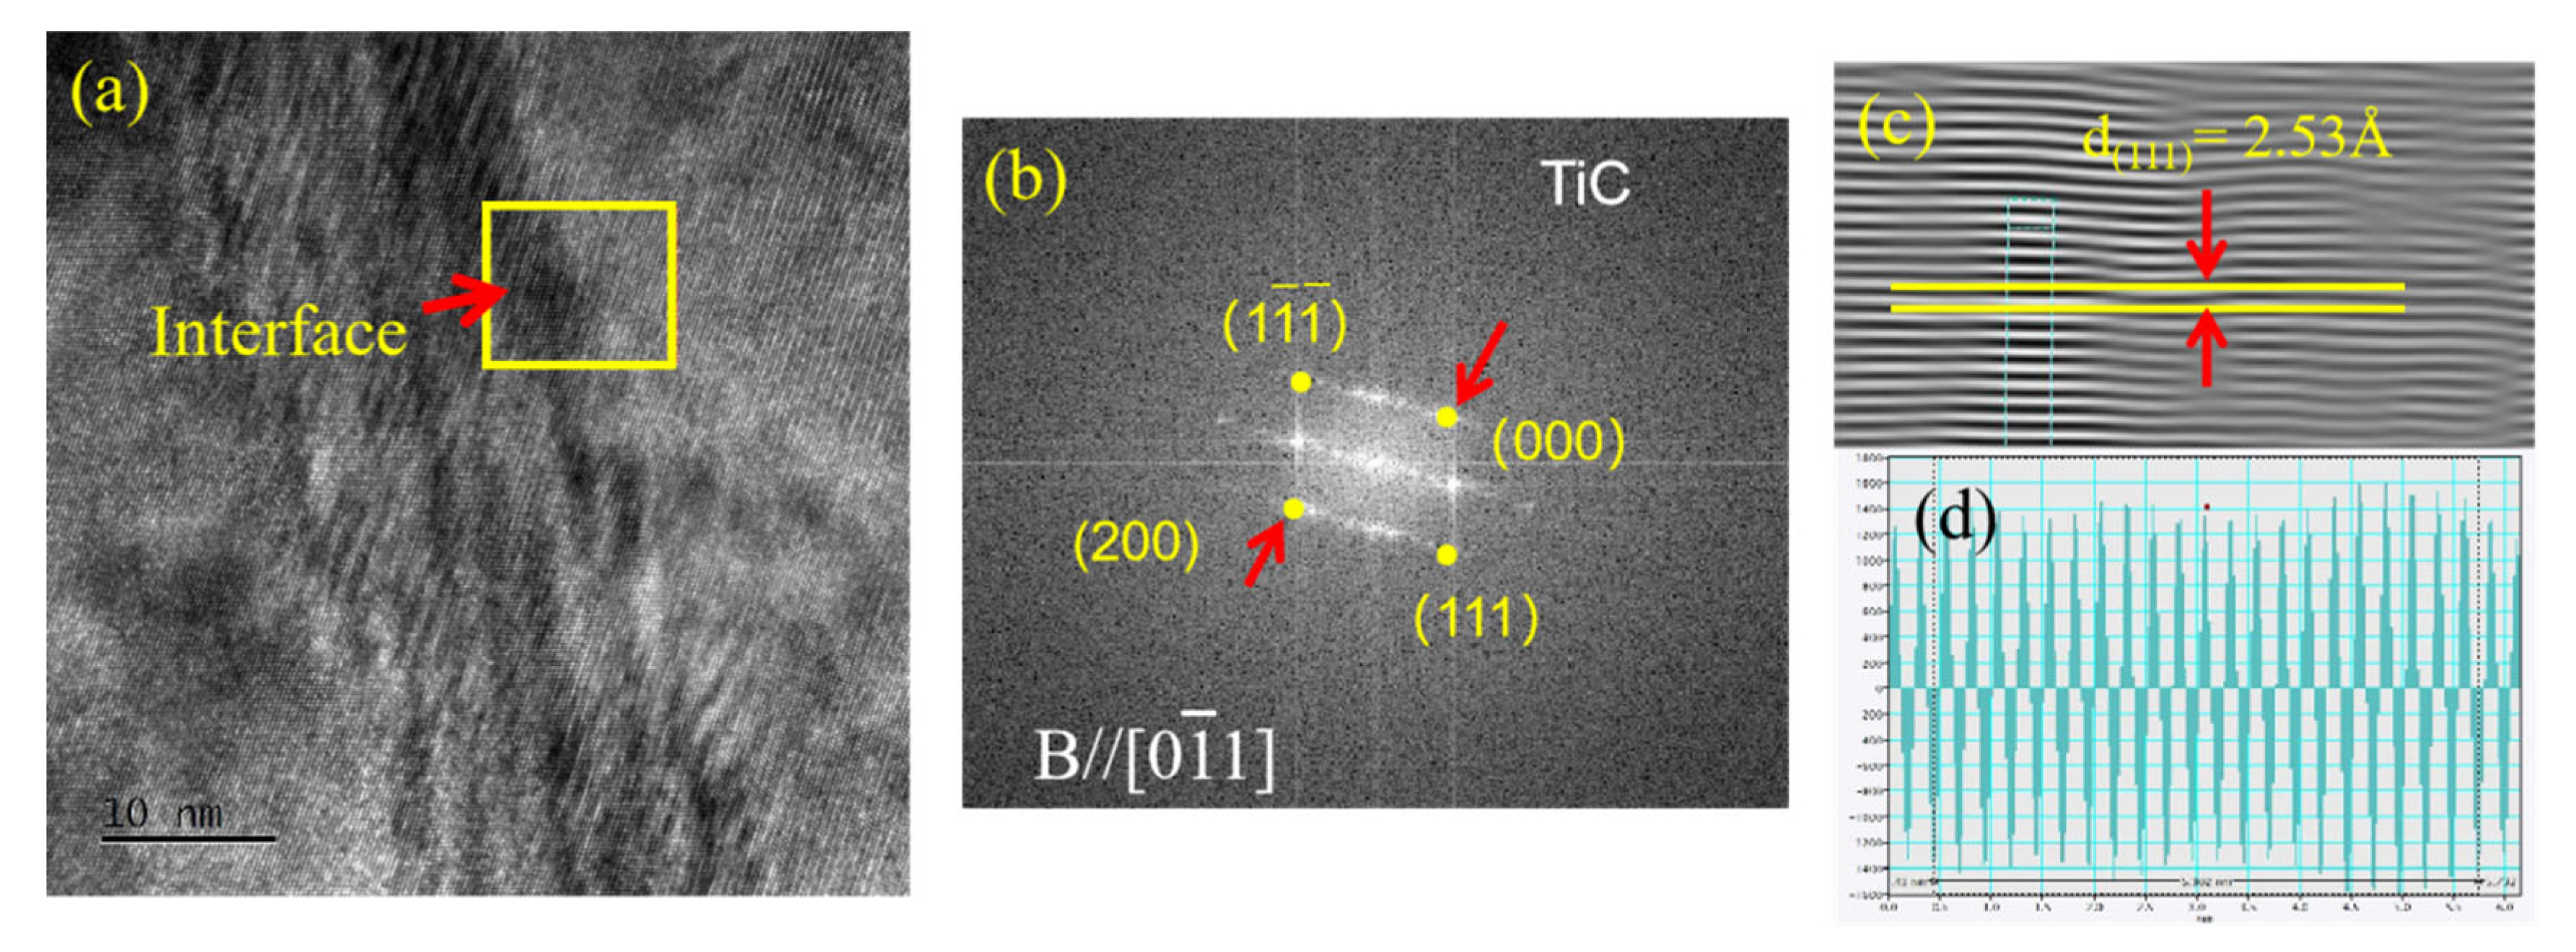
Upon examining
Figure 6, the microstructural highlights of the in situ autogenous composites emerge. This precise and efficient process prevents unwanted intermediate phases. High-resolution microscopy shows a clean interface with only the titanium matrix and titanium carbide, free of impurities.
Such an interface benefits composites. It enables smooth stress transfer, avoiding concentration, and allows uniform stress distribution under loads, enhancing mechanical strength. Also, the simple two-phase interface stabilizes the microstructure, preventing disorder and ensuring integrity, supporting excellent performance in harsh conditions.
3.4. Compressive Property Characterization
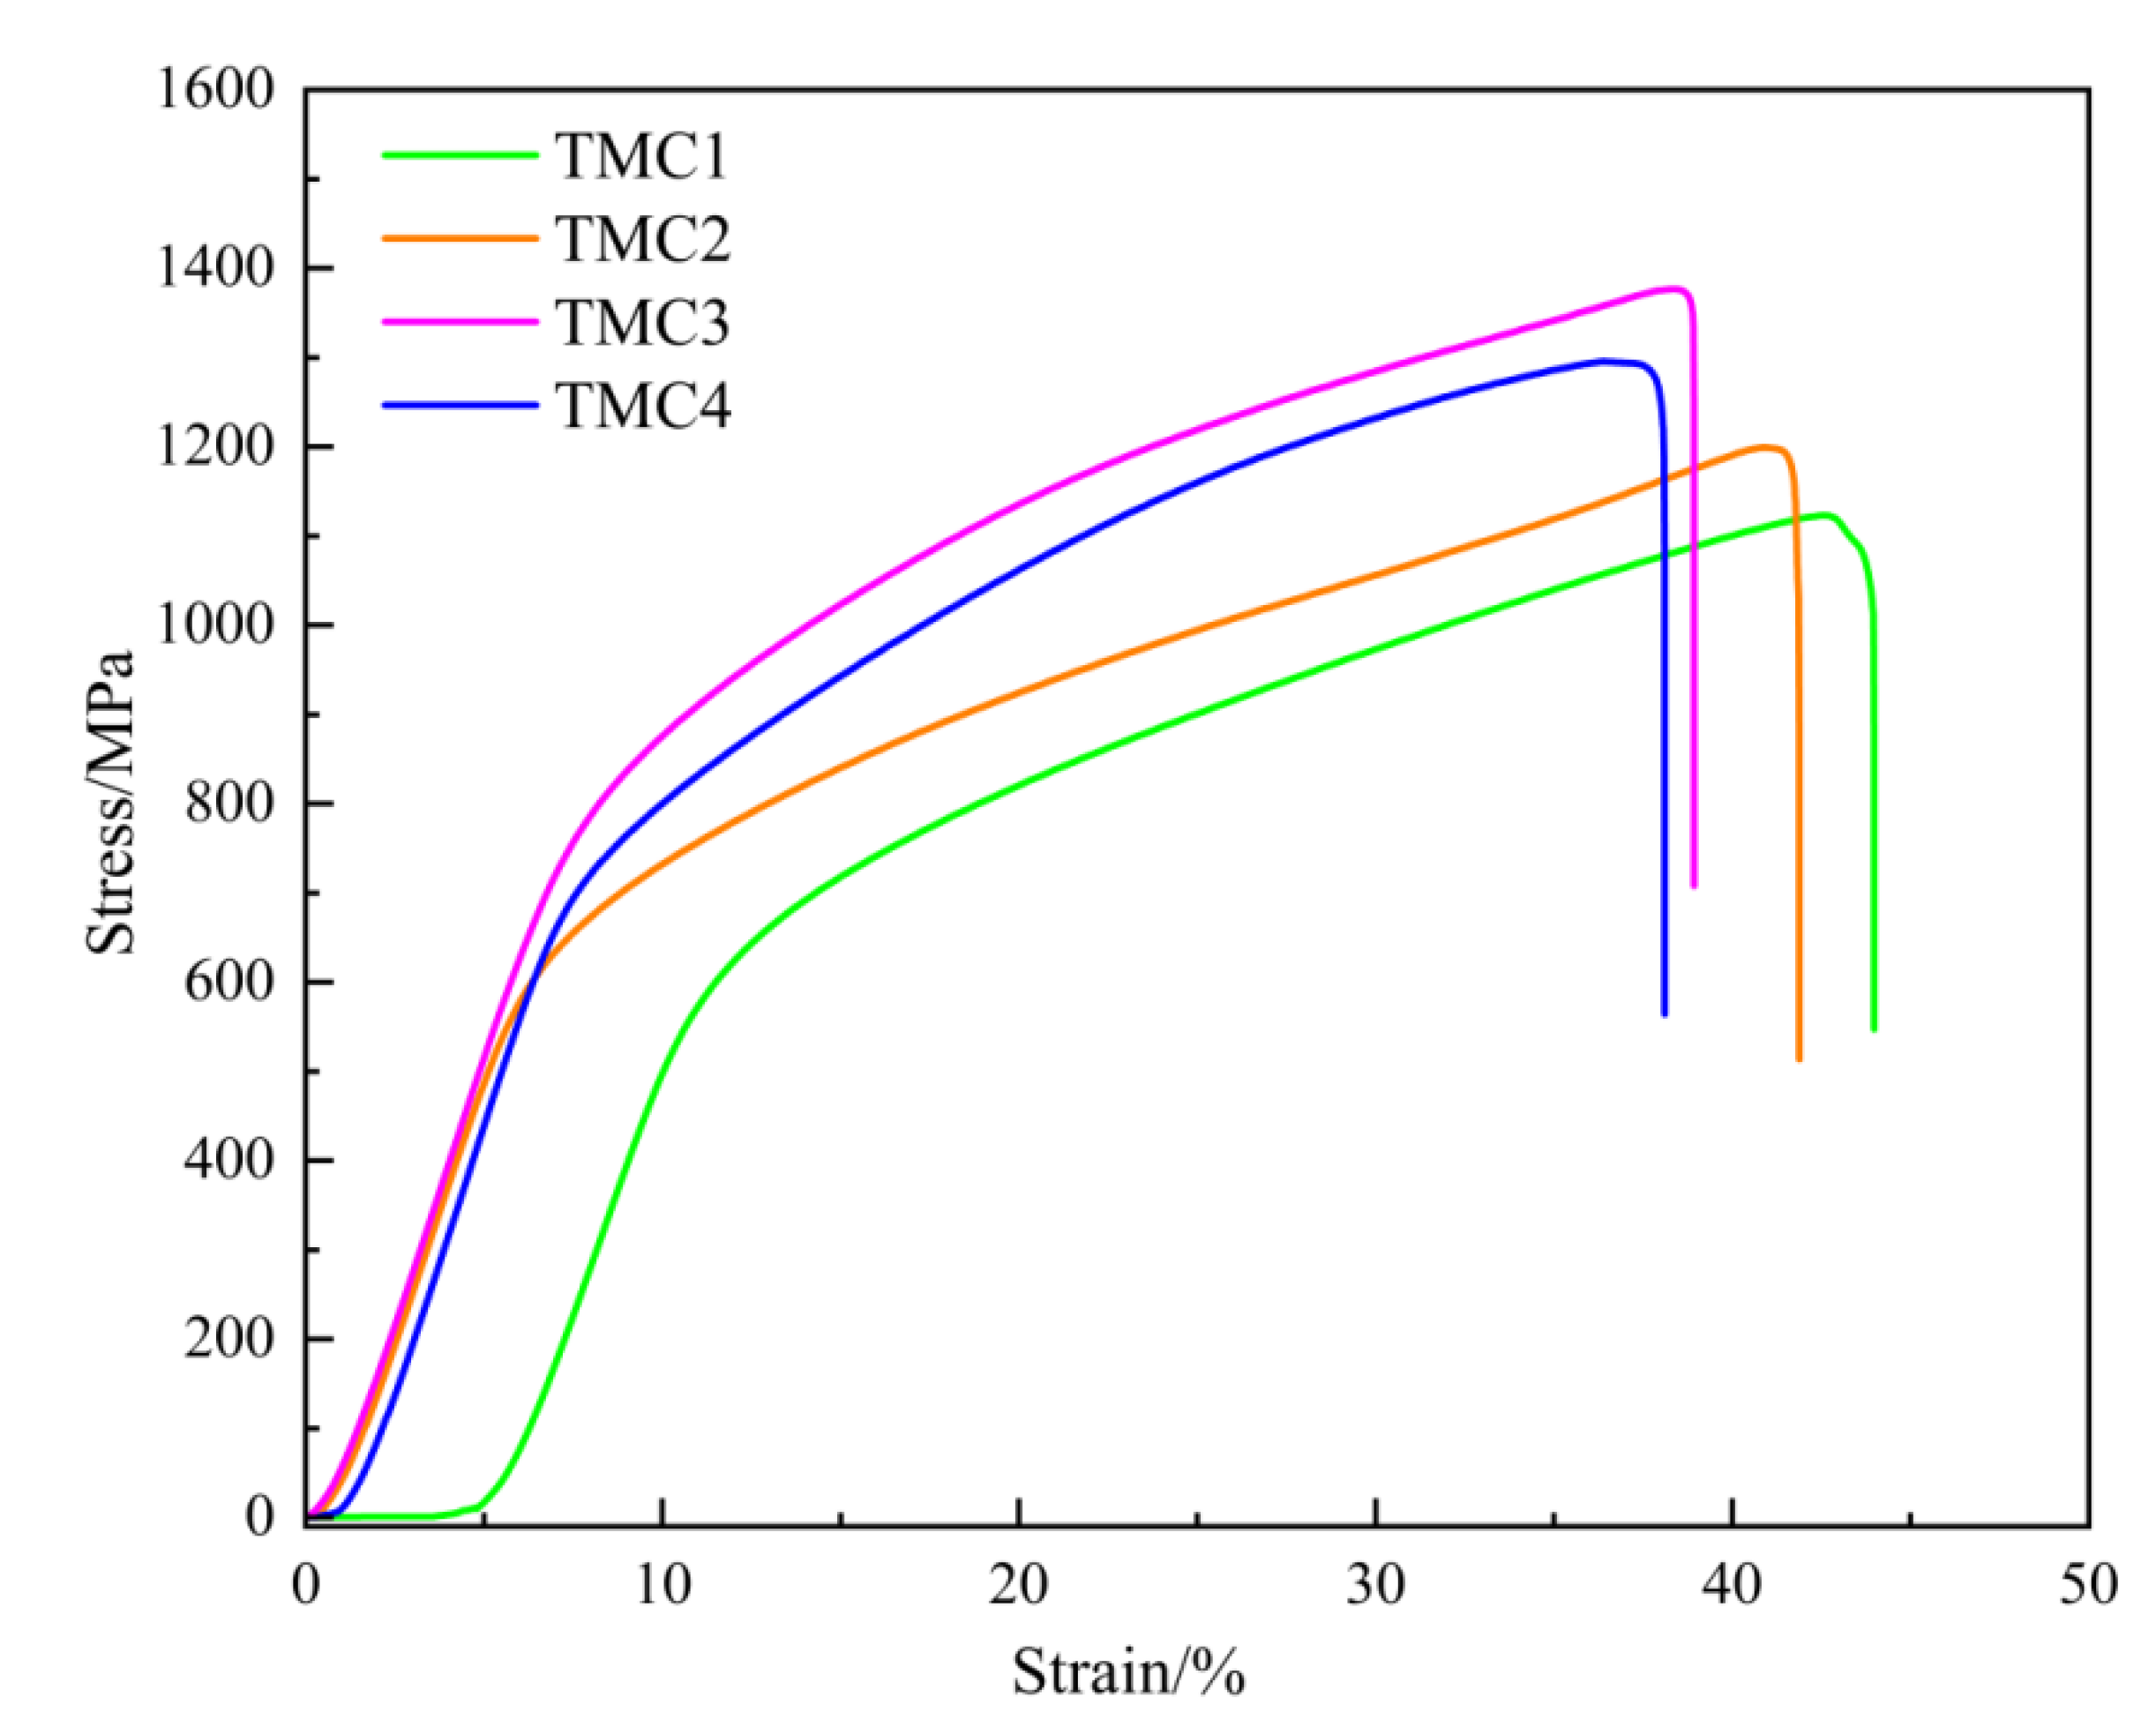
The compressive stress–strain curves of the TMC1–4 composites with different NbC additions shown in
Figure 8 are the key basis for in-depth analysis of the compressive characteristics of the materials. They can clearly reveal the variation law of stress with strain during the compression process and accurately explore the internal relationship between the compressive strength and the microstructure of the composites, providing core clues for understanding the evolution mechanism of material properties.
In general, as the NbC addition amount gradually increases from 0 wt%, the compressive strength of the composites shows a trend of first increasing and then decreasing, reaching the maximum value at TMC3 (with 6 wt% NbC addition). This variation trend is closely related to the evolution of the material’s microstructure and is the result of the synergistic effect of multiple factors. The following is a detailed analysis of each composite.
For TMC1, its compressive strength is relatively low. In TMC1, the TiC phase is sparse and dispersedly distributed. From the perspective of microstructure, this distribution state makes the ability of the TiC phase to impede dislocation movement limited during the compression process. According to the dislocation theory, when dislocations slip in the matrix, the TiC phase makes it difficult to effectively prevent their movement because dislocations can relatively easily bypass or pass through the sparse TiC phase particles, making the material prone to deformation and having an insignificant effect on enhancing the compressive strength. At the same time, the α-Ti phase dominates, but its lamellar structure has poor deformation coordination during compression, making it difficult to effectively relieve local stress concentration. The β-Ti phase has a low content and is poorly distributed, unable to fully play the role of bearing load. The synergistic effect of the two phases on enhancing the compressive strength is not significant, resulting in a relatively low overall compressive strength of the material.
The compressive strength of TMC2 is higher than that of TMC1. At this time, the TiC phase becomes finer, denser, and more uniformly distributed, which to some extent hinders dislocation movement. When dislocations move and encounter the finer and uniformly distributed TiC phase, they need to consume more energy to bypass or pass through the particles, thus enhancing the material’s resistance to deformation and having a positive impact on the compressive strength. However, the homogeneity of the microstructure is still affected to a certain extent, limiting the full reinforcing effect of the TiC phase. The relative content of the α-Ti lamellar phase increases slightly, and its combined effect with the refined TiC phase increases the compressive strength. However, the distribution of the α-Ti phase and the β-Ti phase is not ideal, resulting in a relatively small increase in strength.
TMC3 exhibits a relatively high compressive strength, which is attributed to the synergistic optimization of multiple factors. In TMC3, the TiC phase exhibits an ideal state of further refinement, uniform distribution, and close combination with the matrix, forming an effective strengthening network. During the compression process, the dislocation movement is strongly hindered by the TiC phase. According to the dislocation theory, when dislocations encounter TiC phase particles, they need to consume additional energy to bypass or pass through them. Let the dislocation movement resistance be τ and the increased resistance caused by the TiC phase particles be , and then the actual dislocation movement resistance becomes , significantly increasing the resistance to dislocation slip and thus improving the yield strength and compressive strength.
At the same time, the proportion and distribution of the α-Ti and β-Ti phases reach an almost optimal synergistic state. The plastic deformation ability of the α-Ti phase is fully utilized. When a local stress concentration occurs, it absorbs and disperses the stress through its own plastic deformation, preventing the stress concentration area from expanding rapidly. The β-Ti phase also gives full play to its load-bearing capacity and bears the external compressive load together with α-Ti phase. This synergistic effect enables the material to maintain a good stress balance when stressed, and the stress transfer between the phases is more uniform and efficient, further improving the overall compressive strength of the material.
In addition, the solid solution strengthening effect of the Zr and Nb elements on the matrix is significantly enhanced. These elements dissolve in the matrix, causing lattice distortion. According to the solid solution strengthening theory, lattice distortion increases the resistance to dislocation movement. Let the increased resistance to dislocation movement caused by lattice distortion be , and then when dislocations move in the matrix containing Zr and Nb elements, the total resistance becomes τ + . This solid solution strengthening effect further improves the strength and stability of the matrix, providing additional support for the material during the compression process and contributing to the improvement in compressive strength. In summary, the ideal distribution of the TiC phase, the synergistic optimization of the α-Ti and β-Ti phases, and the solid solution strengthening effect of the Zr and Nb elements in TMC3 jointly contribute to the maximum compressive strength, achieving a good balance between the strength and the plasticity of the material and providing an important reference basis for the design and application of high-performance composites.
The compressive strength of TMC4 is significantly lower than that of TMC3. In TMC4, the TiC phase severely agglomerates, forming local stress concentration regions. During compression, these agglomerated regions become the source of crack initiation and propagation, leading to the premature failure of the material and a significant reduction in compressive strength. The distribution of matrix elements is uneven, and the distribution of the α-Ti phase and the β-Ti phase is disturbed, losing their good synergistic effect and making them unable to effectively transfer and disperse stress. Although the solid solution strengthening of the Zr and Nb elements may be enhanced, the deterioration of the microstructure weakens its positive impact on the compressive strength, resulting in a decline in the overall compressive performance.
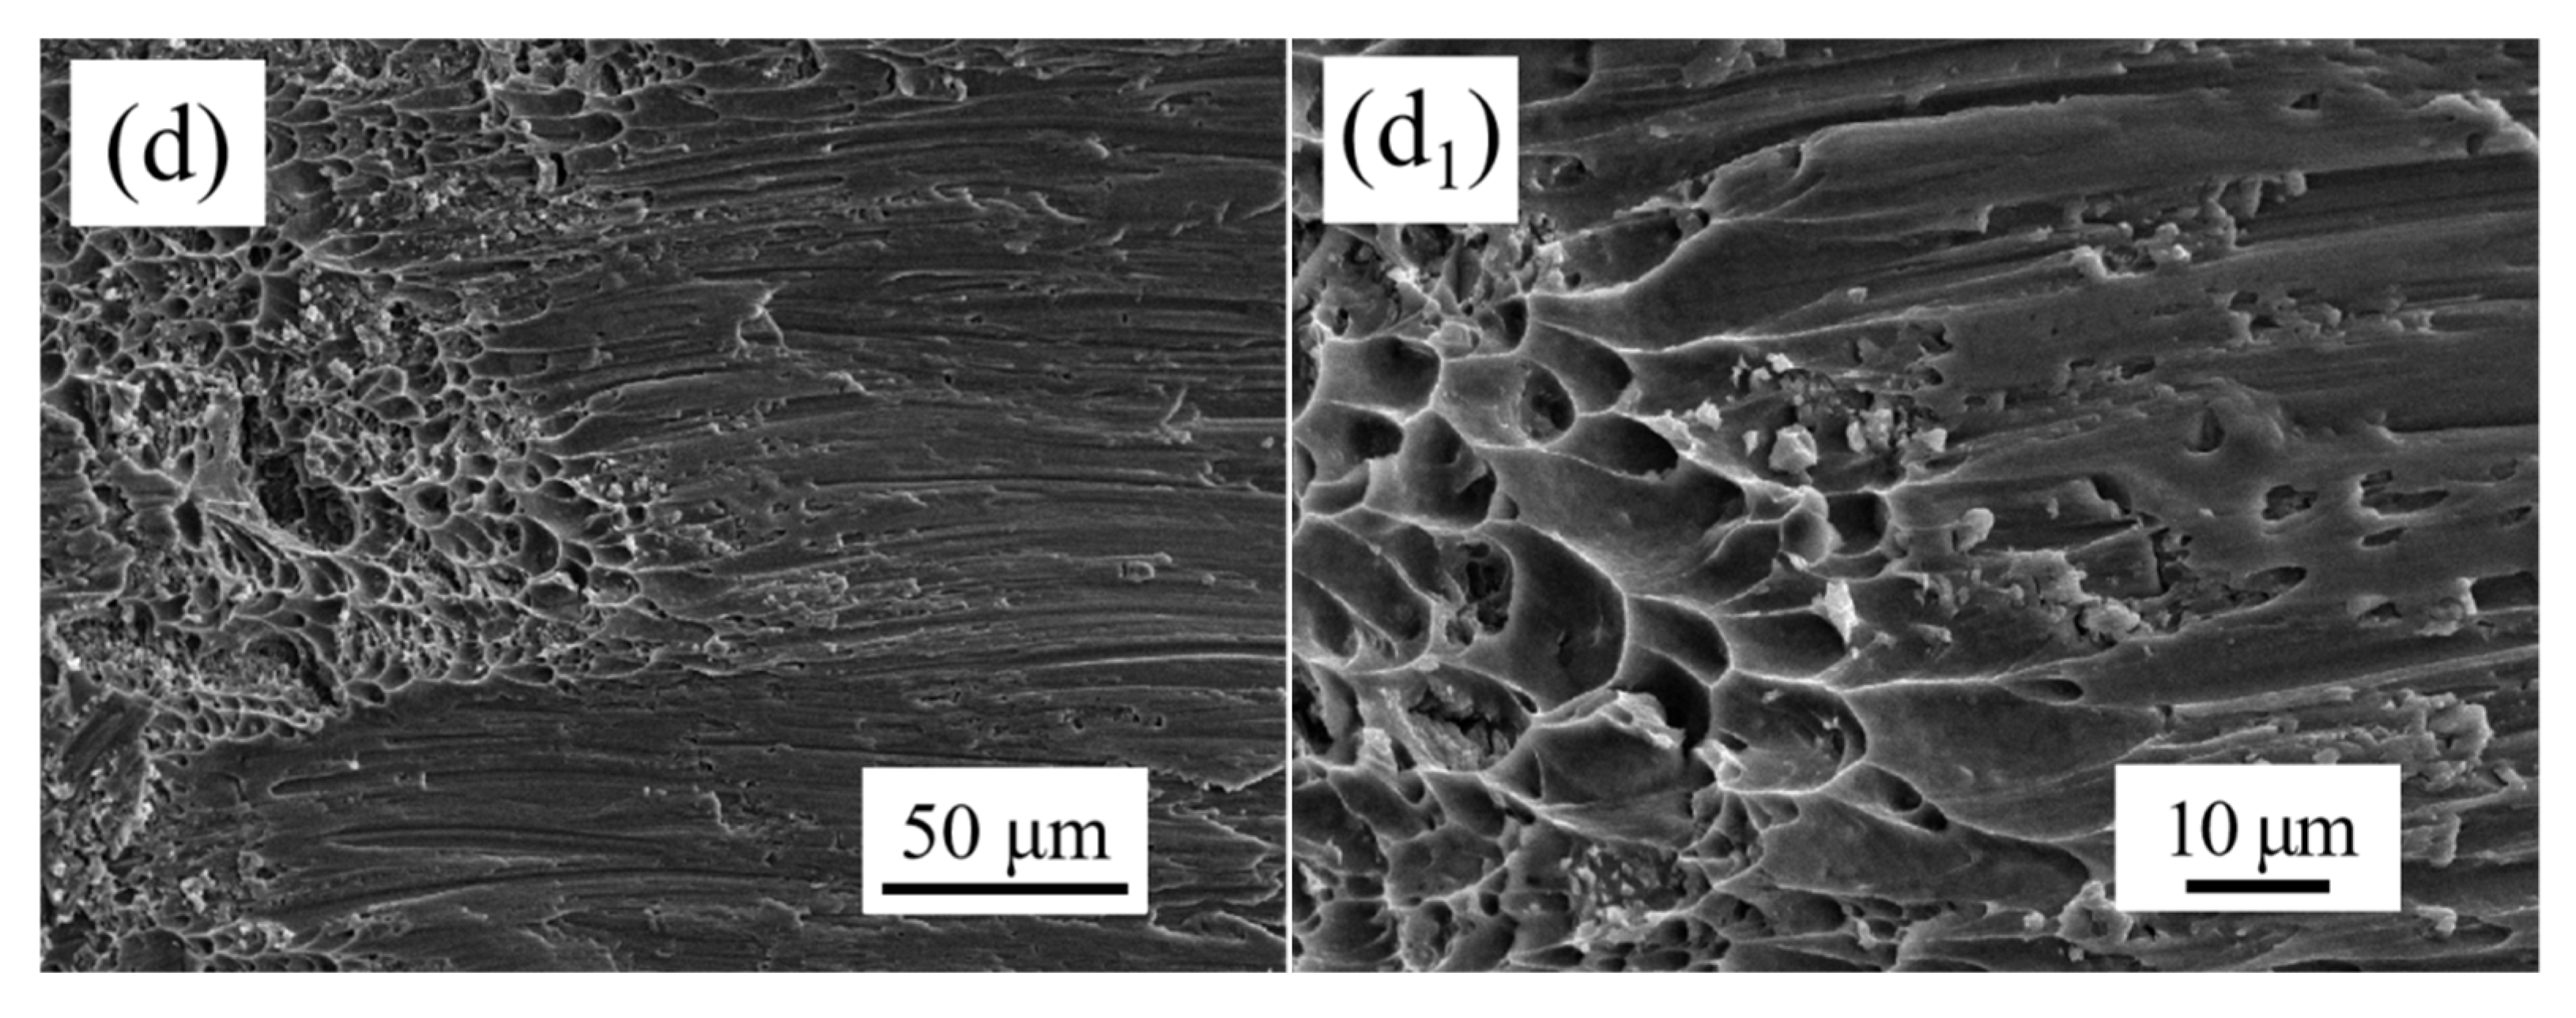
3.5. Fracture Morphology Analysis of TMCs
Figure 9 shows the compression fracture morphology of the composites with different amounts of NbC. The compression fracture of TMC1 (
Figure 9a,a
1) is very flat, with no macro features of plastic deformation, showing typical brittle fracture. Microscopically, the TiC phase is sparse and coarse, the α-Ti phase is dominant and has a simple structure, and the β-Ti phase is sparse, which results in the low compression strength of the material and makes it brittle and easy to fracture.
When NbC reaches 3 wt% (
Figure 9b,b
1), the fracture is now slightly undulating and uneven, with a few signs of plastic deformation, small tear ribs, and similar tough nest features, but the brittle fracture is still dominant. This indicates that the plastic deformation ability of the material is beginning to improve but is still weak. Microscopically, the Zr element contributes to a finer and more uniform distribution of the TiC phase, an adjustment of the ratio of the α-Ti and β-Ti phases, a slight increase in the content of the β-Ti phase, and a clearer phase interface. This leads to the increase in dislocation motion resistance and the initial synergy between the α-Ti and β-Ti phases; the plastic deformation is limited, but the compressive strength is improved compared with TMC1, and the fracture characteristics are in line with the trend of strength change.
The compression fracture of TMC3 (
Figure 9c,c
1) shows significant toughness fracture characteristics, and the toughness nest characteristics indicate that the full plastic deformation absorbs energy to improve toughness. Microscopically, the TiC phase is utilized, the α-Ti and β-Ti phases are synergistic, and the Zr and Nb elements are solid solution strengthened and structurally stable. The advantages of each phase are brought into play, the dislocations are hindered, the plastic deformation is strong, the strength and plasticity are balanced, and the ultimate compressive strength reaches 1379.50 mPa, which provides a basis for the design of high-performance composites.
The macroscopic fracture of TMC4 (
Figure 9d,d
1) shows a mixed fracture mode, with both brittle and plastic characteristics, and the plastic deformation ability is weaker than that of TMC3. At the microscopic level, the TiC phase is severely agglomerated, the distribution of matrix elements is uneven, and the structural stability of the α-Ti and β-Ti phases is damaged, which leads to cracks caused by the stress concentration and the reduction in strength.
Overall, when the NbC content increases from 0 wt% to 6 wt%, the fracture of TMC1–TMC3 changes from brittle to ductile, which is related to the utilization of the microstructure and the increase in the strength, and when the NbC increases to 9 wt%, the plastic deformation ability of TMC4 decreases due to the deterioration of the microstructure, and the compression property decreases significantly, which highlights the key influence of microstructure on the properties of composites, and provides an important basis for the design of high-performance composite materials.
3.6. Analysis Based on Crystal Growth Kinetics and Thermodynamics: Effect of NbC Addition on TiC Morphology and Compression Properties of Composites
- (1)
Basic theory of kinetics and thermodynamics of crystal growth
In the field of materials science, crystal growth is driven by both kinetics and thermodynamics. From the thermodynamic point of view, the driving force of crystal growth originates from the reduction in free energy of the system; in order for the Ti–C system to form the TiC phase, according to the Gibbs free energy change formula −T ( for enthalpy change, T for temperature, for entropy change), the growth is thermodynamically favorable when < 0. Kinetically, the crystal growth rate v is related to a number of factors and is commonly expressed as v = k (k is the rate constant; n depends on the growth mechanism).
- (2)
Effect of NbC addition on the morphology of titanium carbide
At 0 wt% NbC, the TiC phase is dispersed in the form of fine particles or short rods at the grain boundaries and in the interlayers, and its quantity is scarce. Thermodynamically, the C-atoms in the system are limited, which restricts the generation of the TiC phases. Kinetically, the C-atom supply rate is low, which is similar to the TiC growth and consumption rate at equilibrium, but the low makes the growth driving force small; the growth is slow, and the formation of small-sized TiC phases makes it difficult to impede the dislocation motion, and the enhancement of the compressive strength is not obvious.
At 3 wt% NbC, acicular and a small amount of ellipsoidal granular TiC appear with increased regularity and quantity. The introduction of more C elements into NbC thermodynamically shifts the reaction Ti + C ⇌ TiC to the right, increasing the amount of TiC produced. Kinetically, there is a relative increase in the C-atom supply rate (), and an increase in the growth drive, . Assuming a multiplicative increase in the C element concentration of x, for the new growth rate n, the growth rate is accelerated. During the crystal growth process, due to anisotropy, the TiC phase grows faster in certain directions, resulting in the formation of needle-like structures, while a small amount of ellipsoidal granular TiC is formed in some regions. This morphological change allows the TiC phase to hinder dislocation motion to a certain extent, which enhances the deformation resistance of the material and thus positively affects the compressive strength, but the microstructural homogeneity is still affected to a certain extent, so the TiC phase enhances the compressive strength. However, due to the uniformity of the microstructure, the enhancement effect of the TiC phase is not fully utilized and the strength enhancement is relatively small.
At 6 wt% NbC, the TiC is mostly granular or nearly spherical, uniformly distributed and ordered at the grain boundaries, further increasing in number and distribution. The thermodynamic equilibrium leads to a balanced growth trend of the TiC phase, which is characterized by the low surface energy of the morphology according to the principle of minimum surface energy. Kinetically, the appropriate supply of C atoms and the growth driving force lead to uniform growth, and the interfacial energy is in the right range for stable growth. This TiC phase effectively hinders the dislocation motion during compression, and works well with the matrix to achieve a balance between strength and plasticity and the best compression performance.
With 9 wt% NbC, the TiC phase aggregates in large quantities, showing dendrites or thick rods and obvious agglomerations, increasing in quantity but with poor distribution uniformity. Thermodynamically, the excessive NbC makes the C concentration too high, and the local chemical potential is high to promote TiC overgrowth and agglomeration. Kinetically, the high C concentration makes the growth drive force too large and the growth rate too fast. According to the diffusion-controlled growth model, the fast diffusion of C atoms leads to the rapid growth of the TiC phase into a specific shape. The agglomerated TiC phase becomes a source of cracks during compression, leading to the premature failure of the material. Despite solid solution strengthening, microstructural deterioration diminishes the positive effect on compressive strength, resulting in a reduction in overall properties.
- (3)
Effect of NbC incorporation on compression properties of composites
The morphology of the TiC phase is closely related to the dislocation motion. For example, at 0 wt% NbC, the finely dispersed TiC phase makes it difficult to hinder dislocations, and the dislocations are easy to bypass or pass through, and the material is easily deformed; at 6 wt% NbC, the uniformly distributed granular TiC phase can effectively hinder the dislocations, and improve the yield and compression strength.
TiC phase morphology also affects stress transfer. Ideally (at 6 wt% NbC), the TiC phase disperses stress uniformly and is tightly bonded to the matrix, with the phases working together to bear the load; at 9 wt% NbC, the agglomerated TiC phase leads to stress concentration, and the matrix and reinforcing phases work together to fail, which reduces the compressive properties.
3.7. ANSYS Finite Element Analysis Results and Discussion
Combined with the above results, when the addition of zirconium carbide is 6 wt%, the microstructure distribution of the composites is more uniform and the compression performance is optimal. Further, the compressive properties of TMC1–4 were simulated and calculated by ANSYS simulation software, and the results are shown in
Figure 10.
Figure 10 shows the total deformation simulation results (mapped to equivalent plastic strain, EPS) of TMC1–TMC4. For TMC1 (0 wt% NbC), the internal deformation is uneven, with a large strain range (1.048 × 10
−⁵ Max–8.1429 × 10
−¹⁰ Min), coefficient of variation (CV) = 0.35, and 35% of the area exhibiting high strain (>1.5× the mean). This correlates with its inhomogeneous microstructure (sparse TiC,
Figure 4a) and low compressive strength (
Figure 8).
For TMC2 (3 wt% NbC), the deformation homogeneity improves, with a reduced strain range (1.0369 × 10
−⁵ Max–1.3005 × 10
−⁹ Min), CV = 0.22, and 22% high-strain area. This aligns with its moderate microstructure refinement (needle-like TiC,
Figure 4b) and intermediate compressive performance.
For TMC3 (6 wt% NbC), the simulation shows a uniform color distribution dominated by blue-green tones (EPS values concentrated in the lower range), with a strain range of 1.0202 × 10⁻⁵–1.2321 × 10⁻⁹, CV = 0.12, and only 12% high-strain area. This indicates homogeneous deformation during loading, directly reflecting the optimized microstructure (uniform granular TiC,
Figure 1) and efficient stress dispersion, consistent with its peak compressive strength (1379.50 MPa,
Figure 8).
For TMC4 (9 wt% NbC), severe strain localization occurs, with a strain range of 1.0021 × 10
−⁵–1.4371 × 10
−⁹, CV = 0.28, and 28% high-strain area, attributed to the TiC agglomeration (
Figure 4d) and compromised stress transfer, leading to degraded mechanical properties. Overall, the ANSYS simulation results correlate closely with the experimental observations, particularly the uniform deformation in TMC3, which validates the microstructural optimization and provides a theoretical basis for high-performance titanium matrix composite design.
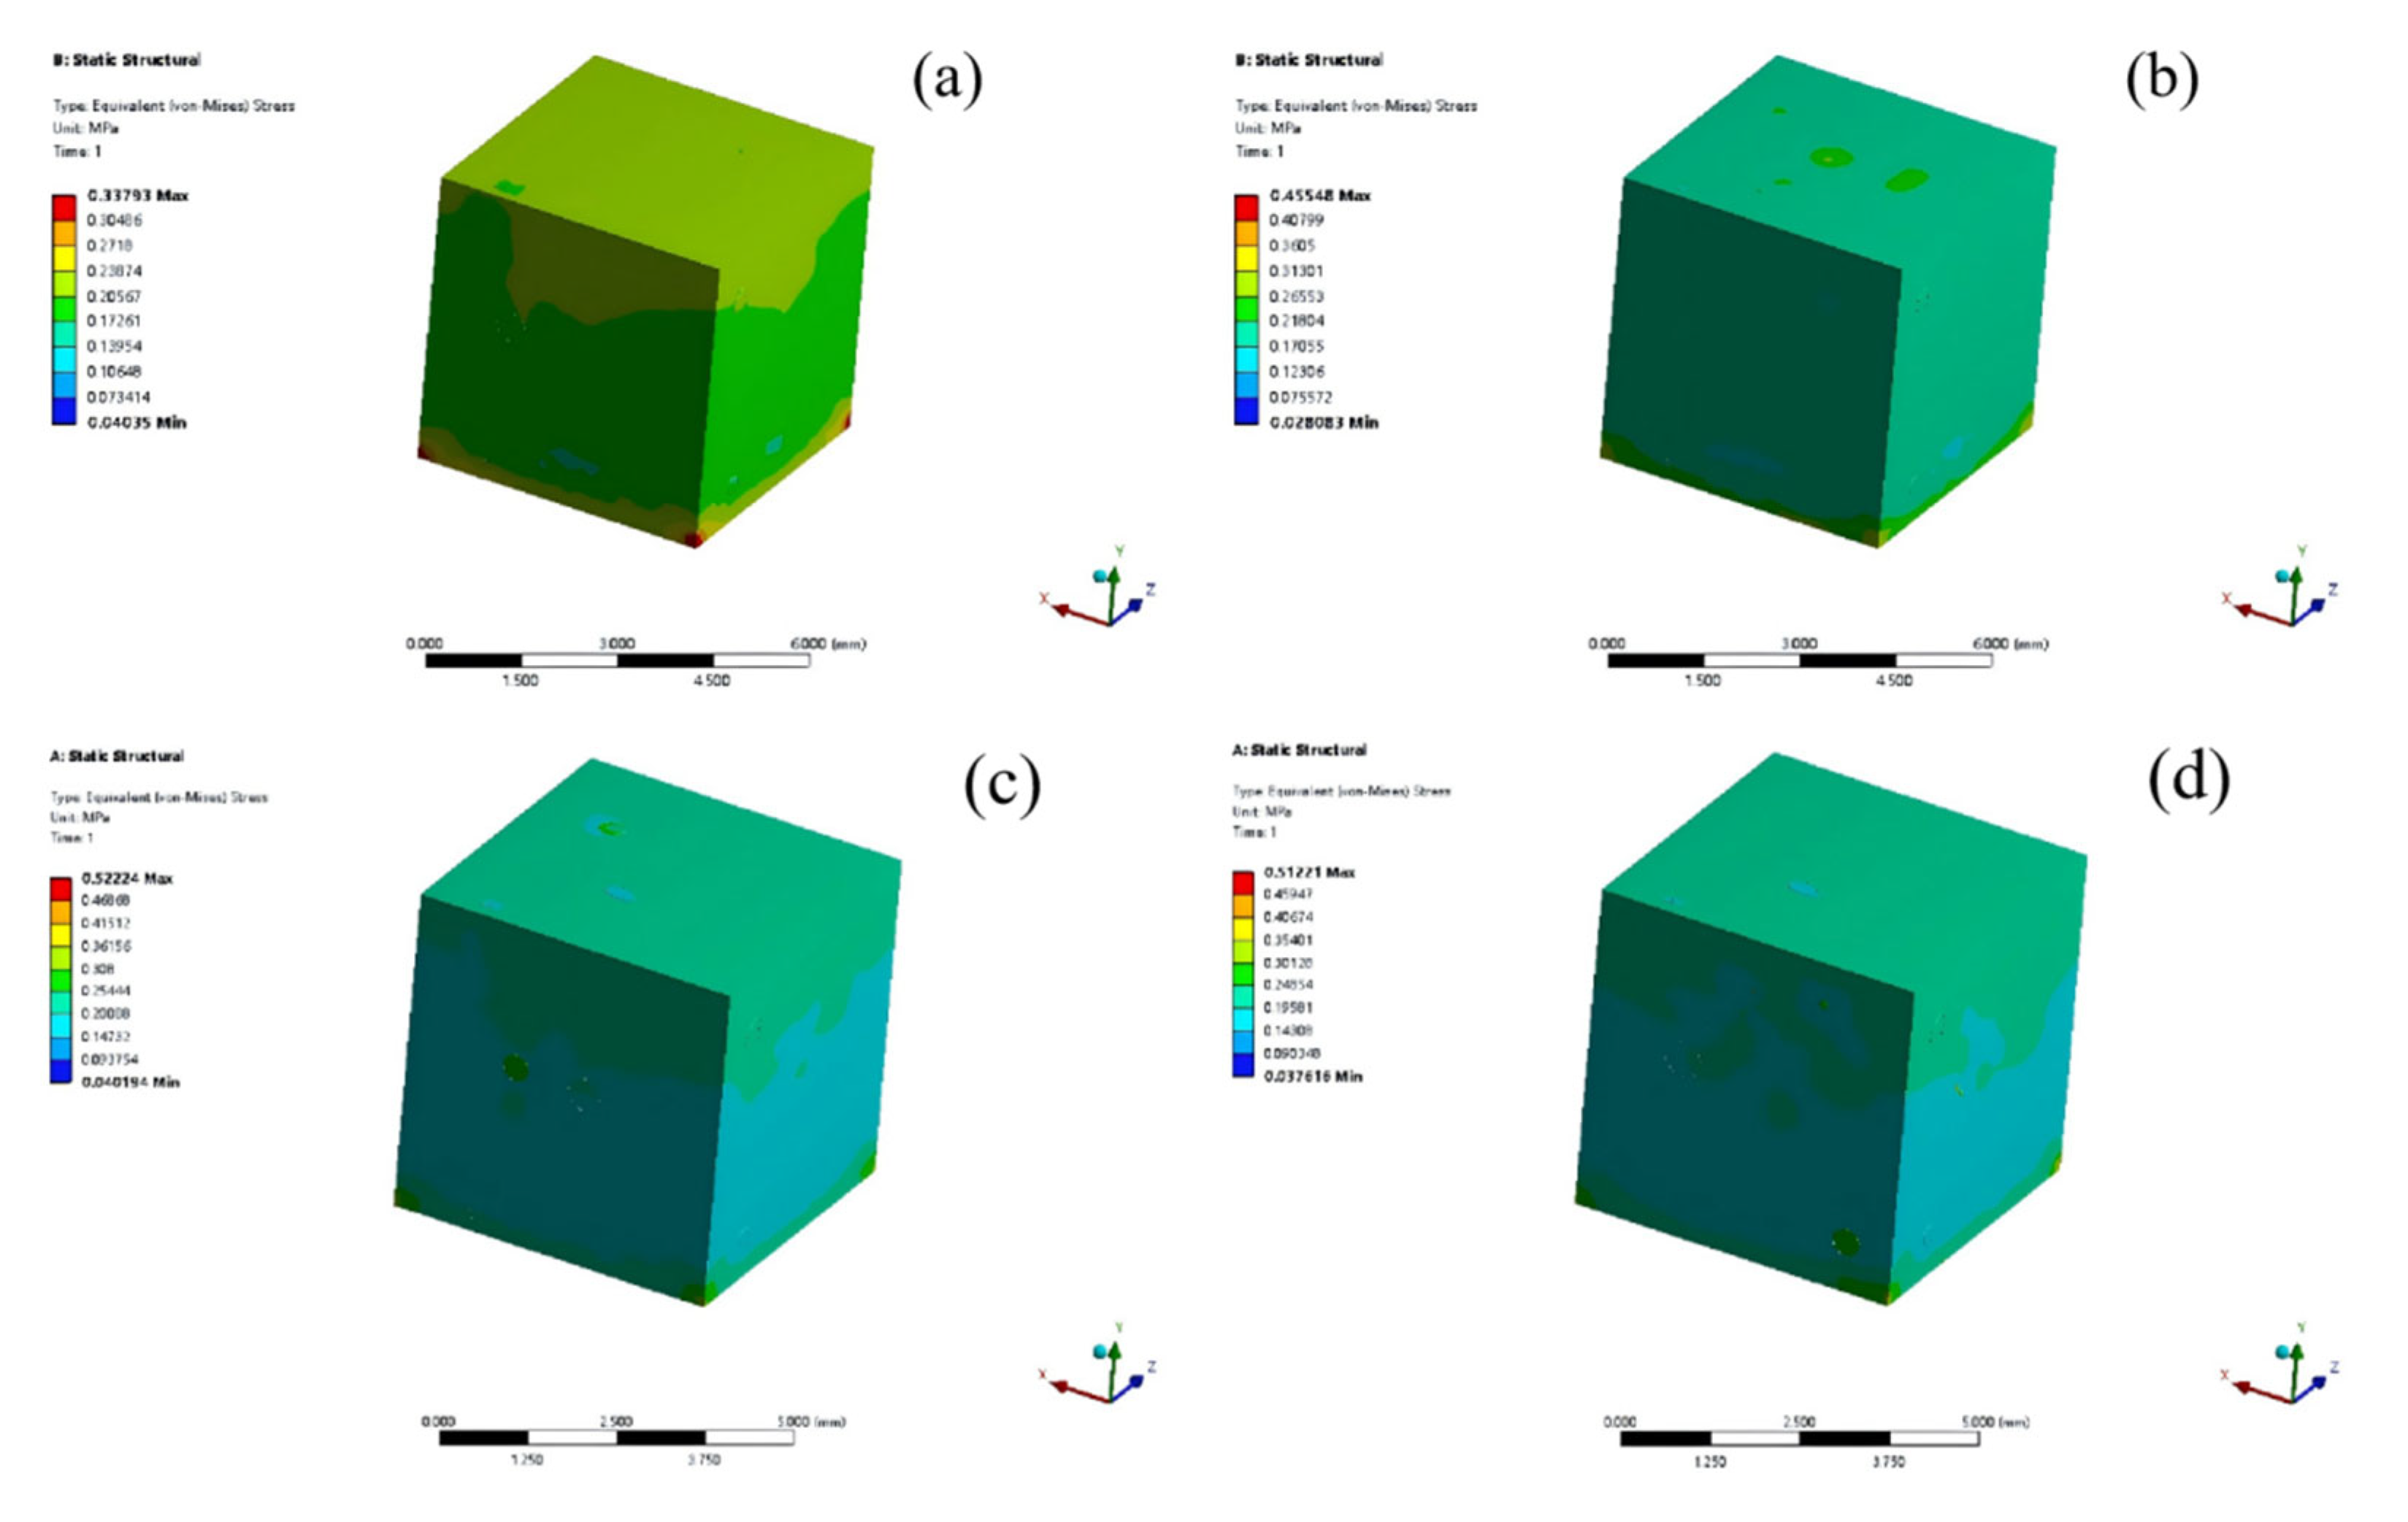
Equivalent stress maps with total deformation simulations (
Figure 11,
Figure 12 and
Figure 13) were performed for TMC1 (0 wt% NbC). Stress distribution simulations (
Figure 11a and
Figure 13a) show extreme inhomogeneity, with discrete stress values and obvious stress concentration areas at the macroscopic level. Microscopically, the TiC phase is small and diffuse (
Figure 3), and the stress component
(i, j = 1, 2, 3) varies drastically. According to the stress concentration factor equation Kt =
(where
is the maximum stress and
is the nominal stress), the value
is larger in the stress concentration region. This is because the TiC phase makes it difficult to disperse the stress. From the crystallographic point of view, the dispersion of the TiC phase leads to relatively weak interfacial bonding with the matrix, and when subjected to external loads, the stress cannot be effectively transferred between the matrix and the reinforcing phases through the interface, which results in the concentration of stress in the local area.
Analyzed from dislocation theory, dislocations move relatively easily under this stress distribution. According to the dislocation motion resistance formula (where is the shear stress required for dislocation motion, is the lattice friction, is a constant, G is the shear modulus, b is the Berthold vector, and is the density of dislocations), in the region of stress concentration, dislocations are easy to gather and slip in the region of lower stress due to the unevenness of the stresses, resulting in the material being easily deformed, with an enhancement of the compressive strength The effect is not obvious.
The simulation of the deformation characteristics of TMC1 (
Figure 12a) shows that the total deformation is inhomogeneous, with a maximum deformation of 1.0786 e
−5 Max (assuming that the minimum value is close to 0). In terms of the relationship between microstructure and deformation, the dislocations can slip relatively easily in the matrix during compression due to the diffuse TiC phase, which is small in size and unevenly distributed according to the crystal growth kinetics analyzed earlier. Let the dislocation slip distance be
x. According to the equation of deformation caused by dislocation slip,
(where
is the strain and
L is the crystal length), the dislocations can easily slip, which makes the material easily deformed under a small stress. At the same time, the α-Ti phase-dominated lamellar structure cannot coordinate the deformation effectively during the deformation process, which further exacerbates the inhomogeneity of the local deformation, leading to the material being unable to disperse the energy effectively through uniform deformation when subjected to compressive load, thus reducing the compressive property of the material.
For TMC2, the simulation results of stress distribution are analyzed as shown in
Figure 11b and
Figure 13b. It can be seen that the stress distribution of TMC2 is improved compared with that of TMC1, but it is still not uniform, and the change in color gradient in the stress cloud shows that the stress value varies at different locations. The addition of NbC optimizes the TiC phase, but the uniformity of the microstructure is not good. From the stress transfer theory, the stress transfer efficiency at the interface of the matrix-reinforced phase is
=
(where
is the stress in the TiC phase and
is the stress in the matrix), and the value of
in the stress concentration area is not ideal because the distribution of the α-Ti and β-Ti phases is not ideal, and the interaction of the three is not optimized, which makes the local deformation easy to be enlarged when subjected to external load, and this affects the overall performance.
Moreover, combined with the simulation results of the deformation characteristics of TMC2 (
Figure 12b), it can be seen that the maximum deformation of TMC2 is 1.0766 e
−5 Max, and the deformation homogeneity is improved but still uneven. The TiC phase increases the dislocation motion resistance, and according to the equation of the dislocation motion resistance,
, where
is the shear stress required for dislocation motion,
is the lattice friction,
is a constant,
G is the shear modulus,
b is the Bergner vector, and
ρ is the dislocation density, at which time the resistance to dislocation motion increases. However, the distribution of the α-Ti and β-Ti phases is not ideal, which leads to uneven dislocation motion resistance. Setting the dislocation motion resistance in different regions as
and
(
), the different dislocation slip rates make the deformation degree of different parts of the material different, and the coordination of the overall deformation should be improved, which restricts the enhancement of the compression performance.
When the addition of NbC is 6 wt% (TMC3), the simulation results of stress distribution (
Figure 11c and
Figure 13c) show that the stress distribution of TMC3 is highly uniform, and the color of the stress cloud is uniform without any sudden change. This is due to the fact that the TiC phase is refined, uniformly distributed, and tightly bonded with the matrix (
Figure 3), and the interfacial bonding energy formula
= (
is the interface;
A is the interfacial area) shows that a good interfacial bonding ensures that the stresses are effectively transferred and dispersed. Meanwhile, the ratio and distribution of the α-Ti and β-Ti phases are nearly optimal, the plastic deformation of α-Ti relieves the stress concentration, the load-bearing capacity of β-Ti is utilized, and the solid solution strengthening of Zr and Nb strengthens the substrate, which balances the stresses and achieves a uniform distribution of the stresses when the material is subjected to stresses.
Meanwhile, the simulation results of TMC3 show that the maximum deformation of TMC3 is 1.0737 e
−5 Max, which is uniformly distributed, and the deformation is consistent in all regions during loading (
Figure 12c). According to the theory of dislocation motion, the uniform TiC phase makes the average free range of dislocations smaller, which strongly prevents dislocation slip. The α-Ti and β-Ti phases are well coordinated with each other, so the coordination of plastic deformation is excellent. From the energy absorption point of view, according to the plastic deformation energy formula
= dV (
is plastic strain), the material absorbs energy uniformly and achieves a perfect balance between strength and plasticity, which demonstrates excellent compression performance.
Further analysis of the stress distribution simulation results (
Figure 11d and
Figure 13d) shows that the stress distribution of TMC4 is seriously uneven, with significant local stress concentration areas and large color differences in the stress maps. Microscopically, the TiC phase is seriously agglomerated and poorly bonded with the matrix (
Figure 3). According to the stress concentration theory, the agglomeration results in a large stress gradient, which makes it difficult for the stress to be transmitted uniformly by destroying the interfacial bonding. The uneven distribution of matrix elements aggravates the disorder, and the structural stability of the α-Ti and β-Ti phases is impaired, which interferes with their stress-transferring and dispersing roles. Although Zr, Nb has solid solution strengthening, the microstructure deterioration weakened its role, and the stress concentration is prone to cracking, so that the mechanical properties decreases significantly.
At the same time, from the simulation results of the deformation characteristics of TMC4 (
Figure 12d), the following can be seen: the maximum deformation of TMC4 is nearly 1.0737 e
−5 Max, the distribution is very uneven, and the local deformation is concentrated, which is related to the uneven distribution of stress. The deformation in the stress concentration area is far more than in other areas. The TiC agglomeration and matrix destruction make the dislocation motion resistance extremely uneven; the dislocation motion resistance around the agglomerate is set, and the dislocation motion resistance away from the agglomerate is set to be
(
), and the dislocations easily pile up around the agglomerate and lead to the concentration of stress to cause the local deformation to be too large. The α-Ti and β-Ti phases have disordered distribution and cannot work together to resist deformation, exacerbating the inhomogeneity, and the material is subjected to small loads, and thus the material has a high deformation rate. The disordered distribution of the α-Ti and β-Ti phases cannot resist deformation in a synergistic way, which increases the inhomogeneity, and the material may fail locally under a small load, and the overall compressive property decreases drastically, which makes it not able to meet the actual demand.
Comparing the ANSYS simulation and the experimental data (
Figure 8 and
Figure 9), the two are in high agreement, e.g., the simulated and the experimental stress, strain, and fracture characteristics of TMC3 at 6 wt% NbC are consistent. This verifies the accuracy of the simulation method, shows that the model and parameters can reflect the mechanical behavior, confirms the correctness of the analysis of the influence mechanism of NbC content, and provides a theoretical basis for the optimization of material design. The simulation results reveal the influence mechanism, and the agreement with the experiment verifies its reliability, which helps aerospace and other fields to precisely regulate the material properties and promote the development of high-performance titanium matrix composites.


