The results obtained from the different tests carried out on the coatings under analysis are presented below.
3.1. Characterization of Coatings
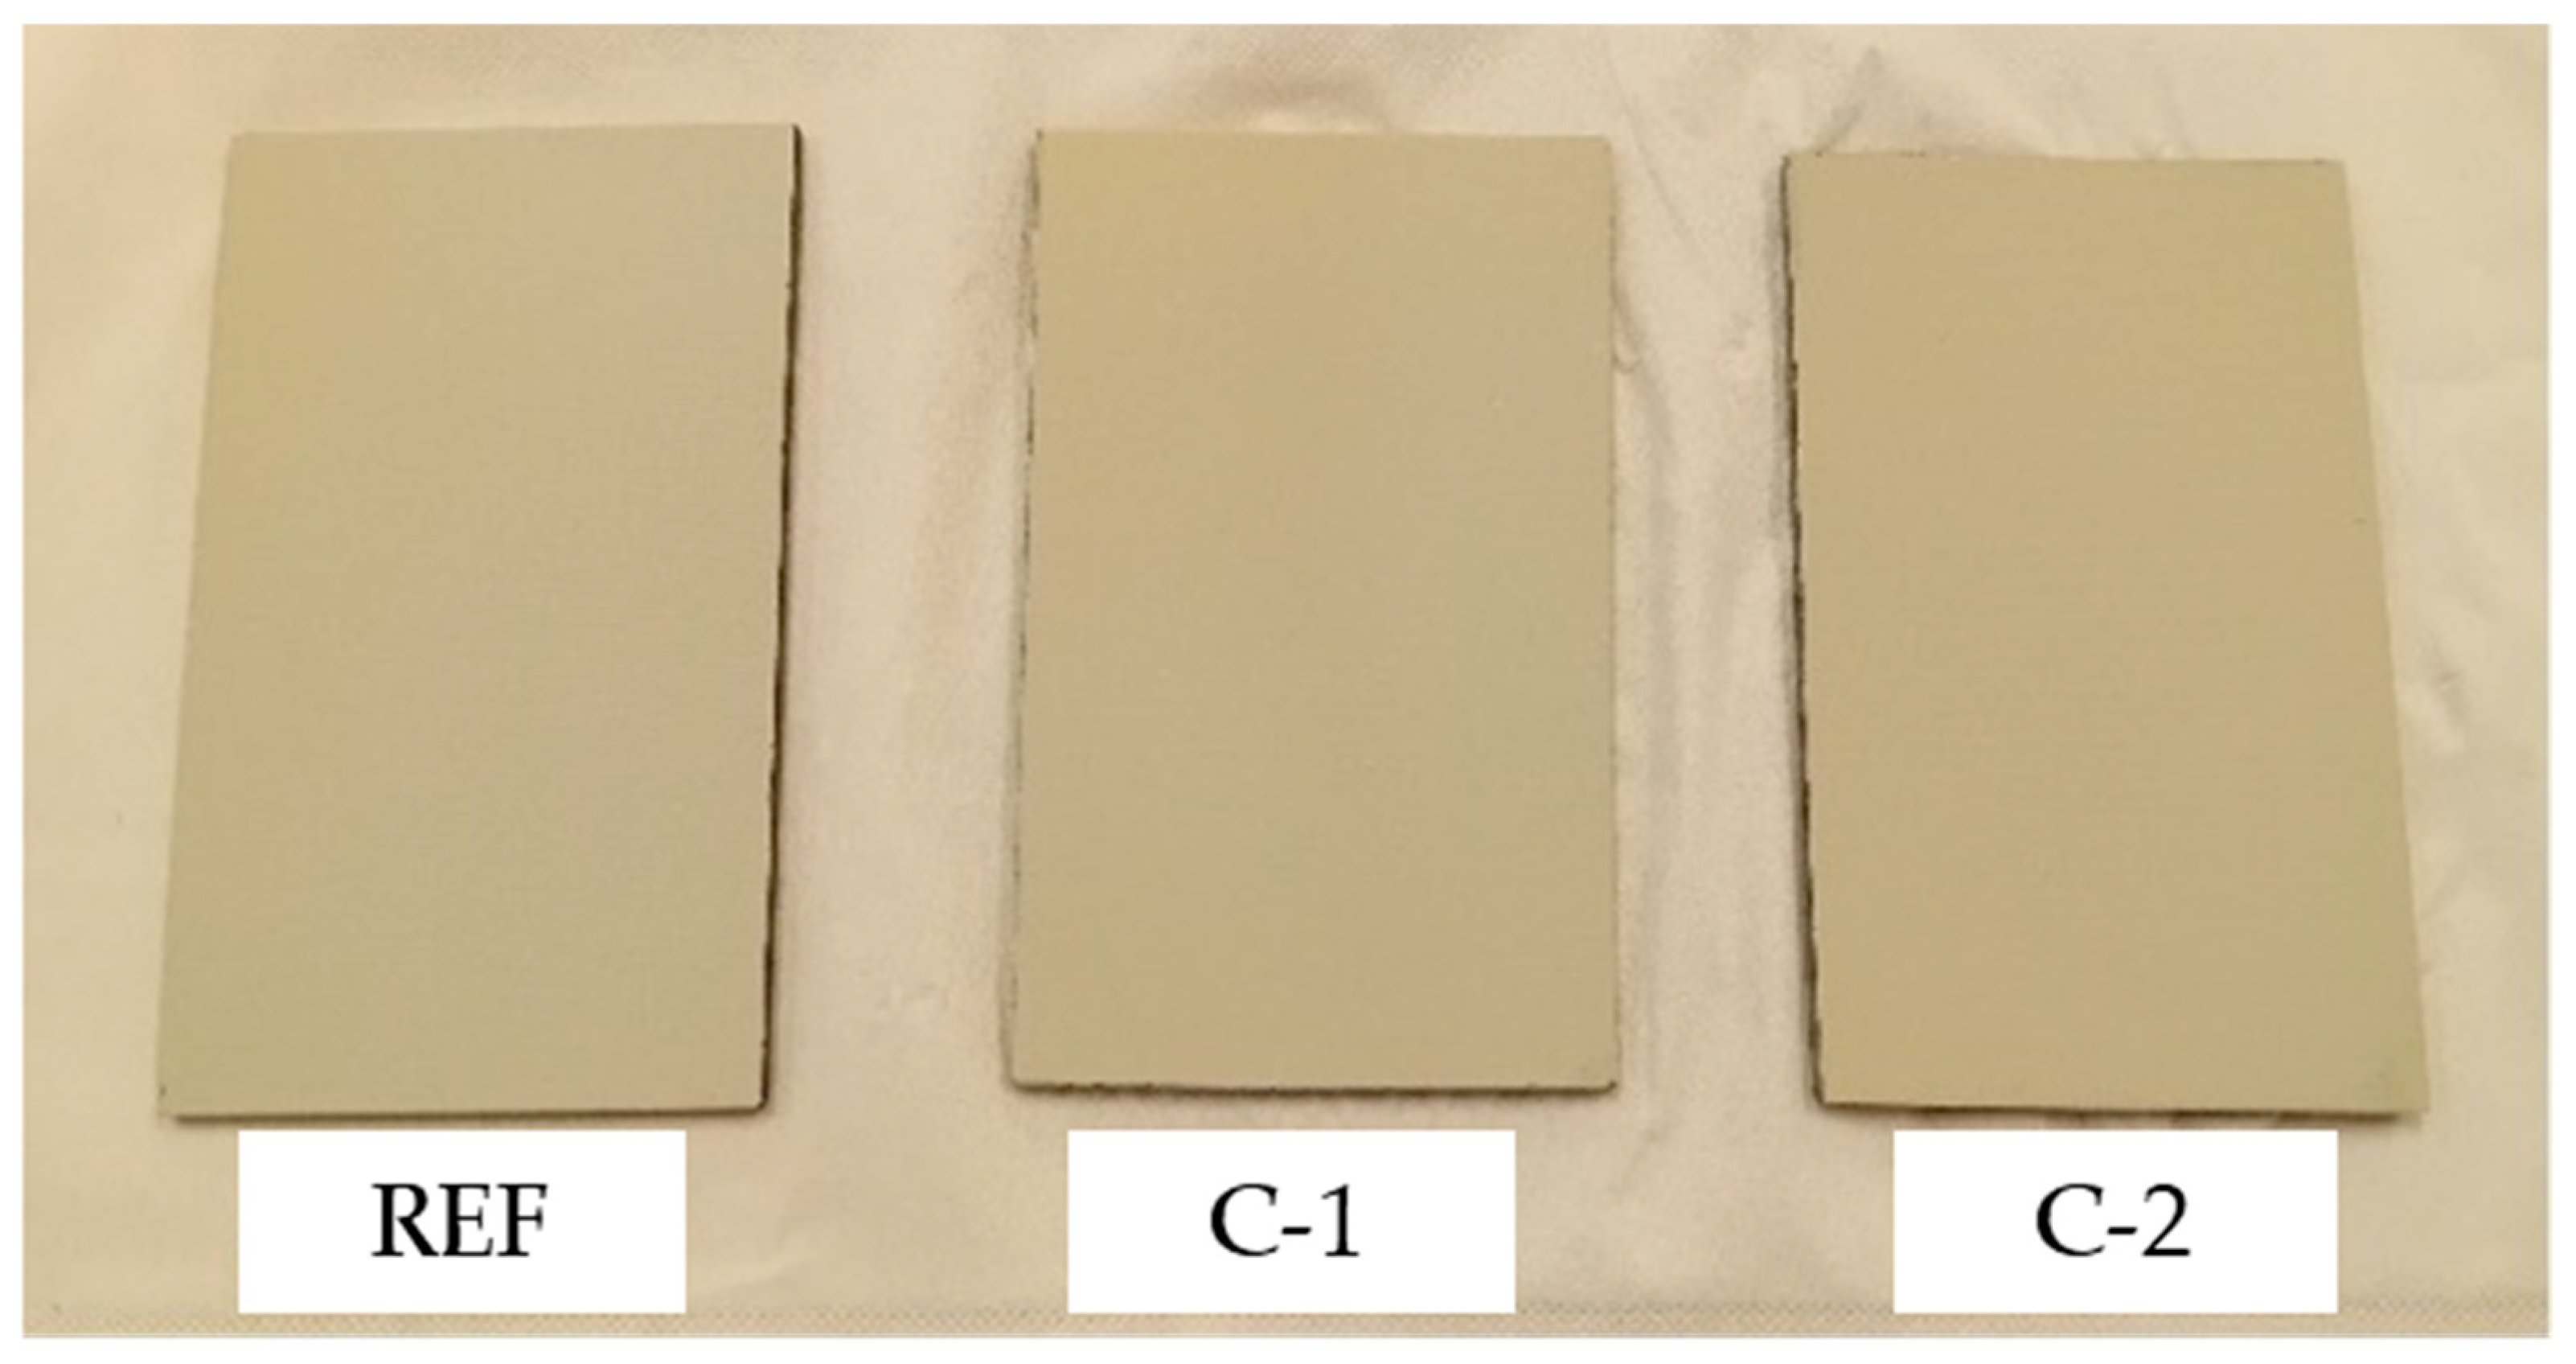
The results of the Shore D hardness test performed on the REF, C-1, and C-2 coatings are shown in
Table 1.
A similar hardness value has been measured on both experimental coatings, equal to about 23, although C-1 and C-2 coatings have different compositions. It is important to underline that this value is higher (by about 7%) than the hardness measured on the reference coating, i.e., REF.
The mean thickness values, with the related confidence intervals, measured on the REF, C-1, and C-2 coatings are reported in
Table 2.
The thickness of the two coatings is similar. Furthermore, the low variation in results indicates that the spray application of the coatings was conducted uniformly, since, as expected, a lower value was observed for C-2.
The results of the roughness measurements, performed on coatings applied on metal plates and on composite substrates, are summarized in
Table 3.
As expected, both experimental coatings, i.e., C-1 and C-2, show higher roughness than the AkzoNobel reference. The high surface roughness plays a crucial role in incorporating and maintaining icephobic performance and is intrinsically interlinked with other surface-induced icephobicity strategies, including superhydrophobicity [
37]. In the present study, the roughness of the C-1 and C-2 coatings was found to be higher than that reported for comparable systems in the literature. For instance, superhydrophobic silicone rubber surfaces prepared via micro compression molding exhibit Ra = 2.54 μm (µCM), while coatings treated with atmospheric pressure plasma (APP) display a significantly lower roughness of Ra = 0.70 μm [
38]. Lotus leaf-inspired superhydrophobic surfaces with micro-/nano-scale surface textures reported by Ma et al. [
39] showed an even lower Ra value of 0.562 μm. Additionally, other advanced coatings developed via chemical techniques—such as sol–gel processes, polyester-based formulations with fluorinated additives applied by electrostatic spray deposition, and silicone-based paints modified with alumina nanoparticles—demonstrate roughness values ranging from 0.19 to 2.84 μm [
40].
The roughness values of the two experimental coatings are similar when applied to a metal plate; on the other hand, when applied to the composite, the roughness of the C-2 slightly exceeds that of the C-1.
The results of contact angle (CA) measurements, performed with water (H
2O), diiodomethane (CH
2I
2), or formamide (HCONH
2), are reported in
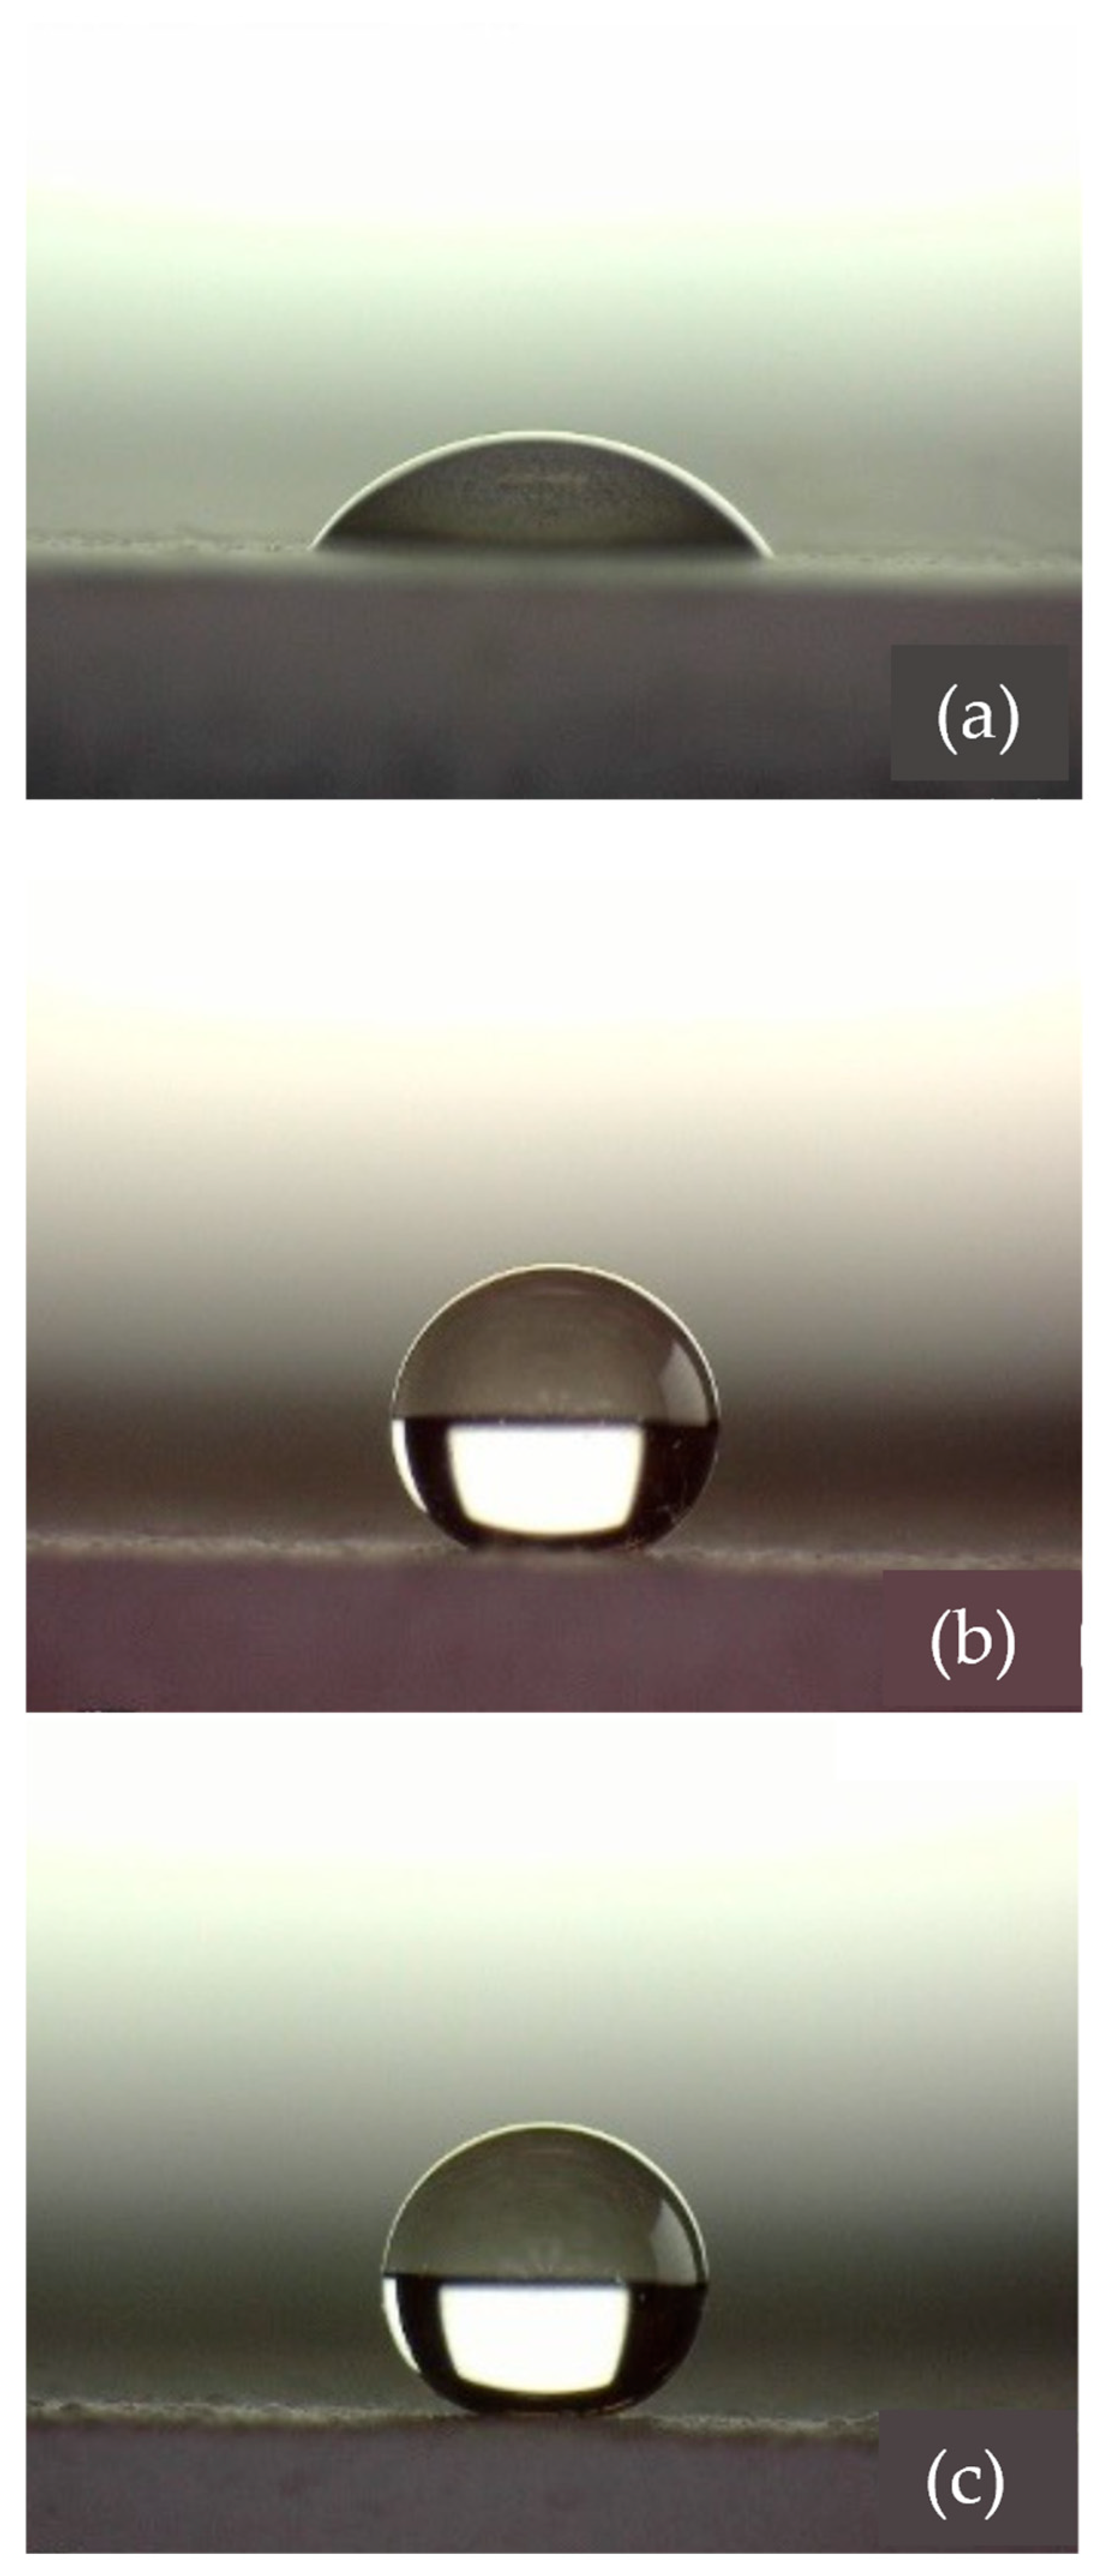
Table 4. Images captured during the contact angle test performed on the different coatings using water are shown in
Figure 4.
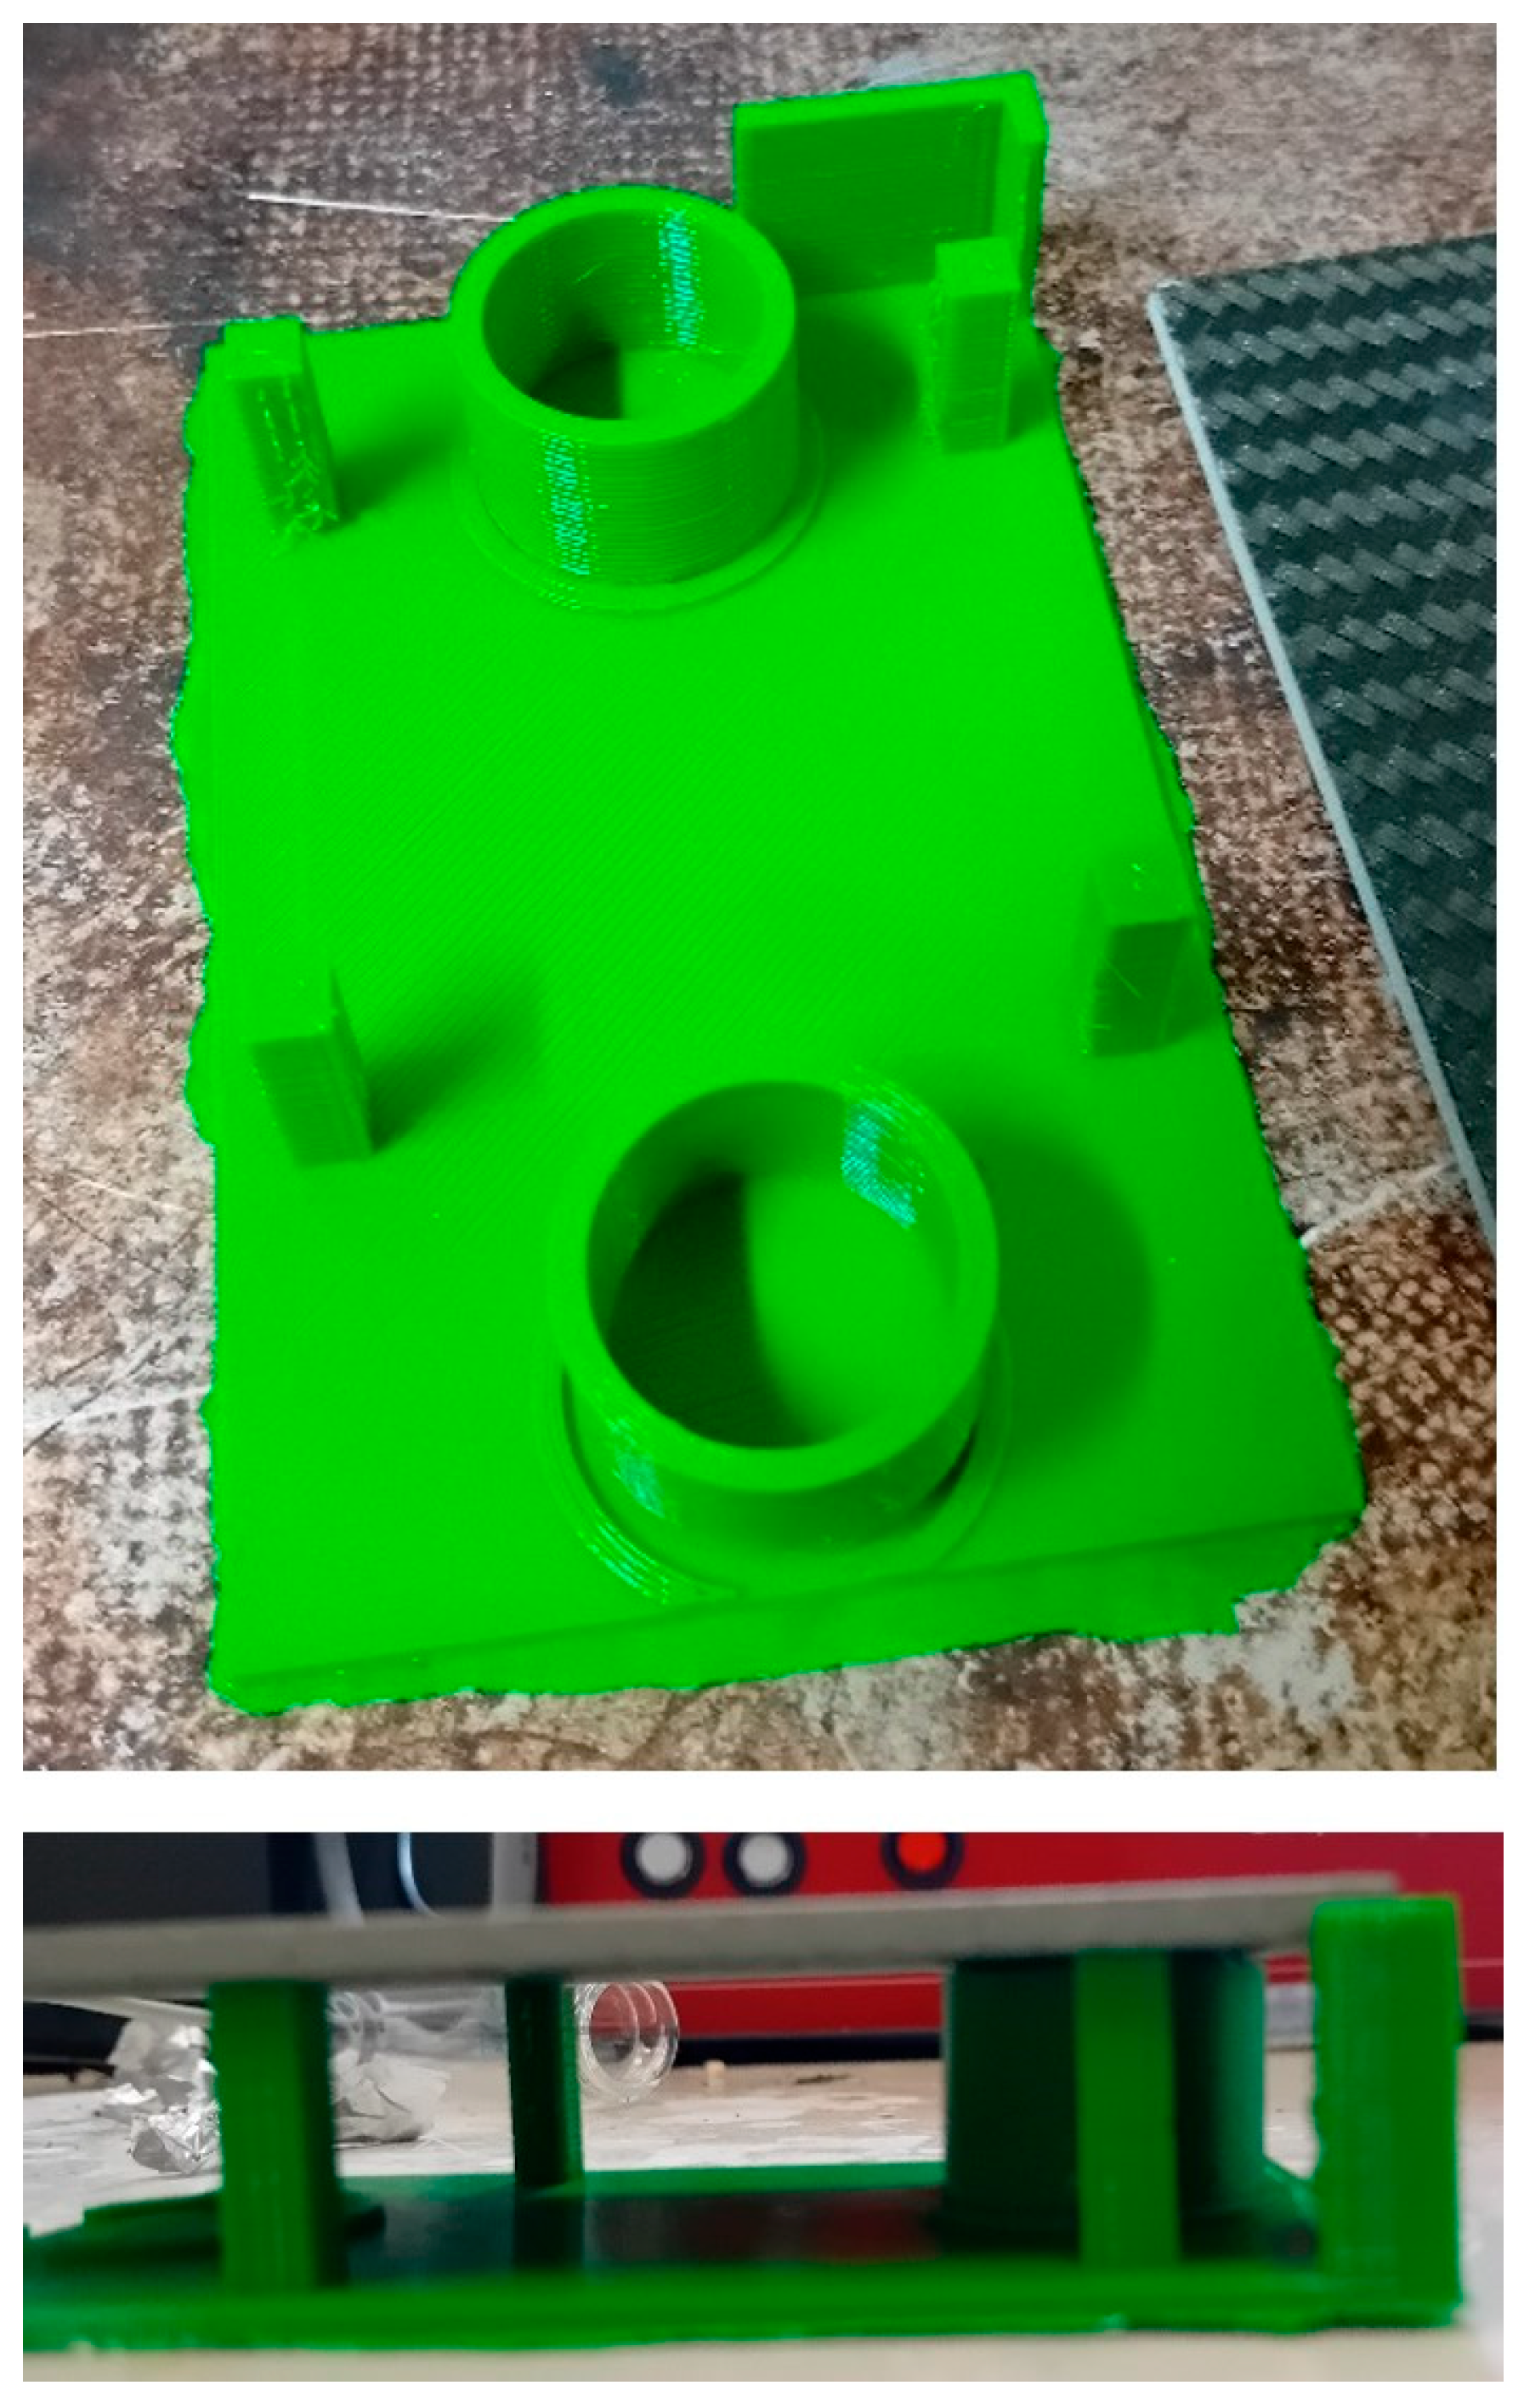
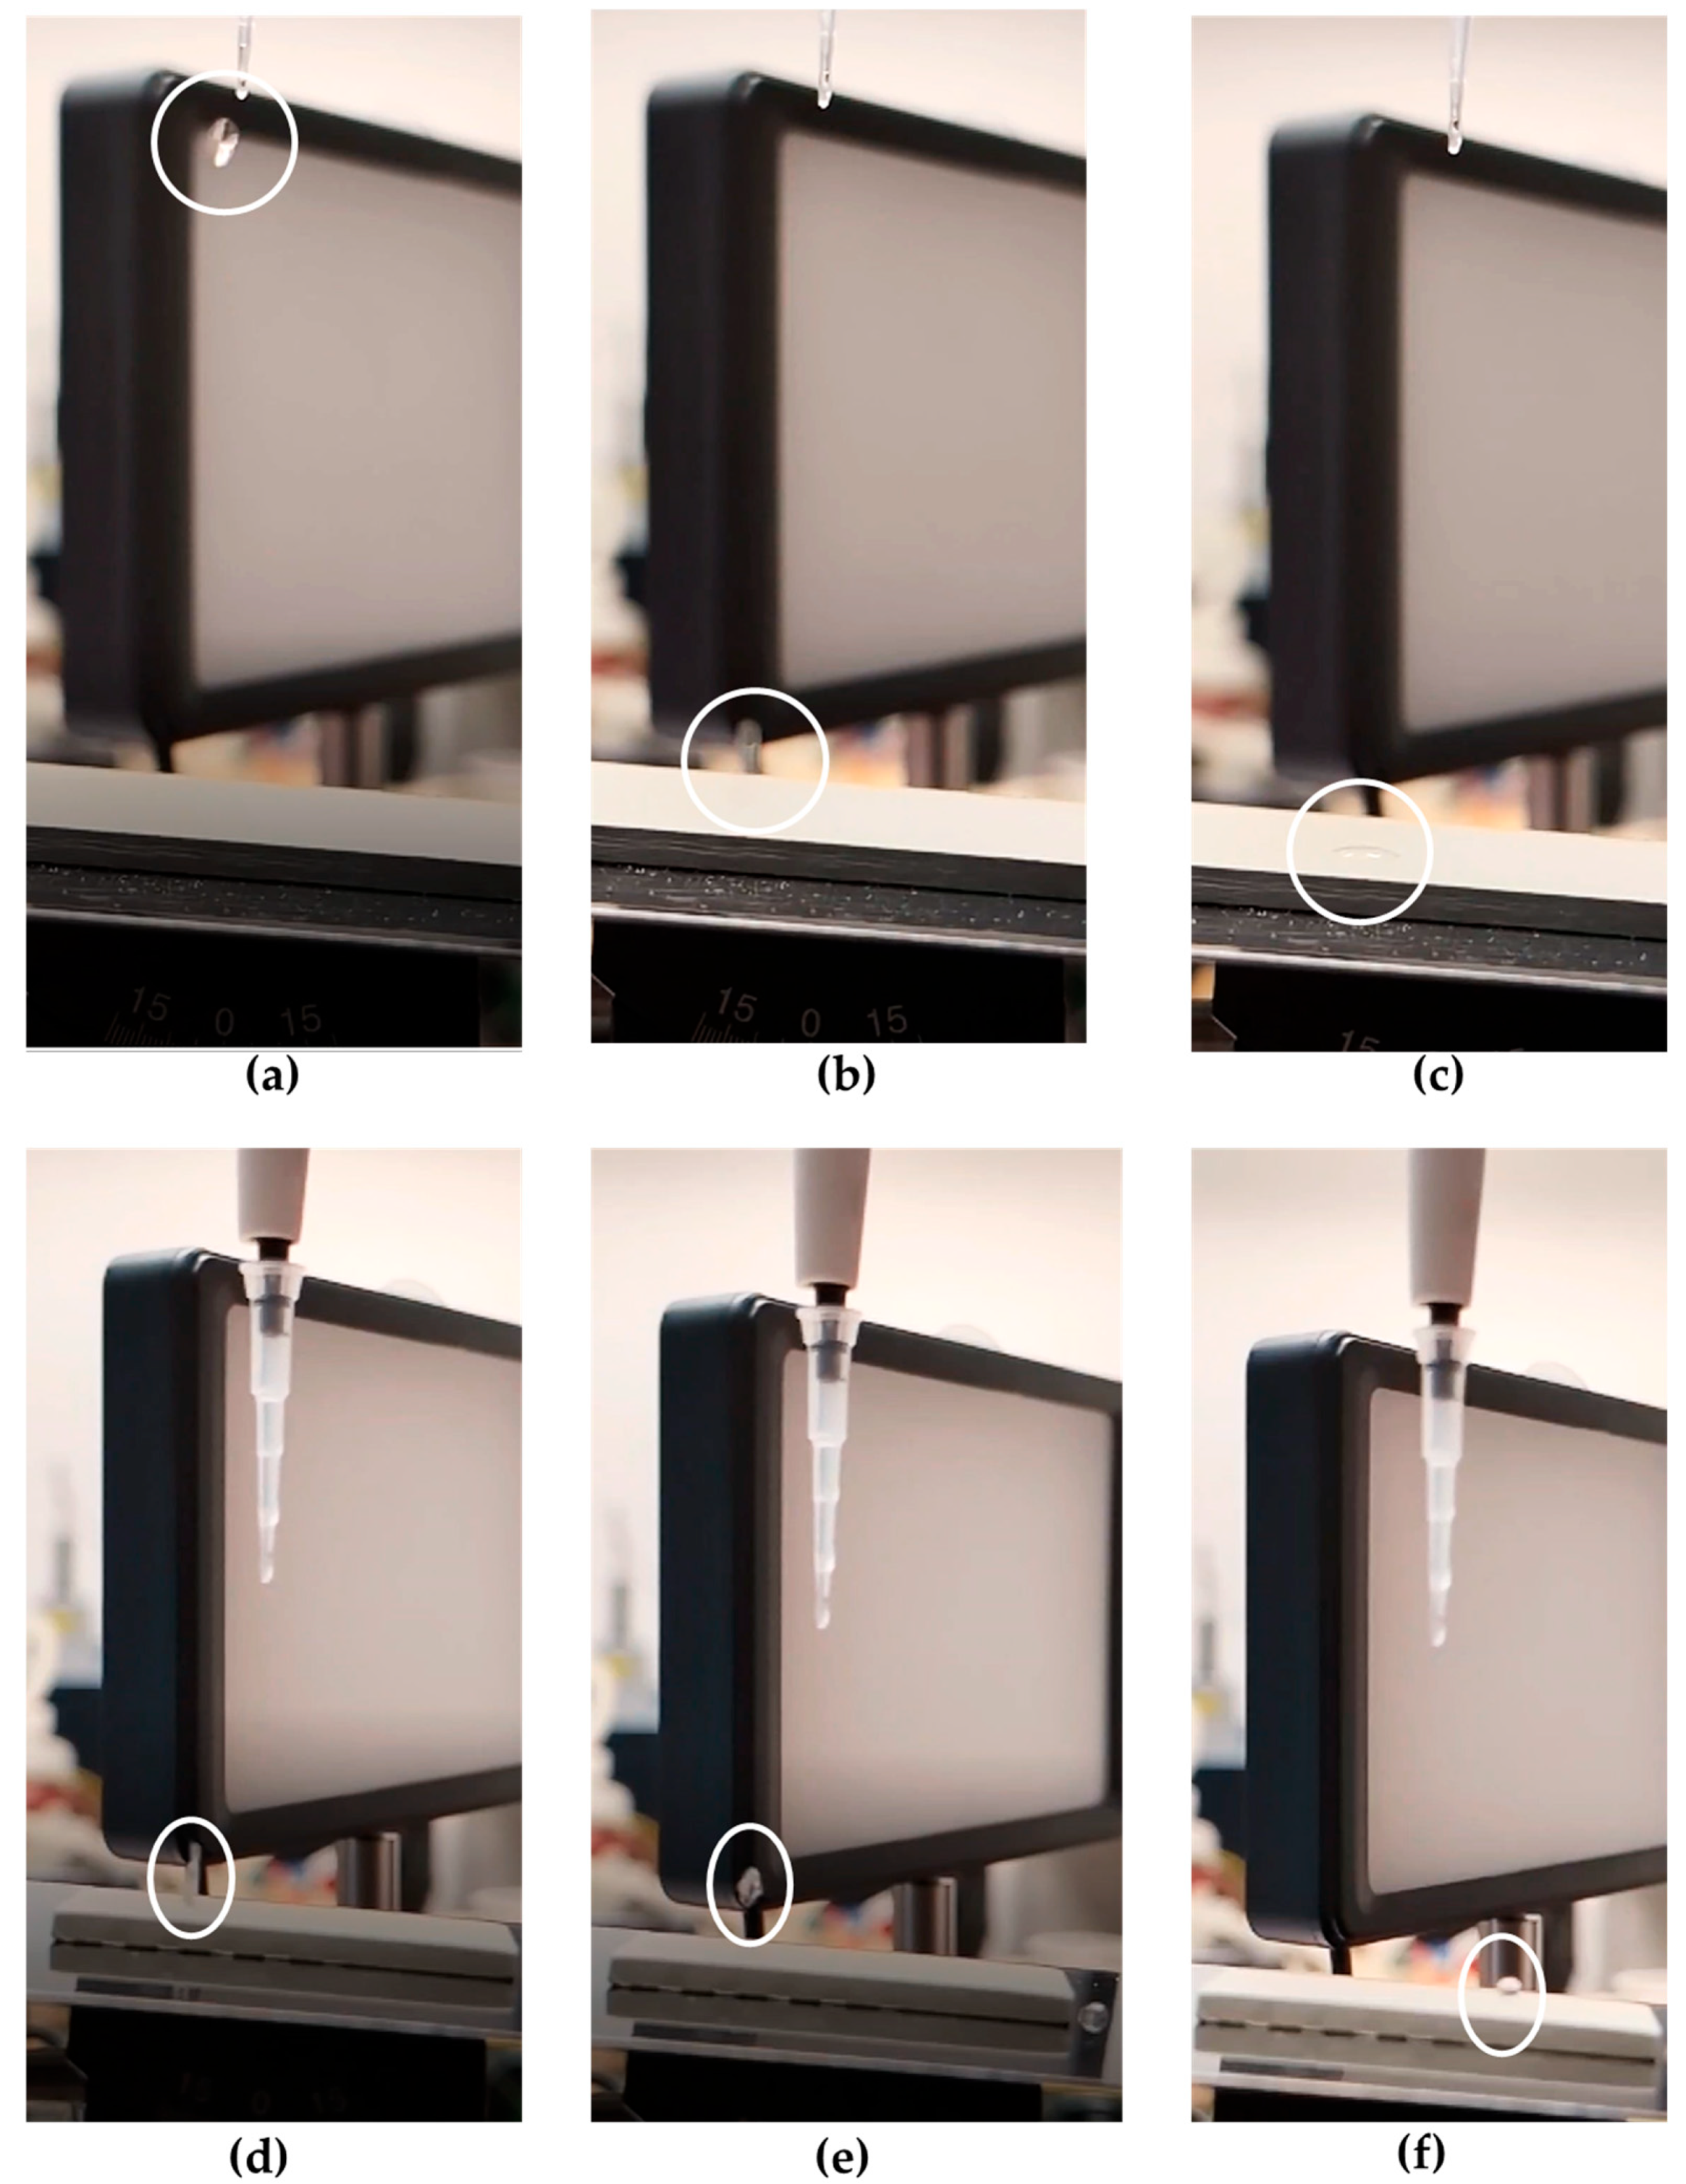
The low wettability of the surface was also demonstrated by the behavior of 5 μL water droplets deposited onto the C-1 coated substrate inclined at an angle of 5°. Upon impact, the droplet promptly bounced off and then rolled off the surface, indicating minimal adhesion and confirming the water-repellent character of the coating (
Figure 5). A similar behavior was observed for C-2; however, the corresponding results are not shown here for the sake of brevity. Conversely, in the case of the REF surface, the water droplet did not roll off but remained attached upon impact, indicating high surface adhesion.
Contact angle measurements using distilled water were used to determine the hydrophobic or hydrophilic nature of the coatings. According to the results reported in
Table 4, and as can be observed in
Figure 4a, the AkzoNobel reference paint is quite hydrophilic, as its average contact angle with water is less than 90°. On the other hand, C-1 and C-2 can both be classified as superhydrophobic coatings since their average contact angle is greater than 150° and 160°, respectively.
As already explained, the measurements performed with the other two liquids, i.e., Diiodomethane and Formamide, were used to calculate the SFE on each coating, according to the relationship reported by Owens [
34,
35,
36]. The SFE of each coating, reported in
Table 5, was calculated from the contact angle data reported in
Table 4 using a Matlab-based solver developed at CIRA for this purpose [
32]. Starting from the measured contact angles, the developed Matlab-based solver is designed to numerically solve the system of equations required to obtain optimized contact angle and solid’s SFE.
As expected, the SFEs of the C-1 and C-2 coatings are much lower than that measured on the reference paint, i.e., AkzoNobel. The obtained values of SFE for C-1 and C-2 are significantly lower than those reported even for PTFE-based coatings [
41]. Specifically, PTFE coatings on rough substrates (Ra = 4.50 μm) exhibit SFE values ranging between 19.52 and 23.46 mJ/m
2.
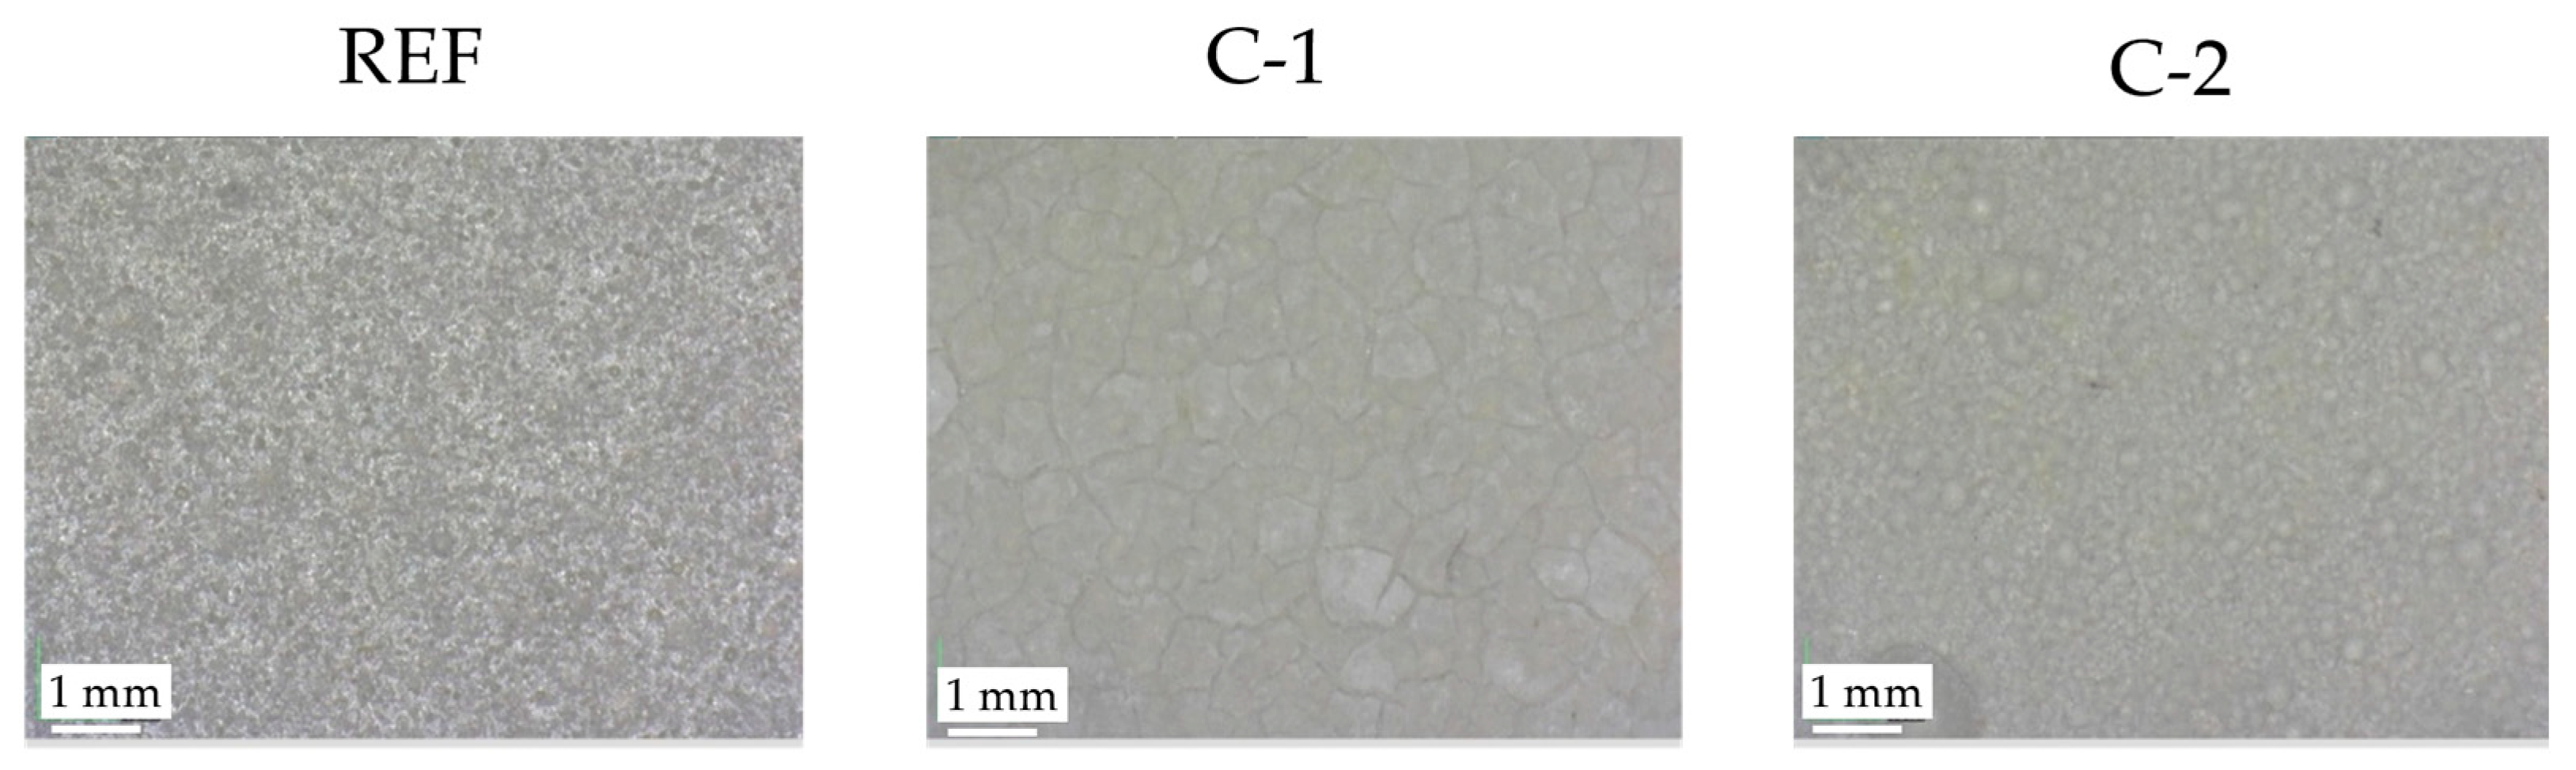
The optical microscope was used to analyze the surface of the different coatings at a medium magnification. The images reported in
Figure 6 illustrate the surfaces of REF, C-1, and C-2 samples at 140× magnification.
An examination of the previous images reveals that the C-1 surface presents plaques and cracks on its surface, while the C-2 sample shows spherical aggregations. Furthermore, in some areas of the C-2 sample, the microscope appears out of focus, confirming that C-2 has a high surface roughness, greater than C-1, as already highlighted by some roughness test results. This observation is supported by the absence of out-of-focus areas in the images of the C-1 coating, despite the fact that surface cracks can be seen on it.
In order to obtain an examination of the surface of the three coatings at higher magnifications, a scanning electron microscope (SEM) was employed. The SEM images taken on the surfaces of REF, C-1, and C-2 coatings at different magnifications are shown in
Figure 7.
SEM images of the REF sample (i.e., the AkzoNobel paint) reveal a relatively smooth surface, with the coating applied uniformly. This observation is in line with the results of the roughness measurements, with low values observed for the REF coating compared to the others. Interestingly, the structures of the superhydrophobic coatings do not show the typical two-length scale hierarchical structure which is usually observed in superhydrophobic surfaces [
42,
43]. This important finding highlights that, regardless of the specific morphological features or roughness patterns generated on the surface, the combination of surface texturing with appropriate chemical modification, capable of significantly lowering the SFE, is sufficient to achieve superhydrophobicity.
Some thin cracks appear on the surface of the C-1 coating. However, they do not appear to influence the contact angle values measured on this coating, as previously presented, and hence the superhydrophobic character of this coating. This finding is in agreement with the results reported by Aslanidou et al. [
44], according to which grooves formed during the preparation of superhydrophobic coatings did not significantly impact the contact angles of water and glycerol drops, which remained high.
Finally, no fractures are detected on the surface of the C-2 coating; its surface appears uniform and similar to that of the AkzoNobel reference but with some spherical particles.
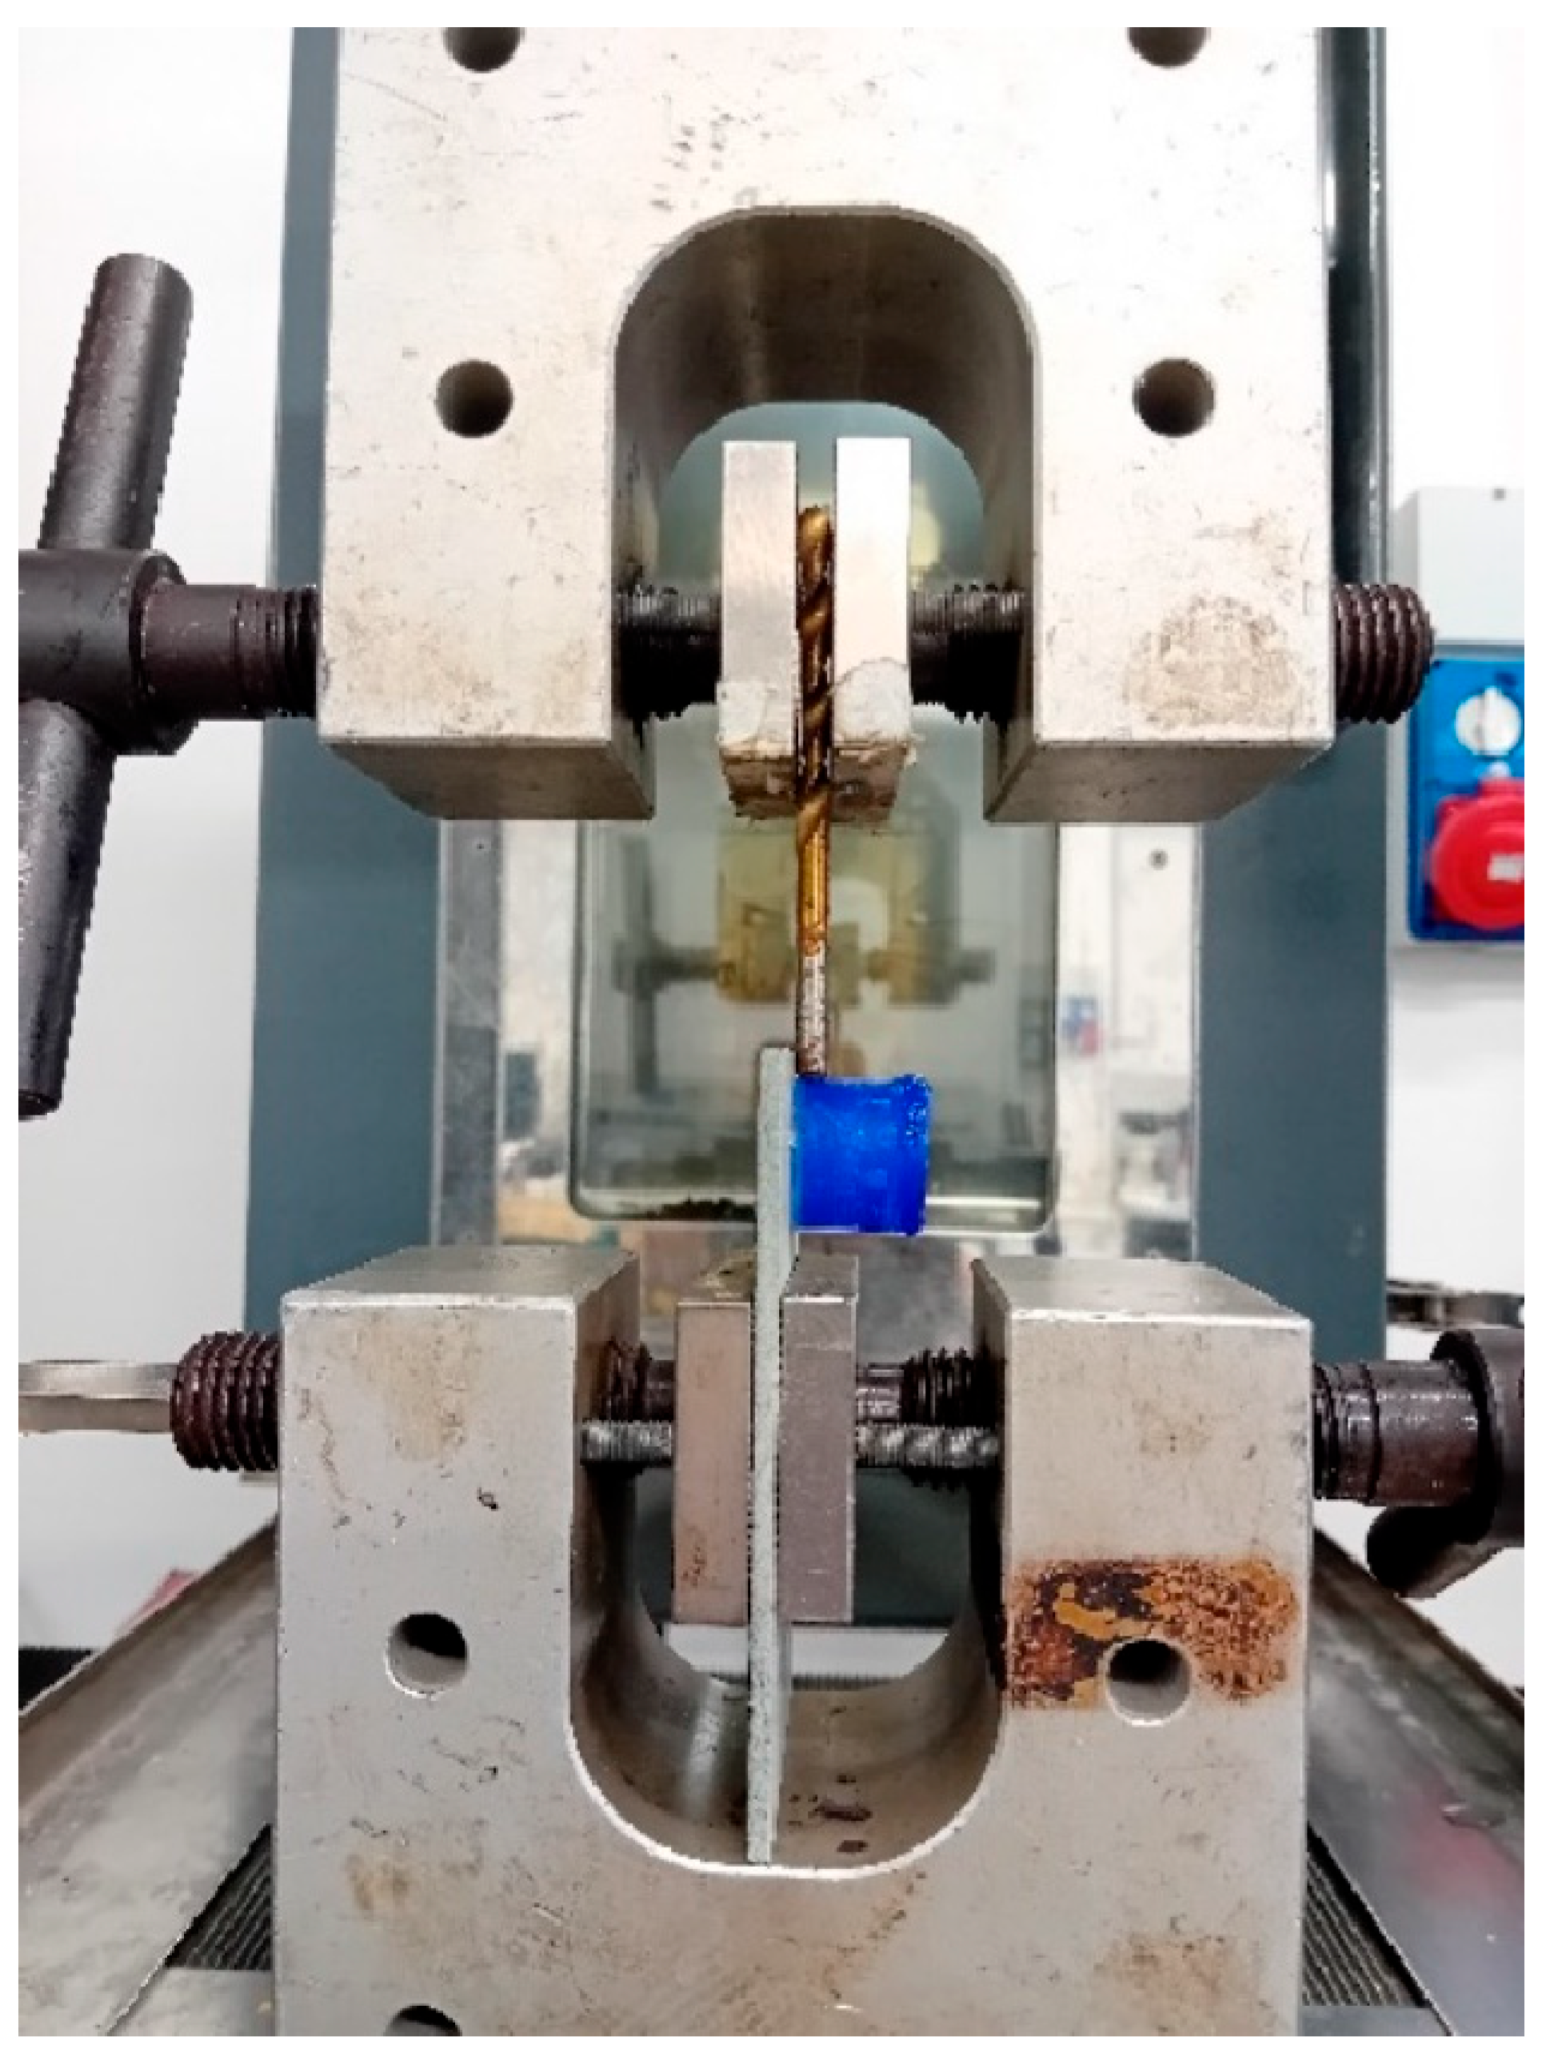
3.2. Ice Adhesion Results
Ice adhesion tests were performed following the original procedure described in
Section 2.2.7.
Before performing the test, the samples were kept at a constant temperature of −29 °C. Considering t = 0 s as the time in which the sample was removed from the freezer, ice detachment (in test with a constant crosshead speed of 1 mm/min) occurred for all samples at t < 45 s. The environmental conditions in which the ice adhesion test was carried out (in the laboratory) were about 20 °C and 60% relative humidity. It was verified that during a time less than 45 s in the mentioned laboratory conditions, no substantial reduction in the contact area between ice and the surface of each coating occurred. However, of the numerous tests carried out in particular for C-1 and C-2 coatings, some of them were not reliable, probably due to the intrinsic superhydrophobic nature of the two coatings which, therefore, made it difficult for ice to adhere. The related results were therefore discarded.
Table 6 presents the average (valid) values of the stress of adhesion between each coating and ice. The ice/coating contact area used to calculate τ was assumed to be constant and equal to 100π mm
2. In all cases, a non-negligible range of variation in results was observed.
From the observation of the data in
Table 6, it is evident that both experimental coatings are capable of substantially reducing the adhesive resistance of the ice on the surface—by 90% for C-1 and 86% for C-2—and these results are in line with our expectations.
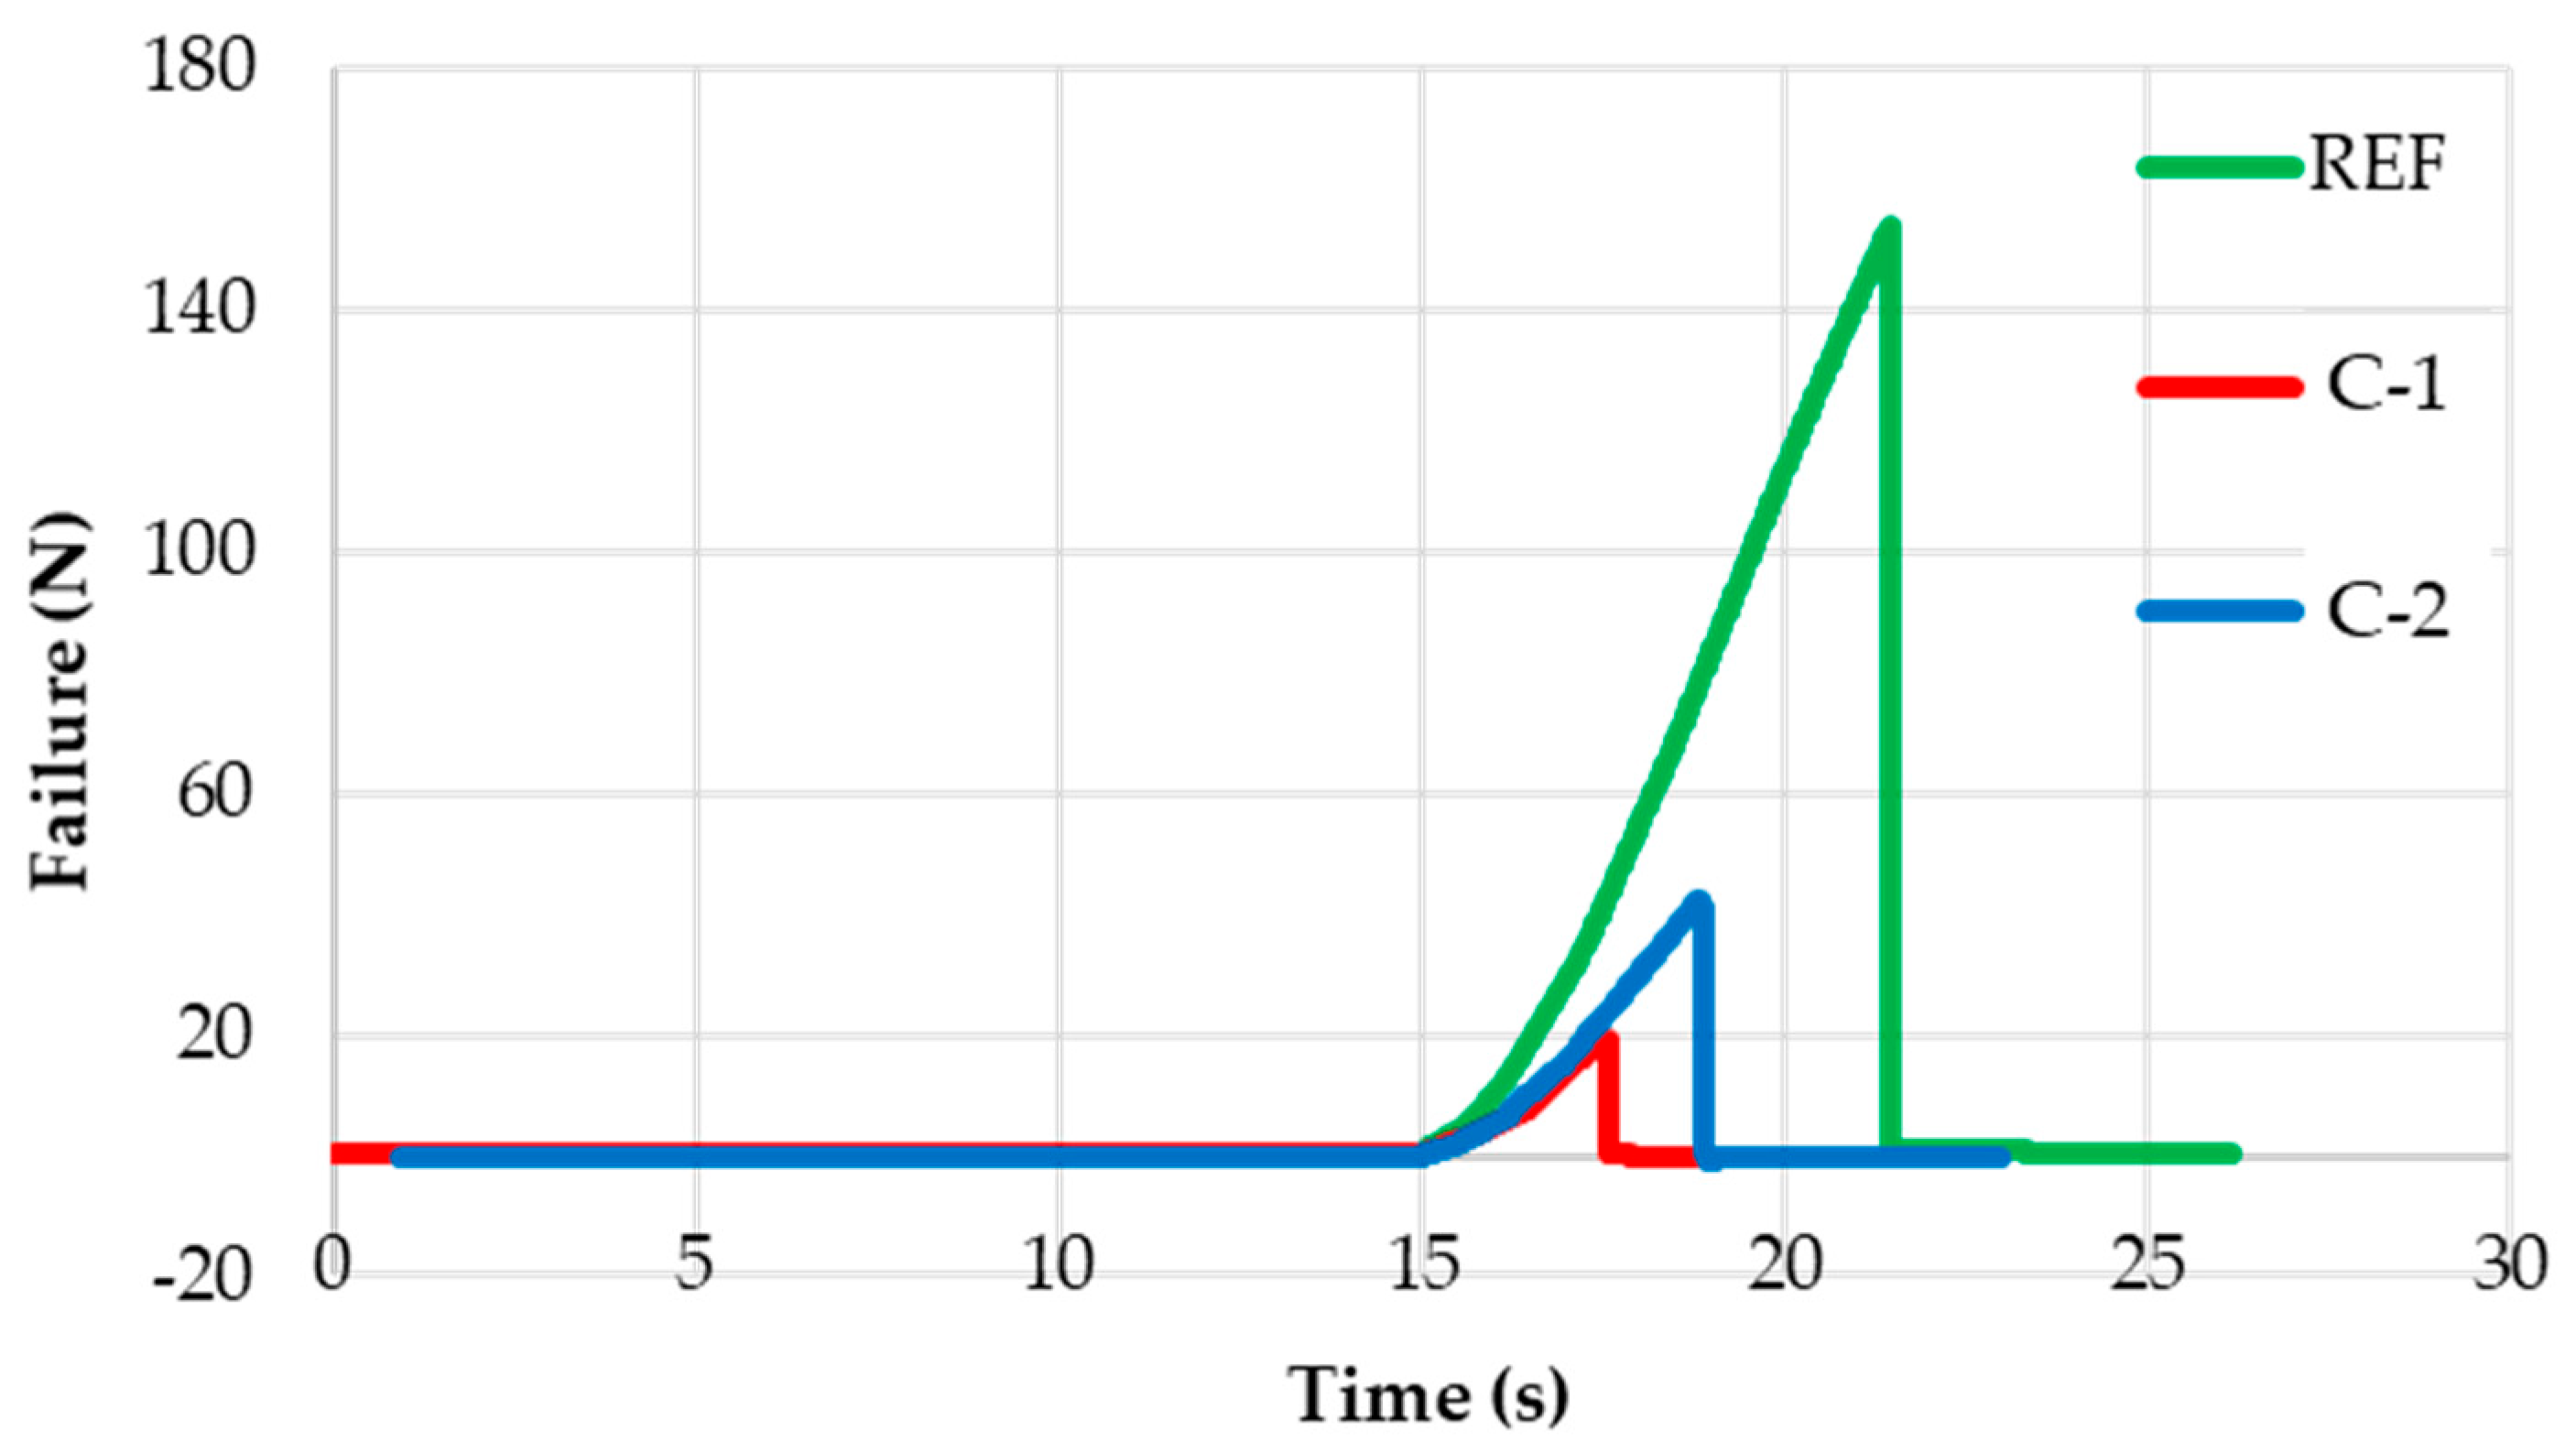
Figure 8 shows curves of breaking load vs. test time recorded during the ice adhesion test performed on each coating. From the observation of these graphs, the excellent behavior of the two experimental coatings is even more evident, which allows us to reduce the adhesion of the ice compared to the paint AkzoNobel. It is also evident that the time required for ice to detach from the coating surface during the test is much shorter for C-1 and C-2 than for the reference coating.
These results, in accordance with the low wettability exhibited by these coatings at low temperatures [
45], are compliant with those measured by Rønneberg et al. [
26] in the same setup configuration at −18 °C, a temperature close to the −29 °C used in the present work. For Al, they measured an Ice Adhesion Strength (IAS) of 393 ± 124 kPa, comparable with those measured in the present work. Differences must be ascribed to the different temperature of icing and mostly to the different nature of reference, being Aluminium 6061-T6 in [
26] and AkzoNobel on the composite sheet in the present work. It is worth noting the comparisons between the IAS measurements performed on the commercial EC-3100, two-component, water-based, icephobic, non-stick coating from Ecological Coating, LLC (New York, NY, USA) [
26,
46] and the coated surfaces object in the present paper. In both cases, a substantial reduction in IAS values is observed compared to the related references, but the C-1 and C-2 provide values of IAS of 48.5 ± 15.6 kPa and 65.6 ± 11.5 kPa, which are considerably lower, i.e., −64% and −51%, respectively, than 135 ± 38 kPa measured for EC-3100. This result is unexpected, considering that the coatings developed in this work have a considerable roughness, i.e., 6.0 ± 1.2 μm for C-1 and 7.3 ± 1.7 μm for C-2, while the commercial EC-3100 reference coating is smooth, as described in the technical datasheet [
46]. Conversely, the time in which the detachment occurs seems to be slightly increased, namely about 17 and 18 s with respect to the 12–15 s measured in [
26].
Rather, the IAS values exhibited by the rough C-1 and C-2 coatings appear to be more comparable to those reported for the same commercial smooth coating EC-3100, which was tested always at –18 °C, but using a centrifugal method, yielding values of 78 kPa ± 14 and 85 kPa ± 49. The two values refer to the same test performed in two different laboratories [
26]. Compared to values measured with the centrifugal test, C-1 shows a reduction in IAS of −38% and −16% and C-2 of −43% and −23%.
In contrast, Shen et al. [
47,
48] reported a shear IAS of approximately 80 kPa on a superhydrophobic surface containing a hierarchical structure formed by sand-blasted microstructures and hydrothermally grown TiO
2 nanowires. Relative to this coating, C-1 and C-2 demonstrate IAS reductions of 39% and 18%, respectively.
Similarly, Du et al. [
49], measured a horizontal shear IAS of 105.92 kPa and 177.36 kPa on TiO
2/polyurea superhydrophobic coating at −20 °C, again significantly higher than those recorded for C-1 and C-2.
Conversely, considerably lower IAS values were reported for PDMS-based coatings. For instance, Xie et al. [
50] measured IAS values of 18.5 kPa and 8.5 kPa for certain interpenetrating epoxy/PDMS gel coatings. Likewise, Cheng et al. [
51] reported an IAS of 6.5 kPa for PDMS/SiO2 based surfaces tested at −25.0 °C and high humidity conditions (60%).


 ,
, 


