1. Introduction
Polyurethanes (PUs) are a diverse group of polymers with a wide range of applications, from coatings and adhesives to foams and elastomers [
1,
2]. PU foam is a cross-linked polymer produced by, among other methods, the reaction between a diisocyanate and a polyol. PUs’ structures are usually composed of both hard and soft segments. Soft segments (SSs) are mostly polyesters or polyethers, while the hard segments (HSs) comprise mainly diisocyanates and chain extenders. [
3,
4].
PUs become versatile due to their segmented molecular structure, consisting of alternating hard and soft domains, which provide a balance between mechanical flexibility and thermal stability [
1,
2,
5,
6]. However, PUs are susceptible to various degradation mechanisms, including thermal, hydrolytic, and photochemical processes, which can significantly alter their molecular structure and performance characteristics [
2,
5,
7].
Due to the great flexibility of and numerous applications for which PUs are used, their weathering behavior needs to be thoroughly understood [
4]. The biggest contributor to the degradation of materials is the exposure to factors such as UV radiation, humidity, and temperature, which results in a reduction in their lifespan [
8].
It is possible to assess the weathering resistance of a material by characterizing it by outdoor exposure or by accelerated weathering in weathering chambers [
9]. Accelerated weathering, also called artificial weathering, is the process in which materials are placed in a specially designed weathering chamber using artificial light, heat, and water. Although outdoor exposure tests can better reflect the degradation behavior of materials for practical applications, they are time consuming, meaning gathering enough data for evaluation can take up to a few years. In contrast, accelerated weathering tests can be performed in a much shorter time and at a lower cost, as they closely resemble outdoor conditions and have become efficient alternative methods for evaluating the weathering behavior of materials [
4,
8,
9,
10].
According to Xie et al. (2019) [
3], accelerated aging is, therefore, a methodology that simulates environmental conditions and in short time periods, the long-term effects of exposure to environmental factors such as UV light, temperature, humidity, etc., and may include various types of degradation, including photo-oxidation.
UV radiation is, in general, the component of the electromagnetic spectrum that initiates reactions in photosensitive groups, which can result in chain breaks and the degradation of the polymer [
3]. Radiation energy can produce deep changes in organic materials, depending on the irradiated substance and the nature of the radiation. Radiation can act on the atomic orbitals and, therefore, on interatomic connections [
3,
4,
11]. Depending on its chemical structure, each polymer has a different spectral sensitivity, causing each material to absorb UV radiation in specific wavelengths [
12,
13,
14].
UV absorption by specific groups in the polymer causes electron excitation, releasing free radicals, which randomly attack the polymeric chains, resulting in the molecular cleavage of the bonds, which are susceptible to oxidation under aerobic conditions. The initiation step occurs via the homolytic cleavage of the covalent bonds of the polymer. The alkyl radical generated at initiation (R•) is highly reactive with oxygen, forming a peroxide radical (ROO•), which reacts again with the polymer, forming hydroperoxide (ROOH) and another alkyl radical. The reactions end with the coupling of two free radicals [
11,
12,
13,
14].
In irradiation at ‘long’ wavelengths (λ ≥ 300 nm), photo-oxidation begins with the abstraction of hydrogen from the methylene group in α position to the nitrogen. In short wavelengths, two different reactions are seen: induced and direct oxidation, involving the photochemical homolysis of C–N and C–O bonds in the urethane groups. For both cases, the polyester segments have shown relatively high photostability. It has also been found that conventional PUs from aromatic diisocyanates, such as methylene 4,4′-diphenyl diisocyanate (MDI) or toluene diisocyanate (TDI), usually present marked yellowing when exposed to UV radiation [
1,
15,
16,
17]. The photo-oxidation of MDI PUs involves the oxidation of the central methylene groups, forming hydroperoxides. These hydroperoxides are thought to be the main products of the reaction leading to the formation of quinone-imides [
1,
15,
16].
In order to contextualize the relevance of the present study,
Table 1 summarizes works focused on the accelerated weathering of polyurethane (PU) foams. These studies involve PUs from fossil-based and partially renewable sources subjected to various artificial aging conditions. The comparison highlights differences in the degradation patterns, test durations, and analytical techniques employed.
In contrast with previous studies, the present work investigates the accelerated weathering of bio-based PUs derived from linseed oil (LO) and passion fruit oil (PFO). To our knowledge, this is the first study to compare these two types of PUs under identical UVB/UVA-accelerated aging conditions, using a multiparametric analytical approach (FTIR, TG/DTG, and stereomicroscopy). These insights are essential for developing sustainable PU-based materials with enhanced resistance to environmental degradation.
In this paper, the PUs synthesized from linseed and passion fruit oils, LO and PFO, respectively, had their degradation behavior investigated in an accelerated weathering chamber and characterized via thermogravimetry (TG) and derivative thermogravimetry (DTG), Fourier transform infrared spectroscopy (FTIR), and stereomicroscope. LO and PFO have been chosen for their fatty acid profiles and being rich in α-linolenic acid (3 unsaturations) and linoleic acid (2 unsaturations), respectively, as a higher unsaturation index favors the reaction performed in this work [
5].
2. Materials and Methods
This work is based on previous research carried out by the author on the synthesis and characterization of vegetable oil-based PUs [
5]. As such, the same method and materials are used.
2.1. Materials
Linseed oil (LO) was obtained from OlvepinTM (Industry of Vegetable Oils Pindorama, Panambi, Brazil) and passion fruit oil (PFO) was purchased from Naturais da AmazôniaTM, both at 99% purity. Formic acid (85%) was provided by Isofar and hydrogen peroxide (30%) by Dinâmica. Sodium bisulfite, sodium carbonate, ethyl ether, anhydrous sodium sulfate, potassium hydroxide, phenolphthalein, potassium biphthalate, calcium hydroxide, barium hydroxide, pyridine, acetic anhydride, butanol, silicone oil, and triethanolamine were bought from Vetec, all analytical graded. Furthermore, 4,4′-diphenylmethane diisocyanate (MDI) was purchased from Dow Chemical.
2.2. Methods
2.2.1. Polyol Synthesis
The synthesis of polyols from LO and PFO was adapted from a procedure found in the literature [
20]. For this study, 3.0 g (21.74 mmol) of degummed LO was mixed with 3.66 g (65.24 mmol) of formic acid (CH
2O
2), and 4.71 g of H
2O
2 (32.62 mmol) was slowly dripped into the mixture at room temperature for 30 min under mechanical stirring. After the hydrogen peroxide addition, the mixture temperature was increased to 65 °C, and the temperature was kept for 5 h. Then, the heating carried out in a thermal bath with the mineral oil removed, and a 10% wt/vol sodium bisulfate solution was added to the mixture. The organic phase was then extracted and neutralized with a 10% wt/vol sodium carbonate solution. The product was dried using sodium sulfate and the solvent was removed under a rotary evaporator. The hydroxyl index was determined via ASTM D 1957-86 [
21] and the values obtained in a previous study were 125.45 mg KOH/g of oil for LO and 122.40 mg KOH/g of oil for PFO [
5].
The PFO polyol was prepared in the same way, using the following reagent quantities: 3.75 g (20.82 mmol) of PFO, 3.47 g (62.46 mmol) of formic acid, and 4.47 g (31.23 mmol) of hydrogen peroxide.
2.2.2. Preparation of PUs
The preparation of PUs was adapted from a procedure described in the literature [
20,
22]. The isocyanate to polyol proportion studied was as follows: [NCO]/[OH] = 0.8 and 1.2, for both the PUs synthesized from linseed oil (LO) polyol and from passion fruit oil (PFO) polyol.
The PUs were prepared in appropriate glass vessels by mixing the 100 parts of polyol, 2.5 parts of water (expansion agent), 2.0 parts of silicone (surfactant), and 1.0 parts of amine (catalyst) under intense mechanical stirring for 2 min, after which diphenylmethane diisocyanate (MDI) was added in excess and continuously stirred for 40 s [
23].
The mixtures were stirred at 3000 rpm for 5 min, poured into Teflon
TM molds and placed in the oven for curing for 24 h at 100 °C. The MDI free isocyanate (NCO) content determined via titration following ASTM D 5155-96 [
24], and the calculated value was 30.82%, similar to the values in the literature [
22,
23]. The PUs from LO were labeled as PULO, and those from PFO as PUPFO. PUs with a molar ratio of 0.8 were labeled as 1A, and the ones with a molar ratio of 1.2 as 2A. So, the PUs were named PULO1A, PULO2A, PUPFO1A, and PUPFO2A.
Figure 1 shows the schematic diagram for obtaining polyurethanes from LO and PFO.
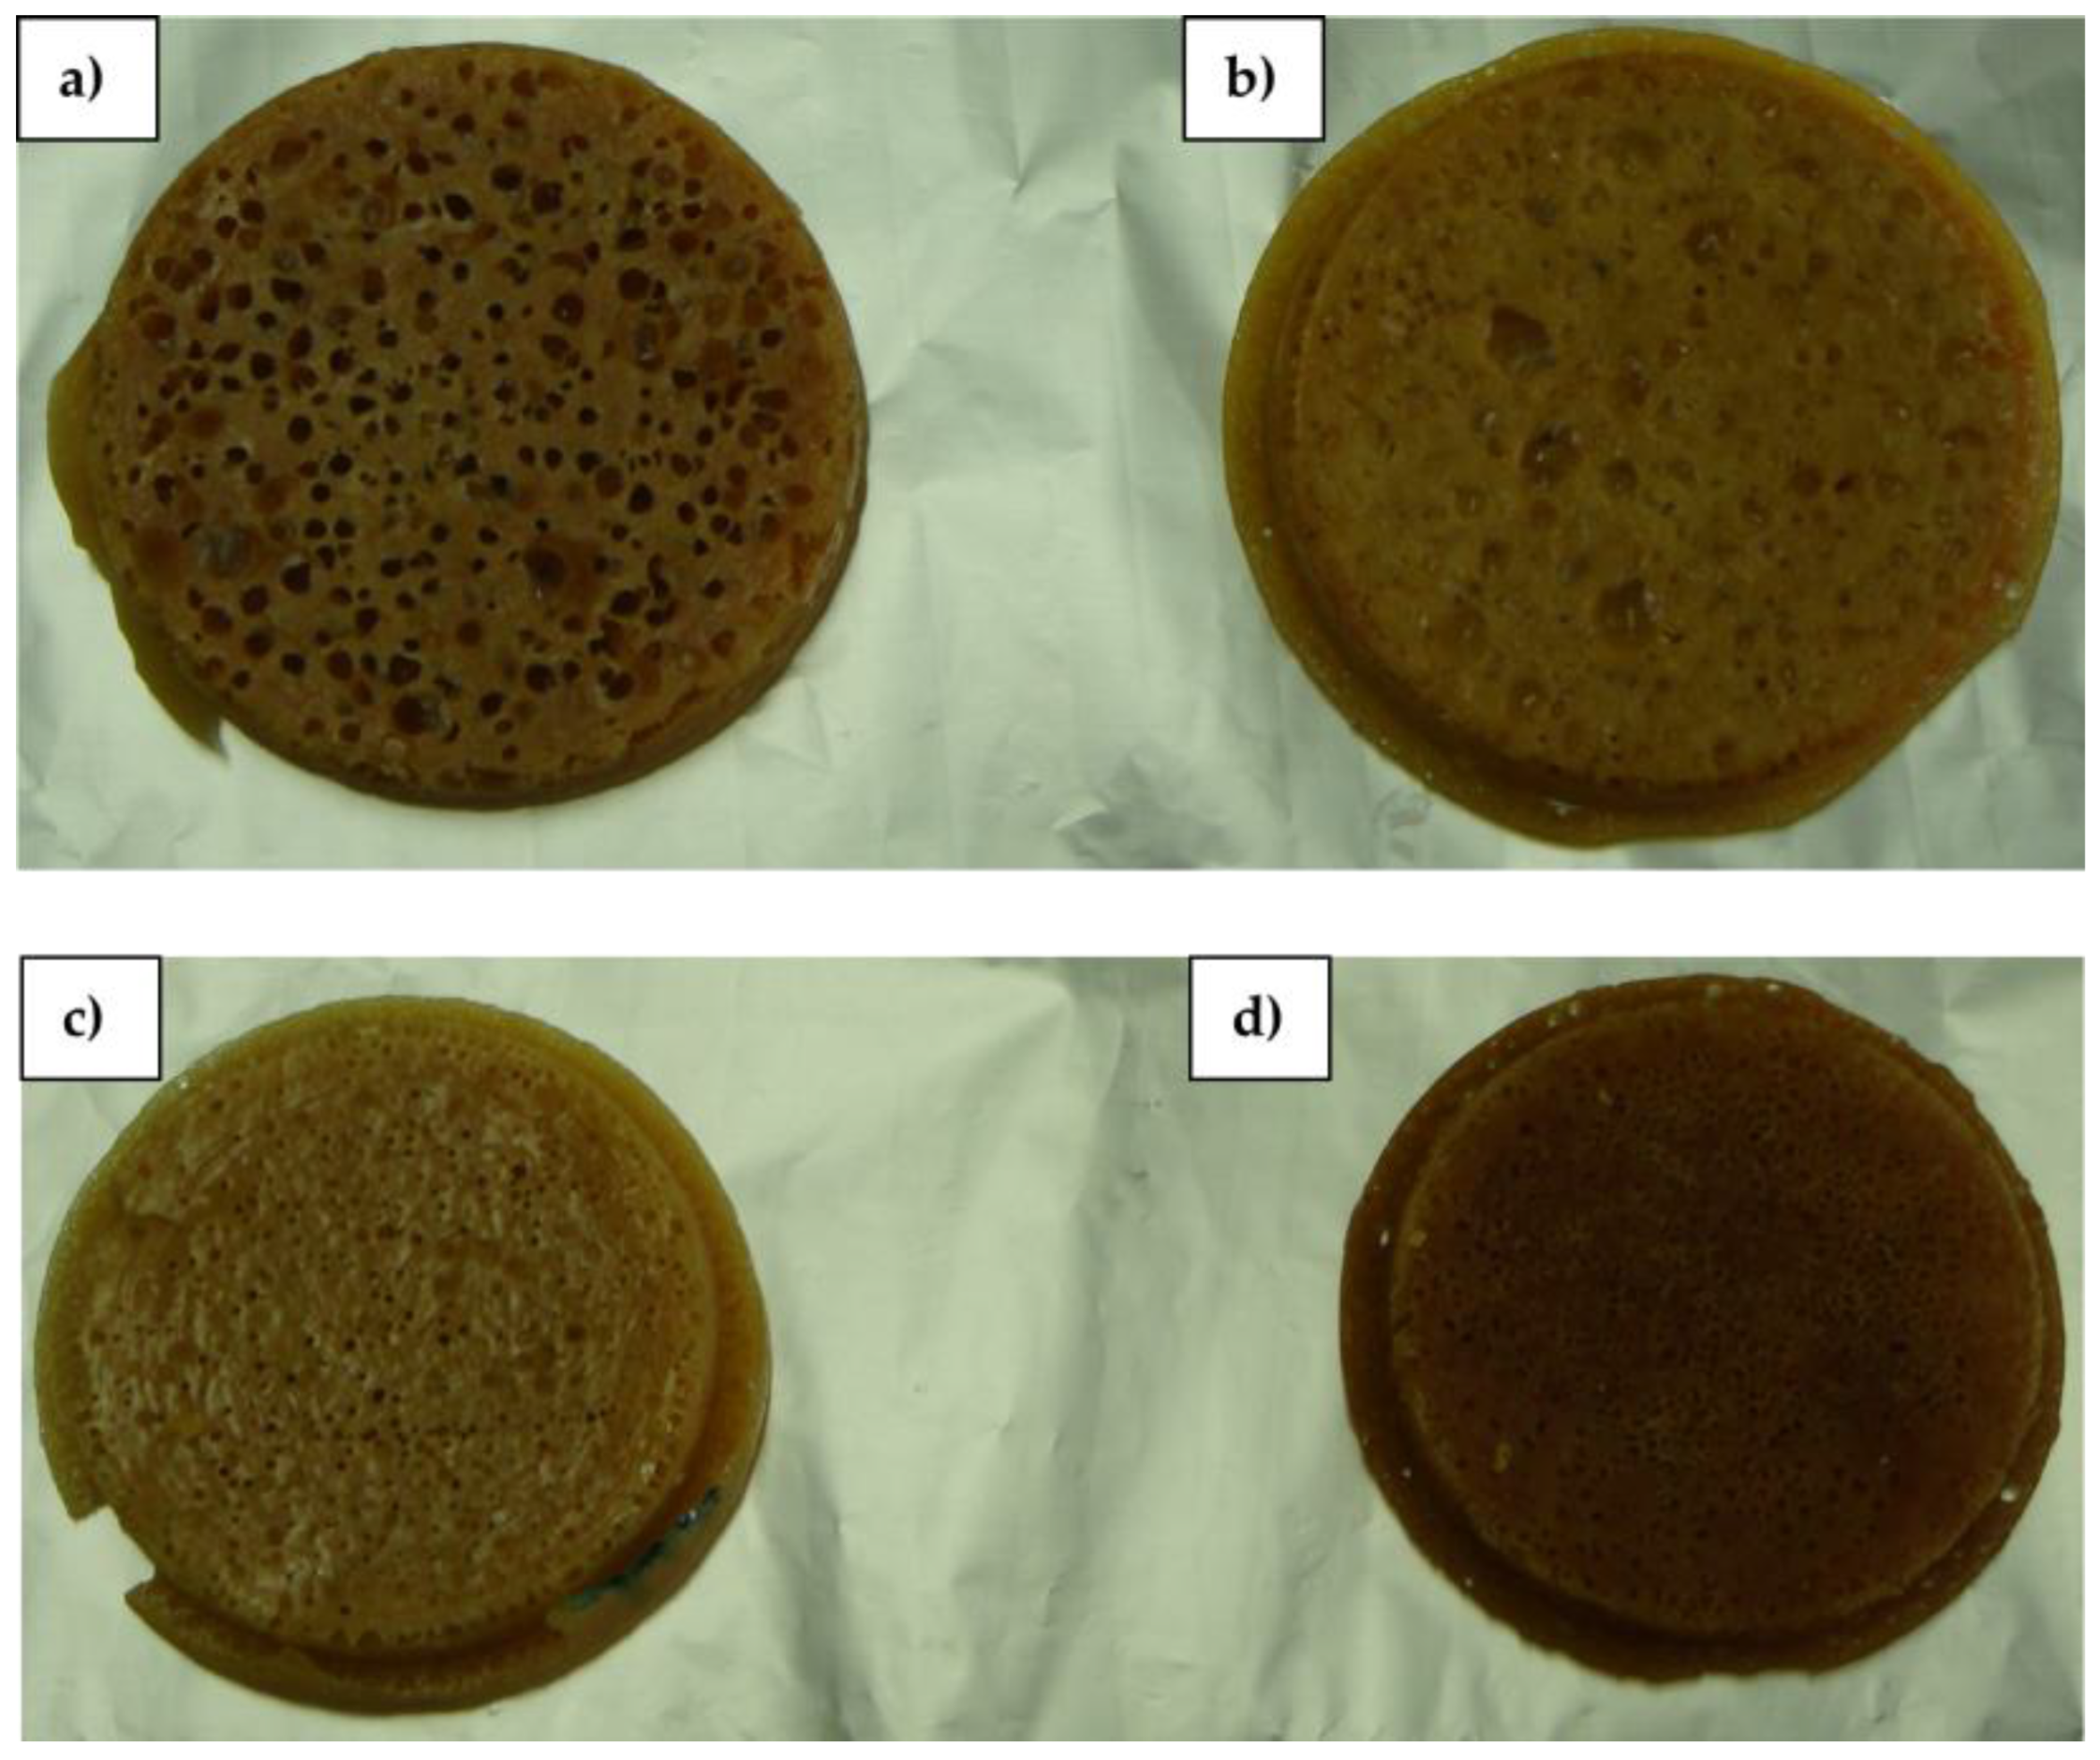
2.2.3. Samples Obtained
Figure 2 presents the PUs before the photodegradation tests. The same materials originally published by Lopes et al. (2022) [
5]; also reproduced in this work for photodegradation tests. The PU were subjected to photodegradation tests at pre-established times of 30, 60 and 90 days.
2.2.4. Sample Preparation
The samples were dried under a vacuum for 24 h at 28 °C and were meant to be cut into 5 cm × 5 cm specimens. They were, however, cut into three equally sized parts, as shown in
Figure 3 (The PUs were cured in circular plates of an approximately 6 cm diameter.).
2.3. Accelerated Aging Test
The PU samples were subjected to photodegradation tests, which consisted of exposure to degrading agents like light, heat, water vapor, and radiation, simulating the natural environment, but in an accelerated process. However, as it is a simulation, the laboratory test cannot be expected to faithfully reproduce natural weather variations. The tests were run at the Univille Biotechnology Laboratory.
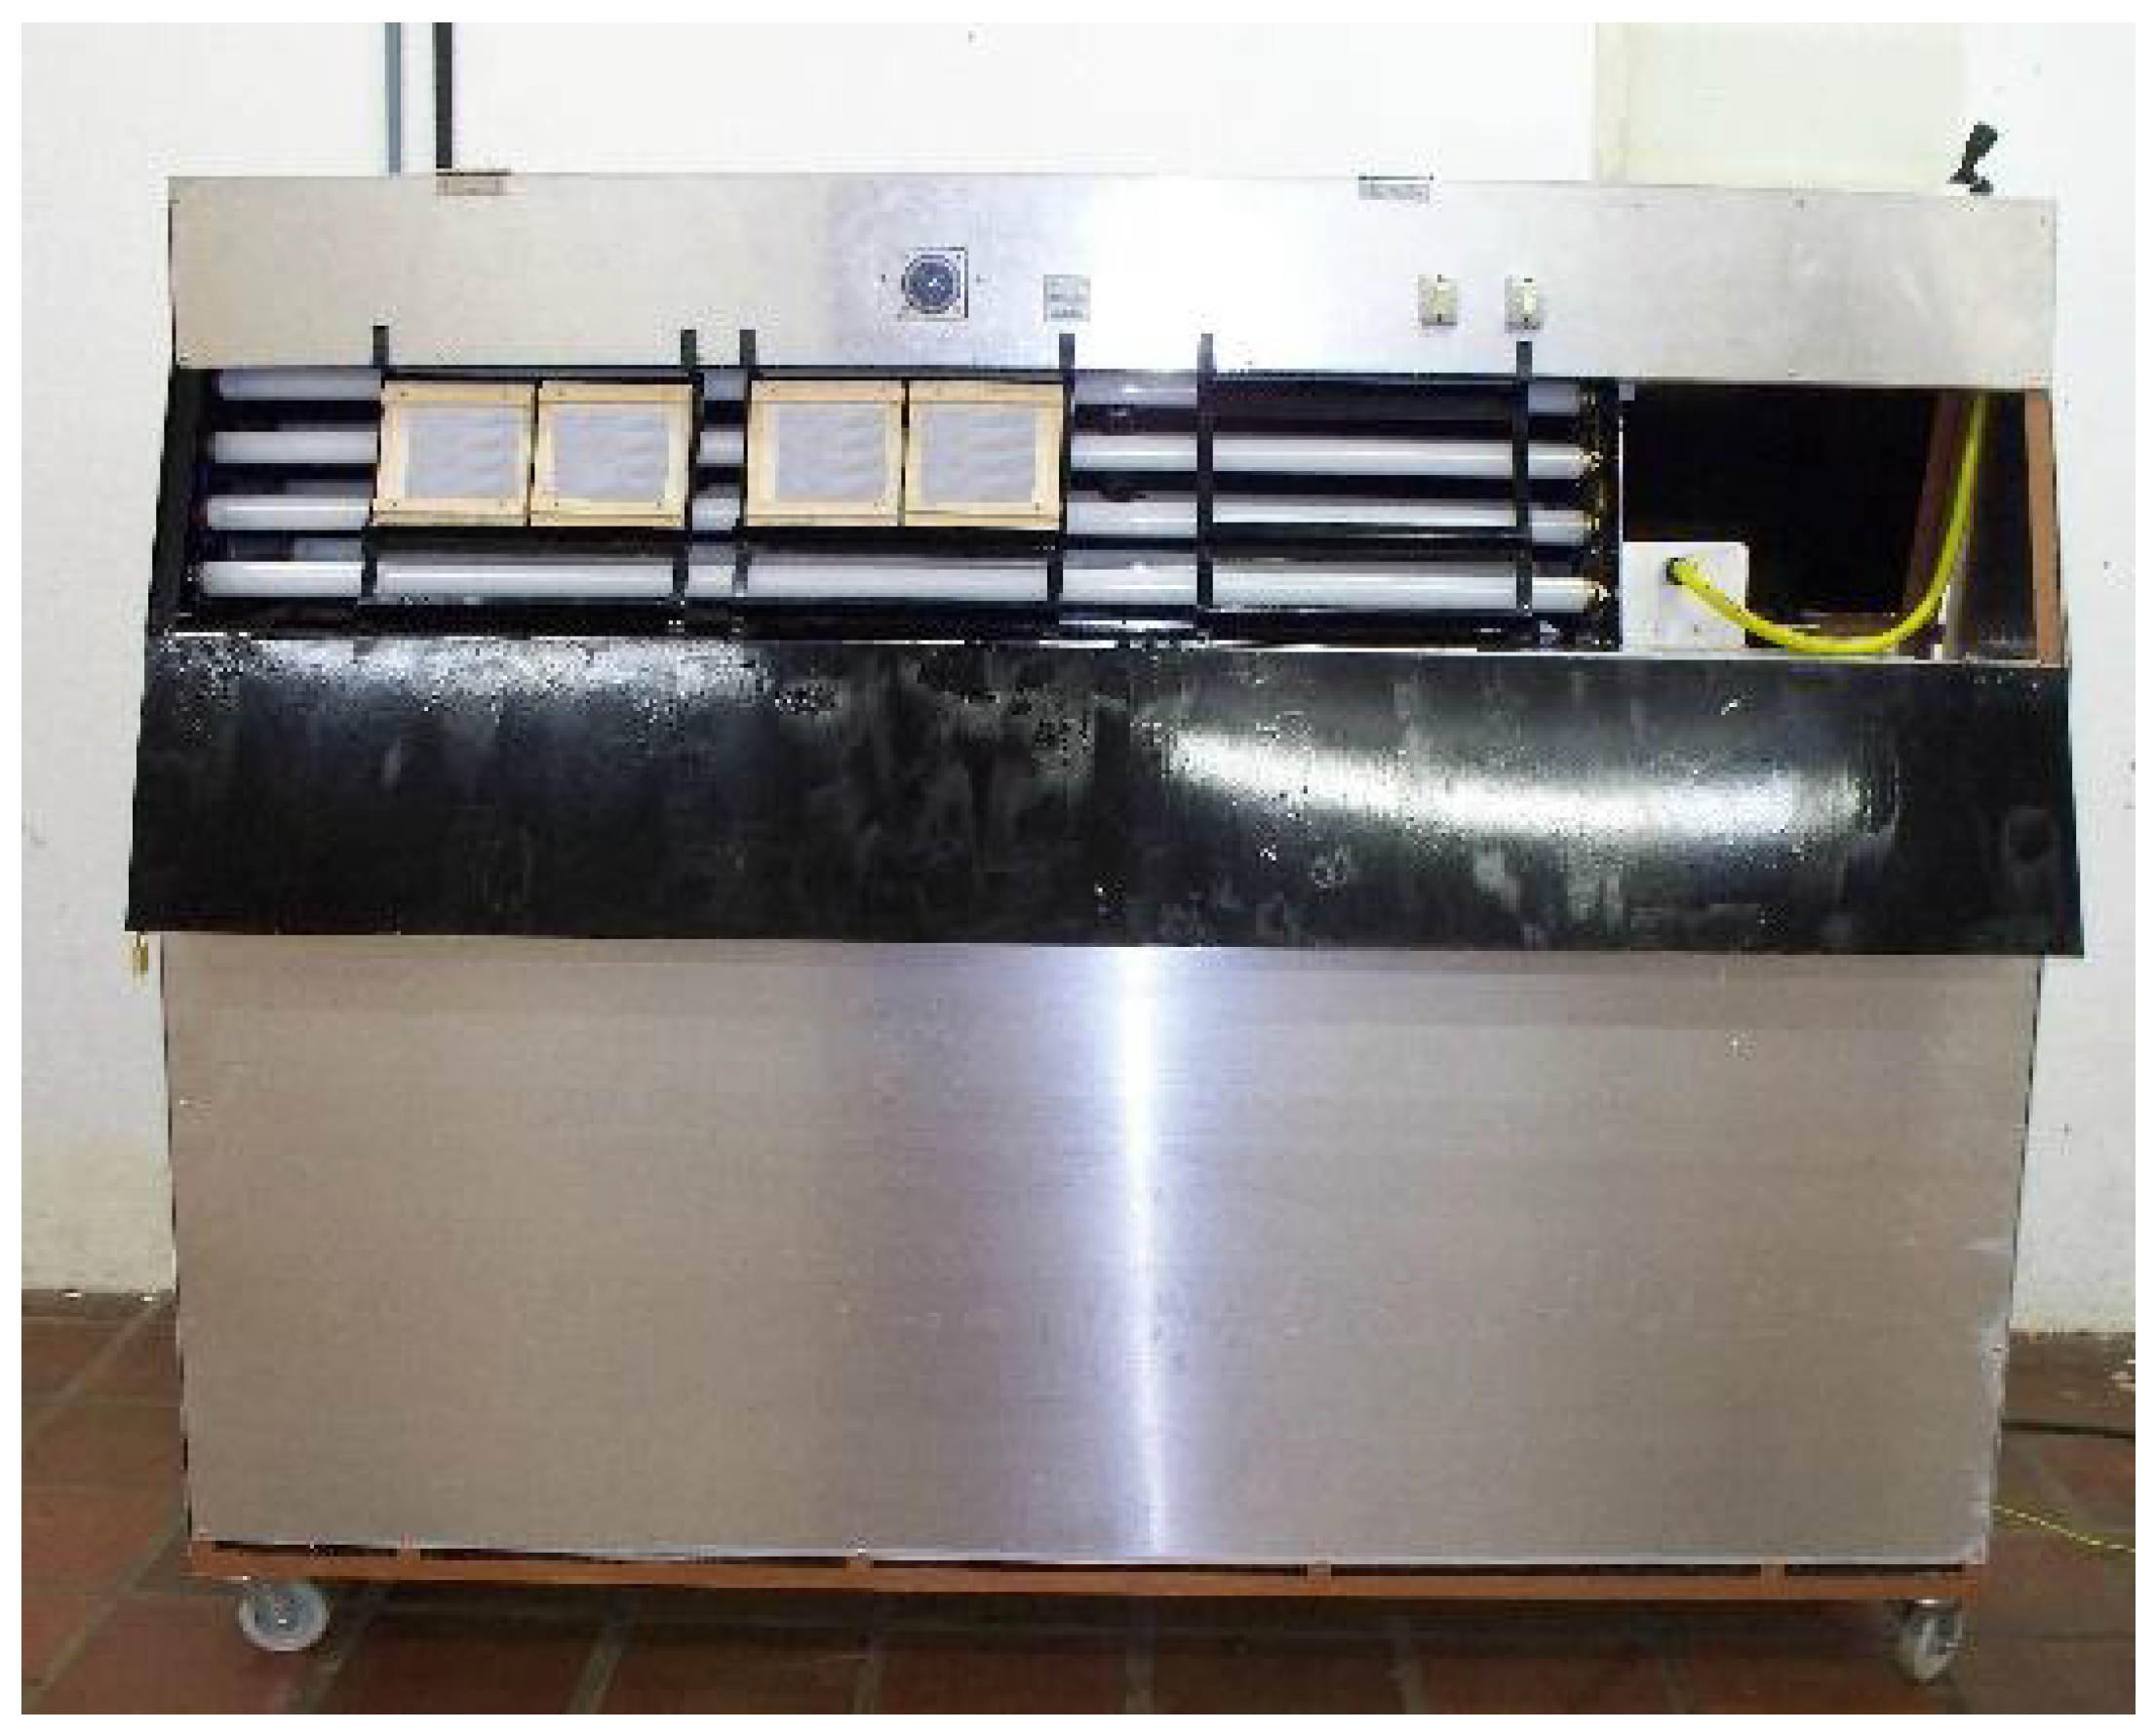
The equipment was constructed according to the standard ASTM G 154-00a [
25] and consisted of eight low pressure fluorescent UV radiation lamps (with an emission of UV radiation highly concentrated between 320 nm and 390 nm and a UVB/UVA emission rate of approximately 1:200), a system for water evaporation and moisture maintenance, a ventilation system, cycle programming control, and temperature and humidity sensors, as well as props for test bodies (
Figure 4).
Samples of the PUs, with the same sizes as those reported in
Figure 1, were conditioned in the accelerated aging chamber, maintained at a mean temperature of 50 °C, average humidity of 85%, and under direct irradiation of UV lamps alternating between 12 h of condensation and 12 h of UV radiation. Samples were collected at 30, 60, and 90 days of exposure, and photographed to observe macroscopic degradation. Subsequently, they were analyzed via TG/DTG, FTIR, and stereomicroscopy to verify the changes in the thermal and structural properties of the materials.
2.4. PU Characterization
Fourier transform infrared (FTIR) spectroscopy was performed using a Michelson Bomem Hartmann and Braun MB100 spectrometer (Serial B), operating in transmission mode over a spectral range of 400–4000 cm⁻1. The samples were prepared as KBr pellets.
The amplified images of the PUs were acquired in a Leica stereomicroscope, model EZ4D, with a digital image capture system with a magnifying glass of 8×. The thermogravimetry (TG) and derivative thermogravimetry (DTG) were performed in a thermobalance Shimadzu TGA-50, using platinum crucibles and 6.0 ± 0.5 mg samples. The temperature was increased from room temperature to 650 °C at a 10 °C⊕min−1 heating rate and in a helium atmosphere (50 mL⊕min−1). The temperature of decomposition (Td) was verified via DTG.
3. Results and Discussion
3.1. Evaluation of PUs Based on the Curing Reaction After 24 h via FTIR
The PU curing reaction was monitored using FTIR, obtaining a spectrum at the initial moment, right after the synthesis reaction, and another spectrum after 24 h curing for each PU, aiming to verify the reduction in the isocyanate and hydroxyl absorption bands.
Figure 5 shows the FTIR spectra of the PUs PULO1A, PULO2A, PUPFO1A, and PUPFO2A, where FTIR was performed at the time the reaction occurred, and after 24 h.
It was observed that after 24 h of reaction, the spectra were similar, regardless of the type of formulation used, except for PULO1A (
Figure 5a). This spectrum showed only a decrease and a split band expansion at 2277 cm
−1, characteristic of unreacted NCO, which, according to Yarahmadi et al. (2017) [
3], is caused by a significant excess of NCO in the reaction mixture compared to the polyol.
For PULO1A, despite the lower overall concentration of isocyanate groups, the reaction may have been incomplete due to reduced reactivity or diffusion limitations in the more flexible matrix formed under these conditions. The lower NCO content combined with the excess of hydroxyl groups can sometimes lead to slower curing or inhomogeneous mixing, which may result in small fractions of unreacted MDI being trapped in the polymer matrix. This can cause the localized retention of free NCO groups, still detectable via FTIR after 24 h.
The observed broadening may be related to the progress in PU curing, i.e., the conversion of the NCO groups into urethane groups, suggesting that in this case, the catalyst did not exert a significant influence. In the same spectrum, the permanence of the broad and strong band at 3380 cm−1, related to the stretching of the OH groups, is also observed. The presence of this band in the final product, the PU, might indicate that the curing reaction has not occurred completely.
However, for the other materials, it is noted that the characteristic NCO band disappeared as a function of the reaction time, possibly indicating that the MDI conversion to the urethane group has been complete. The stretching band close to 3340 cm
−1, characteristic of N-H, was identified in all spectra, inferring the presence of hydrogen bonds in the PU chains [
22,
24].
In the spectra (b) to (d), it is also clear that the stretch band in the OH absorption region appears to persist in 3200 cm−1–3600 cm−1. This can be explained by two factors: first, by the proximity of this band to the characteristic N-H absorption band; second, by the method used to prepare the samples, since it was sprayed with liquid nitrogen. It is possible to infer that, after the evaporation of the nitrogen, water could have been incorporated into the samples. It is worth noting that, regardless of the formulation and the molar ratio used, the FTIR spectra, after 24 h of reaction, clearly indicate that the NCO has reacted by reducing its characteristic absorption band.
The overlap of the C=O stretching bands in MDI and polyols at 1745 cm
−1 was observed only in the spectrum of
Figure 5a. In the other FTIR spectra of the PUs undergoing a 24 h reaction, this band does not appear.
The FTIR spectra of the samples undergoing a 24 h reaction also show the occurrence of stretching bands in the 1084 cm
−1 and 1064 cm
−1 range, typical of the urethane NH–CO–OR group. Between 900 cm
−1 and 675 cm
−1, axial deformation vibrations appear, characteristic of the out-of-plane angular deformation of the C–H bond in aromatic rings [
3,
26].
3.2. Evaluation of FTIR Spectra of the PU Samples After Accelerated Weathering
Several authors have demonstrated that UV-induced degradation in polyurethane materials primarily affects the soft segments of the polymer chains, due to their lower bond energy and higher mobility. For instance, Gradinaru et al. (2019) [
4] observed the cleavage of ester bonds and discoloration in PU membranes subjected to xenon arc lamp weathering. Similarly, other researchers [
6,
27,
28,
29,
30] reported significant chain scission and the formation of oxidized end groups in segmented PUs, leading to a reduced molar mass and thermal resistance.
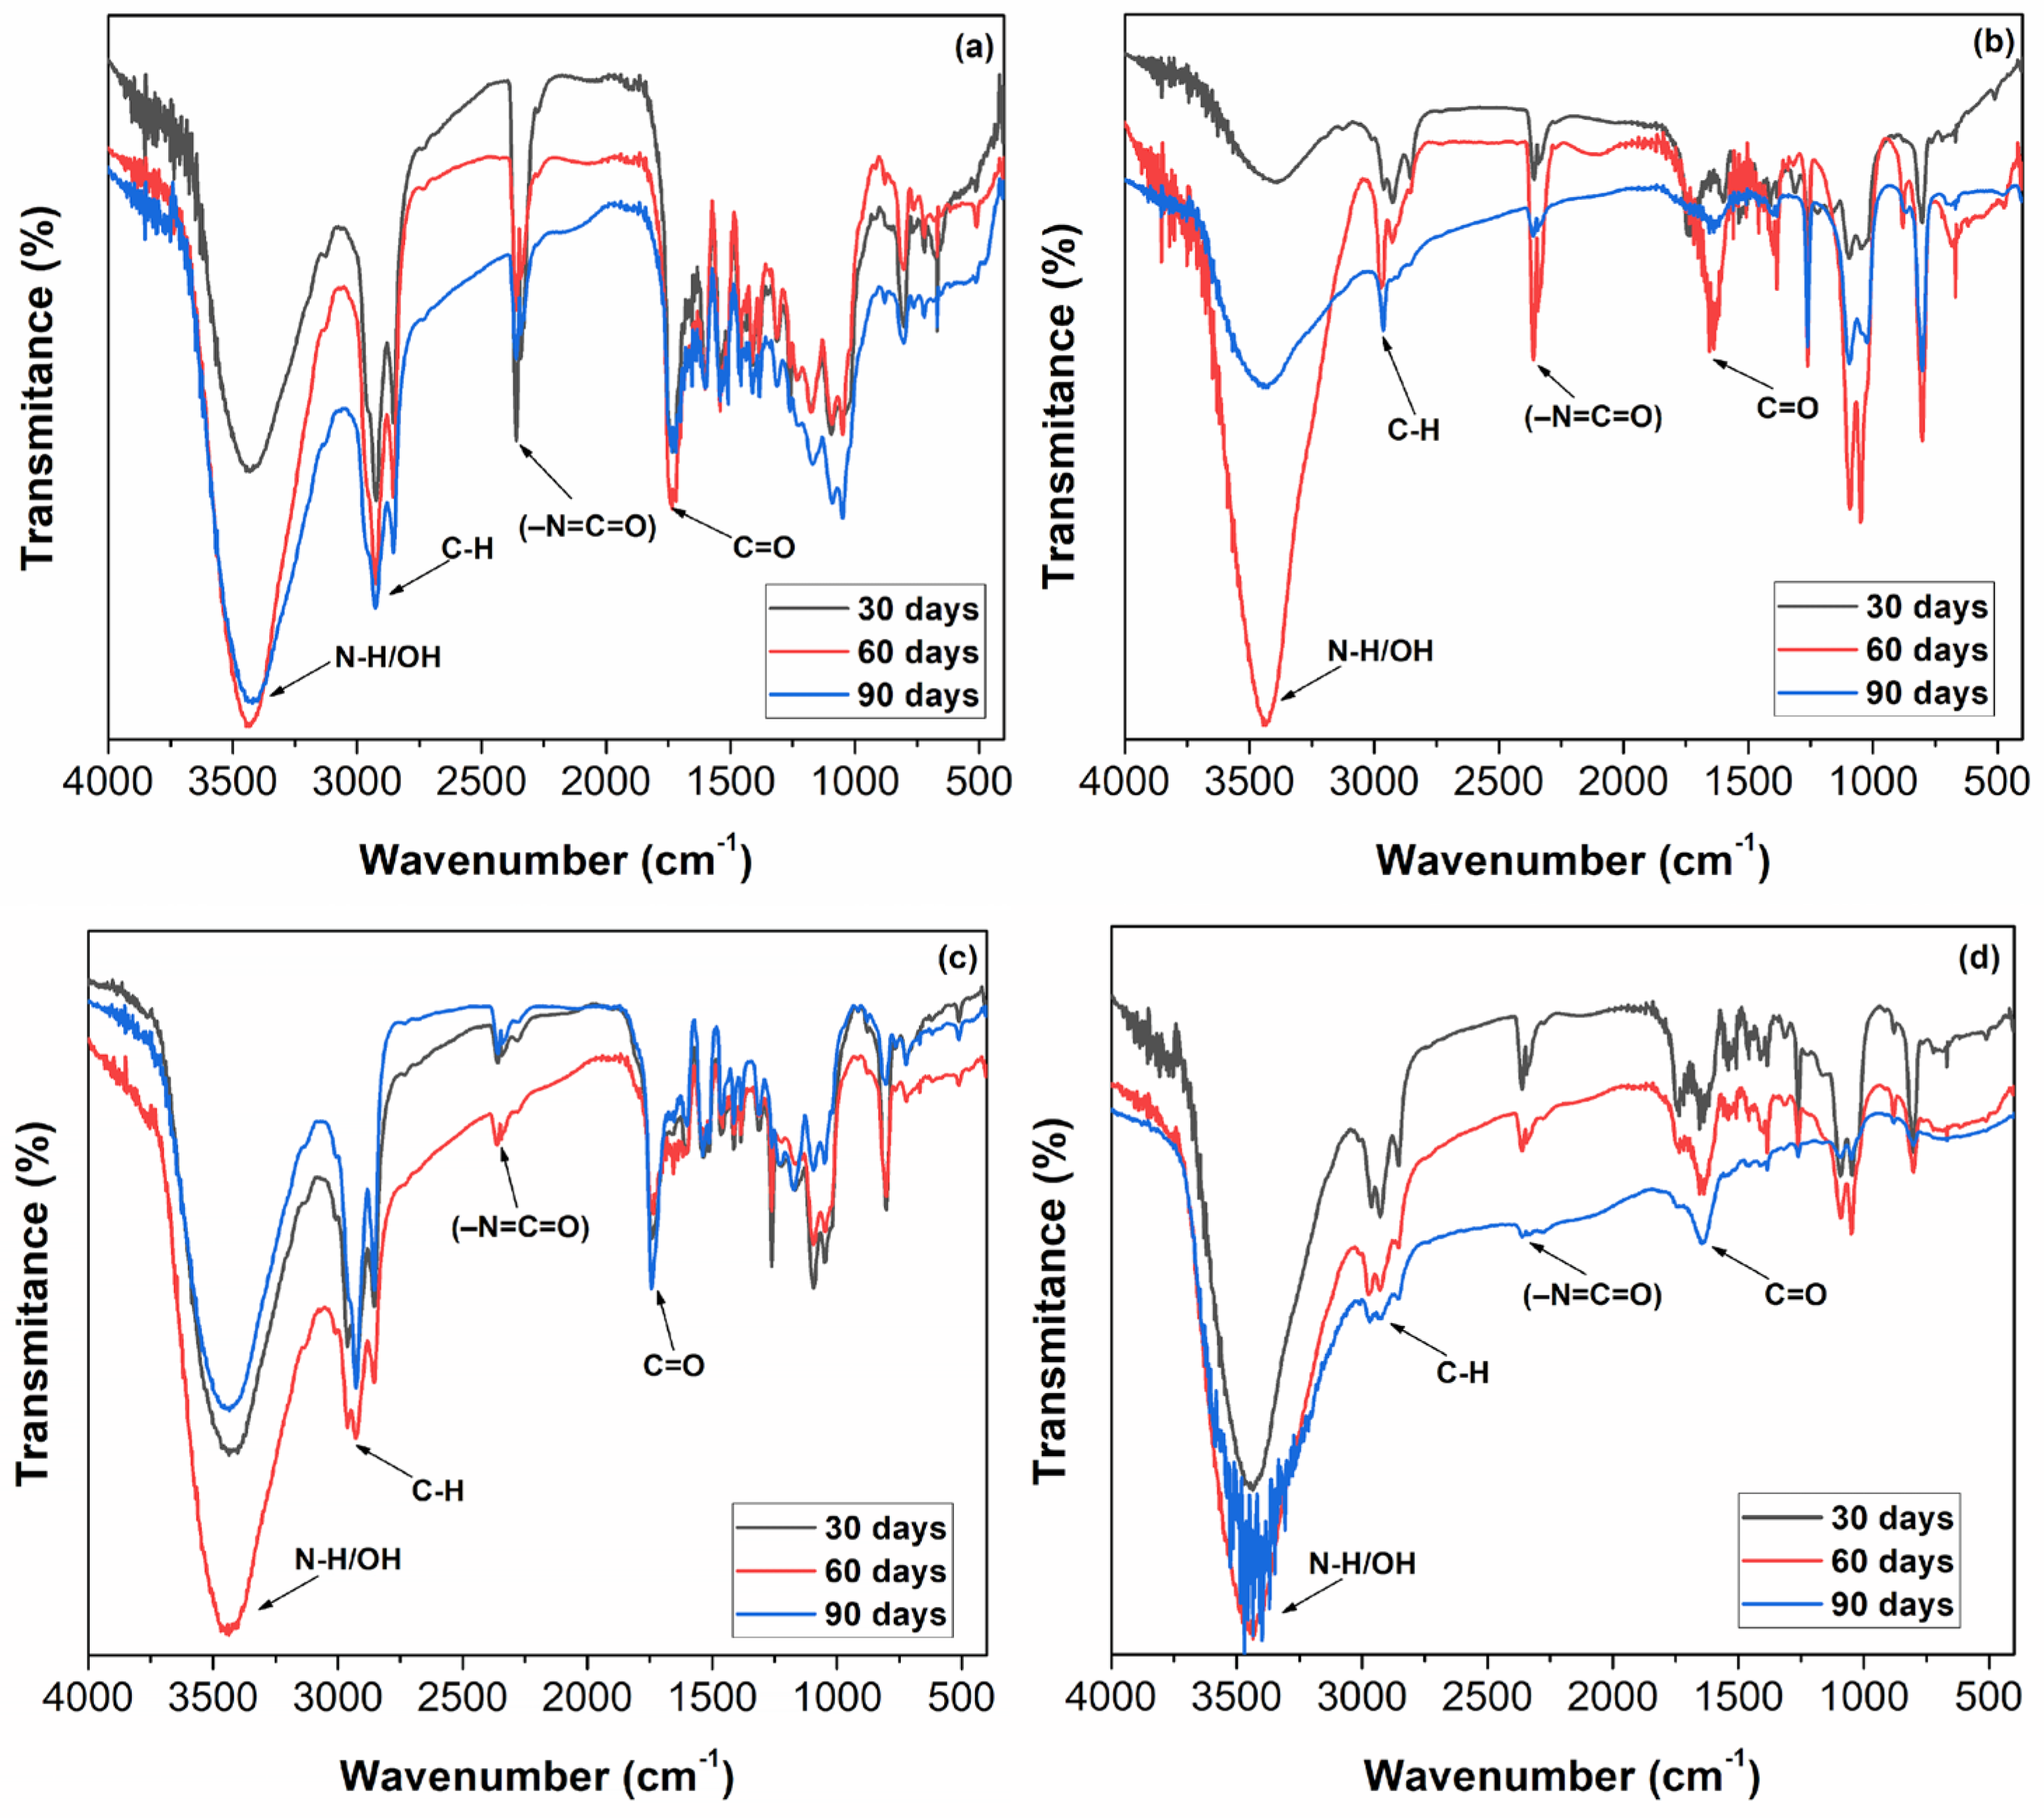
Figure 6 presents the FTIR spectra of the PUs subjected to accelerated weathering for 30, 60, and 90 days.
Differences were observed between the FTIR spectra of the PUs before and after accelerated weathering (comparing
Figure 5 and
Figure 6), indicating that this process had started. It is important to highlight in the spectra of the PUs that, after the accelerated weathering process, some changes were observed in the shape and intensity of the absorption bands of the spectra.
Figure 6 shows that the intensity and shape of the peak at 3330 cm
−1 decreases as the irradiation time increases, especially in the PUPFO2A. The above-mentioned peak represents the stretching vibrational modules of hydrogen in N–H groups, indicating the loss of the urethane group [
4].
The broad bands ~3380–3340 cm⁻1 were observed after the 24 h curing time, indicating N–H and possibly residual O–H stretching. In the 3000–2800 cm−1 broad bands, reduced intensity was observed, suggesting aliphatic chain scission due to oxidation. The 1780 cm−1 band is clearly visible after aging, especially in PULO1A and PUPFO1A, attributed to the formation of oxidized carbonyls. In the 1530 cm−1 band, and in all samples, the presence of the amide II that decreases in intensity after aging was verified, indicating the partial breakdown of urethane linkages. The region between the 1222 and 1069 cm−1 bands was well defined in all samples after 24 h, but decreased over time due to ester bond degradation and oxidative breakdown. The bands in the range between 813 and 770 cm−1 decreased after aging, suggesting the degradation of MDI-based aromatic structures.
The aged FTIR spectra (
Figure 5) no evidence of chemical degradation was observed after 24 h (
Figure 4). The most significant changes occurred in samples with a molar ratio [NCO]/[OH] = 0.8 and in PUPFO2A. These results are consistent with the known mechanisms of polyurethane photodegradation, including urethane bond cleavage, the oxidation of aliphatic chains, and the loss of functional groups.
Table 2 presents the bands observed in the PU samples, the chemical groups assigned to each band, the spectral behavior after accelerated aging, and the corresponding literature references that support the assignments.
In our study, the PUPFO2A formulation exhibited more advanced photodegradation in the FTIR analysis, evidenced by decreased N–H stretching bands and increased carbonyl signals around 1780 cm⁻
1. These changes are consistent with the photo-oxidation processes described by Wilhelm and Gardette (1997) [
15], who reported the formation of hydroperoxides and quinone-imides upon the exposure of MDI-based PUs to UV radiation.
3.3. Stereomicroscopy
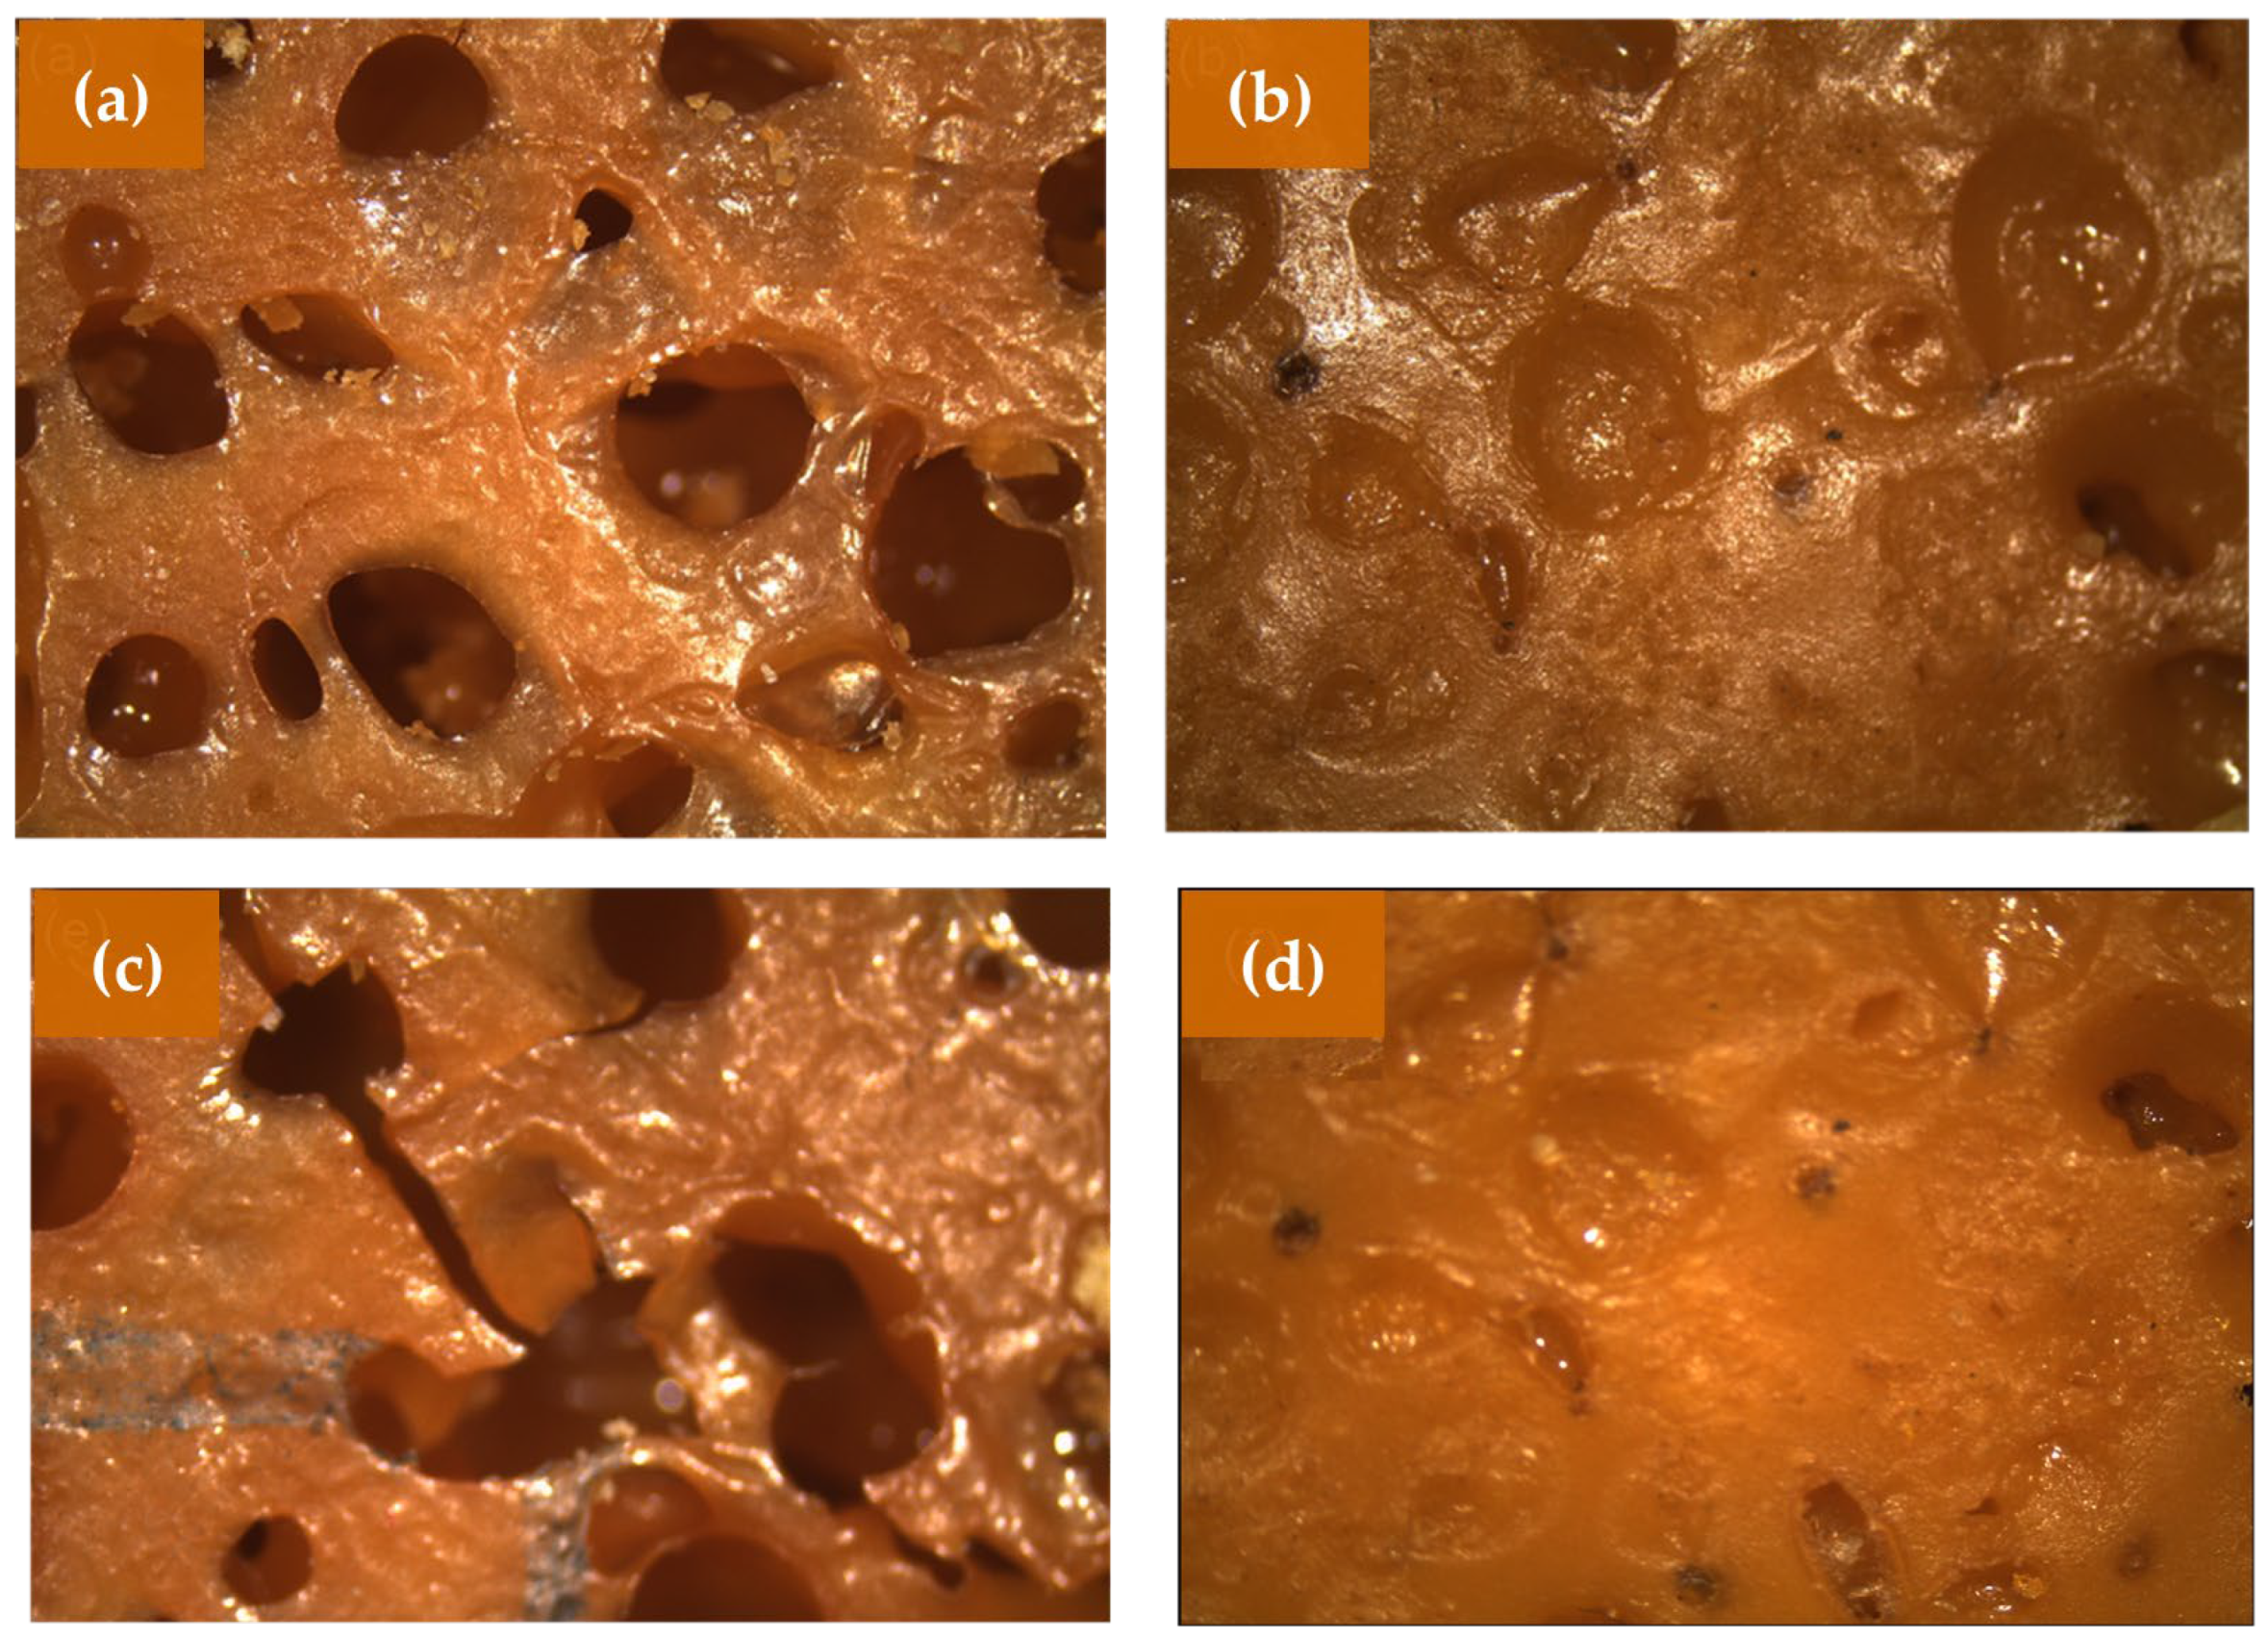
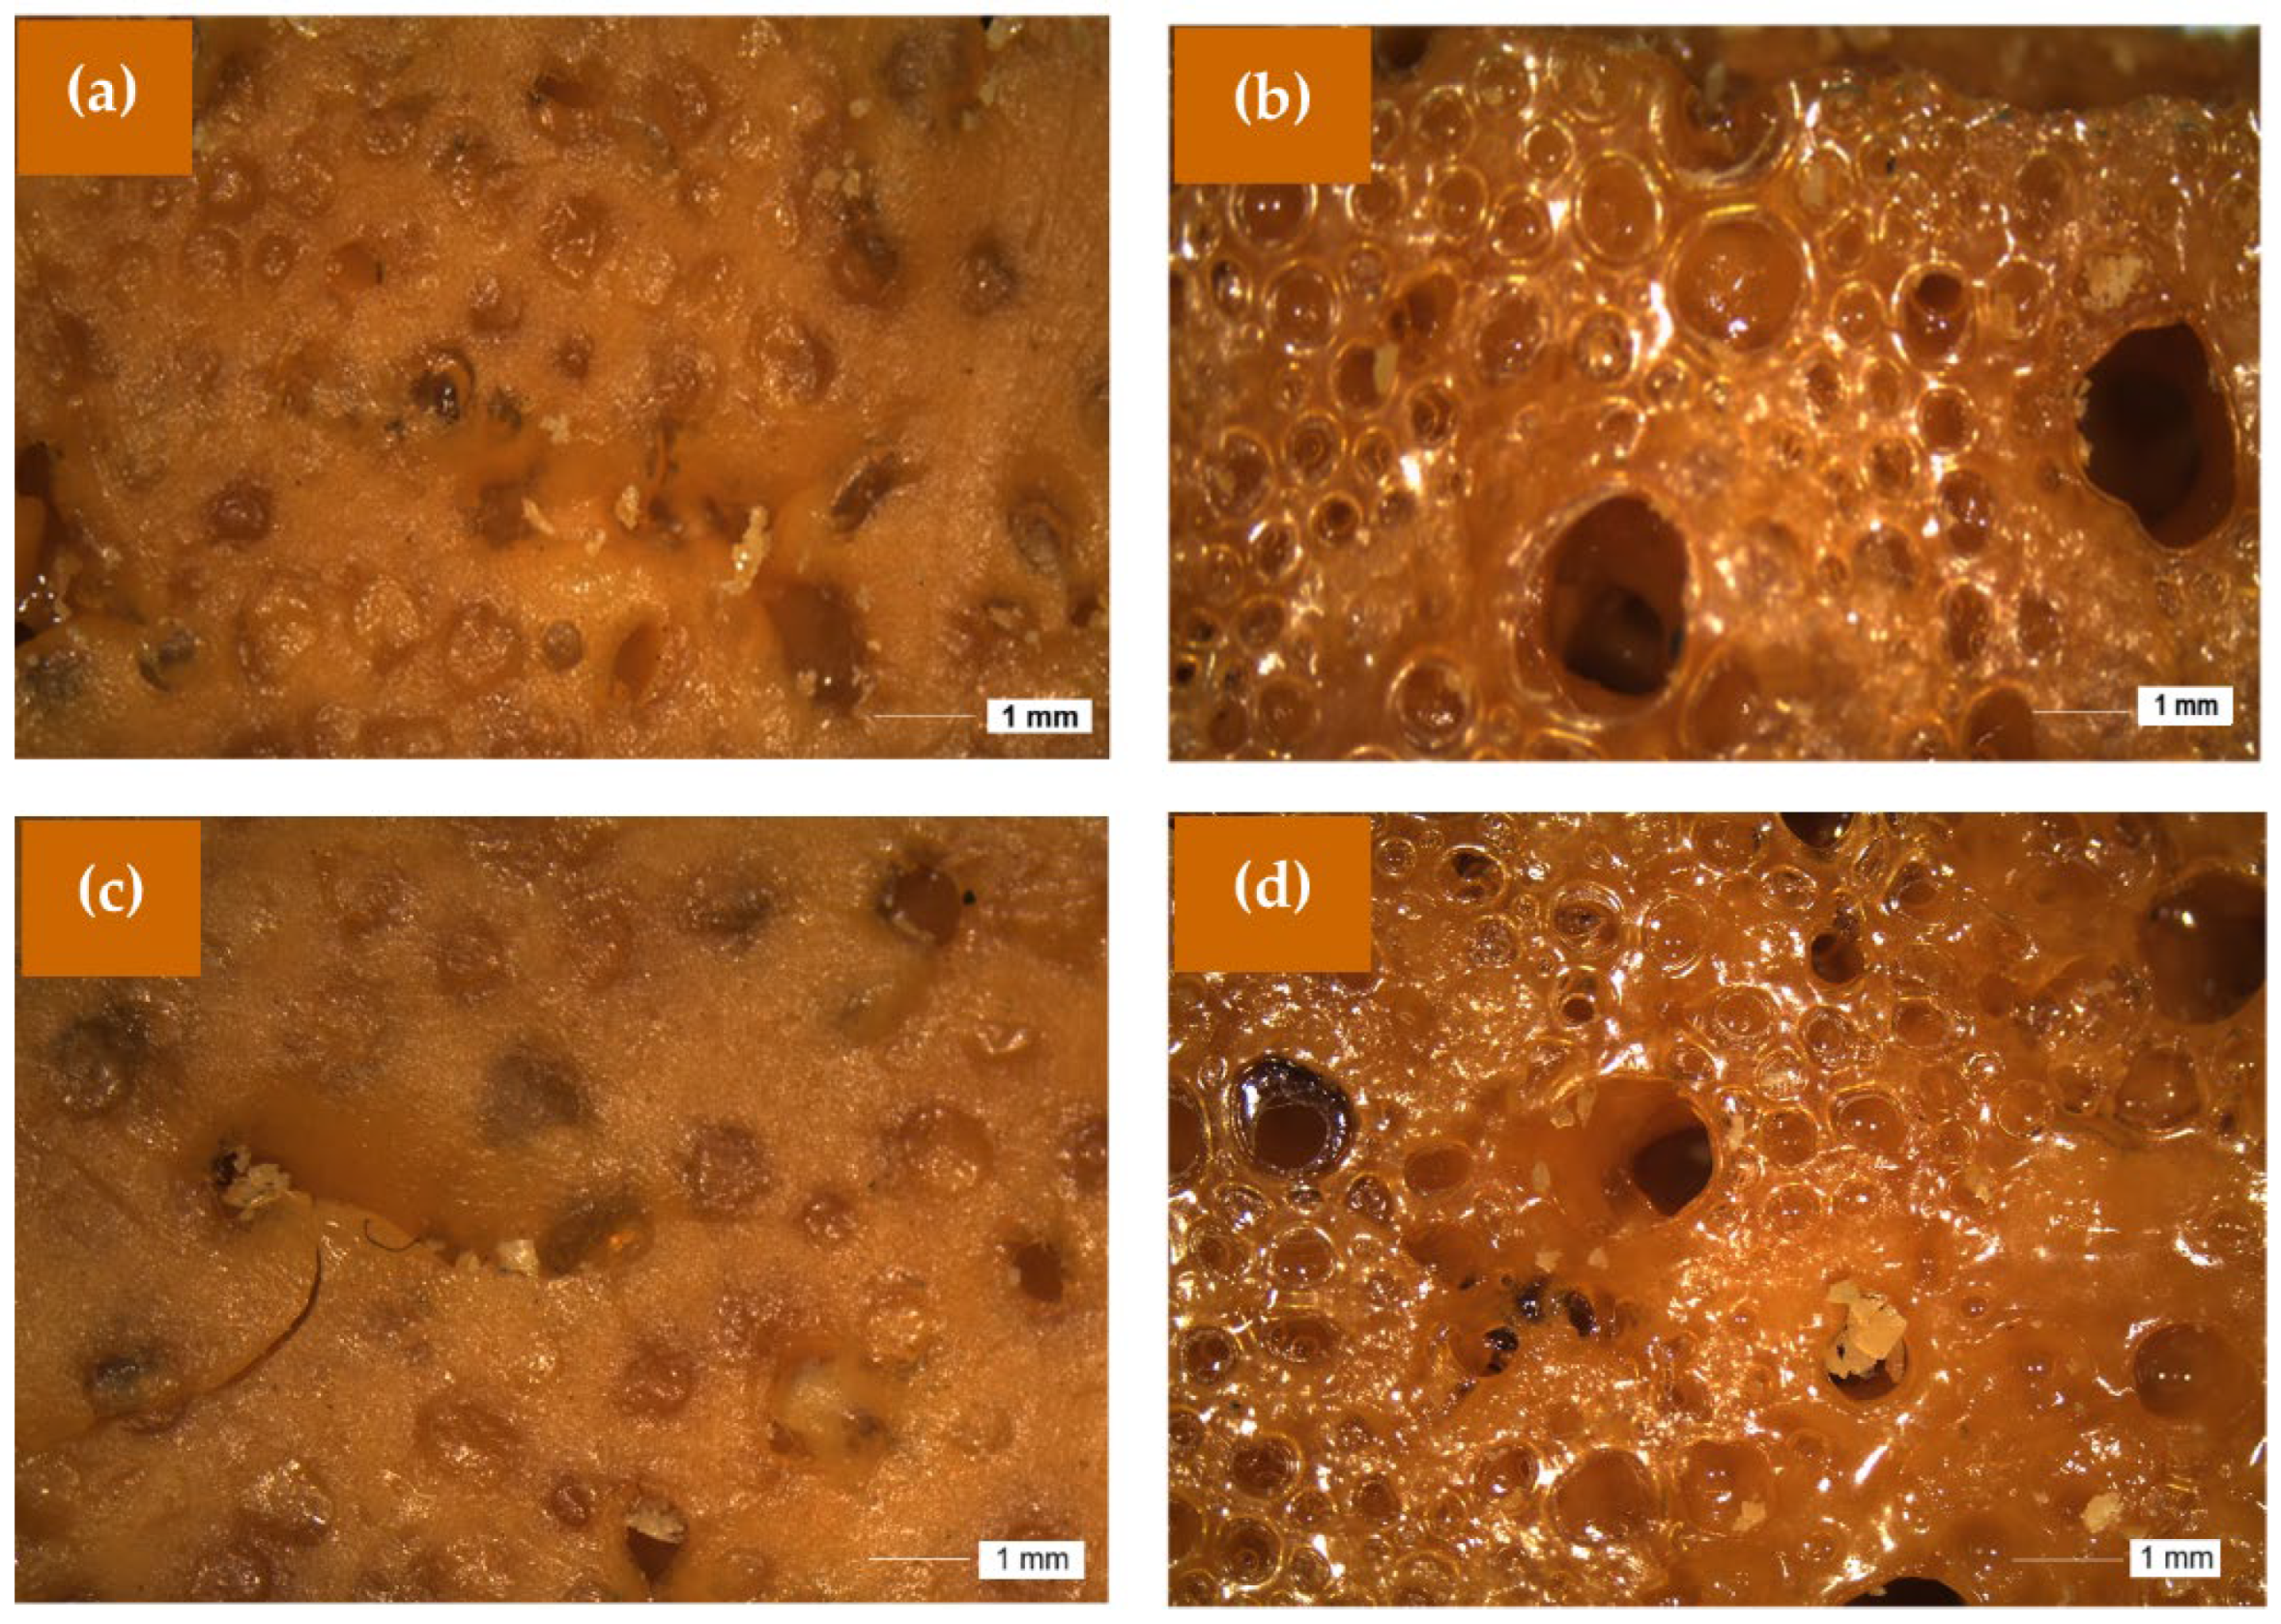
To better visualize the porous structure of the PUs, it was necessary to use a stereomicroscope, which is a device consisting of a magnifying glass and several magnifying lenses. The captured images showed the magnified structure of the PUs in their original colors and shapes, which is another advantage of using this type of equipment.
Figure 7 shows the digital images obtained by the stereomicroscope of the PULO1A and PULO2A, before and after being subjected to accelerated weathering. The same materials originally published by Lopes et al. (2022) [
5]; also reproduced in this work.
Although the PUs were subjected to accelerated weathering for periods of 30, 60, and 90 days, it was found that at the times of 30 and 60 days, the materials presented great similarity compared to the original PUs, that is, a rough surface, non-uniform porosity, and the occurrence of closed cavities. Despite the similarity between the PUs subjected to accelerated weathering and the starting PUs, the presence of cracks was observed in the PUs with a molar ratio of 0.8 and after 90 days (
Figure 7c). This suggests that these PUs were more degraded because they had more flexible segments compared to the PUs with a molar ratio of 1.2.
Many studies indicate that the accelerated weathering of PUs occurs mainly in flexible domains, indicating that resistance to this type of degradation is related to the increased concentration of rigid segments in the PUs’ chain. According to the literature, during the accelerated weathering process, one of the visual effects identified is the yellowing of the materials [
3,
4,
12,
31,
32]. In the PUs under study, this identification was made difficult due to the colors of the materials themselves.
Digital images obtained using the stereomicroscope of the PUPFO1A and PUPFO2A before and after being subjected to accelerated weathering are shown in
Figure 8. The same materials originally published by Lopes et al. (2022) [
5]; also reproduced in this work.
As observed for the LO PUs (
Figure 7), the images of the PFO PUs also show that they were very similar to the starting PUs. The occurrence of cracks was barely evident in them, changes were only observed in the PUs subjected to accelerated weathering after 30 days, remaining without visual changes for up to 90 days.
From a morphological standpoint, stereomicroscopy showed surface cracks and structural roughening, mainly in samples with a lower [NCO]/[OH] ratio (0.8), according to the conclusions of Scholz et al. (2019) [
7], who related a higher cross-link density with improved resistance to photodegradation. PUs with [NCO]/[OH] = 1.2 showed greater resistance to surface cracking, likely due to a higher concentration of rigid segments, as also noted by Chattopadhyay and Webster (2009) [
32].
3.4. Thermal Degradation Analyses (TG/DTG)
The aged PUs were characterized by thermogravimetry, and the results were compared with the non-degraded PUs to investigate the thermal degradation process and infer whether these polymers present high-thermal-stability performance.
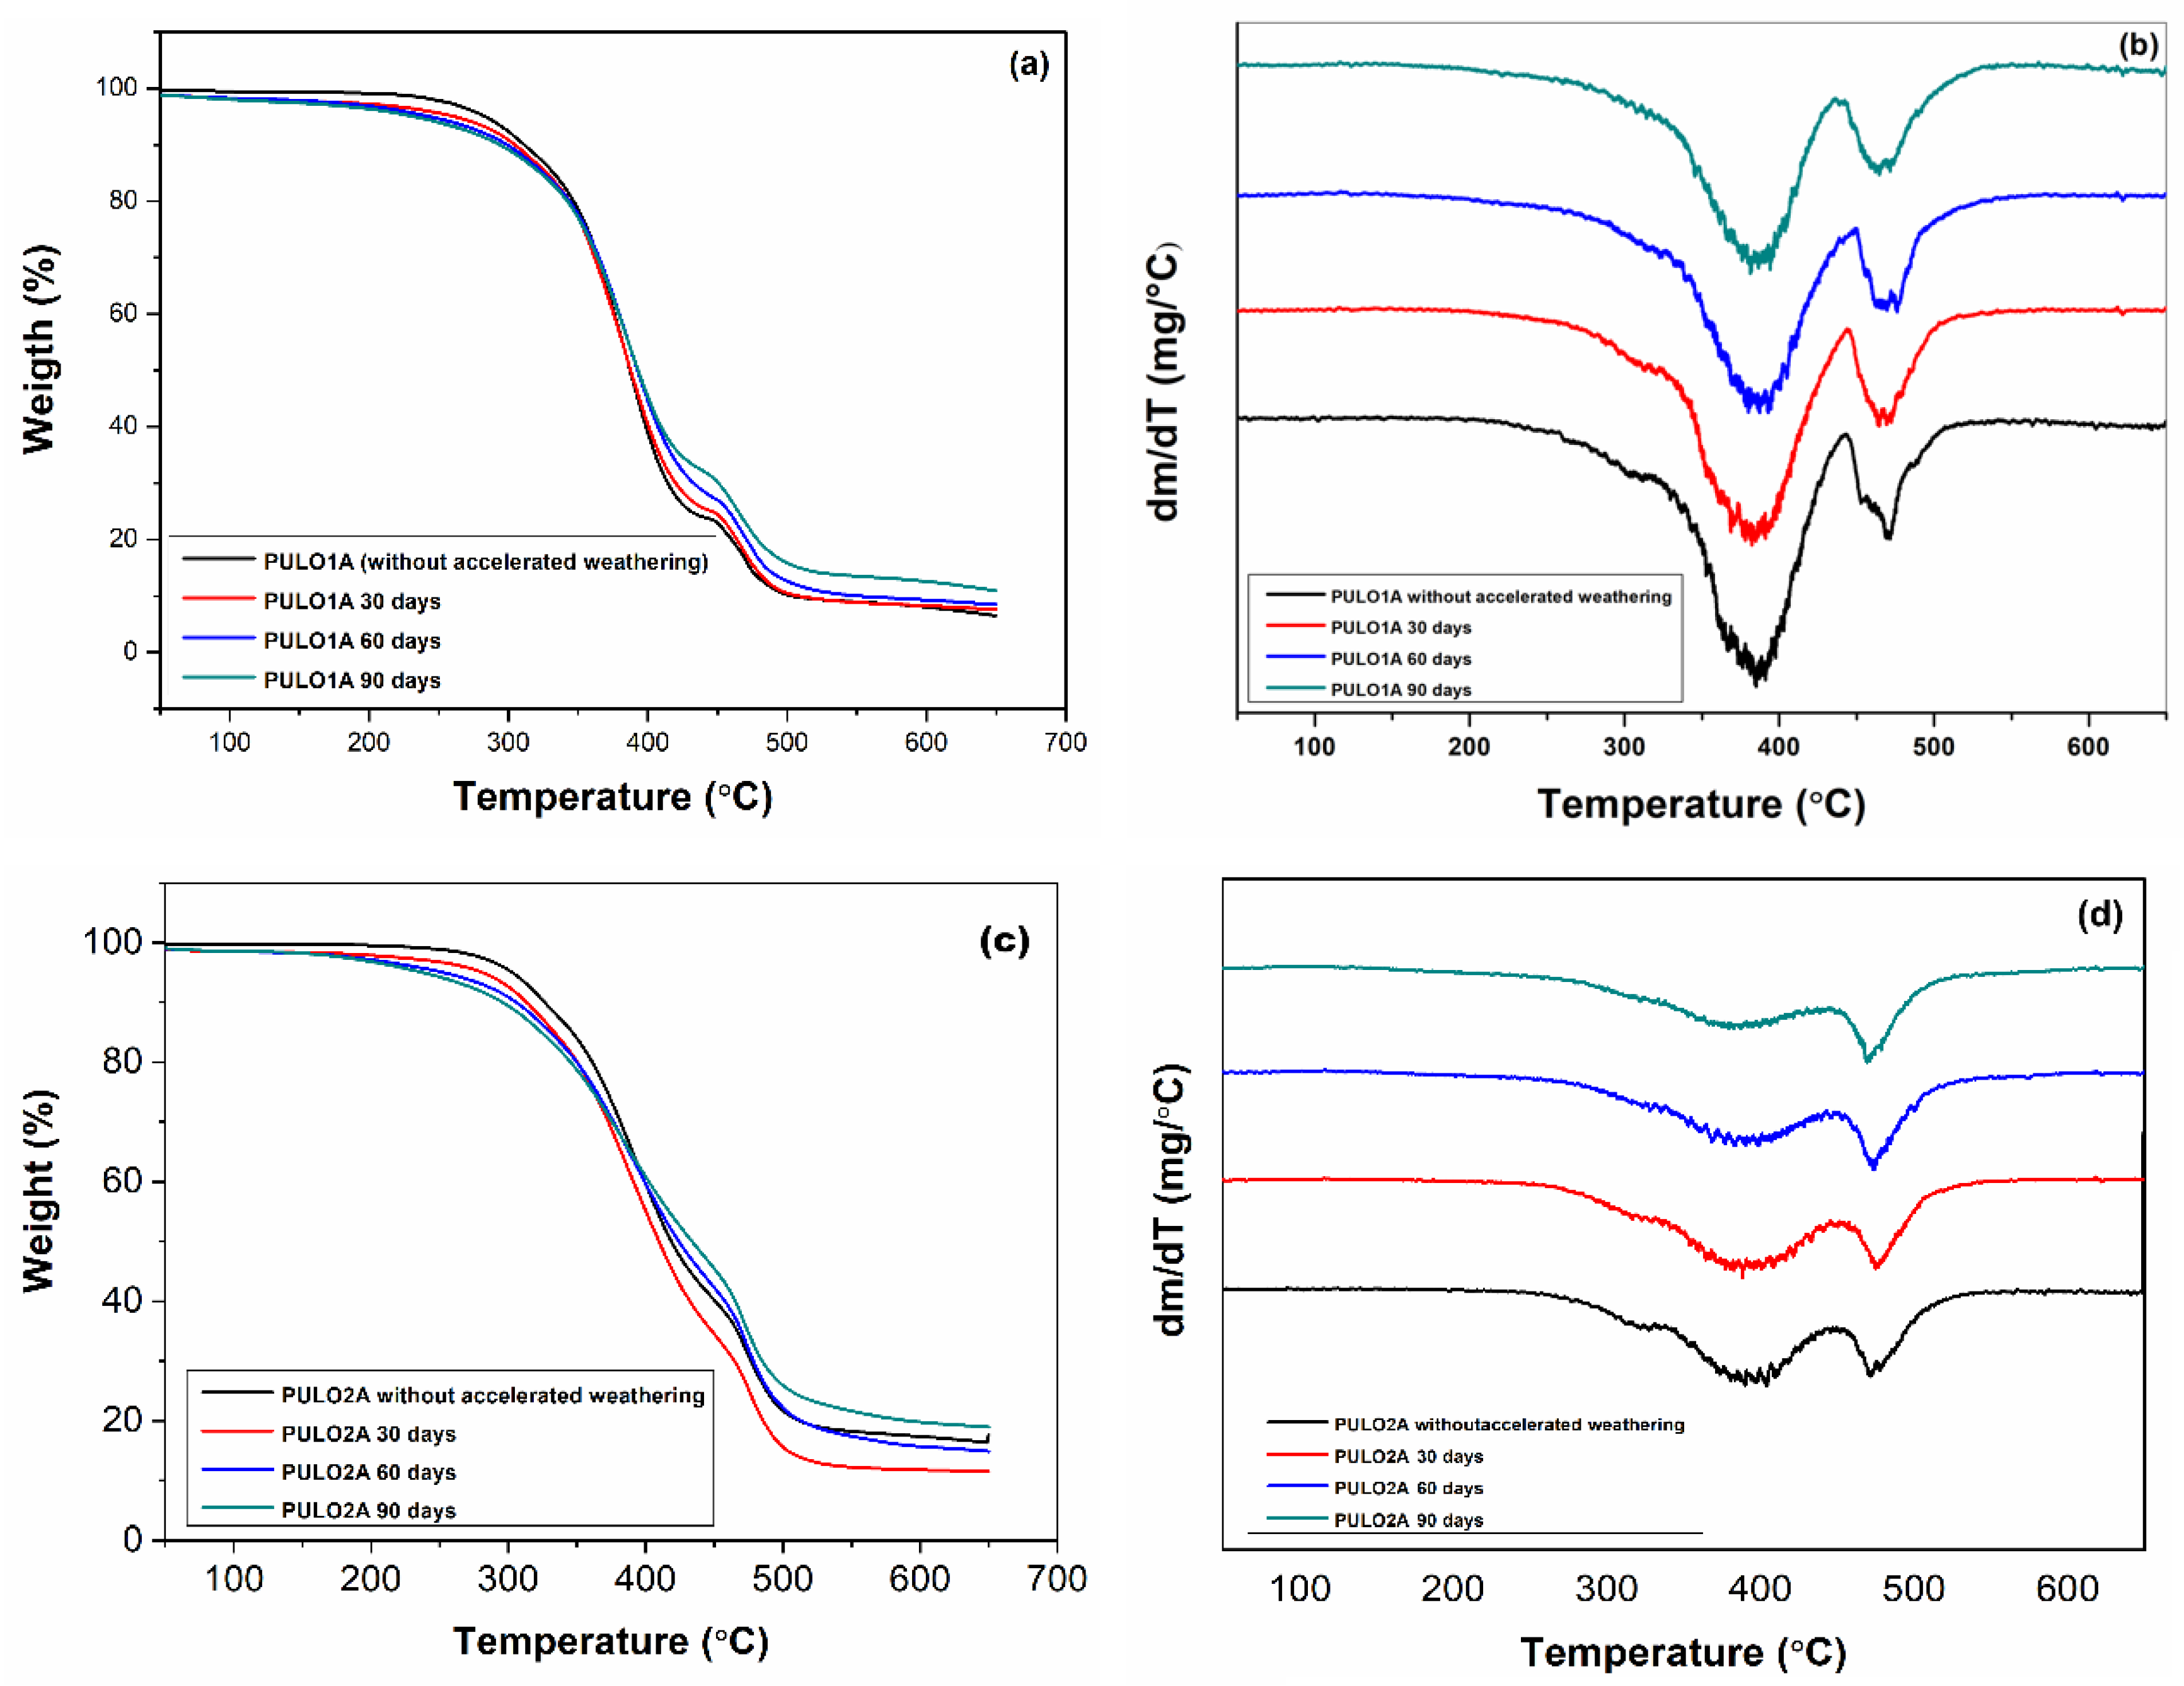
Figure 9 shows the TG/DTG curves of the PUs related to the LO, before and after the process of accelerated weathering.
The TG/DTG curves of PULO1A and PULO2A, subjected to accelerated weathering, presented the same number of thermal decomposition stages, as observed for the respective starting PUs.
Table 3 lists the temperature ranges related to these stages.
It is possible to observe that the thermal decomposition process for all the samples of these photo-aged PUs started at a lower temperature than that observed for the original PUs. It can also be seen that the temperature ranges of the first-stage thermal decomposition decreased with the increasing accelerated aging time of the PUs. This suggests that the degradation process had started. The second stages of decomposition occurred in very similar temperature ranges for all PUs.
It can also be observed from the DTG curves that with the increasing UV radiation time, the thermal decomposition stages of the samples were more defined, compared to the DTG curves of the original PUs.
According to the literature, the first stage, between 200 and 450 °C, corresponds to the degradation of hard segments, being related to the primary breaking of urethane bonding. The second stage is between 450 °C and 550 °C, corresponding mainly to the thermal decomposition of soft segments; it can also represent some rearrangements caused by the degradation of hard segments. These results indicate that, for the initial degradation of the urethane bond, the following possibilities might occur: isocyanate and alcohol might dissociate, as well as primary amine, olefin, and CO
2, and secondary amine formation might occur via CO
2 elimination [
4,
32].
Comparing the data in
Table 4 between original PUs and after accelerating the weathering, the mass loss in both stages of thermal decomposition was similar. This means that, even if free radicals were formed because of irradiation, the samples subjected to accelerated aging remained with nearly the same initial mass.
By analyzing
Table 4, T
d2 can be compared to T
d1, and in all cases, it increased by around 90 °C. This may be caused by the rearrangement of hard segments after manipulation, or even some dimerization or trimerization of the resulting isocyanate structures, which are more closely thermally related [
4,
32].
Furthermore, the Td values of the photo-aged PUs were also close to the Td values of the original PUs, indicating that the modifications in the flexible chains are related to the chromophore groups.
With increasing time in the aging chamber, the DTG curves of the samples show that thermal decomposition was more pronounced in the second stage for the 1.2 molar ratio PUs, suggesting once again that the modifications in the structure of these PUs were more pronounced in the urethane bonds.
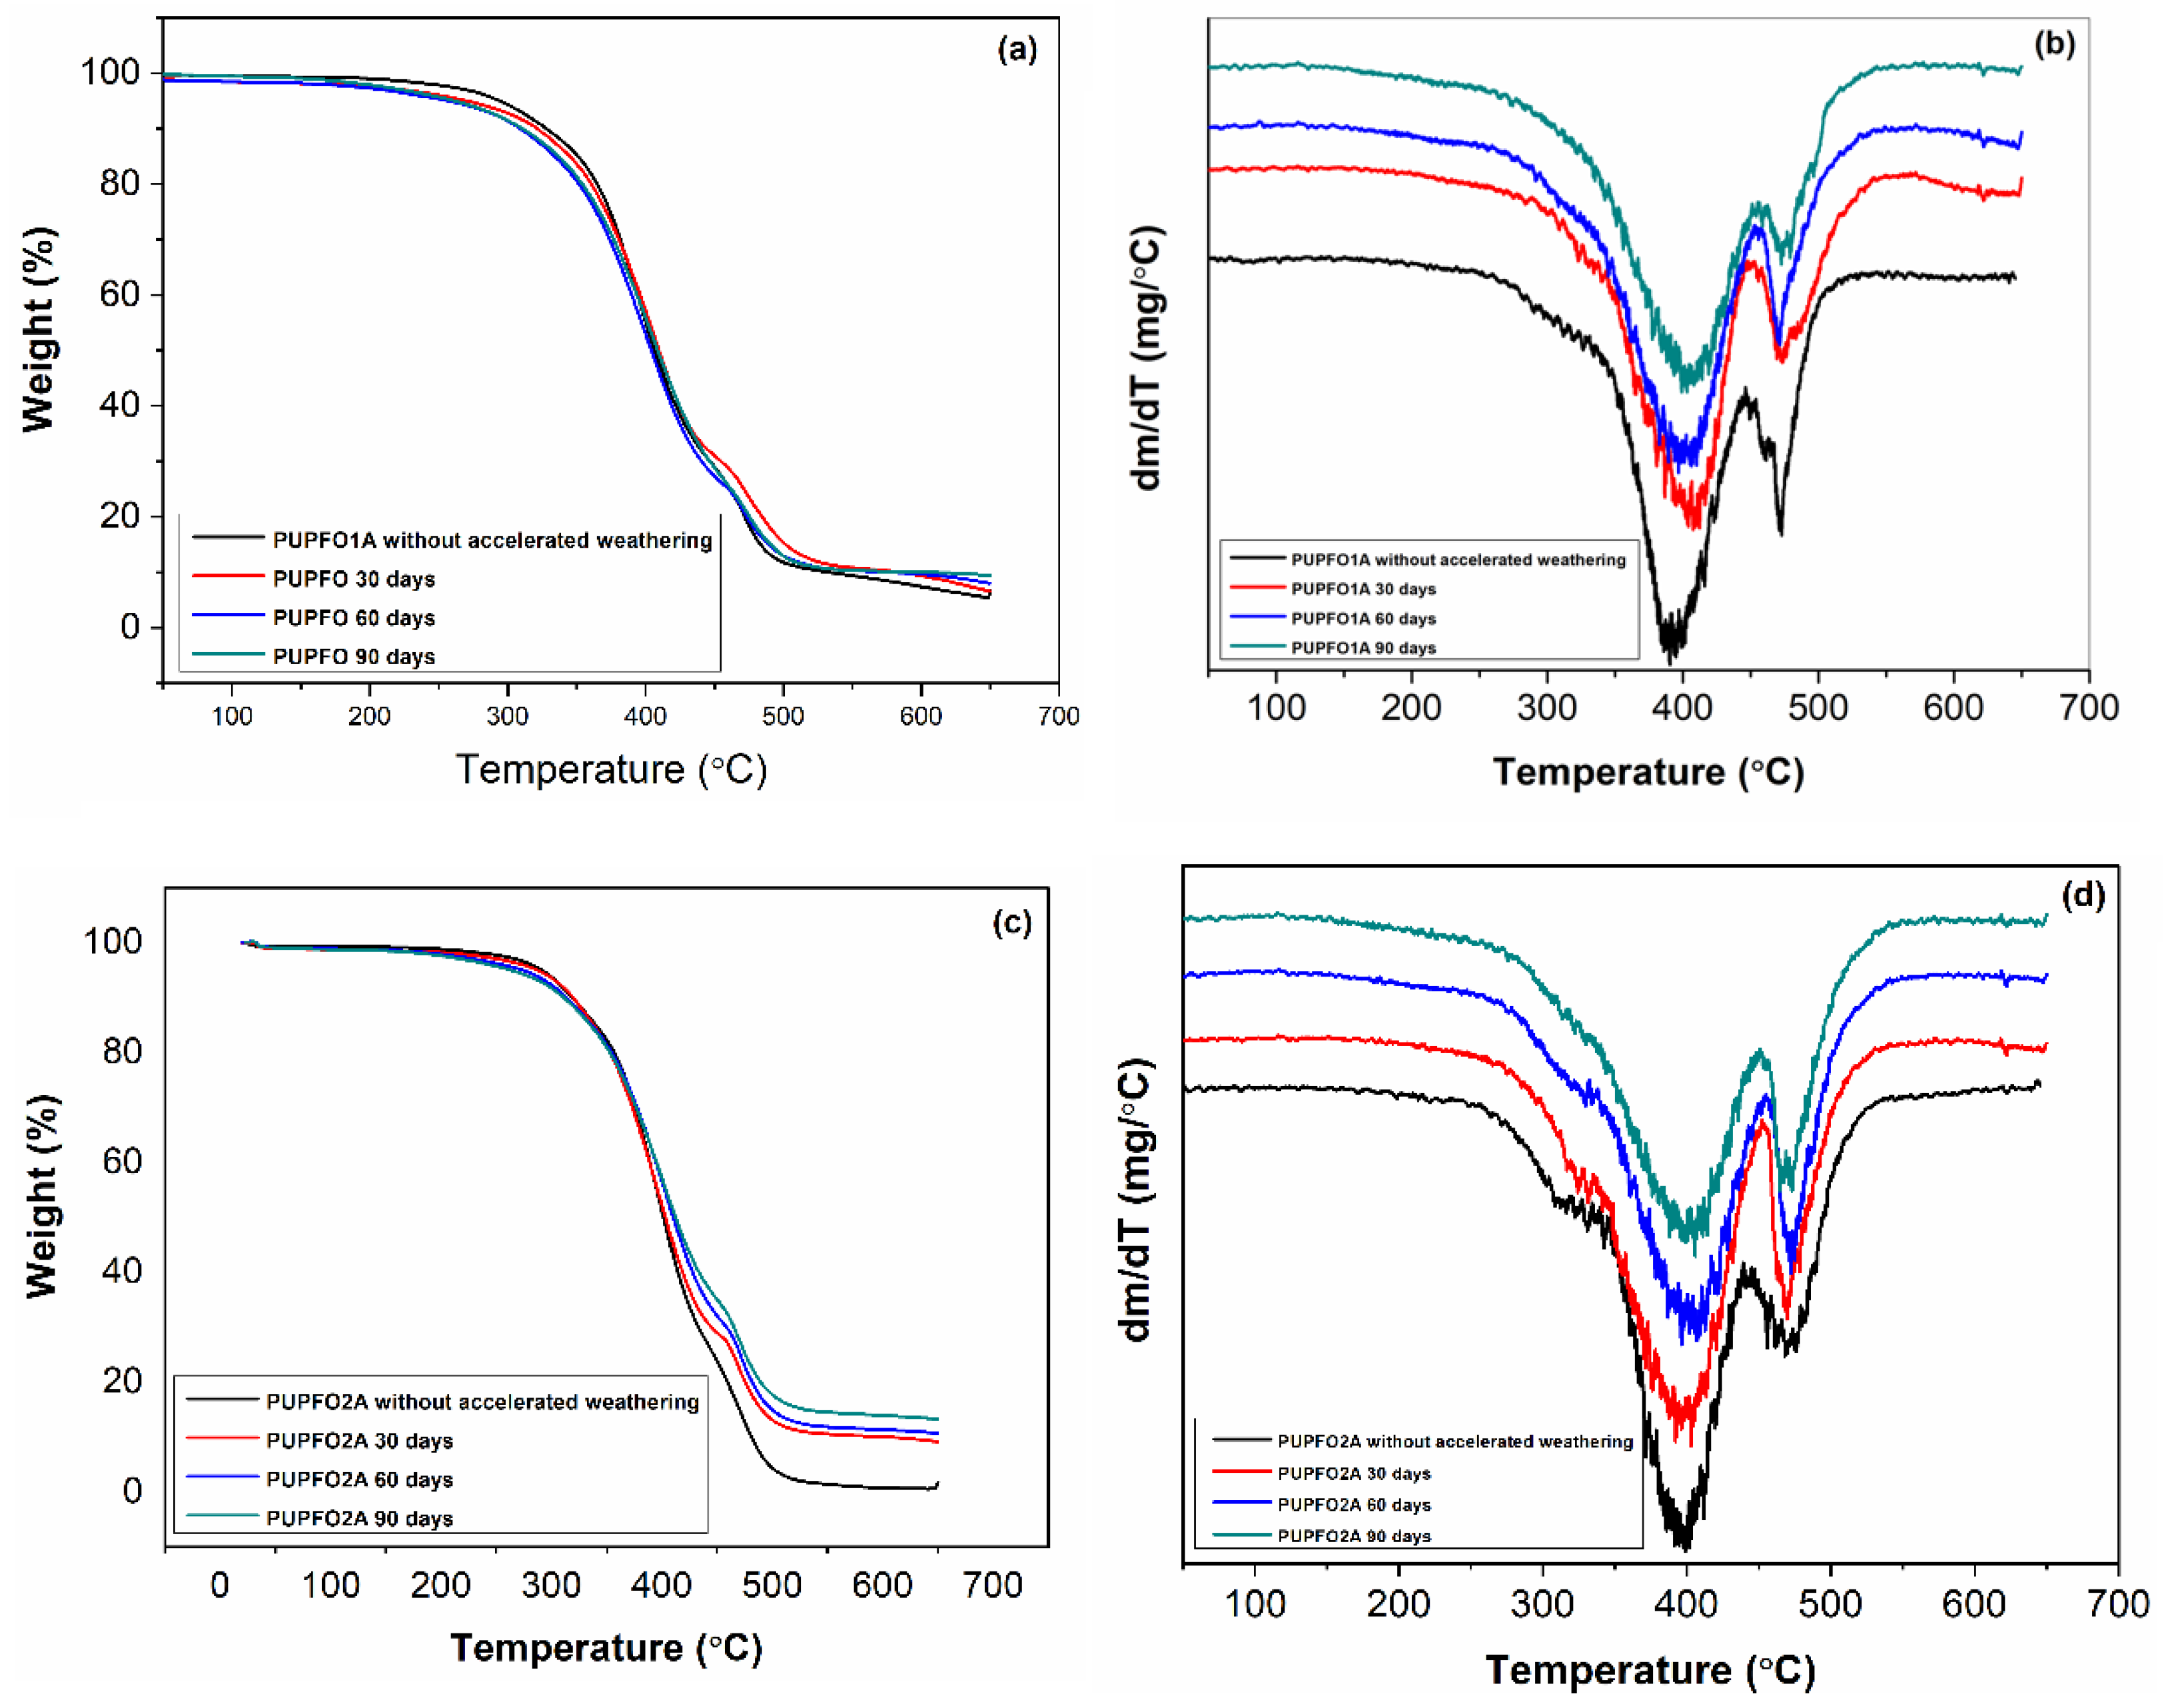
Figure 10 shows the TG/DTG curves of the PUs originating from the PFO, before and after the process of accelerated weathering.
The TG/DTG curves of PUPFO1A and PUPFO2A subjected to accelerated weathering also showed the same number of thermal decomposition steps as observed for the respective starting PUs. Furthermore, the peak shapes of their DTG curves were similar, unlike what was observed for the LO PUs. The temperature ranges relative to the thermal decomposition stages for PUPFOA and PUPFO2A are listed in
Table 5.
The values of the temperature ranges for the photo-aged PUPFOs indicate a similar behavior to that of the LO PUs. In other words, the thermal decomposition process for the photo-aged PUs started at a lower temperature than that observed for the original PUs, and the temperature ranges of the first thermal decomposition stage also decreased with the increase in the accelerated aging time.
Table 6 shows that the T
d and mass loss values for the two stages of thermal decomposition of the PUs compared to the PFO, after the photo-oxidation process, suggest similarity to that observed for the respective starting PUs.
Table 6 shows that T
d2 compared to T
d1, and in all cases, increased around 80 °C. As for the PUs synthesized from LO, this may have been caused by the rearrangement of hard segments after manipulation, or even some dimerization or trimerization of the resulting isocyanate structures, which are more thermally similar [
4,
32].
The thermal degradation profiles (TG/DTG) of the PUs before and after weathering also follow similar trends to those reported by Yarahmadi et al. (2017) [
3], who observed a drop in the initial decomposition temperature (T
d1) and greater definition of the DTG peaks after accelerated UVB exposure. Notably, the PUPFO-based foams retained higher T
d2 values after aging compared to the LO-based foams, suggesting that PFO-derived chains may undergo less chain scission at the soft segment level, possibly due to their higher linoleic acid content, which imparts some stabilization. It was observed that after 90 days of accelerated weathering, PUPFO2A retained thermal decomposition temperatures and mass loss patterns close to those of the original, showing resilience compared to PULO samples.
4. Conclusions
This study investigated the effects of accelerated weathering on flexible polyurethane foams synthesized from linseed oil (LO) and passion fruit oil (PFO). The materials were exposed to UV radiation, heat, and moisture over 90 days, and their chemical, morphological, and thermal properties were thoroughly analyzed. The findings confirmed that UV-induced degradation affected both the chemical structure and the thermal behavior of these biobased polyurethanes, especially in samples with lower [NCO]/[OH] ratios. The FTIR results indicated the progressive loss of urethane bonds and the formation of oxidation byproducts, while thermogravimetric analysis revealed a slight decrease in thermal stability over time. Despite these changes, the materials—particularly those synthesized from PFO with a higher cross-link density—maintained a significant degree of thermal resistance and morphological integrity. From a practical standpoint, these results suggest that such biobased PU foams could be considered for non-structural or indoor applications, such as insulation, cushioning, or packaging, especially when UV exposure is limited or when UV stabilizers are incorporated. Additionally, the data reinforce the potential of accelerated weathering as a viable screening tool for predicting long-term performance in shorter periods—an important consideration for the development of sustainable polymers. Furthermore, accelerated weathering has shown similar results to those seen in soil degradation studies previously carried out by the author with the same materials, showing the high potential of using this less time-consuming technique for vegetable oil-based PUs.


 ,
, 


