Article

The Role of Titanium Carbides in Forming the Microstructure and Properties of Ti-33Mo-0.2C Alloy

by
Wojciech Szkliniarz
and
Agnieszka Szkliniarz
*
Faculty of Materials Engineering, Silesian University of Technology, 40-019 Katowice, Poland
*
Author to whom correspondence should be addressed.
Coatings 2025, 15(5), 546; https://doi.org/10.3390/coatings15050546
Submission received: 10 April 2025 / Revised: 28 April 2025 / Accepted: 30 April 2025 / Published: 2 May 2025
(This article belongs to the Section Surface Characterization, Deposition and Modification)

Abstract

:
This study presents the characteristics of the Ti-33Mo-0.2C alloy, which belongs to the group of titanium alloys with a stable β phase and contains 0.27 wt% carbon; this is significantly higher than the permissible level for this alloy, which is 0.1 wt%. The Ti-33Mo-0.2C alloy was melted in a vacuum induction furnace with a cold copper crucible and subsequently processed into a 12 mm diameter rod through hot rolling and annealing under standard conditions. The microstructure, as well as the mechanical and physicochemical properties of the Ti-33Mo-0.2C alloy, were compared with those of the Ti-33Mo alloy of a similar chemical composition. The following techniques were used to characterize the microstructure and properties of the alloys: LM; SEM/EDS (WDS); XRD; and mechanical, creep, and corrosion testing. The conducted analyses demonstrated that the addition of approximately 0.2 wt% carbon to the Ti-33Mo alloy leads to the expected improvement in microstructural stability by reducing grain growth and inhibiting the precipitation of the α phase at β grain boundaries. Consequently, a unique simultaneous enhancement of both strength and ductility, with increased creep resistance, is observed while maintaining the excellent corrosion resistance of the investigated alloy. The observed beneficial effects and additional capabilities resulting from the presence of carbon in the investigated alloy justify the conclusion that carbon should no longer be regarded as an undesirable impurity, which stands in contrast to some previous statements.

1. Introduction

Titanium is a lightweight yet exceptionally strong metal, possessing the highest strength-to-density ratio among all metals. Its corrosion resistance, comparable to that of platinum, and its biological inertness make it a highly versatile material with a wide range of applications. When alloyed with other metals, titanium forms alloys with unique properties that are widely utilized across various technological fields. The introduction of appropriate alloying elements enables the development of titanium-based alloys with novel and often unique characteristics, while maintaining its outstanding corrosion resistance in both natural and chemically aggressive environments [1,2,3,4].
Titanium and its alloys exhibit exceptional corrosion resistance due to the passive nature of the dense, strongly adherent, and ultrathin titanium oxide layer that spontaneously forms on their surface in the presence of moisture and oxygen. This protective layer develops gradually, increasing in strength and resistance over time. Notably, the oxide layer possesses a remarkable ability to self-repair almost instantaneously upon damage [5,6].
Due to the mechanisms of formation and regeneration of the passive oxide layer, titanium and titanium alloys exhibit complete corrosion resistance in natural and humid environments, oxidizing acids (e.g., nitric, chromic, hypochlorous, and perchloric acids), hydrogen sulfide, ammonia, and seawater, as well as chloride and sulfide solutions [1,2,3,4]. However, the corrosion resistance of titanium and its alloys in strong reducing acids (such as sulfuric and hydrochloric acid) or in anhydrous environments with oxygen deficiency—particularly at elevated temperatures—is insufficient, leading to rapidly progressing corrosion processes. The rate of corrosion increases with rising temperature and acid (solution) concentration. This occurs due to the inadequate availability or complete absence of oxygen, which prevents the formation of a protective passive oxide layer on the material’s surface. Even when a passive layer does form, its ability to self-repair upon damage is limited or insufficient [5,6].
Alloying elements that enhance the corrosion resistance of titanium include the so-called light platinum group metals (palladium and ruthenium), as well as molybdenum, nickel, tantalum, and niobium. These platinum group metals have demonstrated the highest effectiveness in this regard [7]. However, even the exceptionally expensive Ti-0.15 wt% Pd alloy (Grade 7), which exhibits the greatest overall corrosion resistance among all commercially available titanium alloys, lacks sufficient resistance in non-oxidizing acid environments such as hydrochloric and sulfuric acids. In contrast, Ti-Mo alloys containing up to several tens of weight percent of molybdenum have shown high corrosion resistance under such conditions. The presence of molybdenum enhances the stability and protective properties of the passive oxide layer, which spontaneously forms on the alloy’s surface and consists of titanium and molybdenum oxides [7,8,9,10,11]. Moreover, the corrosion resistance of these alloys increases significantly with higher molybdenum content [8,11].
These alloys, classified as β-type titanium alloys, retain their stable β-phase structure only at room temperature, whereas at elevated temperatures, this stability is maintained only for a limited period, depending on the temperature. Although the structural stability of these alloys significantly increases with higher molybdenum content [12,13,14,15,16,17], the development of alloys with a thermodynamically stable β phase at both low and elevated temperatures remains impossible [14,16].
Currently, four grades of binary Ti-Mo alloys, containing between 30 and 40 wt% molybdenum, are produced and utilized worldwide. These alloys are specifically classified as a group of materials with exceptional corrosion resistance (Table 1). Due to their high molybdenum content, after plastic deformation and annealing, these alloys exhibit a microstructure composed exclusively of the stable β phase, which is a solid solution of molybdenum in the high-temperature allotropic form of titanium (β phase) with a body-centered cubic (BCC) crystal structure.
High-molybdenum Ti-Mo alloys, known for their excellent corrosion resistance, are not a product of the latest advancements in the titanium industry. The first two alloys, containing 30 and 40 wt% Mo, were initially developed and applied in the United States by Rem-Cru Titanium Inc. as early as 1952 [18]. Two additional alloys, Ti-33Mo and Ti-32Mo, were introduced much later, in 1968 in Russia [19] and in 1990 in China [20], respectively (Table 1). It is widely recognized that the outstanding corrosion resistance of these alloys makes them suitable substitutes for tantalum, nickel-based Hastelloy-type alloys, and noble metals such as platinum and gold [21]. They are most commonly used in environments containing both oxidizing and non-oxidizing acids, including elevated-temperature applications, with the exception of hydrofluoric acid, as well as Cu, Fe, and Al chlorides. Additionally, they are utilized in specialized applications such as the production of tetrachloro-alkanes, furfural, amino acids, methyl methacrylate ester, caprolactam, and viscose fibers. Moreover, the Ti-32Mo (TB7) alloy, produced in China, has found applications in the aerospace, shipbuilding, automotive, chemical, and defense industries [20,22].
Ti-Mo alloys are most commonly produced by vacuum and/or inert gas-shielded melting and casting processes using feedstock in the form of commercially pure titanium and molybdenum. However, these melting and casting processes present significant technological challenges due to the substantial differences in the melting points and densities of the constituent elements. Consequently, to achieve a chemically homogeneous composition free from gravitational segregation, multiple remeltings are required, with the number of remelts significantly exceeding those typically used for other alloys [19,23,24,25,26]. For this reason, powder metallurgy and additive manufacturing technologies are increasingly being utilized as alternatives to conventional melting and casting processes [14,20,27,28]. Cast semi-finished products, after homogenization, undergo conventional two-stage hot and cold plastic deformation processing. The final heat treatment of molybdenum-rich Ti-Mo alloys involves annealing or quenching and aging; however, the primary objective of these treatments is not to enhance strength, but rather to stabilize the microstructure [29,30,31].
Molybdenum-rich Ti-Mo alloys are regarded as one of the most versatile groups of titanium β alloys [1,4,10,24]. They exhibit an exceptional combination of high strength, ductility, and fatigue and fracture resistance, even at large cross-sections. Additionally, they are characterized by excellent corrosion resistance, biocompatibility, and good weldability and machinability, as well as suitability for both hot and cold plastic deformation. One of the unique properties of this group of alloys is their ability to capture and store hydrogen [32]. However, the high content of molybdenum—a heavy and expensive metal—results in a relatively higher density and increased manufacturing costs compared to other groups of titanium alloys.
The dynamic development of the chemical industry, driven by both the implementation of new processes and the enhancement of existing ones to optimize costs and improve productivity, has led to the increasing use of non-oxidizing acids, such as hydrochloric acid and sulfuric acid, at progressively higher concentrations and temperatures. Consequently, materials used in the construction of equipment and instrumentation operating under these demanding conditions must not only exhibit enhanced corrosion resistance but also improved mechanical properties, enabling them to withstand elevated temperatures and higher mechanical stresses. Moreover, the use of high-performance materials is economically advantageous, as it allows to eliminate or significantly reduce costly and time-consuming maintenance and equipment replacement processes resulting from progressive and increasingly aggressive corrosion-induced degradation.
Currently, the most advanced molybdenum-rich Ti-Mo alloys used in industrial chemical processes involving non-oxidizing acids—both for the production of new compounds and the utilization of waste liquors, exhaust gasses, and solid residues—exhibit significant and problematic deficiencies. These include a pronounced tendency for rapid, irreversible grain growth, resulting in a deterioration in mechanical properties, as well as reduced structural stability under operating conditions, which negatively affects corrosion resistance and plasticity.
The rapid grain growth at elevated temperatures results from the increased diffusion of alloying elements within the β phase, which predominates in the microstructure of molybdenum-rich Ti-Mo alloys. This phenomenon is primarily attributed to the crystalline lattice structure of this body-centered cubic (BCC) phase [17,30,33].
Although molybdenum-rich Ti-Mo alloys are classified as single-phase materials with a stable β phase, according to the Ti-Mo equilibrium phase diagram [29,34,35], the α phase may still form at temperatures below 695 °C, regardless of the molybdenum content [16,29]. This results from the β ⮂ α allotropic transformation. The presence of the α phase in the microstructure of Ti-Mo alloys can be avoided by using higher cooling rates (e.g., water or air quenching) in processes that involve passing through the β ⭢ α transformation temperature. However, under operating conditions at temperatures below the allotropic transformation temperature, the α phase may appear after a certain time, depending on the operating temperature. Initially, it forms along β grain boundaries before progressively growing into the grain interior. As demonstrated by Furuhara et al. [29], the probability of α phase formation in the microstructure of molybdenum-rich Ti-Mo alloys decreases with increasing molybdenum content. Nevertheless, this phase has been observed even in alloys containing as much as 40 wt% molybdenum [14,29,36]. The presence of a fine, plate-like α phase along β grain boundaries results in only a minor strengthening effect while significantly deteriorating corrosion resistance and causing an unacceptable reduction in the plasticity of Ti-Mo alloys [14,17,23,24,29].
Given these considerations, improving the performance of molybdenum-rich Ti-Mo alloys may not be best achieved by further increasing the molybdenum content but rather by reducing their tendency for grain growth and, most importantly, by suppressing α-phase precipitation along β grain boundaries.
Numerous studies conducted over different periods [37,38,39,40,41,42,43,44,45,46,47,48,49], including those by the authors of the present study [50,51,52], have demonstrated the positive effect of a small carbon addition on improving the mechanical properties, creep and oxidation resistance, as well as the grain refinement and structural stability of commercially pure titanium and titanium alloys belonging to different groups.
In contrast to studies highlighting the beneficial impact of a minor carbon addition—typically not exceeding 0.2 wt%—on the properties of different titanium alloy groups, the findings of Yan et al. [53] and Zhao et al. [54] suggest a detrimental effect. They established that carbon present in Ti-15Mo alloy as an impurity, in amounts permitted by industry standards and not exceeding 0.1 wt%, which leads to the formation of non-stoichiometric TiCx carbides at grain boundaries. This phenomenon results in a severe deterioration of plasticity, fatigue strength, and corrosion resistance to levels that render the alloy unsuitable for biomedical applications. Furthermore, their findings indicate that the complete elimination of carbide formation within the alloy structure requires reducing the permissible carbon content to an exceptionally low and technologically challenging level not exceeding 0.006 wt% [53,54].
To date, the literature lacks information regarding the influence of carbon on the properties of molybdenum-rich Ti-Mo alloys classified within the stable β-phase group. However, in the context of the previously defined expectations for improving these alloys’ properties, the findings on the beneficial effect of a small carbon addition—approximately 0.2 wt%—on the properties of Ti-V-Cr alloys, which also belong to the stable β-phase group, appear particularly intriguing. These studies have demonstrated that carbon, present as non-stoichiometric TiCx carbides, causes grain refinement in Ti-25V-15Cr-2Al [39] and Ti-35V-15Cr-0.3Si [48] alloys, enhances creep resistance in Ti-35V-15Cr [43,55] and Ti-25V-15Cr-2Al [55] alloys, improves the plasticity of Ti-35V-15Cr [43] and Ti-25V-15Cr-2Al [41] alloys, and increases wear resistance in the Ti-35V-15Cr-0.3Si alloy [56].
Given the established positive effect of carbon on the properties of titanium alloys from various groups, particularly Ti-V-Cr alloys classified within the stable β-phase group, this study aims to investigate whether a similar beneficial influence can be observed in molybdenum-rich Ti-Mo alloys, which also belong to this group. The research focuses on Ti-33Mo, a representative alloy of this relatively small group (Table 1), known for its exceptional corrosion resistance. This alloy is utilized in environments containing highly concentrated, non-oxidizing acids at elevated temperatures; however, no data on its properties are currently available in the literature.
The primary objectives of this study were to assess the positive, negative, and neutral effects of carbon in the Ti-33Mo alloy by directly comparing the properties of a carbon-free alloy with those of an alloy containing an elevated carbon content of 0.27 wt%. The research also aimed to determine whether the presence of carbon in the alloy would reduce grain growth tendency and, more importantly, suppress α-phase precipitation at β grain boundaries, leading to the expected improvement in performance and an expansion of its potential applications. Additionally, the study aimed to evaluate whether the addition of carbon might compromise the alloy’s most critical property—its excellent corrosion resistance—to an extent that would render its use impractical and economically unviable.

2. Materials and Methods

The schematic diagram of the alloy production and testing procedures is provided in Figure 1. Beta titanium alloy Ti-33Mo-0.2C with 0.2 wt% of carbon in comparison with carbon free Ti-33Mo alloy was studied. The chemical composition of the investigated alloys is presented in Table 2. The analysis of alloying elements was carried out using the ICP-OES method, while interstitial elements (O, N, H, C) were determined using Leco ONH836 and CS844 analyzers. The alloys containing carbon were melted in a vacuum induction furnace with a water-cooled copper cold crucible. Carbon was introduced in the form of anthracite. The ingots with 40 mm in diameter and 350 mm in length were homogenized and subsequently hot rolled. The bars with a final diameter of 12 mm were subjected to a final heat treatment (850 °C/1 h/air cooling).
The microstructural characteristics of the alloys were examined using LM (Nikon, Japan) and SEM (HITACHI, Japan) coupled with both energy and wavelength dispersive x-ray spectroscopy (EDS and WDS) techniques. Specimens for SEM and LM observations were prepared by standard metallographic preparation procedures followed by a final chemical etching performed with modified Kroll’s reagent. The quantitative analysis of microstructural parameters (grains size, carbides size, shape factor) was conducted using Met-Ilo software version 14.0. The phase composition was identified by X-ray diffraction. XRD patterns of the researched alloys were obtained by means of JEOL JDX-7S X-ray diffractometer (Japan) with Cu Kα radiation. For this, materials were scanned at a rate of 0.05°, with a dwell time of 3 s and a 2θ range of 20° to 80°. Lattice parameters were precisely measured using XRD methods, using a finer scanning step of 0.01° and a counting time of 10 s per step.
Vickers hardness (HV1) was measured using a universal Zwick hardness testing machine (Germany). Mechanical properties at room temperature were assessed on bar-shaped specimens in accordance with PN-EN ISO 6892-1:2010, using a Zwick/Roell Z100 testing machine. Measurements were carried out on 5 samples. Impact toughness was evaluated using a Charpy V-notch impact tester (ZwickRoell, Germany) at room temperature, following ASTM E23 standards. The impact specimens were machined to a size of 55 mm × 5 mm × 10 mm. Short-term creep behavior was examined with Applied Test Systems Inc (USA). equipment at a temperature of 500 °C and under an applied stress of 200 MPa. The corrosion resistance tests were carried out in two acidic environments, namely 10% hydrochloric acid (HCl) and 40% nitric acid (HNO₃) solutions, both maintained at 20 °C. The DC (direct current) electrochemical measurements were taken in the conventional three-electrode system consisting of the measuring cell, a Solartron 1285 potentiostat, and a computer equipped with CorrWare software (version 2.0) [57]. All electrode potentials were measured relative to the normal hydrogen electrode (NHE).

3. Results and Discussion

3.1. Alloy Characteristics

The carbon-containing titanium alloy Ti-33Mo-0.2C and the carbon-free reference alloy Ti-33Mo belong to a very limited and elite group of alloys with a stable β phase. These materials are characterized by exceptional corrosion resistance, which makes them well-suited for applications in highly concentrated, non-oxidizing acid environments at elevated temperatures. While the Ti-33Mo alloy and its equivalents have long been used in industrial applications (Table 1), the Ti-33Mo-0.2C alloy remains experimental. In this alloy, without changing the content of the primary alloying element, the addition of approximately 0.2 wt% carbon—well above its maximum solubility in the β phase—leads to the formation of titanium carbides. This approach was intended to minimize the most important shortcomings observed in the carbon-free Ti-33Mo alloy.
The microstructure of the investigated Ti-33Mo-0.2C alloy, as well as the morphology of its constituent phases, results from interactions between processes and phase transformations occurring during solidification, hot rolling, and final heat treatment, in combination with a carbon content of 0.27 wt%. Due to the high molybdenum content in the alloy and its anticipated influence on carbon solubility in the various phases, the pseudo-binary (Ti-33Mo)-C phase diagram [58,59,60] should be used as the basis for analyzing microstructural changes, rather than the conventional Ti–C equilibrium diagram [61,62]. A section of this pseudo-binary diagram, covering carbon concentrations of up to 20 wt%, was generated using Thermo-Calc 2024a software and is shown in Figure 2.
The phase diagram presented in Figure 2a highlights several key features, including the dominant presence of the β phase and the non-stoichiometric titanium carbide TiC in the alloy microstructure, as well as the limited solubility of carbon in both β and α phases, which decreases significantly with decreasing temperature (red lines). Also notable is the wide concentration range between 12.4 and 16.5 wt% carbon, in which stoichiometric TiC is stable in the microstructure, alongside a distinct field for the occurrence of the non-stoichiometric titanium carbide Ti₂C. In addition, the minimum carbon content required to form stoichiometric TiC also decreases significantly with decreasing temperature, as illustrated by the red curve in Figure 2a.
Figure 2b presents a fragment of the pseudo-binary equilibrium diagram of the (Ti-33Mo)-C system within the range up to 1.0 wt% carbon, relevant for the investigated alloy containing 0.27 wt% carbon. The most significant consequence of the high molybdenum content in the Ti-33Mo-0.2C alloy is the considerable changes in the carbon solubility in both the β and α phases. In the presence of 33.0 wt% molybdenum, the maximum carbon solubility in the β phase changes from 0.19 wt% at the eutectic transformation temperature of 1750 °C to 0.0003 wt% at 545 °C (Figure 2b). A negative consequence of the significant decrease in carbon solubility with temperature is that carbon in these alloys is almost exclusively present as non-stoichiometric carbides. On the other hand, a beneficial consequence is the potential to employ high-temperature solution treatments, which can be followed by potential aging.
Figure 3 presents the microstructures of the Ti-33Mo-0.2C alloy after casting (Figure 3a), hot rolling (Figure 3b), and annealing (Figure 3c). The microstructure observed in Figure 3a results from a sequence of phase transformations occurring during solidification and subsequent cooling: L → L + β → L + β + TiC → β + TiC → α + β + TiC (see Figure 2b). After casting into a metallic mold, the structure consists almost exclusively of large, elongated, and irregularly shaped primary carbides located at the grain boundaries of the coarse-grained matrix (Table 3), formed as a result of the eutectic reaction. Additionally, fine secondary carbides are also present, precipitated due to the changes in carbon solubility within the matrix (Figure 2b).
The elongated and irregularly shaped primary carbides undergo fragmentation into more spheroidal-like particles during multi-pass hot rolling, as a result of the substantial imposed deformation of 93% (Figure 3b). This transformation is evidenced by changes in the carbide shape factor, which increases from 0.50 in the as-cast condition to 0.83 after hot rolling (Table 3). The fragmentation of the carbide phase is accompanied by significant grain refinement of the matrix, with the average grain size decreasing more than tenfold—from over 200 μm to 18.6 μm (Table 3)—along with a substantial coefficient of variation of 112.5% for this parameter.
The inhomogeneity accompanying grain refinement (Figure 3b, Table 3) is reflected in the microstructural non-uniformity of the deformed alloy (Figure 3b and Figure 4b), manifested in the presence of both fully recrystallized areas (Figure 4a) and non-recrystallized or partially recrystallized regions (Figure 4c). This condition is attributed to the fragmented carbides, which influence the course of microstructural reconstruction processes in the hot-rolled alloy. It has been observed that new, recrystallized grains are predominantly located in regions where carbides are present. In areas lacking carbides, signs of recrystallization are absent or only partial. This phenomenon frequently occurs in deformed alloys containing hard second-phase precipitates. However, in titanium alloys, it is considered extremely rare and has thus far been confirmed only in certain compositions belonging to the burn resistant group of titanium alloys [48].
This phenomenon is known as particle-stimulated nucleation (PSN) [63]. The mechanism behind PSN involves local strain incompatibilities between the matrix and the hard precipitates under high deformation conditions. These incompatibilities are accommodated by a high density of dislocations generated around the particles through the Orowan mechanism. Due to the accumulated energy and the high dislocation density—both serving as driving forces for recrystallization—the regions surrounding the precipitates become preferential sites for the nucleation of new grains.
The annealing of the Ti-33Mo-0.2C alloy, conducted after rolling at a temperature of 850 °C, which was necessary to complete the recrystallization process, resulted in further grain refinement, reducing the average grain diameter to 10.3 µm (Figure 3c, Table 3). Within the region of relatively equiaxed and less size-differentiated grains of the β phase, carbides forming local clusters were observed (Figure 3c). These carbides exhibited an area fraction comparable to that found in the hot-rolled state, but were characterized by larger sizes, lower size variability, and higher and more uniform shape factor values, with a mean shape factor of 0.86 (Table 3).
Figure 5 presents the results of phase composition analysis of the examined alloys in the annealed condition, shown as a double diffractogram. The results indicate the presence of the β phase in both alloys, and, in the case of the carbon-containing alloy, the occurrence of distinct reflections corresponding to titanium carbide.
The elemental mapping analysis shown in Figure 6, obtained via EDS/WDS acquisition, illustrates the spatial distribution of the elements: titanium, molybdenum, carbon, and oxygen within the investigated alloy. These maps confirm a significantly higher carbon content and a slightly increased titanium content in the carbides located at grain boundaries and within the grains of the Ti-33Mo-0.2C alloy matrix, compared to the surrounding matrix. At the same time, the maps reveal that these carbides are markedly depleted in molybdenum and exhibit a lower oxygen content relative to the matrix, as further confirmed by the linear elemental distribution analysis presented in Figure 7. The presence of oxygen in the carbides and its reduced content at the matrix/carbide interface, relative to the β phase matrix (Figure 7), supports the purifying effect of carbides, which “trap” oxygen from the matrix—a phenomenon also reported in other studies [42,43] on Ti-V-Cr-type alloys with a stable β-phase structure.
A point quantitative analysis of the chemical composition in the areas marked in Figure 8a—corresponding, respectively, to the matrix (point 1) and the carbide (point 2) of the Ti-33Mo-0.2C alloy after annealing—confirmed the intended chemical composition of the alloy as well as the non-stoichiometric content of titanium and carbon in the carbide, amounting to 78.3 at% and 21.5 at%, respectively (Figure 8b). Consequently, the carbide initially identified by XRD as titanium carbide TiC (see Figure 5) should be denoted as TiCx, a designation applied to non-stoichiometric carbides present in titanium–carbon alloys.
The lattice parameter of the β phase present in the structure of the Ti-33Mo alloy, determined by XRD, is 0.3230 nm (Table 4), which is significantly lower than the lattice parameter of β-Ti, reported as 0.3310 nm [64]. In contrast, the presence of carbon in the Ti-33Mo-0.2C alloy, acting as an interstitial element, leads to an increase in the β phase lattice parameter to 0.3236 nm compared to the carbon-free alloy (Table 4).
The lattice parameter of the carbide present in the structure of the Ti-33Mo-0.2C alloy is 0.4316 nm (Table 4). This value deviates significantly from the parameter characteristic of stoichiometric titanium carbide TiC, which is 0.4327 nm [65]. This deviation, supported by the quantitative EDS analysis results (Figure 8), confirms the carbon depletion of the carbide and its resulting non-stoichiometric nature, for which the symbol TiCx should be used.
The α→β phase transformation temperature is one of the most important characteristics of titanium alloys. It is typically treated as a fundamental reference point in the design of thermomechanical and heat treatment processes, as well as in assessing the suitability of alloys for high-temperature applications. Due to the high molybdenum content, the investigated alloys exhibit a stable β-phase structure, in which the α phase can appear only under very specific conditions. For this reason, the experimental determination of the transformation temperature using commonly applied methods is very difficult and subject to considerable error. Consequently, computational methods—such as Yolton’s formula [66]—are used to estimate the α→β phase transformation temperature in such alloys, according to the following equation:
Tα→β (°C) = 882 + 21.1·Al – 9.5·Mo + 4.2·Sn – 6.9·Zr – 11.8·V – 12.1·Cr – 15.4·Fe + 23.3·Si + 123·O
The transformation temperatures calculated using Equation 1 and shown in Table 4 are 590 °C and 623 °C for the Ti-33Mo and Ti-33Mo-0.2C alloys, respectively.
Figure 9 presents the microstructure of the carbon-containing Ti-33Mo-0.2C alloy (Figure 9a) and the reference carbon-free Ti-33Mo alloy (Figure 9b), both annealed under identical conditions: 850 °C for 1 h followed by air cooling. The initial microstructures shown in Figure 9 were compared in terms of properties relevant to their current and potential applications. It should be noted that the compared alloys were produced and processed under identical conditions, and the nearly nine-fold difference in the initial average grain diameter (10.3 ± 5.3 μm in Ti-33Mo-0.2C vs. 90.3 ± 32.0 μm in Ti-33Mo) is solely the result of the beneficial effect of carbon and carbides present at grain boundaries on the final grain size after completing all necessary technological treatments.

3.2. Alloys Properties

The expected effect of carbon present in the Ti-33Mo-0.2C alloy—in the form of an interstitial solid solution in β-titanium and hard, dispersed, non-stoichiometric TiCx carbides—is an improvement in the alloy’s strength properties. In addition to a comparative analysis, the investigation of other properties also aimed to answer the following question: does the addition of more than 0.2 wt% carbon, intended to enhance mechanical properties, cause any deterioration of other critical characteristics that might compromise the alloy’s current advantages and areas of application, making carbon addition unjustified or economically unviable?

3.2.1. Mechanical Properties

To assess the expected impact of carbon, Table 5 presents comparative values of ultimate tensile strength (UTS), yield strength (YS), elongation (EL), reduction in area (RA), Young’s modulus (E), Vickers hardness (HV), and impact energy (CVN) for the Ti-33Mo alloy with and without carbon, following identical annealing conditions. The addition of 0.27 wt% carbon resulted in a 4.3% increase in UTS (from 920 to 960 MPa) and a 4.7% increase in YS (from 902 to 944 MPa) in the annealed state. Notably, these strength gains were accompanied by a surprisingly significant enhancement in ductility: elongation increased by 9.1% (from 15.4% to 16.8%) and reduction in area by 13.6% (from 35.2% to 39.0%) (Table 5).
These results, which demonstrate the beneficial influence of carbon on both the strength and ductility of Ti-33Mo, are consistent with previous findings by the authors and other researchers who studied the impact of carbon on various groups of titanium alloys [38,39,40,41,42,47,49,50,51,52].
The unexpectedly modest increase in strength after adding 0.27 wt% carbon can be attributed to the limited effect of solid-solution strengthening, due to the extremely low solubility of carbon in the β-phase at room temperature (see Figure 2b). Additionally, the precipitation strengthening mechanism is constrained by the presence of oversized, widely spaced, and clustered carbide precipitates in the alloy’s microstructure (Figure 9a), despite their significant area fraction of 6.95% (Table 3).
On the other hand, the surprising and substantial improvement in ductility observed in the carbon-containing Ti-33Mo alloy—relative to the carbon-free variant—is likely due to a purifying effect of the carbides. These precipitates may act as oxygen scavengers, removing oxygen from the matrix. The existence of this phenomenon and its beneficial impact on ductility has also been reported by Li et al. [39] for the Ti-25V-15Cr-2Al alloy with a stable β-phase structure, and by Mousavi et al. [67] and Chen et al. [42] for Ti-13V-11Cr-3Al and Ti-15Mo pseudo-β alloys, respectively.
Carbon also has a slight yet positive effect on the elastic modulus (Young’s modulus) and hardness of Ti-33Mo, increasing these values from 98 to 101 GPa and from 300 to 310 HV, respectively (Table 5).
Essentially, the only adverse effect of carbon in the Ti-33Mo alloy is a reduction in impact energy (CVN), measured via Charpy impact bending tests, from 12.5 to 10.7 J (Table 5). However, this value still meets the standards specified for alloys with a stable β-phase [68].

3.2.2. Creep Resistance

The Ti-33Mo alloy, along with other molybdenum-rich alloys with chemical compositions shown in Table 2, exhibits exceptional corrosion resistance and is commonly used in highly concentrated, high-temperature, non-oxidizing acid environments. Given the alloy’s application in demanding industries such as aerospace, and based on findings by Sun and Lavernia [43] and Zhao et al. [55] demonstrating the beneficial effects of carbon on the creep resistance of Ti-35V-15Cr and Ti-25V-15Cr-2Al alloys, there is strong support for the suggestion that the Ti-33Mo alloy with carbon may be suitable not only for corrosive environments but also for high-temperature, creep-resistant applications.
The presence of carbide phases at grain boundaries in the Ti-33Mo-0.2C alloy and the well-established role of grain boundaries in the creep process provide further support for the hypothesis that carbon can enhance the alloy’s performance under elevated temperature and stress.
Comparative short-term creep tests (up to ~200 h) conducted on both the carbon-free Ti-33Mo alloy and the Ti-33Mo-0.2C alloy revealed that, after a brief initial strengthening stage characteristic of primary creep (Stage I), both alloys transitioned into the longer-lasting steady-state creep stage (Stage II), followed by the onset of tertiary creep (Stage III) after several dozen hours (Figure 10).
The addition of 0.27 wt% carbon resulted in an earlier onset of steady-state creep and a markedly slower creep rate—more than twice as slow—at 4.55·10−5 s−1. This reduced creep rate delays the transition to tertiary creep (Table 6) and significantly postpones the time required to reach specific levels of creep strain (Figure 10, Table 6).
The analysis of the creep curves presented in Figure 10 for the reference Ti-33Mo alloy and the carbon-containing Ti-33Mo-0.2C alloy clearly indicates that the addition of carbon significantly improves creep resistance. This is evidenced by a more than twofold reduction in creep rate, the extension of steady-state creep duration, the delayed onset of tertiary creep, and the prolonged time to reach defined strain levels (Table 6).
The microstructural examination of longitudinal sections of both the undeformed grip and the deformed gauge portions of samples after creep testing confirmed the critical role of large, irregular primary carbide precipitates tightly associated with grain boundaries, along with numerous fine secondary carbides decorating these boundaries (Figure 11a). These carbides, located at grain boundaries—regions critical to the creep process—impede grain boundary sliding and thus slow overall creep deformation. This is supported by the visible signs of cracking and fragmentation of the primary carbides observed in the deformed region of the specimen after creep (Figure 11b), which are absent in the undeformed grip section (Figure 11a).

3.2.3. Corrosion Resistance

Considering the exceptional corrosion resistance of molybdenum-rich alloys belonging to the group with a stable β-phase in both non-oxidizing and oxidizing acid environments, a comparative study was conducted to evaluate the corrosion resistance of the Ti-33Mo-0.2C alloy and the carbon-free Ti-33Mo alloy. The tests were carried out at room temperature in a 10% solution of non-oxidizing hydrochloric acid and a 40% solution of oxidizing nitric acid. The aim of these investigations was not to demonstrate an improvement in corrosion resistance due to the presence of carbon, but rather to verify that this exceptional property of the alloy is not adversely affected. The polarization curves for the compared alloys are presented in Figure 12.
In the 10% hydrochloric acid solution, the alloy containing 0.27 wt% carbon transitions into the active corrosion state at a slightly lower corrosion potential compared to the carbon-free alloy, with values of −0.27 V and −0.26 V, respectively, and corrosion current densities of 2.0 × 10⁻⁷ and 3.9 × 10⁻⁷ A/cm2. The transition from the active state to the pseudo-passive and passive states occurs at slightly lower corrosion current densities—1.2 × 10⁻⁵ and 1.5 × 10⁻⁵ A/cm2 for the carbon-containing and carbon-free alloys, respectively.
The Ti-33Mo alloy containing carbon, under the conditions of a corrosion test conducted in the environment of a 40% nitric acid solution, enters the active corrosion state at a slightly lower corrosion potential (0.16 V) compared to the alloy without carbon (0.18 V), with corresponding corrosion current densities of 2.6 × 10⁻⁷ and 3.0 × 10⁻⁷ A/cm2. The transition from the active to the passive state occurs at approximately 0.70 V for both alloys, with slightly higher corrosion current density observed for the carbon-containing alloy (9.0 × 10⁻⁶ A/cm2) compared to the carbon-free one (8.1 × 10⁻⁶ A/cm2).
A comparison of the polarization curves (Figure 12a,b) and the values of corrosion potential, corrosion current density, and current density at the transition to the passive state (Table 7) for the Ti-33Mo-0.2C and Ti-33Mo alloys indicates that the addition of 0.27 wt% carbon does not have a significant impact on the excellent corrosion resistance of the tested alloy in both tested non-oxidizing and oxidizing acid environments.

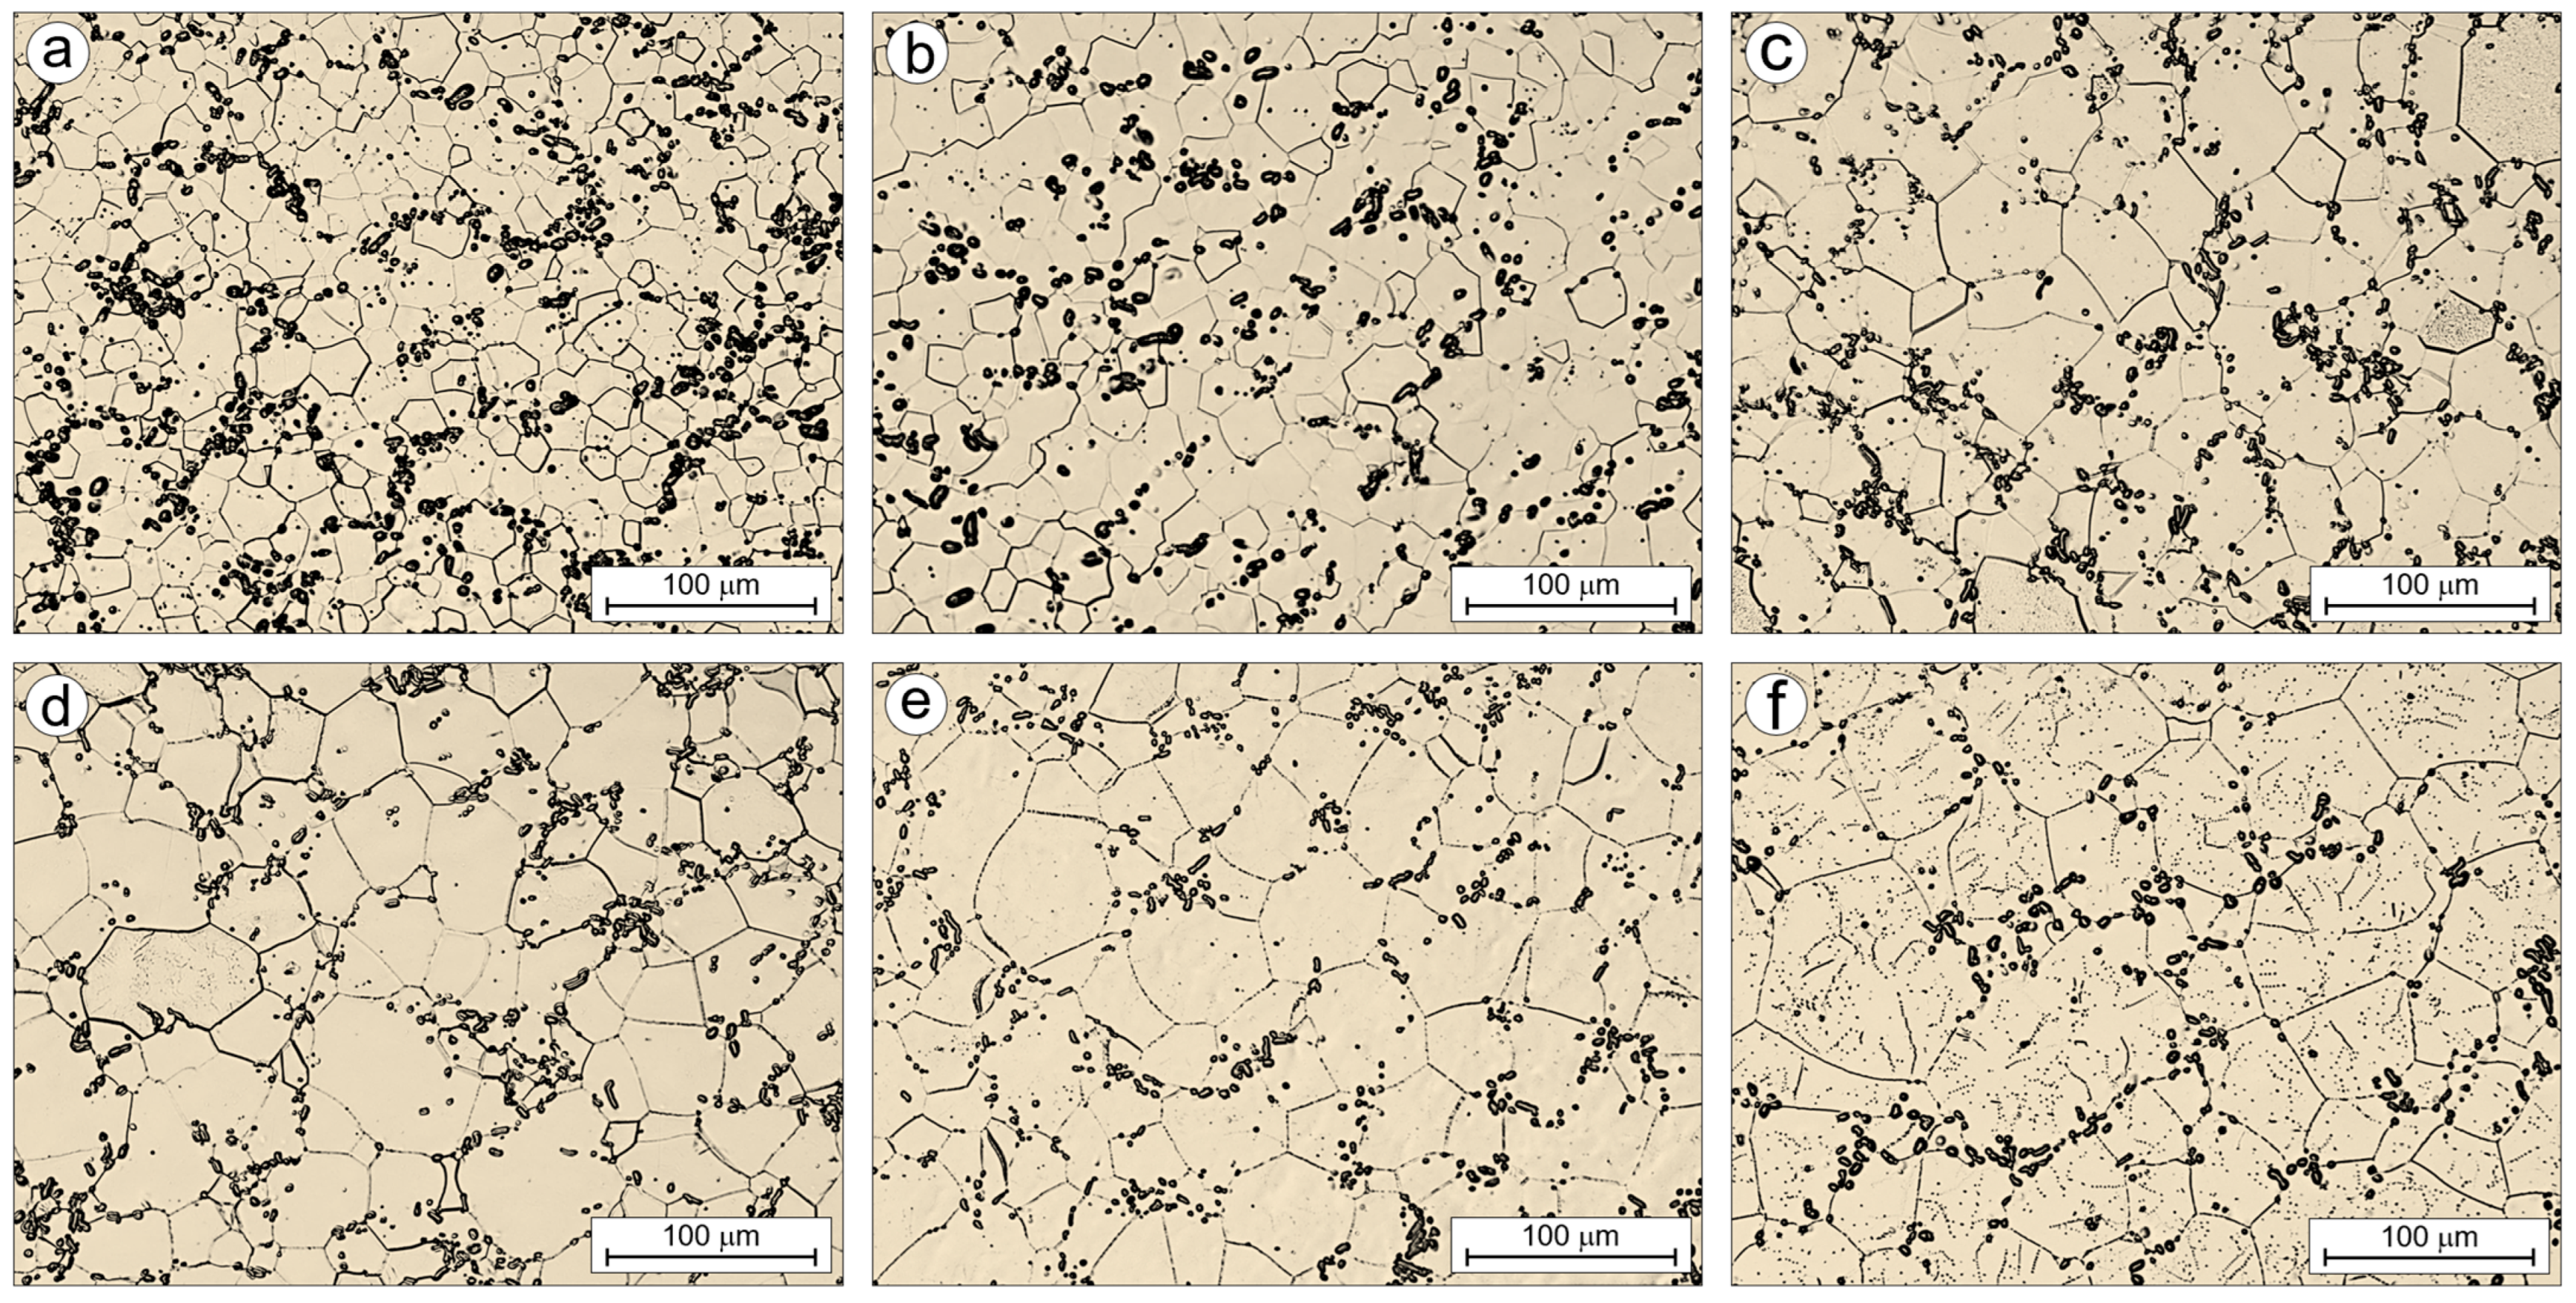
3.2.4. Structure Stability

Structural stability is a crucial property of alloys intended for use at elevated temperatures. Structural instability typically manifests through changes in properties during service. In titanium alloys containing a stable β phase—such as the investigated Ti-33Mo and Ti-33Mo-0.2C alloys—structural instability is most often caused by the activation of α-phase lamellar precipitation at β grain boundaries and grain coarsening of the β phase. These phenomena lead to unacceptable deterioration in ductility, reduced yield strength, and diminished corrosion resistance [17,37,55,69].
No α-phase precipitates were observed at the clearly visible β grain boundaries of the Ti-33Mo-0.2C alloy after annealing (Figure 3c). The applied heat treatment, consisting of water quenching from 850 °C followed by aging at 500 °C for 4 h—within the temperature range conducive to α-phase precipitation from the β phase (see Figure 2a)—did not result in the formation of the α phase in the microstructure of the alloy (Figure 13a,b). The microstructure exhibited only coarse primary carbide precipitates located at the grain boundaries (1), as well as secondary carbides: fine precipitates within the grains (2), and very fine ones decorating the grain boundaries (3) (Figure 13b).
The absence of the α phase in the microstructure of the solution-treated and aged Ti-33Mo-0.2C alloy is also reflected in the lack of significant changes in its mechanical properties compared to the annealed state (Table 5), thereby confirming the structural stability of the alloy.
Figure 14 and Figure 15 show the microstructures of the Ti-33Mo-0.2C and Ti-33Mo alloys, respectively, after annealing at 850 °C for 1 h, followed by an additional 1 h soak at temperatures ranging from 850 °C to 1250 °C and air cooling. The primary goal of this additional heat treatment was to assess the grain growth susceptibility of both alloys.
The average grain size of the annealed Ti-33Mo-0.2C alloy was 10.3 ± 5.3 µm. Subsequent soaking at temperatures between 850 °C and 1250 °C resulted in moderate grain growth with increasing temperature (Figure 14 and Figure 16), reaching an average grain size of 39.6 ± 18.1 µm after soaking at 1250 °C. In contrast, the carbon-free Ti-33Mo alloy exhibited uncontrolled grain growth under the same conditions, with the average grain size increasing from 90.3 ± 32.0 µm in the annealed state to 675.0 ± 67.0 µm after soaking at 1250 °C (Figure 15 and Figure 16).
The grain growth observed in the Ti-33Mo alloy during soaking at 850–1250 °C (Figure 16) was accompanied by a decrease in hardness, proportional to the extent of grain growth—from 300 ± 5 HV in the initial state to 268 ± 12 HV after treatment at 1250 °C (Figure 17). In contrast, the significantly smaller grain growth in the Ti-33Mo-0.2C alloy was unexpectedly associated with a slight increase, followed by the stabilization of hardness at approximately 315 ± 10 HV (Figure 17). The stabilization of hardness, despite the increasing grain size, is likely due to the beneficial effects of the carbide phase present in the alloy’s microstructure, which not only impedes grain growth but also contributes positively to the overall hardness.
Table 8 presents the changes in stereological parameters describing the morphology of the carbide phase as a function of one-hour annealing at temperatures ranging from 850 to 1250 °C. The results indicate that increasing the annealing temperature leads to a progressive growth of the matrix grain size, a decrease in both the area fraction and mean area of the carbide precipitates, and a shift in precipitate shape toward a more spheroidal form. Additionally, the size distribution of the precipitates becomes increasingly heterogeneous. These changes become particularly pronounced at annealing temperatures of 1050 °C and above. The marked increase in the coefficient of variation for precipitate size with rising annealing temperature (Table 8) suggests that the microstructure becomes dominated by carbide precipitates of increasingly varied dimensions.
As shown in Figure 18a, the size distribution of precipitates in the initial (annealed) state is bimodal, with both small and large precipitates present, although the larger ones predominate. As the annealing temperature increases, this distribution shifts, and the microstructure becomes dominated by fine precipitates. After additional soaking at 1250 °C, more than 80% of all precipitates exhibit an area smaller than 1.0 μm2. Since these fine precipitates are nearly spheroidal in shape, their increasing prevalence results in a higher proportion of precipitates with a shape factor close to 1.0, as shown in the distribution presented in Figure 18b.
The changes in the stereological parameters of both the matrix grains and the carbide phase (Table 8, Figure 18), caused by annealing the Ti-33Mo-0.2C alloy within the 850–1250 °C temperature range, reflect the corresponding microstructural evolution illustrated in Figure 14 and Figure 19. The alloy’s initial microstructure contains a relatively high area fraction of carbides (~7.0%, Table 8), present as large precipitates forming local clusters along grain boundaries and finer precipitates within the grains (Figure 19a). Upon annealing above 850 °C, these carbides begin to partially dissolve, with the extent of dissolution increasing with temperature (Figure 19b), thereby releasing carbon into the matrix. This process is facilitated by the increasing solubility of carbon in the β phase at elevated temperatures (Figure 2b). As they dissolve, the carbides change shape and reduce in size, becoming more closely associated with the matrix grain boundaries. Both the dissolution of carbides and the diffusion of carbon into the matrix intensify with increasing annealing temperature (Figure 14 and Figure 19). After annealing at 1250 °C for 1 h, the microstructure contains remnants of undissolved primary carbides that are even more strongly associated with grain boundaries, along with numerous, very fine, nearly spheroidal secondary carbides (Figure 19c). These precipitates primarily decorate subgrain boundaries and, to a lesser extent, grain boundaries. They are most likely the result of carbon precipitating from the supersaturated matrix.
A hypothetical mechanism for the formation of these carbides may be as follows: the intense dissolution of fine secondary carbides and large primary carbides in the initial microstructure results in the high carbon saturation of the matrix. Concurrently, as indicated in the pseudo-binary equilibrium diagram for the (Ti-33Mo)-C system (Figure 2a), the minimum carbon content required for the formation of stoichiometric titanium carbides decreases significantly with temperature—from 16.0 wt% at 850 °C to 15.0 wt% at 1250 °C. As a result, under conditions of intense primary carbide dissolution, limited (although it increases with temperature) carbon solubility in the β phase, and a decreasing threshold for carbide formation, conditions arise for the precipitation of secondary carbides from the matrix. These precipitates preferentially nucleate at energetically favorable sites, such as subgrain and grain boundaries. Notably, the initial signs of secondary carbide reprecipitation are observed at 1150 °C, while no such precipitates are present at lower temperatures.
The presence of carbides—even partially dissolved but strongly bonded to the grain boundaries—effectively inhibits grain growth, particularly under conditions that would otherwise promote its acceleration. Consequently, the extent of grain growth in the Ti-33Mo-0.2C alloy is significantly smaller compared to the carbon-free alloy (see Figure 16).
The change in the strengthening mechanism of the carbon-containing alloy from purely precipitation strengthening to a mixed solution- and precipitation-strengthening type, the presence of carbides strongly associated with grain boundaries, and the high number and fine dispersion of secondary carbides decorating both grain and subgrain boundaries are, despite the observed moderate grain growth, an important reason for the stabilized level of alloy hardness.
Complementary hardness measurements, along with static tensile and creep tests, were performed on the Ti-33Mo-0.2C alloy additionally soaked at 1250 °C, which exhibited the microstructure shown in Figure 19c. These tests revealed a further slight improvement in strength and hardness (Table 5), and—more notably and as expected from the microstructural characteristics—a substantial enhancement in creep resistance compared to the annealed alloy without additional heat treatment. Based on the comparative creep test results presented in Figure 10 and Table 6, it can be concluded that the alloy additionally soaked at 1250 °C reaches the steady-state creep regime at a similar rate, but the steady-state creep rate is nearly 30% lower than that of the merely annealed alloy. Additionally, no transient creep phase was observed within the 200 h testing timeframe.
The study of the effect of carbon on the structural stability and grain growth tendency of the Ti-33Mo-0.2C alloy, containing a small carbon addition of 0.27 wt%, unequivocally demonstrates the beneficial impact of carbon on the properties studied. Moreover, the results reveal further potential, such as the possibility of solution treatment at very high temperatures without the risk of excessive grain growth, followed by aging, which offers additional strengthening under both static tensile and creep loading conditions.
Finally, these findings highlight the significant potential of a binary alloy system enhanced by a small addition of a third, simple element—carbon—which, in this context, has traditionally been regarded merely as an undesirable impurity.

4. Summary

Based on a direct comparison of the properties of the Ti-33Mo alloy without carbon and with an increased carbon content of 0.27 wt%, the following conclusions can be drawn:
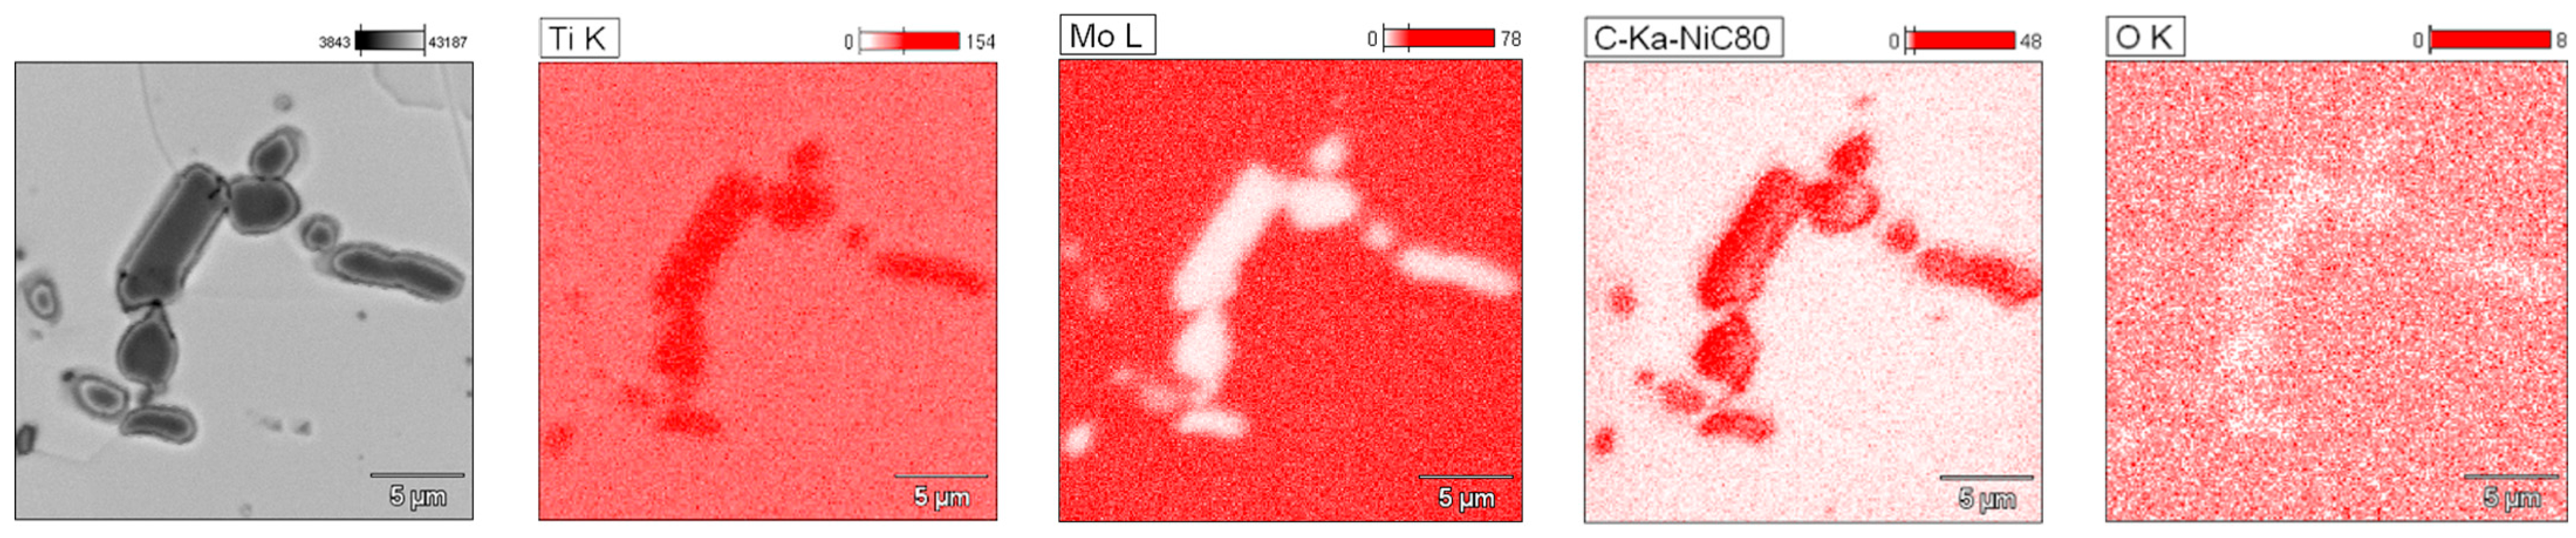
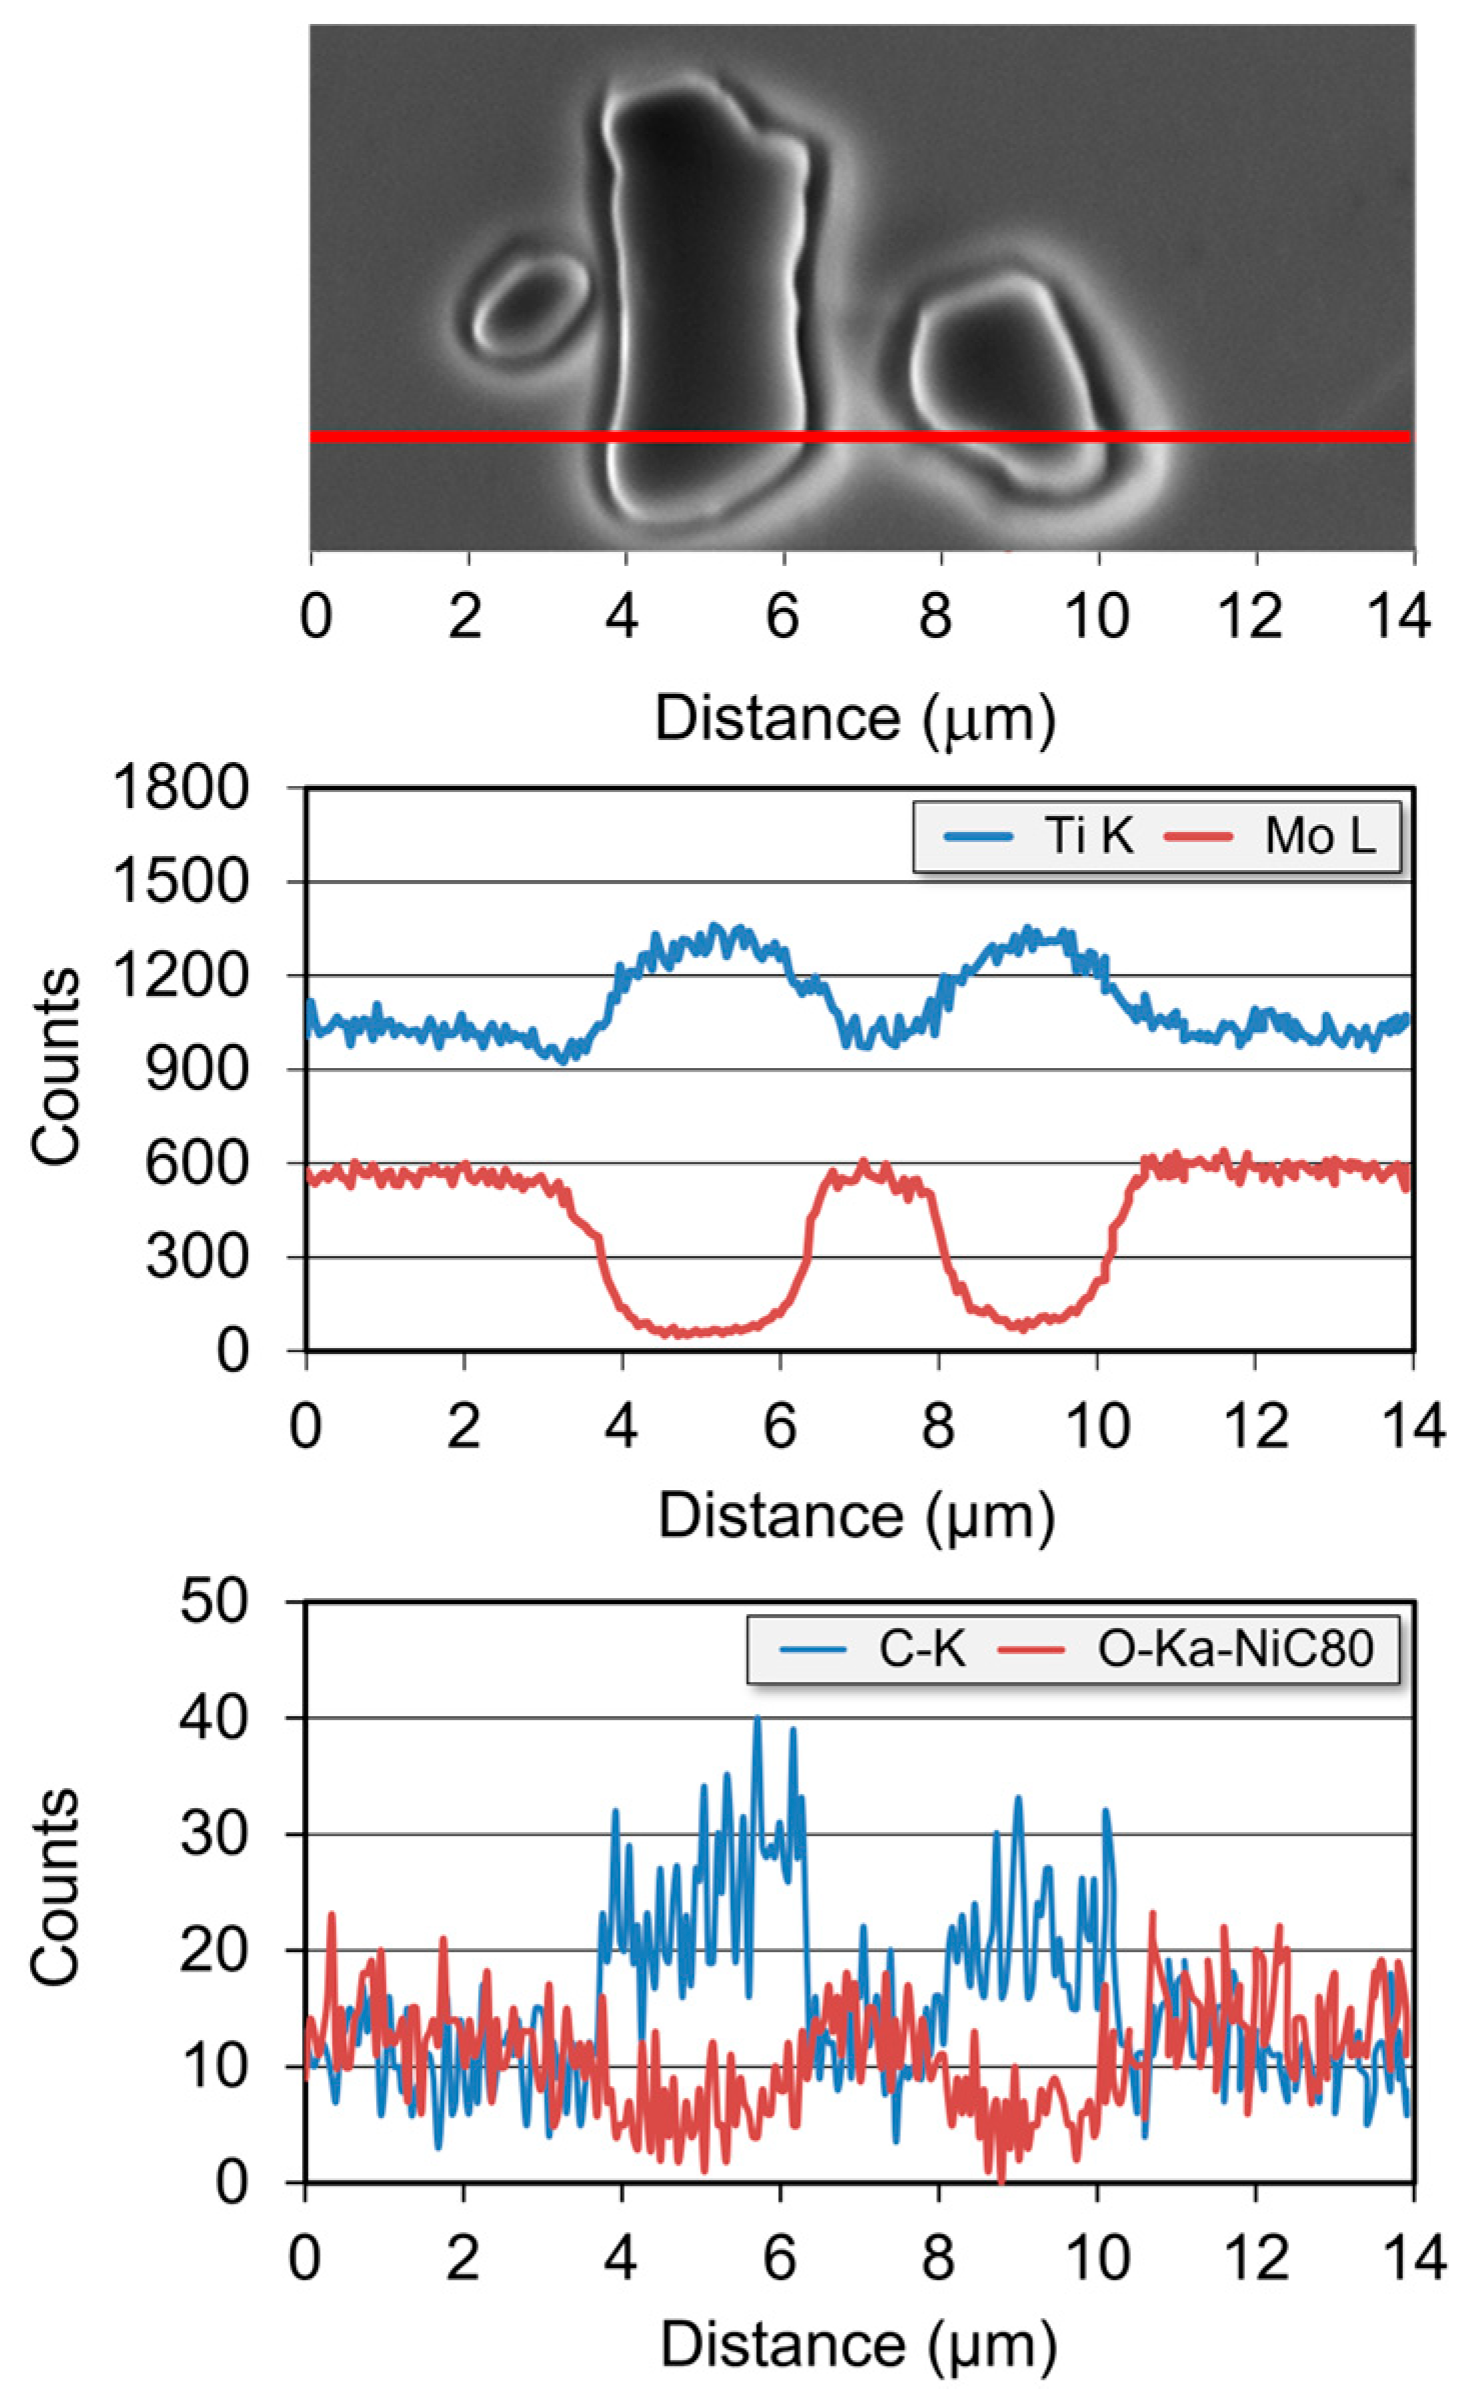
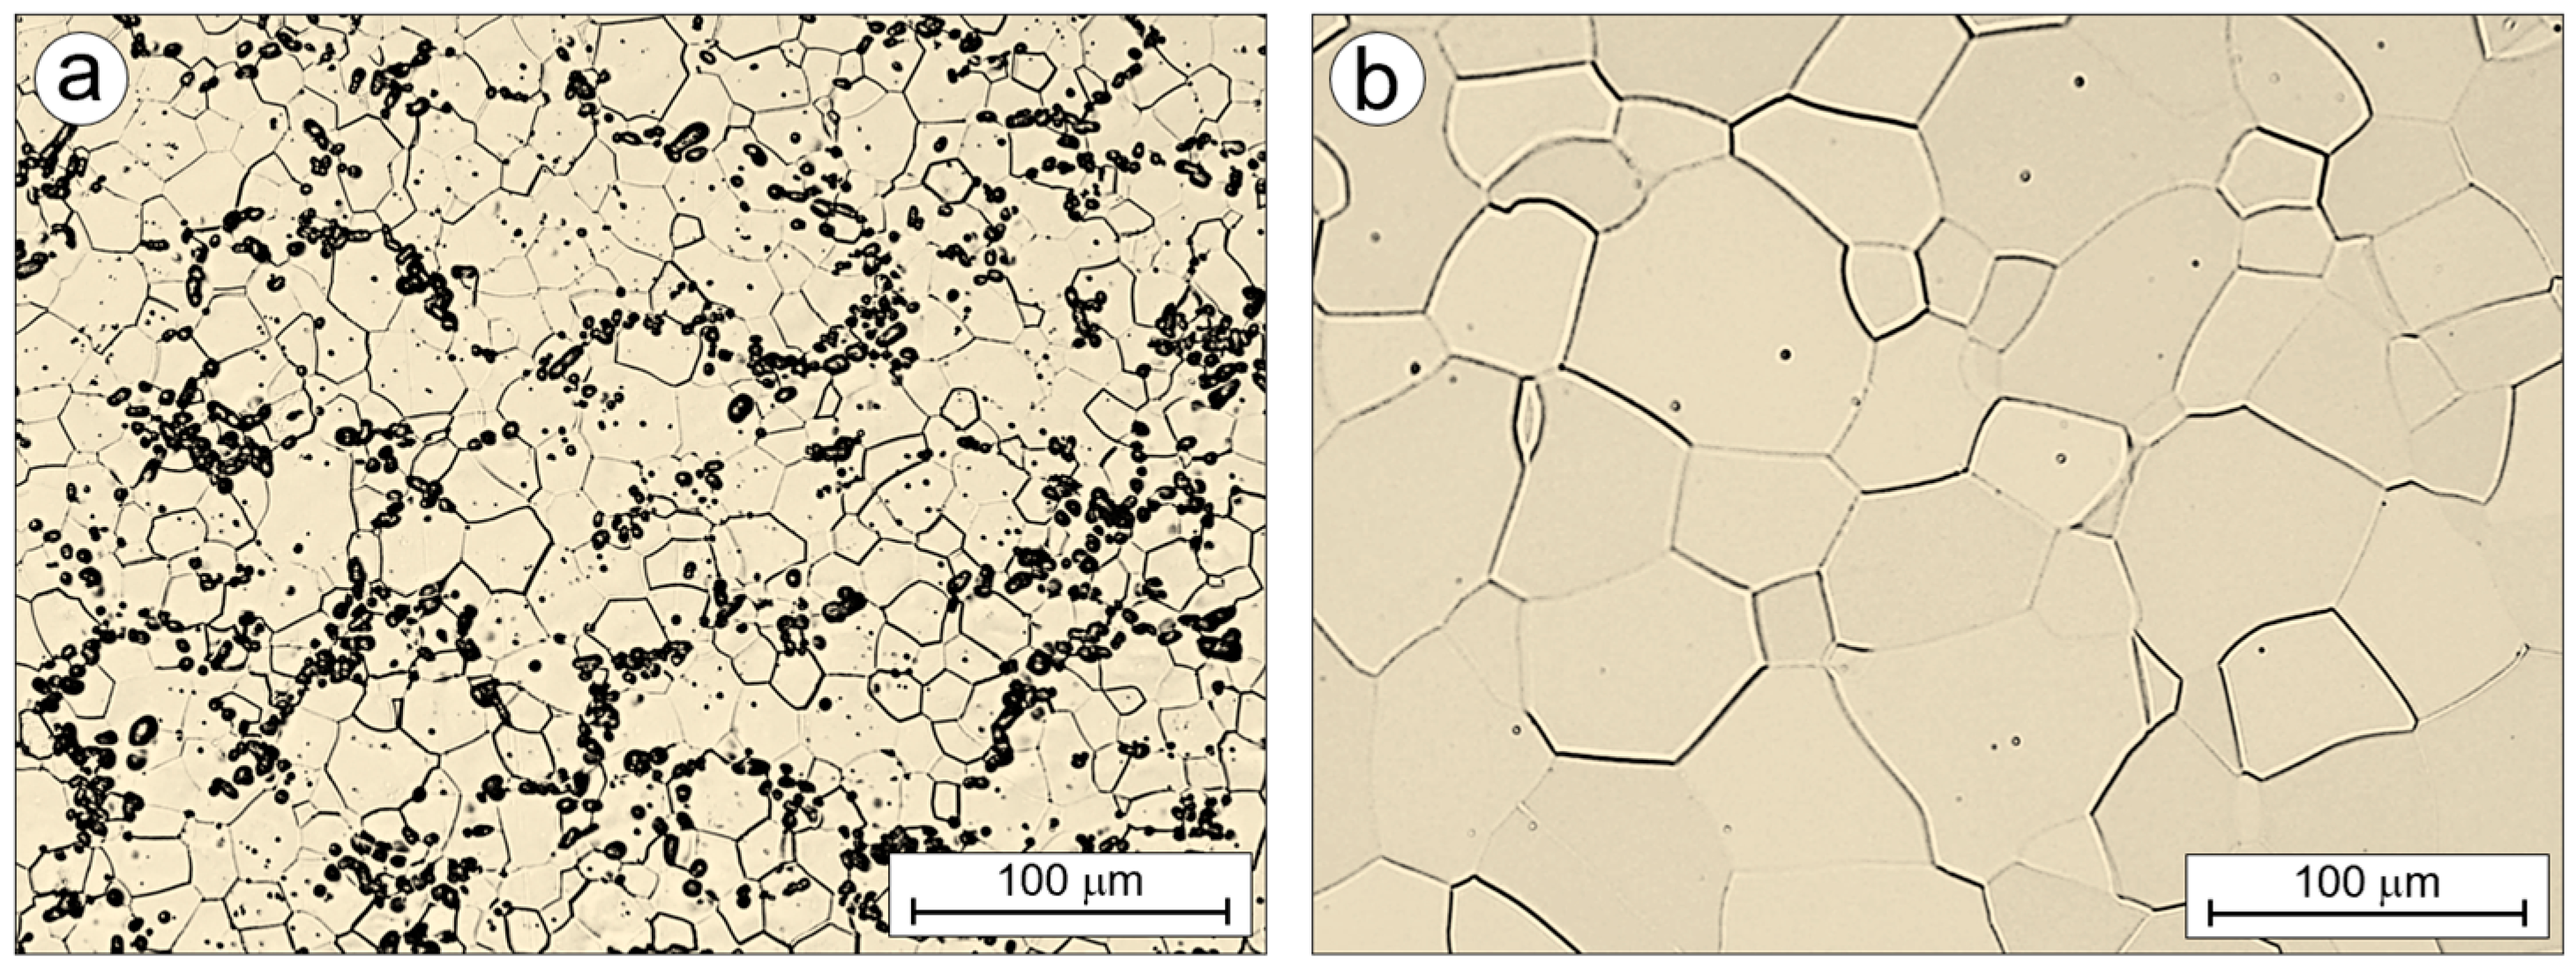
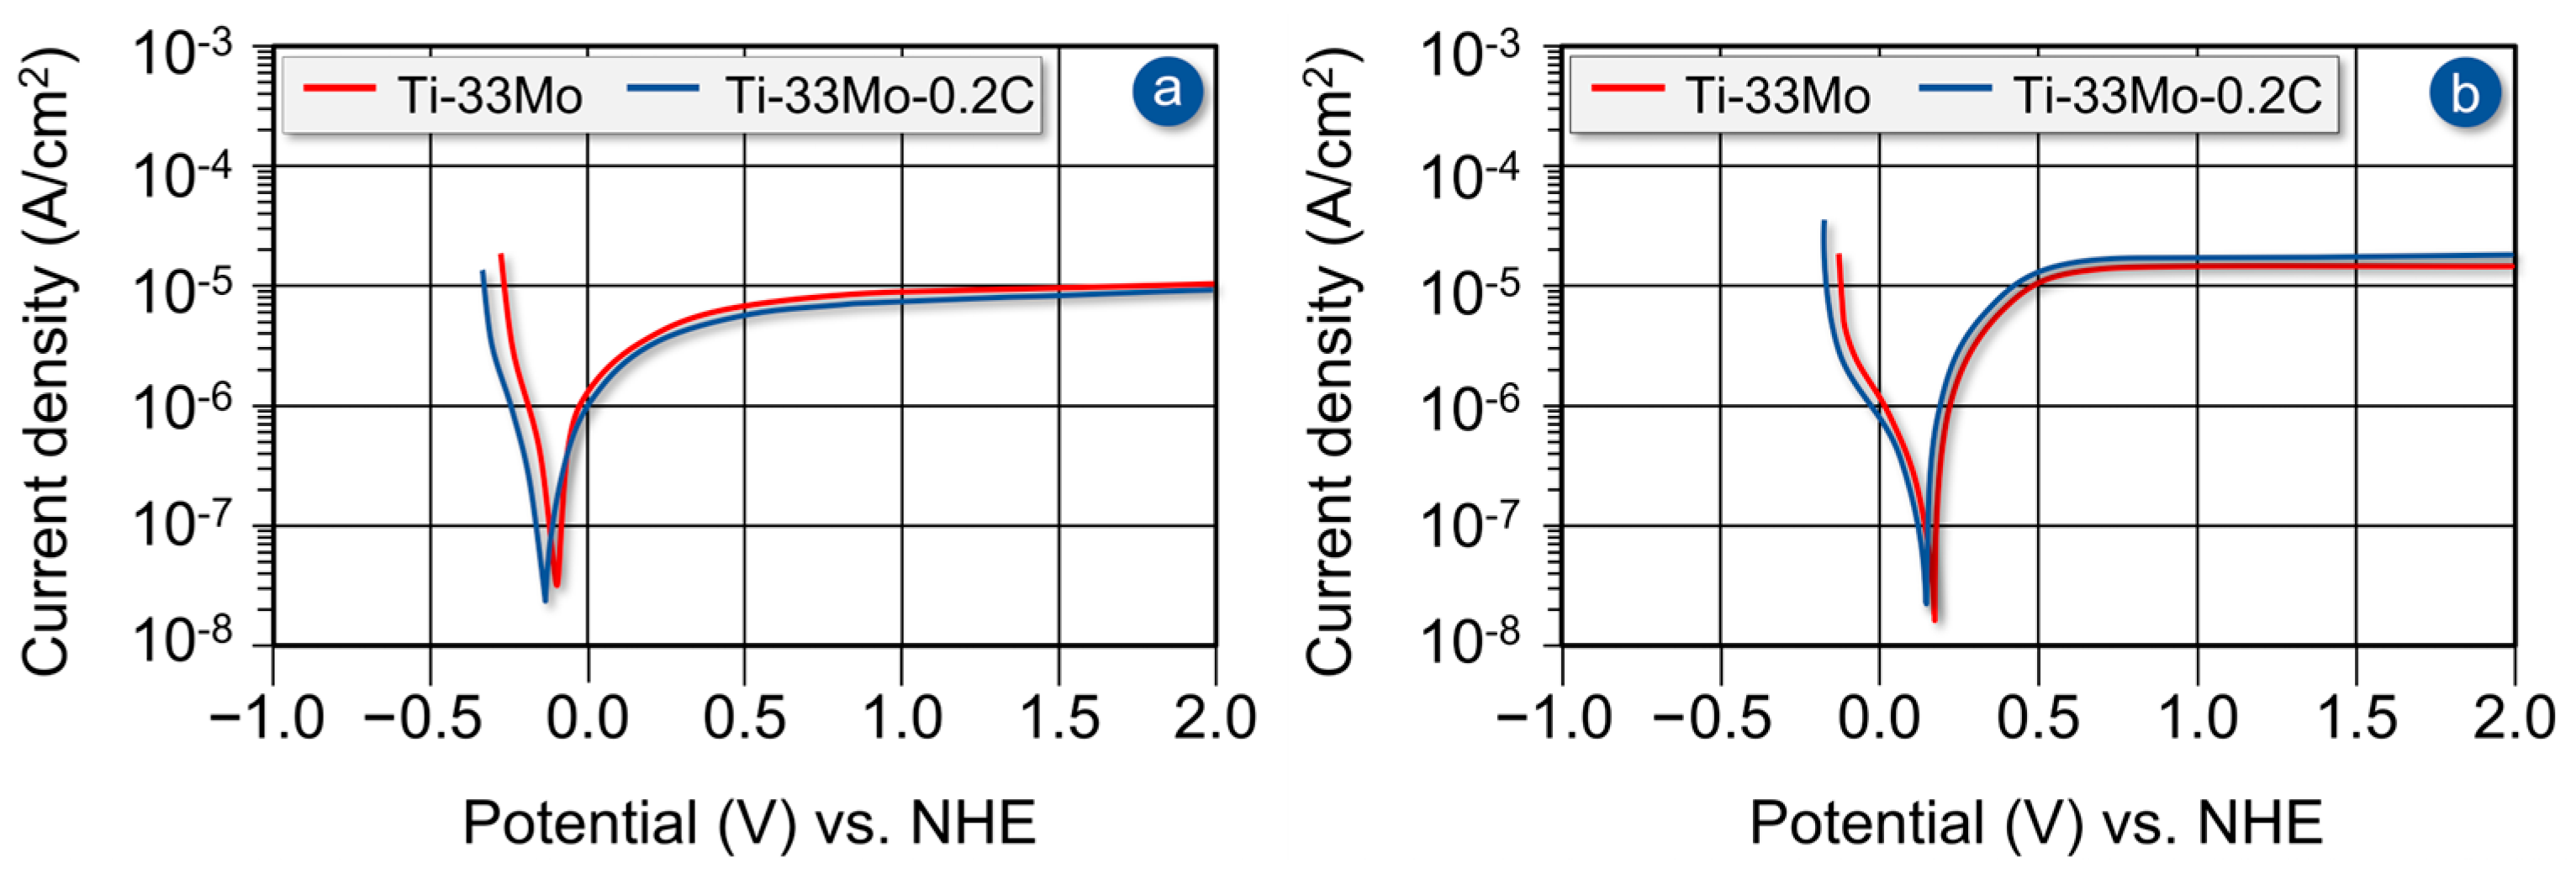
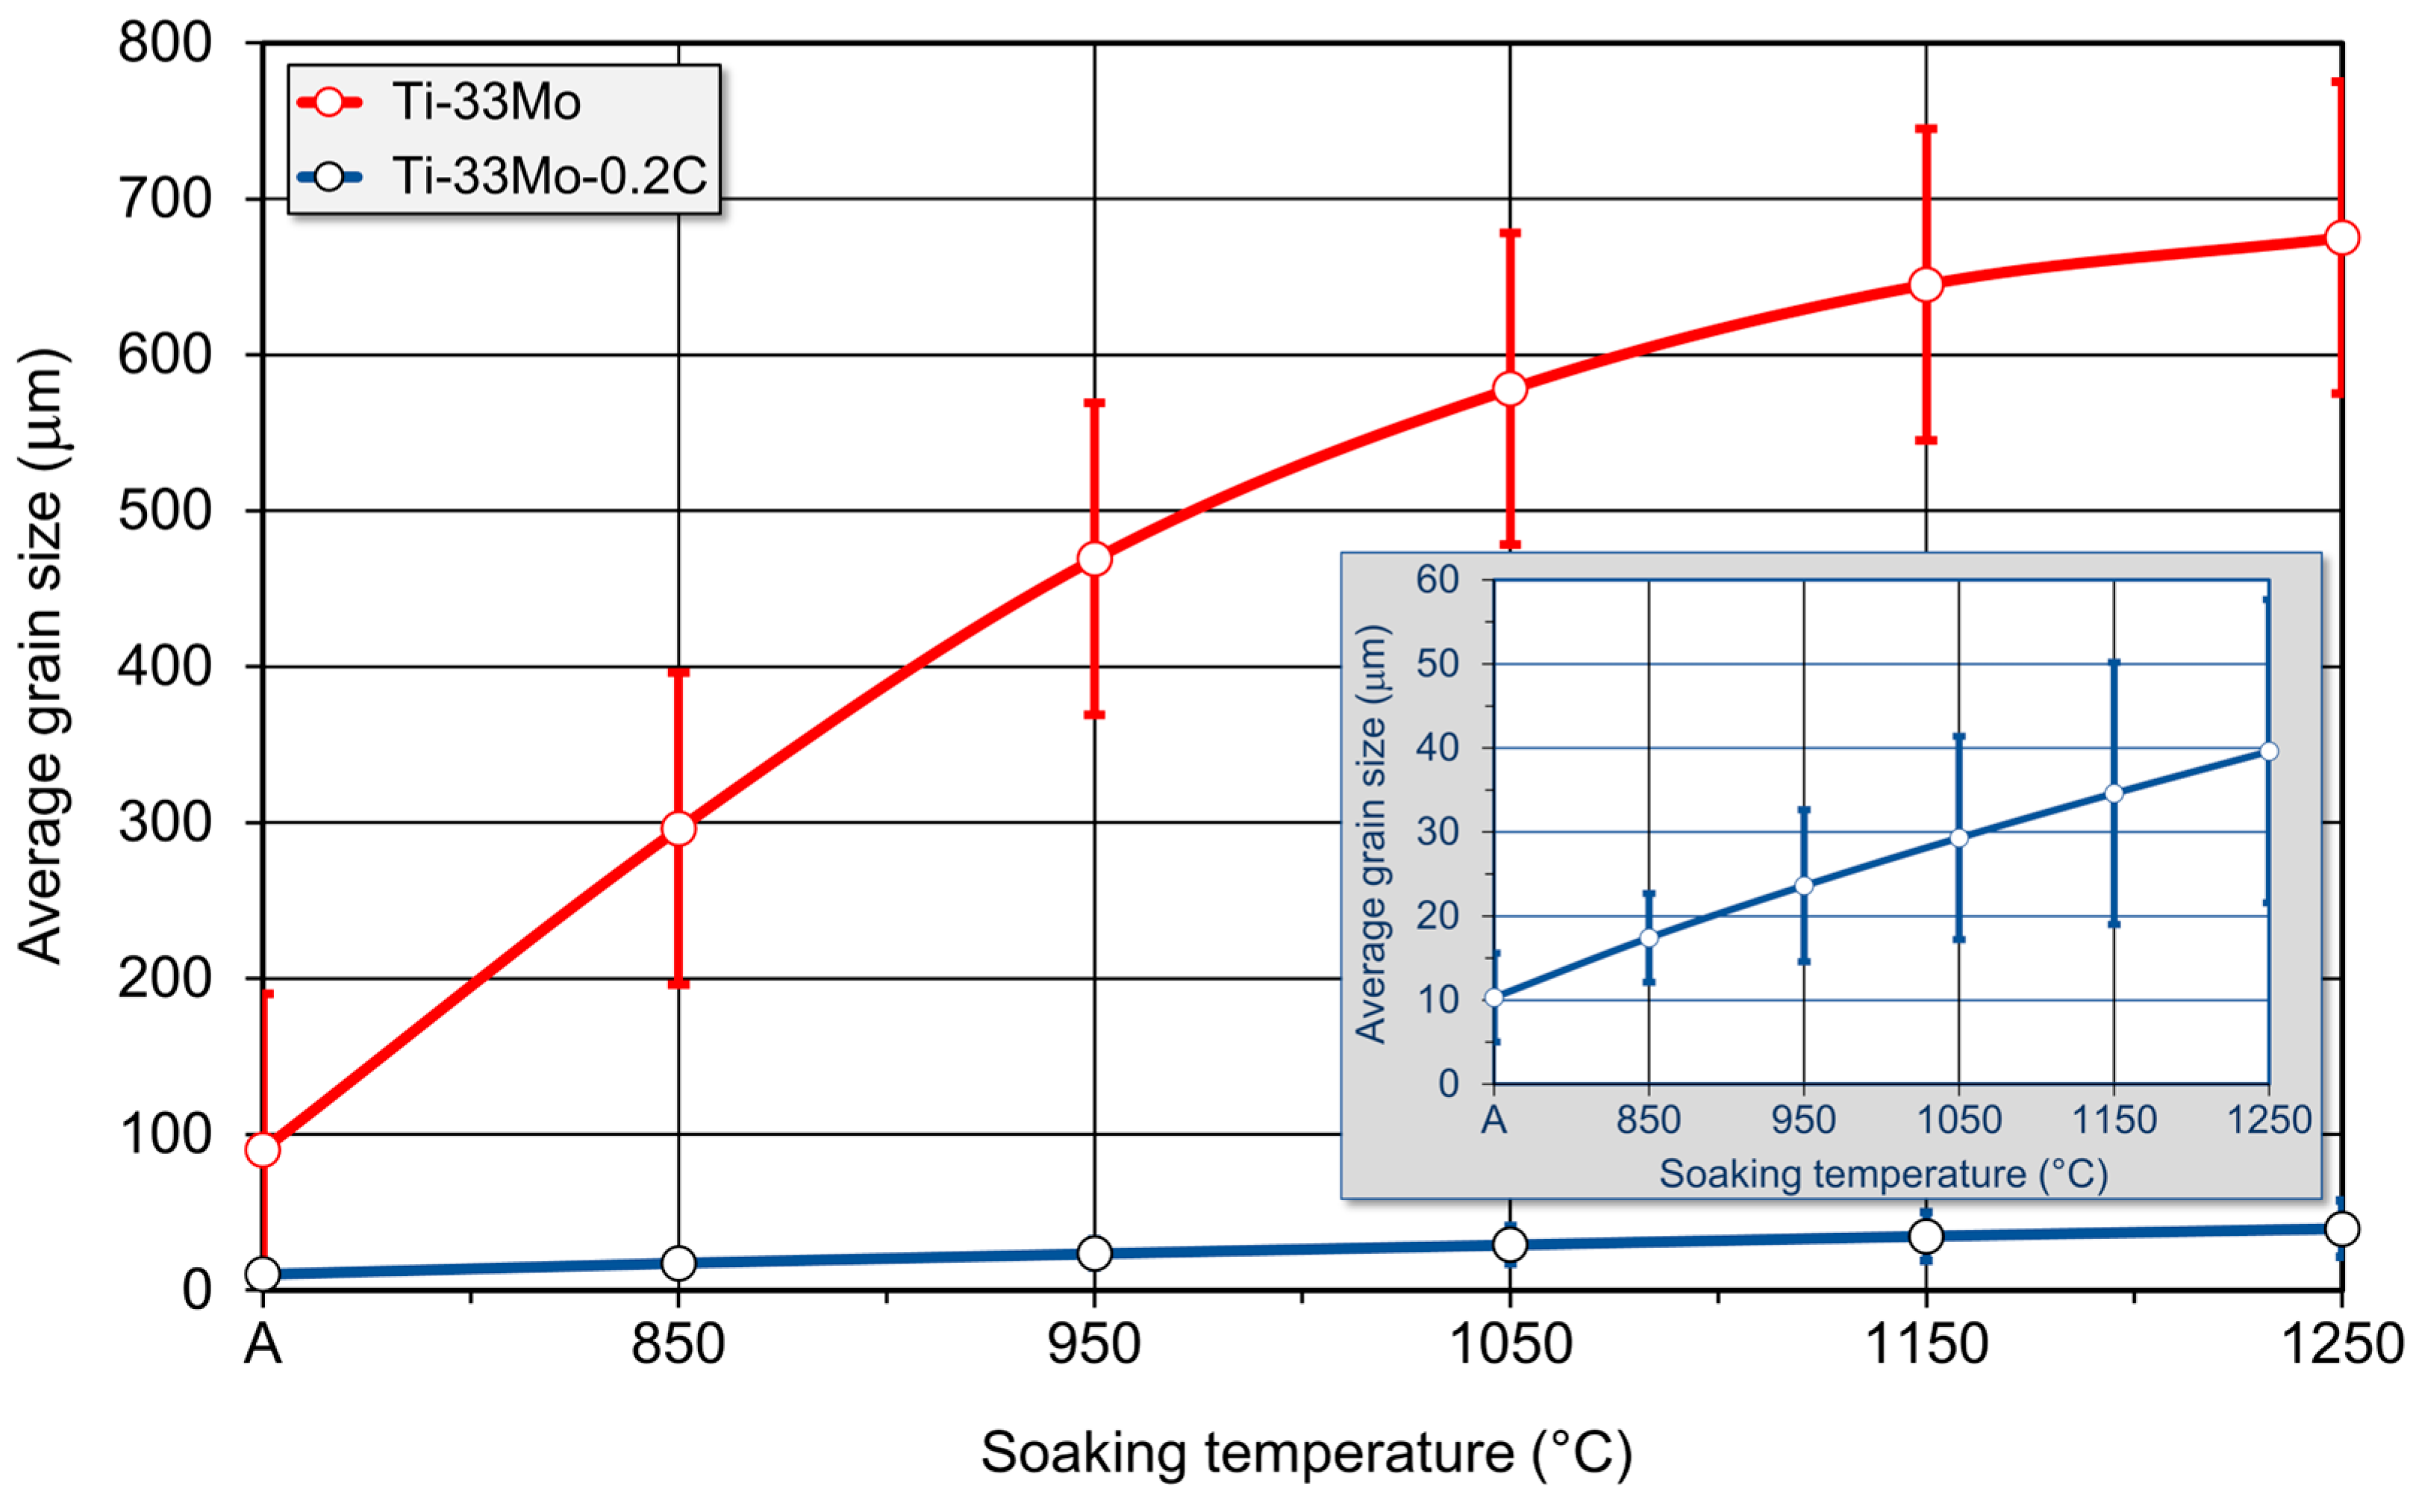
  • The addition of 0.27 wt% carbon to the Ti-33Mo alloy, due to the limited solubility of carbon in the molybdenum-rich β-phase, results in the formation of predominantly non-stoichiometric titanium carbides TiCₓ, which are mostly located at grain boundaries. These carbides accelerate dynamic recrystallization and promote grain refinement during hot plastic deformation, inhibit grain growth during high-temperature heat treatments, and stabilize the microstructure by ″trapping″ oxygen from the immediate vicinity. This oxygen capture effectively prevents the precipitation of the α-phase at grain boundaries, which is known to significantly reduce ductility. Importantly, the addition of carbon does not impair the excellent corrosion resistance of the alloy in both oxidizing and non-oxidizing acidic environments, a critical property of this alloy system.
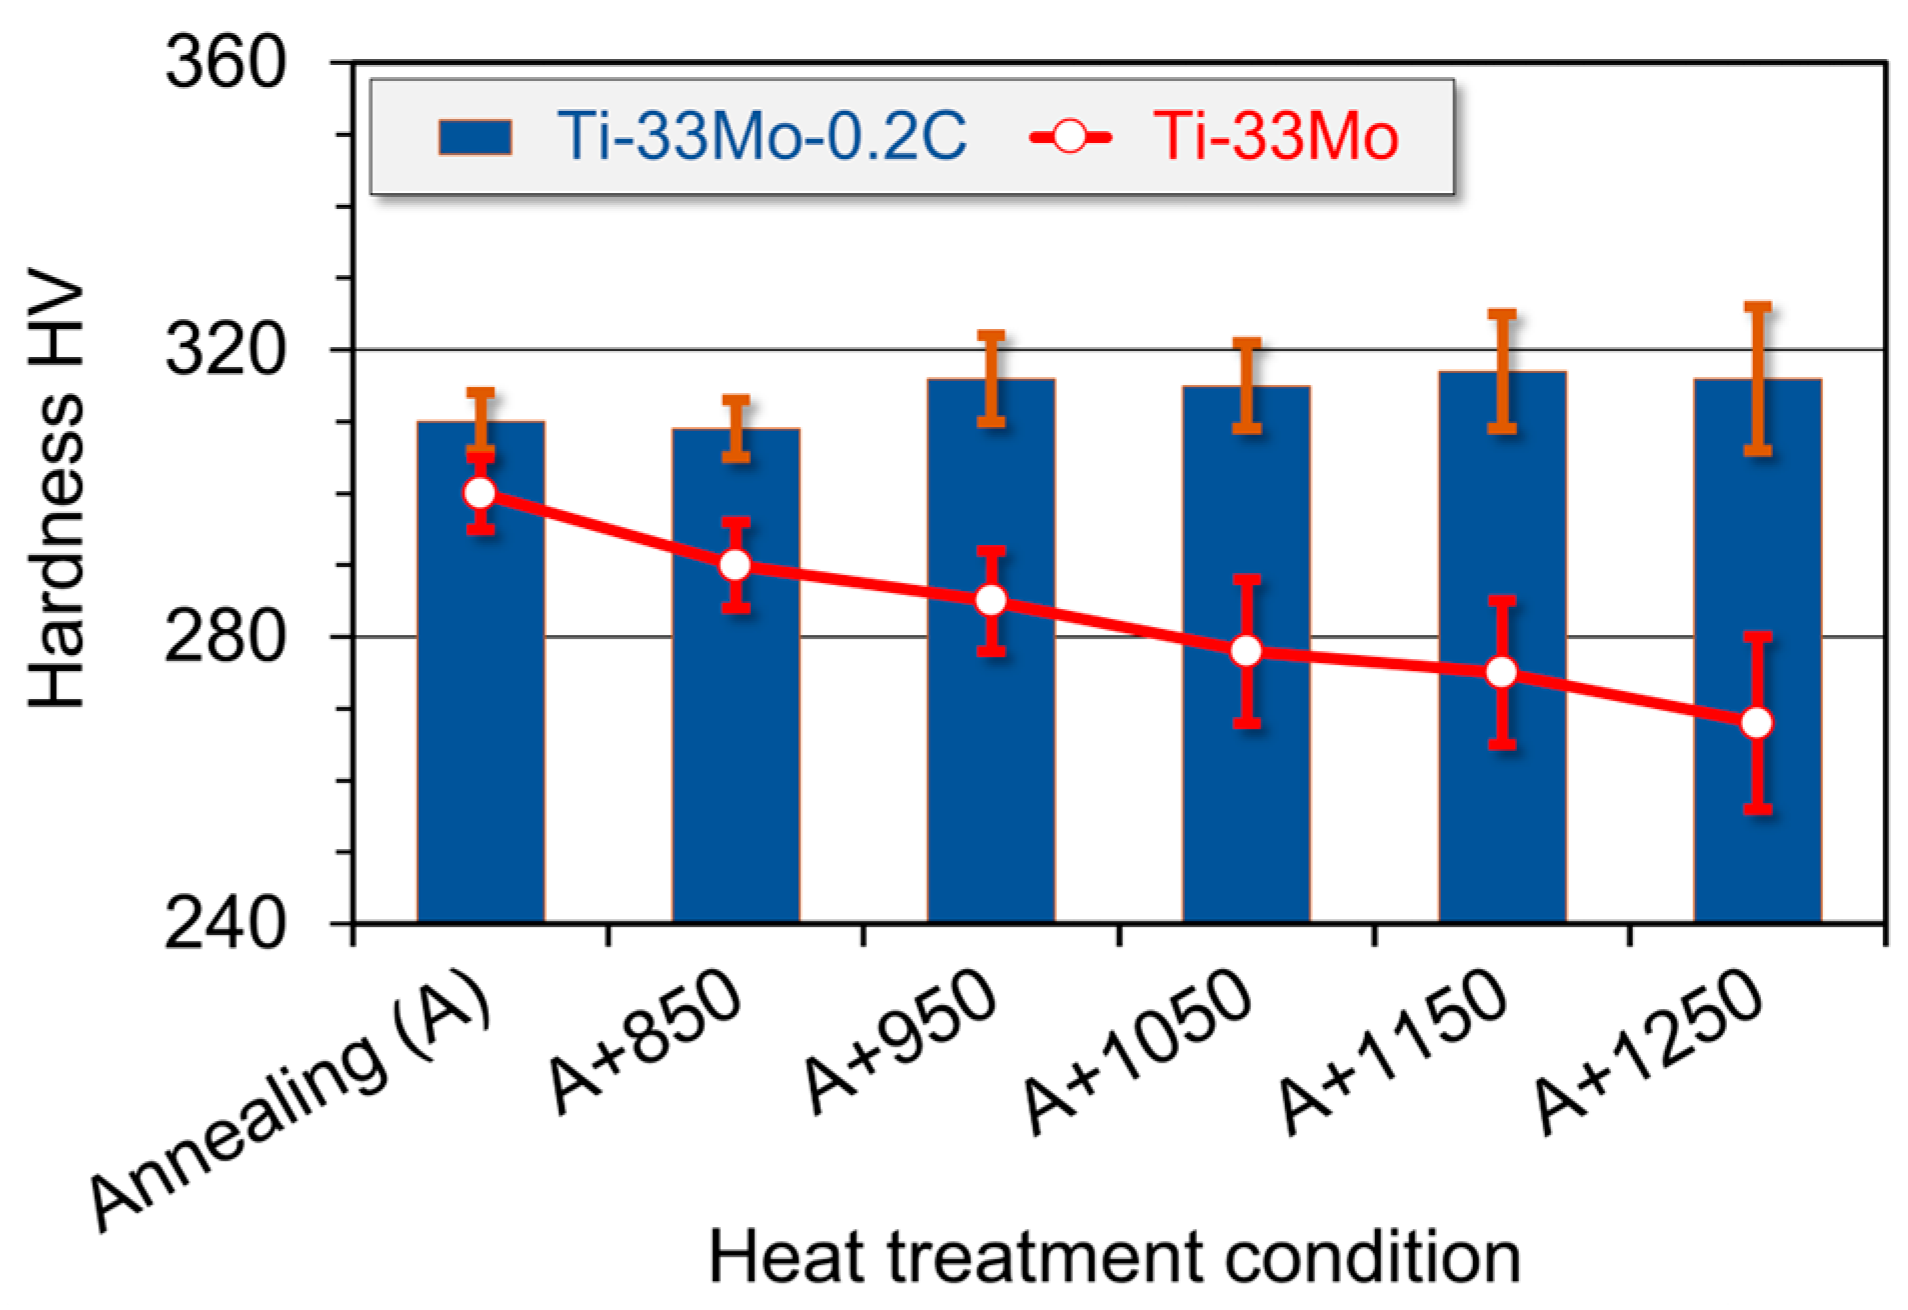
  • The introduction of 0.27 wt% carbon into the Ti-33Mo alloy leads to a modest improvement in strength (UTS increased from 920 to 960 MPa, respectively, for the alloy without and with carbon), hardness (from 300 to 310 HV), and Young’s modulus (from 98 to 101 GPa), a more pronounced enhancement in ductility (EL increased from 15.4% to 16.8%), and, most significantly, an almost twofold increase in creep resistance as measured by the steady-state creep rate (from 9.66 × 10⁻⁵ to 4.55 × 10⁻⁵ s−1). The only adverse effect associated with carbon addition is a moderate reduction in impact toughness, as measured by impact energy (from 12.5 to 10.7 J, respectively, for the alloy without and with carbon); however, this decrease still falls within acceptable limits defined by current standards.
  • Annealing the alloy at very high temperatures, where the solubility of carbon in the β-phase increases with temperature while the carbon content required for carbide formation decreases, activates the partial dissolution of large primary carbides. This process results in carbon diffusing into the matrix and enhances the binding of undissolved carbides to grain boundaries. Additionally, it promotes the precipitation of fine secondary carbides, primarily at subgrain boundaries. These microstructural changes lead to further improvements in the alloy’s mechanical properties and significantly increased creep resistance. These findings support the potential for the future application of more advanced high-temperature solution treatment combined with aging in carbon-containing alloys of this group, minimizing concern for excessive grain growth.
  • Rather than limiting carbon content in β-phase-stabilized titanium alloys, as some have proposed, the findings presented here support maximizing the beneficial effects of carbon. Furthermore, there is potential for continued improvement in alloy performance through the incorporation of inexpensive and widely available carbon at concentrations only slightly exceeding current allowable limits. This strategy could extend the range of applications not only for high-performance, molybdenum-rich titanium alloys but also for other titanium alloys containing the β-phase.

Author Contributions

Conceptualization, A.S. and W.S.; formal analysis, W.S.; investigation, A.S. and W.S.; writing—original draft, A.S.; writing—review and editing, W.S.; visualization, W.S. All authors have read and agreed to the published version of the manuscript.

Funding

The study was partially financed within the statutory research projects: BK-226/RM3/2025 (11/030/BK_25/1221).

Institutional Review Board Statement

Not applicable.

Informed Consent Statement

Not applicable.

Data Availability Statement

Data are contained within the article.

Conflicts of Interest

The authors declare no conflicts of interest.

References

  1. Leyens, C.; Peters, M. Titanium and Titanium Alloys: Fundamentals and Applications; Wiley-VCH Verlag GmbH & Co. KGaA: Weinheim, Germany, 2003. [Google Scholar]
  2. Lütjering, G.; Williams, J.C. Titanium; Springer: Berlin/Heidelberg, Germany, 2007. [Google Scholar]
  3. Froes, F.H. Titanium: Physical Metallurgy, Processing, and Applications; ASM International: Materials Park, OH, USA, 2015. [Google Scholar]
  4. Veiga, C.; Davim, J.P.; Loureiro, A.J.R. Properties and applications of titanium alloys: A brief review. Rev. Adv. Mater. Sci. 2012, 32, 14–34. [Google Scholar]
  5. Chen, Q.; Xu, Y.; Ma, A.; Zhang, L.; Zheng, Y. Study of the passivation and repassivation behavior of pure titanium in 3.5 wt% NaCl solution and 6 M HNO3 solution. Corros. Sci. 2023, 224, 111538. [Google Scholar] [CrossRef]
  6. Laboulais, J.N.; Mata, A.A.; Borrás, V.A.; Muñoz, A.I. Electrochemical characterization and passivation behaviour of new beta-titanium alloys (Ti35Nb10Ta-xFe). Electrochim. Acta 2017, 227, 410–418. [Google Scholar] [CrossRef]
  7. Taninouchi, Y.; Okabe, T.H. Trends of Technological Development of Platinum Group Metal Recycling: Solubilization and Physical Concentration Processes. Mater. Trans. 2023, 64, 627–637. [Google Scholar] [CrossRef]
  8. Wang, G.; Wang, H.; Liu, X. A Study of the Chemical Composition of the Passive Film on a Ti-Mo Alloy in HCl and H2SO4. J. Mater. Eng. Perform. 1997, 6, 199–202. [Google Scholar] [CrossRef]
  9. Balusamy, T.; Jamesh, M.; Kumar, S.; Sankara Narayanan, T.S.N. Corrosion resistant Ti alloy for sulphuric acid medium: Suitability of Ti–Mo alloys. Mater. Corros. 2011, 63, 803–806. [Google Scholar] [CrossRef]
  10. Sakaguchi, S.; Nakahara, K.; Hayashi, Y. Development of Sintered Ti-30mass % Mo Alloy and Its Corrosion Properties. Met. Mater. 1999, 5, 193–195. [Google Scholar] [CrossRef]
  11. Zhao, H.; Xie, L.; Xin, C.; Li, N.; Zhao, B.; Li, L. Effect of molybdenum content on corrosion resistance and corrosion behavior of Ti-Mo titanium alloy in hydrochloric acid. Mater. Today Commun. 2023, 34, 105032. [Google Scholar] [CrossRef]
  12. Bania, P.J. Beta Titanium Alloys and Their Role in the Titanium Industry. JOM 1994, 46, 16–19. [Google Scholar] [CrossRef]
  13. Cotton, J.D.; Briggs, R.D.; Boyer, R.R.; Tamirisakandala, S.; Russo, P.; Shchetnikov, N.; Fanning, J.C. State of the Art in Beta Titanium Alloys for Airframe Applications. JOM 2015, 67, 1281–1303. [Google Scholar] [CrossRef]
  14. Sochacka, P.; Miklaszewski, A.; Jurczyk, M. The influence of Mo content on phase transformation in Ti-Mo alloys. Arch. Metall. Mater. 2017, 62, 2051–2056. [Google Scholar] [CrossRef]
  15. Kolli, R.P.; Devaraj, A. A Review of Metastable Beta Titanium Alloys. Metals 2018, 8, 506. [Google Scholar] [CrossRef]
  16. Wang, Q.; Dong, C.; Liaw, P.K. Structural Stabilities of β-Ti Alloys Studied Using a New Mo Equivalent Derived from [β/(α+β)] Phase-Boundary Slopes. Metall. Mater. Trans. A 2015, 46A, 3440–3447. [Google Scholar] [CrossRef]
  17. Sadeghpour, S.; Javaheri, V.; Abbasi, S.M.; Komi, J. The effect of phase stability on the grain growth behavior of beta titanium alloys. Phys. B Condens. Matter. 2020, 593, 412315. [Google Scholar] [CrossRef]
  18. Finlay, W.L. Titanium Molybdenum Alloys. U.S. Patent 2,614,041, 14 October 1952. [Google Scholar]
  19. Anoshkin, N.F.; Oginskaya, E.I. Specifics of the Production Technology of Ingots and Semi-Finished Products of Corrosion Resistant 4201 Titanium Alloys; FSTC-HT-23-242-70; U.S. Army Foreign Science and Technology Center Technical Translate: Alexandria, VA, USA, 1970. [Google Scholar]
  20. Xu, Z.; Wang, H.; Tang, H.; Cheng, X.; Zhu, Y. Microstructure, microsegregation and mechanical properties of directed energy deposited Ti-32Mo titanium alloy. J. Mater. Sci. 2022, 57, 12540–12555. [Google Scholar] [CrossRef]
  21. Zhang, M.; Ma, B.; Xu, J.; Zhou, H.; Liu, Y.; Chen, Z.; Xu, Z.; Chen, J.; Ye, J. Corrosion behavior of C-22, Ti-0.2Pd and Ti-32Mo alloys in the aqueous solution of hydrochloric acid and sodium chlorate. IOP Conf. Ser. Mater. Sci. Eng. 2021, 1040, 012007. [Google Scholar] [CrossRef]
  22. Shanghai Hite Special Alloy Co., Ltd. Information: Hite Metal Stock List. Available online: https://stocklist.hitealloy.com/details/tb7.html (accessed on 8 April 2025).
  23. Ho, W.F.; Ju, C.P.; Chern Lin, J.H. Structure and properties of cast binary Ti-Mo alloys. Biomater 1999, 20, 2115–2122. [Google Scholar] [CrossRef]
  24. Zhou, Y.-L.; Luo, D.-M. Microstructures and mechanical properties of Ti–Mo alloys cold-rolled and heat treated. Mater. Charact. 2011, 62, 931–937. [Google Scholar] [CrossRef]
  25. Yao, K.; Min, X.; Shi, S.; Tan, Y. Volatilization Behavior of β-Type Ti-Mo Alloy Manufactured by Electron Beam Melting. Metals 2018, 8, 206. [Google Scholar] [CrossRef]
  26. Moshokoa, N.; Raganya, L.; Obadele, B.A.; Machaka, R.; Makhatha, M.E. Microstructural and mechanical properties of Ti-Mo alloys designed by the cluster plus glue atom model for biomedical application. Int. J. Adv. Manuf. Technol. 2020, 111, 1237–1246. [Google Scholar] [CrossRef]
  27. Arensburger, D.S.; Pugin, V.S.; Fedorchenko, I.M. Sintered Titanium-Molybdenum Alloys. Poroshkovaya Metall. 1970, 4, 32–38. [Google Scholar] [CrossRef]
  28. Xua, J.L.; Tao, S.C.; Bao, L.Z.; Luo, J.M.; Zheng, Y.F. Effects of Mo contents on the microstructure, properties and cytocompatibility of the microwave sintered porous Ti-Mo alloys. Mater. Sci. Eng. C 2019, 97, 156–165. [Google Scholar] [CrossRef] [PubMed]
  29. Furuhara, T.; Makino, T.; Idei, Y.; Ishigaki, H.; Takada, A.; Maki, T. Morphology and Crystallography of α Precipitates in β Ti-Mo Binary Alloys. Mater. Trans. JIM 1998, 39, 31–39. [Google Scholar] [CrossRef]
  30. Lua, J.-W.; Zhao, Y.Q.; Geb, P.; Niu, H.-Z. Microstructure and beta grain growth behavior of Ti–Mo alloys solution treated. Mater. Charact. 2013, 84, 105–111. [Google Scholar] [CrossRef]
  31. Yumak, N.; Aslantas, K. A review on heat treatment efficiency in metastable β titanium alloys: The role of treatment process and parameters. J. Mater. Res. Technol. 2020, 9, 15360–15380. [Google Scholar] [CrossRef]
  32. Wang, Q.; Liu, X.; Zhu, T.; Ye, F.; Wan, M.; Zhang, P.; Song, Y.; Huang, C.; Ma, R.; Ren, X.; et al. Mechanism of hydrogen-induced defects and cracking in Ti and Ti–Mo alloy. Int. J. Hydrogen Energy 2023, 48, 5801–5809. [Google Scholar] [CrossRef]
  33. Weiss, I.; Semiatin, S.L. Thermomechanical processing of beta titanium alloys—An overview. Mater. Sci. Eng. A 1998, 243, 46–65. [Google Scholar] [CrossRef]
  34. Murray, J.L. The Mo-Ti (Molybdenum-Titanium) System. Bull. Alloy Phase Diagr. 1981, 2, 185–192. [Google Scholar] [CrossRef]
  35. Barzilai, S.; Toher, C.; Curtarolo, S.; Levy, O. Molybdenum-titanium phase diagram evaluated from ab initio calculations. Phys. Rev. Mater. 2017, 1, 023604. [Google Scholar] [CrossRef]
  36. Collins, P.C.; Banerjee, R.; Banerjee, S.; Fraser, H.L. Laser deposition of compositionally graded titanium–vanadium and titanium–molybdenum alloys. Mater. Sci. Eng. A 2003, 352, 118–128. [Google Scholar] [CrossRef]
  37. Li, Y.G.; Blenkinsop, P.A.; Loretto, M.H.; Walker, N.A. Structure and stability of precipitates in 500 °C exposed Ti-25V-15Cr-xAl alloys. Acta Mater. 1998, 46, 5777–5794. [Google Scholar] [CrossRef]
  38. Li, G.; Li, D.; Liu, Y.; Wang, Q.; Guan, S.; Li, Q. Microstructure and Mechanical Properties of Ti-35V-15Cr-0.05C Nonburning Titanium Alloy. J. Mater. Sci. Technol. 1998, 14, 411–414. [Google Scholar]
  39. Li, Y.G.; Blenkinsop, P.A.; Loretto, M.H.; Rugg, D.; Voice, W. Effect of carbon and oxygen on microstructure and mechanical properties of Ti-25V-15Cr-2Al (wt%) alloys. Acta Mater. 1999, 47, 2889–2905. [Google Scholar] [CrossRef]
  40. Li, Y.G.; Loretto, M.H.; Rugg, D.; Voice, W. Effect of heat treatment and exposure on microstructure and mechanical properties of Ti-25V-15Cr-2Al-0.2C (wt%). Acta Mater. 2001, 49, 3011–3017. [Google Scholar] [CrossRef]
  41. Lei, L.-M.; Xuang, X.; Sun, F.-S.; Wu, X.-R.; Cao, C.-X.; Rugg, D.; Voice, W. Heat treatment process for improving ductility of Ti-25V-15Cr-2Al-0.2C alloy. Trans. Nonferrous Met. Soc. China 2003, 13, 1175–1180. [Google Scholar]
  42. Chen, Z.Q.; Li, Y.G.; Hu, D.; Loretto, M.H.; Wu, X. Role of alloying elements in microstructures of beta titanium alloys with carbon additions. Mater. Sci. Technol. 2003, 19, 1391–1398. [Google Scholar] [CrossRef]
  43. Sun, F.S.; Lavernia, E.J. Creep behavior of nonburning Ti-35V-15Cr-xC alloys. J. Mater. Eng. Perform. 2005, 14, 784–787. [Google Scholar] [CrossRef]
  44. Del Prado, J.; Song, X.; Hu, D.; Wu, X. The influence of oxygen and carbon-content on aging of Ti-15-3. J. Mater. Eng. Perform. 2005, 14, 728–734. [Google Scholar] [CrossRef]
  45. Soo, S.L.; Hood, R.; Lannette, M.; Aspinwall, D.K.; Voice, W.E. Creep feed grinding of burn-resistant titanium (BuRTi) using superabrasive wheels. Int. J. Adv. Manuf. Technol. 2011, 53, 1019–1026. [Google Scholar] [CrossRef]
  46. Alam, T.; Kami, P.; Cao, L.; Nag, S.; Bettles, C.; Wu, X.; Banerjee, R. On the Role of C Addition on α Precipitation in a β Titanium Alloy. Metall. Mater. Trans. A 2014, 45A, 1089–1095. [Google Scholar] [CrossRef]
  47. Banoth, R.; Sarkar, R.; Bhattacharjee, A.; Nandy, T.K.; Nageswara Rao, G.V.S. Effect of boron and carbon addition on microstructure and mechanical properties of metastable beta titanium alloys. Mater. Des. 2015, 67, 50–63. [Google Scholar] [CrossRef]
  48. Zhang, S.; Zeng, W.; Gao, X.; Zhou, D.; Lai, Y. Role of titanium carbides on microstructural evolution of Ti-35V-15Cr-0.3Si-0.1C alloy during hot working. J. Alloys Compd. 2016, 684, 201–210. [Google Scholar] [CrossRef]
  49. Kashapov, O.S.; Pavlova, T.V.; Kalashnikov, V.S.; Popov, I.P. Effect of Carbon Additives on the Mechanical Properties of a Titanium Near-α Alloy. Inorg. Mater. Appl. Res. 2020, 11, 1291–1298. [Google Scholar] [CrossRef]
  50. Szkliniarz, A.; Szkliniarz, W. Effect of carbon content on the microstructure and properties of Ti-6Al-4V alloy. Arch. Metall. Mater. 2020, 65, 1197–1204. [Google Scholar] [CrossRef]
  51. Szkliniarz, A.; Szkliniarz, W. Carbon in Commercially Pure Titanium. Materials 2023, 16, 711. [Google Scholar] [CrossRef]
  52. Szkliniarz, A.; Szkliniarz, W. Microstructure and Properties of Ti-5Al-2.5Sn Alloy with Higher Carbon Content. Coatings 2025, 15, 224. [Google Scholar] [CrossRef]
  53. Yan, M.; Qian, M.; Kong, C.; Dargusch, M.S. Impacts of trace carbon on the microstructure of as-sintered biomedical Ti-15Mo alloy and reassessment of the maximum carbon limit. Acta Biomater. 2014, 10, 1014–1023. [Google Scholar] [CrossRef]
  54. Zhao, D.; Ebel, T.; Yan, M.; Qian, M. Trace carbon in biomedical beta-titanium alloys: Recent progress. JOM 2015, 67, 2236–2243. [Google Scholar] [CrossRef]
  55. Zhao, Y.Q.; Qu, H.L.; Wang, M.M.; Wu, H.; Zhu, K.Y. Thermal stability and creep behavior of Ti–V–Cr burn-resistant alloys. J. Alloys Compd. 2006, 407, 118–124. [Google Scholar] [CrossRef]
  56. Mi, G.; Yao, K.; Bai, P.; Cheng, C.; Min, X. High Temperature Oxidation and Wear Behaviors of Ti–V–Cr Fireproof Titanium Alloy. Metals 2017, 7, 226. [Google Scholar] [CrossRef]
  57. Szkliniarz, A.; Michalik, R. Characteristics of corrosion resistance of Ti-C alloys. Solid State Phenom. 2012, 191, 235–242. [Google Scholar] [CrossRef]
  58. Rudy, E. The Phase Diagrams of the Systems Ti-Nb-C, Ti-Ta-C, and Ti-Mo-C. Air Force Materials Laboratory Technical Report: AFML-TR-69-117; Wright-Patterson AFB: Dayton, OH, USA, 1970. [Google Scholar]
  59. Shim, J.-H.; Oh, C.-S.; Lee, D.N. A Thermodynamic Evaluation of the Ti-Mo-C System. Metall. Mater. Trans. B 1996, 27B, 955–966. [Google Scholar] [CrossRef]
  60. Bandyopadhyay, D.; Haldar, B.; Sharma, R.C.; Chakraborti, N. The Ti-Mo-C (Titanium-Molybdenum-Carbon) System. J. Phase Equilibria 1999, 20, 332–336. [Google Scholar] [CrossRef]
  61. Gusev, A.I. Phase equilibria, phases and chemical compounds in the Ti–C system. Russ. Chem. Rev. 2002, 71, 439–463. [Google Scholar] [CrossRef]
  62. Frisk, K. A revised thermodynamic description of the Ti-C system. Calphad 2003, 27, 367–373. [Google Scholar] [CrossRef]
  63. Zhang, S.; Zeng, W.; Zhou, D.; Lai, Y.; Zhao, Q. The particle stimulated nucleation in Ti–35V–15Cr–0.3Si–0.1C alloy. Mater. Lett. 2016, 166, 317–320. [Google Scholar]
  64. Senkov, O.N.; Chakoumakos, B.C.; Jonas, J.J.; Froes, F.H. Effect of temperature and hydrogen concentration on the lattice parameter of beta titanium. Mater. Res. Bull. 2001, 36, 1431–1440. [Google Scholar] [CrossRef]
  65. Mhadhbia, M.; Drissb, M. Titanium Carbide: Synthesis, Properties and Applications. Brill. Eng. 2021, 2, 1–11. [Google Scholar] [CrossRef]
  66. Guo, Z.; Malinov, S.; Sha, W. Modelling beta transus temperature of titanium alloys using artificial neural network. Comput. Mat. Sci. 2005, 32, 1–12. [Google Scholar] [CrossRef]
  67. Mousavi, E.; Aboutalebi, M.R.; Seyedein, S.H.; Abbasi, S.M. Influence of carbon on the aging behaviour of Ti-13V-11Cr-3Al. Iran. J. Mater. Sci. Eng. 2014, 11, 40–47. [Google Scholar]
  68. ASTM B348/B348M-21; Standard Specification for Titanium and Titanium Alloy Bars and Billets. ASTM International: West Conshohocken, PA, USA, 2021.
  69. Xin, S.W.; Zhao, Y.Q.; Zeng, W.D.; Wu, H. Research on thermal stability of Ti40 alloy at 550 °C. Mater. Sci. Eng. A 2008, 477, 372–378. [Google Scholar] [CrossRef]
Figure 1. Production and testing methods of investigated alloys (based on [52]).
Coatings 15 00546 g001
Figure 2. Pseudo-binary phase diagram of (Ti-33Mo)-C up to 20.0 (a) and 1.0 (b) wt% of carbon predicted using Thermo-Calc software.
Coatings 15 00546 g002
Figure 3. Microstructure of the Ti-33Mo-0.2C alloy after casting (a), hot rolling (b), and annealing (c).
Coatings 15 00546 g003
Figure 4. Microstructure of the Ti-33Mo-0.2C alloy after hot rolling (ac).
Coatings 15 00546 g004
Figure 5. X-ray diffraction (XRD) patterns of investigated alloys.
Coatings 15 00546 g005
Figure 6. SEM image of carbides in Ti-33Mo-0.2C alloy after annealing and EDS/WDS maps of the corresponding area for Ti, Mo, C, and O.
Coatings 15 00546 g006
Figure 7. A linear elemental distribution of Ti, Mo, C, and O for analyzed area (along the line) of Ti-33Mo-0.2C alloy.
Coatings 15 00546 g007
Figure 8. SEM image of the microstructure of Ti-33Mo-0.2C alloy after annealing in the secondary electron detection mode (a) and energy-dispersive X-ray spectrum at marked points with results of quantitative EDS analysis (b).
Coatings 15 00546 g008
Figure 9. Microstructure of the Ti-33Mo-0.2C (a) and Ti-33Mo (b) alloy after annealing.
Coatings 15 00546 g009
Figure 10. Effect of carbon on the creep curves of the Ti-33Mo alloy (* results for this variant are described in Section 3.2.4).
Coatings 15 00546 g010
Figure 11. Microstructure of Ti-33Mo-0.2C alloy on the longitudinal section of the holder part (a) and the working part (b) of the creep sample after creep at temperature of 500 °C and applied stress of 200 MPa.
Coatings 15 00546 g011
Figure 12. Effect of carbon on the potentiodynamic polarization curves of the Ti-33Mo alloy in 10% hydrochloric acid solution (a) and 40% nitric acid solution (b).
Coatings 15 00546 g012
Figure 13. Microstructure of the Ti-33Mo-0.2C alloy after solution treatment at 850 °C (a) with water cooling (a) and aging at 500 °C for 4 h (b).
Coatings 15 00546 g013
Figure 14. Microstructure of Ti-33Mo-0.2C alloy after annealing (a) and after additional soaking for 1h at the following temperatures: 850 (b), 950 (c), 1050 (d), 1150 (e), and 1250 °C (f).
Coatings 15 00546 g014
Figure 15. Microstructure of Ti-33Mo alloy after annealing (a) and after additional soaking for 1h at the following temperatures: 850 (b), 950 (c), 1050 (d), 1150 (e) and 1250 °C (f).
Coatings 15 00546 g015
Figure 16. Effect of carbon and soaking temperature on the average grain size of Ti-33Mo alloy.
Coatings 15 00546 g016
Figure 17. Effect of carbon and soaking temperature on the hardness of Ti-33Mo alloy.
Coatings 15 00546 g017
Figure 18. Effect of soaking temperature on the carbide area (a) and shape factor distribution of the carbides (b) in Ti-33Mo-0.2C alloy.
Coatings 15 00546 g018
Figure 19. Microstructure of Ti-33Mo-0.2C alloy after annealing (a) and after additional soaking for 1h at temperature: 1050 (b) and 1250 °C (c).
Coatings 15 00546 g019
Table 1. Characteristic of beta stable Ti-Mo alloys [18,19,20].
Alloy CompositionCommercial NameYear Introduced by Country
Ti-30Mo 1952—USA
Ti-40Mo
Ti-33Mo42011968—Russia
Ti-32MoTB71990—China
Table 2. Chemical composition of investigated alloys.
AlloyAlloying Elements and Impurity Contents (wt%)
MoCONHTi
Ti-33Mo-0.2C33.100.270.180.030.01Balance
Ti-33Mo33.230.030.160.030.01
Table 3. Grain size and stereological parameters of carbides in the microstructure of Ti-33Mo-0.2C alloy.
ProcessesGrain Size and Stereological Parameters of Carbides after the Processes
Average Grain
Size (μm)
Area Fraction (%)Mean
Area (μm2)
Coefficient of Variation in Area (%)Shape
Factor
Homogenization211.6 ± 67.57.1526.47 ± 78.34296.00.50 ± 0.44
Hot rolling18.6 ± 13.26.824.00 ± 4.50112.50.83 ± 0.17
Annealing10.3 ± 5.36.955.98 ± 5.6090.90.86 ± 0.13
Table 4. Lattice parameters of phases of investigated alloys.
ParameterAlloy
Ti-33MoTi-33Mo-0.2C
aβ (nm)0.32300.3236
aTiCx (nm)-0.4316
Calculated Tα→β (°C)590623
Table 5. Mechanical properties of investigated alloys after annealing (A), solution treatment and aging (STA) and after additional soaking for 1h at temperature 1250 °C with air cooling (A+1250).
AlloyUTS (MPa)YS (MPa)EL (%)RA (%)E (GPa)HVCVN (J)
Ti-33Mo(A)920 ± 10902 ± 815.4 ± 0.835.2 ± 1.898 ± 2300 ± 512.5 ± 1.2
Ti-33Mo-0.2C(A)960 ± 12944 ± 1016.8 ± 0.839.0 ± 1.8101 ± 2310± 810.7 ± 1.0
Increase/decrease+4.3%+4.7%+9.1%+13.6%+3.1%+3.3%−14.4%
Ti-33Mo-0.2C (STA) *965 ± 10945 ± 1216.0 ± 0.938.7 ± 2.0101 ± 2315 ± 810.6 ± 1.2
Ti-33Mo-0.2C (A+1250) *975 ± 10963 ± 1015.5 ± 0.838.2 ± 1.8101 ± 2325 ± 610.5 ± 1.1
* Results for these variants are described in Section 3.2.4.
Table 6. Effect of carbon on the creep characteristics of the Ti-33Mo alloy.
AlloySecondary Creep ConditionSecondary Creep Rate (h−1)Tertiary Creep ConditionTime to Reaches the Strain of (h)
0.10%0.20%0.50%1.00%2.00%
Ti-33Mo (A)21.5 h/0.32%9.66 × 10−566.0 h/0.75%2.28.340.188.0142.5
Ti-33Mo-0.2C (A)20.0 h/0.20%4.55 × 10−5108.0 h/0.60%3.520.086.5162.5-
Ti-33Mo-0.2C (A+1250) *20.0 h/0.15%3.30 × 10−5-9.538.5128.5--
* Results for this variant are described in Section 3.2.4.
Table 7. Parameters of the potentiodynamic polarization curves of the Ti-33Mo and Ti-33Mo-0.2C alloy in different media.
MediumAlloyCorrosion
Potential (V)
Corrosion Current Density (A/cm2)Passive Current Density (A/cm2)
10% HClTi-33Mo−0.263.9 × 10−71.5 × 10⁻⁵
Ti-33Mo-0.2C−0.272.0 × 10−71.2 × 10⁻⁵
40% HNO3Ti-33Mo0.183.0 × 10−78.1 × 10⁻⁶
Ti-33Mo-0.2C0.162.6 × 10−79.0 × 10⁻⁶
Table 8. Grain size and stereological parameters of carbides in the Ti-33Mo-0.2C alloy after annealing (A) and additional soaking for 1 h at different temperatures.
ProcessesGrain size and Stereological Parameters of Carbides After Processes
Average Grain
Size (μm)
Area
Fraction (%)
Mean
Area (μm2)
Coefficient of Variation in Area (%)Shape
Factor
Annealing (A)10.3 ± 5.36.955.98 ± 5.6090.90.86 ± 0.13
A+85017.4 ± 5.36.845.52 ± 5.1092.40.88 ± 0.13
A+95023.6 ± 9.16.755.16 ± 4.6993.60.90 ± 0.12
A+105029.3 ± 12.16.124.62 ± 5.05109.30.90 ± 0.13
A+115034.6 ± 15.65.553.12 ± 4.85155.40.90 ± 0.12
A+125039.6 ± 18.14.701.68 ± 3.98236.90.96 ± 0.10
Disclaimer/Publisher’s Note: The statements, opinions and data contained in all publications are solely those of the individual author(s) and contributor(s) and not of MDPI and/or the editor(s). MDPI and/or the editor(s) disclaim responsibility for any injury to people or property resulting from any ideas, methods, instructions or products referred to in the content.

