Abstract
Mg-Li alloy is widely used in aerospace and military equipment, but the research on its micromechanical mechanism is still insufficient. In this paper, molecular dynamics simulation is used to analyze the nano-indentation response and mechanical mechanism of single crystal Mg-Li. The deformation and hardness changes of Mg-Li under different loads were studied by load–displacement and hardness–depth curves. At the same time, the dislocation defects and equivalent stress are analyzed to reveal the dislocation formation and stress distribution in the process of deformation. Finally, under the condition of stress relaxation, the mechanical behavior of Mg-Li in the process of nano-indentation was revealed, and the deformation mechanism of Mg-Li alloy was studied.
1. Introduction
With the progress of material surface science, using the traditional methods of material mechanics testing it has been difficult to meet the needs of modern material research. Therefore, nanoindentation technology has been widely used in the study of mechanical properties of micro/nano-scale materials. This technique can effectively evaluate the key mechanical properties of materials such as elastic modulus, hardness and strain hardening effect [1,2,3]. To date, nanoindentation technology [4] has been successfully applied to a variety of material applications, involving a wide range of important components in civil- and military-related industries.
The nanoindentation experiment [5] has challenges in revealing the transient atomic information inside the material. The molecular dynamics simulation method can greatly make up for the material microscopic blank field. This method can simulate the atomic-level interaction between the indenter and the material, and deeply analyze the structural evolution, thus revealing the deformation mechanism and mechanical properties of the material. With the development of computer technology, researchers can use high-performance computing capabilities to obtain key parameters such as load–displacement curves, mechanical mechanisms, and structural deformation [6,7,8], providing theoretical support for material performance research.
Magnesium–lithium alloy is a lightweight structural material, especially with the addition of 14–16 wt. % of lithium, with extremely low density and large elastic modulus [9,10]. It can be processed by cold metal forming processing, casting or semi-solid injection molding. With the upgrading of China ’s automobile, 3C and other industries, the market potential of Mg-Li alloy is huge, especially in the field of automobile lightweight and new energy. At the same time, applications in the pharmaceutical, chemical and aerospace sectors will continue to grow [11,12,13].
Nanoindentation technology, through continuous load and real-time indentation depth measurement, can accurately obtain the hardness, elastic modulus and other properties of materials. It is widely used in the fields of thin film coatings, special functional materials and biological tissues [14,15,16]. Compared with the traditional hardness test, the nanoindentation technology controls the load change through a computer program, which has higher accuracy and resolution, and can reduce the measurement error and experimental error. In addition, the nanoindentation technology has less damage to the material and can be regarded as a non-destructive test, thus broadening its application range. With the deepening of research, the relationship between macroscopic mechanics and microstructure of materials has attracted much attention. As an important means of modern scientific research, molecular dynamics simulation considers the interaction between atoms, bonding energy, etc., simulates the interaction of atoms and reveals the mechanism of nanoindentation [17,18,19].
The research of Mg-Li alloys began in the 1960s. It was used by NASA for aerospace parts, but it was stalled due to high lithium prices and corrosion-resistance challenges. Nowadays, the progress of smelting and surface-treatment technology has attracted more attention. The United States, Japan, Germany, Russia and other countries have commercial series. In this study, the nanoindentation process was simulated by molecular dynamics to investigate the mechanical properties and microstructure changes of Mg-Li alloys [20,21,22]. By comparing with the actual nanoindentation experiment, this study aims to reveal the influence of different factors on the nanoindentation response and enrich the research results of Mg-Li alloys. In this study, Atomsk (V0.13.1) softwarewas used for modeling, Lammps (2023) was used for Molecular dynamics simulation, and Ovito (3.12.2) software was used for post-processing. The research procedure is as follows (Figure 1).
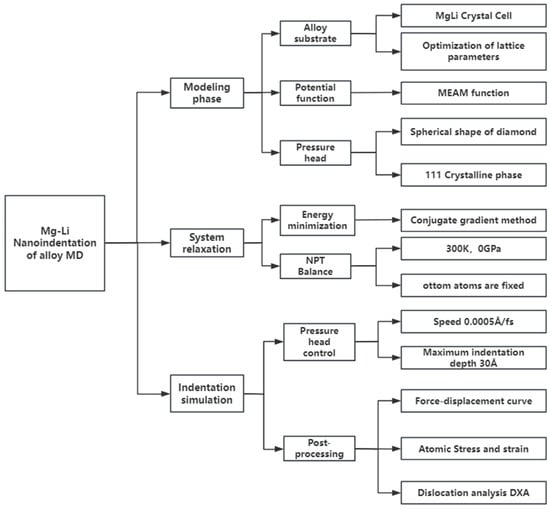
Figure 1.
Study roadmap.
In this paper, the simulation process is divided into the following four steps: (1) Before the indentation, the conjugate gradient (CG) method is used to minimize the energy of the simulation system to push away the overlapping atoms, so as to obtain a stable structure. (2) The time step is set up, the length is 1 fs and the temperature and pressure of the system are controlled in the NPT ensemble. In order to avoid the influence of thermal vibration, the temperature is kept at 300 K, and the pressure is controlled at 0 bar to eliminate the stress in the high-entropy alloy model. (3) After the surface of the high-entropy alloy matrix is covered with a graphene layer, the composite material model (hereafter referred to as the composite system) is rebalanced in the NVT ensemble. (4) Finally, in the NVT ensemble, the virtual rigid indenter directly above the material moves along the negative z direction at a speed of 50 m/s until the indentation depth reaches 3 nm.
The Berkovich indenter [23] was selected in this study, which is shaped as a triangular pyramid cut at a specific angle, which is very suitable for measuring the elastic modulus and hardness values of materials. However, this indenter is not ideal for the estimation of the elastoplastic transition point. When the indenter initially presses the material, elastic deformation mainly occurs. As the load increases, the indentation depth increases, and plastic deformation appears [24]. Plastic deformation causes the loading and unloading curves to not coincide, forming indentations on the material surface [25]. The load–displacement curve can calculate the material hardness and equivalent elastic modulus. The calculation principle is described below [26]:
Equation (1) is a calculation formula for hardness, where the maximum load is and the contact area is . It represents the theoretical contact surface of the indenter. The product is . At present, the Oliver–Pharr method is usually used to calculate the contact area in academic research [27]. First, the slope of the unloading curve needs to be fitted, which needs to be expressed by a specific equation, i.e., Equation (2):
In this equation, the parameters involved such as residual indentation depth and specific coefficients B and m are determined by fitting experimental curves. After differentiating the slope of the unloading curve, expression (3) for the maximum indentation depth and the slope of the unloading point can be obtained:
The maximum pressing depth is and the unloading curve slope is . Equation (4) is the actual contact depth. In this formula, the constant is related to the shape of the indenter, and the indenter values of different shapes are different.
The formula contains the constant , and its numerical value is related to the shape and appearance of the indenter. The calculation formula for the head area is shown in Equation (5):
The fitting constants need to be determined experimentally. In order to calibrate the contact area of the indenter, the contact area will be adjusted at a given hardness. Multiple indentation experiments were carried out on the fused silica glass calibration piece, and then Equation (5) was used to fit, so as to obtain the calibration data of the indenter contact area of this experiment.
The equivalent elastic modulus is calculated by Equation (6), and the constant involved is 1.034.
At the same time, the equivalent elastic modulus is also related to the Young’s modulus and can be calculated by Equation (7).
and are the Young’s modulus and Poisson’s ratio of the indenter, respectively. The Young’s modulus of the diamond indenter is 1140 GPa, and the Poisson’s ratio is 0.07.
2. Numerical Model Setup and Boundary Conditions
In the nanoindentation experiment, the indenter is the key element, and the selection of the indenter will have a certain influence on the experimental results. Usually, diamond is used as the indenter material in the study, so this paper also uses this material to establish a diamond spherical indenter model as shown in Figure 1.
Figure 2 is a diamond indenter model with a lattice constant of 3.567 Å. Since the tip of the Bose indenter is spherical at the microscopic scale, the simulation in this paper is set to a spherical indenter with a radius of 30 Å, a total of 19,949 atoms.
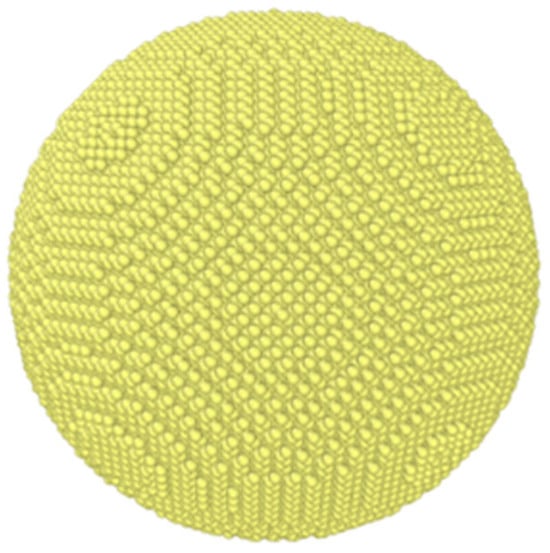
Figure 2.
Diamond indenter model.
The lattice structure of the Mg-Li material studied in this paper is the body-centered cubic lattice structure (BCC), and its lattice constant is 3.484 Å, and its lattice structure is shown in Figure 3a. In this lattice structure, Li atoms are located at eight corners of the lattice, and Mg atoms are located at the center of the cell. In order to study the mechanical evolution mechanism of nanoindentation on different crystal orientations, a [111] crystal orientation model was established in this paper.
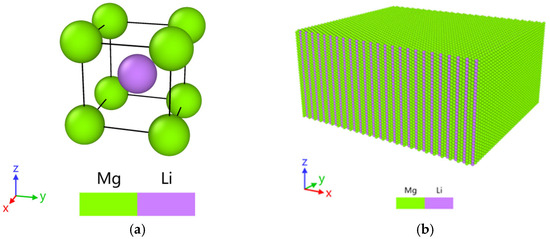
Figure 3.
Mg-Li lattice and [111] single crystal Mg-Li molecular dynamics model. (a) Mg-Li lattice structure; (b) [111] crystal orientation model.
The crystal orientation model shown in Figure 4 is a Newtonian layer, an isothermal layer and a fixed layer from top to bottom. As the main body of molecular dynamics simulation, the atoms in the Newton layer participate in the analysis of the mechanical mechanism. The constant temperature layer is responsible for transmitting internal energy. The fixed layer is responsible for fixing the boundary, so that the molecular dynamics simulation is carried out smoothly. The molecular dynamics model of the [111] crystal orientation is 213.35 Å × 177.37 Å × 99.57 Å, with a total of 178,200 atoms.
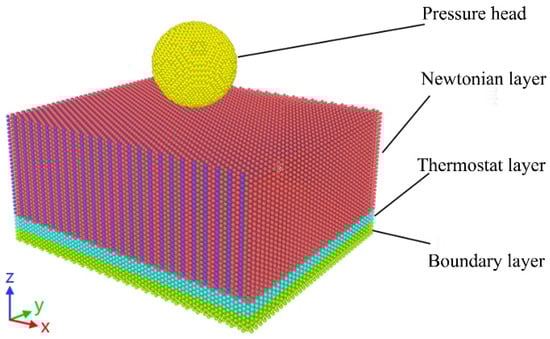
Figure 4.
Nanoindentation model diagram.
In order to study the mechanical properties of the Mg-Li alloy under nanoindentation and the evolution mechanism under load, this chapter established a molecular dynamics simulation using a diamond spherical indenter to apply the load to Mg-Li, as shown in Figure 3. In the molecular dynamics model, in order to prevent interaction between the diamond and the workpiece during the relaxation and energy-minimization process, the distance between the diamond indenter and the Mg-Li workpiece is 5 Å, and the diamond indenter is located at the upper end of the workpiece center. In the simulation, the diamond indenter is set as a rigid body.
The potential functions used in this paper are MEAM and Lennard–Jones potential functions [28]. The MEAM potential function considers the interaction force between Mg-Li atoms. The Lennard–Jones potential function considers the interaction forces between C-C, C-Mg and Mg-Li. Set the time step to 1 fs. The periodic boundary conditions are used in the X and Y directions of the model, and the fixed boundary conditions are used in the Z direction (Table 1). The first is the energy-minimization and relaxation process, which aims to eliminate the stress inside the model and reasonably optimize the internal bad structure, and reduce the influence of unreasonable stress and structure on molecular dynamics simulation. Firstly, the conjugate gradient method is used to minimize the energy of the Mg-Li workpiece, and then the Mg-Li workpiece is set under the NVT ensemble for relaxation simulation, and the relaxation time is 20 ps. After the relaxation, the internal stress of the model system is eliminated, and the internal structure is reasonable without disintegration. After the relaxation, the next stage is the nanoindentation stage. In this paper, the vertical pressing speed of the diamond indenter along the Z direction is set to 50 m/s. In order to explore the influence of different pressing depths on hardness and Young’s modulus, three different pressing depths were set in this paper: 20 Å, 25 Å and 30 Å. After the diamond indenter reaches the lowest depth, there are two simulation cases of unloading and retention-unloading (stress relaxation). In the case of loading–unloading, the rate of unloading and lifting is set to 50 m/s after the diamond indenter reaches the lowest depth and then lifts to the initial position. In the case of stress relaxation, the diamond indenter is in the loading–holding–unloading situation. The indenter is maintained for 10 ps after reaching the lowest point, and then unloaded and lifted to the initial position at a rate of 50 m/s.

Table 1.
Single crystal Mg-Li nanoindentation simulation conditions and parameters.
3. Simulation Result and Analysis
3.1. Surface Accumulation Analysis
After the nanoindentation simulation loading, the surface morphology of the material changed intuitively. The change of the morphology of the material surface reflects the mechanical properties of the material surface during the loading process. In order to study the surface deformation of single crystal Mg-Li under external force loading, this section analyzes six groups of surface topography after loading with different crystal orientations and depths, as shown in Figure 5.
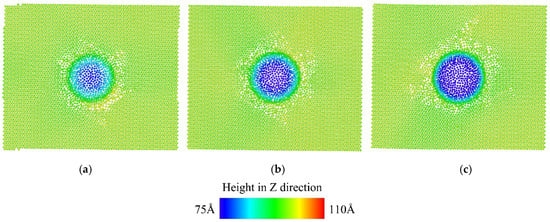
Figure 5.
Distribution of atomic height on the surface of single crystal Mg-Li after nanoindentation simulation (along the Z direction). (a) [111] crystal orientation indentation depth 20 Å; (b) [111] crystal orientation indentation depth 25 Å; (c) [111] crystal orientation indentation depth 30 Å.
In order to observe the surface morphology of the material more intuitively, the diamond indenter atoms and other atoms except the surface in the model are deleted in the above figure, and only the Mg-Li surface atoms are retained. The color change shows the different heights of the surface atoms along the Z direction. From blue to red, the height is 75 Å to 110 Å. From analysis of the figure, it can be seen that the voids of the workpiece with [111] crystal orientation gradually increase during the loading process. With the increase in the pressing depth, the depth of the cavity gradually increases, which aggravates the interaction of atoms inside the material, and it is speculated that dislocation and slip phenomena are generated inside the material. From the diagram, it can be seen that the surface atom height around the hole is low, so it can be seen that the surface atom accumulation is less. It can be inferred that the surface force of the [111] crystal direction is small, and it is not easy to produce atom accumulation on the surface. The material is more inclined to produce dislocation, slip and deformation inside the workpiece. As shown in Figure 5b, when the pressing depth reaches 20 Å, annular bulges have initially appeared on the surface of the workpiece, which are distributed around the cavity. When the depth reaches 30 Å, the annular bulge is more obvious and has a tendency to expand outward, and the annular bulge is evenly distributed around the cavity [29]. It can be analyzed and speculated that the material tends to have atomic accumulation on the surface to eliminate internal stress, and the surface is a non-indentation area surrounded by voids. By longitudinal observation and comparison of the workpiece materials of the two crystal orientations, it can be obtained that the atomic accumulation height on the surface of the [111] crystal-orientation workpiece is significantly higher, and the annular atomic accumulation on the surface of the workpiece increases significantly with the increase in the pressure depth.
3.2. Atomic Displacement Vector Analysis
In order to further study the surface accumulation and the internal atomic motion trajectory, the following content studies the atomic displacement vector during the nanoindentation process, as shown in Figure 6.
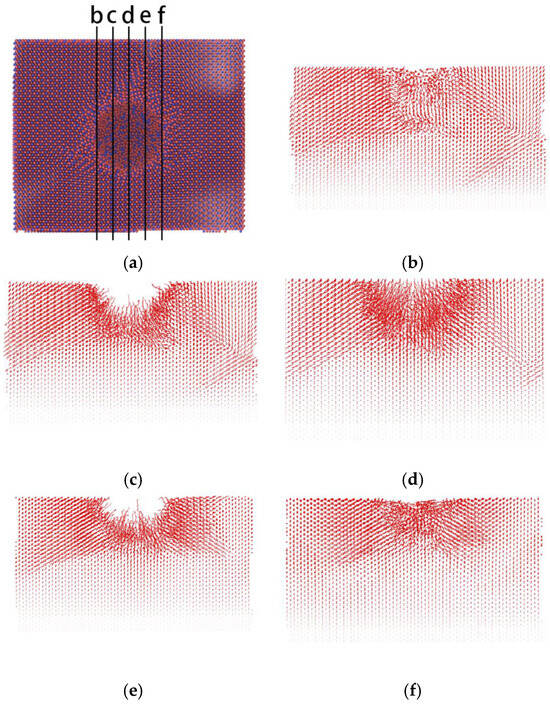
Figure 6.
[111] atomic displacement vector distribution of crystal orientation. (a) Workpiece XY surface overlooking (b) X coordinate 30 Å, (c) X coordinate 15 Å, (d) X coordinates 0 Å, (e) X coordinates 15 Å, (f) X coordinates 30 Å.
Figure 6a shows the surface morphology of the single crystal Mg-Li material with a [111] crystal orientation depth of 30 Å. For convenience of observation, the diamond indenter atoms in the figure have been deleted. In order to better study the atomic motion trajectory on the surface and inside the material, this section selects the X coordinate of the d section as 0, the X coordinate of the c section as −15 Å, the X coordinate of the b section as −30 Å, the X coordinate of the e section as 15 Å, and the X coordinate of the f section as 30 Å. Then, the atomic displacement vector analysis of the above five sections is carried out by the Generate Trajectory Lines function of OVITO. The vector in the figure represents the displacement trajectory from the initial position of the atom to the final position at the end of loading. By analyzing Figure 6d, it can be seen that when the section is located directly below the center of mass of the indenter, the trajectory of the atom covered by the indentation moves radially to the lower left, lower and lower right along the center of the upper surface of the workpiece. Other non-indentation atoms are squeezed by the indentation atoms and move along the lower left and lower right, respectively. From Figure 6c,e, it can be seen that in addition to moving to the lower left and lower right, the atoms at the indentation also have a tendency to move in a direction with a certain angle to the cross section. From Figure 6b,f, it can be seen that the atoms at the edge of the indentation receive less squeezing effect, and the atomic trajectory is the shortest and moves along the lower left and lower right. This is the same as the movement trend of the atoms in the other three sections. It can be seen that the atoms tend to move to the lower left and lower right under the external force. Comparing the five sections in the figure, since the d section is located in the middle of the indentation, the displacement vector is longer and denser, and it has a greater force and slip effect on the atoms in the non-indentation area inside the material.
3.3. Load–Displacement Curve Analysis of Single Crystal Mg-Li Model
3.3.1. Load–Displacement Curve Analysis
In the process of nanoindentation simulation, the load–displacement curve of the material is an important analysis method to reveal the mechanical properties and internal deformation of the material. For convenience of observation, the value of the negative force of the diamond indenter along the Z-axis is set to be positive. In this section, the load–displacement data of Mg-Li materials were collected from different indentation depths and crystal orientations (sampling once every 200 steps of simulation, step size 1 fs), as shown in Figure 7 below.
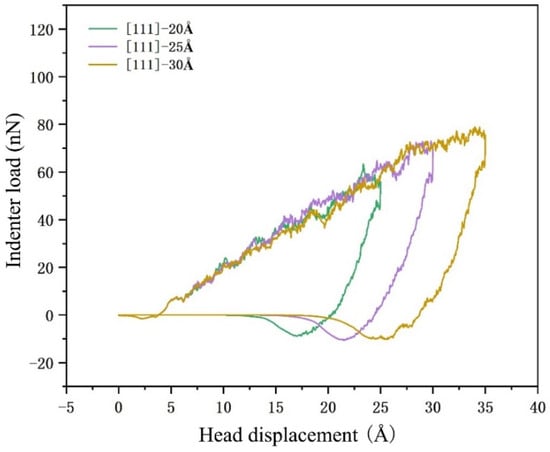
Figure 7.
Load–displacement curve analysis.
As shown in Figure 7, the color line segments in the figure represent the indenter load–displacement curves under different crystal orientations and different indentation depths. The crystal orientation and indentation depth are shown in the legend. In the indenter loading stage, with the increase in displacement, the indenter load shows a fluctuating exponential rise state, and the workpiece produces elastic deformation. This is because, in the process of elastic deformation, with the increase in displacement, the contact area between the indenter surface and the workpiece increases, and the resistance also increases. However, due to the constant loading speed, it shows a large slope upward trend. In the indenter unloading stage, due to the elastic recovery ability of the workpiece, there is still an interaction force between the workpiece and the indenter. After a short distance of displacement, the indenter load is reduced to a negative value and finally tends to 0. The indentation depth is not 0, which is due to the plastic deformation inside the workpiece and the atomic accumulation on the surface of the workpiece after the loading–unloading process. At the end of the unloading stage, the indenter load is negative, which is due to the interaction force between the lower end of the indenter and the surface atoms on the Mg-Li model under the action of the short distance force field. However, with the increase in the distance between the C atom and the Mg-Li atom, the value of this interaction force gradually decreases to 0. With the increase in the indentation depth, the residual indentation depth also increases, showing a trend consistent with the experiment, indicating that the plastic deformation in the material is more severe. The same is true for [111] crystal orientation. This is because the simulation calculation is based on the same model (two crystal orientations and two models) after energy minimization and relaxation, so it shows similar crystal structure mechanical properties. The initial curve fitting slope of the loading stage can reflect the ability of the material to resist deformation. In the later stage of the loading stage, the difference in the maximum indenter load reflects the ability of the material to resist the load.
3.3.2. CSP Defect Analysis
The main reason for the change of surface and internal morphology of the material is the change of defect structure inside the material. When the load is applied to the surface of the material, evolution of the defect structure inside the material occurs. In order to explore the influence of the pressure depth on the deformation mechanism of the structural defects of the material, this section selects the defect structure of the [111] crystal-oriented Mg-Li material at different pressure depths and different times, as shown in Figure 8.
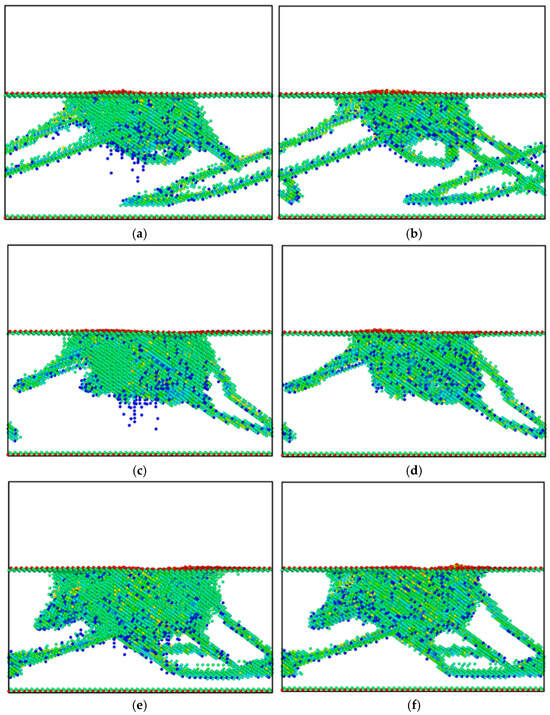
Figure 8.
[111] CSP defect analysis of Mg-Li material under the crystal orientation; (a) 20 Å loading time; (b) 20 Å unloading time; (c) 25 Å loading time; (d) depth 25 Å unloading time; (e) depth 30 Å loading time; (f) depth 30 Å unloading time.
Figure 8 is the CSP defect-analysis diagram of Mg-Li material with [111] crystal orientation. Figure 8 shows the structural defect maps after loading and unloading at 20 Å, 25 Å and 30 Å, respectively. In the figure, the value of CSP less than 1 (C atom and lattice without phase transition) is deleted, and only defects are shown. The black box is the boundary of the model box. Obviously, most of the green defects shown in the figure have a CSP value of 10. According to the same loading form of different pressure depths in the longitudinal observation diagram, it can be seen that the defect structure of the material shows a horizontal and vertical downward expansion trend with the gradual increase in the pressure depth, whether at the time of loading or unloading. The cluster-defect structure at the center of the indentation gradually increases with the increase in the indentation depth. The dislocation loop caused by the defects in the central indentation area diffuses to the lower left and lower right until the left and right boundaries of the simulation box. This is because under the action of load, the dislocation and slip of the crystal structure can effectively release the internal stress. Defect structures including, but not limited to, dislocation loops, nucleation, stacking faults and vacancy defects are shown in the diagram. At different times of the same depth in the transverse observation diagram, after unloading, the cluster defect structure in the central area of the indentation obviously shows a shrinkage trend, and the defect area shown in the figure also decreases. This is because the material will produce two kinds of deformation behavior under the action of load, and retain the permanent defects caused by plastic deformation. After the elastic deformation recovery, the dislocation of the material will move and then disappear under the interaction force of the surrounding atoms, and finally the CSP value of the original sample will be restored to 0. By observing the ring defects generated in the non-indentation area, it can be seen that the ring dislocations did not change greatly after unloading and after loading. This is because the dislocation ring is plastically deformed after being generated inside the material and does not annihilate with the disappearance of the load.
3.3.3. DXA Defect Analysis
In this paper, the dislocation-extraction algorithm is used to extract and analyze the defect types such as dislocation line defects, Burgers vectors and dislocation nodes in Mg-Li crystal, as shown in Figure 9. Figure 9b–l shows the dislocation analysis diagram for the b–l point in Figure 9a.
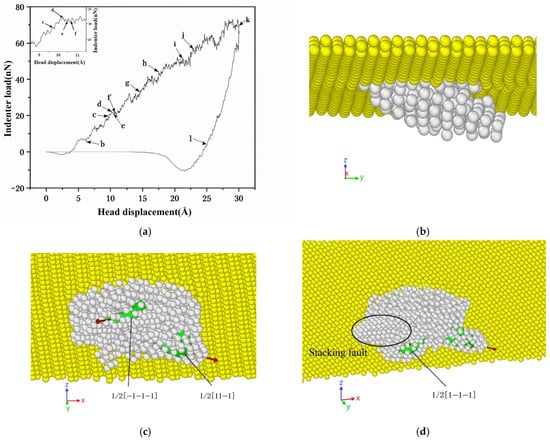
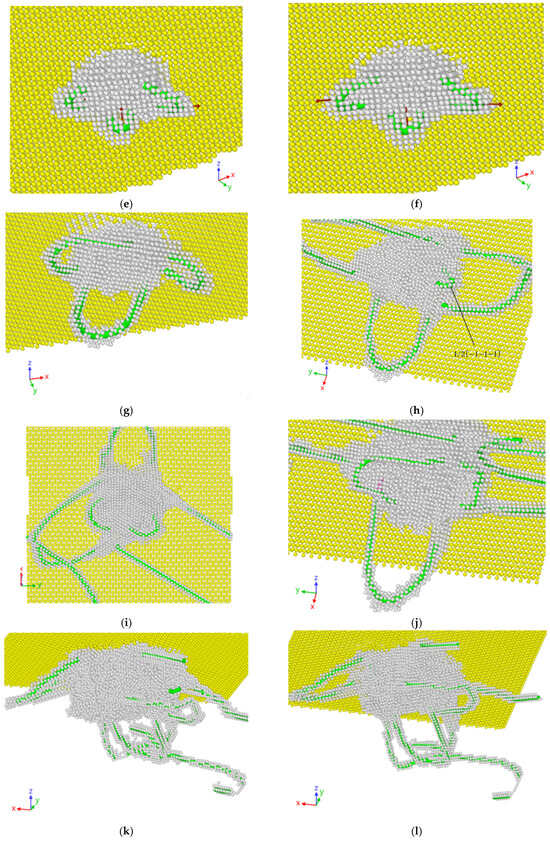
Figure 9.
[111] crystalline indenter load–indenter displacement curve and different displacement DXA defect maps. (a) Load–displacement curve; (b) depth 6.2 Å; (c) depth 9.7 Å; (d) depth 10.3 Å; (e) pressure depth 10.5 Å; (f) pressure depth 10.7 Å; (g) pressure depth 14.6 Å; (h) pressure depth 17.5 Å; (i) indentation depth 21.2 Å; (j) indentation depth 23 Å; (k) indentation depth 30 Å; (l) indentation depth 25 Å.
Figure 9a is the indenter load–displacement curve of the [111]-oriented Mg-Li model with a pressure depth of 25 Å calculated by molecular dynamics simulation, in which the local map is enlarged and placed in the upper left corner. Figure 9b–l correspond to the DXA analysis of the internal defect structure of the material at each point in Figure 9a. In order to facilitate observation, this section flexibly selects the observation angle (the coordinate system is given in Figure 9), and the normal body-centered cubic lattice type Mg-Li atoms and diamond C atoms are eliminated in Figure 9; only the defect structure and the surface atoms on the model are retained. Green and red stripes are dislocation lines. As shown in Figure 9b, under the action of the initial indenter load, the atoms directly below the indenter have been separated from the lattice, and the body-centered cubic lattice has begun to change to the non-lattice type and to plastically deform. In Figure 9c, when the indenter displacement is 9.7 Å, full dislocations with Burgers vectors of 1/2 [−1−1−1] and 1/2 [11−1] appear below the indentation, which belong to the {111} crystal plane family and begin to move along the (−1−11) and (111) crystal planes, respectively. Due to the emergence of dislocations, the internal stress is released, so the indenter load begins to drop suddenly. As the indenter displacement increases, the dislocation continues to move along its slip plane. Surface defects of stacking faults are formed during the movement of full dislocations with Burgers vectors of 1/2 [−1−1−1] and 1/2 [11−1]. Figure 9d produces a new full dislocation nucleation with a Burgers vector of 1/2 [1−1−1] and moves along the (−1−11) crystal plane. Each of the three dislocation loops contains an intrinsic stacking fault, forming an extended dislocation. Similarly, the formation of dislocations in order to release the internal stress, in the load–displacement curve showed a significant decrease in the indenter load. In Figure 9e, the ‘U-shaped’ dislocation loops of three kinds of Burgers vectors begin to form and gradually expand. As shown in Figure 9f, after a period of development, the area of the included intrinsic stacking faults and extended dislocations gradually increases. The length of dislocation line also increases with the increase in indenter displacement. As shown in Figure 9g, as the indenter continues to load downward, the dislocations of the three different Burgers vectors continue to move in their slip directions (emitting dislocations) and grow into larger ‘U-shaped’ dislocation loops in the vicinity. The atoms in the region where the dislocation passes are restored to the body-centered cubic lattice type. It can be seen from Figure 9h that a new full dislocation with a Burgers vector of 1/2 [−1−1−1] appears below the indentation and moves along the (−1−11) crystal plane. The generation of new dislocations also makes the load–displacement curve decrease. It can be seen from Figure 9i that when the displacement reaches 21.2 Å, a full dislocation with a Burgers vector of 1/2 [−1−1−1] also appears, and the dislocation continues to move around along the indentation center. The plastic deformation volume caused by the loading of the indenter in the material gradually increases. It can be seen from Figure 9k that when the indenter reaches the maximum indentation depth, the plastic deformation and the indenter load reach the maximum, and the total dislocation length also reaches the maximum. By comparing Figure 9k,l, it can be seen that during the unloading process, due to the elastic deformation-recovery function of the material, the load curve does not return to zero instantaneously, but gradually returns to zero at a certain slope. The partial dislocations are also annihilated with the disappearance of the load, and the partial deformation of the material is restored, eventually leaving permanent plastic deformation and internal dislocations. The research is similar to the trend in the literature [30]. Due to the easy slip characteristics of dislocations in the body-centered cubic lattice, it is still easy to produce larger defect structures such as dislocation loops when subjected to load again.
In order to explore the stress change inside the material and its influence mechanism on the defect structure, this section analyzes the von Mises equivalent stress of the molecular dynamics nanoindentation process of the Mg-Li material [111] crystal-orientation model.
3.3.4. Stress Analysis
In this section, the von Mises equivalent stress analysis of the molecular dynamics nanoindentation process of the Mg-Li material [111] crystal-orientation model is carried out. The equivalent stress formula of the paradigm is as in Equation (8):
Since the six output stress components (, , , , , ) in the Lammps own command contain the atomic volume, the volume needs to be removed in subsequent data processing to obtain more accurate stress data [31]. The cut-off distance of the atomic sphere space is 9 Å. The cloud diagram obtained by using the paradigm equivalent stress formula is shown in Figure 10.
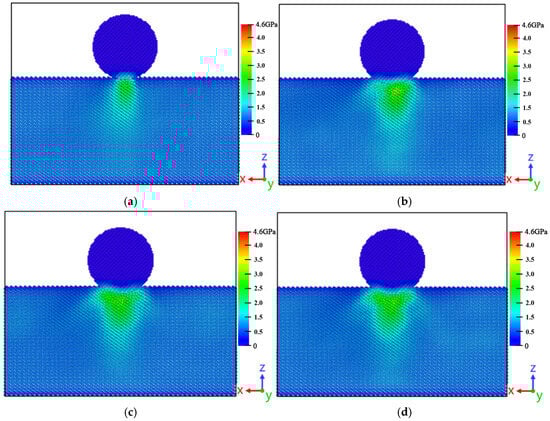
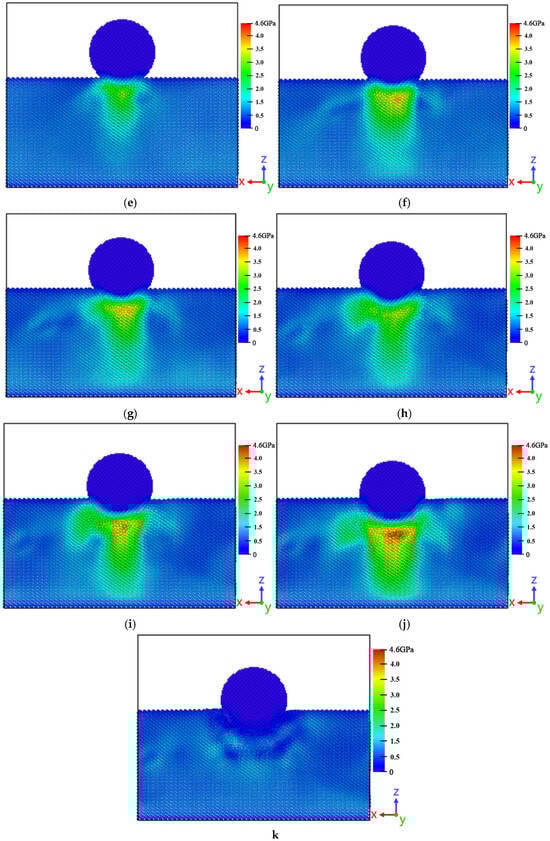
Figure 10.
Different displacement stress-analysis diagram; (a) depth 6.2 Å; (b) depth 9.7 Å; (c) depth 10.3 Å; (d) depth 10.5 Å; (e) depth 10.7 Å; (f) depth 14.6 Å; (g) depth 17.5 Å; (h) depth 21.2 Å; (i) depth 23 Å; (j) depth 30 Å; (k) depth 25 Å.
The cloud diagram shown in Figure 10 is the model stress-analysis diagram of each sampling point, Figure 10a–k, which corresponds to points b to l in the ballast–displacement curve in turn, a total of ten points and ten diagrams. Figure 10 shows the stress cloud diagram of the middle slice of the y-axis of the model. The diamond spherical indenter is retained in the figure to facilitate the intuitive observation of the indenter displacement. The color area is the stress distribution. It can be seen from Figure 10a that in the early stage of the pressing process, stress was generated in the area directly below the diamond indenter. In Figure 10b, the stress expands along the horizontal direction, so that the larger area below the indenter begins to undergo dislocation reaction under the influence of stress, resulting in full dislocations with Burgers vectors of 1/2 [−1−1−1] and 1/2 [11−1]. The generation of full dislocations effectively alleviates the expansion of stress. Comparing Figure 10c–e, due to the increase in displacement, the color of the stress area is deepened and the range is expanded. The area other than the projection of the indenter on the material is also affected by the stress. The color changes from dark blue to blue, and the shape of the stress area is ‘inverted T’. In Figure 10f, when the displacement of the indenter is 14.6 Å, a high-stress area appears under the indenter, which is shown as red and yellow areas in the stress cloud diagram. The ‘inverted T’-shaped stress region changes to a rectangular region. The bottom of the stress area begins to expand to the bottom of the model. A stress ring is also generated around the stress region, and the corresponding defect analysis is dislocation emission. The stress ring in Figure 10g expands to the left and right sides, respectively, and the dislocation emission length increases, which relieves the internal stress and relieves the stress to a certain extent. The high-stress area shrinks, and the corresponding ballast–displacement curve decreases. In Figure 10h, the high-stress region continues to shrink, the area of the medium-stress region increases and expands to the left, the stress ring continues to expand to the left and the length of the dislocation ring continues to increase. In Figure 10i, a high-stress area appears in the area directly below the indenter, which is due to the generation and interleaving of multiple dislocations hindering the release of stress. In the load–displacement curve, it shows a sudden increase. Figure 10j shows that when the indenter displacement reaches a maximum of 30 Å, almost half of the diamond indenter is submerged into the material, and the high-stress area directly below the diamond indenter continues to expand into an inverted triangle. The stress reaches a maximum of 4.6 GPa, and the green medium-stress area presents an ‘inverted T’-shaped cylinder at the projection position of the indenter. As shown in Figure 10k, when the indenter unloads the distance of 5 Å, the high stress and medium stress in the original area dissipate. Due to the elastic deformation characteristics of the material, the existence of dislocations and defects makes it retain some residual stress.
3.4. Stress-Relaxation-Simulation Analysis of Single Crystal Mg-Li Model
3.4.1. Load–Displacement Curve Analysis
It plays an important role in simulation calculation and experimental analysis of mechanical properties of materials. The stress-relaxation stage will cause changes in stress, dislocation defects, slip and mechanical properties inside the material. Therefore, it is important to explore the evolution of mechanical properties and defect changes in Mg-Li alloy materials under stress relaxation. Based on the above simulation calculation, this section adds a ballast-holding stage between loading and unloading, and the holding time is 10 ps (10,000 time steps). According to the stress-relaxation characteristics of the material, the load–displacement diagram of the indenter is shown in Figure 11.
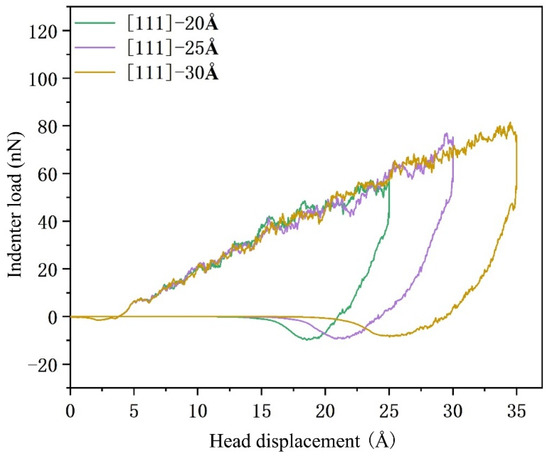
Figure 11.
Load–displacement curves of stress-relaxation characteristics under different crystal orientations and different pressure depths.
Figure 11 is the load–displacement curve of stress-relaxation characteristics of Mg-Li material under different crystal orientations and different pressure depths. It can be seen from the figure that under the same crystal orientation, the first half of the curve is basically fitted, which is due to the use of the same molecular dynamics model for different pressure depth test results. By comparing the non-stress-relaxation load-displacement curve, it can be concluded that the trend of stress relaxation and non-stress relaxation is consistent when the indenter is loaded. In the indenter load-holding stage, the spatial position of the indenter remains stable. Due to the alternation of stress generation and annihilation in the material, and the stress release dominating, the indenter load gradually decreases and finally drops to zero. The negative value of the indenter load in the curve is caused by the interaction force between the C atom and the Mg-Li atom at a close distance. As the distance between the indenter and the material increases, it eventually returns to zero. From the data in the figure, the hardness and Young’s modulus of the material after stress relaxation can be calculated.
3.4.2. DXA Defect Analysis
In order to study the mechanical properties and defects of Mg-Li alloy materials under stress-relaxation conditions, this section selects two time points before the start of stress relaxation and after the end of stress relaxation for analysis, using the DXA dislocation-analysis method and paradigm equivalent stress-analysis method.
Figure 12 is the DXA dislocation-analysis diagram of the [111] crystal-orientation model before and after stress relaxation. In the figure, C atoms and normal BCC lattice-type atoms are deleted to facilitate observation of changes. The non-lattice type (white) and dislocation (green) are retained, and the coordinate system in the view reference map is observed. Under different pressure depths, there are great changes in the dislocation diagram before and after stress relaxation. When the pressure depth is 20 Å, it can be found that the two ring dislocations on the right side continue to move to the right after stress relaxation, and the amorphous structure directly below the indenter continues to expand downward. The region changes to the normal BCC lattice, and the defect region has a significant expansion trend after stress relaxation. This is because when the indenter remains stable [32], the contact part of the indenter and the material continues to receive the stress given by the indenter, forcing the dislocations inside the material to continue along the original motion direction. At the same time, more dislocations will be generated, resulting in increased plastic deformation inside the material.
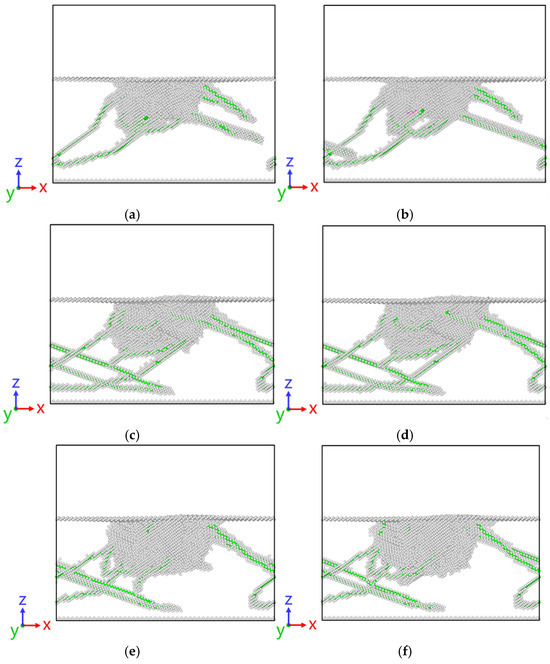
Figure 12.
[111] DXA dislocation analysis of crystal-orientation model before and after stress relaxation at different depths; (a) 20 before stress relaxation; (b) 20 after stress relaxation; (c) 25 before stress relaxation; (d) 20 after stress relaxation; (e) 30 before stress relaxation; (f) 30 after stress relaxation.
3.4.3. Stress Analysis
Figure 13 is the equivalent stress-change cloud diagram of the Mg-Li material [111] crystal orientation before and after stress relaxation under different pressure depths.
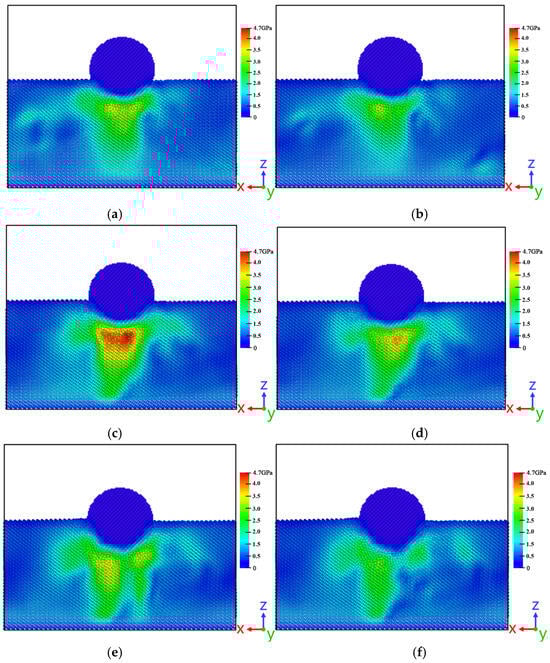
Figure 13.
[111] cloud diagram of equivalent stress change before and after stress relaxation under different pressing depths in crystal orientation; (a) 20 before stress relaxation; (b) 20 after stress relaxation; (c) 25 before stress relaxation; (d) 20 after stress relaxation; (e) 30 before stress relaxation; (f) 30 after stress relaxation.
In order to facilitate observation, the diamond indenter is retained in the figure, and the slice observation is performed with the midpoint distance of the Y axis. The observation angle refers to the coordinate system in the figure. The stress is distributed in a ‘T’ shape below the indenter. Observing the stress cloud diagram at different times of the same indentation depth, it can be concluded that after the model undergoes stress relaxation, the area and number of high-stress areas in the figure are significantly reduced. This is due to the fact that in the indenter load-maintenance stage, the atomic movement continues, and defects such as dislocations are continuously moving and slipping, releasing the internal stress of the model, so that the internal stress is redistributed and the stress is reduced. When the displacement is at 25 Å, the trend of stress reduction is more significant, and the stress area also shrinks inward. Combined with the DXA dislocation-analysis diagram, it can be seen that the emergence of new dislocation loops and stacking faults effectively reduces the stress in the corresponding region, indicating that the generation of dislocations causes the corresponding stress to decrease. It also promotes the atoms in the contact part of the indenter to move to the surface of the material [33], so that the density of atoms below the indenter decreases, and the stress in the corresponding contact area also decreases significantly.
4. Conclusions
In this chapter, the molecular dynamics calculation nanoindentation simulation of single crystal Mg-Li is carried out, and the surface morphology, load–displacement, dislocation defects, stress conditions and stress-relaxation characteristics are analyzed. The following conclusions are obtained:
(1) The accumulation of cyclic atoms on the surface of the [111]-oriented workpiece increases significantly with the increase in the pressure depth. The surface force of [111] crystal-orientation is small, and it is not easy to produce atomic accumulation on the surface. The material is more inclined to produce dislocation, slip and deformation inside the workpiece.
(2) The cluster defect structure of the [111] crystal-orientation model at the center of the indentation gradually increases with the increase in the indentation depth. The dislocation loop caused by the defects in the central indentation area diffuses to the lower left and lower right until the left and right boundaries of the simulation box. With the increase in pressing depth, some defects such as full dislocations belonging to the {111} crystal plane family with Burgers vectors of 1/2 [−1−1−1] and 1/2 [11−1] appear continuously, releasing internal stress.
(3) When the displacement of the indenter is 14.6 Å, a high-stress area appears below the indenter. The generation of dislocation loops relieves the internal stress and the stress in the region decreases.
(4) The ring dislocation of the [111] crystal-orientation model continues to move, and the amorphous structure directly below the indenter expands downward. The defect area has a significant tendency to expand after stress relaxation, resulting in an increase in plastic deformation inside the material. At the same time, the stress inside the model is released.
Author Contributions
C.X. designed and performed the manuscript, Y.L. analyzed the data, and drafted the manuscript. J.L. and F.Y. analyzed the data and supervised this study. A.L. and D.L. conceived the project, and Z.Z. organized the paper and edited the manuscript. All authors have read and agreed to the published version of the manuscript.
Funding
This research was funded by the science and technology development plan project of Jilin Province No. 20220201036GX and Changchun Guanghua University Project Aeronautical nozzle flow Field Coupling Machining Technology and process HX2024011.
Institutional Review Board Statement
Not applicable.
Informed Consent Statement
Not applicable.
Data Availability Statement
Data are contained within this article.
Conflicts of Interest
Author Feng Yan was employed by the company Fushun Mechanical Equipment Manufacturing Co., Ltd. The remaining authors declare that the research was conducted in the absence of any commercial or financial relationships that could be construed as a potential conflict of interest.
References
- Aval, H.J. Impressive effect of li microalloying and severe plastic deformation of Al-Cu-Mg Alloy on strength and corrosion resistance. Arab. J. Sci. Eng. 2023, 48, 12485–12497. [Google Scholar] [CrossRef]
- Bednarczyk, I. Characteristics of the microstructure and properties of mg-li magnesium alloy after deformation by the kobo method. Arch. Metall. Mater. 2022, 67, 1179–1184. [Google Scholar] [CrossRef]
- Bhat, K.; Schlotterose, L.; Hanke, L.; Helmholz, H.; Quandt, E.; Hattermann, K.; Willumeit-Römer, R. Magnesium-lithium thin films for neurological applications—An in vitro investigation of glial cytocoMPatibility and neuroinflammatory response. Acta Biomater. 2024, 265, 113754. [Google Scholar] [CrossRef]
- Eunji, S.; Taheri, A.M.; Amit, M. Investigation of grain size and geometrically necessary dislocation density dependence of flow stress in Mg-4Al by using nanoindentation. Acta Mater. 2024, 265, 119633. [Google Scholar]
- Custodio, A.G.; Lindquist, K.J.; Tolentino, M.; Aranas, C.; Saha, G.C. Investigating the nanoscale hardness/strength properties of high-entropy alloy particles using the nanoindentation technique. J. Alloys Metall. Syst. 2023, 4, 100043. [Google Scholar] [CrossRef]
- Wu, J.H.; Choi, J.; Uba, S.A.; Soper, S.A.; Park, S. Engineering inlet structures to enhance DNA capture into nanochannels in a polymer nanofluidic device produced via nanoimprint lithography. Micro Nano Eng. 2023, 21, 113256. [Google Scholar] [CrossRef]
- Wang, J.F.; Dziadkowiec, J.; Liu, Y.K.; Jiang, W.M.; Zheng, Y.J.; Xiong, Y.Q.; Peng, P.A.; Renard, F. Combining atomic force microscopy and nanoindentation helps characterizing in-situ mechanical properties of organic matter in shale. Int. J. Coal Geol. 2024, 281, 104406. [Google Scholar] [CrossRef]
- Li, Q.; Wang, J.S.; Kang, Y.L.; Li, Y.L.; Qin, Q.H.; Wang, Z.L.; Zhong, X.H. Multi-scale experimental studies on mechanical properties of three-dimensional porous graphene cementitious composite. Cem. Concr. Compos. 2024, 147, 105412. [Google Scholar]
- Cao, F.R.; Zhou, B.J.; Ding, X.; Zhang, J.; Xu, G.M. Mechanical properties and microstructural evolution in a superlight Mg-7.28Li-2.19Al-0.091Y alloy fabricated by rolling. J. Alloys Compd. 2018, 745, 436–445. [Google Scholar]
- Zheng, H.P.; Fei, P.F.; Wu, R.Z.; Hou, L.G.; Zhang, M.L. Microstructure and hardness of Mg–9Li–6Al– x La (x = 0, 2, 5) alloys during solid solution treatment. Mater. Sci. Eng. A 2015, 625, 169–176. [Google Scholar]
- Li, Z.J.; Kuang, Q.; Dong, X.L.; Yuan, T.W.; Ren, Q.H.; Wang, X.X.; Wang, J.; Jing, X.Y. Characteristics of high-performance anti-corrosion/anti-wear ceramic coatings on magnesium-lithium alloy by plasma electrolytic oxidation surface engineering. Surf. Coat. Technol. 2019, 375, 600–607. [Google Scholar] [CrossRef]
- Jiang, L.Y.; Jiang, W.; Guo, F.; Huang, W.J.; Dong, H.P.; Hu, H.J.; Dai, Q.W. Micro-nano structure characteristics and texture evolution of the friction stir processed dual-phase Mg-Li alloy. Mater. Charact. 2021, 173, 110979. [Google Scholar] [CrossRef]
- Mahata, A.; Sikdar, K. Molecular dynamics simulation of nanometer scale mechanical properties of hexagonal Mg-Li alloy. J. Magnes. Alloys 2016, 4, 36–43. [Google Scholar] [CrossRef]
- Liu, P.; Zhao, Y.; Baisheng, N.; Liu, X.; Deng, B.; He, H.; Cao, M. Probing nano-mechanical behavior of coal using nanoindentation tests. J. China Coal Society 2023, 936, 1–17. [Google Scholar]
- Li, L.; Wei, H.; Song, D.; Huang, S.Y.; Xie, L.Z.; Chen, Z.W. Mesoscale elastic-plastic constitutive relationship of Fe-32Ni super-invar alloy based on nanoindentation inverse analysis. J. Plast. Eng. 2024, 31, 129–136. [Google Scholar]
- Luo, J.; Li, N.; Wang, X.; Liu, C.K. Research Progress of Nanoindentation Methods for Measuring Residual Stress in Critical Materials of Aero-engine. Mater. Rev. 2023, 21, 1–33. [Google Scholar]
- Zhang, Q.S.; Liu, Z.B.; Tang, Y.S.; Deng, Y.F.; Luo, T.Y.; Wang, Y.T. Mechanical property characterization of mudstone based on nanoindentation technique combined with upscaling method. Environ. Earth Sci. 2023, 82, 485. [Google Scholar] [CrossRef]
- Huang, T.J.; Niverty, S.; Sundar, A.; Chawla, N. Microstructural characterization and mechanical behavior of Aba Panu meteorite by correlative microscopy and nanoindentation. Mater. Charact. 2023, 205, 132616. [Google Scholar] [CrossRef]
- Teixeira, E.D.; Rossignolo, J.A.; Ferreira, T.I.B.; Medeiros, C.M.D.; Barbosa, N.P. Study of the transition zone of concretes prepared with metakaolin using sem/eds-associated nanoindentation technique. Constr. Build. Mater. 2024, 412, 134717. [Google Scholar] [CrossRef]
- Wang, Y.Q.; Zhou, Z.Y.; Zhou, W.Z.; Xu, L.Q.; Guo, J.; Lan, Z.Q. Effects of in-situ formed Mg 2 Si phase on the hydrogen storage properties of MgLi solid solution alloys. Mater. Des. 2016, 111, 248–252. [Google Scholar] [CrossRef]
- Wu, T.; Blawert, C.; Lu, X.P.; Serdechnova, M.; Zheludkevich, M.L. Difference in formation of plasma electrolytic oxidation coatings on MgLi alloy in coMParison with pure Mg. J. Magnes. Alloys 2021, 9, 1725–1740. [Google Scholar] [CrossRef]
- Song, W.J.; Liu, J.; He, S.; Shen, J.H.; Yang, G.; Liu, Y.H.; Chen, Y.X.; Wei, Q.M. Microstructure and mechanical properties of as-cast ultralight and high strength Mg-10Li-3Al-3Zn-xY alloy with multi-precipitates. Mater. Charact. 2022, 189, 111972. [Google Scholar] [CrossRef]
- Man, J.L.; Wu, B.L.; Duan, G.S.; Zhang, L.; Wan, G.; Zhang, L.; Zou, N.F.; Liu, Y.D. The synergistic addition of Al, Ti, Mo and W to strengthen the equimolar CoCrFeNi high-entropy alloy via thermal-mechanical processing. J. Alloys Compd. 2022, 902, 163774. [Google Scholar] [CrossRef]
- Liu, H.R.; Jiang, B.L.; Li, H.T. Mechanical properties of TiN films prepared in glow-arc transition region. Surf. Eng. 2021, 37, 154–159. [Google Scholar] [CrossRef]
- News of Science. Nanoindentation of Zrh2 by Molecular Dynamics Simulation; Reports from University of Florida Advance Knowledge in Nanoindentation: Gainesville, FL, USA, 2020; p. 1654. [Google Scholar]
- Le, N.C.; Phong, T.D.; Tien, T.V.N. Optimal Design of a Dragonfly-Inspired Compliant Joint for Camera Positioning System of Nanoindentation Tester Based on a Hybrid Integration of Jaya-ANFIS. Math. Probl. Eng. 2018, 2018, 8546095. [Google Scholar]
- Lei, M.; Dang, F.N.; Xue, H.B.; Zhang, Y.; He, M.M. Study on Mechanical Properties of Granite Minerals Based on Nanoindentation Test Technology. Therm. Sci. 2021, 25, 4457–4463. [Google Scholar] [CrossRef]
- Li, Y.C.; Kang, Z.W.; Zhang, X.K.; Pan, J.S.; Ren, Y.; Zhou, G.S. Fabricating an anti-corrosion carbonate coating on Mg-Li alloy by low-temperature plasma. Surf. Coat. Technol. 2022, 439, 2111. [Google Scholar] [CrossRef]
- Rezaei, M.; Aval, H.J. Effect of Cu/Mg Ratio on Microstructure and Corrosion Resistance of Al-Cu-Mg-Li cast Alloy During Non-Isothermal Aging. Met. Mater. Int. 2023, 29, 1907–1922. [Google Scholar] [CrossRef]
- Moudir, D.; Souag, R.; Kamel, N.; Aouchiche, F.; Mouheb, Y.; Kamariz, S. Microwave chemical durability of an iron-rich glass-ceramic dedicated for high-level radioactive waste. Mater. Res. Express 2023, 10, 065503. [Google Scholar] [CrossRef]
- Jeong, H.T.; Kim, W.J. Critical review of superplastic magnesium alloys with emphasis on tensile elongation behavior and deformation mechanisms. J. Magnes. Alloys 2022, 10, 1133–1153. [Google Scholar] [CrossRef]
- Hanke, L.; Jessen, L.K.; Weisheit, F.; Bhat, K.; Westernströer, U.; Garbe-Schönberg, D.; Willumeit-Römer, R.; Quandt, E. Structural characterisation and degradation of Mg-Li thin films for biodegradable implants. Sci. Rep. 2023, 13, 52–56. [Google Scholar] [CrossRef] [PubMed]
- MacLeod, K.; Nash, D.H.; Bow, D.R.; Ma, L. Influence of Heat Treatments on the Microstructure and Mechanical Properties of Two Fine Mg-Li-Y Alloy Wires for Bioresorbable Applications. Adv. Eng. Mater. 2023, 25, 200143. [Google Scholar] [CrossRef]
Disclaimer/Publisher’s Note: The statements, opinions and data contained in all publications are solely those of the individual author(s) and contributor(s) and not of MDPI and/or the editor(s). MDPI and/or the editor(s) disclaim responsibility for any injury to people or property resulting from any ideas, methods, instructions or products referred to in the content. |
© 2025 by the authors. Licensee MDPI, Basel, Switzerland. This article is an open access article distributed under the terms and conditions of the Creative Commons Attribution (CC BY) license (https://creativecommons.org/licenses/by/4.0/).