Abstract
Color metallographic samples of H59 brass alloy have been prepared by aqua regia etching. In this paper, combined with XRD (X-ray diffraction), traditional metallographic analysis, FE-SEM (field emission scanning electron microscopy), and EBSD (electron backscattering diffraction), the effect of the color metallographic method on the microstructure characterization of the H59 brass alloy was analyzed. The experimental results showed that α phases and β phases could be distinguished clearly, and the phase morphology, distribution, and content could be expressed accurately with an average error value of 5.25% for the α phase and 4.71% for the β phase. The average error rate of the phase content characterization was 4.98% (less than 5%) with the color metallographic method. In addition, it was also found in the study that the brightness and darkness of the β phase would be related to the grain orientation, and the bright grains would correspond to the low-index surface, and the dark grains to the high-index surface. As a low-cost, fast, and efficient characterization technique, the experimental results show that color metallography (CM) could replace electron backscattering diffraction (EBSD) for the analysis of the phase composition, phase distribution, phase content, and grain orientation of brass alloys, which would provide an experimental basis for optimizing alloy properties and expanding applications.
1. Introduction
Brass alloy has been widely used in mechanical part manufacturing, electrical manufacturing, construction, musical instrument manufacturing, chemical equipment, and other fields, because of its excellent mechanical properties and corrosion resistance [1,2,3,4]. The microstructure of the alloy has a direct effect on its properties such as strength, plasticity, and corrosion resistance. The quantitative and qualitative characterization of the multiphase microstructure should help to optimize heat treatment process conditions to achieve specific mechanical properties and further expand its application range [5].
Appropriate microstructure characterization techniques form the basis of understanding and predicting the properties of alloys. Key information such as phase composition, grain size, and distribution could be determined by characterization [6]. Optimizing the microstructure would help to improve the comprehensive properties of alloys to meet the needs of different industrial fields.
Traditional metallographic analysis and scanning electron microscopy (SEM) are usually presented in black and white or gray-scale images to characterize the microstructure of brass alloys, which could better display the morphology of grain boundaries, phase boundaries, and grain morphology, but it was difficult to identify the phase and accurately characterize the distribution, morphology, content, and orientation relationship of all phases [7]. Electron backscatter diffraction (EBSD) technology is widely used in material research because of its high precision and superior resolution for microscopic information such as crystal orientation [8,9,10,11,12,13,14]. However, the EBSD technique had some limitations that cannot be ignored, such as high testing costs, long testing times, and strict requirements for sample preparation.
As a traditional technique, color metallography can highlight the color and morphological characteristics of different phases, which shows great potential in the characterization of alloy microstructure [15,16,17]. The etching agents of different types have different effects on specific metal materials [18,19]. Pashangeh et al. [20] identified and estimated the phase constituents of a high-silicon, medium-carbon multiphase steel subjected to quenching and bainitizing treatment using color metallography. Vaško et al. [21] distinguished phases with similar chemical components in graphite cast iron using an appropriate colored etchant. Nguyen et al. [22] investigated the characteristic color microstructure of Al-Mn-Si alloy strips fabricated by high-speed twin-roll casting using Weck’s reagent. Previous studies have demonstrated that in cast iron and low-carbon steel samples, color metallography can not only distinguish grains from one another but also provide valuable information regarding their crystallographic orientation [15,23]. It had been pointed out that when pure copper is treated by Beraha-I color etching, the color of the developing layer is significantly correlated with the crystallographic orientation of the grains [24]. Despite their extensive application in metallography as a method for developing grain structures, no quantitative studies have been conducted on brass alloys to establish the relationship between crystallographic orientation and the resultant color of individual grains after color etching. Therefore, further study on the application of color metallography in the phase identification and crystal orientation analysis of brass alloys needs to be carried out.
This study highlighted the advantages of color metallography (CM) in identifying the phase morphology of H59 brass alloys with higher resolution by comparing traditional metallographic analysis and advanced electron microscopy (EBSD, FE-SEM) with color metallographic techniques. The phase composition and phase content of H59 brass alloys were tested by X-ray diffraction (XRD) and electron backscattering diffraction (EBSD), and then the results were compared and analyzed with the phase content data that were obtained via calculation with the color metallographic images, showing that color metallography (CM) had a small error in determining the phase content. This paper also deals with the relationship between the lightness and darkness degree of the phase color and grain orientation in color metallographic images, which would solve the problem of the phase content and judge the grain orientation in brass alloys, with which color metallography struggles. The purpose of this study is to evaluate the feasibility of using color metallography instead of EBSD in the characterization of the microstructure of brass alloys. In subsequent studies on brass alloys, low-cost, efficient, and rapid color metallography should be used to characterize phase composition, phase content, and grain orientation without relying on EBSD technology.
2. Experimental Materials and Methods
Cast commercial-grade H59 brass alloy (the chemical composition is shown in Table 1) was purchased from Baose Metal Materials Co., Ltd. in Dongguan City, Guangdong province, China. The diameter of the H59 brass alloy was 20 mm, and its length was 200 mm. The alloy was cut into several cylindrical specimens with a height of 10 mm using a wire-cutting machine. The samples were heated up to 650 °C and 800 °C, and, after holding at this temperature for 30 min, slowly cooled down to room temperature. The specimens for microstructure observations were polished with 80–2000 grid SiC paper, followed by mechanical polishing. Nitric acid aqueous solution was employed to reveal the microstructures. The microstructural observations were carried out using an optical Olympus microscope and a field emission scanning electron microscope (FE-SEM) in secondary electron (SE) imaging modes. The electron microscope was operated at 15 Kv. The phase composition was analyzed by XRD (D8 Advance, Bruker AXS, Karlsruhe, Germany), using copper Kα radiation, with 2θ ranging between 20° and 90° and rotation performed at 5°/min. The MDI Jade 6.5 software database was employed for data interpretation and analysis. EBSD specimens were prepared using vibratory polishing. The phase composition and distribution of the alloys were observed using backscattered electron diffraction (EBSD) (Oxford Nordlys Max3, Oxford Instruments, High Wycombe, UK). The EBSD data were analyzed using Aztec Crystal software.

Table 1.
The chemical composition of brass alloy.
The color etching reagent was hydrochloric acid–nitric acid in the ratio of 3:1 by volume, known as aqua regia, and the etching time was 8S. The colored metallographic images at the same locations were observed using a metallographic microscope, the colored metallographic images were processed using Adobe Photoshop, and the percentage content was calculated using Fiji ImageJ software.
3. Results
3.1. Phase Composition
The phase compositions of H59 brass alloy in different states were accurately determined by the X-ray diffraction (XRD) technique, as shown in Figure 1. The experimental results show that the internal phase structure of the H59 brass alloy in cast state and after annealing mainly consisted of the Cu0.64Zn0.36 (Pdf#50-1333) and CuZn (Pdf#65-6321) of specific crystal structures. Annealing has no obvious effect on the phase composition of the H59 brass alloy. Combined with the Cu-Zn alloy phase diagram, it could be seen that the Cu0.64Zn0.36 was the α phase and the CuZn was the β phase.

Figure 1.
XRD pattern of H59 brass alloy.
3.2. Comparative Analysis of Microstructure Characterization
The properties of a material are closely related to its microstructure. The unique microstructures consist of different materials, and the grain size, phase morphology, and distribution were all precisely revealed with the application of suitable characterization techniques, which helped in understanding the basic properties of the materials.
Shown in Figure 2 are the microstructure characterizations of the same region of the H59 brass alloy in the annealed condition. The microstructure observed by a scanning electron microscope (SEM) is presented as a gray-scale image in Figure 2a. The resolution is superior to that of traditional metallographic methods, clearly revealing microstructural features such as particles, pores, and cracks. The grain boundaries can be clearly seen. However, sufficient detail on internal structures and phase morphology cannot be provided. Additionally, SEM images are typically monochrome, lacking color contrast, which could make it difficult to distinguish between different phases. It is impossible to distinguish which ones are α phase and which ones are β phase merely from SEM images.
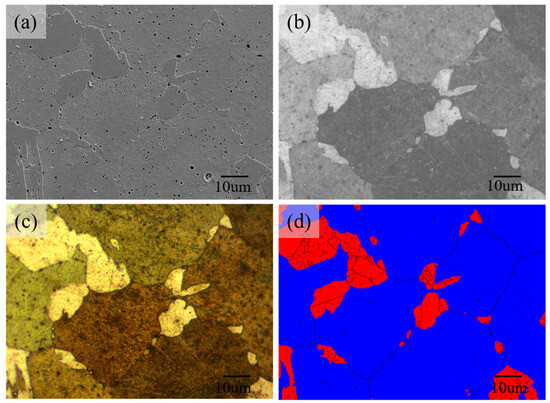
Figure 2.
Microstructure characterization of the same region of the H59 brass alloy in annealed condition. (a) SEM; (b) optical microscope; (c) color metallography; (d) EBSD.
The traditional metallographic structure is shown in Figure 2b. The grain boundary and phase interfaces can be highlighted by suitable etching methods. However, metallographic images generally have a lower resolution, which could not clearly display fine microstructural details and phase morphology. At the same time, metallographic images are usually black and white, which may not intuitively differentiate phases.
The color metallographic image is shown in Figure 2c, and the contrast between different phases is obvious, making the morphology and distribution of phases more visually distinct. This type of image can more intuitively display microstructural features such as the grain size, shape, and phase distribution. By comparison and analysis with the electron backscattering diffraction pattern (EBSD) in Figure 2d, it can be clearly determined that the bright color region corresponds to the pro-eutectoid α phase, which presents a bright color and luster characteristics, continuous grain boundaries, and a relatively regular morphology, and the distribution range of α phase in the organization is outlined. The dark region is the β phase, which had a relatively unique tonal performance, and its grain boundaries can be effectively distinguished. The overall distribution trend is complementary with α, and both α and β build up the internal microstructure of the material together.
3.3. Phase Content Analysis
The phase content significantly affects the properties of alloy materials. Figure 3 shows morphology distribution maps of the phase and phase percentage content, which were obtained using electron backscattering diffraction (EBSD) and color metallographic images. Figure 3a–c are EBSD analysis diagrams of alloys with different states, which were identified to consist of an α phase and β phase, which is in line with the XRD analysis results. The color metallographic images of the same region are shown in Figure 3d–f. It was found that the color metallographic image and EBSD phase morphology distribution were in close agreement compared with them. The bright yellow areas in the color metallographic images correspond to the red region in the EBSD diagram, which is the pro-eutectoid α phase. The other areas in the color metallographic images correspond to the blue areas in the EBSD diagram and are β phases. To illustrate the differences in the content of the α phase and β phase obtained by color metallography and EBSD, the color metallographic image was processed using Adobe Photoshop software 2023, and the contents of the two phases were measured by Image J software, as shown in the table in Figure 3. The cast brass alloy was analyzed by EBSD and found to contain 25.94% α phase and 69.75% β phase. The sum of the two phases does not equal 100% because there are zero solution points in the EBSD analysis. The content of the α phase calculated from the color metallographic image was 27.2%, and the content of the β phase was 72.8%. Compared to the phase content data obtained by EBSD, the difference in α phase content is only 1.26%, and in β phase content is only 4.05%. Considering that the α phase in the cast brass alloy is relatively small, there may be a large error in the calculation process. Thus, the cast brass alloy was annealed at 600 °C and 800 °C, and the annealed state H59 brass alloy was more widely used. The α phase content of the brass alloy annealed at 600 °C was 33.21%, and the β phase content was 66.79%, which differed from the data obtained by EBSD by 2.84% and 1.75%. The α phase content of the brass alloy annealed at 800 °C was 36.21%, and the β phase content was 61.65%, which differed from the data obtained by EBSD by 2.14% and 3.73%.
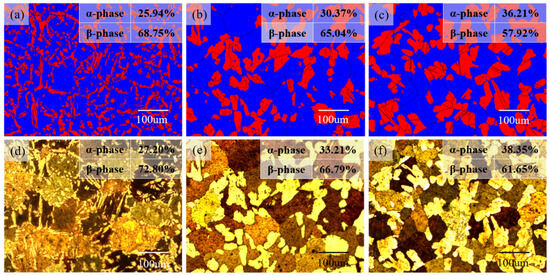
Figure 3.
Area map of alloy morphology distribution and phase content calculation. (a,d) Cast, (b,e) annealed at 600 °C, (c,f) annealed at 800 °C.
According to the phase content calculated by analysis in the table in Figure 3, the column chart of phase content comparison was obtained, as shown in Figure 4 (CM stands for color metallography). The orange area represents the α phase, and the purple area represents the β phase. The phase content obtained by the two methods was not very different. This shows that it is feasible to calculate the content of the α phase and β phase using the color metallographic method.
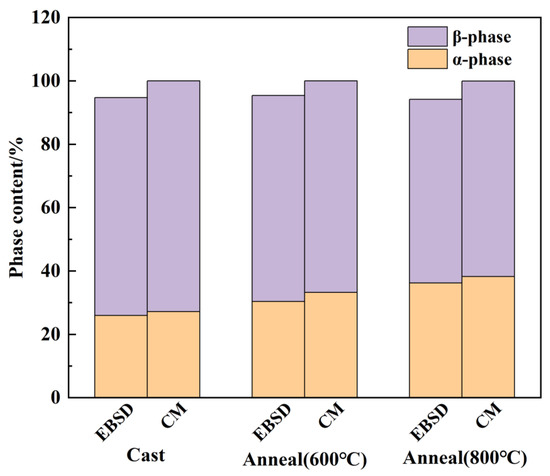
Figure 4.
Results of phase content analyses of the two methods.
3.4. Grain Orientation Analysis
Previous studies have proven a strong connection between the developed layer’s color and crystallographic orientation [24,25,26]. It can be seen from Figure 3, comparing EBSD phase distribution with color metallography, that the color of the α phase is uniform and becomes bright yellow after color etching. The color of the β phase becomes dark yellow, and the degree of brightness is inconsistent, which is related to the corrosion resistance of the grain.
According to the Cu-Zn alloy phase diagram, the Zn content in the α phase is about 35% and the Zn content in the β phase is about 50% at room temperature. The α phase with the FCC crystal structure has a higher density and lower surface energy and therefore higher electrode potential. The β phase is a BCC structure, the atomic arrangement is relatively loose, and the surface energy is higher, but the electrode potential is lower. At the same time, the copper electrode potential is higher than the zinc alloy phases, so the phase content of copper could be one of the factors that affects the electrode potential. According to the above analysis, the α phase has higher corrosion resistance and a brighter color in the process of color etching, which is consistent with the experimental results.
Figure 5a shows the IPF diagram of the H59 brass alloy in the annealed state at 800 °C, and Figure 5b shows the colored metallographic image for the same region. The β phase grains with different colors in the color metallography are also different in IPF, indicating that the grain orientation is inconsistent. The β phase grains with similar color are also similar in IPF, indicating that the grain orientation is roughly the same. To illustrate the relationship between grain orientation and etching color, 5 β phase grains with different colors of lightness and darkness were selected, as shown in Figure 5a,b. The experimental results showed that the darker-colored grains 1, 2, 3, 4, and 5 were all β phase grains, as shown in Figure 5a,b, the color brightness gradually increased after etching, and the corresponding crystal faces of grains 1, 2, 3, 4, and 5 were (223), (233), (214), (104), and (012), respectively, as shown in Figure 5c-1–c-5. As the etching color (brightness) becomes brighter, the β phase grains have a lower surface index.
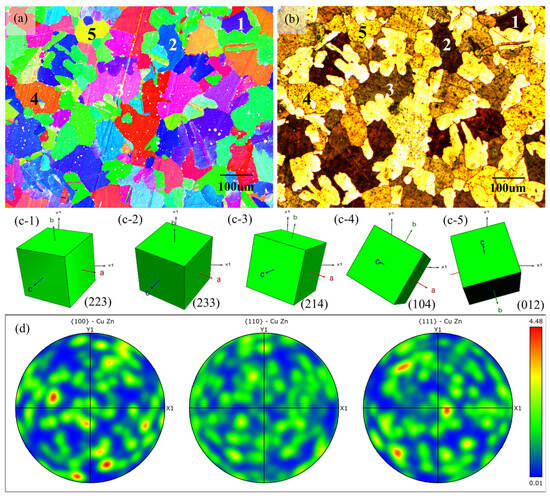
Figure 5.
Determination of grain orientation by color metallography: (a) IPF map showing grain morphology and orientation in annealed state at 800 °C; (b) color metallography showing grain morphology and erosion colors in annealed state at 800 °C; (c-1–c-5) are grain orientation maps for grains 1–5; (d) represents polar plots of β phases {100}, {110}, and {111}.
The β phase grain orientation in brass alloys in the annealed state showed a random distribution, as shown in Figure 5d. In the infected β phase, the brightness of the grain was related to the corrosion degree of the grain. The corrosion degree of the grain was related to the Cu atomic density of the crystal face. The ratio of Cu and Zn atoms in the β phase was about 1:1. Assuming that the distribution of Zn atoms in the β phase was uniform, the density of copper atoms in the most densely packed {110} crystal face group would be the highest, while the density of copper atoms in the {100} crystal face group would be the lowest. The smaller the angle with the {110} crystal face group, the greater the degree of corrosion of the crystal face, and the lower the brightness, conversely, the brighter the crystal surface. This is consistent with the experimental results. The experimental results show that the grain brightness of the β phase was related to the grain orientation after color etching, and the grain orientation of the β phase of brass alloy could be roughly judged by color metallography. The bright grains correspond to the low-index surface, and the dark grains to the high-index surface.
4. Discussion
Compared with traditional metallography and field emission scanning electron microscope (FE-SEM) observation, color metallography (CM) clearly showed the fine structure of the internal organization of the material with a bright color and contrast, such as grain boundary characteristics and phase distribution morphology, meaning that the identification accuracy for the microstructure could be greatly improved. And the procedure for obtaining tissue images is essentially the same as for the conventional metallographic method. Compared with electron backscattering diffraction (EBSD), it showed an excellent performance in experimental cost control, with efficient and rapid detection efficiency, which could effectively shorten the experiment cycle and reduce the input in terms of manpower, material resources, and time costs. This would greatly improve the efficiency of the organizational identification of brass alloys in industrial production. It had great application value and popularization potential in the field of the microstructure characterization of brass alloys.
The error values for the analysis of each phase percentage using the color metallographic method were calculated according to Equation (1):
where σ is the average error value; A is the measured value, specifically, the color metallographic analysis value; E is the EBSD analysis value, and this is the correct value, resulting in an average error value of 5.25% for the α phase and 4.71% for the β phase. The average error in phase content is 4.98%. Therefore, when characterizing the phase content of the H59 brass alloy, the color metallographic images could be obtained by etching the brass alloy sample, and then the phase content could be calculated. This method could guide us in adjusting the heat treatment process according to the actual working conditions and better serve production.
At the same time, the results of grain orientation analyses show that the degree of corrosion resistance of different phases in brass alloys depends preferentially on the crystal structure, followed by the composition. In the lower corrosion-resistant β phase, the corrosion resistance depends on the spatial orientation of the grains. Thus, in production, the spatial orientation of the grains of the different β phases in the alloy can be roughly determined by color metallography (especially in the production of brass alloys in the rolled state) without relying on EBSD, which can quickly provide data support for the optimization of the production process.
5. Conclusions
In this paper, the microstructure of the H59 brass alloy was characterized by color metallography and advanced electron microscopy technology, and the following conclusions were reached:
- (1).
- By aqua regia etching on H59 brass, visible color metallography could be achieved, which was low-cost, fast, and efficient compared with traditional metallography and advanced electron microscopy technology.
- (2).
- Color metallographic images could be used to characterize the phase morphology and distribution of brass alloys and could also be used for phase identification.
- (3).
- The average error in the α phase using color metallographic statistics was 5.25%, the average error in the β phase was 4.71%, and the average error rate in the phase content was 4.98% (less than 5%).
- (4).
- The grain orientation of the β phase in the color metallography of H59 brass is related to the degree of brightness and darkness: the color of the low-index surface is brighter, and the color of the high-index surface is darker.
Author Contributions
S.Y.: Methodology, software, and writing—review and editing. Y.M.: Writing—original draft, data curation, validation, and funding acquisition. H.Y.: Formal analysis and supervision. Z.M.: Project administration. L.C.: Validation and data curation. All authors have read and agreed to the published version of the manuscript.
Funding
The work described in this paper was financially supported by the Heilongjiang Provincial Education Department Fundamental Scientific Research Project, China (2020-KYYWF-0254).
Institutional Review Board Statement
Not applicable.
Informed Consent Statement
Not applicable.
Data Availability Statement
Data are unavailable due to privacy or ethical restrictions.
Conflicts of Interest
The authors declare that the research was conducted in the absence of any commercial or financial relationships that could be construed as a potential conflict of interest.
References
- Mahdi, M.M.; Ali, A.M.; Alalousi, M.A.; Kadhim, D.A.; Abid, M.A. Developing a Copper-Zinc-Aluminum Alloying Technique by Vacuum Thermal Deposition after Irradiation by Gamma Rays (NaI (Ti)) with Stabilized Zinc Metal. Vacuum 2024, 219, 112676. [Google Scholar] [CrossRef]
- Yu, X.; Xiao, Z.; Li, Z.; Zhao, X.; Lu, S.; Fu, Y. Hot Deformation Behaviour and Microstructure Evolution of Gold-Imitation Brass Alloy with High Corrosion Resistance. Trans. Nonferrous Met. Soc. China 2023, 33, 839–850. [Google Scholar] [CrossRef]
- Akbar, F.; Čurlík, I.; Reiffers, M.; Giovannini, M. Phase Equilibria and Crystal Structures in the Ytterbium–Copper–Zinc System. J. Alloy. Compd. 2024, 976, 173195. [Google Scholar] [CrossRef]
- Al-Jubury, A.; Yin, F.; Abusharkh, T.; Fuad, M.H.; Kania, P.W.; Buchmann, K. Stationary Metal Sheets (Copper, Zinc or Brass) in Fish Tanks Prevent Ichthyophthirius Multifiliis Fouquet, 1876 Infection of Rainbow Trout: In Vivo and in Vitro Effects. Aquaculture 2023, 577, 739945. [Google Scholar] [CrossRef]
- Mendonça, R.R.; Nogueira, I.M.S.; Lovo, J.F.P.; Canale, L.C.F. Multiple Etchings Methodology: A New Approach in Multiphase Steel Characterization. J. Microsc. 2020, 277, 93–99. [Google Scholar] [CrossRef]
- Lambert, A.; Lambert, A.; Drillet, J.; Gourgues, A.F.; Sturel, T.; Pineau, A. Microstructure of Martensite–Austenite Constituents in Heat Affected Zones of High Strength Low Alloy Steel Welds in Relation to Toughness Properties. Sci. Technol. Weld. Join. 2000, 5, 168–173. [Google Scholar] [CrossRef]
- Shan, X.; Peng, B.; Li, G.; Dong, B.; Wang, X.; Liu, S.; Jie, J.; Li, T. CALPHAD-Aided Designing Complex Brass Alloys and Revealing the Evolution Mechanism of δ-Ni2Si Reinforcing Phase. Mater. Sci. Eng. A 2025, 923, 147759. [Google Scholar] [CrossRef]
- Xu, X.; Song, Z.; Wang, K.; Li, H.; Pan, Y.; Hou, H.; Zhao, Y. Cryo-Rolling and Annealing-Mediated Phase Transformation in Al5Ti2.5Fe25Cr25Ni42.5 High-Entropy Alloy: Experimental, Phase-Field and CALPHAD Investigation. J. Mater. Sci. Technol. 2025, 219, 307–325. [Google Scholar] [CrossRef]
- Pu, Q.; Geng, J.; Li, K.; Luo, T.; Li, Y.; Xia, P.; Wang, F.; Chen, D.; Wang, H.; Wang, H. Microstructural Insights into Short Fatigue Crack Growth in Particle-Reinforced al-Matrix Composite Sheet. Int. J. Fatigue 2025, 193, 108787. [Google Scholar] [CrossRef]
- Bajaj, D.; Feng, A.H.; Qu, S.J.; Li, D.Y.; Chen, D.L. Orientation-Dependent Lattice Rotation and Phase Transformation in an Additively Manufactured High-Entropy Alloy. J. Mater. Sci. Technol. 2025, 227, 11–25. [Google Scholar] [CrossRef]
- Liu, L.; Gao, Y.; Chen, X.; Liu, Z.; Ren, X.; Zhu, M. Orientation-Related Fatigue Crack Initiation Behavior at Twin Boundary of Inconel 718 in Vacuum Environment of 650 °C. Int. J. Fatigue 2025, 193, 108825. [Google Scholar] [CrossRef]
- Liu, Y.T.; Chua, C.; Soh, V.; Sun, Z.; Chua, C.K.; Sing, S.L. Revealing the Underlying Mechanism in Controlling Young’s Modulus of Additively Manufactured Ti-6Al-4V Using Fuzzified Machine Learning. Virtual Phys. Prototyp. 2025, 20, e2443103. [Google Scholar] [CrossRef]
- Huo, K.; Han, P.; Wang, W.; Liu, Y.; Zhang, X.; Zheng, P.; Qiao, K.; Qiang, F.; Wang, Q.; Wang, K. Role of Intermetallic Compounds in the Fracture of Double-Sided Friction Stir Welded Titanium-Steel Clad Plates. Mater. Charact. 2025, 221, 114757. [Google Scholar] [CrossRef]
- Xiang, Z.; Chen, M.; Wang, L.; Wang, M.; Li, L. The Process, Microstructure, and Mechanical Properties of Hybrid Manufacturing for Steel Injection Mold Components. CIRP J. Manuf. Sci. Technol. 2025, 57, 90–99. [Google Scholar] [CrossRef]
- Renkó, J.B.; Bonyár, A.; Jánoš Szabó, P. Effect of Beracha-I Type Color Etchant on the Ferrite Phase in Different Type Fe-C Alloys. IOP Conf. Ser. Mater. Sci. Eng. 2020, 903, 012054. [Google Scholar] [CrossRef]
- González Fernández De Castro, M.; Martín Álvarez, Y.; Moreno-Labella, J.J.; Panizo-Laiz, M.; Del Río, B. Color-Metallographic Characterization of Alloyed White Cast Irons Ni-Hard Type. Metals 2020, 10, 728. [Google Scholar] [CrossRef]
- Suárez-Peña, B.; Asensio-Lozano, J.; Vander-Voort, G.F. Metalografía a color en aleaciones Al-Si comerciales. Optimización de las técnicas de caracterización microestructural mediante microscopía óptica de reflexión. Rev. Met. 2010, 46, 469–476. [Google Scholar] [CrossRef]
- Ambrož, O.; Čermák, J.; Jozefovič, P.; Mikmeková, Š. Automated color etching of aluminum alloys. Pract. Met. 2022, 59, 459–474. [Google Scholar] [CrossRef]
- Duwe, S.; Tonn, B. The effect of seven etching solutions used for the differentiated visualization of complex microstructures in low-alloyed cast iron. Pract. Met. 2021, 58, 507–538. [Google Scholar] [CrossRef]
- Pashangeh, S.; Ghasemi Banadkouki, S.S.; Besharati, F.; Mehrabi, F.; Somani, M.; Kömi, J. Color Light Metallography Versus Electron Microscopy for Detecting and Estimating Various Phases in a High-Strength Multiphase Steel. Metals 2021, 11, 855. [Google Scholar] [CrossRef]
- Vaško, A.; Belan, J.; Tillová, E. Use of Colour Etching in the Structural Analysis of Graphitic Cast Irons. Manuf. Technol. 2020, 20, 845–848. [Google Scholar] [CrossRef]
- Nguyen, T.H.; Song, R.; Harada, Y.; Kumai, S. Color Metallography of Characteristic Microstructure in High-Speed Twin-Roll Cast Al–Mn–Si Alloy Strip Using Weck’s Reagent. Mater. Trans. 2020, 61, 2253–2262. [Google Scholar] [CrossRef]
- Bonyár, A.; Renkó, J.; Kovács, D.; Szabó, P.J. Understanding the Mechanism of Beraha-I Type Color Etching: Determination of the Orientation Dependent Etch Rate, Layer Refractive Index and a Method for Quantifying the Angle between Surface Normal and the <100>, <111> Directions for Individual Grains. Mater. Charact. 2019, 156, 109844. [Google Scholar] [CrossRef]
- Renkó, J.B.; Szabó, P.J.; Bonyár, A. Correlation between the Developed Layer’s Color and Crystallographic Orientation of Pure Copper during Long-Term Color Etching with beraha-I. J. Mater. Res. Technol. 2023, 23, 4346–4354. [Google Scholar] [CrossRef]
- Bonyár, A.; Szabó, P.J. Correlation between the Grain Orientation Dependence of Color Etching and Chemical Etching. Microsc. Microanal. 2012, 18, 1389–1392. [Google Scholar] [CrossRef]
- Renkó, J.B.; Romanenko, A.; Szabó, P.J.; Sulyok, A.; Petrik, P.; Bonyár, A. Analysis of Structural and Chemical Inhomogeneity of Thin Films Developed on Ferrite Grains by Color Etching with Beraha-I Type Etchant with Spectroscopic Ellipsometry and XPS. J. Mater. Res. Technol. 2022, 18, 2822–2830. [Google Scholar] [CrossRef]
Disclaimer/Publisher’s Note: The statements, opinions and data contained in all publications are solely those of the individual author(s) and contributor(s) and not of MDPI and/or the editor(s). MDPI and/or the editor(s) disclaim responsibility for any injury to people or property resulting from any ideas, methods, instructions or products referred to in the content. |
© 2025 by the authors. Licensee MDPI, Basel, Switzerland. This article is an open access article distributed under the terms and conditions of the Creative Commons Attribution (CC BY) license (https://creativecommons.org/licenses/by/4.0/).