
Correlations Between Crystallinity, Rheological Behavior, and Short-Term Biodegradation for LDPE/Cellulose Composites with Potential as Packaging Films


Abstract
1. Introduction
2. Materials and Methods
2.1. Research Materials
2.2. Preparation of Composites
2.3. Characterization
2.3.1. Rheology Test
2.3.2. XRD Test
2.3.3. Degradation Test
3. Results
3.1. XRD
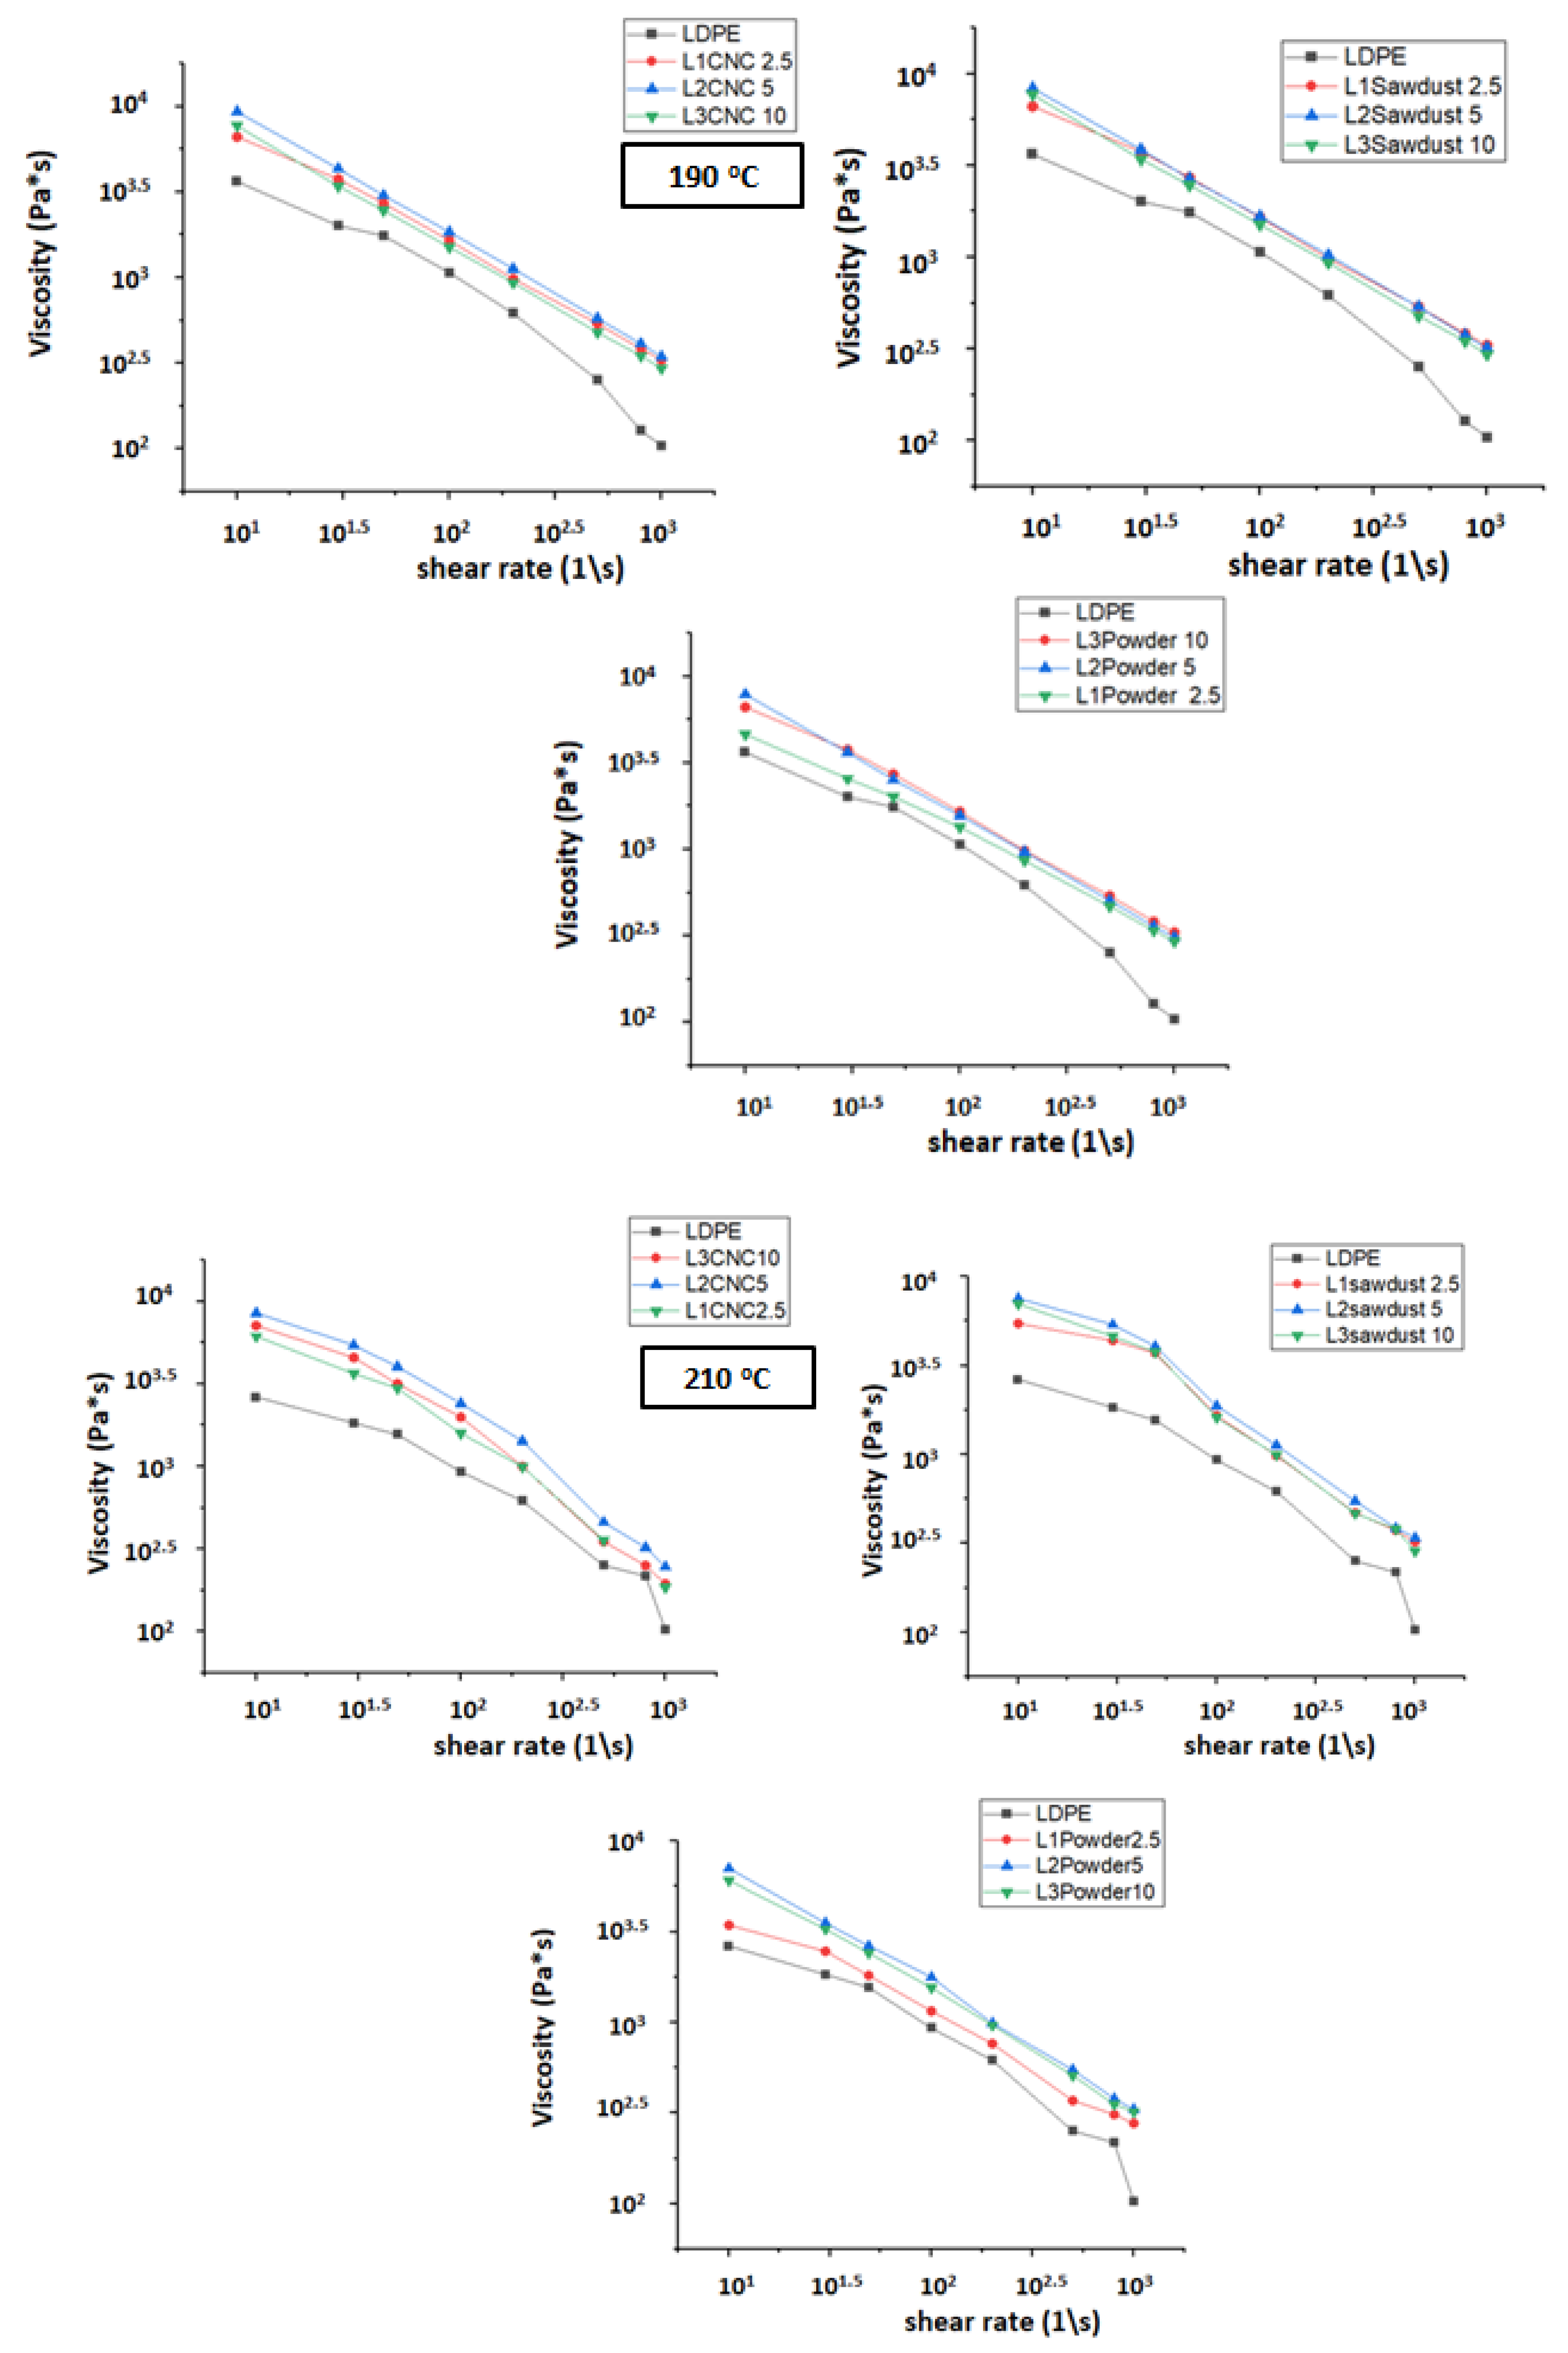
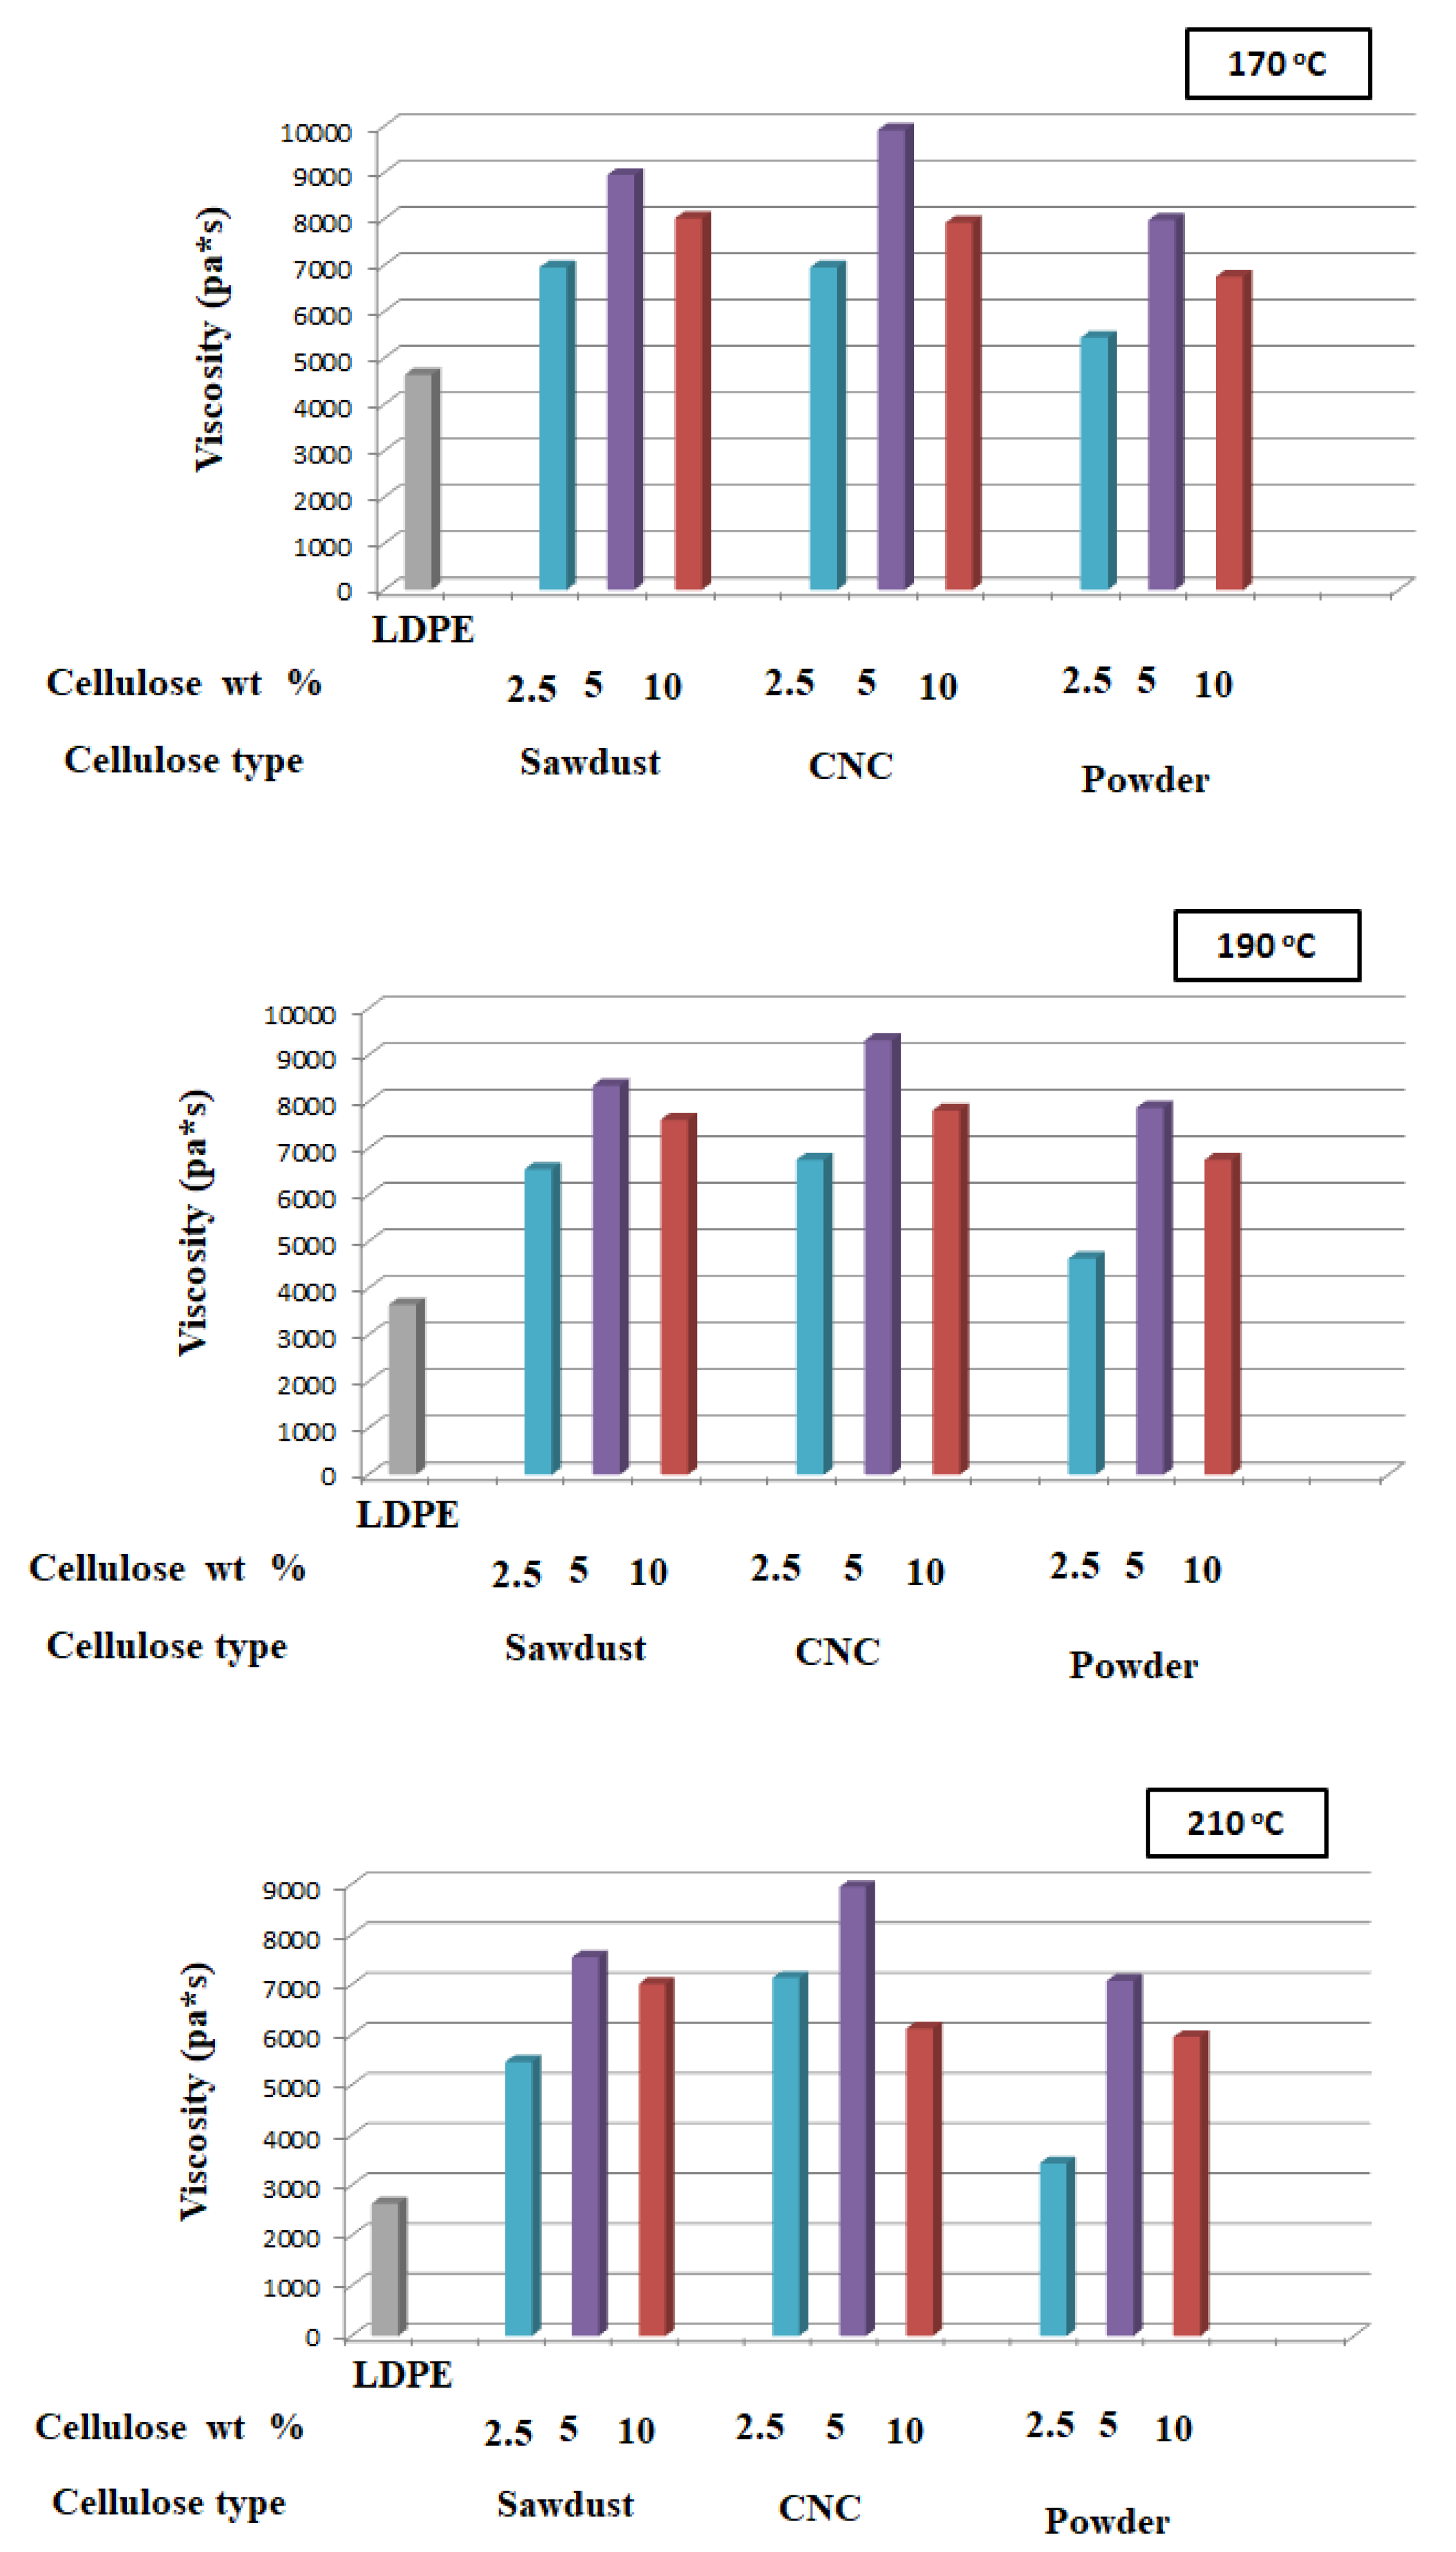
3.2. Rheology
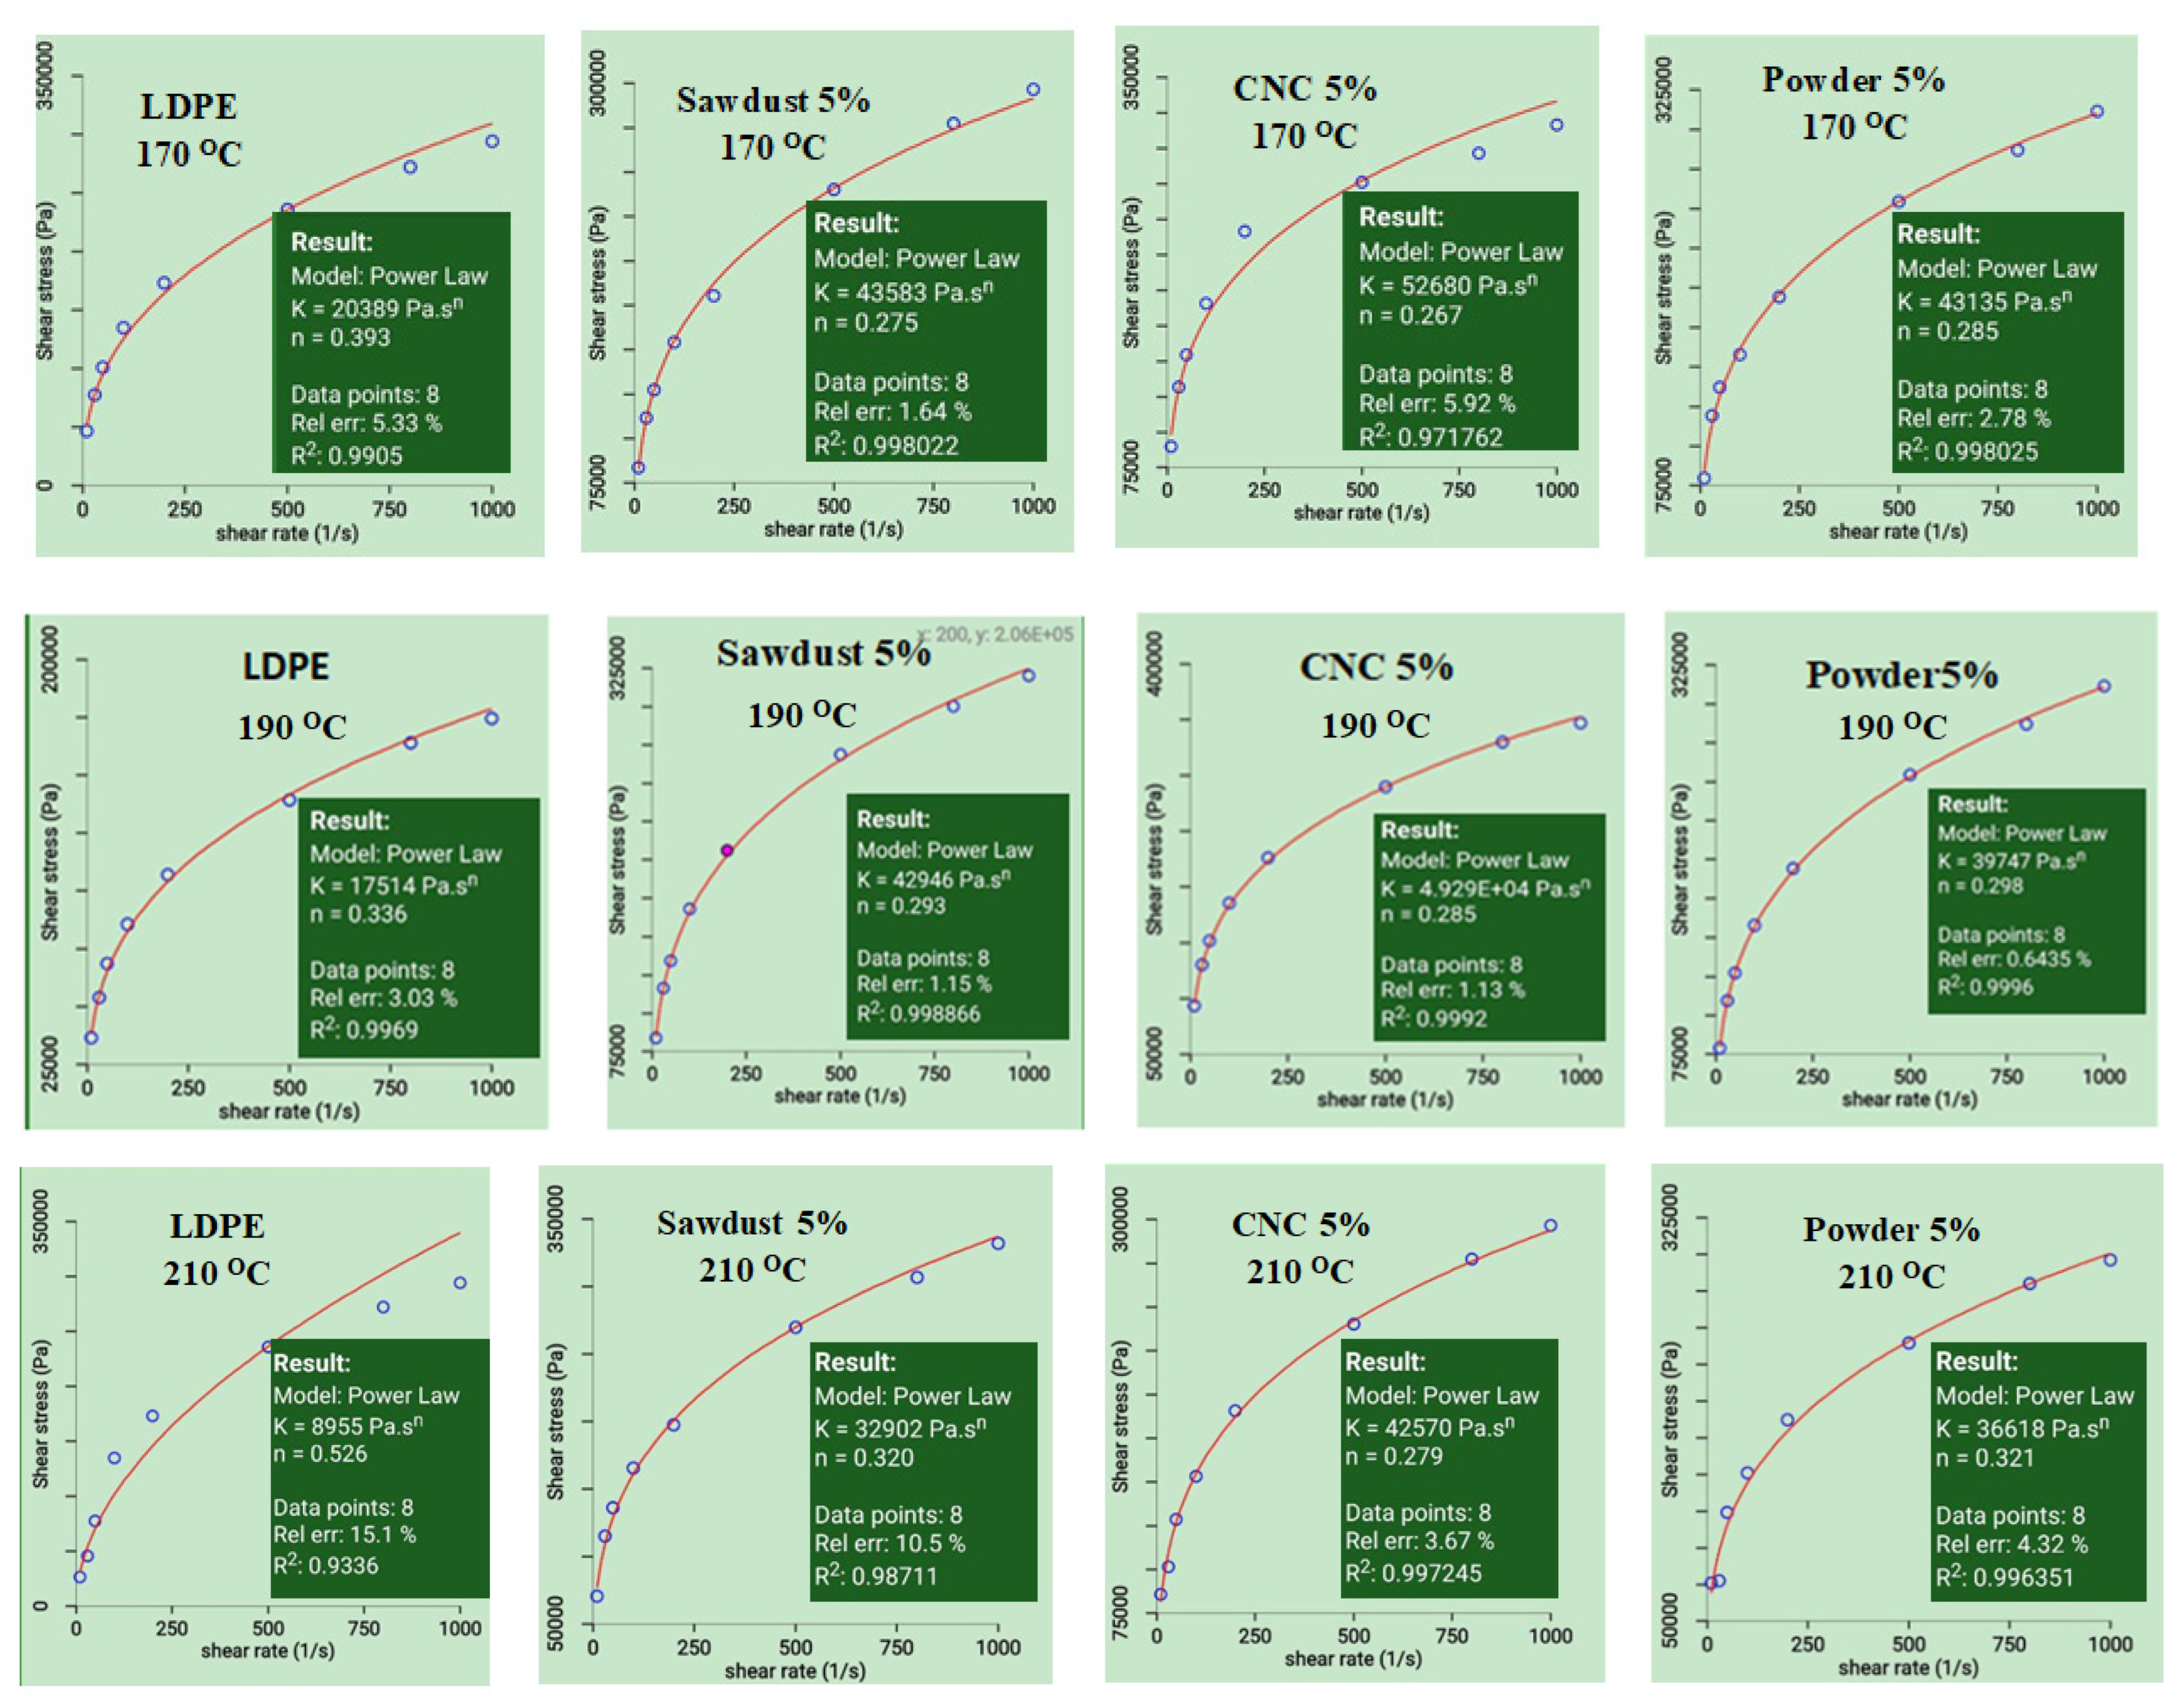
3.2.1. Rheological Model
- Power-law model:
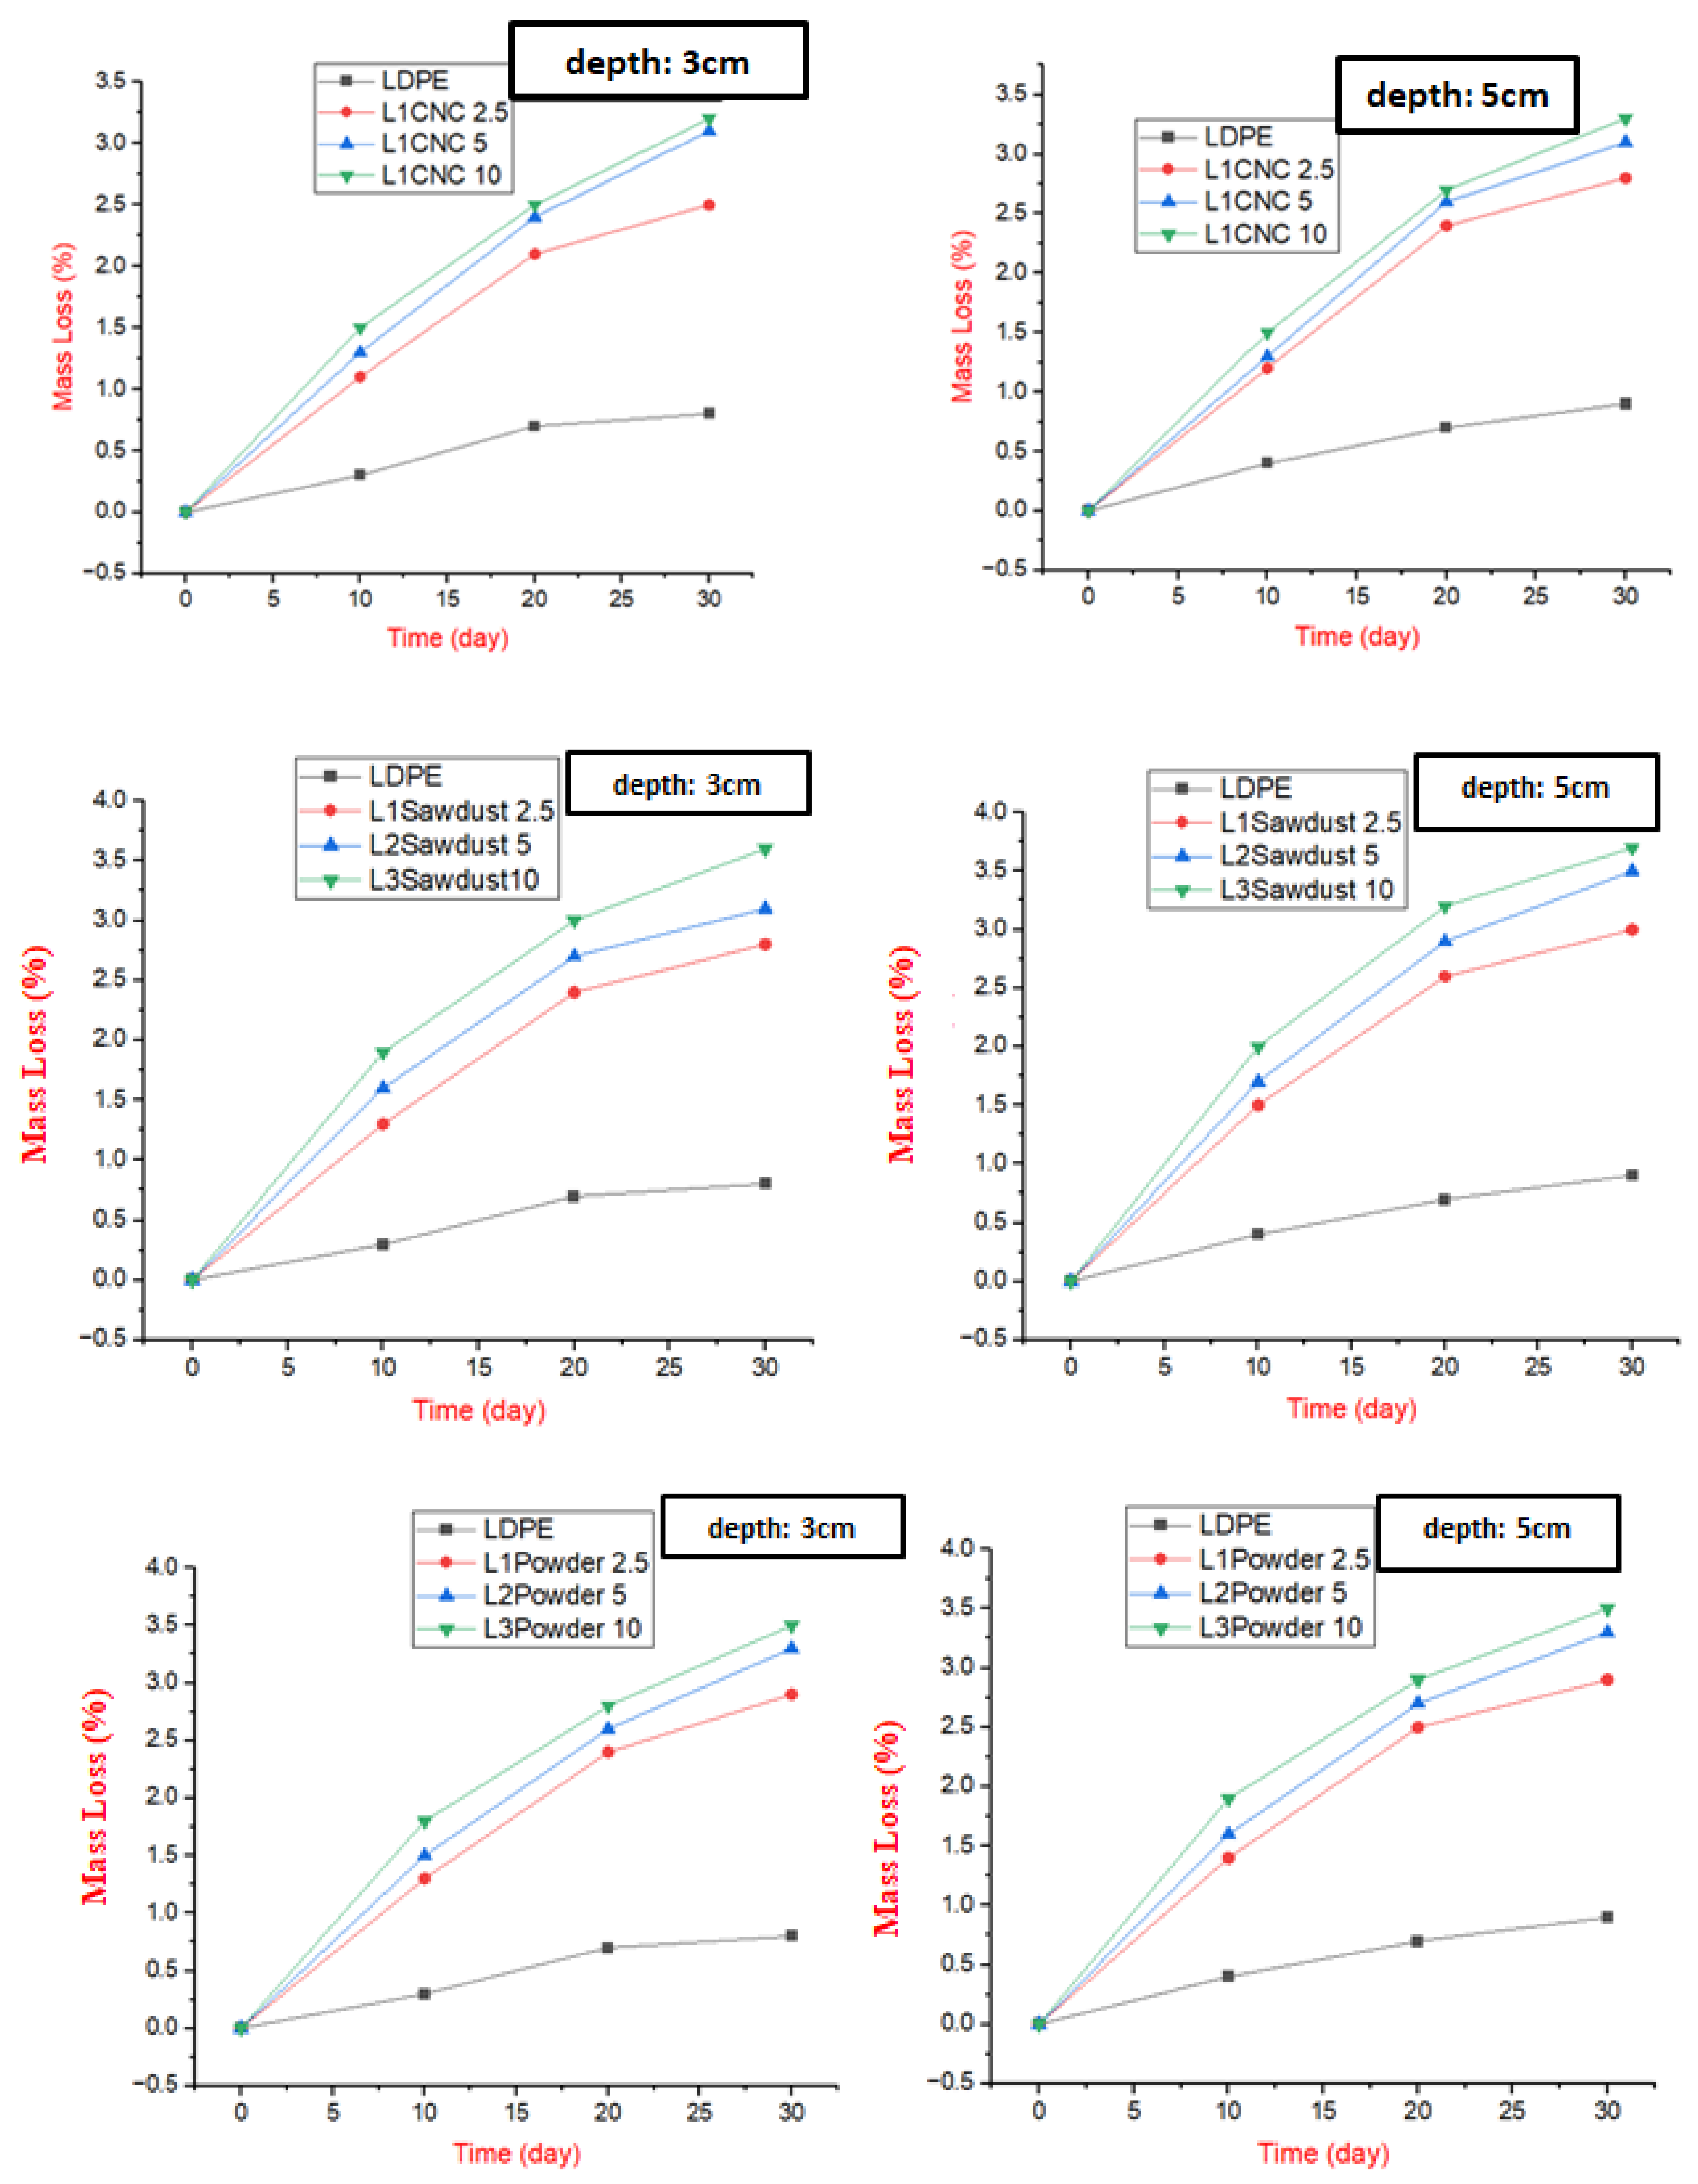
3.2.2. Degradation
4. Conclusions
Author Contributions
Funding
Institutional Review Board Statement
Informed Consent Statement
Data Availability Statement
Acknowledgments
Conflicts of Interest
References
- Shazleen, S.S.; Foong Ng, L.Y.; Ibrahim, N.A.; Hassan, M.A.; Ariffin, H. Combined effects of cellulose nanofiber nucleation and maleated polylactic acid compatibilization on the crystallization kinetic and mechanical properties of polylactic acid nanocomposite. Polymers 2021, 13, 3226. [Google Scholar] [CrossRef] [PubMed]
- Sun, J.; Li, Y.; Cao, X.; Yao, F.; Shi, L.; Liu, Y. A film of chitosan blended with ginseng residue polysaccharides as an antioxidant packaging for prolonging the shelf life of fresh-cut melon. Coatings 2022, 12, 468. [Google Scholar] [CrossRef]
- Kalambur, S.; Rizvi, S.S.H. An overview of starch-based plastics blends from reactive extrusion. J. Plast. Film Sheeting 2006, 22, 39. [Google Scholar]
- Ahari, H.; Anvar, A.A.; Ataee, M.; Naeimabadi, M. Employing nanosilver, nanocopper, and nanoclays in food packaging production: A systematic review. Coatings 2021, 11, 509. [Google Scholar] [CrossRef]
- Pucciaviello, R.; Villani, V.; Belviso, S.; Gorrasi, G.; Tortora, M.; Vittoriam, V. Phase behavior of modified montmorillonite poly(e-caprolactone) nanocomposites. J. Polym. Sci. Part B Polym. Phys. 2004, 42, 1321–1332. [Google Scholar]
- La Mantia, F.P.; Morreale, M. Green composites: A brief review. Compos. Part A 2011, 42, 579–588. [Google Scholar]
- Taj, S.; Munawar, M.A.; Khan, S.U. Natural fiber-reinforced polymer composites. Proc. Pak. Acad. Sci. 2007, 44, 129–144. [Google Scholar]
- Sheltami, R.M.; Abdullah, I.; Ahmad, I.; Dufresne, A.; Kargarzadeh, H. Extraction of cellulose nanocrystals from mengkuang leaves (Pandanus tectorius). Carbohydr. Polym. 2012, 88, 772–779. [Google Scholar]
- Khan, A.; Khan, R.A.; Salmieri, S.; Le Tien, C.; Riedl, B.; Bouchard, J.; Lacroix, M. Mechanical and barrier properties of nanocrystalline cellulose reinforced chitosan based nanocomposite films. Carbohydr. Polym. 2012, 90, 1601–1608. [Google Scholar]
- Zielińska, D.; Rydzkowski, T.; Thakur, V.K.; Borysiak, S. Enzymatic engineering of nanometric cellulose for sustainable polypropylene nanocomposites. Ind. Crops Prod. 2021, 161, 113188. [Google Scholar]
- Kose, R.; Kondo, T. Size effects of cellulose nanofibers for enhancing the crystallization of poly(lactic acid). J. Appl. Polym. Sci. 2013, 128, 1200–1205. [Google Scholar]
- Frone, A.N.; Berlioz, S.; Chailan, J.-F.; Panaitescu, D.M. Morphology and thermal properties of PLA—Cellulose nanofibers composites. Carbohydr. Polym. 2013, 91, 377–384. [Google Scholar]
- Odalanowska, M.; Cofta, G.; Woźniak, M.; Ratajczak, I.; Rydzkowski, T.; Borysiak, S. Bioactive Propolis-Silane System as Antifungal Agent in Lignocellulosic-Polymer Composites. Materials 2022, 15, 3435. [Google Scholar] [CrossRef] [PubMed]
- Song, Y.; Tashiro, K.; Xu, D.; Liu, J.; Bin, Y. Crystallization behavior of poly (lacticacid)/microfibrillated cellulose composite. Polymer 2013, 54, 3417–3425. [Google Scholar]
- Andrzejewski, I.; Barczewski, M.; Czarnecka-Komorowska, D.; Rydzkowski, T.; Gawdzińska, K.; Thakur, V.K. Manufacturing and characterization of sustainable and recyclable wood-polypropylene biocomposites: Multiprocessing-properties-structure relationships. Ind. Crops Prod. 2024, 207, 117710. [Google Scholar] [CrossRef]
- Scholten, P.B.V.; Özen, M.B.; Söyler, Z.; Thomassin, J.M.; Wilhelm, M.; Detrembleur, C.; Meier, M.A.R. Rheological and mechanical properties of cellulose\LDPE composites using sustainable and fully renewable compatibilisers. J. Appl. Polym. Sci. 2020, 137, 48744. [Google Scholar]
- Salehiyan, R.; Soleymani Eil Bakhtiari, S. A review on rheological approaches as a perfect tool to monitor thermal degradation of biodegradable polymers. Korea-Aust. Rheol. J. 2024, 36, 295–317. [Google Scholar]
- Partini, M.; Argenio, O.; Coccorullo, I.; Pantani, R. Degradation kinetics and rheology of biodegradable polymers. J. Therm. Anal. Calorim. 2009, 98, 645–653. [Google Scholar]
- Conrad, J.D. The Rheology, Degradation, Processing, and Characterization of Renewable Resource Polymers. Doctoral Dissertation, Clemson University, Clemson, SC, USA, 2009. [Google Scholar]
- Mansourieh, M.; Farshbaf Taghinezhad, S.; Abbasi, A.; Chen, Y.; Devine, D. A Study on the Degradability and Mechanical–Rheological Correlations of PLA/Silk Composites. J. Compos. Sci. 2024, 8, 428. [Google Scholar] [CrossRef]
- Hadi, N.J.; Abd Alhussein, M.M.; Rydzkowski, T.L. Experimental and numerical simulatuon of non-newtonian in capillary rheometer. Eng. Sci. Technol. Rev. Mater. A 2019, 64–87. [Google Scholar]
- Whba, F.; Mohamed, F.; Idris, M.I.; Yahya, M.S. Surface modification of cellulose nanocrystals (CNCs) to form a biocompatible, stable, and hydrophilic substrate for MRI. Appl. Sci. 2023, 13, 6316. [Google Scholar] [CrossRef]
- Scaffaro, R.; Maio, A.; Gulino, E.F.; Morreale, M.; La Mantia, F.P. The effects of nanoclay on the mechanical properties, carvacrol release and degradation of a PLA/PBAT blend. Materials 2020, 13, 983. [Google Scholar] [CrossRef] [PubMed]
- Fatona, A.; Berry, R.M.; Brook, M.A.; Moran-Mirabal, J.M. Versatile Surface Modification of Cellulose Fibers and Cellulose Nanocrystals through Modular Triazinyl Chemistry. Chem. Mater. 2018, 30, 2424–2435. [Google Scholar]
- Bouafif, H.; Koubaa, A.; Perré, P.; Cloutier, A.; Riedl, B. Wood particle/high-density polyethylene composites: Thermal sensitivity and nucleating ability of wood particles. J. Appl. Polym. Sci. 2009, 113, 593–600. [Google Scholar]
- Díaz-Cruz, C.A.; Caicedo, C.; Jiménez-Regalado, E.J.; Díaz de León, R.; López-González, R.; Aguirre-Loredo, R.Y. Evaluation of the antimicrobial, thermal, mechanical, and barrier properties of corn starch–chitosan biodegradable films reinforced with cellulose nanocrystals. Polymers 2022, 14, 2166. [Google Scholar] [CrossRef]


| Sample Code | Cellulose wt.% | LDPE wt.% | LDPEgMA wt.% | Screw Speed (rpm) | Temperature (°C) | Thickness (µm) |
|---|---|---|---|---|---|---|
| LDPE | 0 | 98 | 2 | 50 | 190 | 25 |
| L1Sawdust 2.5 L1CNC 2.5 L1Powder 2.5 | 2.5 | 95.5 | 2 | 50 | 190 | 27 |
| L2Sawdust 5 L2Powder 5 L2 CNC 5 | 5 | 93 | 2 | 50 | 190 | 28 |
| L3Sawdust 10 L3Powder 10 L3CNC 10 | 10 | 88 | 2 | 50 | 190 | 25 |
| Sample | 2θ (200) | 2θ (110) | CrI% |
|---|---|---|---|
| LDPE | 23.1 | 20.49 | 75 |
| LDPE/5 wt.% CNC | 23.1 | 20.5 | 83.3 |
| Sample | Flow Index (n) | Consistency Index (K) |
|---|---|---|
| LDPE (170 °C) | 0.393 | 20,389 |
| LDPE (190 °C) | 0.336 | 17,514 |
| LDPE (210 °C) | 0.526 | 8955 |
| Sawdust (170 °C) | 0.275 | 43,583 |
| Sawdust (190 °C) | 0.293 | 42,946 |
| Sawdust (210 °C) | 0.320 | 32,902 |
| CNC (170 °C) | 0.267 | 52,680 |
| CNC (190 °C) | 0.285 | 49,290 |
| CNC (210 °C) | 0.279 | 42,570 |
| Powder (170 °C) | 0.285 | 43,135 |
| Powder (190 °C) | 0.298 | 39,747 |
| Powder (210 °C) | 0.321 | 36,618 |
Disclaimer/Publisher’s Note: The statements, opinions and data contained in all publications are solely those of the individual author(s) and contributor(s) and not of MDPI and/or the editor(s). MDPI and/or the editor(s) disclaim responsibility for any injury to people or property resulting from any ideas, methods, instructions or products referred to in the content. |
© 2025 by the authors. Licensee MDPI, Basel, Switzerland. This article is an open access article distributed under the terms and conditions of the Creative Commons Attribution (CC BY) license (https://creativecommons.org/licenses/by/4.0/).
Share and Cite
Hadi, N.J.; Rydzkowski, T.; Ali, Z.S.; Al-Jarwany, Q.A. Correlations Between Crystallinity, Rheological Behavior, and Short-Term Biodegradation for LDPE/Cellulose Composites with Potential as Packaging Films. Coatings 2025, 15, 397. https://doi.org/10.3390/coatings15040397
Hadi NJ, Rydzkowski T, Ali ZS, Al-Jarwany QA. Correlations Between Crystallinity, Rheological Behavior, and Short-Term Biodegradation for LDPE/Cellulose Composites with Potential as Packaging Films. Coatings. 2025; 15(4):397. https://doi.org/10.3390/coatings15040397
Chicago/Turabian StyleHadi, Nizar Jawad, Tomasz Rydzkowski, Zahraa Saleem Ali, and Q. A. Al-Jarwany. 2025. "Correlations Between Crystallinity, Rheological Behavior, and Short-Term Biodegradation for LDPE/Cellulose Composites with Potential as Packaging Films" Coatings 15, no. 4: 397. https://doi.org/10.3390/coatings15040397
APA StyleHadi, N. J., Rydzkowski, T., Ali, Z. S., & Al-Jarwany, Q. A. (2025). Correlations Between Crystallinity, Rheological Behavior, and Short-Term Biodegradation for LDPE/Cellulose Composites with Potential as Packaging Films. Coatings, 15(4), 397. https://doi.org/10.3390/coatings15040397