
Close-Range Photogrammetry and RTI for 2.5D Documentation of Painted Surfaces: A Tiryns Mural Case Study


Abstract
1. Introduction
2. Materials and Methods
2.1. Close-Range Photogrammetry (SfM-MVS)
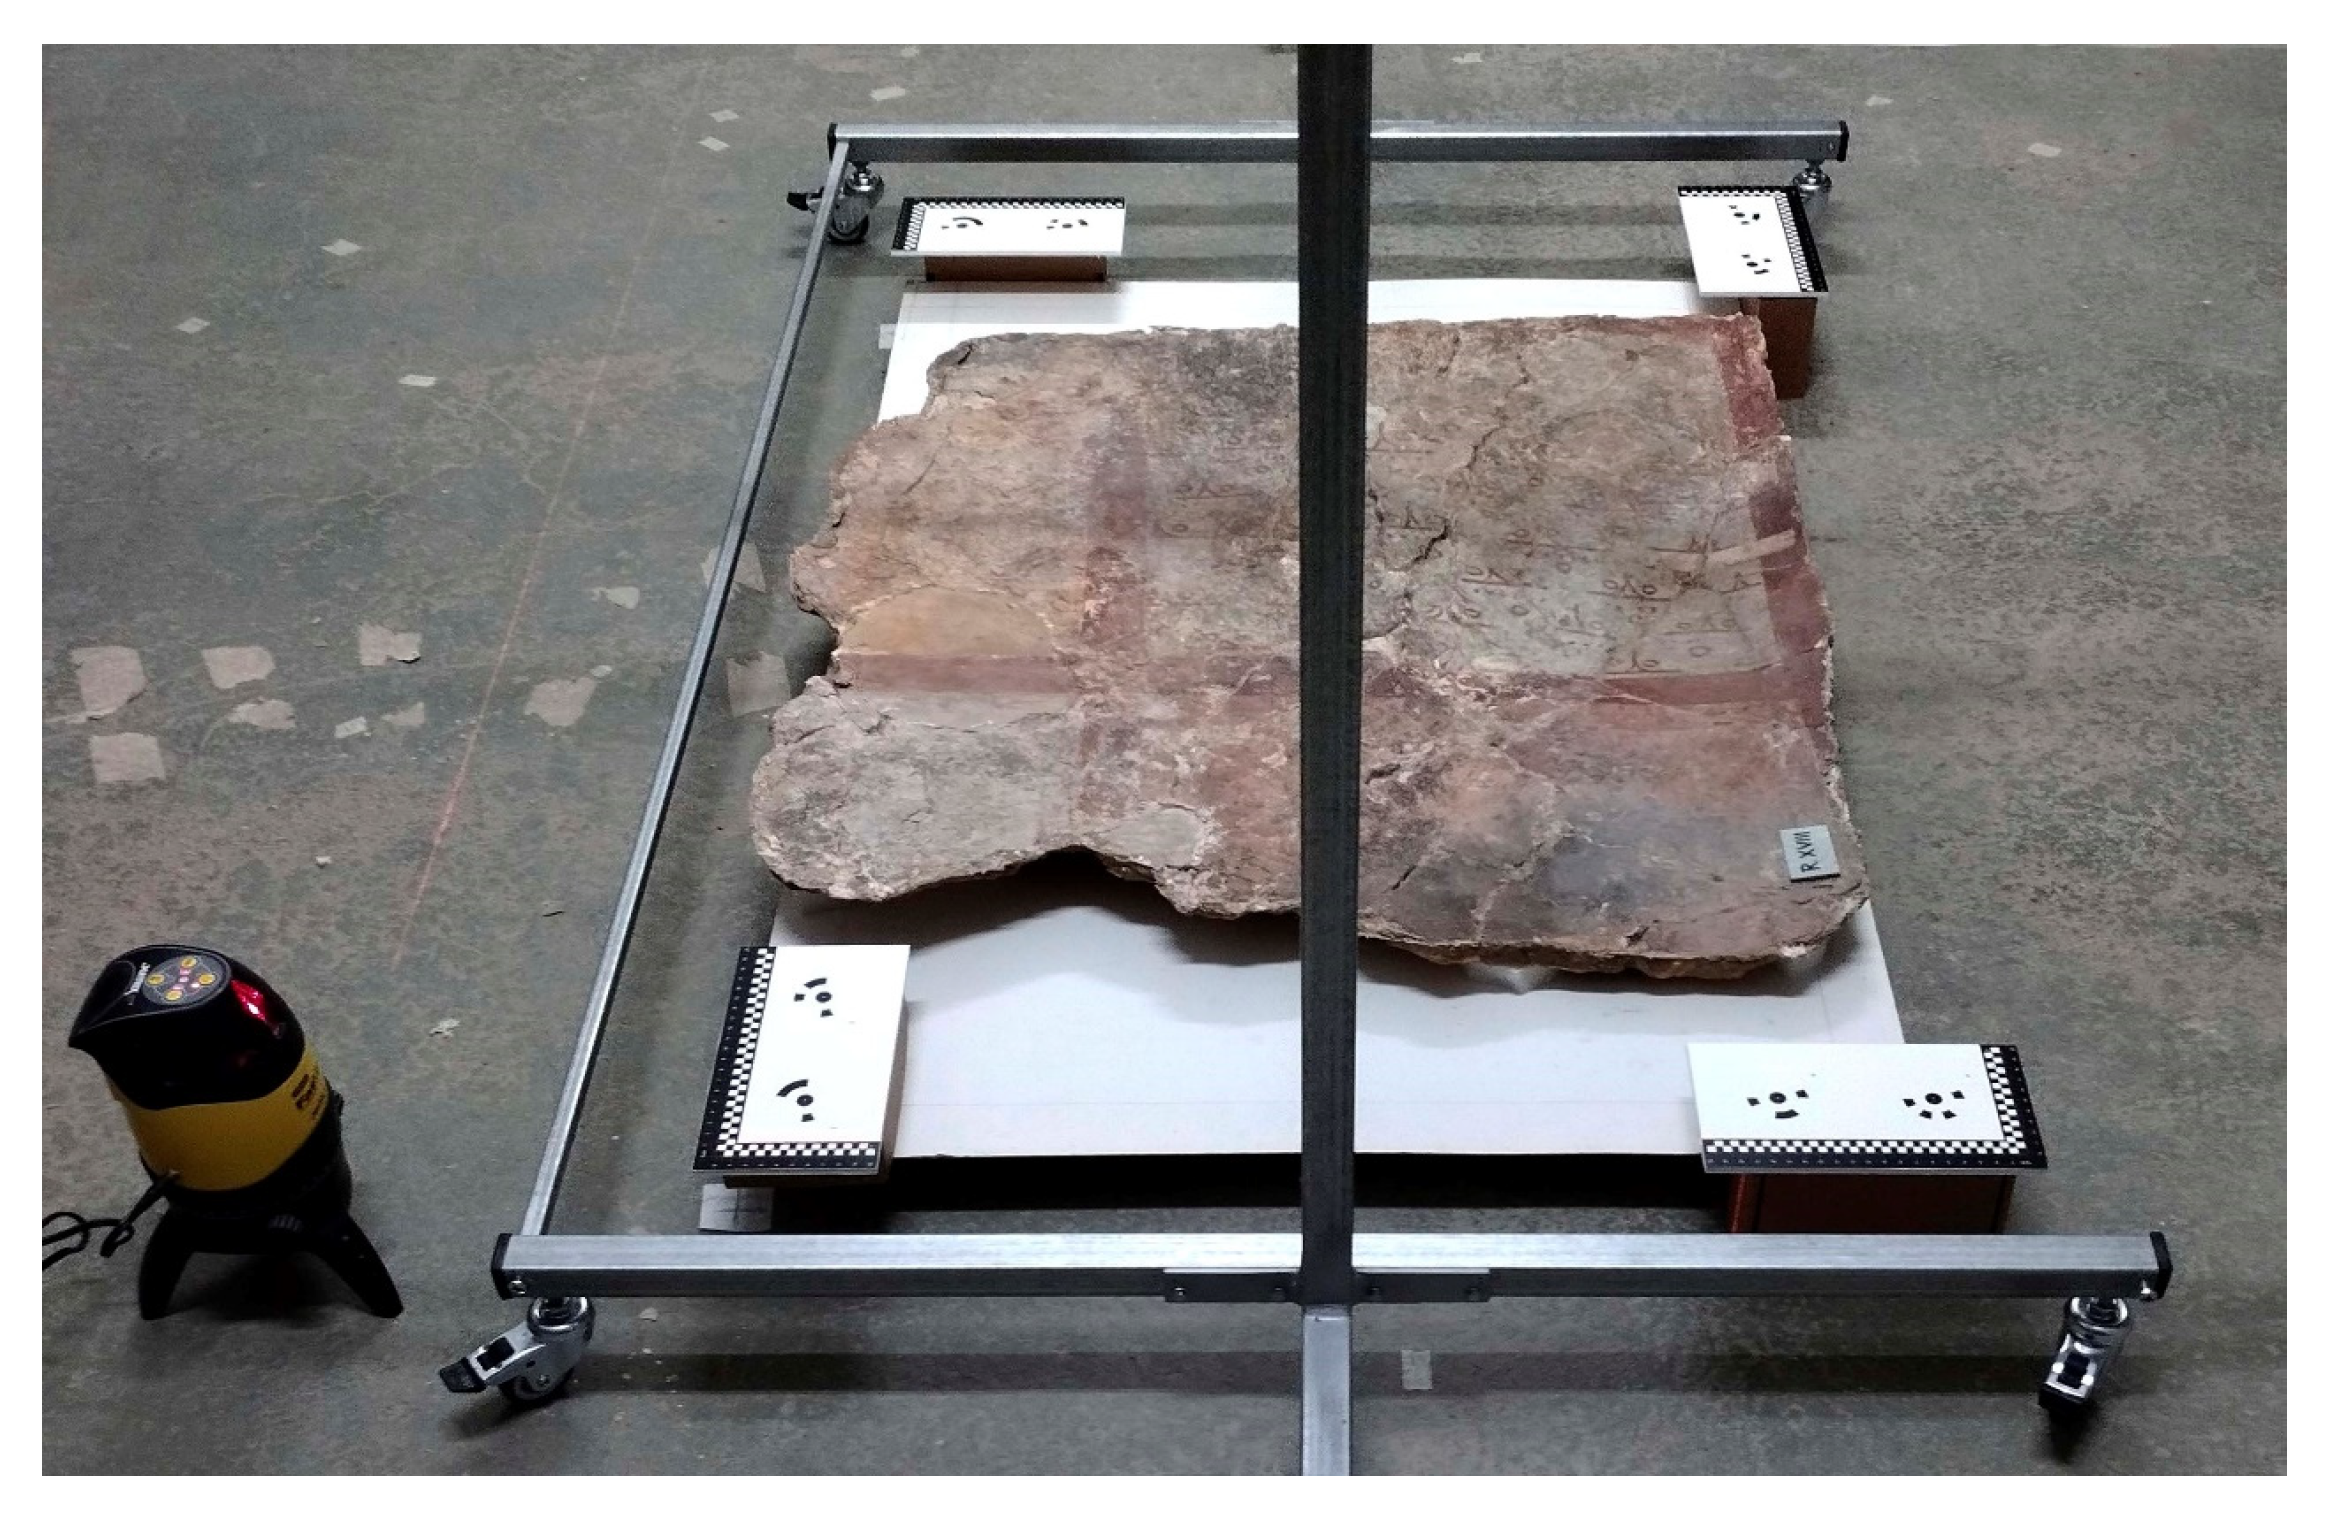
2.1.1. Photogrammetry: Data Acquisition
2.1.2. Photogrammetry: Data Processing
2.2. Reflectance Transformation Imaging (RTI) Technique
2.2.1. RTI: Data Acquisition
2.2.2. RTI: Data Processing
3. Results
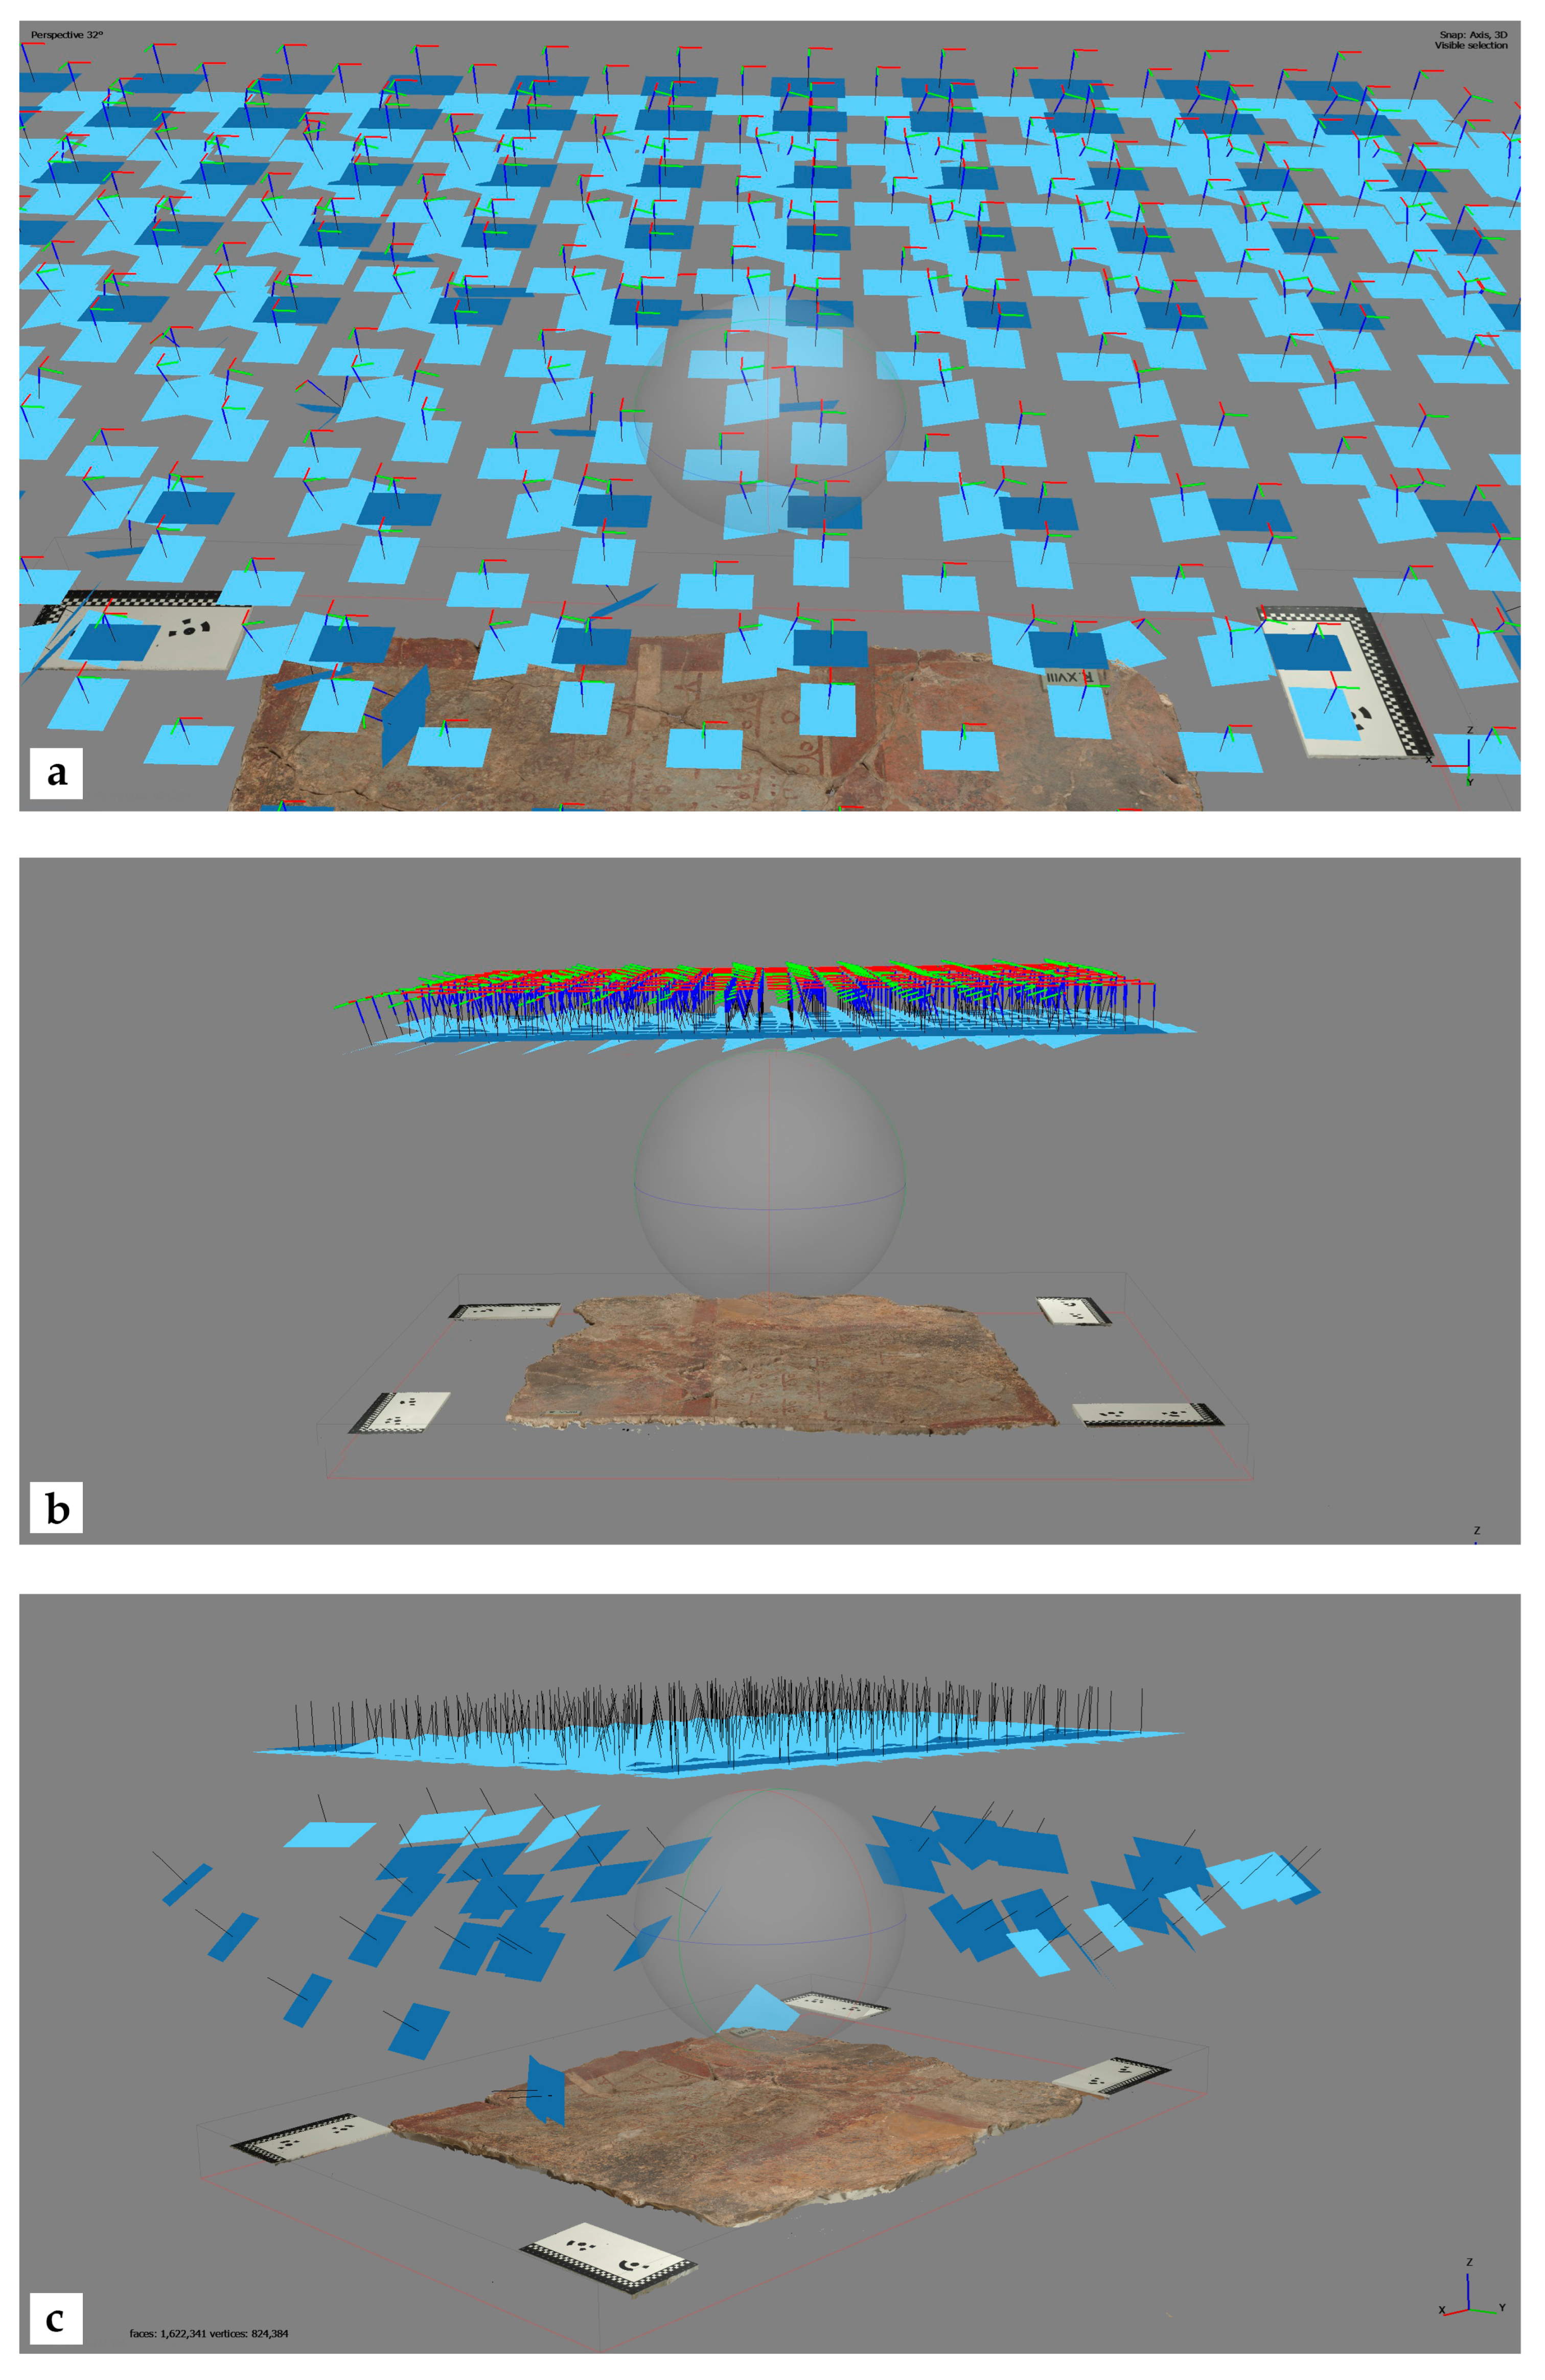
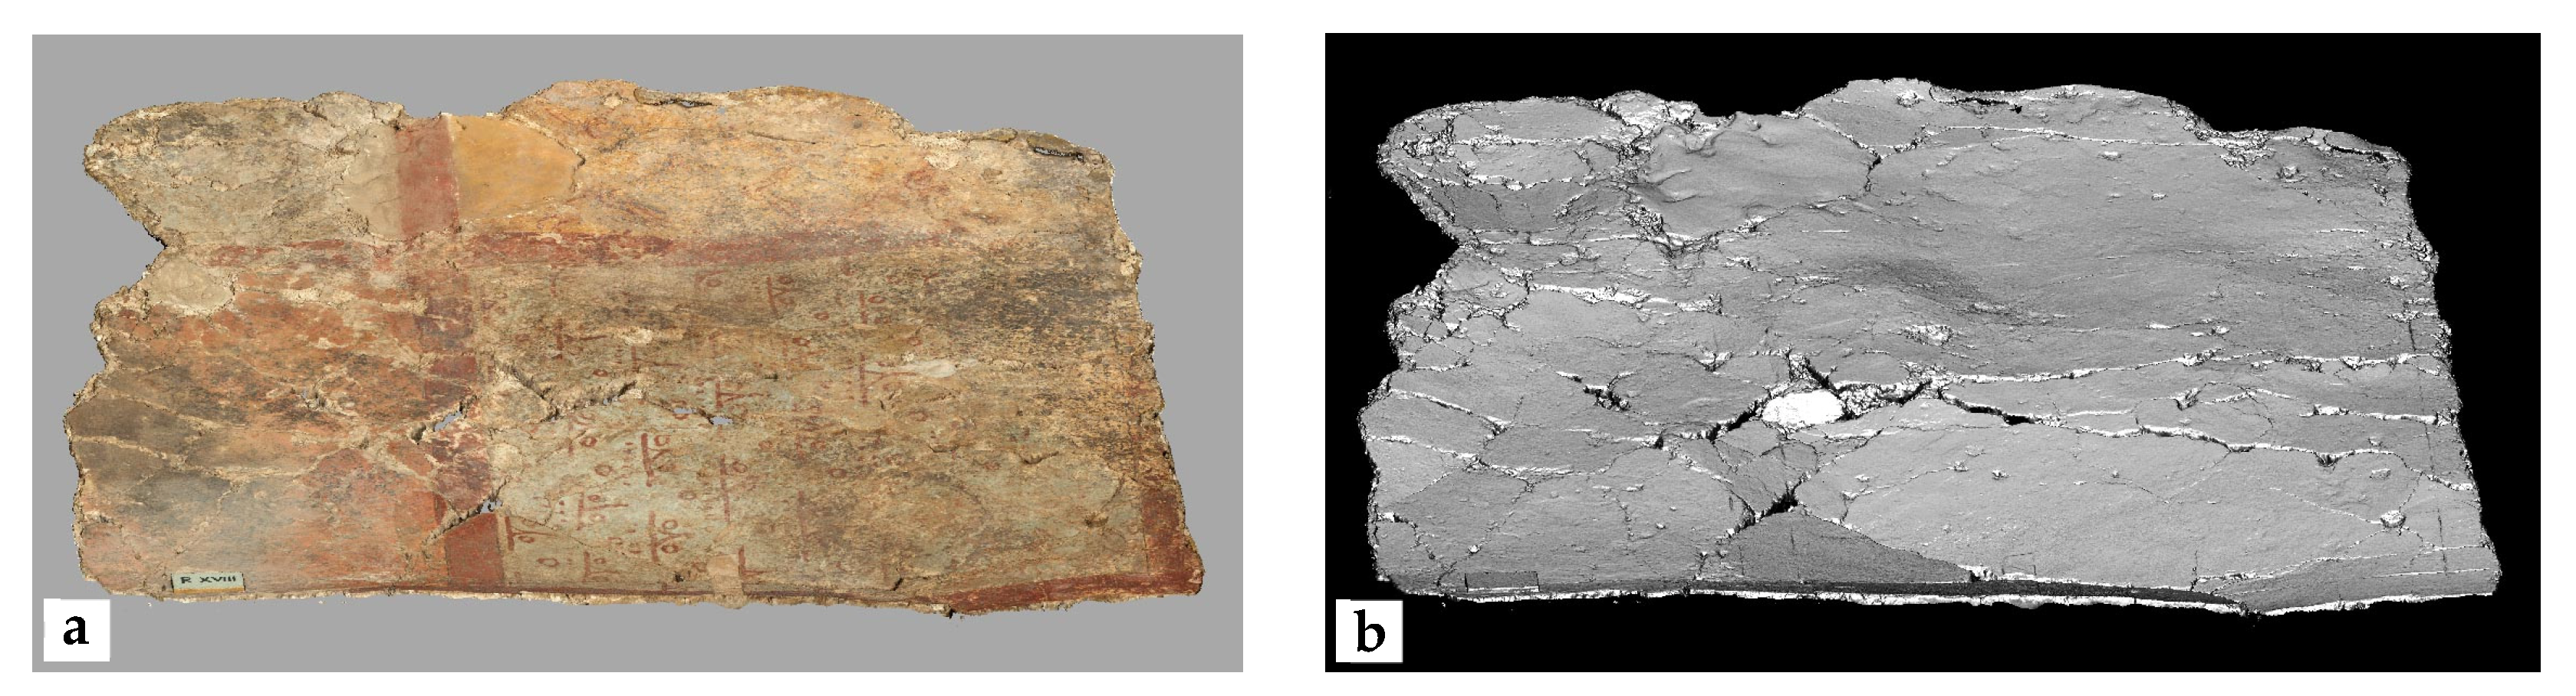
3.1. Photogrammetry Results
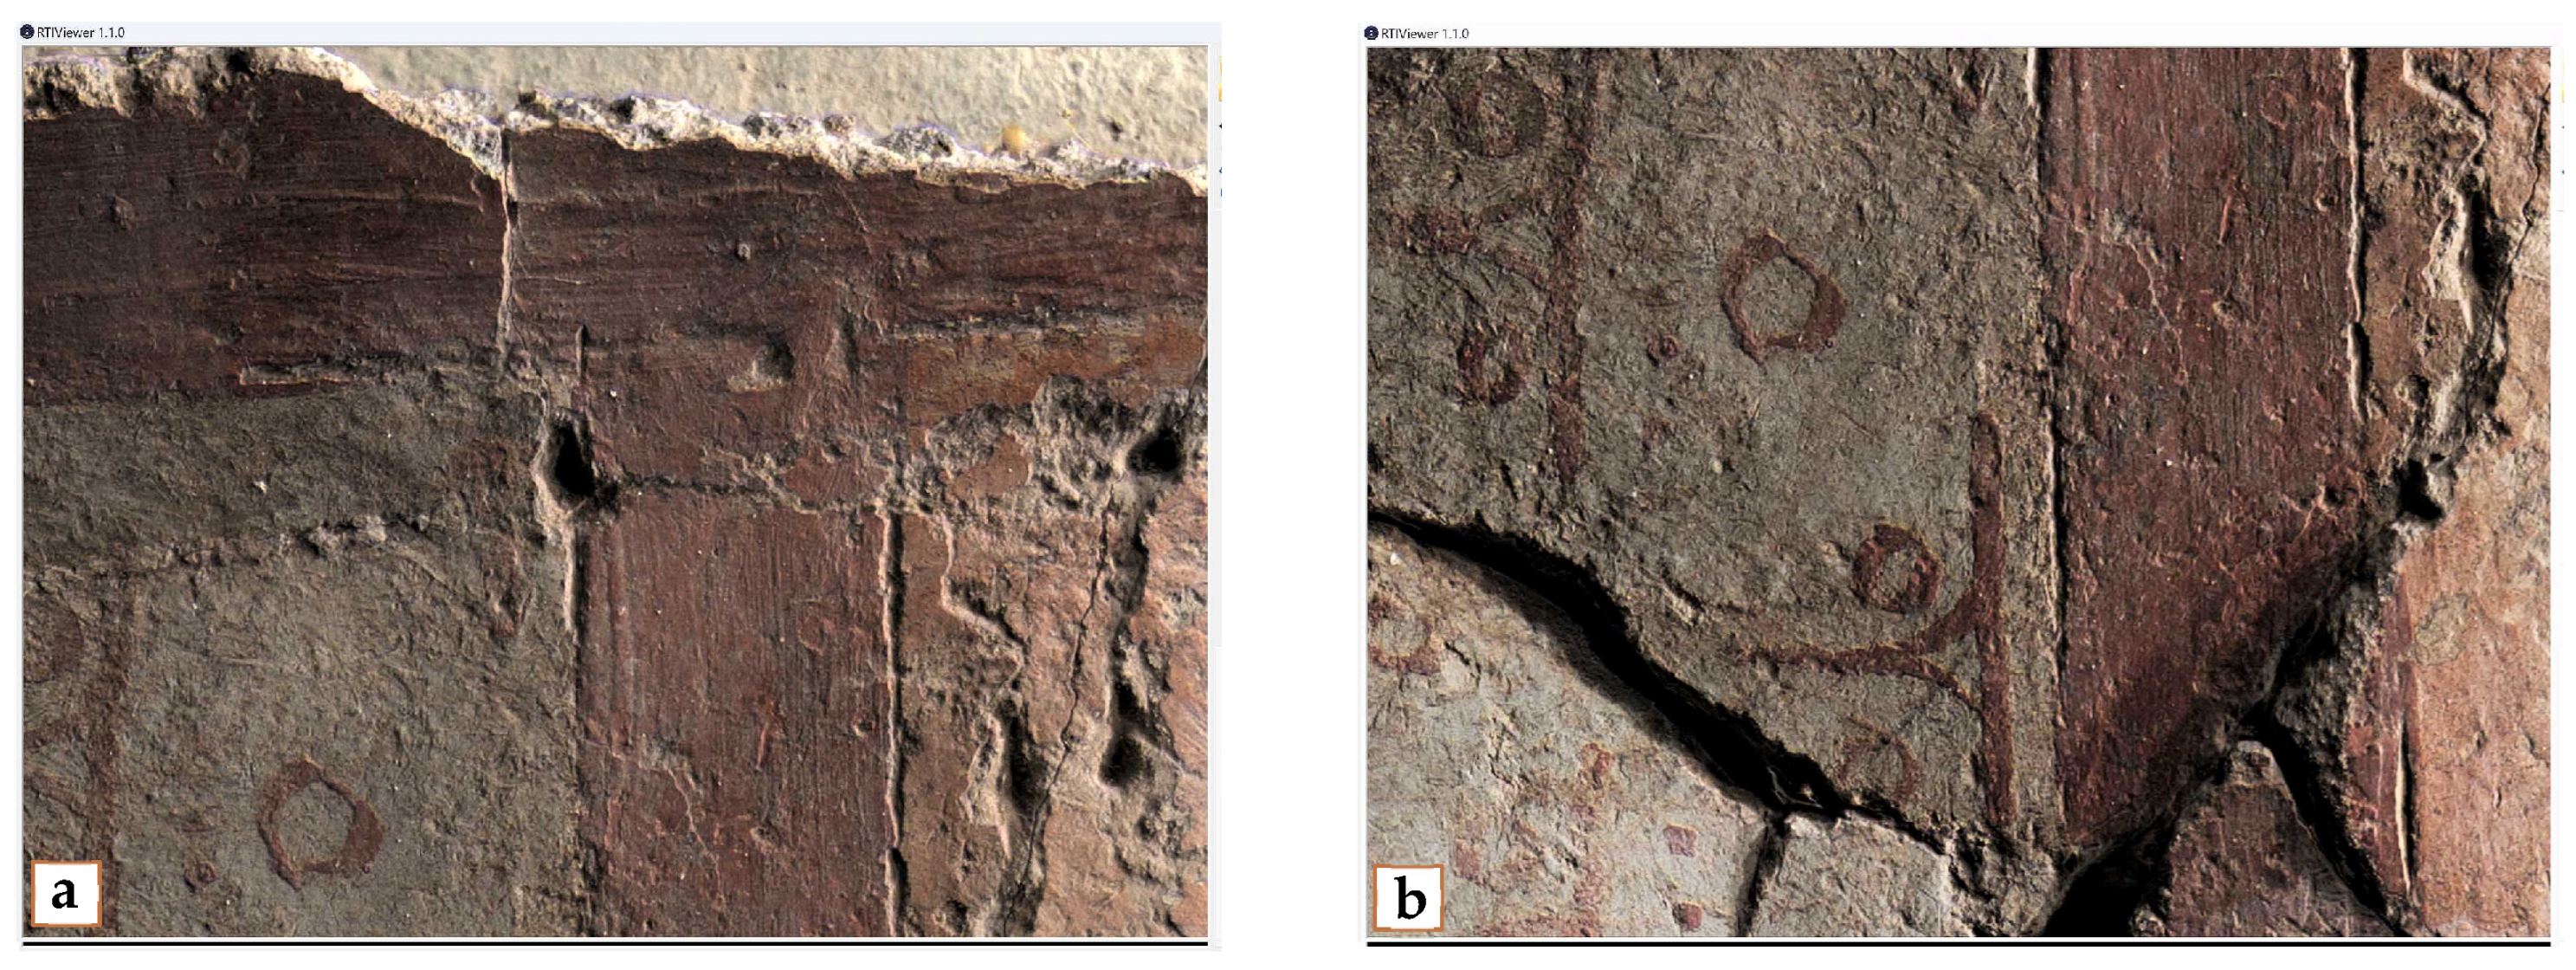
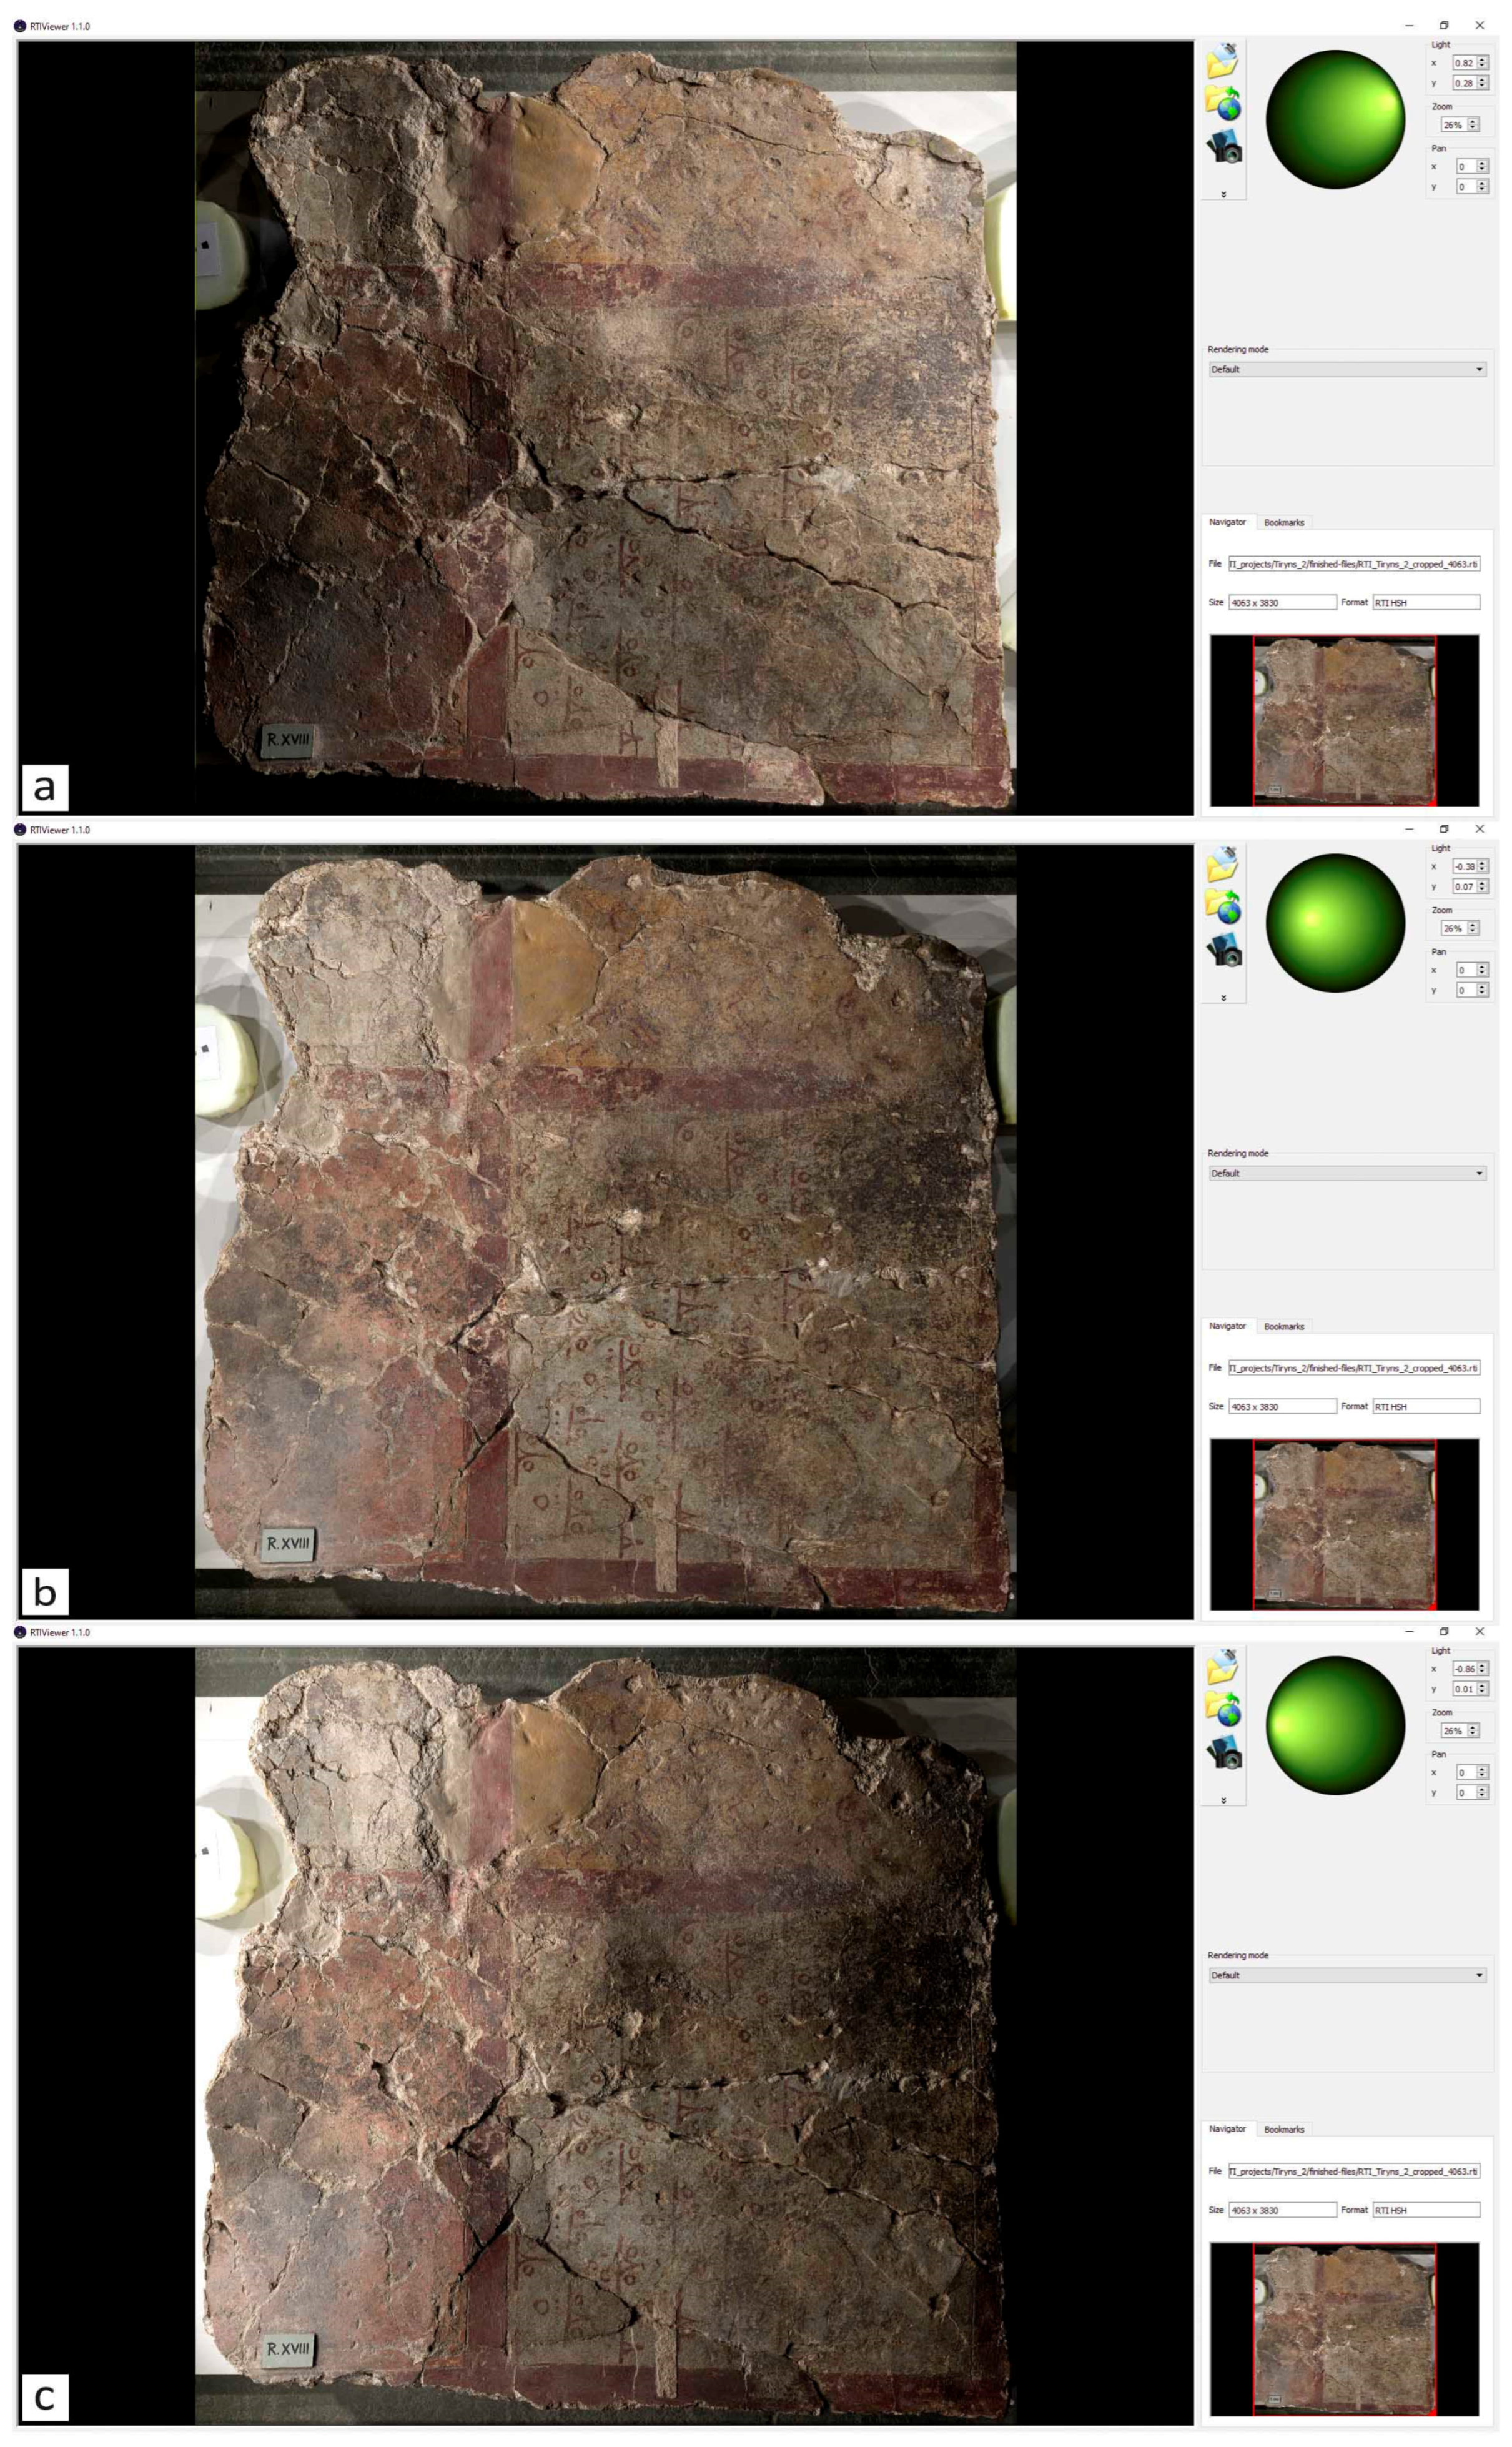
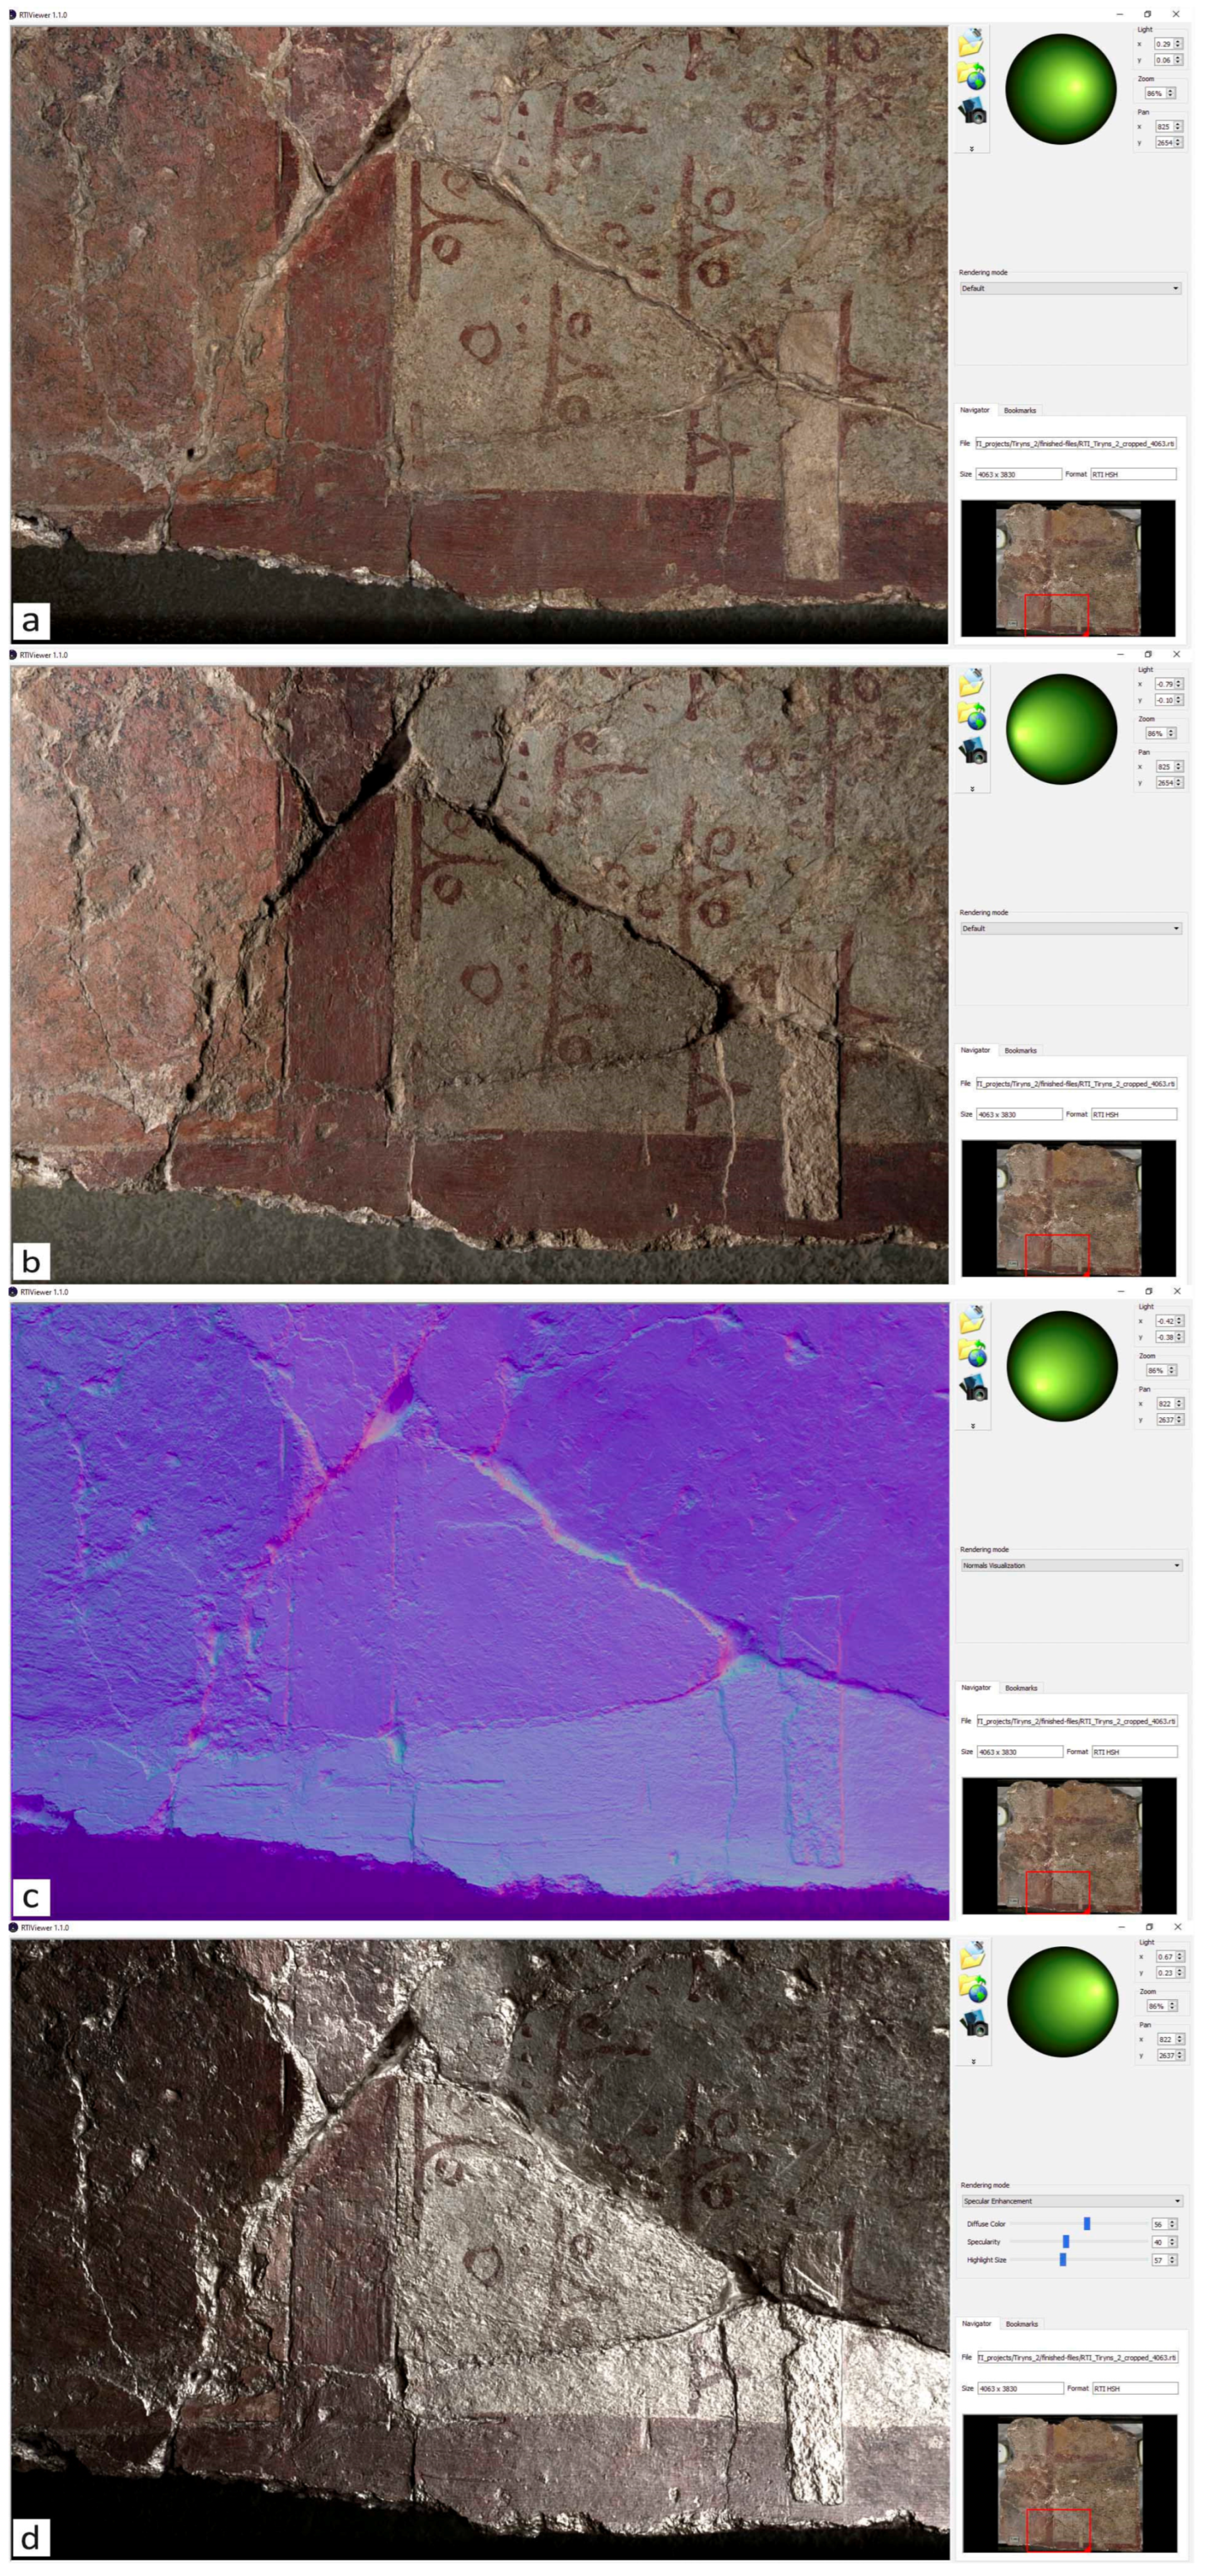
3.2. RTI Results
4. Discussion
5. Conclusions
Author Contributions
Funding
Institutional Review Board Statement
Informed Consent Statement
Data Availability Statement
Acknowledgments
Conflicts of Interest
References
- Koutsoudis, A.; Vidmar, B.; Ioannakis, G.; Arnaoutoglou, F.; Pavlidis, G.; Chamzas, C. Multi-image 3D reconstruction data evaluation. J. Cult. Herit. 2014, 15, 73–79. [Google Scholar]
- Bianconi, F.; Catalucci, S.; Filippucci, M.; Marsili, R.; Moretti, M.; Rossi, G.; Speranzini, E. Comparison between Two Non-Contact Techniques for Art Digitalization. J. Phys. Conf. Ser. 2017, 882, 012005. [Google Scholar]
- Adamopoulos, E.; Rinaudo, F.; Ardissono, L. Ardissono A critical comparison of 3D digitization techniques for heritage objects. ISPRS Int. J. Geo-Inf. 2020, 10, 10. [Google Scholar]
- Abate, D.; Menna, F.; Remondino, F.; Gattari, M. 3D painting documentation: Evaluation of Conservation Conditions with 3D Imaging and Ranging Techniques. ISPRS—Int. Arch. Photogramm. Remote Sens. Spat. Inf. Sci. 2014, 40, 1–8. [Google Scholar]
- Mudge, M.; Malzbender, T.; Schroer, C.; Lum, M. New Reflection Transformation Imaging Methods for Rock Art and Multiple-Viewpoint Display. In Proceedings of the 7th International Symposium on Virtual Reality, Archaeology and Cultural Heritage, VAST, Nicosia, Cyprus, 30 October–4 November 2006; Volume 6, pp. 195–202. [Google Scholar]
- Skarlatos, D.; Kiparissi, S. Comparison of Laser Scanning, Photogrammetry and SFM-MVS Pipeline Applied in Structures and Artificial Surfaces. ISPRS Ann. Photogramm. Remote Sens. Spat. Inf. Sci. 2012, 3, 299–304. [Google Scholar]
- Miles, J.; Pitts, M.; Pagi, H.; Earl, G. Photogrammetry and RTI Survey of Hoa Hakananai’a Easter Island Statue. In Papers from the 41st Conference on Computer Applications and Quantitative Methods in Archaeology; Amsterdam University Press: Amsterdam, The Netherlands, 2013; pp. 144–156. [Google Scholar]
- Porter, S.T.; Huber, N.; Hoyer, C.; Floss, H. Portable and low-cost solutions to the imaging of Paleolithic art objects: A comparison of photogrammetry and reflectance transformation imaging. J. Archaeol. Sci. Rep. 2016, 10, 859–863. [Google Scholar]
- Altaratz, D.; Caine, M.; Maggen, M. Combining RTI & SFM. A Multi-Faceted Approach to Inscription Analysis. In Proceedings of the Electronic Imaging and the Visual Arts Florence, Florence, Italy, 8–9 May 2019. [Google Scholar]
- Kotoula, E.; Robinson, D.W.; Gandy, D.; Jolie, E.A. Computational Photography, 3-D Modeling, and Online Publication of Basketry for Cache Cave, California. Adv. Archaeol. Pract. 2019, 7, 366–381. [Google Scholar]
- Verhoeven, G.; Santner, M.; Trinks, I. From 2D (to 3D) to 2.5 D: Not All Gridded Digital Surfaces are Created Equally. In Proceedings of the 28th CIPA Symposium “Great Learning & Digital Emotion”, Beijing, China, 28 August–1 September 2021; Volume 8, pp. 171–178. [Google Scholar]
- Kraus, K. Photogrammetry: Geometry from Images and Laser Scans, 2nd ed.; Walter de Gruyter: Berlin, Germany, 2007. [Google Scholar]
- Remondino, F.; El-Hakim, S. Image-based 3D modelling: A review. Photogramm. Rec. 2006, 21, 269–291. [Google Scholar]
- Kelley, K.; Wood, R.K.L. Digital Imaging of Artefacts: Developments in Methods and Aims; Archaeopress Publishing Ltd.: Bicester, UK, 2018. [Google Scholar]
- Westoby, M.J.; Brasington, J.; Glasser, N.F.; Hambrey, M.J.; Reynolds, J.M. ‘Structure-from-Motion’photogrammetry: A low-cost, effective tool for geoscience applications. Geomorphology 2012, 179, 300–314. [Google Scholar]
- Remondino, F.; Campana, S. 3D Recording and Modelling in Archaeology and Cultural Heritage Theory and Best Practices; Archaeopress Publishing Ltd.: Bicester, UK, 2014; pp. 65–73. [Google Scholar]
- Fuhrmann, S.; Langguth, F.; Goesele, M. MVE-a multi-view reconstruction environment. GCH 2014, 3, 4. [Google Scholar]
- Iglhaut, J.; Cabo, C.; Puliti, S.; Piermattei, L.; O’Connor, J.; Rosette, J. Structure from motion photogrammetry in forestry: A review. Curr. For. Rep. 2019, 5, 155–168. [Google Scholar]
- Solem, D.E.; Nau, E. Two new ways of documenting miniature incisions using a combination of image-based modelling and reflectance transformation imaging. Remote. Sens. 2020, 12, 1626. [Google Scholar] [CrossRef]
- Frey, F.S.; Warda, J.; Heller, D.; Kushel, D.; Vitale, T.; Weaver, G. The AIC Guide to Digital Photography and Conservation Documentation; American Institute for Conservation of Historic and Artistic Works: Washington, DC, USA, 2017. [Google Scholar]
- Alexopoulou-Agoranou, A.; Chrysoulakis, Y. Sciences and Artworks; Gonis, N., Ed.; Gonis: Athens, Greece, 1993. [Google Scholar]
- Padfield, J.; Saunders, D.; Malzbender, T. Polynomial texture mapping: A new tool for examining the surface of paintings. ICOM Comm. Conserv. 2005, 1, 504–510. [Google Scholar]
- Woodham, R.J. Photometric method for determining surface orientation from multiple images. Opt. Eng. 1980, 19, 139–144. [Google Scholar] [CrossRef]
- Malzbender, T.; Gelb, D.; Wolters, H. Polynomial texture maps. In Proceedings of the 28th Annual Conference on Computer Graphics and Interactive Techniques, ACM, Los Angeles, CA, USA, 12–17 August 2001; pp. 519–528. [Google Scholar] [CrossRef]
- Frank, E. Documenting Archaeological Textiles with Reflectance Transformation Imaging (RTI). Archaeol. Text. Rev. 2014, 56, 3–13. [Google Scholar]
- MacDonald, L.; Robson, S. Polynomial texture mapping and 3d representations. Int. Arch. Photogramm. Remote Sens. Spat. Inf. Sci. 2010, 38, 422–427. [Google Scholar]
- Schädel, M.; Yavorskaya, M.; Beutel, R. The earliest beetle† Coleopsis archaica (Insecta: Coleoptera)–morphological re-evaluation using Reflectance Transformation Imaging (RTI) and phylogenetic assessment. Arthropod Syst. Phylogeny 2022, 80, 495–510. [Google Scholar]
- Happa, J.; Mudge, M.; Debattista, K.; Artusi, A.; Gonçalves, A.; Chalmers, A. Illuminating the past: State of the art. Virtual Real. 2010, 14, 155–182. [Google Scholar]
- Cultural Heritage Imaging (CHI), 2002–2025. [En línea]. Available online: https://culturalheritageimaging.org/ (accessed on 16 January 2022).
- Rodenwaldt, G.; Hackl, R.; Heaton, N. Die Fresken des Palastes, 2; von Zabern, P., Ed.; Eleutheroudakis and Barth: Athens, Greece, 1912. [Google Scholar]
- Thaler, U. Mykene—Die Sagenhafte Welt des Agamemnon; Wbg Philipp von Zabern in Wissenschaftliche Buchgesellschaft (WBG): Darmstadt, Germany, 2018; p. 391. [Google Scholar]
- Hirsch, E.S. Painted and Decorated Floors on the Greek Mainland and Crete in the Bronze Age. 1974. Available online: https://orb.binghamton.edu/dissertation_and_theses/262/ (accessed on 2 October 2022).
- Blegen, C.W. Korakou: A Prehistoric Settlement Near Corinth; American School of Classical Studies at Athens: Boston, MA, USA, 1921. [Google Scholar]
- Sturgis, R.; Schliemann, H.; Oxon, D.C.L. Tiryns: The Prehistoric Palace of the Kings of Tiryns, the Results of the Latest Excavations; Harper & Brothers: New York, NY, USA, 1886; Volume 2, p. 75. [Google Scholar]
- Homerus. Homēri Odyssea: Scholarum in Usum; Cauer, P., Ed.; G. Freytag: Lipsiae, Germany, 1887. [Google Scholar]
- Hirsch, E.S. Another look at Minoan and Mycenaean interrelationships in floor decoration. Am. J. Archaeol. 1980, 84, 453–462. [Google Scholar]
- Hackl, R. Die Fußboden. In Tiryns: Die Ergebnisse der Ausgrabungen des Instituts (Band 2): Die Fresken des Palastes; Rodenwaldt, G., Ed.; Eleutheroudakis and Barth: Athens, Greece, 1912; pp. 222–237. [Google Scholar]
- Ullman, S. The interpretation of structure from motion. Proceedings of the Royal Society of London. Ser. B. Biol. Sci. 1979, 203, 405–426. [Google Scholar]
- Furukawa, Y.; Hernández, C. Multi-view stereo: A tutorial. Found. Trends® Comput. Graph. Vis. 2015, 9, 1–148. [Google Scholar] [CrossRef]
- Verhoeven, G. Taking computer vision aloft–archaeological three-dimensional reconstructions from aerial photographs with photoscan. Archaeol. Prospect. 2011, 18, 67–73. [Google Scholar] [CrossRef]
- Verhoeven, G.; Doneus, M.; Briese, C.; Vermeulen, F. Mapping by matching: A computer vision-based approach to fast and accurate georeferencing of archaeological aerial photographs. J. Archaeol. Sci. 2012, 39, 2060–2070. [Google Scholar] [CrossRef]
- De Reu, J.; De Clercq, W.; Sergant, J.; Deconynck, J.; Laloo, P. Orthophoto mapping and digital surface modeling for archaeological excavations an image-based 3D modeling approach. In 2013 Digital Heritage International Congress (DigitalHeritage); IEEE: Piscateville, NJ, USA, 2013. [Google Scholar]
- Olson, B.R.; A Placchetti, R.; Quartermaine, J.; E Killebrew, A. The Tel Akko Total Archaeology Project (Akko, Israel): Assessing the suitability of multi-scale 3D field recording in archaeology. J. Field Archaeol. 2013, 38, 244–262. [Google Scholar] [CrossRef]
- Green, S.; Bevan, A.; Shapland, M. A comparative assessment of structure from motion methods for archaeological research. J. Archaeol. Sci. 2014, 46, 173–181. [Google Scholar] [CrossRef]
- Szeliski, R. Computer Vision: Algorithms and Applications; Springer: Berlin/Heidelberg, Germany, 2022. [Google Scholar]
- Verhoeven, G.; Doneus, N.; Doneus, M.; Štuhec, S. From Pixel to Mesh: Accurate and Straightforward 3D Documentation of Cultural Heritage from the Cres/Lošinj Archipelago. In Istraživanja na otocima; Hrvatsko arheološko društvo: Lošinjski muzej, Croatia, 2015; Volume 30, pp. 165–176. [Google Scholar]
- Barnes, A. Digital Photogrammetry. Encycl. Archaeol. Sci. 2018, 1–4. [Google Scholar]
- Georgopoulos, A. Photogrammetric automation: Is it worth? Mediterr. Archaeol. Archaeom. 2016, 16, 11. [Google Scholar]
- Tsairis, G. Development of a Methodology for the Digital Documentation of Fragile Paintings: Utilizing a Low-Cost, Custom-made, Portable Construction for Various Applications in Cultural Heritage Management. In Book of Abstracts 5th Panhellenic Conference on Cultural Heritage Digitization—EUROMED; EU: Larissa, Greece, 2024. [Google Scholar]
- Linder, W. Digital Photogrammetry; Springer: Berlin/Heidelberg, Germany, 2016. [Google Scholar]
- Luhmann, T.; Robson, S.; Kyle, S.; Boehm, J. Close-Range Photogrammetry and 3D Imaging; Walter de Gruyter GmbH & Co KG: Berlin, Germany, 2023. [Google Scholar]
- Förstner, W.; Wrobel, B.P. Photogrammetric Computer Vision; Springer: Berlin/Heidelberg, Germany, 2016. [Google Scholar]
- Agisoft, L.L.C. Agisoft Metashape User Manual: Professional Edition, Version 2.0; Agisoft: St. Petersburg, Russia, 2023. [Google Scholar]
- Lowe, D.G. Object recognition from local scale-invariant features. Proc. Seventh IEEE Int. Conf. Comput. Vis. 1999, 2, 1150–1157. [Google Scholar]
- Stylianidis, E.; Remondino, F. 3D Recording, Documentation and Management of Cultural Heritage; Whittles Publishing: Dunbeath, UK, 2016. [Google Scholar]
- Verhoeven, G. Resolving some spatial resolution issues: Part 1: Between line pairs and sampling distance. AARGnews 2018, 25–34. [Google Scholar]
- Patias, P.; Karras, G. Modern Photogrammetric Practices in Architecture and Archaeology Applications; Diptycho Publications: Thessaloniki, Greece, 1995. [Google Scholar]
- Hecht, E. Optics, 5th ed.; Pearson: Boston, MA, USA, 2017; Available online: https://emineter.wordpress.com/wp-content/uploads/2020/04/hecht-optics-5ed.pdf (accessed on 9 May 2023).
- Earl, G.; Beale, G.; Martinez, K.; Pagi, H. Polynomial texture mapping and related imaging technologies for the recording, analysis and presentation of archaeological materials. Int. Arch. Photogramm. Remote Sens. Spat. Inf. Sci. 2010, 38, 218–223. [Google Scholar]
- Malzbender, T.; Gelb, D.; Wolters, H.; Zuckerman, B. Enhancement of Shape Perception by Surface Reflectance Transformation. 2004. Available online: https://www.researchgate.net/publication/220839189_Enhancement_of_Shape_Perception_by_Surface_Reflectance_Transformation (accessed on 3 October 2022).
- Zányi, E.; Schroer, C.; Mudge, M.; Chalmers, A. Lighting and Byzantine Glass Tesserae. In Proceedings of the EVA London Conference, London, UK, 11–13 July 2007. [Google Scholar]
- Cultural Heritage Imaging Reflectance Transformation Imaging (RTI). 2002–2025. [En línea]. Available online: https://culturalheritageimaging.org/Technologies/RTI/ (accessed on 16 January 2022).
- England, H. Multi-Light Imaging for Cultural Heritage; Historic England: Swindon, UK, 2018. [Google Scholar]
- Cultural Heritage Imaging Reflectance Transformation Imaging: Guide to Highlight Image Capture v2.0; CulturalHeritage Imaging: San Francisco, CA, USA, 2013.
- Granshaw, S.I. Photogrammetric terminology: Fourth edition. Photogramm. Rec. 2020, 35, 143–288. [Google Scholar] [CrossRef]
- Grieves, M. Digital Twin: Manufacturing Excellence Through Virtual Factory Replication. White Paper 2014, 1, 1–7. [Google Scholar]


| Project | Camera Position | According to Figure 3 | Number of Images | Altitude (mm) | Ground Resolution (mm/pix) | Tie Points | Reprojection Error (pix) | F Error (pix) | Scale Bars Error (m) |
|---|---|---|---|---|---|---|---|---|---|
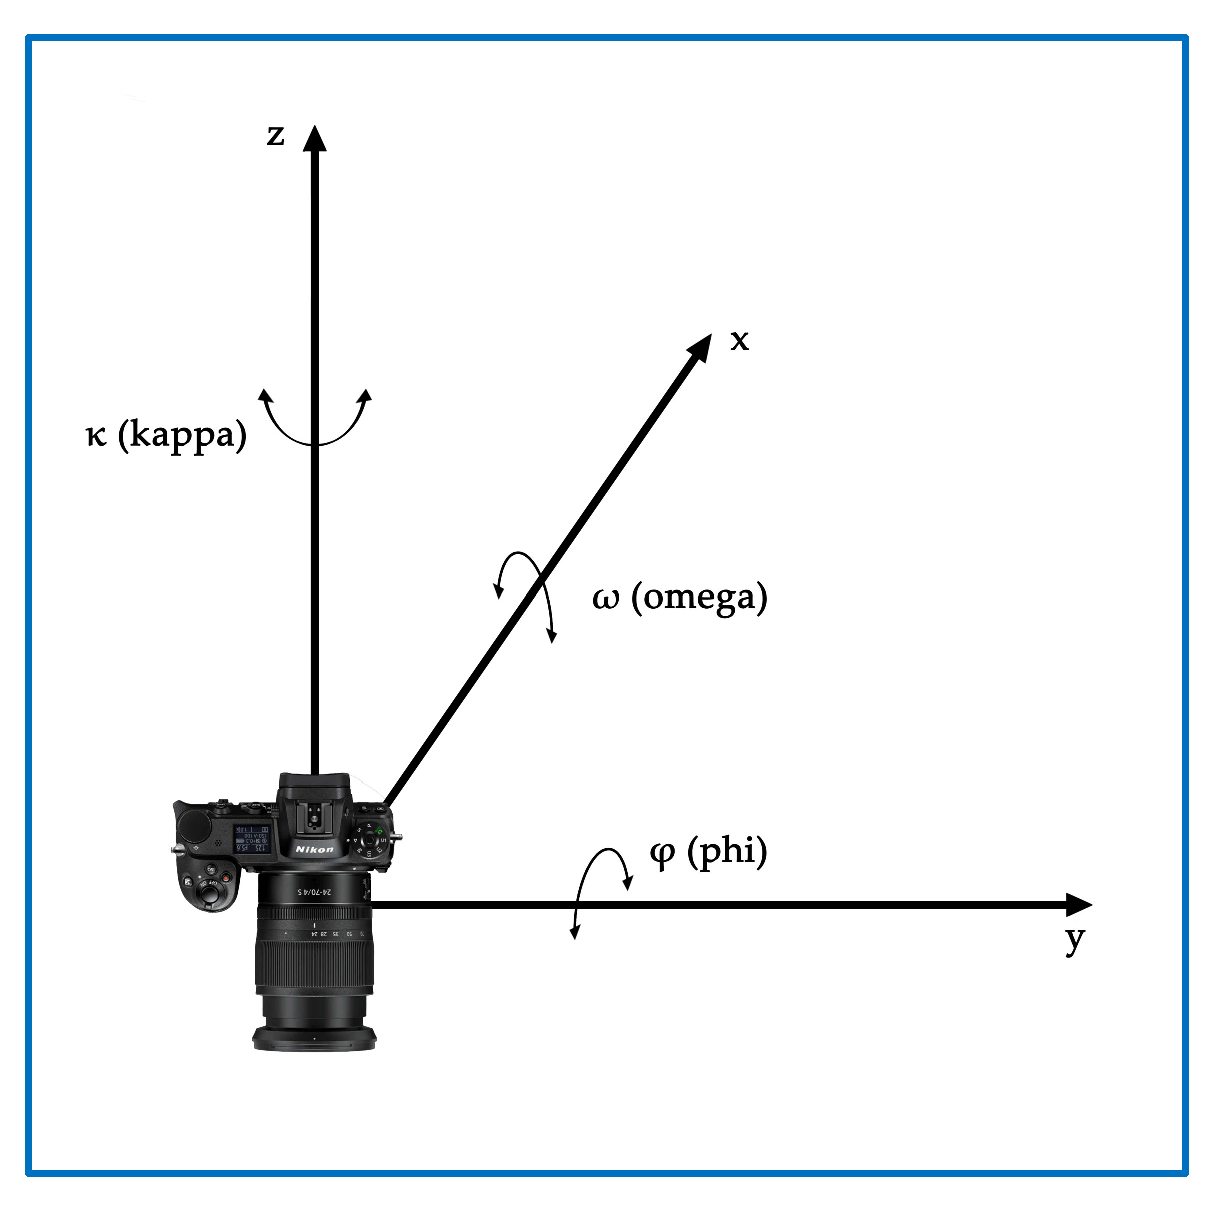
| D850 Tiryns | Parallel, No targets Parallel, targets Turn 90° Tilt 15° Tilt −15° Oblique | ω = 0°, φ = 0°, κ = 0° ω = 0°, φ = 0°, κ = 0° ω = 0°, φ = 0°, κ = 90° ω = 0°, φ = 15°, κ = 90° ω = 0°, φ = −15°, κ = 90° | 89 107 84 75 64 49 | 715 | 0.0555 | 100,784 | 1 | 0.12 | 0.000013 |
Disclaimer/Publisher’s Note: The statements, opinions and data contained in all publications are solely those of the individual author(s) and contributor(s) and not of MDPI and/or the editor(s). MDPI and/or the editor(s) disclaim responsibility for any injury to people or property resulting from any ideas, methods, instructions or products referred to in the content. |
© 2025 by the authors. Licensee MDPI, Basel, Switzerland. This article is an open access article distributed under the terms and conditions of the Creative Commons Attribution (CC BY) license (https://creativecommons.org/licenses/by/4.0/).
Share and Cite
Tsairis, G.; Alexopoulou, A.G.; Zacharias, N.; Kakoulli, I. Close-Range Photogrammetry and RTI for 2.5D Documentation of Painted Surfaces: A Tiryns Mural Case Study. Coatings 2025, 15, 388. https://doi.org/10.3390/coatings15040388
Tsairis G, Alexopoulou AG, Zacharias N, Kakoulli I. Close-Range Photogrammetry and RTI for 2.5D Documentation of Painted Surfaces: A Tiryns Mural Case Study. Coatings. 2025; 15(4):388. https://doi.org/10.3390/coatings15040388
Chicago/Turabian StyleTsairis, Georgios, Athina Georgia Alexopoulou, Nicolaos Zacharias, and Ioanna Kakoulli. 2025. "Close-Range Photogrammetry and RTI for 2.5D Documentation of Painted Surfaces: A Tiryns Mural Case Study" Coatings 15, no. 4: 388. https://doi.org/10.3390/coatings15040388
APA StyleTsairis, G., Alexopoulou, A. G., Zacharias, N., & Kakoulli, I. (2025). Close-Range Photogrammetry and RTI for 2.5D Documentation of Painted Surfaces: A Tiryns Mural Case Study. Coatings, 15(4), 388. https://doi.org/10.3390/coatings15040388