Article

Investigation of Asphalt Mixture Balanced Design Method Based on Intermediate Layer Properties

by
Jie Yu
1,2,
Xinhe Hu
1,*,
Qi Mao
3,
Xianglong Chen
4,
Gang Cheng
1 and
Yong Zheng
5
1
School of Architectural Engineering, College of Post and Telecommunication of WIT, Wuhan 430073, China
2
School of Civil and Hydraulic Engineering, Chongqing University of Science and Technology, Chongqing 401331, China
3
School of Civil Engineering and Architecture, Wuhan Institute of Technology, Wuhan 430205, China
4
China Harbour Engineering Company Ltd., Beijing 100027, China
5
College of River and Ocean Engineering, Chongqing Jiaotong University, Chongqing 400074, China
*
Author to whom correspondence should be addressed.
Coatings 2025, 15(4), 384; https://doi.org/10.3390/coatings15040384
Submission received: 4 March 2025 / Revised: 21 March 2025 / Accepted: 24 March 2025 / Published: 25 March 2025

Abstract

:
The determination of the optimal asphalt content in aggregate mix design is currently conducted independently of the pavement structure. This approach fails to consider the characteristics of the pavement structure, such as layer positioning and thickness. As a result, there is a significant disconnect between the structural design of asphalt pavements and the material design of the mixtures. This limitation hampers the full and effective utilization of the deformation and crack resistance capabilities of each layer of asphalt mixture. To address this issue, this study focuses on the commonly used AC-20 asphalt mixture in the intermediate layer of asphalt pavements. The Hamburg wheel tracking test (HWTT) and overlay test (OT) were employed to evaluate the high-temperature rutting resistance and low-temperature crack resistance of the mixture, respectively. The effective range of asphalt content was first established through these tests. Additionally, the VESYS rutting prediction model was utilized to obtain the permanent deformation parameters of the asphalt mixture through experimental data. The rutting prediction was calculated based on the deflection values at the top and bottom of the asphalt layer. The optimal range of asphalt content for the intermediate layer was then determined by combining the rutting contribution rate derived from a finite element model with the allowable rut depth value for the intermediate layer. By considering the characteristics of the asphalt layer position and achieving a relative balance between the crack resistance and deformation resistance capabilities of the asphalt mixture, this study proposes a new design method for determining the optimal asphalt content. This method is of great significance for subsequent engineering applications. The feasibility of this design method was demonstrated using the intermediate layer of asphalt pavement on high-grade highways as an example. The research results show that the asphalt content designed by the balanced design method (BDM), based on the rutting resistance performance of the intermediate layer for this pavement structure and material type, is 4.3%–4.6%. In actual engineering practice, it is recommended to use 4.4% as the optimal asphalt content for AC-20.

1. Introduction

Ruts and cracks are the two primary issues affecting roads. Ruts are related to the asphalt mixture’s ability to resist permanent deformation, while cracks are associated with the mixture’s resistance to fracture. The asphalt content directly influences these two properties: a higher asphalt content enhances the mixture’s crack resistance, whereas a lower content improves its resistance to deformation. The high or low asphalt content in asphalt mixtures creates a conflict between deformation resistance and cracking resistance. There should be a balance point where these properties are equated. Unfortunately, current design methods for determining optimal asphalt content do not achieve this balance well. This is mainly due to two reasons: firstly, these methods are based on air voids ratio or asphalt film thickness, which do not inherently balance stability and cracking resistance; secondly, the criteria for determining optimal asphalt content lack uniformity, leading to inconsistent results. Asphalt pavement structures are layered, with different mechanical properties in each layer, resulting in varying deformation and cracking characteristics. For instance, in a three-layer asphalt pavement, the middle layer is most prone to rutting, while the lower layer is crucial for preventing reflective and fatigue cracks. Additionally, the thickness of each layer affects the pavement’s overall cracking and deformation resistance. Current asphalt mixture design methods do not adequately consider these structural factors, leading to a disconnect between pavement structure design and mixture material design. This results in an underutilization of each layer’s potential for deformation and cracking resistance. Therefore, for a hot mix asphalt (HMA) overlay to perform effectively, it must achieve a balance between adequate resistance to both ruts and cracks. Additionally, each asphalt layer possesses unique properties. The deformation and crack resistance characteristics vary from layer to layer, necessitating different asphalt content requirements for each layer. The optimum asphalt content can be estimated using theoretical formulas, but due to the variability in actual material properties, these formulas only provide a rough estimate. The final optimum asphalt content must be determined experimentally. Methods for determining the optimum asphalt content include the Marshall method, Superpave method, Hveem method, French LCPC method, and the TxDOT method used in Texas, USA. All these methods are based on the high-temperature performance of asphalt mixtures and do not adequately consider cracking characteristics. Additionally, different methods can yield significantly different optimum asphalt contents for the same materials. Regardless of the method used, the goal is the same: to design asphalt mixtures with good deformation resistance, cracking resistance, water stability, aging resistance, and ease of construction.
In the past, HMA designs, such as the Marshall method, focused solely on rutting resistance. Superpave mixtures were often too dry, frequently associated with cracking issues, such as reflective and top-down cracking. In 2006, Zhou [1] first proposed a balanced design that considered both rutting and cracking resistance. Subsequently, Scullion and Hu [2] used this method to design extremely thin asphalt mixtures and applied the results to road profiles based on their research findings. At the same time, Walubita and Hu [3,4] compared the balanced design method (BDM) of TxDOT through laboratory evaluation. The results showed that the balanced design was more effective. Reflective cracking is one of the major forms of deterioration in pavement and is very common when HMA overlays are constructed over a base with discontinuities in its surface. Idris et al. [5] conducted an in-depth review of the available literature and evaluated 17 reflective cracking testing devices, among which the best three were chosen based on their availability, ease of use, variability, repeatability of the test results, and field validation.
Fatigue cracking, a major distress in asphalt pavements, is worsened by traffic and climate conditions, such as moisture effects on constituents and interfacial properties. Silva et al. [6] conducted more tests to assess moisture-induced damage effects on asphaltic materials, focusing on the failure of asphalt binders, the aggregate–binder interface, and mixture. He et al. [7] prepared nine types of recycled asphalt mixtures with different percentages of reclaimed asphalt pavement and rejuvenators. They conducted Hamburg rutting tests, semi-circular bending tests, and freeze–thaw splitting tests to study the rutting resistance, cracking resistance, and water stability of the asphalt mixtures. The test results indicated that the recycled asphalt mixtures prepared with the optimal asphalt content determined by the Superpave method did not meet the specification requirements for cracking resistance. Applying the BDM to the design of hot recycled asphalt mixtures can yield high-performance recycled asphalt mixtures that meet all specification requirements. However, like other mixture design methods, the BDM does not take into account the layer properties. In order to investigate the feasibility of recycling the recycled plastic-modified asphaltic mixtures, Lim et al. [8] conducted a series of laboratory tests, such as Marshall stability, indirect tensile strength, Cantabro abrasion loss, and resilient modulus tests to evaluate the performance of recycled asphalt concrete containing 20% aged content.
Currently, the material design of asphalt mixtures is primarily based on test methods that focus on high-temperature performance, without adequately considering the cracking characteristics of the mixtures. Moreover, asphalt mixtures designed using these methods have no direct relationship with the behavior of pavement structures. However, in reality, different structural layers have varying requirements for rutting and cracking resistance. Therefore, it is necessary to integrate and correlate pavement structure design with asphalt mixture material design to effectively delay the occurrence of ruts and cracks. Consequently, obtaining experimental methods, indicators, and standards for evaluating the deformation and fracture characteristics of asphalt mixtures is essential. The rutting test is currently the recognized method for assessing the high-temperature (permanent deformation) stability of asphalt mixtures, with the Hamburg wheel tracking test being the most representative. The rutting test provides an experimental method for evaluating the material’s resistance to deformation and can serve as a basis for establishing corresponding indicators and standards.
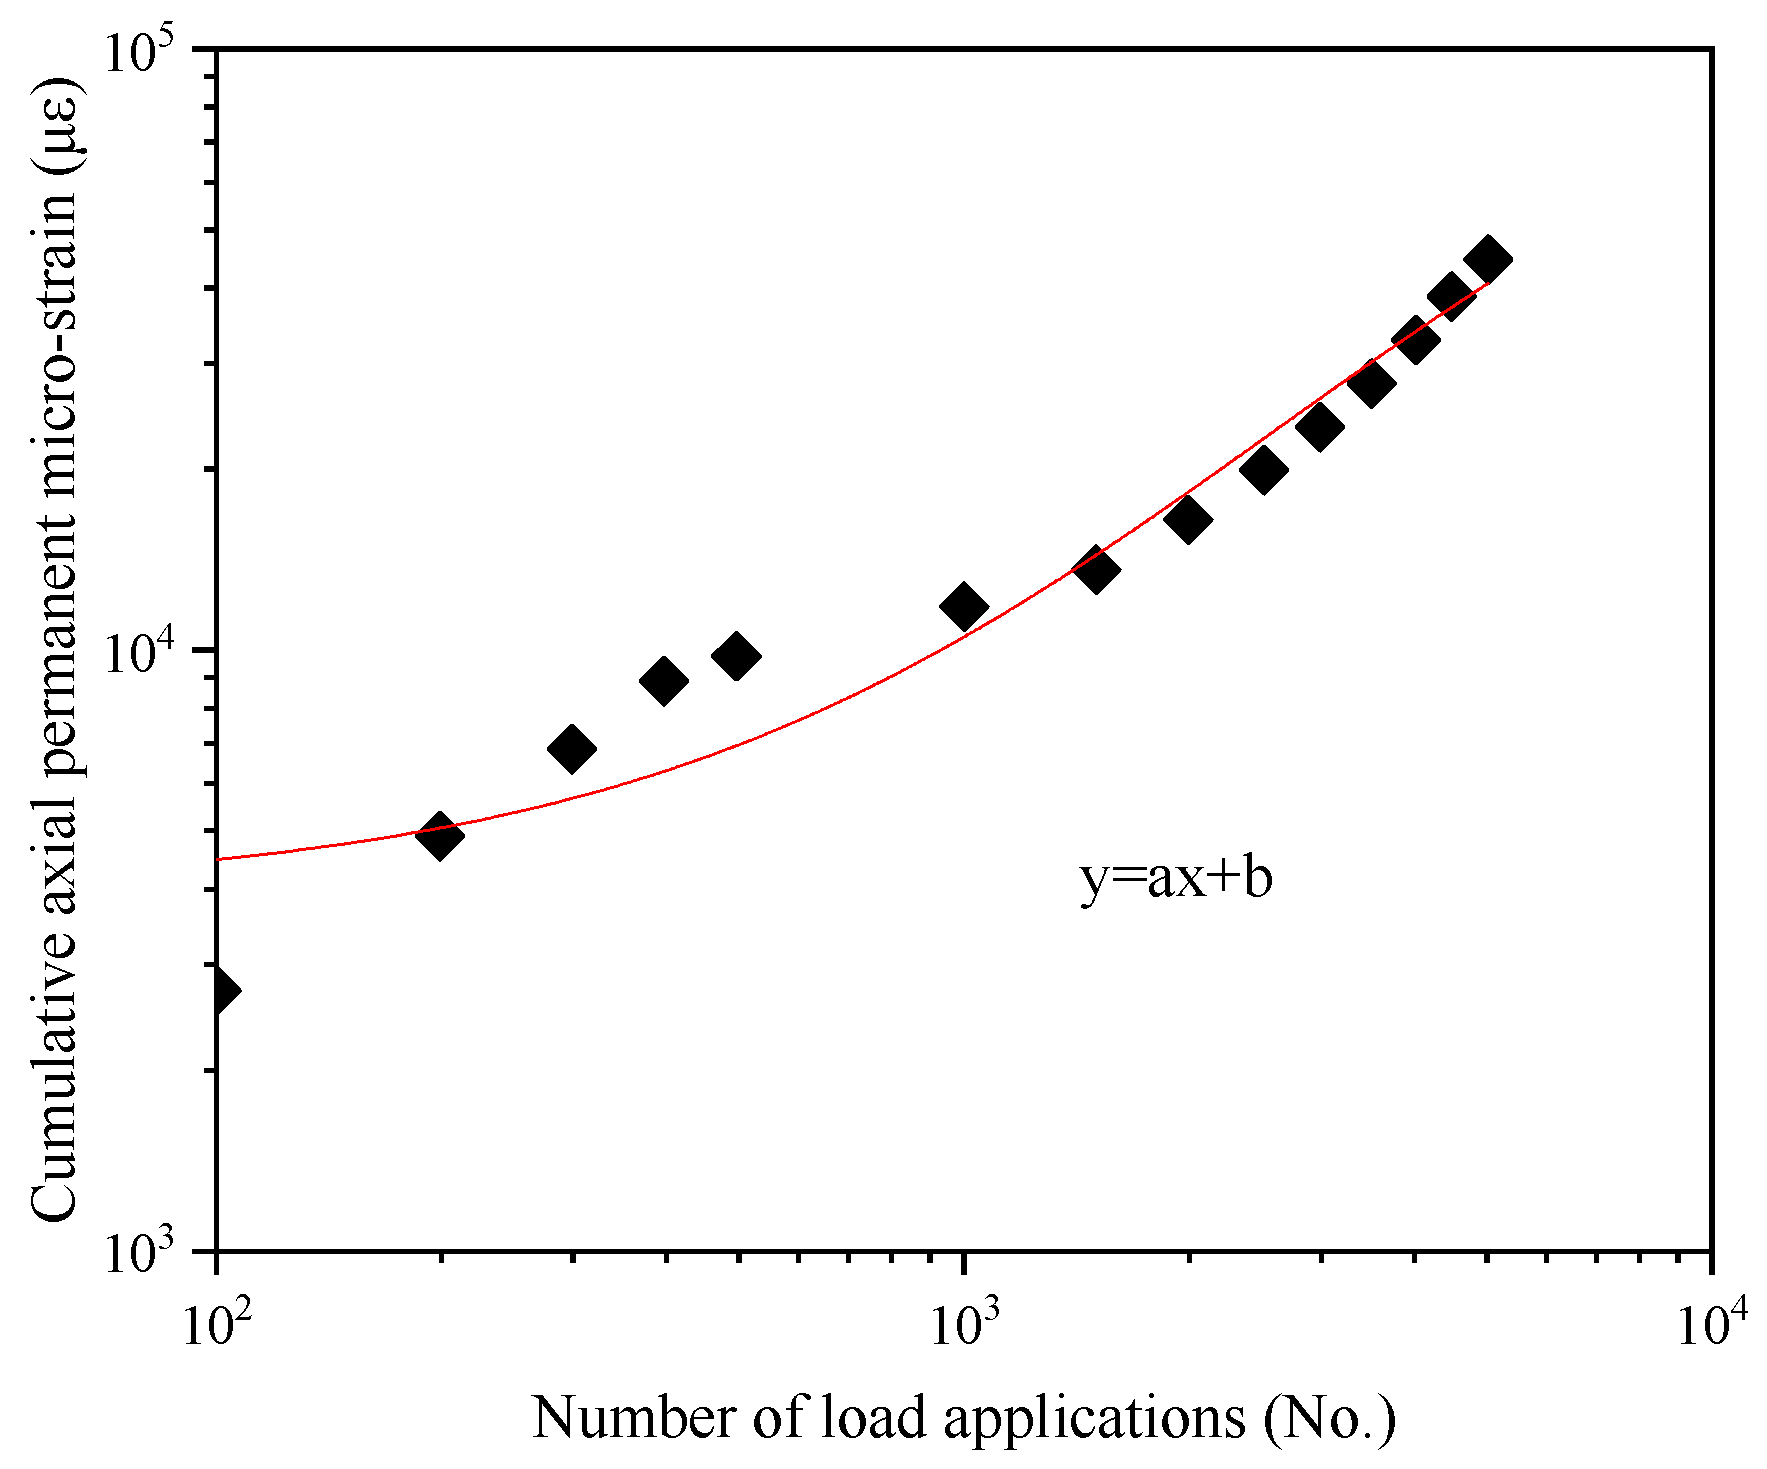
Rutting prediction and modeling have been extensively researched for many years, leading to the development of various models aimed at forecasting rutting or permanent deformation. Generally, these models can be classified into two categories: (1) layer strain rutting models and (2) shear strain rutting models. The VESYS rutting model, which is utilized in this paper, falls under the category of layer strain rutting models. A key feature of the VESYS layer rutting model is its focus on characterizing the properties of individual layers rather than relying on global parameters. For each layer, the VESYS model requires specific permanent deformation parameters, denoted as αi and μi. However, one of its drawbacks is the need to acquire these layer properties and conduct repeated load tests for each layer. Despite this challenge, recognizing the complexity of HMA mixtures, it is essential to accurately characterize the permanent deformation properties of each HMA layer to make more precise predictions. Therefore, the VESYS layer rutting model was ultimately chosen for modeling rutting in HMA overlays.
This paper takes the commonly used AC-20 asphalt mixture for the intermediate layer of asphalt pavements as the subject of analysis. It evaluates its high-temperature rutting resistance and low-temperature cracking resistance through the Hamburg wheel tracking test (HWTT) and the overlay tests (OTs), respectively. Initially, the effective range of asphalt content is determined. On the other hand, the VESYS rutting prediction model is utilized. Permanent deformation parameters of the asphalt mixture are obtained through testing, and the predicted rutting amount is calculated using the deflection values at the top and bottom of the asphalt layer. Subsequently, the rutting contribution rate calculated from the finite element model and the allowable rutting depth value for the intermediate layer are used to further determine the optimal range of asphalt content for the intermediate layer asphalt mixture. We take the intermediate layer of asphalt pavement on high-grade highways as an example to demonstrate the feasibility of this design method. By comparing the rutting depth obtained from the VESYS rutting prediction model under each asphalt content with the allowable rutting depth, the research results show that the asphalt content designed by the BDM based on the rutting resistance performance of the intermediate layer for this pavement structure and this kind of material is 4.3%–4.6%. In actual engineering, it is recommended to take 4.4% as the optimal asphalt content for AC20.

2. Asphalt Mixture BDM

2.1. Basic Conception of BDM

The so-called BDM refers to the approach that combines the structural characteristics of asphalt pavement and, based on the properties of each asphalt layer, designs the optimal asphalt content for HMA mixtures. This ensures that the designed asphalt mixture can balance the rutting resistance and crack resistance of the asphalt layer at that particular position, thereby achieving the best possible performance.
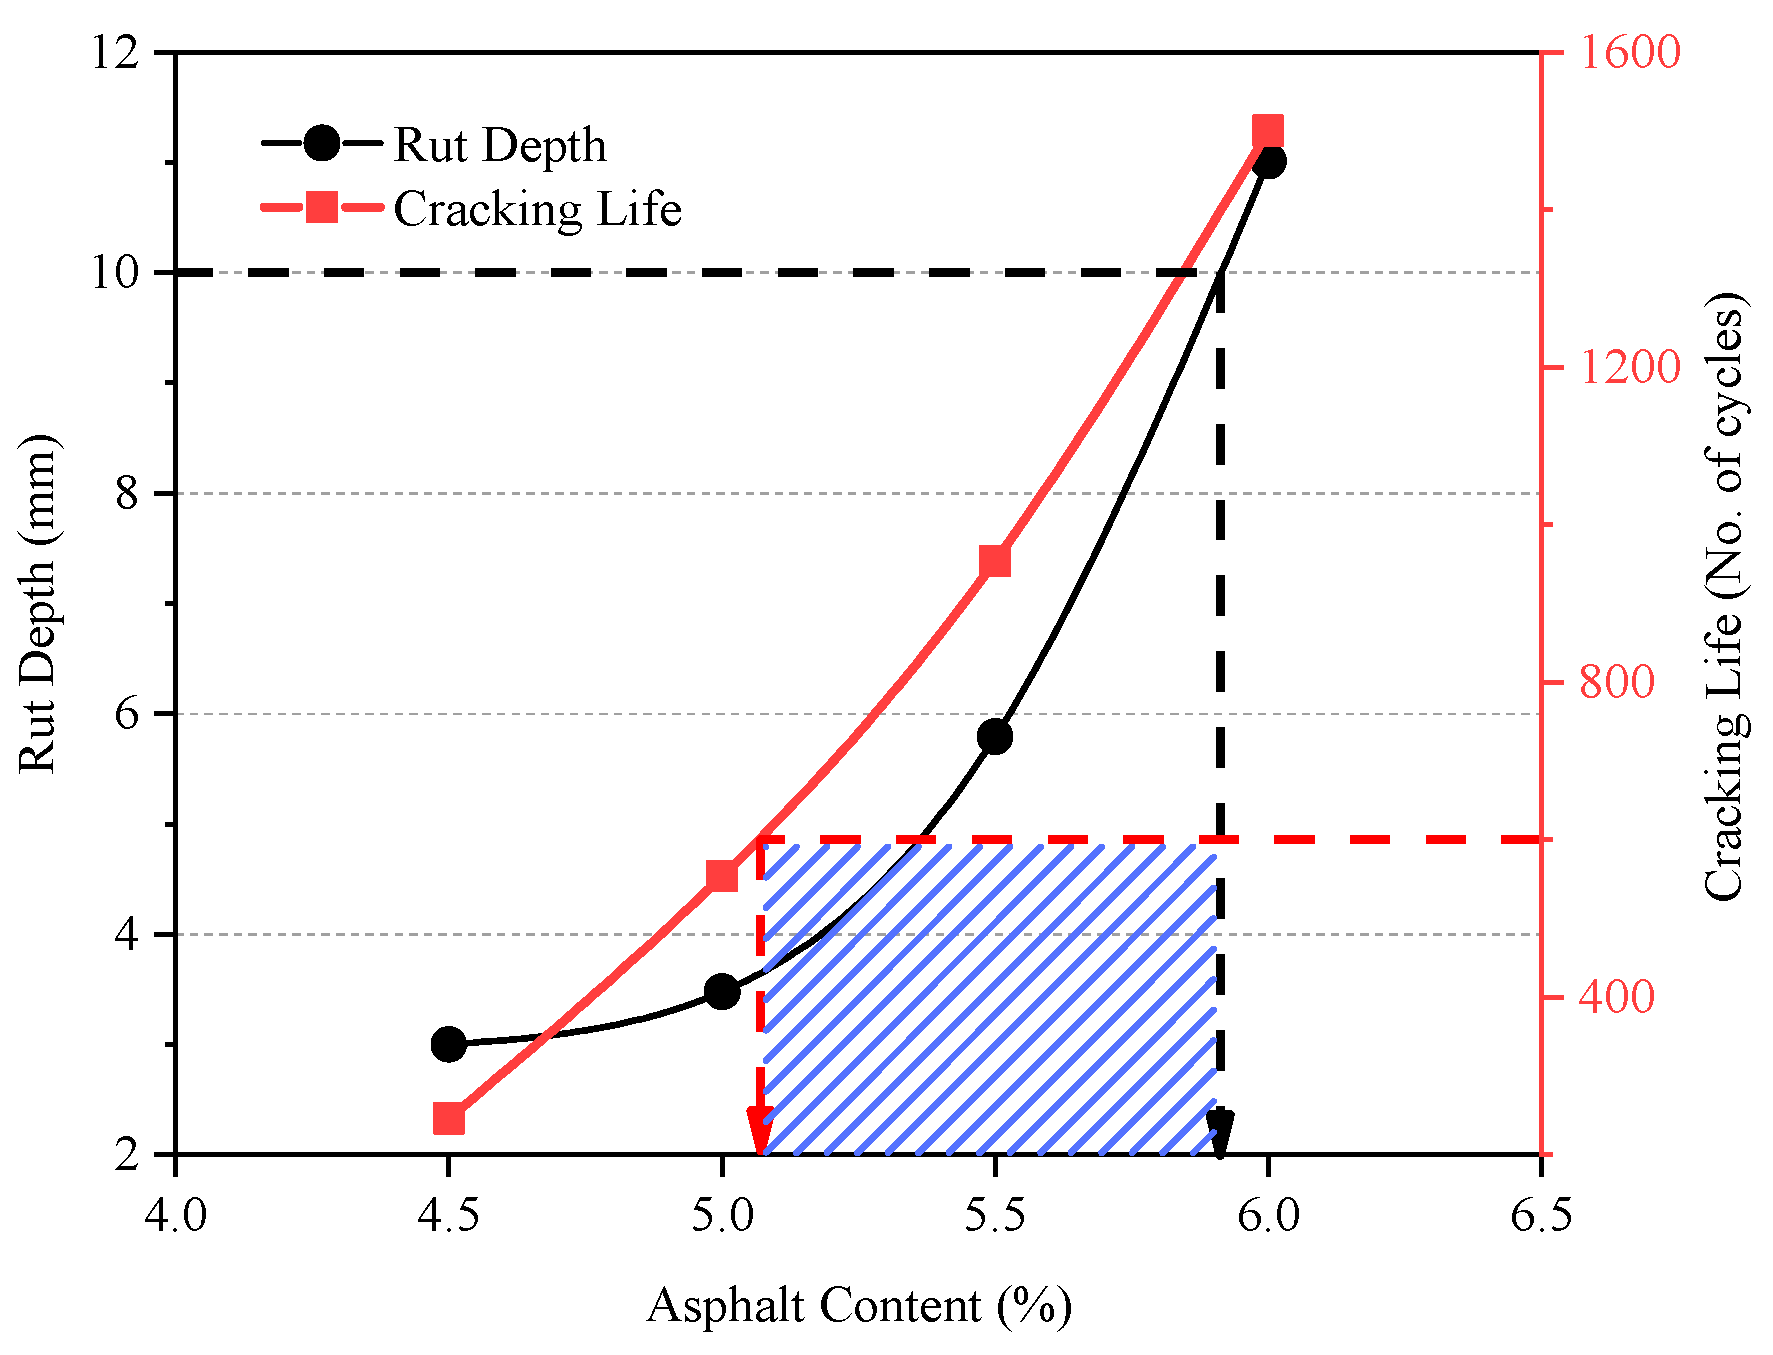
Selecting an appropriate trial asphalt content is crucial for successfully determining the balanced asphalt content, ensuring that the designed mixture meets both rutting and cracking standards. Balanced design is a method for HMA mixture design that can balance the requirements for rutting and cracking resistance. The HWTT and OT apparatus are used to evaluate the rutting and cracking resistance of HMA mixtures, respectively. The upper limit of the asphalt content range is determined by the immersed HWTT. The lower limit of the asphalt content range is determined by the OT.
The immersed HWTT is widely accepted for evaluating the high-temperature stability of asphalt mixtures. In this study, the test was stopped after 20,000 wheel passes, with data collected from 11 points as the roller moved from the end to the front. The rut depth was indicated by negative values from the initial height, with the average of points 5, 6, and 7 used as the final rut depth. The test temperature was 50 °C, and the maximum rut depth after 20,000 wheel passes should be less than 12.5 mm.
As for the evaluation of cracking resistance, there are various existing methods both domestically and internationally, each with its own strengths and limitations. These include the indirect tensile test, small beam fatigue test, temperature stress test for confined specimens, and semi-circular bend test. Research indicates that in the early stage of reflective crack propagation in asphalt mixtures, opening mode cracks (caused by temperature and load) dominate. As the crack extent increases and reaches a certain stage, shear-mode expansion due to load becomes the main factor. Therefore, controlling early stage opening mode reflective cracks can effectively delay the progression of cracks to the top of the asphalt layer. Based on this principle, the OT was developed by the Texas Transportation Institute in the US. It can evaluate the cracking resistance of asphalt mixtures by simulating the development and characteristics of reflective cracks. The test temperature was 25 °C, and the OT cycle count should be no less than 300.
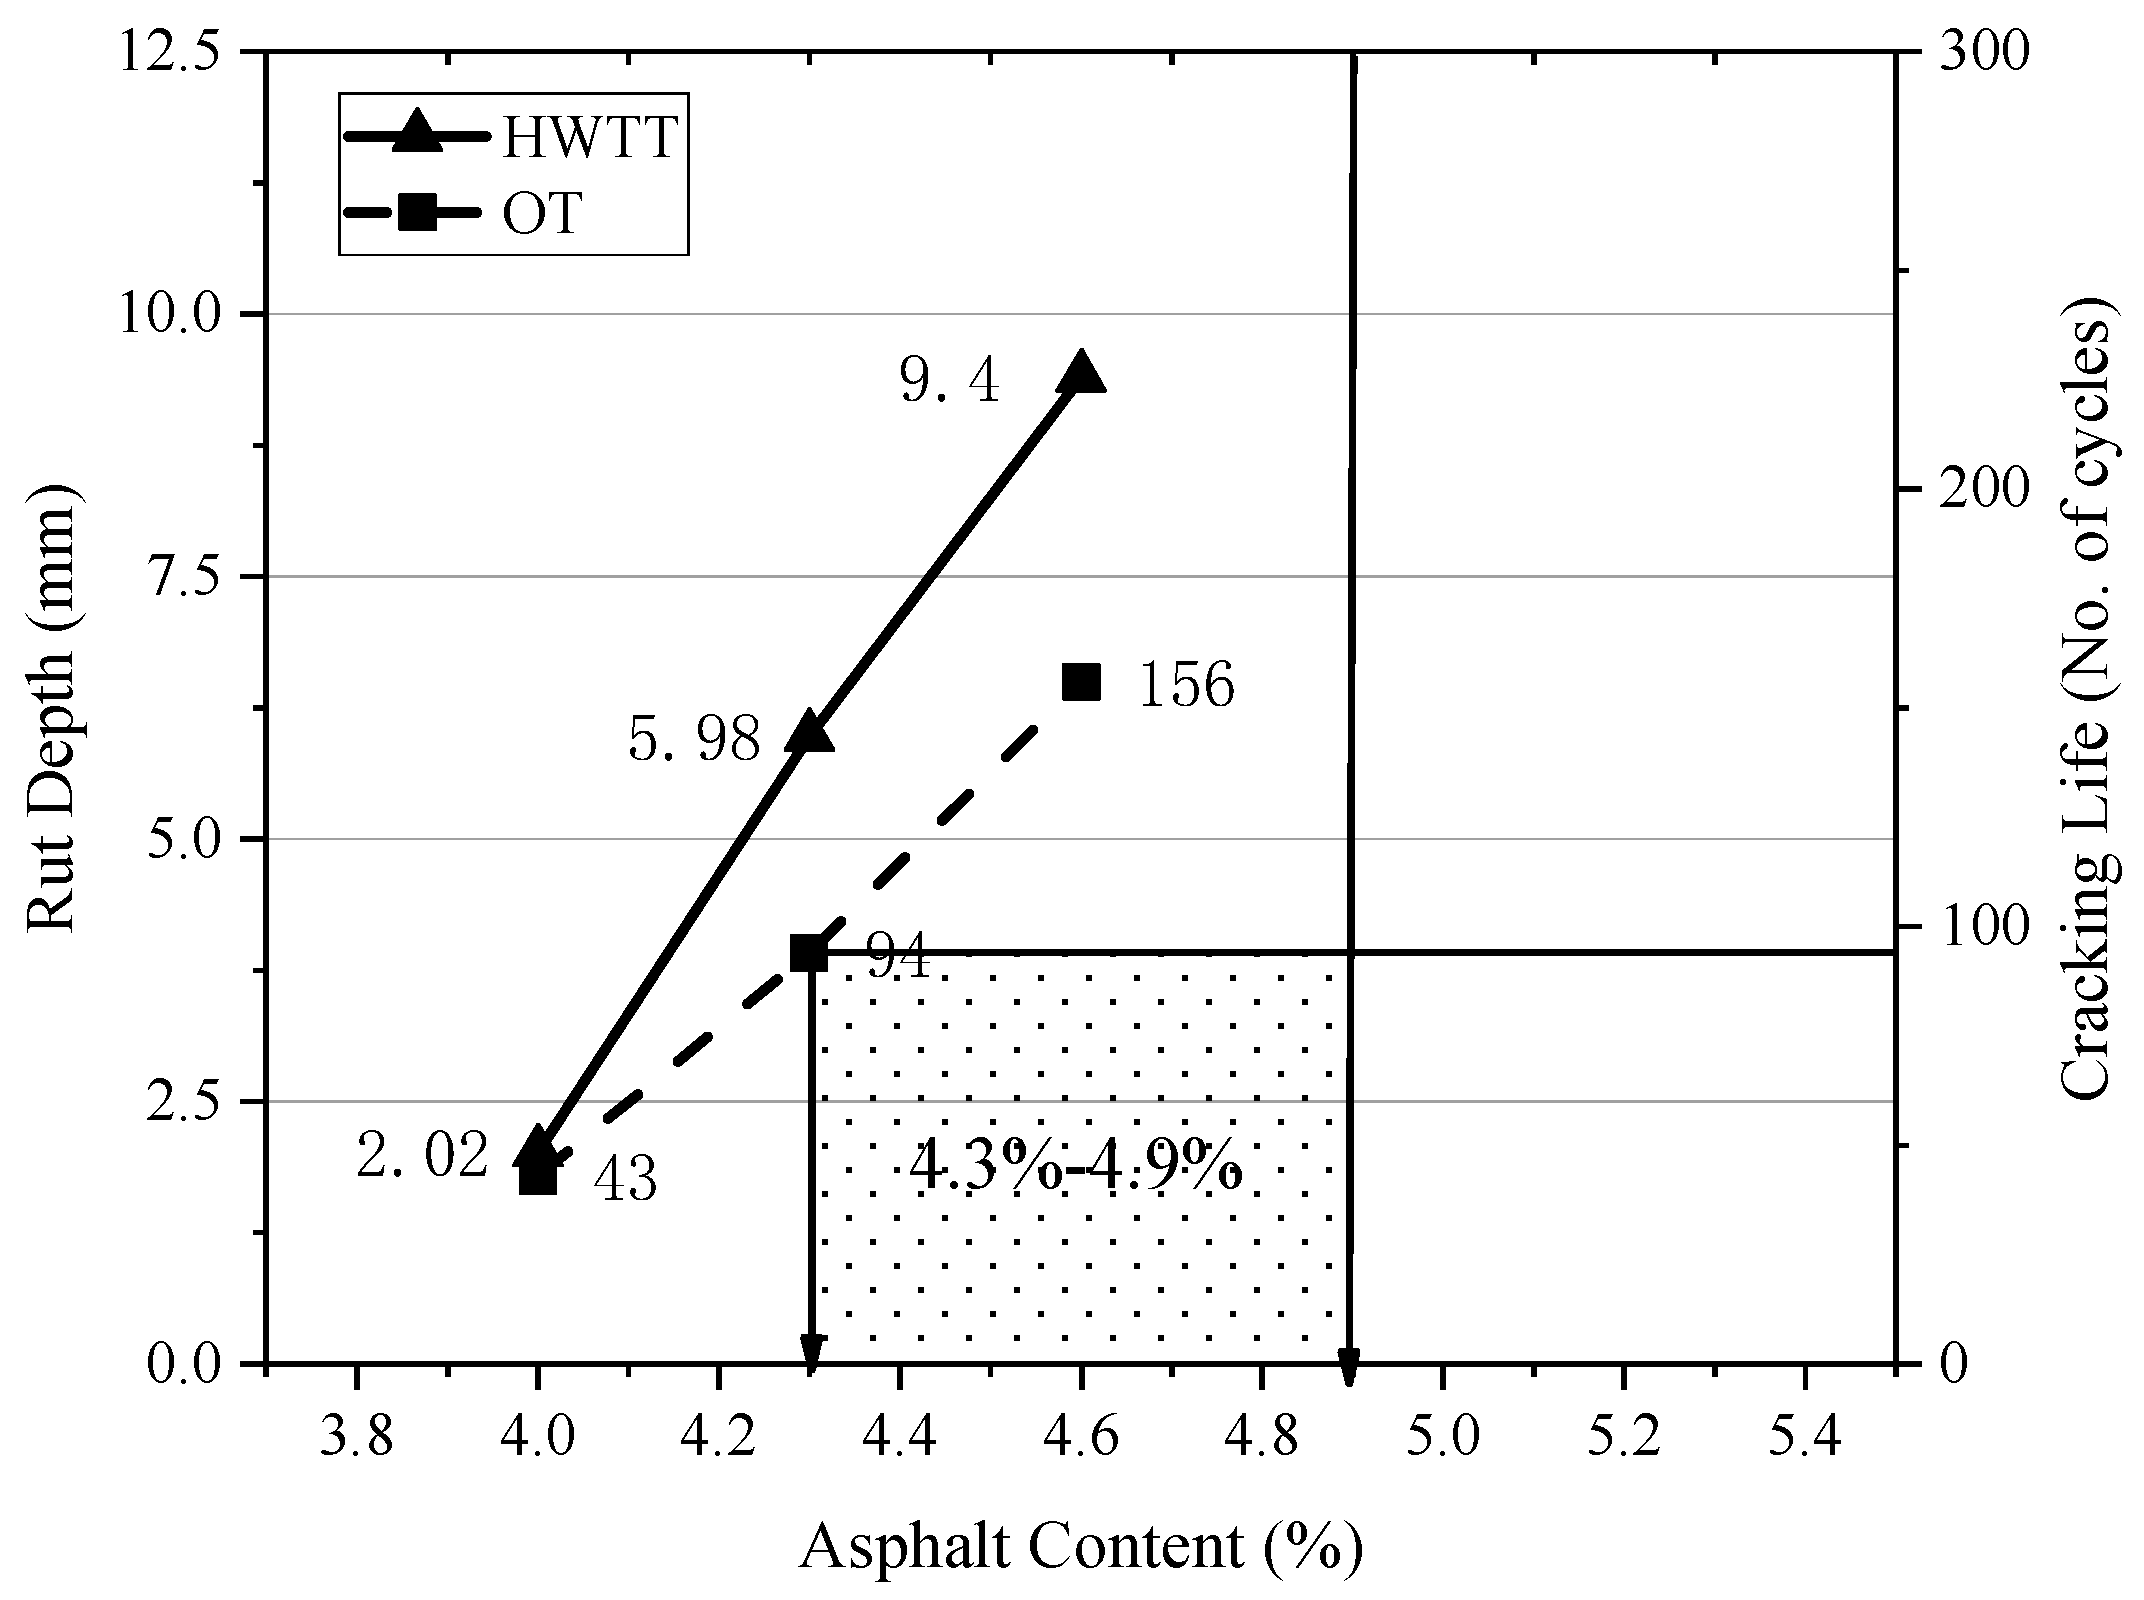
Once the types and gradations of the raw materials and the pavement structure have been established, it is essential to select three or four different asphalt contents for testing, while adhering to the fundamental requirements of VMA/VFA. In reality, the requirement for rutting resistance sets an upper limit for the trial asphalt content; exceeding this limit will result in an HMA mixture that fails to meet the necessary rutting resistance standards. Conversely, the requirement for cracking resistance establishes a lower limit for the trial asphalt content; falling below this threshold will compromise the mixture’s cracking resistance and overall durability. A typical graphical representation is provided below, with the shaded area in Figure 1 indicating the effective range of asphalt content.
If there is no overlap in the figure, it is necessary to adjust the raw materials of the asphalt mixture, redesign the gradation, or change the type of mixture, etc.
Although the asphalt content range determined by the balanced design can balance crack resistance and rutting resistance, it still does not take into account the properties of different layers. For instance, the lower limit of the trial asphalt content determined by the OT can meet the cracking resistance requirement. However, due to the higher contribution of permanent deformation from the intermediate layer, the upper limit of the trial asphalt content determined by the HWTT may not necessarily meet the rutting resistance requirement. Therefore, based on the results of the balanced design, further optimization of this method is necessary.

2.2. Specific Steps of BDM

(1) Preliminary determination of the effective asphalt content range
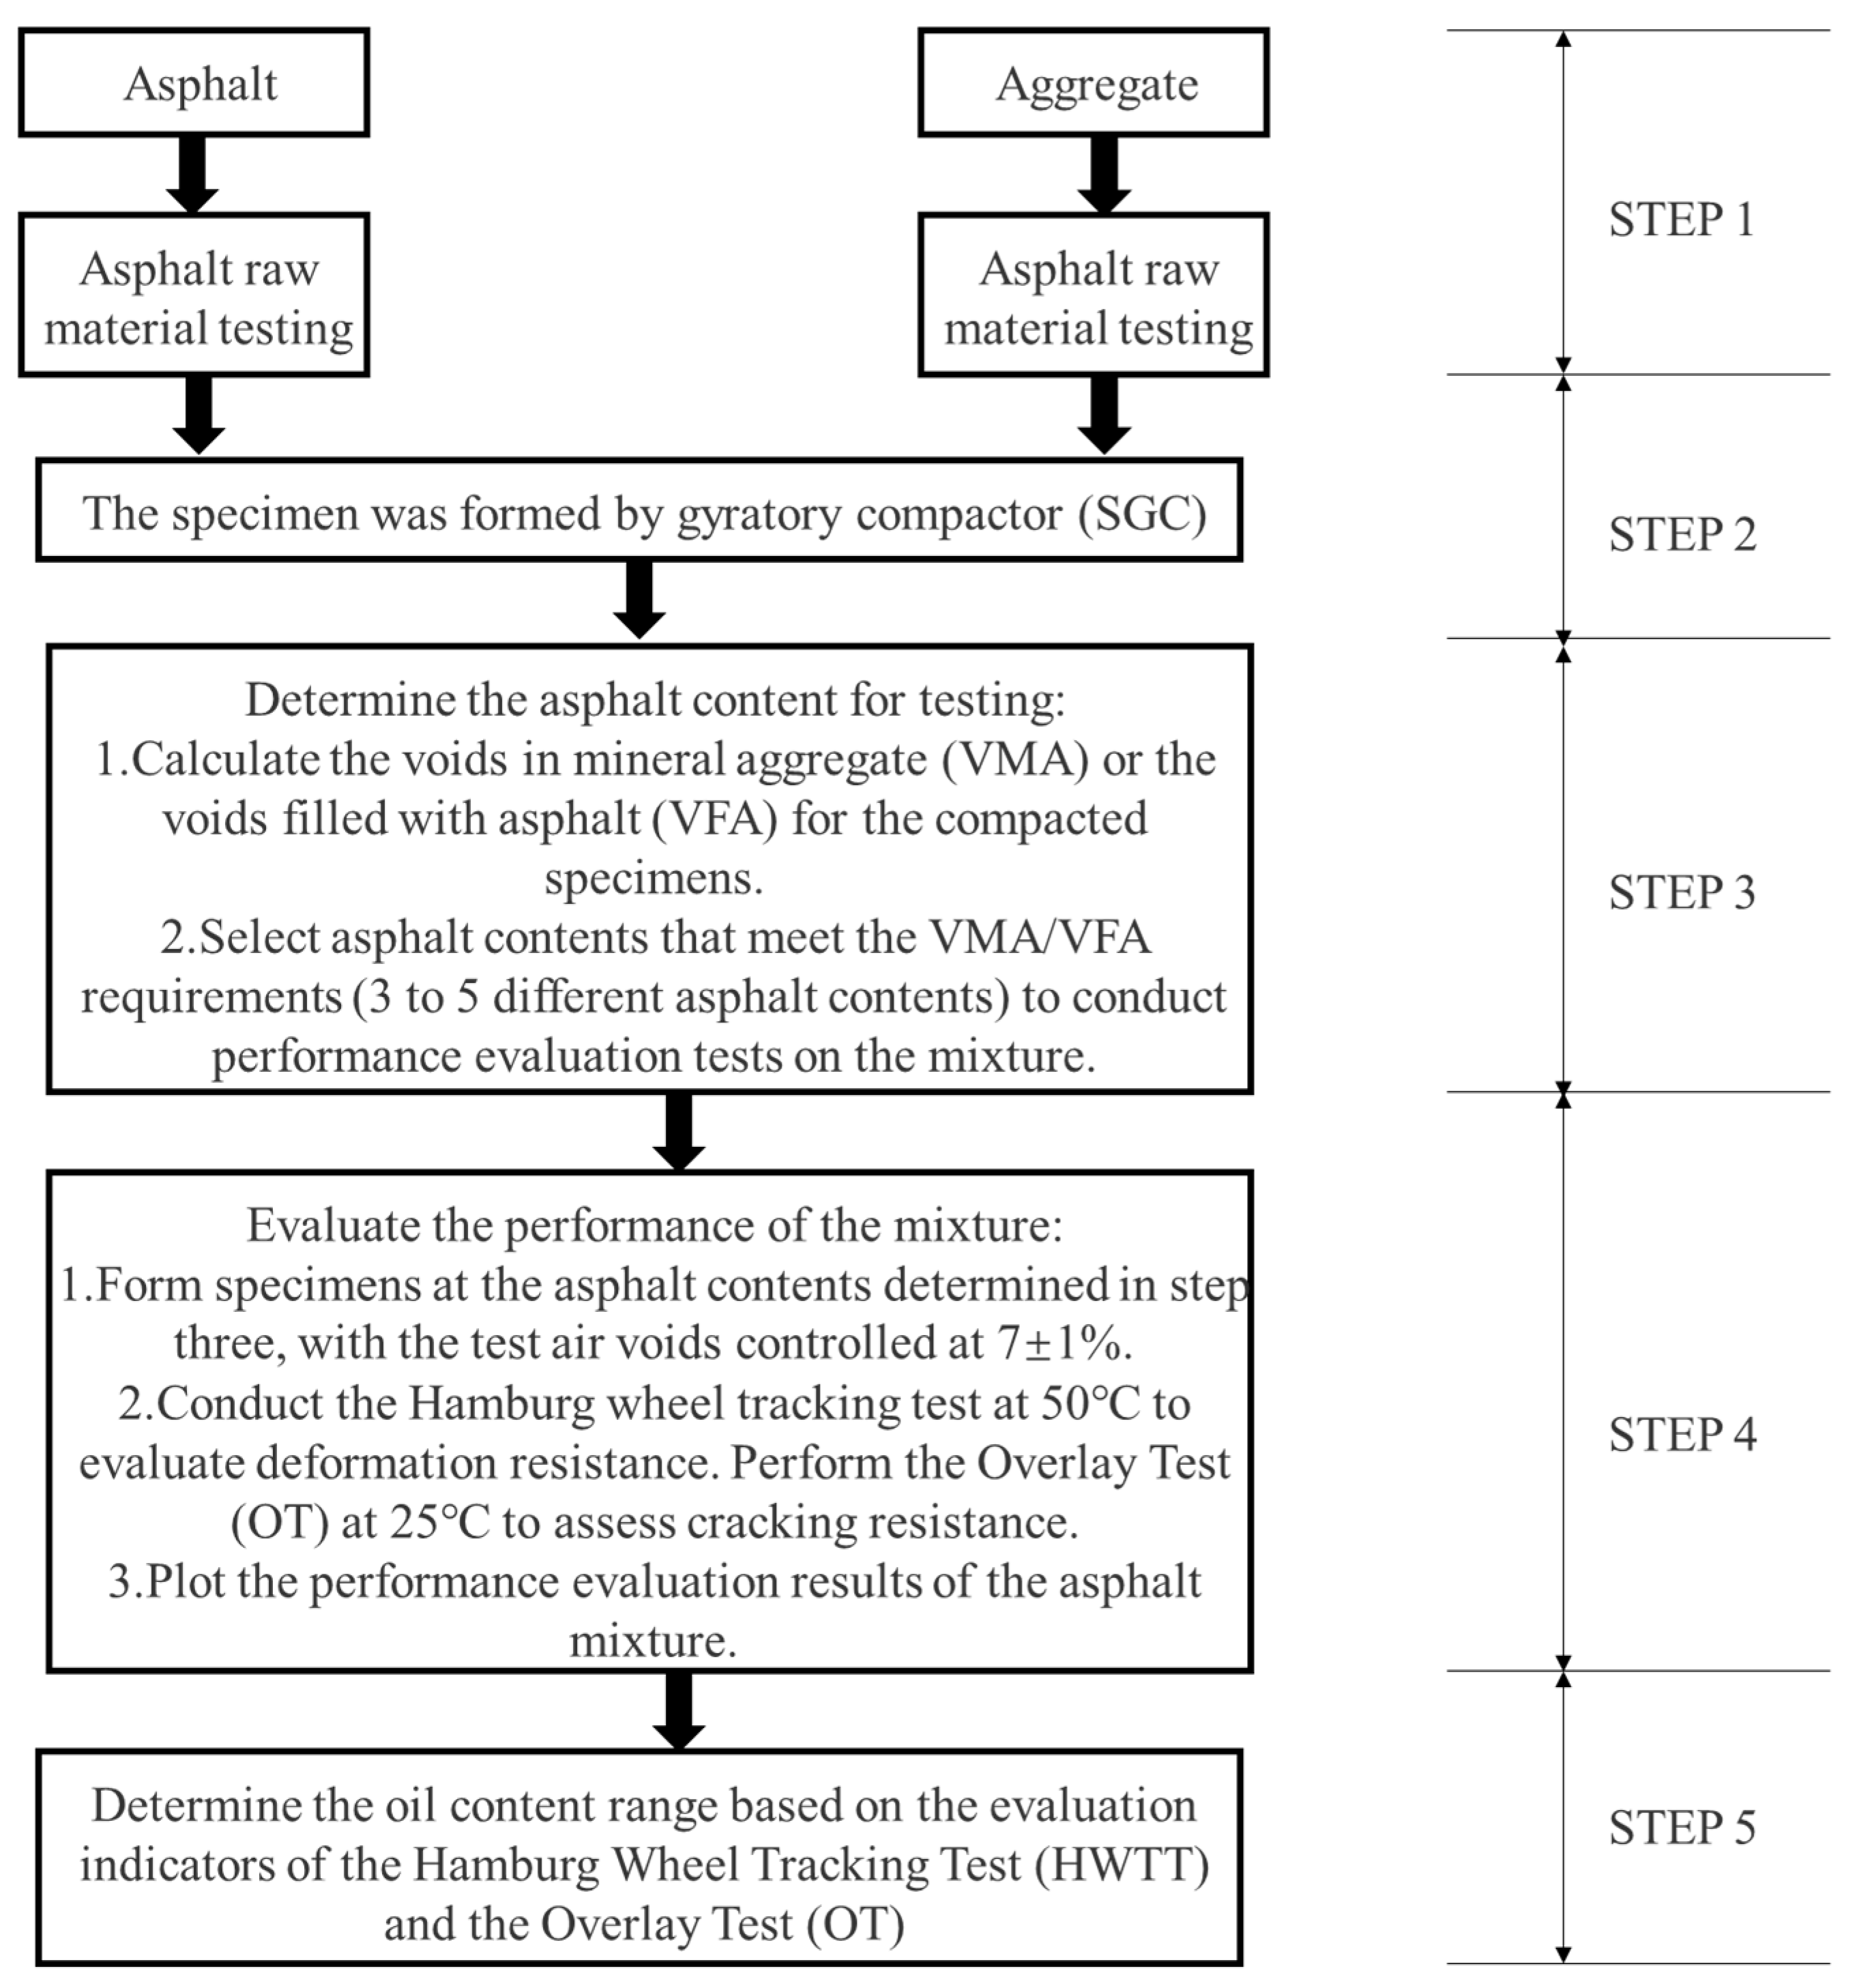
In Step 4, specimens are compacted with an air void content of 7 ± 1% as required by the test procedure. A 7% air void content is used for specimen compaction because it represents the threshold for water permeability in pavements and is closer to the actual construction requirement of achieving a compaction level greater than 93%.
During the preliminary selection of the optimal asphalt content, the following four scenarios may occur:
(1)
The asphalt mixture fails to meet both rutting and cracking resistance requirements;
(2)
The asphalt mixture meets only the cracking resistance requirement;
(3)
The asphalt mixture meets only the rutting resistance requirement;
(4)
The asphalt mixture satisfies both cracking and rutting resistance requirements at an appropriate oil content.
If Scenario 1 occurs, among the 3 to 4 asphalt contents chosen within the range that meets basic requirements, like asphalt film thickness or VMA/VFA, none fall within the asphalt content range set by the immersed HWTT (upper limit) and OT (lower limit). The asphalt mixture design needs to be redesigned, including attempting different gradation types, material varieties, or different asphalt grades.
When Scenario 2 arises, among the 3 to 4 asphalt contents selected within the basic requirements range for asphalt film thickness or VMA/VFA, only those at the lower limit set by the OT are acceptable. And they exceed the upper limit set by the immersed HWTT. In this case, the asphalt content is too high, and the mixture needs redesign as in Scenario 1.
The occurrence of Scenario 3 suggests that this type of asphalt mixture has good rutting resistance, but it does not meet the cracking resistance requirement within the tested oil content range. In this case, one should return to Step 3 in Figure 2 and further increase several sets of asphalt contents for HWTT and OT.
For Scenario 4, it indicates that the preliminary selection of asphalt content is complete, and the next step can proceed to more accurately determine the oil content.
The BDM can be briefly described as follows: when the materials, pavement structure layer thickness, and mix gradation are determined, select 3–4 asphalt contents within the range that meets basic requirements like asphalt film thickness or VMA/VFA. Use the immersed HWTT to set the upper limit and the OT to set the lower limit of the asphalt content range. The range between these limits is the “effective range” of asphalt content determined by the BDM, ensuring both rutting resistance and cracking resistance.
(2) Oil content optimization considering horizon characteristics
The functional or characteristic role of each asphalt layer in an asphalt pavement is an important consideration in this method. Although the BDM introduced in the previous section takes into account both the rutting and cracking resistance of asphalt mixtures in a balanced manner, it does not consider the functional role of the asphalt layer within the pavement structure. Therefore, it is essential to further optimize the asphalt content based on the existing BDM, taking into account the characteristics of each layer’s position.
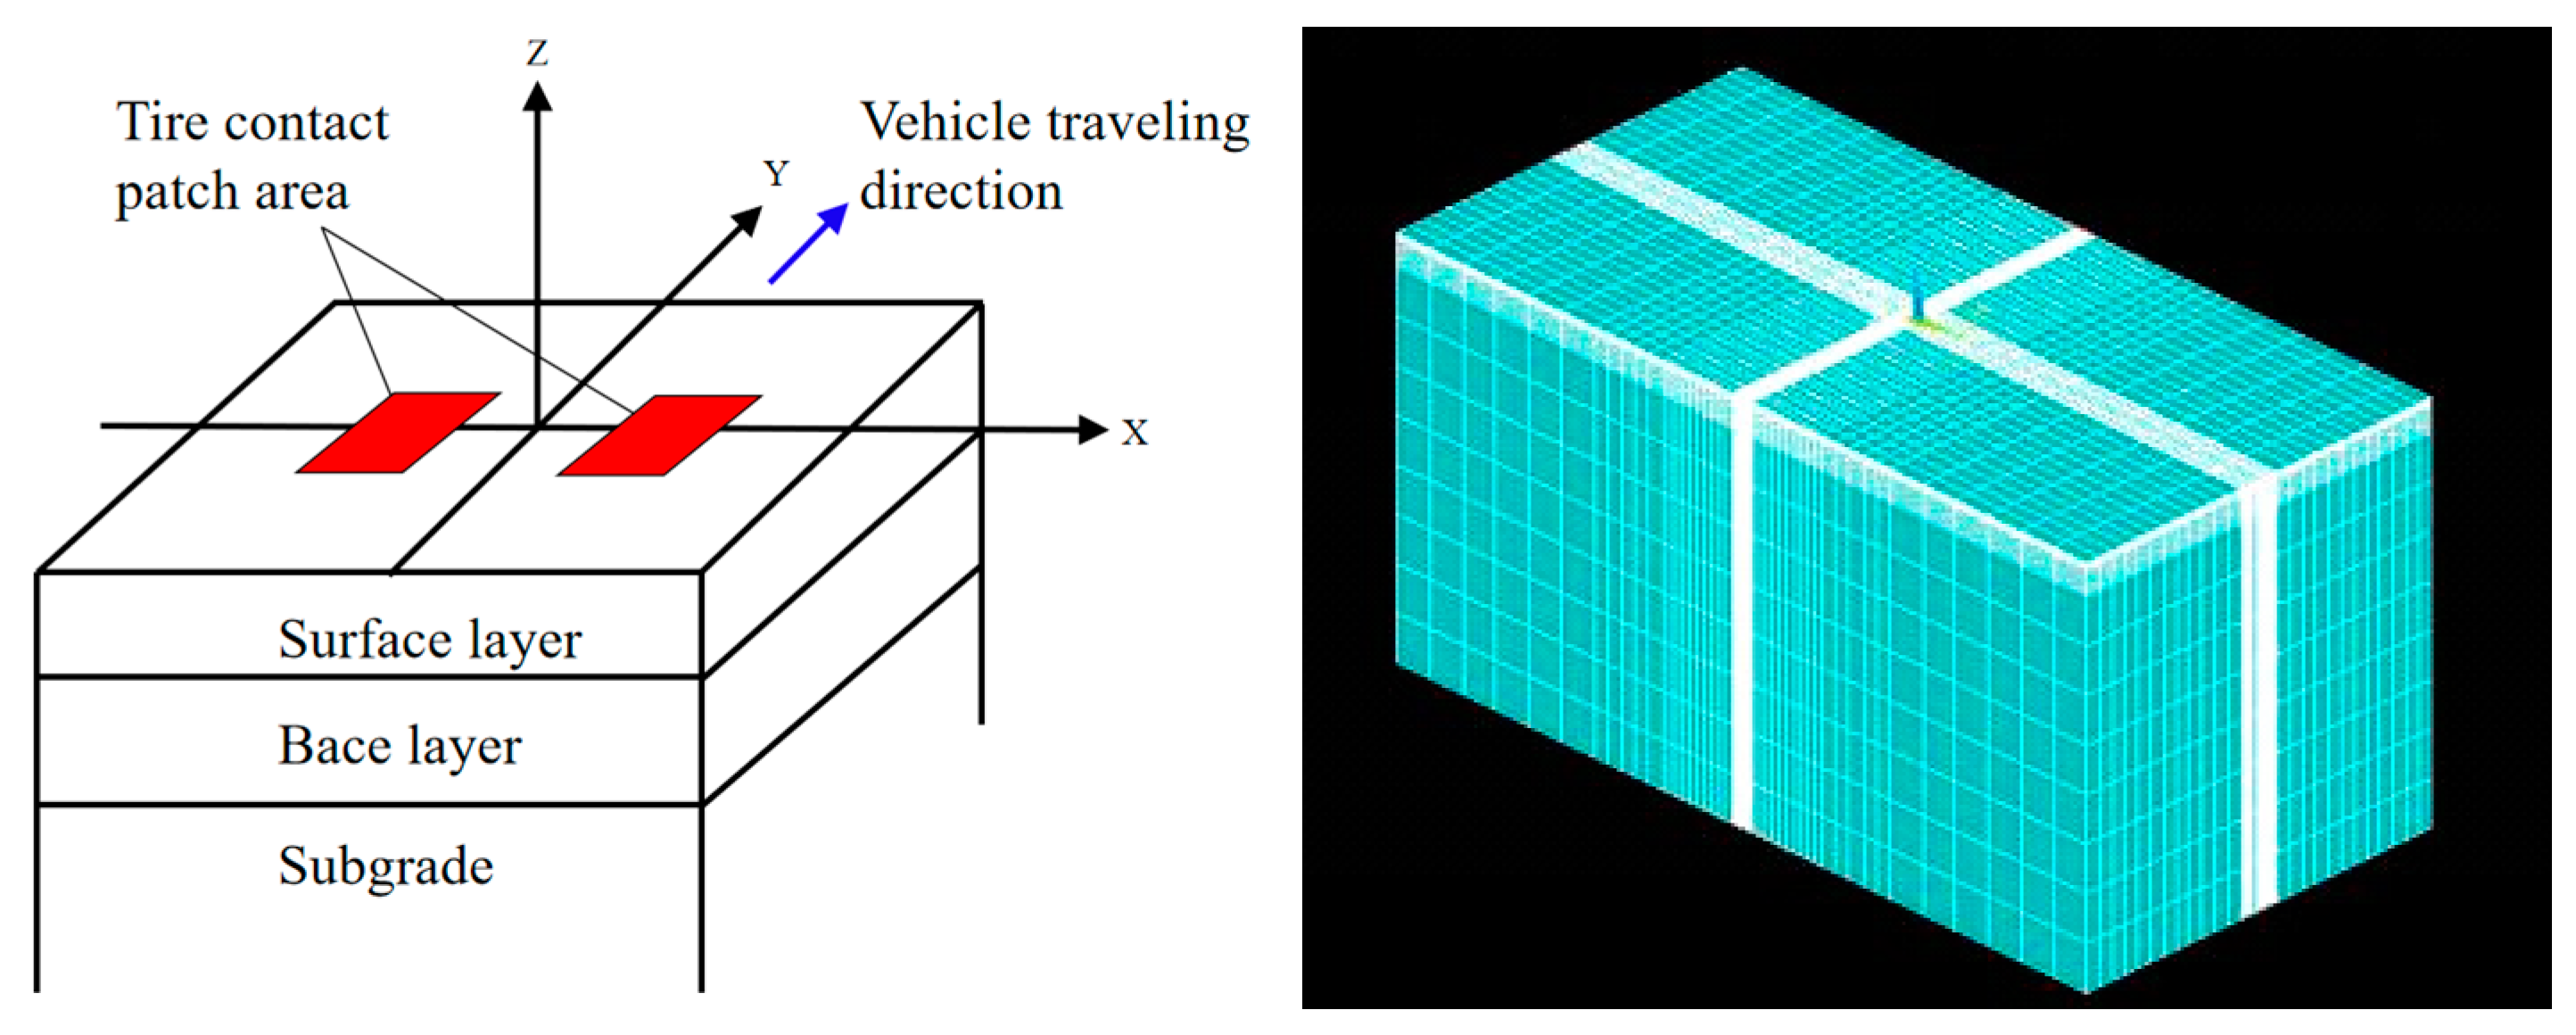
Regarding the rutting resistance of the intermediate layer, to optimize the upper limit of the asphalt content, it is first necessary to clarify two values: the estimated rutting depth and the allowable rutting depth. By comparing these two values, the optimal range of asphalt content for the intermediate layer’s rutting performance can be determined. The estimated rutting depth is calculated using the VESYS rutting prediction model, while the allowable rutting value is obtained after calculating the rutting contribution rate using the ANSYS1.0 finite element software.
The specific optimization steps for asphalt content based on layer characteristics, using the intermediate layer of a highway asphalt pavement as an example, are described as follows:
Step 1: Within the effective range of asphalt content initially determined by the BDM, select 3 to 4 different asphalt contents again. Conduct repeated loading creep tests and dynamic modulus tests for each. Additionally, perform dynamic modulus tests for the upper and lower layers to facilitate subsequent finite element calculations.
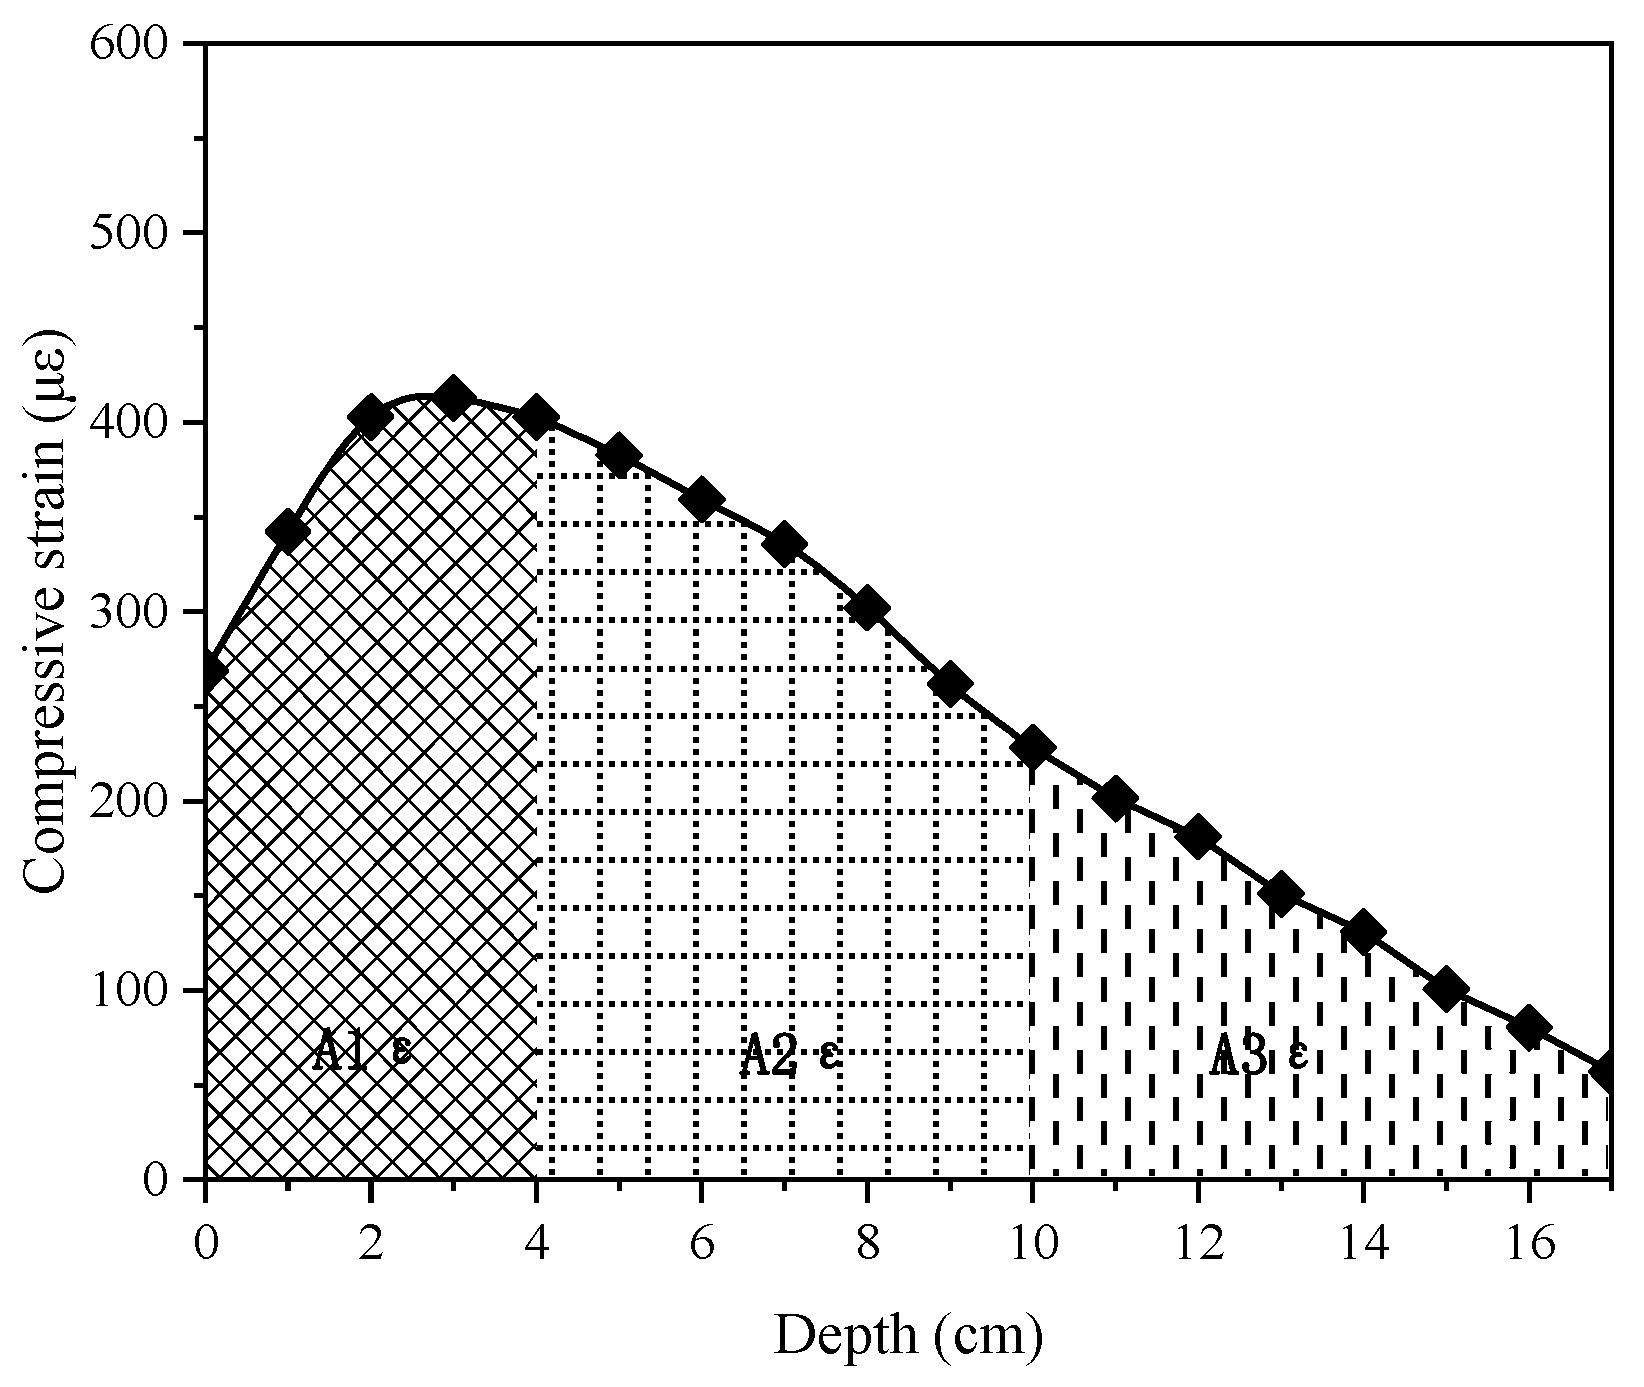
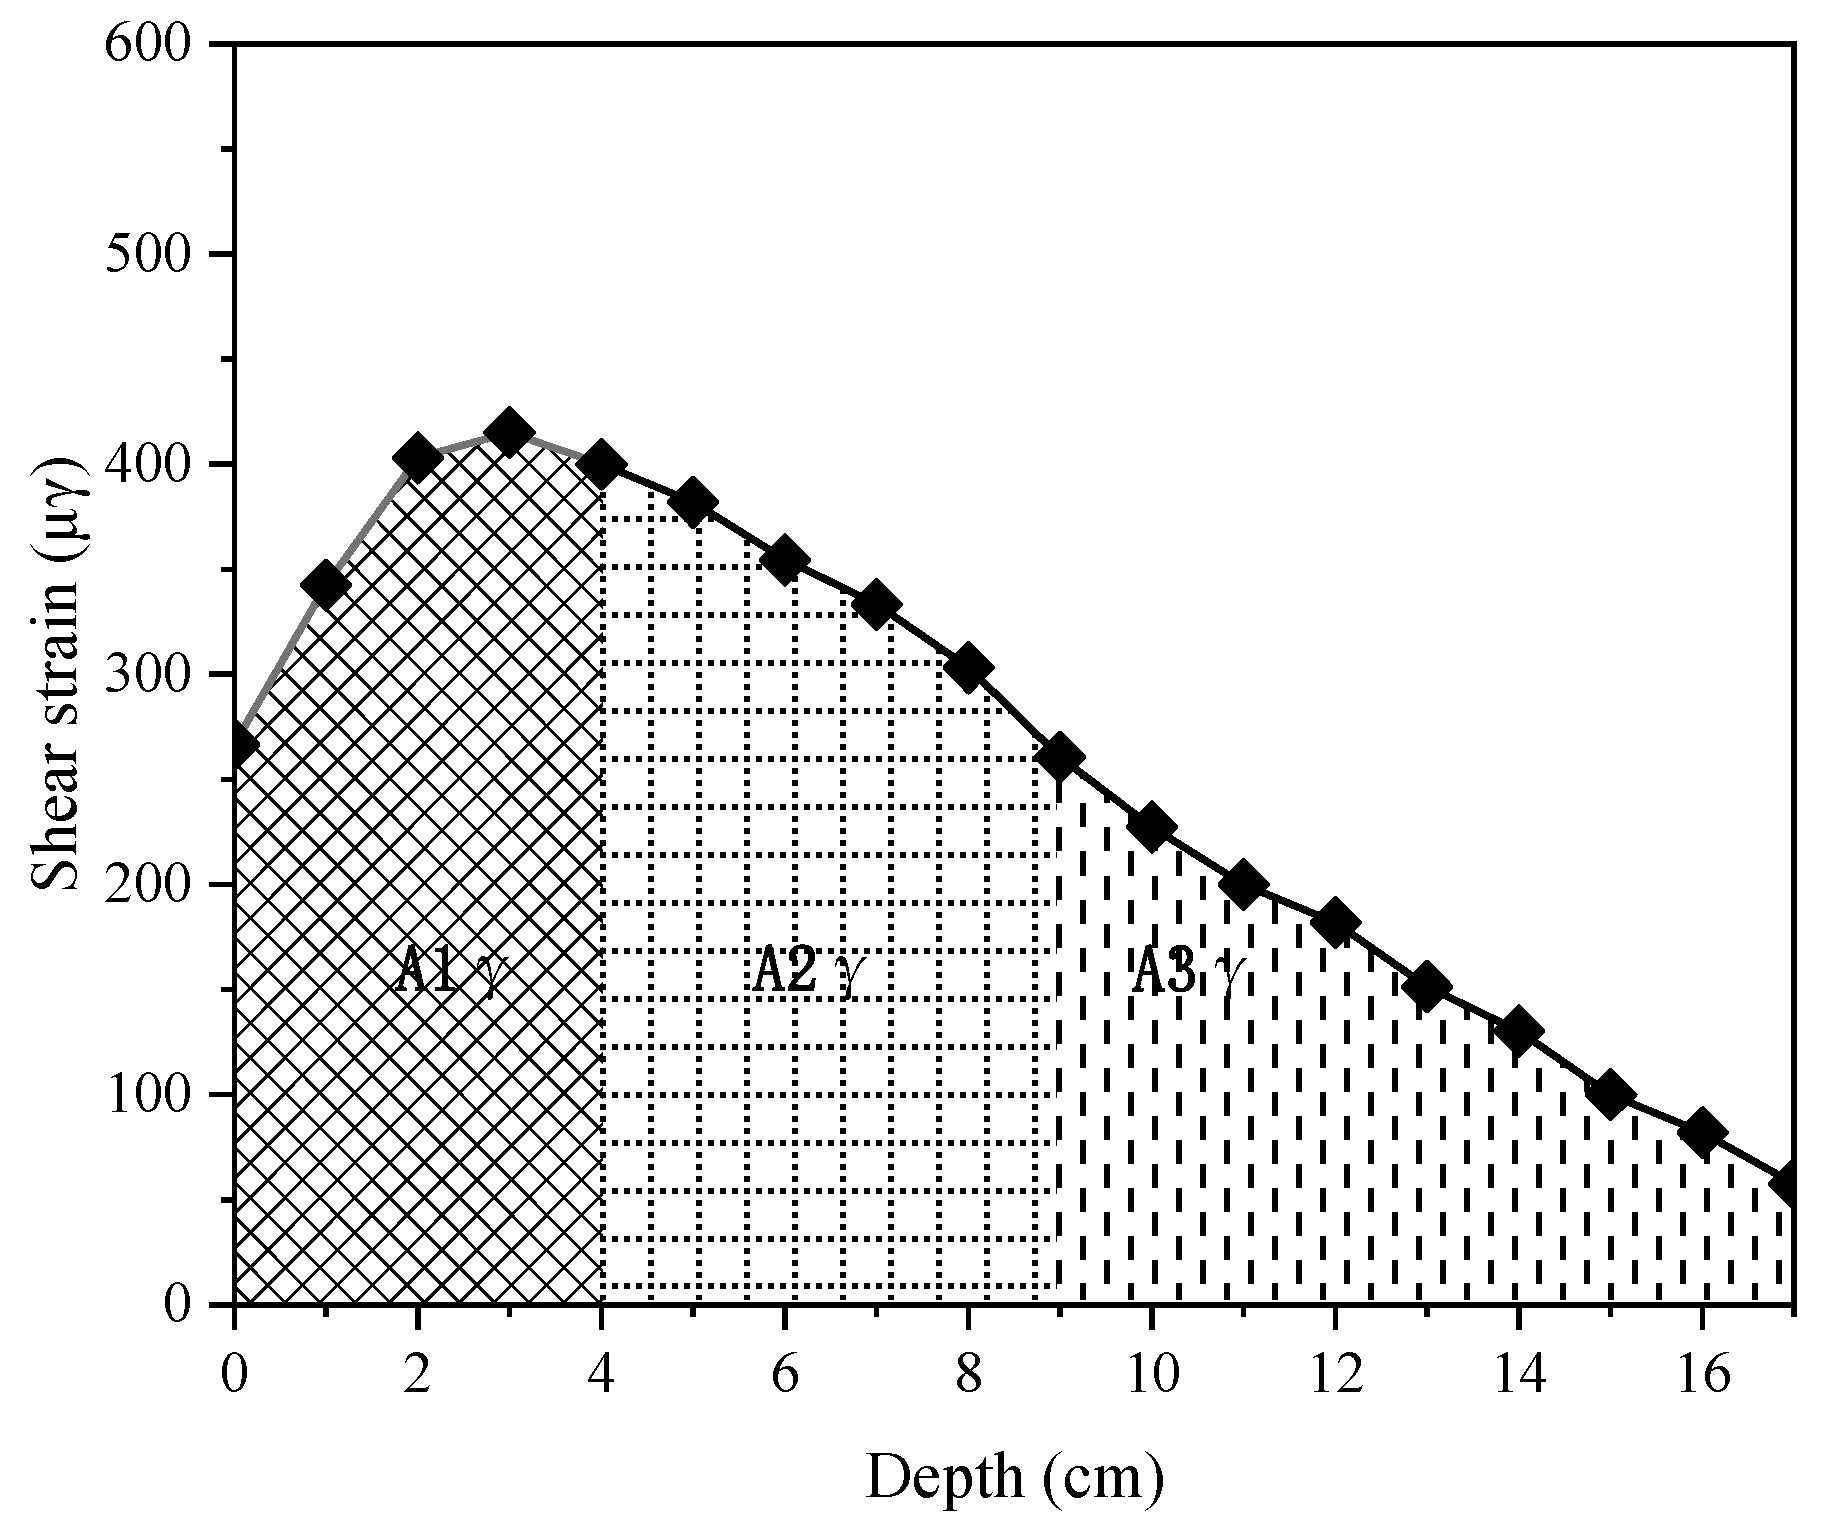
Step 2: Establish an ANSYS finite element model. Using a UTM testing machine, conduct dynamic modulus tests to measure the dynamic modulus values of each layer’s asphalt mixture. Convert these values into viscoelastic parameters through calculations and input them into the finite element model. Calculate the deflection values at the top and bottom of the intermediate layer and estimate the rutting contribution rate of the intermediate layer.
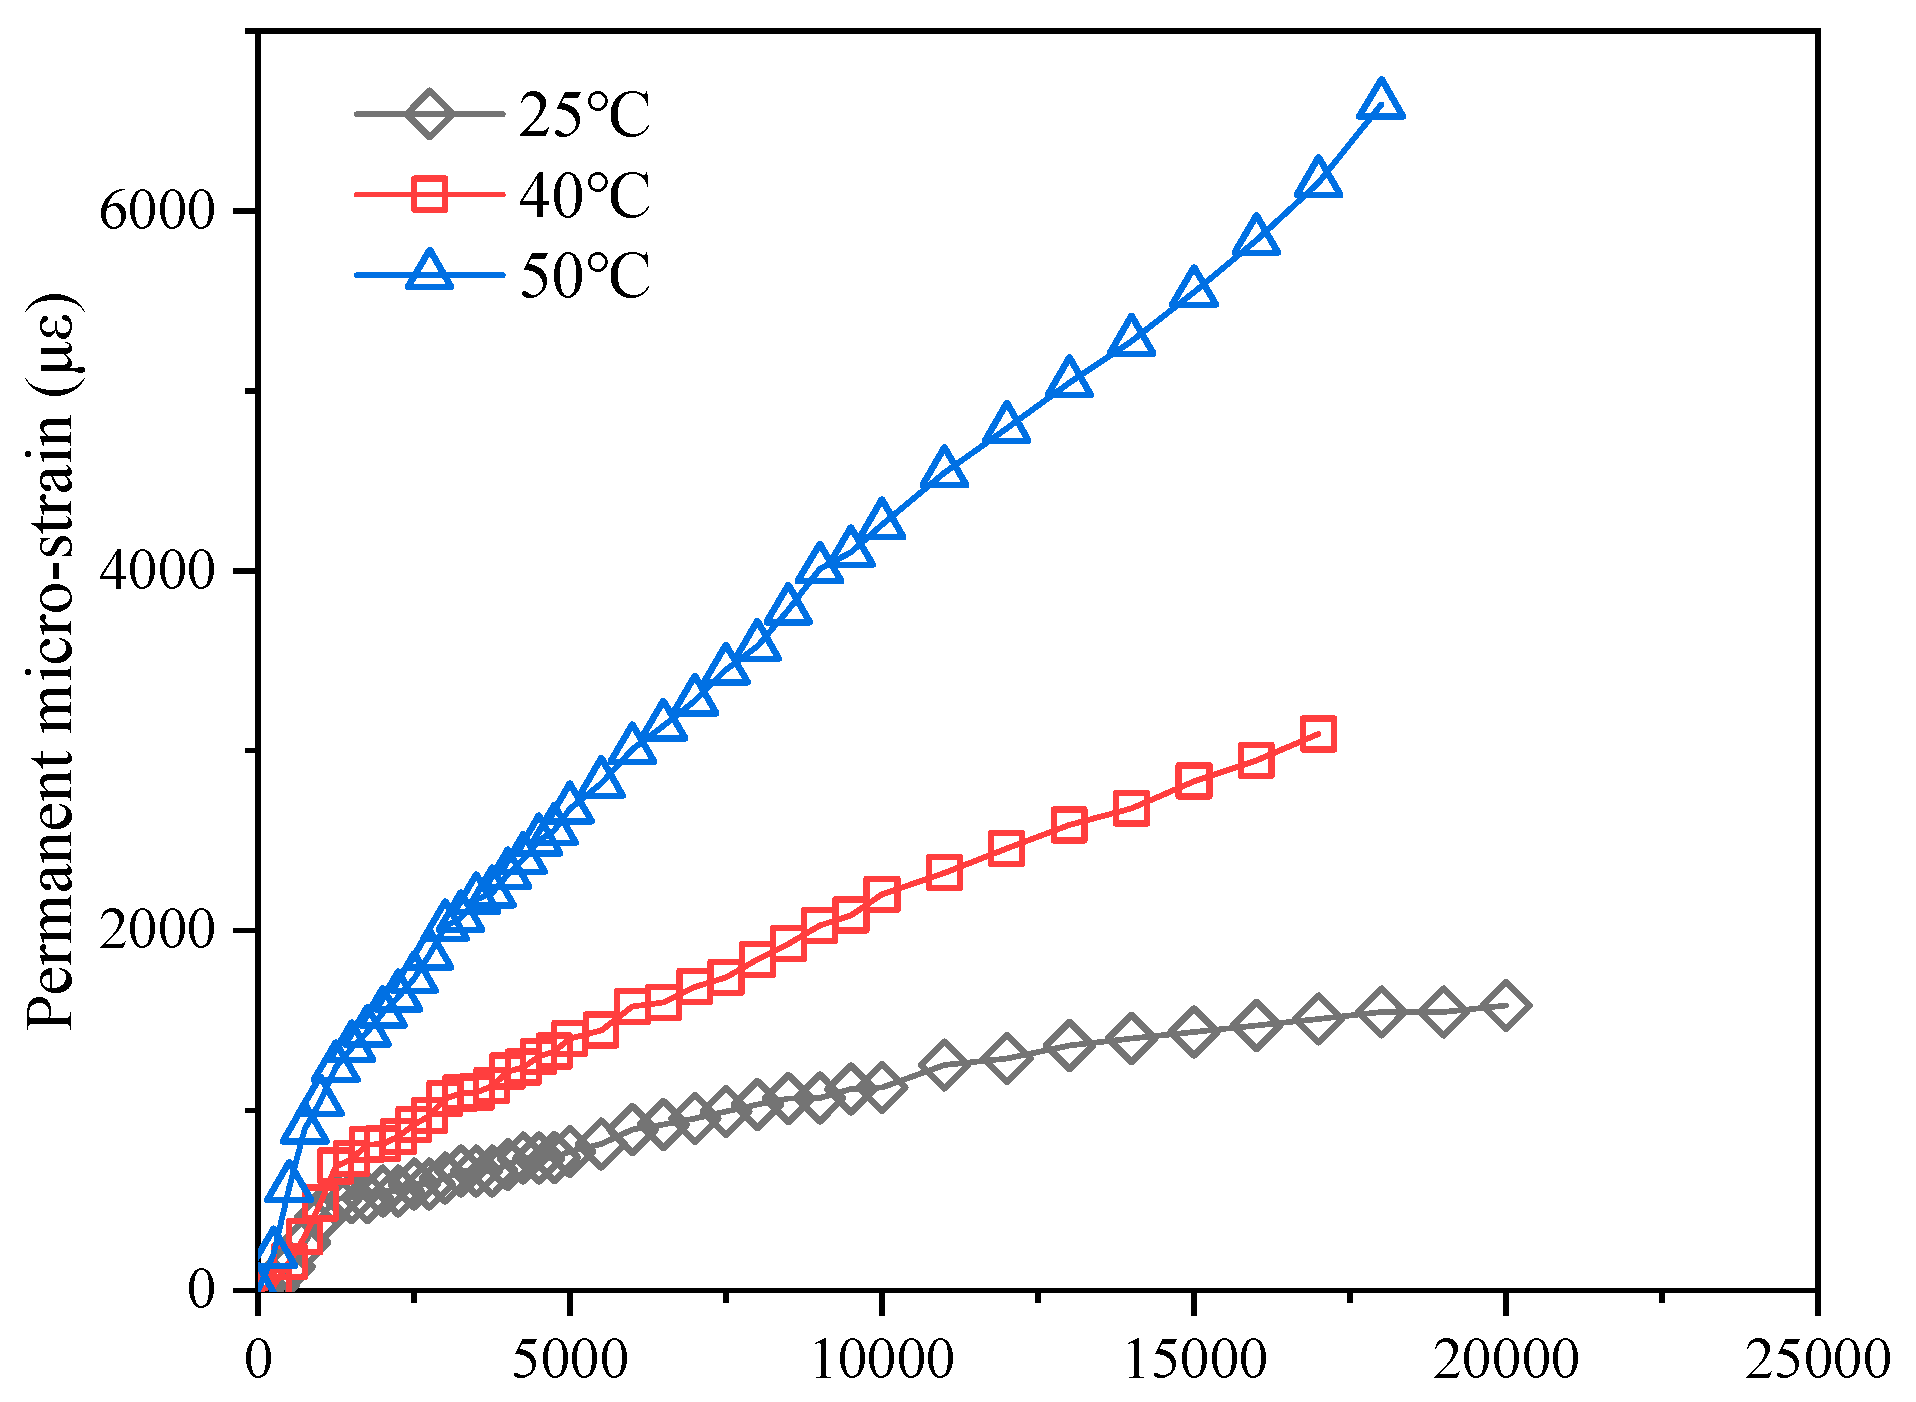
Step 3: Process the results of the repeated loading creep tests to obtain the permanent deformation parameters μ and α required for the VESYS rutting prediction model.
Step 4: Substitute the deflection values at the top and bottom of the intermediate layer, along with the μ and α values for each asphalt content, into the VESYS rutting prediction model. Calculate the estimated rutting amount for the intermediate layer and make necessary adjustments.
Step 5: Use the finite element calculation results to estimate the rutting contribution rate of the intermediate layer. In conjunction with the requirements for asphalt pavement rutting depth specified in the “Technical Specifications for Maintenance of Highway Asphalt Pavements [9]”, determine the allowable rutting value for the intermediate layer.
Step 6: Compare the estimated rutting value obtained in Step 4 with the allowable rutting value obtained in Step 5. If the estimated rutting value is less than the allowable rutting value, the asphalt content is acceptable. This comparison helps to determine the optimal range of asphalt content for the intermediate layer’s rutting resistance performance.

3. Optimization of Asphalt Mixture BDM Considering Intermediate Layer Properties

3.1. Establishment of Finite Element Model

Asphalt pavement structures are layered, and each layer has different stress characteristics, resulting in varying resistance to deformation and cracking. For instance, in a three-layer asphalt pavement structure, the intermediate layer may contribute most significantly to rutting, while the bottom layer plays a more critical role in resisting reflective and fatigue cracking. The purpose of establishing a finite element model is to obtain the parameters needed for calculating the estimated rutting depth and allowable rutting depth: the deflection values at the top and bottom of the intermediate layer of the asphalt pavement and the rutting contribution rate of the intermediate layer. In actual road structures, the pavement is subjected to non-uniform loads, and the contact condition between layers is a complex state that lies between continuous and smooth, with asphalt mixtures exhibiting significant viscoelastic behavior. Therefore, this chapter uses the finite element software ANSYS to establish a three-dimensional asphalt pavement structure model under measured wheel loads, interlayer interfaces, and viscoelastic conditions and to calculate the deflection values at the top and bottom of the intermediate layer and its rutting contribution rate under high-temperature conditions of 54 °C.
The contact pressure between the tire and the pavement is based on actual measurements, with the total load weight being the standard axle load of 100 kN. The model uses an X-Y-Z three-dimensional coordinate system to establish the pavement structure. The entire model has a planar size of 4 m × 4 m, with a subgrade depth of 6 m. The model consists of three layers of asphalt surface, two layers of base, and the subgrade. The boundary conditions are as follows: the bottom of the subgrade is restricted in X, Y, and Z directions; the sides of the model are restricted in the X direction; and the front and back of the model are restricted in the Y direction. The direction of vehicle travel is consistent with the Y direction. A schematic diagram of the three-dimensional model is shown in Figure 3.
In the structural model, stress transfer between layers is achieved through contact. The connection between asphalt layers and between the asphalt surface layer and the base layer is simulated using contact pairs, which control vertical displacement. The friction coefficient between surface layers is 0.7, and between the base and surface layers is 0.5. In the ANSYS library, numerous units for contact simulation are available. When a rigid body contacts a flexible one, the rigid body is the target surface (simulated by Targe170), and the flexible body is the contact surface (simulated by Conta174). These two units form a contact pair to control vertical displacement.
Due to the influence of the temperature field within the asphalt pavement structure, the surface layer structure is divided into ten sublayers. A temperature field that varies with the thickness of the asphalt surface layer is established, and the viscoelastic parameters under the condition of 54 °C are input. This allows for the calculation of the deflection values at the top and bottom of the intermediate layer at 54 °C, as well as the rutting contribution of the required surface layer. This prepares for the determination of the estimated rutting depth and the allowable rutting depth.

3.2. Rutting Estimation Calculation

3.2.1. Rutting Model Selection and Calibration

The VESYS rutting model selected in this paper is based on the assumption that the permanent deformation produced by the specimen under each load application can be represented by Equation (1):
Δ ε p ( N ) ε = μ N α
Δεp(N) represents the vertical permanent deformation under each repeated load application; ε is the strain value corresponding to the peak vertical stress at the 200th repeated load application; and μ and α are the material’s permanent deformation parameters.
In Equation (1), ε is a constant obtained through testing, and the increment of permanent deformation Δεp(N) under each repeated load application can be expressed as:
Δ ε p ( N ) = ε ε r ( N )
εr(N) is the resilient strain under the Nth load application. Therefore, the rutting depth of any structure under Nth load applications can be expressed as:
R D = H × ε p = H × ε μ 1 α N 1 α
The VESYS rutting model estimates the permanent deformation of the pavement by analyzing the resilient and permanent deformation patterns of each layer. The permanent deformation of the pavement can be represented as:
R D = N 1 N 2 U s + e t e s μ s u b N α s u b d N + i = 1 n N 1 N 2 ( U i + U i ) μ i N α i d N
In the equation, US+ represents the deflection at the subgrade surface under a single-axle load; Ui+ and Ui are the deflections at the top and bottom surfaces of the ith layer under multi-axle loads, respectively; et is the strain at the subgrade surface under multi-axle loads; es is the strain at the subgrade surface under a single-axle load; μsub and αsub are the permanent deformation parameters of the subgrade material; μi and αi are the permanent deformation parameters of the material in the ith layer.
Therefore, the rutting model for the asphalt pavement structure layers is:
R D = i = 1 n k R D ( U i + U i ) μ i N α i d N
In the equation, kRD is a calibration factor; Ui+ and Ui are the deflections at the top and bottom surfaces of the ith layer under multi-axle loads, respectively; N is the number of load applications; n is the number of asphalt layers; μi and αi are the permanent deformation parameters of the material in the ith layer.
The calibration factor is a function of pavement temperature (T) and asphalt layer thickness (ℎOL). However, the permanent strain (εp) is not necessarily proportional to the resilient deformation, but it is related to the resilient deformation and modulus. Therefore, the modulus can also serve as one of the calibration factors. Consequently, the calibration factor includes the temperature of the asphalt pavement (T), the modulus of the asphalt pavement (E), and the thickness of the asphalt pavement (ℎOL), that is:
k R D = f 1 ( T ) × f 2 ( E ) × f 3 ( h O L )
Based on the research findings from the track tests conducted by the Asphalt Technology Center in the United States [10]:
f 1 ( T ) = 0.191112 + 3.643124 1 + e 18.3009 0.204437 T
f 2 ( E ) = 0.30787 + 1.27860 1 + e 8.28248 + 0.09239 E
f 3 ( h O L ) = ( 0.01445272 h 1 3 0.12471319 h 1 2 + 0.22193794 h 1 + 1.37640722 ) ×                                 ( 0.00567302 h 2 3 0.07104301 h 2 2 0.49592553 h 2 + 2.12378879 ) ×                                     ( 0.00199314 + 0.54035153 1 + e 2.61478586 + 0.58494148 ( h 1 + h 2 ) )
In the equation, T is the temperature of the asphalt pavement (°F). E is the dynamic modulus value of the asphalt mixture measured at 50 °C and 10 Hz (ksi).

3.2.2. Model Parameter Acquisition

(1) Permanent Deformation Parameter Calculation
Permanent deformation parameters of asphalt mixtures can be obtained through repeated loading creep tests. Under the continuous changes of traffic loads and environmental conditions, different stress levels can affect the development of rutting, leading to cumulative damage. The “time hardening” process provides a reasonable method for calculating cumulative damage.
Under the action of each vehicle load, the permanent deformation can be calculated using the following formula:
ε i p = ε i p ( N = 1 ) N e q i + n i b N e q i b
In the equation, εip (N = 1) represents the permanent strain under the first load application; ni is the number of load applications during the ith stage; Neqi is the number of load applications before the start of the ith stage; b is the slope determined from the linear part of the curve plotted in a double-logarithmic coordinate format, showing the relationship between cumulative axial permanent micro-strain and the number of load applications.
For any structural layer, the time hardening process is as follows:
N e q = 0 First   stage :   ε 1 p = ε 1 p ( N = 1 ) N 1 b 1
N e q 2 = ε 1 p ε 2 p ( N = 1 ) 1 b 2 Second   stage : ε 2 p = ε 2 p ( N = 1 ) N e q 2 + n n b 2 N e q 2 b 2
N e q l = ε l 1 p ε l p ( N = 1 ) 1 b l Third   stage :   ε l p = ε l p ( N = 1 ) N e q l + n l b l N e q l b l
Permanent deformation is obtained through repeated loading creep tests. After processing the experimental data, a curve is plotted showing the relationship between the number of load applications and the permanent micro-strain. The schematic diagram is shown in Figure 4.
The steps for calculating permanent deformation parameters are described as follows:
  • The axial strain value is obtained by dividing the average value of readings from two LVDT sensors by the gauge length.
  • Obtain the axial permanent strain and the elastic strain (εr) under the 100th repeated loading.
Plot the relationship curve between cumulative axial permanent micro-strain and the number of load applications using a double-logarithmic coordinate format. Determine the permanent deformation parameters a (intercept) and b (slope) from the linear part of the curve [11], as shown in Figure 5.
Calculate the permanent deformation parameters μ and α:
μ = a b ε r
α = 1 b
(2) Deflection Value Calculation
For deflection values, the vertical displacements at various points are calculated and output using the finite element model. The vertical displacements at points on either side of the midpoint at the top and bottom of the intermediate layer are taken as the deflection values, and the deflection difference is calculated.

3.3. Rutting Allowable Value Calculation

3.3.1. Rutting Contribution Rate for the Intermediate Layer

The so-called rutting contribution rate refers to the proportion of rutting in each layer of the asphalt pavement surface layer to the total rutting. Existing research results indicate [12] that the shear strain γxz and compressive strain εz have a more direct relationship with the rutting of asphalt pavements. The integral result of strain with depth is the strain energy, which can better evaluate the level of rutting resistance of the asphalt pavement structure layers. This paper intends to use strain energy to assess the level of rutting resistance of the asphalt pavement structure layers and to determine the rutting contribution rate of each structural layer.
Strain energy (the area enclosed by the strain-depth curve) can characterize and quantify the permanent deformation of the asphalt pavement structure layers. By integrating the curve of shear strain γxz with depth and the curve of compressive strain εz with depth, the permanent deformation of the asphalt pavement structure layers can be quantified.
A 1 γ = 0 h 1 γ x z d h
A 2 γ = h 1 h 1 + h 2 γ x z d h
A 3 γ = h 1 + h 2 h 1 + h 2 + h 3 γ x z d h
A 1 ε = 0 h 1 ε z d h
A 2 ε = h 1 h 1 + h 2 ε z d h
A 3 ε = h 1 + h 2 h 1 + h 2 + h 3 ε z d h
In Equation, A represents the shear strain energy of the top layer; A represents the shear strain energy of the bottom layer; A represents the compressive strain energy of the top layer; A represents the compressive strain energy of the bottom layer. ℎ1 indicates the thickness of the top layer of the asphalt pavement; ℎ2 indicates the thickness of the intermediate layer of the asphalt pavement; and ℎ3 indicates the thickness of the bottom layer of the asphalt pavement.
The rutting contribution rate is the proportion of the rutting depth of each layer in the asphalt pavement structure to the total rutting depth [12]. Strain energy can quantify the permanent deformation (rutting depth) of the asphalt pavement structure layers. Therefore, the rutting compressive strain contribution rate and the rutting shear strain contribution rate for each structural layer are the ratios of the compressive and shear strain energies of each layer to the total strain energy of the asphalt pavement. Schematic diagrams of the compressive strain and shear strain rutting contribution rates are shown in Figure 6 and Figure 7.
Compressive strain rutting contribution rate:
SA = A/(A + A + A) represents the compressive strain rutting contribution rate of the top layer, %;
ZA = A/(A + A + A) represents the compressive strain rutting contribution rate of the intermediate layer, %;
XA = A/(A + A + A) represents the compressive strain rutting contribution rate of the bottom layer, %;
Shear strain rutting contribution rate:
SA = A1γ/(A + A + A) represents the compressive strain rutting contribution rate of the top layer, %;
ZA = A2γ//(A + A + A) represents the compressive strain rutting contribution rate of the intermediate layer, %;
XA = A/(A + A + A) represents the compressive strain rutting contribution rate of the bottom layer, %.

3.3.2. Allowable Rutting Depth for the Intermediate Layer

According to the ref. [9], the rutting depth of asphalt pavements on expressways and first-class highways should be ≤15 mm.
Referring to this standard and combining it with the rutting contribution rate of the asphalt pavement structure layers, this paper assumes that the allowable rutting depth for the intermediate layer of the asphalt pavement structure is less than or equal to (15× the rutting contribution rate of the intermediate layer) mm.

4. Application of Optimized Asphalt Mixture BDM

4.1. Pavement Structure Materials

Taking the construction project of Wuhan South Fourth Ring Expressway as an example, this study conducts an application research on the BDM of intermediate surface layer asphalt mixtures based on the characteristics of the stratum. The upper surface layer of asphalt uses basalt SMA-13, while the intermediate and lower layers use limestone AC-20 and AC-25, respectively. The gradations of the three types of aggregates are shown in Table 1.
The pavement structure and the recommended material parameters are shown in Table 2.

4.2. Determining the Optimum Asphalt Content

As shown in Table 3, in this example, the optimal asphalt content determined by the SUPERPAVE design method is used as the basis, and asphalt contents that meet the requirements of VMA or VFA are selected for testing. The HWTT and OT for the intermediate layer are conducted at three asphalt contents: OAC (optimum asphalt content), OAC + 0.3%, and OAC + 0.6%. The test results are shown in Figure 8.
According to the requirements of the two test indicators, the HWTT results are considered qualified if the maximum rut depth is less than 12.5 mm after 20,000 wheel passes, and the OT results are qualified if the number of cycles reaches at least 100 when the maximum tensile stress decreases to 7% of the initial maximum tensile stress. The HWTT results meet the criteria, and the trend line of the HWTT indicates that the upper limit of asphalt content can reach approximately 4.9%. The asphalt content corresponding to 100 cycles in the OT test is about 4.3%. Therefore, the effective range of asphalt content determined by the balanced design method for this material is 4.3% to 4.9%.

4.3. Calculation of Permanent Deformation Parameters

Three asphalt contents of 4.3%, 4.6%, and 4.9% were selected within the effective asphalt content range to conduct repeated loading creep tests under the condition of 50 °C. Based on the experimental results, the relationship curves between the cumulative axial permanent micro-strain and the number of load applications were drawn as shown in Figure 9, and the permanent deformation parameters were calculated. The calculation results of the permanent deformation parameters are shown in Table 4.

4.4. Calculation of the Rutting Contribution Rate and Deflection of the Intermediate Layer

According to the results of the dynamic modulus test, they are converted into the relaxation modulus. The generalized Maxwell model is used to simulate the viscoelastic input into the finite element model. Finite element modeling is used to calculate the deflection values at the top and bottom of the intermediate layer and the rutting contribution rate of the intermediate layer when the asphalt content of the intermediate layer is 4.3%, 4.6%, and 4.9%, respectively. The calculation results of the deflection of the intermediate layer are shown in Table 5.
The rutting contribution rate of the intermediate layer under each asphalt content is calculated based on the curve chart, and the results are shown in the following Table 6.

4.5. Calculation of Rutting Prediction Value Using VESYS Model

Substitute the permanent deformation parameters and the deflection values at the top and bottom surfaces corresponding to each asphalt content of the intermediate layer obtained from the above calculations into the formula of the VESYS rutting prediction model. Since the case in question is a fast road, the N value in the VESYS rutting prediction model is taken as ten million times. After correcting the results, the rutting depth values under each oil content are obtained, and the results are shown in Table 7.

4.6. Determination of the Optimal Asphalt Content Based on the Rutting Resistance Characteristics of the Intermediate Layer

According to the specifications in our country, the allowable rutting depth of asphalt pavement on expressways and first-class highways is ≤15 mm. Referring to this standard and combining with the rutting contribution rate of the intermediate layer of asphalt pavement under each asphalt content, the allowable rutting depth under each asphalt content is calculated and shown in Table 8.
Compare the rutting depth obtained from the VESYS rutting prediction model under each asphalt content with the allowable rutting depth. When the rutting depth is less than the allowable rutting depth, the asphalt content is considered qualified. It can be seen that under the material and pavement combination form of this example, the asphalt contents of 4.3% and 4.6% in the intermediate layer of the asphalt pavement can meet its rutting resistance characteristics. At an asphalt content of 4.9%, the rutting prediction value exceeds the allowable rutting depth. Based on this, the asphalt content designed by the BDM based on the rutting resistance performance of the intermediate layer for this pavement structure and this kind of material is 4.3%–4.6%. In actual engineering, it is recommended to take 4.4% as the optimal asphalt content for AC20.

5. Discussion

The comparison between Marshall, Superpave, and current AASHTO design procedures and the BDM in this manuscript is as follows:

5.1. Comparison of Several Procedures with BDM

Marshall design procedure focuses on the analysis of asphalt mixture density and air void characteristics. It ensures proper volumetric proportions and determines the optimum binder-to-aggregate ratio by taking the midpoint of a suitable range. However, the link between volumetric parameters and pavement performance is weak. The Superpave design procedure can determine the best asphalt usage based on volumetric characteristics, emphasizing gradation design and asphalt material selection. Specimens are made using a gyratory compactor to simulate actual construction compaction. It sets control standards based on traffic but is complex and can result in insufficient field compaction. AASHTO design procedures are based on empirical formulas and statistics for pavement structure design. They rely on field tests and historical data, adjusting parameters for different traffic and climate conditions and focus on pavement structure. Different design procedures can lead to significantly different optimal asphalt contents for the same materials. Almost none of these procedures consider pavement structure, layer position, or thickness. This disconnects pavement structure and material design, underutilizing material properties. Performance tests mainly focus on high-temperature stability, with less attention to low-temperature crack resistance. Compared with the above procedures, the BDM proposed in this manuscript emphasizes meeting field performance requirements. It considers the characteristics of asphalt layers to balance crack and deformation resistance when determining the optimal asphalt content. Results can be further optimized based on specific road structures and performance needs.

5.2. Challenges in Implementing Asphalt Content in Full Scale Pavement Applications

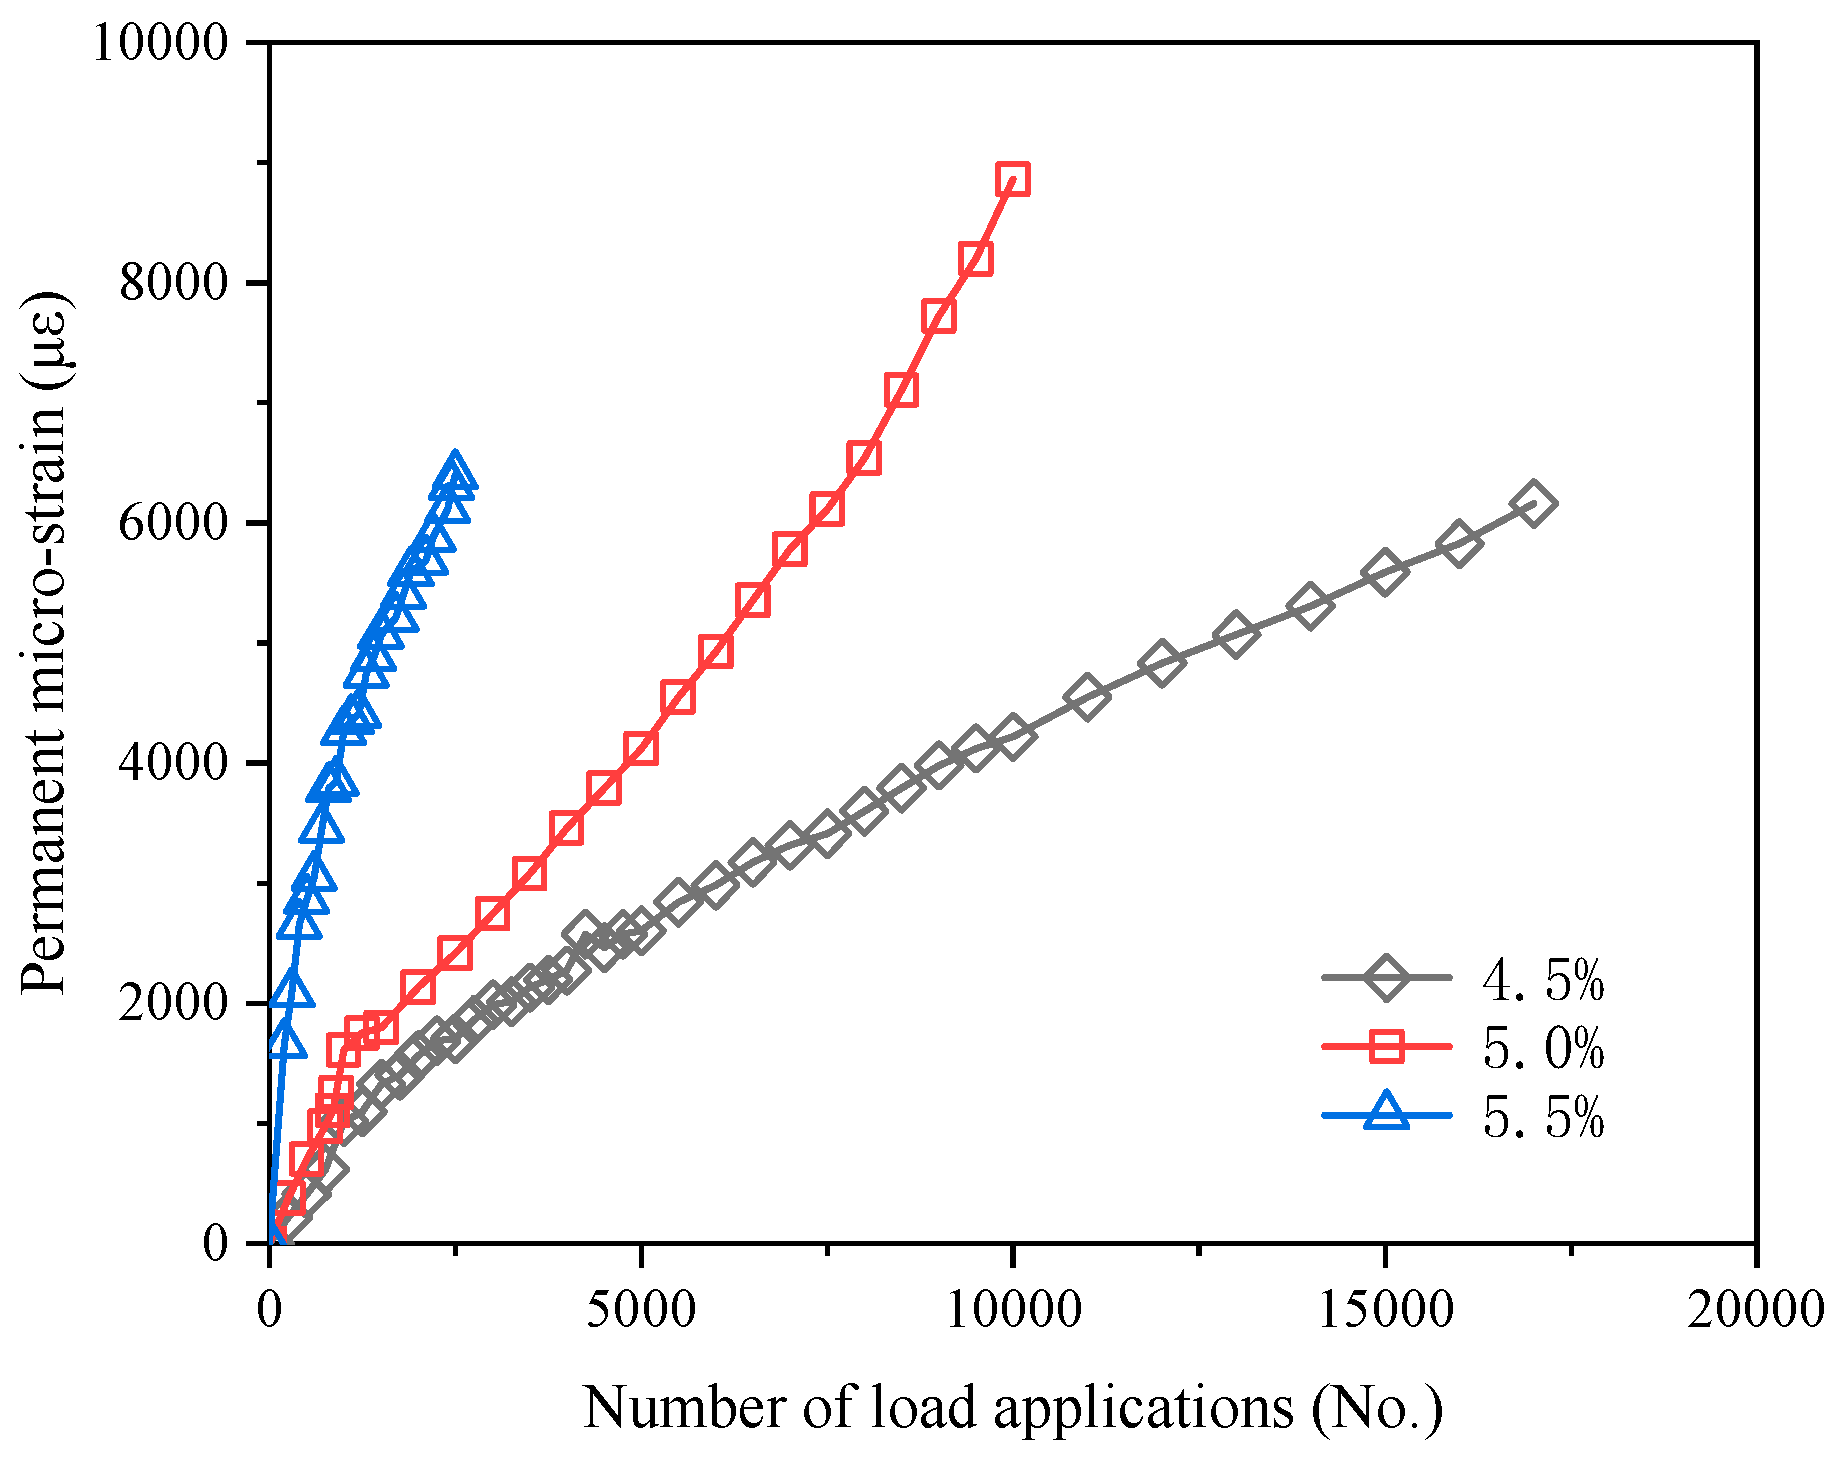
In full scale pavement applications, the implementation of the author’s suggested asphalt content mainly faces the following challenges. Both the rutting resistance standard and the referenced OT test—based cracking resistance standard need correction using pavement survey data. For the cracking resistance standard, it can be determined by comprehensively analyzing pavement survey data (like cumulative load/thermal stress—induced crack—free axle passes), relevant material-based cracking test results, and theoretically calculated fatigue lives of pavement layers under temperature-load coupling. Then, further correction is done using tracking pavement survey data, with structural layer thickness and position also considered. The rutting resistance standard is established based on existing pavement survey data, including rutting data under different load applications, relevant material-based rutting test results, and a rutting prediction model. Similarly, this standard is refined with tracking pavement survey data. This study offers a specific approach and steps for the middle surface layer’s characteristics. Future research can optimize the effective asphalt content by integrating the characteristics of the upper and lower surface layers.

5.3. Alignment of Research Content with Existing Pavement Design Standards

The premise of the initial selection of the asphalt stone ratio is that the VMA of the asphalt mixture must meet the requirements of the pavement specifications, and the mixture forming test controls the range of void ratio, which matches the existing pavement design standards. The contribution rate of each asphalt layer to rutting on asphalt pavement is different, and the contribution rate is affected by changes in modulus and thickness. By predicting the depth of rutting and calculating the contribution rate of the middle layer rutting, the oil stone ratio can be further optimized based on the initial selection of the oil stone ratio in the early stage. The oil stone ratio initially selected in the early stage is a range of values that can meet the requirements of both crack resistance and high temperature stability. Within this range, further consideration needs to be given to whether the optimal oil content should be taken as the median value, a smaller value, or a larger value (existing standards often take the median value in a general way). In fact, due to differences in pavement structure thickness and materials, each layer has different emphasis on the high temperature stability and low temperature stability of the mixture. By calculating and predicting the amount of ruts, the requirements for high temperature stability and low temperature crack resistance of this layer can be clarified, and the range can be further narrowed within the initial selection of oil stone ratio to determine the optimal oil stone ratio. In fact, the standards all propose a unified rutting allowance value for the overall road surface to control high temperature stability because the contribution rate of rutting in each layer of the road surface is different. Therefore, accurately obtaining the rutting allowance value for each layer as an indicator is more accurate. The high temperature stability requirements of each layer narrow down the range of the oil stone ratio.

5.4. Analysis of Asphalt Durability

This study did not explore the impact of oxidation on asphalt performance, only conducting the asphalt raw material’s rotational thin-film heating test. It was found that the air voids ratio greatly affects asphalt durability. When initially selecting the asphalt content, the mineral gap rate (VMA) was considered. Three to five binder-to-aggregate ratios were preliminarily chosen within the VMA specification range. During mix performance testing, the air voids ratio of the asphalt mixture was controlled at 7 ± 1%. The early volume index control ensures the durability of the asphalt mixture. However, the relationship between durability and oxidation requires further study.
The optimum asphalt content is recommended to be 4.3%–4.6%. but there are no field test sections to support the effectiveness of these numbers, Therefore, the study will be further developed in subsequent research to verify the long-term performance.

6. Conclusions

In response to the one-sidedness in the current methods for determining the optimal asphalt content in hot-mix asphalt mixtures, this paper proposes a BDM for the optimal asphalt content of asphalt mixtures based on layer characteristics, through theoretical analysis and numerical calculations. This method fully considers the dual requirements of the asphalt pavement structure’s resistance to rutting and cracking, and integrates the characteristics of the pavement layers. It provides a new, theoretically grounded experimental approach for determining the optimal asphalt content in asphalt mixtures. The main conclusions of this paper are as follows:
(1)
Considering the rutting and cracking resistance of asphalt mixtures comprehensively, the basic concept of the BDM of asphalt mixture based on layer characteristics is proposed, and the specific experimental methods, evaluation indicators, and basic steps for the design are also provided.
(2)
HWTT and OT can be conducted to preliminarily select the effective asphalt content range. Combining the permanent deformation parameters of asphalt mixture obtained from the test with the VESYS wheel tracking prediction model to calculate the wheel tracking prediction value, and then importing the wheel tracking contribution rate obtained from numerical simulation and the allowable wheel tracking depth value of the middle layer, the optimal asphalt content range for the middle layer asphalt mixture can be finally determined.
(3)
By comparing the wheel tracking depth obtained by the VESYS wheel tracking prediction model at each asphalt content with the allowable wheel tracking depth, the research results show that the asphalt content designed according to the wheel tracking resistance of the middle layer of this pavement structure and material, proposed by the balanced design method of asphalt mixture in this paper, is 4.3%–4.6%. In practical engineering, the optimal asphalt content for AC20 is recommended to be 4.4%.

Author Contributions

X.H.: Data curation, Validation and Writing—original draft. Q.M. and J.Y.: Conceptualization and Writing—review and editing. J.Y.: Project administration and Funding acquisition. G.C. and Y.Z.: Data curation and Investigation. X.C.: Investigation and Methodology. All authors have read and agreed to the published version of the manuscript.

Funding

This work is financially supported by the Chongqing Natural Science Foundation (No. CSTB2022NSCQ-MSX1242) and the Chongqing Construction Plan Project (No. 8-5, City Kezi 2023).

Institutional Review Board Statement

This study did not require ethical approval.

Informed Consent Statement

This study did not involve humans.

Data Availability Statement

This original contribution presented in the study are included in the article; further inquiries can be directed to the corresponding author.

Acknowledgments

We would like to express our gratitude to the editors and the reviewers for their constructive and helpful review comments.

Conflicts of Interest

Xianglong Chen was employed by the company China Harbour Engineering Company Ltd. The remaining authors declare that the research was conducted in the absence of any commercial or financial relationships that could be construed as a potential conflict of interest.

References

  1. Zhou, F.; Hu, S.; Scullion, T. Integrated Asphalt (Overlay) Mixture Design, Balance Rutting and Cracking Requirements; Technical Report FHWA/TX-06/0-5123-1; Texas Transportation Institute: College Station, TX, USA, 2006. [Google Scholar]
  2. Scullion, T.; Hu, X.; Design, S.S. Construction and Performance Monitoring of the Very Thin Overlay Placed on BUS 59 in the Lufkin District; Technical Report FHWA/TX-10/5-5598-01-2; Texas Transportation Institute: College Station, TX, USA, 2010. [Google Scholar]
  3. Walubita, L.; Hu, X.; Scullion, T. Laboratory evaluation of two different HMA mix-design methods and test procedures. Asfaltosy Pavimentos Magazine, 4–16 June 2012; Edition# 24. [Google Scholar]
  4. Ferdous, N.; Sener, I.N.; Bhat, C.R.; Reeder, P. Tour-Based Model Development for TxDOT: Implementation Steps for the Tour-Based Model Design Option and the Data Needs; Center for Transportation Research, The University of Texas at Austin: Austin, TX, USA, 2022. [Google Scholar]
  5. Idris, I.I.; Sadek, H.; Hassan, M. State-of-the-art review of the evaluation of asphalt mixtures’ resistance to reflective cracking in laboratory. J. Mater. Civ. Eng. 2020, 32, 03120004. [Google Scholar] [CrossRef]
  6. Silva, L.S.V.D.; Bastos, J.B.D.S.; Lucas Júnior, J.L.O.; Babadopulos, L.F.D.A.L.; Soares, J.B. Evaluation of moisture-induced damage on the fatigue life of asphalt mixtures using failure tests of asphalt binders, interfaces, and mixtures. Fatigue Fract. Eng. Mater. Struct. 2024, 47, 2481–2496. [Google Scholar] [CrossRef]
  7. He, Y.; Huang, T.; Liu, J. Optimization design of thermal reclaimed asphalt mixture based on Superpave method and balanced design method. Highw. Eng. 2024, 49, 106–112. [Google Scholar]
  8. Lim, S.M.; He, M.; Hao, G.; Ong, G.P. Laboratory evaluation of the recyclability potential of recycled plastic-modified asphalt concrete and its environmental impact. In Proceedings of the International Conference on Transportation Geotechnics, Sydney, Australia, 20–22 November 2024; Springer: Singapore, 2025. [Google Scholar]
  9. JTJ 073.2-2001; Technical Specification for Maintenance of Highway Asphalt Pavement. People’s Communications Press: Beijing, China, 2001.
  10. Zhou, F.; Hu, S.; Hu, X.; Scullion, T. Mechanistic-Empirical Asphalt Overlay Thickness Design and Analysis System; Mathematical Models; Texas Transportation Institute, The Texas A&M University System: College Station, TX, USA, 2009. [Google Scholar]
  11. AASHTO TP9-96; Method for Determining the Creep Compliance and Strength of Hot Mix Asphalt (HMA) Using the Indirect Tension Tensile Test Device. AASHTO Standards: Frederick, MD, USA, 1996.
  12. Zhong, S. Research on Asphalt Pavement Rutting Based on Structural Layer Position Characteristics; Wuhan Institute of Technology: Wuhan, China, 2014. [Google Scholar]
Figure 1. Asphalt content of balanced design.
Coatings 15 00384 g001
Figure 2. Steps to determine the effective asphalt content range.
Coatings 15 00384 g002
Figure 3. The schematic diagram of three-dimensional model.
Coatings 15 00384 g003
Figure 4. Repeated loading creep curves.
Coatings 15 00384 g004
Figure 5. Regression parameters a and b.
Coatings 15 00384 g005
Figure 6. Schematic diagram of contribution rate of pressure strain rutting.
Coatings 15 00384 g006
Figure 7. Shear strain rutting contribution diagram.
Coatings 15 00384 g007
Figure 8. BDM asphalt content zone chart.
Coatings 15 00384 g008
Figure 9. Repeated loading creep curve chart.
Coatings 15 00384 g009
Table 1. The gradation of asphalt mixtures.
The Mass Percentage Passing Through the Following Sieves (%)
31.526.5191613.29.54.752.361.180.60.30.150.075
SMA-13Specification requirements10010010010090–10050–7526–3415–2614–2412–2010–169–158–12
Design mix proportion////93.368.627.219.716.214.112.511.210
AC-20Specification requirements10010090–10078–9262–8050–7226–5616–4412–338–245–174–133–7
Design mix proportion//99.284.372.261.938.330.321.315.210.67.45.7
AC-25Specification requirements10090–100 75–9065–8357–7645–6524–5216–4212–338–245–174–133–7
Design mix proportion/96.882.972.164.457.538.230.221.315.110.67.45.7
Table 2. Pavement structure type.
Structural LayerMixture TypeAsphalt TypeThickness
(mm)
Density
(kg/m3)
Modulus
(MPa)
Poisson’s Ratio
Upper surface layer SMA-13SBS I-D402600//
Intermediate surface layerAC-20SBS I-D602500//
Lower surface layer AC-25AH-70802500//
Base course//270240041000.2
Subbase course//270200040000.2
Subgrade//60001900600.4
Table 3. Performance indices of asphalt mixture.
Mixture Asphalt to Aggregate RatioVMA Required VMA Value VFARequired VFA Value
SBS-AC-204.00%14.30≥1361.5065–75
4.30%14.2565.15
4.60%14.1071.05
Table 4. Permanent deformation parameters.
Asphalt Content (%) Permanent Deformation Parameters50 °C
4.3μ0.254
α0.683
4.6μ0.264
α0.636
4.9μ0.350
α0.582
Table 5. Deflection values at the top and bottom surfaces of the intermediate layer in asphalt pavement.
Layer Position Asphalt to Aggregate RatioLocationDeflection Value
Intermediate layer4.3%Top surface12.06
Bottom surface10.28
4.6%Top surface12.80
Bottom surface10.30
4.9%Top surface12.84
Bottom surface10.35
Table 6. Rutting contribution rate of the intermediate layer in asphalt pavement.
Layer PositionAsphalt to Aggregate Ratio (%)Rutting Contribution Rate due to Compressive Strain (%)Rutting Contribution Rate due to Shear Strain (%)
Intermediate layer4.349.948.3
4.653.154.6
4.959.958.3
Table 7. Rutting depth of the intermediate layer in asphalt pavement.
LayerAsphalt Content Rutting Depth (mm)
Intermediate layer4.3%2.08
4.6%8.06
4.9%10.89
Table 8. Allowable rutting depth of the intermediate layer in asphalt pavement.
LayerAsphalt ContentAllowable Rutting Depth (mm)
Intermediate layer4.3%7.49
4.6%8.19
4.9%8.99
Disclaimer/Publisher’s Note: The statements, opinions and data contained in all publications are solely those of the individual author(s) and contributor(s) and not of MDPI and/or the editor(s). MDPI and/or the editor(s) disclaim responsibility for any injury to people or property resulting from any ideas, methods, instructions or products referred to in the content.

