Abstract
This study establishes a numerical simulation model based on heat and mass transfer theory to reflect the variations in temperature and humidity conditions within a tunnel. It analyzes the impact of high-temperature fissure water, humid porous media, and drainage methods on the temperature and humidity distribution in a tunnel. The results indicate the following: (1) When the area of the humid porous media increases from 150 m2 to 300 m2, the relative humidity (RH) of the air in the tunnel rises from 52.7% to 55.8%, but the impact on air temperature (Ta) is minimal. (2) The heating and humidification effects of hot water in a drainage ditch on the airflow cannot be overlooked. Meanwhile, the hot water transfers heat to the surrounding rock, with heat transfer predominantly driven by the surrounding rock convection. Compared to a drainage pipe, the heat transfer amount increases by 44.9%, and RH rises by 9.3%. (3) For every increase of 5 °C in water temperature (water volume of 90 m3/h), the ventilation outlet Ta linearly increases by 0.15 °C, and the rate of increase in RH accelerates with rising water temperature. (4) Covering a drainage ditch with a cover plate can reduce RH by 12.3%, while spraying a 10 cm insulation layer on the tunnel walls can significantly lower Ta by 0.66 °C. These findings provide a potential solution for the application of insulation materials in reducing the thermal hazards of deep high temperatures.
1. Introduction
The increasing demand for mineral resources and advancements in mining technology have led to a shift towards deeper mining levels globally [1,2]. As mining depths continue to increase, high mine temperatures have emerged as a critical issue in deep mining research [3,4]. The discharge of large volumes of hot water has resulted in elevated levels of thermal damage in mines [5,6]. Seeping hot water acts as a “reinforcing agent”, regulating the temperature and humidity of the tunnel airflow [7,8]. Excessive temperatures not only reduce productivity but also heighten the risk of accidents [9,10,11]. Consequently, high-temperature heat damage has become a major constraint on the safe operation of mines.
Several scholars have analyzed the distribution of temperature and humidity fields in tunnels affected by high-temperature fissure water theoretically. Qu et al. demonstrated that the complexity of the fissure network influences the temperature distribution in the surrounding rock and plays a role in the formation of thermal hazards in mines [12]. Gong et al. [13] explored the coupling characteristics of seepage and temperature fields, as well as the heat transfer and exchange mechanisms related to fissure extension. Chen et al. [14] examined the heat transfer mechanisms of groundwater flow under coupled seepage-temperature conditions. Zeng et al. [15] investigated the thermal regulation of tunnels and the surrounding ambient temperatures and analyzed the impact of surrounding rock and ventilation on the tunnel temperature field. However, these studies assumed dry surrounding rock and did not account for the effects of humidity. Li et al. [16] explored the influence of various parameter conditions on the temperature and humidity of tunnel airflow based on field measurements, derived a model for heat exchange between the airflow and tunnel enclosure considering the reverse evaporation of water from the shaft, and corrected the heat exchange coefficient between the enclosure rock and airflow. Wei et al. [17,18] comprehensively analyzed the factors affecting tunnel airflow temperature and humidity through orthogonal experiments. Li et al. [19] highlighted that neglecting latent heat could lead to significant errors in predicting tunnel exit temperatures. Moreover, dehumidifying the initial airflow or increasing the ventilation rate can facilitate latent heat release. The aforementioned studies primarily focus on heat and mass transfer between the wetted tunnel and airflow, without addressing the scenario of high-temperature fissure water entering the tunnel. Wang et al. [20] explored the variations in the tunnel airflow temperature and humidity fields under high-temperature fissure water using similar test methods. Xin et al. [21] demonstrated that the Reynolds number significantly affects the convective heat transfer coefficient and wall temperature, while the channel shape has the greatest influence on the length of the longitudinal heat transfer zone. Xiao et al. [22] addressed these knowledge gaps by conducting water uptake experiments on fractionally wet artificial porous media, varying in water–wet ratios, pore sizes, and wettability heterogeneities. The application of spray-on thermal insulation materials for cooling in tunnels is a widely used active cooling method, and numerous scholars have conducted extensive research on thermal insulation materials for mining. For example, Paustian et al. [23] examined the relationship between capillary pressure, saturation, and interfacial area in a three-phase flow system within wet porous media. Yu et al. [24] prepared a lightweight porous insulation concrete using tailings, perlite particles, EPS particles, and cement, and verified its excellent performance through experimental testing. Zhang et al. [25] developed a thermal insulation material for spray application on tunnel surfaces using materials such as bamboo branches, gravel, expanded clay, and glass hollow beads. Yang et al. [26] used dolomite tailings and granite waste as raw materials, and produced a lightweight, porous insulation material through silicon carbide foaming treatment. Cheng et al. [27] prepared a high-performance thermal insulation material using modified polyurethane, bentonite, cement, and expanded clay as raw materials. At the same time, there has been extensive research on the application of thermal insulation materials. Qin et al. [28] examined the temperature field and heat dissipation dynamics of the tunnel envelope after adding an insulation layer. Yao et al. [29] numerically simulated the tunnel temperature field changes post-insulation, concluding that the low thermal conductivity of the slurry material is a key factor influencing the temperature field distribution. Li et al. [30] conducted experiments and numerical simulations to investigate the effects of various factors on the thermal insulation performance of wall-mounted insulation linings, exploring the impact of natural convection on the heat transfer mechanisms of wall insulation linings. Despite the comprehensive analysis of insulation layers, the complex heat and humidity environment in tunnels still a need a comprehensive means of treatment that combines multiple methods.
In summary, scholars have conducted some research on the temperature and humidity fields in high-temperature underground engineering; however, studies on the humidity distribution within tunnels under the influence of high-temperature fissure water are limited, and there are few reports on the impact of humid porous media on the thermal and humidity distribution in tunnels. This paper innovatively integrates the interaction between humid porous media and high-temperature fissure water into a thermal–humidity coupling model, advancing previous research. It quantitatively reveals for the first time the coupling mechanisms of surrounding rock thermal conduction, hot water evaporation, and airflow convection. By breaking through the traditional limitations that focus solely on dry surrounding rocks, it proposes a multi-phase heat and humidity transfer theoretical framework, quantifying the effects of drainage methods and insulation layers on the tunnel environment, and fills the gap in predicting and managing thermal hazards in tunnels under high-humidity fissure water conditions. Table 1 presents a comparison between this study and previous research.

Table 1.
Comparison between this study and similar works.
2. Engineering Background
2.1. Status of Works
A coal mine situated in the central region of China’s Ju Ye Coal Field has a burial depth ranging from 700 to 1200 m, with an average ground temperature gradient of 2.20 °C/100 m. The original rock temperature in most sections of the mine is 37–42 °C, placing it within the second level of thermal hazardous areas [31]. The temperature of the hot water can reach up to 60 °C, representing a typical geothermal anomaly within the tunnels. The 1# drainage tunnel, located in the middle of the mine, was selected as the research object. This channel passes through faults 1, 2, and 3, and is adjacent to fault 4, as Figure 1a illustrates. Hot water discharge is managed through both drainage ditches and pipes. To mitigate the large volume of water in the shower area, a tarpaulin is placed over the top of the tunnel, as shown in Figure 1b, with hot water being diverted through the tarpaulin and channeled into the drainage ditch to minimize direct contact between the hot water and air. Figure 1c depicts the drainage pipe arrangement, with a 40 cm deep and 30 cm wide drainage ditch, and a 30 cm diameter metal drainage pipe. Ventilation is provided by a press-in ventilation system at one end of the tunnel, with a specified capacity of 14.8 m3/s.
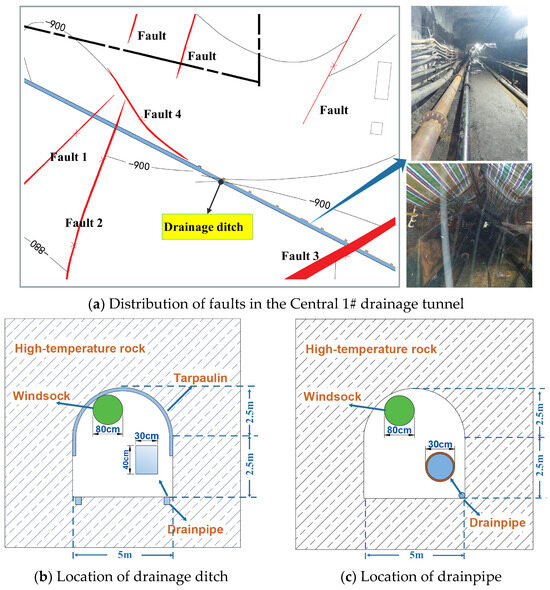
Figure 1.
Tunnel location and section.
To analyze the temperature and humidity field distribution within the tunnel under the influence of high-temperature fissure water, a 900 m section of the drainage tunnel was selected for on-site measurements. As shown in Figure 2, measurement points were set every 100 m, with separate points before and after the areas of water accumulation and the shower zone. All measurement points were positioned 1.8 m above the ground. A YWSD 100 temperature and humidity meter was used to assess the thermal environment in the tunnel, with a temperature accuracy of 0.1 °C and humidity accuracy of 0.1% RH. The hot water parameters at multiple drainage ditches and areas of water accumulation were measured, and the thermodynamic parameters were tested by sampling the wet porous medium of the tunnel floor.
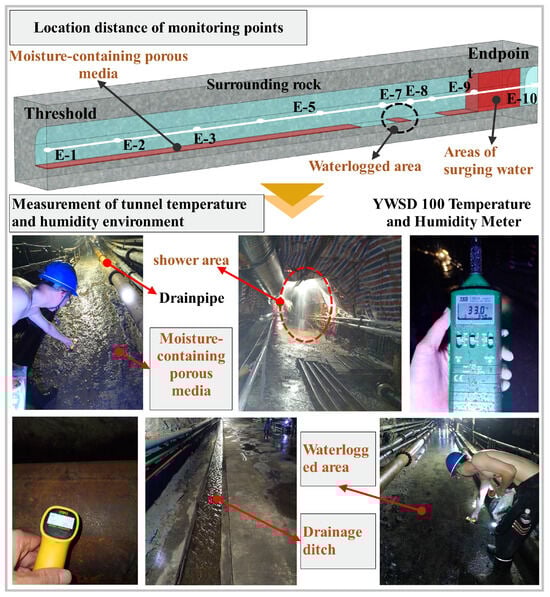
Figure 2.
Schematic diagram of field measurement.
2.2. Analysis of the Measured Results of Ambient Temperature and Humidity in the Tunnel
The data from each monitoring point within the tunnel were compiled and analyzed, as shown in Figure 3. The airflow temperature in the tunnel is generally higher than 30 °C, and the RH is generally higher than 80%. At the initial measurement point, the Ta was 27.4 °C, and the relative humidity was 58.5%. As the distance into the tunnel increased, both the temperature and humidity rose to varying extents due to the influence of high-temperature surrounding rock and high-temperature fissure water. A detailed analysis of these variations follows below.
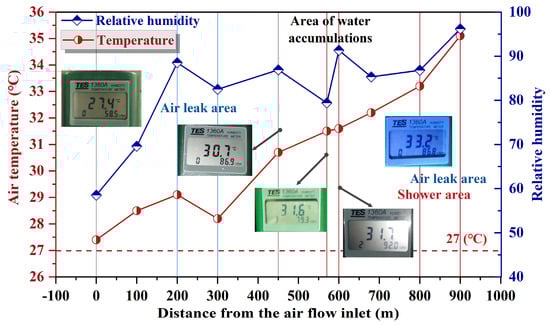
Figure 3.
Temperature and relative humidity tested on-site.
Within the first 200 m of the tunnel, both Ta and RH increased rapidly. The rise in Ta in this section was primarily attributed to heat transfer from the surrounding rock to the airflow in the tunnel. While no significant water accumulation or drenching was observed in this area, the large area of moisture-containing porous media on the ground led to an increase in RH. A reduction in both Ta and RH at the 300 m measurement point was observed, which was attributed to air leakage from broken ducts between the 200 m and 300 m points. The decrease in RH between 450 m and 570 m was due to the reduced area of moisture-containing porous media. The fluctuation in RH at the 600 m measurement point was caused by a small area of water accumulation in that section. From 800 m to 900 m, a large high-temperature shower area was observed, with water temperatures reaching as high as 62.3 °C. Despite the use of a tarp for shielding and drainage, the tarpaulin showed varying degrees of damage, allowing water to directly humidify and heat the air. This resulted in a rapid increase in both Ta and RH values.
The heat and moisture exchange process in the tunnel involves the interaction between the airflow, high-temperature fissure water, and the surrounding rock, as Figure 4 illustrates. The areas with moist porous media, water accumulation, and significant inflow of water all influence the longitudinal distribution of Ta and RH, specifically manifested as follows:
- (1)
- In the region of moisture-containing porous media, heat and moisture exchange occurs between the gas flow and wet porous media, and RH rises continuously. Due to the small amount of fracture water in this area, the heat carried has little effect on the temperature of the moisture-containing porous media, and the temperature of the moisture-containing porous media is mainly affected by the heating of the surrounding rock. The vertical distribution trend of Ta is primarily controlled by the high-temperature surrounding rock and the drainpipe, and the moisture-containing porous medium mainly plays the role of humidifying the airflow.
- (2)
- In the water accumulation area, the continuous evaporation of standing water leads to an increase in the temperature and humidity of the airflow. However, due to the relatively small amount of water being added, the heat carried is also minimal, and the standing water primarily serves to humidify the airflow.
- (3)
- In regions where large quantities of fracture water enter the tunnel, both Ta and RH increase rapidly. The airflow is heated and humidified by the high-temperature shower water and hot water in the drainage ditch. Simultaneously, the hot water transfers heat to the surrounding rock, initiating convection between the hot water and surrounding rock, followed by heat transfer from the surrounding rock to the airflow. This process leads to a significant increase in both the temperature and humidity of the airflow.
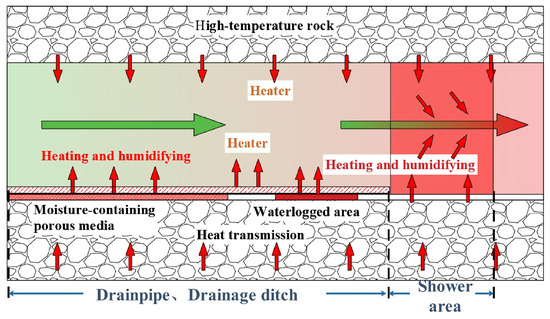
Figure 4.
Heat and moisture coupling transfer of air-hot water–rock in the tunnel.
3. Numerical Simulations
3.1. Basic Assumptions
The thermal environment and humidity within a tunnel are inherently complex and influenced by numerous factors, making it impossible to develop a mathematical model that fully captures the tunnel conditions. To create a computational model that accurately reflects the temperature and humidity dynamics, the following assumptions are made:
- (1)
- Homogeneous medium assumption: the surrounding rock and insulation layer are treated as homogeneous, continuous media with constant physical properties.
- (2)
- Incompressible fluid assumption: since the tunnel environment is at normal temperature and pressure, it is assumed that both air and water are incompressible fluids, and the effects of internal thermal radiation are neglected.
- (3)
- Smooth surface assumption: the inner surfaces of the tunnel, drainage ditch, and drainage pipe are assumed to be smooth.
- (4)
- Impermeable rock mass assumption: The surrounding rock mass is considered impermeable, restricting the movement of hot water to drains and pipes. The water flow is assumed to be uniform and unidirectional.
3.2. Mathematical Modeling
The numerical model developed in this study employs a set of control equations divided into flow control equations and temperature field control equations. For the flow field analysis, the Navier–Stokes equations are utilized. Based on the maximum water influx through the fissures, the Reynolds number for the water flow within the ditch indicates a laminar flow regime. The mass conservation and momentum conservation equations for the hot water flow are expressed as follows:
where is the density of water (kg/m3), t is the time (s), is the water flow velocity field (m/s), is water pressure (Pa), N is the identity tensor, is the dynamic viscosity of water (Pa·s), and is water temperature (K).
where is the fluid density (kg/m3), is the fluid velocity (m/s), X is the body force and the direction of the coordinate axis, is the second viscosity coefficient of the fluid, and is the viscosity coefficient of the fluid (Pa·s).
For the airflow in the ducts and lanes, the Reynolds numbers exceed 106, indicating a turbulent state. The Reynolds-averaged Navier–Stokes (RANS) method is applied to manage the control equations of the mean turbulent field [32]. The quasi-k-epsilon two-equation model, which is as follows, is widely applied to address turbulence issues [33]:
where is the density of moist air (kg/m3), is the airflow velocity field (m/s), is air pressure (Pa), is the dynamic viscosity of moist air (Pa·s), is the eddy viscosity coefficient (Pa·s), is air temperature (K), q is turbulent kinetic energy (J), is the turbulent kinetic energy dissipation rate, and , , , , are constants with values 0.09, 1.44, 1.92, 1.0, and 1.3, respectively.
The temperature field is controlled by the energy conservation equations, distinguishing between conduction in the surrounding rock and structures (Equation (11)) and convection in the air and water (Equation (12)), with the equations being as follows:
where and are the solid and fluid densities (kg/m3), and are specific heat capacities (J/(kg·K)), and are temperatures (K), and are thermal conductivities (W/(m·K)), and are heat sources (W), and is the fluid velocity field (m/s).
The humidity field is governed by component transport equations, one of which follows:
where is the molar mass of water vapor (kg/mol), is water vapor concentration (mol/m3), is the water vapor diffusion coefficient (m2/s), and is the mass source (kg/s) [34].
The coupling between these physical fields is achieved through variable boundary conditions and material properties. Air and water viscosity, density, and thermal conductivity are temperature-dependent, while air thermophysical parameters are also humidity-dependent. Specific parameter values are detailed in Section 3.3.
3.3. Model Geometry and Material Parameters
The model’s geometry, shown in Figure 5, focuses on a 200 m section of the tunnel. The drainage ditch, drainage pipe, thermal cover plate, and insulation layer span the entire length of the tunnel. The underground space is modeled as a semicircular arch, with surrounding rock dimensions of 200 m × 50 m × 50 m. The drainage ditch measures 30 cm in width and 40 cm in depth. The thermal insulation cover plate is 5 cm thick and 70 cm wide, while the insulation layer has a thickness of 20 cm, covering both the top and side walls. The model uses a fully structured mesh composed of tetrahedral cells with high mesh quality; most cells exhibit a skewness greater than 0.3, and the minimum mesh quality is 0.1205. The specific parameter values for each material are shown in Table 2. Air and water are set using COMSOL 6.1 built-in materials, and the thermophysical parameters are a function of temperature change.
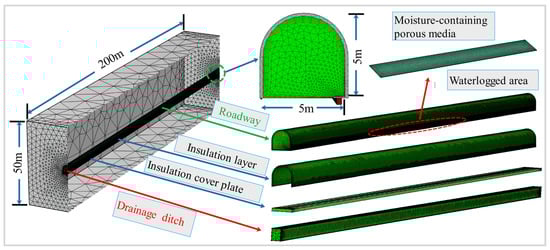
Figure 5.
Model geometry and grid settings.
Table 2.
Material calculation parameters.
3.4. Boundary Conditions and Solution Settings
The air intake temperature of the tunnel is maintained at 20 °C with a relative humidity of 50%, and the air intake rate is 14.8 m3/s. The surrounding rock at the thermal boundary is set to a temperature of 30 °C. The parameter settings for different calculation conditions are shown in Table 3. COMSOL 6.1 was employed to solve the numerical model, with flow field accuracy set to 10−3 and temperature and humidity field accuracy set to 10−5. The solution for the flow field is steady-state, while other physics are modeled transiently. The total simulation time was set to 300 days.
Table 3.
Calculation conditions.
3.5. Grid Independence Test
The mesh size and quality in the finite element numerical simulation are critical for determining both accuracy and computational efficiency. To investigate mesh independence, three grid sizes—Grid A, Grid B, and Grid C—were analyzed using hot water drainage from a gutter at 65 °C. Grid A consisted of 1,968,923 elements, Grid B of 8,607,815 elements, and Grid C of 30,685,711 elements.
As shown in Figure 6, a comparison of the calculation results for three mesh configurations was conducted. When comparing Mesh A and Mesh B, the maximum temperature and humidity errors were 0.35 °C and 4.3%, respectively, with a reduction in computation time of 76% (Mesh B took 7.6 h, while Mesh A took 1.9 h). The maximum temperature and humidity errors for Mesh B and Mesh C were much smaller, at 0.04 °C and 1.3%, respectively, with a reduction in computation time of 74% (Mesh C required 29.5 h, while Mesh B took only 7.9 h). Therefore, we believe that Mesh A has a higher error and is unable to accurately capture the temperature and humidity distribution within the tunnel. Although Mesh C has the highest computational accuracy, its computational efficiency is too low. Mesh B has only a small error and maintains a relatively high computational accuracy. Thus, to balance computational accuracy and efficiency, this study chose Mesh B for the calculations.
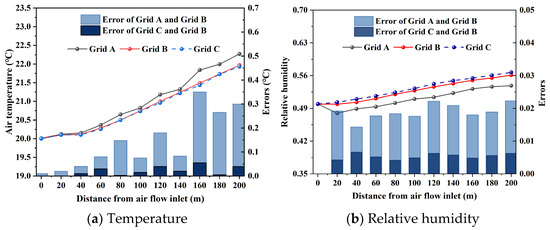
Figure 6.
Comparison of calculation results and errors for different grid sizes.
The numerical model’s accuracy in predicting temperature and humidity distributions was validated by comparing simulation results with field monitoring data. A finite element model of the tunnel, 500 m in length, was created based on site conditions, and the results were compared with on-site measurements, as shown in Figure 7. Due to the inability to achieve the idealized rock uniformity and boundary conditions assumed in the COMSOL simulation software in real-world environments, the simulated temperature and humidity results are higher than the field measurements. In most areas, the simulated temperature and humidity results exceed the field measurement values. The errors in temperature and humidity for the two methods are shown in Table 4, with maximum errors of 7% and 4.7%, respectively. Despite these absolute errors, both the numerical and field data exhibited similar spatial distribution trends for temperature and humidity. This alignment indicates that the model accurately predicts the temperature and humidity trends in the tunnel, confirming that the numerical model is both reasonable and reliable.
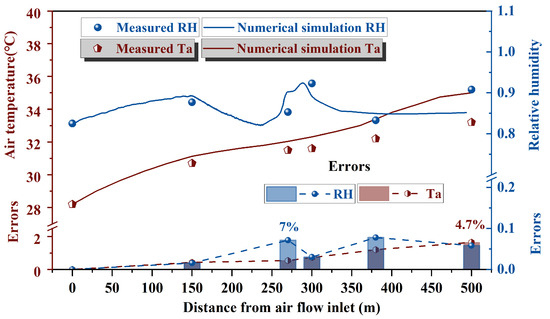
Figure 7.
Comparison of numerical model and field monitoring.
Table 4.
Comparison between simulation results and actual measurement results.
4. Distribution Characteristics of Ambient Temperature and Humidity in the Tunnel Under Different Factors
4.1. Area of Moisture-Containing Porous Media
The area of the moist porous medium varies from 150 m2 to 300 m2, and its initial temperature is 35 °C, and heat exchange occurs between it and the surrounding rock. The other variables are consistent with the basic conditions, and Figure 8 illustrates the results. The effect of different moist porous media areas on the spatial distribution of RH follows a similar pattern. The longitudinal RH distribution in the tunnel exhibits a slow decrease from the ventilation entrance to the moisture-containing porous medium region, followed by a rapid increase within the moisture-containing porous area, and a gradual decrease as it exits the region towards the ventilation exit. Upon entering the moisture-containing porous medium region, RH increases as the area of the medium expands. When the area of the moisture-containing porous medium increases from 150 m2 to 300 m2, the maximum RH increases from 52.7% to 55.8%, demonstrating the significant effect of the moisture-containing porous medium on the tunnel’s humidity. The spatial distribution of temperature in the tunnel with varying areas of moisture-containing porous media shows similar trends. Since the flow of fissure water is minimal and carries relatively little heat, its influence on the temperature field is not significant.
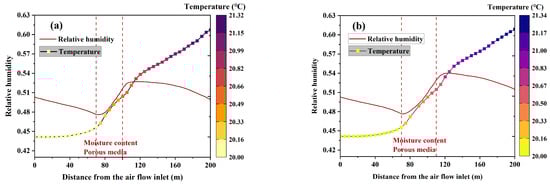
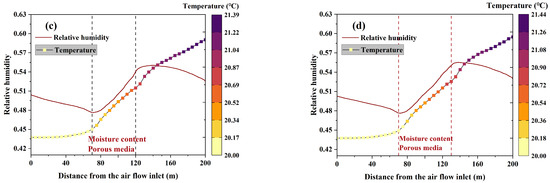
Figure 8.
Temperature and humidity distribution in the tunnel with different moisture-containing porous media: (a) 150 m2; (b) 200 m2; (c) 250 m2; (d) 300 m2.
4.2. Area of Water Accumulations
To investigate the effect of the contact area between the airflow and water accumulation on the temperature and humidity in the tunnel, the water accumulation area ranges from 150 m2 to 300 m2, with the gushing water temperature set to 35 °C. Thermal convection occurs between the water accumulation area and the surrounding rock. Other variables are kept consistent with the basic conditions, and Figure 9 presents the results.
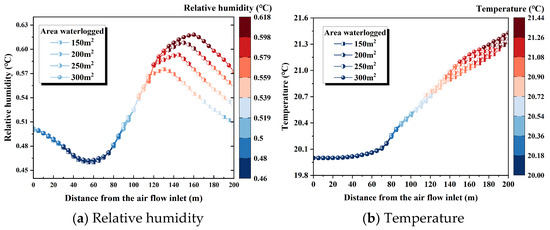
Figure 9.
Temperature and humidity distribution in the tunnel with different areas of water accumulations.
As shown in Figure 9a, the longitudinal RH distribution in the tunnel exhibits a similar trend for different water accumulation areas. With a 150 m2 water accumulation area, the RH of the airflow increases by 9.8%. With the increase in the distance of the area of water accumulation, the growth rate of the RH slows down gradually. Therefore, the larger the area of water accumulation, the higher the RH, but as the area of water accumulation increases, the growth rate of RH at the ventilation outlet gradually decreases. Figure 9b shows that the longitudinal Ta distribution follows a similar trend across different water accumulation areas. From the ventilation inlet to the ventilation outlet, Ta increases slowly. However, with an increasing water accumulation area, a slight increase in Ta at the ventilation outlet is observed, though the change is relatively small.
4.3. Water Temperature
As the fissure water volume increases, the disparity in heat carried by the fissure water at varying temperatures also becomes more pronounced. To investigate the impact of hot water temperature on the temperature and humidity of the tunnel environment, the water temperature was varied between 40 °C and 65 °C, while maintaining a fissure water volume of 90 m3/h and other primary conditions constant.
Figure 10 presents the temperature field of the surrounding rock in the model’s cross-section, illustrating that when hot water is drained through the ditch, it not only heats and humidifies the air directly but also raises the temperature of the surrounding rock in contact with the drainage ditch. This process enhances the heat exchange between the tunnel’s surrounding rock and the airflow. As the water temperature (Tw) increases, the extent of the high-temperature perimeter rock expands, resulting in a corresponding rise in the rock’s temperature.
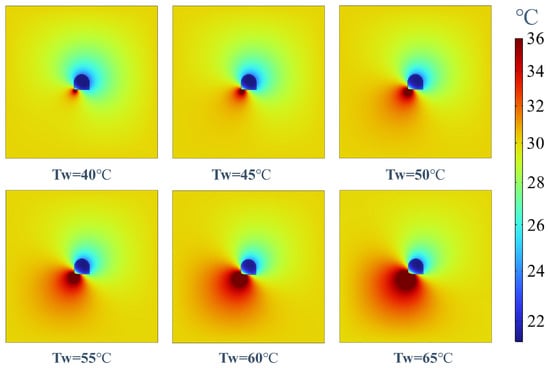
Figure 10.
Cloud map of the temperature field of the surrounding rock.
Figure 11a shows that the longitudinal Ta distribution in the tunnel follows a consistent upward trend across different water temperatures. The Ta value at the ventilation outlet increases linearly, with Tw, rising by 0.15 °C for every 5 °C increase in water temperature. From Figure 11b, it can be seen that the spatial distribution trend of RH is different from the difference of Tw, and when the water temperature is higher, the RH shows a trend of decreasing and then increasing. With the increase of Tw, the RH at the ventilation outlet also increased, and the rate of RH growth also increased. When the water temperature was 40 °C, 45 °C, 50 °C, 55 °C, 60 °C, and 65 °C, the values of RH at the ventilation outlet were 53%, 53.8%, 54.4%, 55%, and 56% in that order.
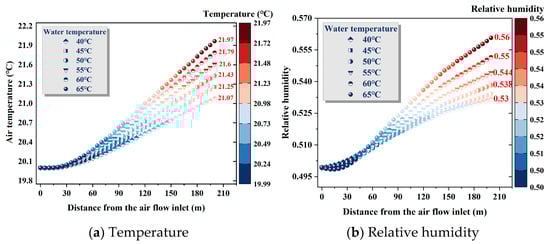
Figure 11.
Variation in temperature and humidity in the tunnel at different water temperatures.
4.4. Comparison of the Effect of Drainage Ditch and Drainpipe on the Hot and Humid Environment
A comparative analysis was conducted to assess the impact of two drainage methods—drainage ditch and drainpipe—on the heat and humidity environment in the tunnel, with a water temperature of 65 °C and a flow rate of 90 m3/h, while other parameters remained consistent.
Figure 12 illustrates that the use of a drainage ditch for hot water drainage exacerbates heat damage in two ways. First, the high-temperature fissure water heats a portion of the tunnel’s perimeter rock, raising its temperature and increasing the heat exchange between the surrounding rock and the airflow. Second, the hot water directly heats and humidifies the air. The area of the surrounding rock affected by heat from the drainage ditch is much larger than the area of direct contact between the hot water and the air, making heat transfer between the surrounding rock and the air the dominant process. This is confirmed by the results in Section 4.5, where the addition of a cover plate above the drainage ditch was shown to limit heat transfer. In contrast, when a drainpipe is used, the hot water does not directly contact the surrounding rock, leading to less heat transfer. While the drainpipe heats the air, the limited contact area results in a less significant impact on the temperature field within the tunnel.
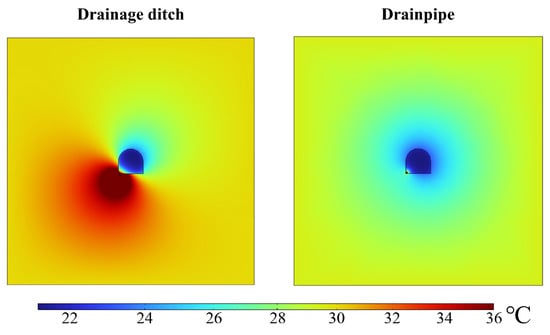
Figure 12.
Temperature field of surrounding rock with different drainage methods.
Figure 13a reveals a marked difference between the two drainage methods in terms of their effect on the thermal environment. As the distance into the tunnel increases, the difference in Ta between the two methods becomes more pronounced. At the ventilation exit, the Ta in the drainage ditch tunnel is 0.89 °C higher than in the drainpipe tunnel, with a 45% greater heat transfer. This demonstrates that using a drainage ditch for hot water drainage has a far greater impact on the tunnel’s thermal environment compared to using a drainpipe. Figure 13b shows the longitudinal distribution of RH in the two drainage methods. When a drainage ditch is used, the RH exhibits a sharp increase along the tunnel’s length. In contrast, with a drainpipe, the RH gradually decreases. Ultimately, the RH at the ventilation exit in the drainage ditch tunnel is 9.3% higher than in the drainpipe tunnel.
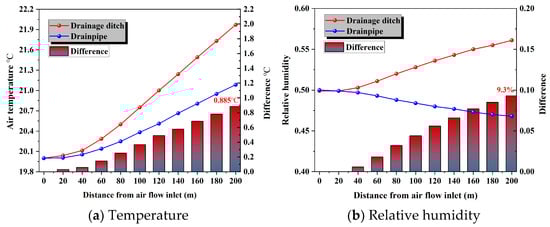
Figure 13.
Variation in temperature and humidity field in the tunnel with different drainage methods.
4.5. Optimization of Drainage Methods for Drains
The use of a drainage pipe for hot water drainage offers better heat damage control; however, the drainage pipes are prone to blockage due to mineral deposition (with an annual blockage rate exceeding 15%), and their installation cost is 30% higher than that of drainage ditches. Regular cleaning is required to maintain flow capacity, which may increase operational and maintenance complexity. To address the limitations of drainage ditches, this study proposes the addition of a thermal insulation cover plate above the drainage ditch and the application of thermal insulation material on the inner wall of the tunnel to mitigate heat damage. Three simulation scenarios were designed based on the CO2 foam concrete thermal insulation material parameters developed by Ta et al. [35], as shown in Table 5.
Table 5.
Simulation schemes.
As can be seen from Figure 14a, with the increase in the distance from the ventilation inlet, the Ta value of working condition ② decreases very little compared with working condition ①, and simply adding a drainage ditch cover plate has a small contribution on the thermal insulation. It can be concluded that the thermal impact of the drainage ditch on the tunnel environment is primarily due to the heating of the surrounding rock and the enhanced heat exchange between the surrounding rock and the airflow. In contrast, the difference in Ta between conditions ③ and ① increases progressively. In condition ③, the Ta value is 0.66 °C higher than in condition ①, which highlights the significant cooling effect of the insulation layer.
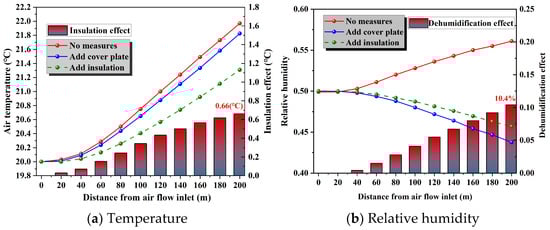
Figure 14.
Effectiveness of different methods of heat damage management.
As shown in Figure 14b, adding a cover plate above the drainage ditch results in a 12.3% decrease in RH at the ventilation outlet, indicating a significant moisture insulation effect. Due to the lower tunnel temperature under condition ③ compared to condition ②, the RH in condition ③ is slightly higher than in condition ②.
5. Conclusions
A numerical simulation model was established based on heat and mass transfer theory to analyze the impact of varying fissure water conditions on the temperature and humidity distribution within the tunnel, combining finite element calculations with field monitoring data. The cooling effect of increasing the gutter cover and thermal insulation coating was studied.
- (1)
- Field measurements indicated that fissure water entering the tunnel forms moisture-containing porous media and water accumulation areas. For an area of 150 m2, the moisture-containing porous media increased the RH of the airflow by 5.1%, while the water accumulation area raised the RH by 9.8%. The degree of influence was positively correlated with the area covered. Due to the small amount of water inflow, the longitudinal distribution of Ta is mainly controlled by the high-temperature surrounding rock and drainage facilities.
- (2)
- The hot water in the drainage ditch heats and humidifies the airflow. At the same time, the hot water also transfers heat to the surrounding rock, experiencing convection between the hot water and the surrounding rock→heat conduction in the surrounding rock→convection between the airflow and the surrounding rock, leading to a substantial increase in Ta and RH, with heat transfer through the surrounding rock being the dominant mechanism. Under the same fissure water conditions, the air temperature (Ta) values at the ventilation outlets of the drainage ditch and drainage pipe tunnels are 21.97 °C and 20.08 °C, respectively. In comparison, the use of the drainage pipe results in a decrease in Ta by 0.89 °C (a reduction of 4.2%), with heat transfer reduced by 44.9% and relative humidity (RH) decreased by 9.3%.
- (3)
- When a large amount of fissure water enters the tunnel space, both Ta and RH increase rapidly. The water temperature directly influences the distribution of Ta and RH. Specifically, the Ta value at the ventilation outlet exhibited a linear growth trend with increasing Tw. When the fissure water volume was 90 m3/h, the Ta value at the ventilation outlet rose by 0.15 °C for every 5 °C increase in water temperature, and the RH growth rate accelerated as Tw increased.
- (4)
- The addition of a cover plate above the drainage ditch resulted in a 12.3% decrease in RH, with minimal impact on Ta. Spraying an insulation layer on the inner wall of the tunnel caused a significant reduction in Ta, with a 0.66 °C decrease observed when the insulation layer thickness reached 10 cm.
In this study, although it was confirmed that the heat transfer of the drainage ditch is 1.45 times higher than that of the drainage pipe, the use of drainage ditches remains widespread. Therefore, based on the existing foundation, methods to reduce the heat dissipation of drainage ditches are proposed, such as lining the inner walls of the drainage ditch with cement-based insulation materials and optimizing the structure and materials of the drainage ditch cover. This will also be an important focus of our future research. Additionally, future work will explore the effects of increasing ventilation rates, lowering inlet temperatures, and incorporating active cooling devices. Furthermore, the model will be extended to other tunnel geometries, with attention paid to other insulation materials.
Author Contributions
S.X.: writing—original draft, funding acquisition. X.Z.: writing—original draft, formal analysis. W.W.: writing—reviewing and editing, S.L.: conceptualization. C.S.: formal analysis. All authors have read and agreed to the published version of the manuscript.
Funding
This work has been funded by the National Natural Science Foundation of China, grant numbers 51774197.
Institutional Review Board Statement
Not applicable.
Informed Consent Statement
Not applicable.
Data Availability Statement
Data is contained within the article.
Conflicts of Interest
The authors declare that they have no known competing financial interests or personal relationships that could have appeared to influence the work reported in this paper.
References
- Han, Q.; Zhang, Y.; Li, K.; Zou, S. Computational evaluation of cooling system under deep hot and humid coal mine in China: A thermal comfort study. Tunn. Undergr. Space Technol. 2019, 90, 394–403. [Google Scholar]
- Chen, X.; Zhang, Y.; Ji, J.; Miao, D. Ventilation and cooling of coal mining face based on CFD model optimization. Process Saf. Environ. Protect. 2023, 172, 764–777. [Google Scholar]
- Chen, L.; Li, J.; Zhang, Y.; Han, F.; Ji, C.; Zhang, J. Study on coupled heat transfer and seepage in large sparsely fractured surrounding rocks in deep underground spaces. Appl. Therm. Eng. 2019, 162, 114277. [Google Scholar]
- Xie, H.; Gao, G.; Ju, Y. Research and exploration of deep rock mechanics. J. Rock Mech. Eng. 2015, 11, 2161–2178. [Google Scholar]
- Xu, C.; Nie, W.; Peng, H.; Li, H.; Wan, J. Enhancing Dust Concentration Monitoring in High Particulate Matter Environments: A Dual-Light Source Particulate Matter Sensor Approach Based on Mie Scattering. Sens. Actuators A Phys. 2025, 387, 116348. [Google Scholar]
- Chen, Z.; Huang, L.; Li, X.; Chen, J.; Liu, Z. Comprehensive heat extraction performance and fractured reservoir cooling effect analysis of a novel mine enhanced geothermal system. Appl. Therm. Eng. 2024, 245, 122790. [Google Scholar]
- Guo, L.; Nie, W.; Liu, Q.; Hua, Y.; Xue, Q.; Sun, N. Study on the coupling pollution law of dust and gas and determination of the optimal purification position of air duct during tunnel excavation. Powder Technol. 2022, 411, 117843. [Google Scholar]
- Wang, W.P.; Wang, S.; Dai, M.M.; Shao, K.; Cui, Z.; Liu, Y.; Cheng, L. Experimental analysis on dynamic performance of refrigeration systems in a deep gold mine. Appl. Therm. Eng. 2022, 217, 119259. [Google Scholar]
- Du, C.; Wei, D.; Zhang, H.; Zhang, L. Research on factors influencing the deep gushing water cooling process in constant temperature zone. Case Stud. Therm. Eng. 2019, 14, 100438. [Google Scholar]
- Wang, H. Numerical study of surrounding rock heat dissipation and wind temperature prediction in high geotemperature coal face. Energy Explor. Exploit. 2024, 42, 17–39. [Google Scholar]
- Xin, S.; Wang, W.; Zhang, N.; Zhang, C.; Yuan, S.; Li, H.; Yang, W. Comparative studies on control of thermal environment in development headings using force/exhaust overlap ventilation systems. J. Build. Eng. 2021, 38, 102227. [Google Scholar]
- Qu, Z.Q.; Zhang, W.; Guo, T.K. Influence of different fracture morphology on heat mining performance of enhanced geothermal systems based on COMSOL. Int. J. Hydrogen Energy 2017, 42, 18263–18278. [Google Scholar]
- Gong, F.; Guo, T.; Sun, W.; Li, Z.; Yang, B.; Chen, Y.; Qu, Z. Evaluation of geothermal energy extraction in Enhanced Geothermal System (EGS) with multiple fracturing horizontal wells (MFHW). Renew. Energy 2020, 151, 1339–1351. [Google Scholar]
- Chen, Y.; Zhao, Z.; Peng, H. Convective heat transfer of water flow in intersected rock fractures for enhanced geothermal extraction. J. Rock Mech. Geotech. Eng. 2022, 14, 108–122. [Google Scholar]
- Zeng, Y.; Tao, L.; Ye, X.; Zhou, X.; Fang, Y.; Fan, L.; Yang, Z. Temperature reduction for extra-long railway tunnel with high geotemperature by longitudinal ventilation. Tunn. Undergr. Space Technol. 2020, 99, 103381. [Google Scholar]
- Li, Z.X.; Wang, T.M.; Zhang, M.; Lin, L. Construction of heat transfer coefficients for drench evaporation and calculation of wind flow temperature in a mine tunnel. J. Coal 2017, 42, 3176–3181. [Google Scholar]
- Wei, Y.X.; Hu, H.H.; He, F.L.; Li, J. Numerical simulation of heat and humidity exchange law between tunnel wall and air. Chin. J. Saf. Sci. 2012, 22, 42–47. [Google Scholar]
- Chen, G.Y. Numerical Simulation of Temperature Field of Surrounding Rock and Wind Flow in Deep Mine Tunnel. Ph.D. Thesis, Hunan University of Science and Technology, Xiangtan, China, 2014. [Google Scholar]
- Li, Z.; Xu, Y.; Li, R.; Jia, M.; Wang, Q.; Chen, Y.; Cai, R.; Han, Z. Impact of the water evaporation on the heat and moisture transfer in a high-temperature underground tunnel. Case Stud. Therm. Eng. 2021, 28, 101551. [Google Scholar]
- Wang, J.C. Experimental Study on the Changing Law of Temperature and Humidity Field in Tunnel Wind Flow Under the Action of High Temperature Fissure Water. Ph.D. Thesis, China University of Mining and Technology, Xuzhou, China, 2019. [Google Scholar]
- Xin, S.; Wang, W.; Zhang, C.; Li, C.; Li, H.; Yang, W. Effects of rock-airflow conjugated heat transfer in development headings: A numerical study. Int. J. Therm. Sci. 2022, 172, 107301. [Google Scholar]
- Xiao, Y.; Zheng, J.; He, Y.; Wang, L. Percolation transitions of spontaneous imbibition in fractional-wet porous media. Colloid Surf. A-Physicochem. Eng. Asp. 2023, 673, 131826. [Google Scholar]
- Paustian, R.; Andersson, L.; Helland, J.O.; Wildenschild, D. On the relationship between capillary pressure, saturation, and interfacial area for three-phase flow in water-wet porous media. Adv. Water Resour. 2021, 151, 103905. [Google Scholar]
- Yu, H.; Zahidi, I.; Liang, D. Sustainable porous-insulation concrete (SPIC) material: Recycling aggregates from mine solid waste, white waste and construction waste. J. Mater. Res. Technol. 2023, 23, 5733–5745. [Google Scholar]
- Zhang, Y.; Yin, S.; Qu, M.; Liu, Y.; Zhu, Z.; Zhou, Y.; Xing, Y. Feasibility of natural bamboo branches aggregate applied to the thermal insulation layer of rock walls in roadways. Constr. Build. Mater. 2024, 435, 136870. [Google Scholar]
- Yang, L.; Li, X.; Pan, M.; Fu, J.; Wang, A.; Kong, Y.; Ma, C. Light-weight high strength porous thermal insulation materials based on dolomite-granite waste. Ceram. Int. 2024, 50, 55498–55507. [Google Scholar]
- Cheng, J.; Ran, D.; Shu, C.M.; Zhu, S.; Zhang, Y. Resource utilisation of waste TPU: Reform and modification for improving a bentonite-based thermal insulation material’s performance. Inorg. Chem. Commun. 2023, 154, 110866. [Google Scholar]
- Qin, Y.; Hou, H.; Guo, M.; Liu, Q.; Tang, F. Simulated and experimental study on effect of thermal insulation layer on temperature field and heat dissipation of tunnel surrounding rock. Case Stud. Therm. Eng. 2024, 53, 103960. [Google Scholar]
- Yao, W.; Lyimo, H.; Pang, J. Evolution regularity of temperature field of active heat insulation tunnel considering thermal insulation spraying and grouting: A case study of Zhujidong Coal Mine, China. High Temp. Mater. Process. 2021, 40, 151–170. [Google Scholar]
- Li, W.; Feng, Z.; Su, H.; Zou, S.; Zeng, L. Analysis of thermal insulation effect of off-wall insulation lining in high-temperature tunnel. Case Stud. Therm. Eng. 2024, 61, 104957. [Google Scholar]
- Wang, C.; Du, Y.; Deng, Y.; Zhang, Y.; Deng, J.; Zhao, X.; Duan, X. Study on spontaneous combustion characteristics and early warning of coal in a deep mine. Fire 2023, 6, 396. [Google Scholar] [CrossRef]
- Kang, F.; Li, Y. Numerical study on airflow temperature field in a high-temperature tunnel with insulation layer. Appl. Therm. Eng. 2020, 179, 115654. [Google Scholar]
- Lu, T.; Zhang, G.; Liu, S.; Zheng, B.; Zhang, X. Numerical investigation of the temperature field and thermal insulation design of cold-region tunnels considering airflow effect. Appl. Appl. Therm. Eng. 2021, 191, 116923. [Google Scholar]
- Chen, X.; Zhou, X.; Wang, Y.; Liang, N.; Xu, B. Study on ambient temperature and humidity in the construction tunnel under the influence of ventilation and hot water gushing. Tunn. Undergr. Space Technol. 2024, 143, 105501. [Google Scholar]
- Ta, X.P. Supercritical CO2 Foam Concrete Foaming Mechanism and Its Application to Tunnel Surrounding Rock Insulation. Ph.D. Thesis, China University of Mining and Technology, Xuzhou, China, 2023. [Google Scholar]
Disclaimer/Publisher’s Note: The statements, opinions and data contained in all publications are solely those of the individual author(s) and contributor(s) and not of MDPI and/or the editor(s). MDPI and/or the editor(s) disclaim responsibility for any injury to people or property resulting from any ideas, methods, instructions or products referred to in the content. |
© 2025 by the authors. Licensee MDPI, Basel, Switzerland. This article is an open access article distributed under the terms and conditions of the Creative Commons Attribution (CC BY) license (https://creativecommons.org/licenses/by/4.0/).