
Study on Adhesion Characteristics of Rubber–Soil Interface Based on Electric Double-Layer and Water Film Theories


Abstract
1. Introduction
2. Experimental Design
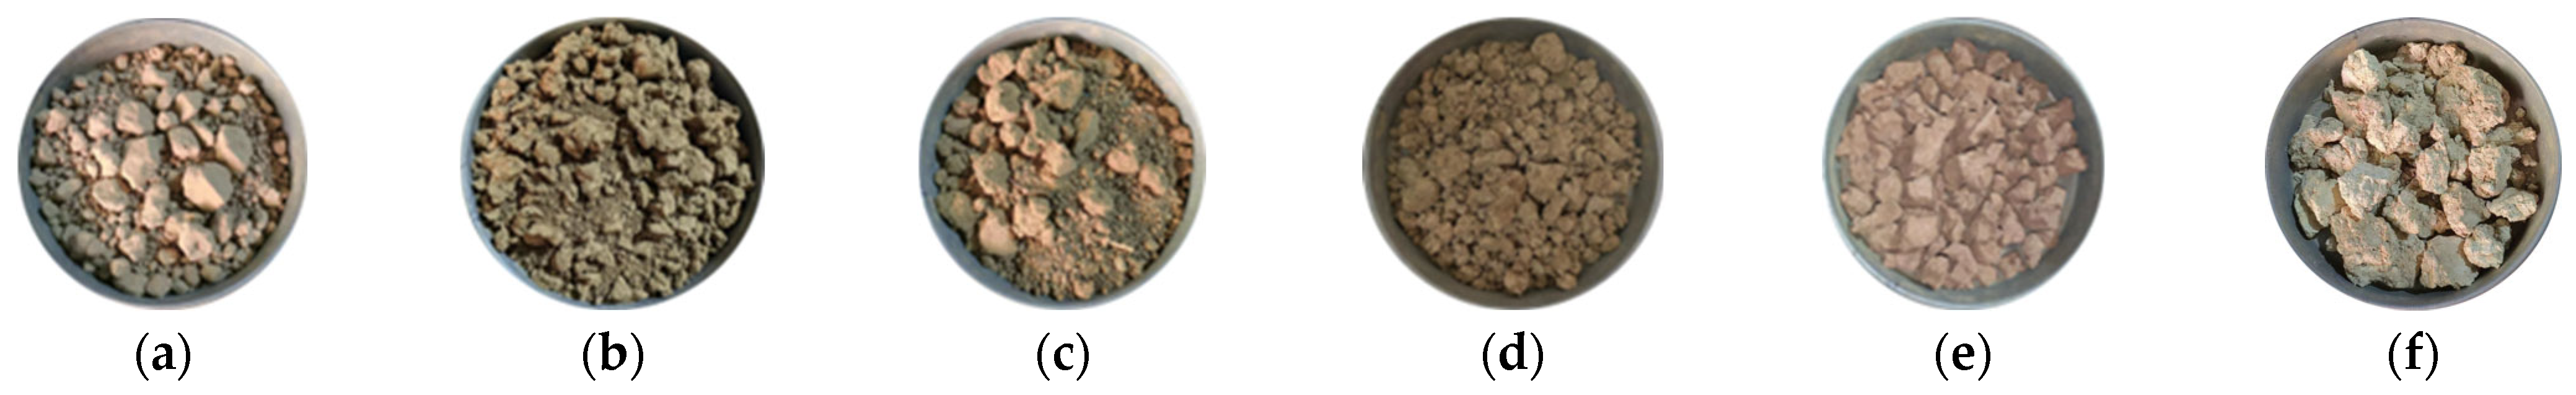
2.1. Experiment Material
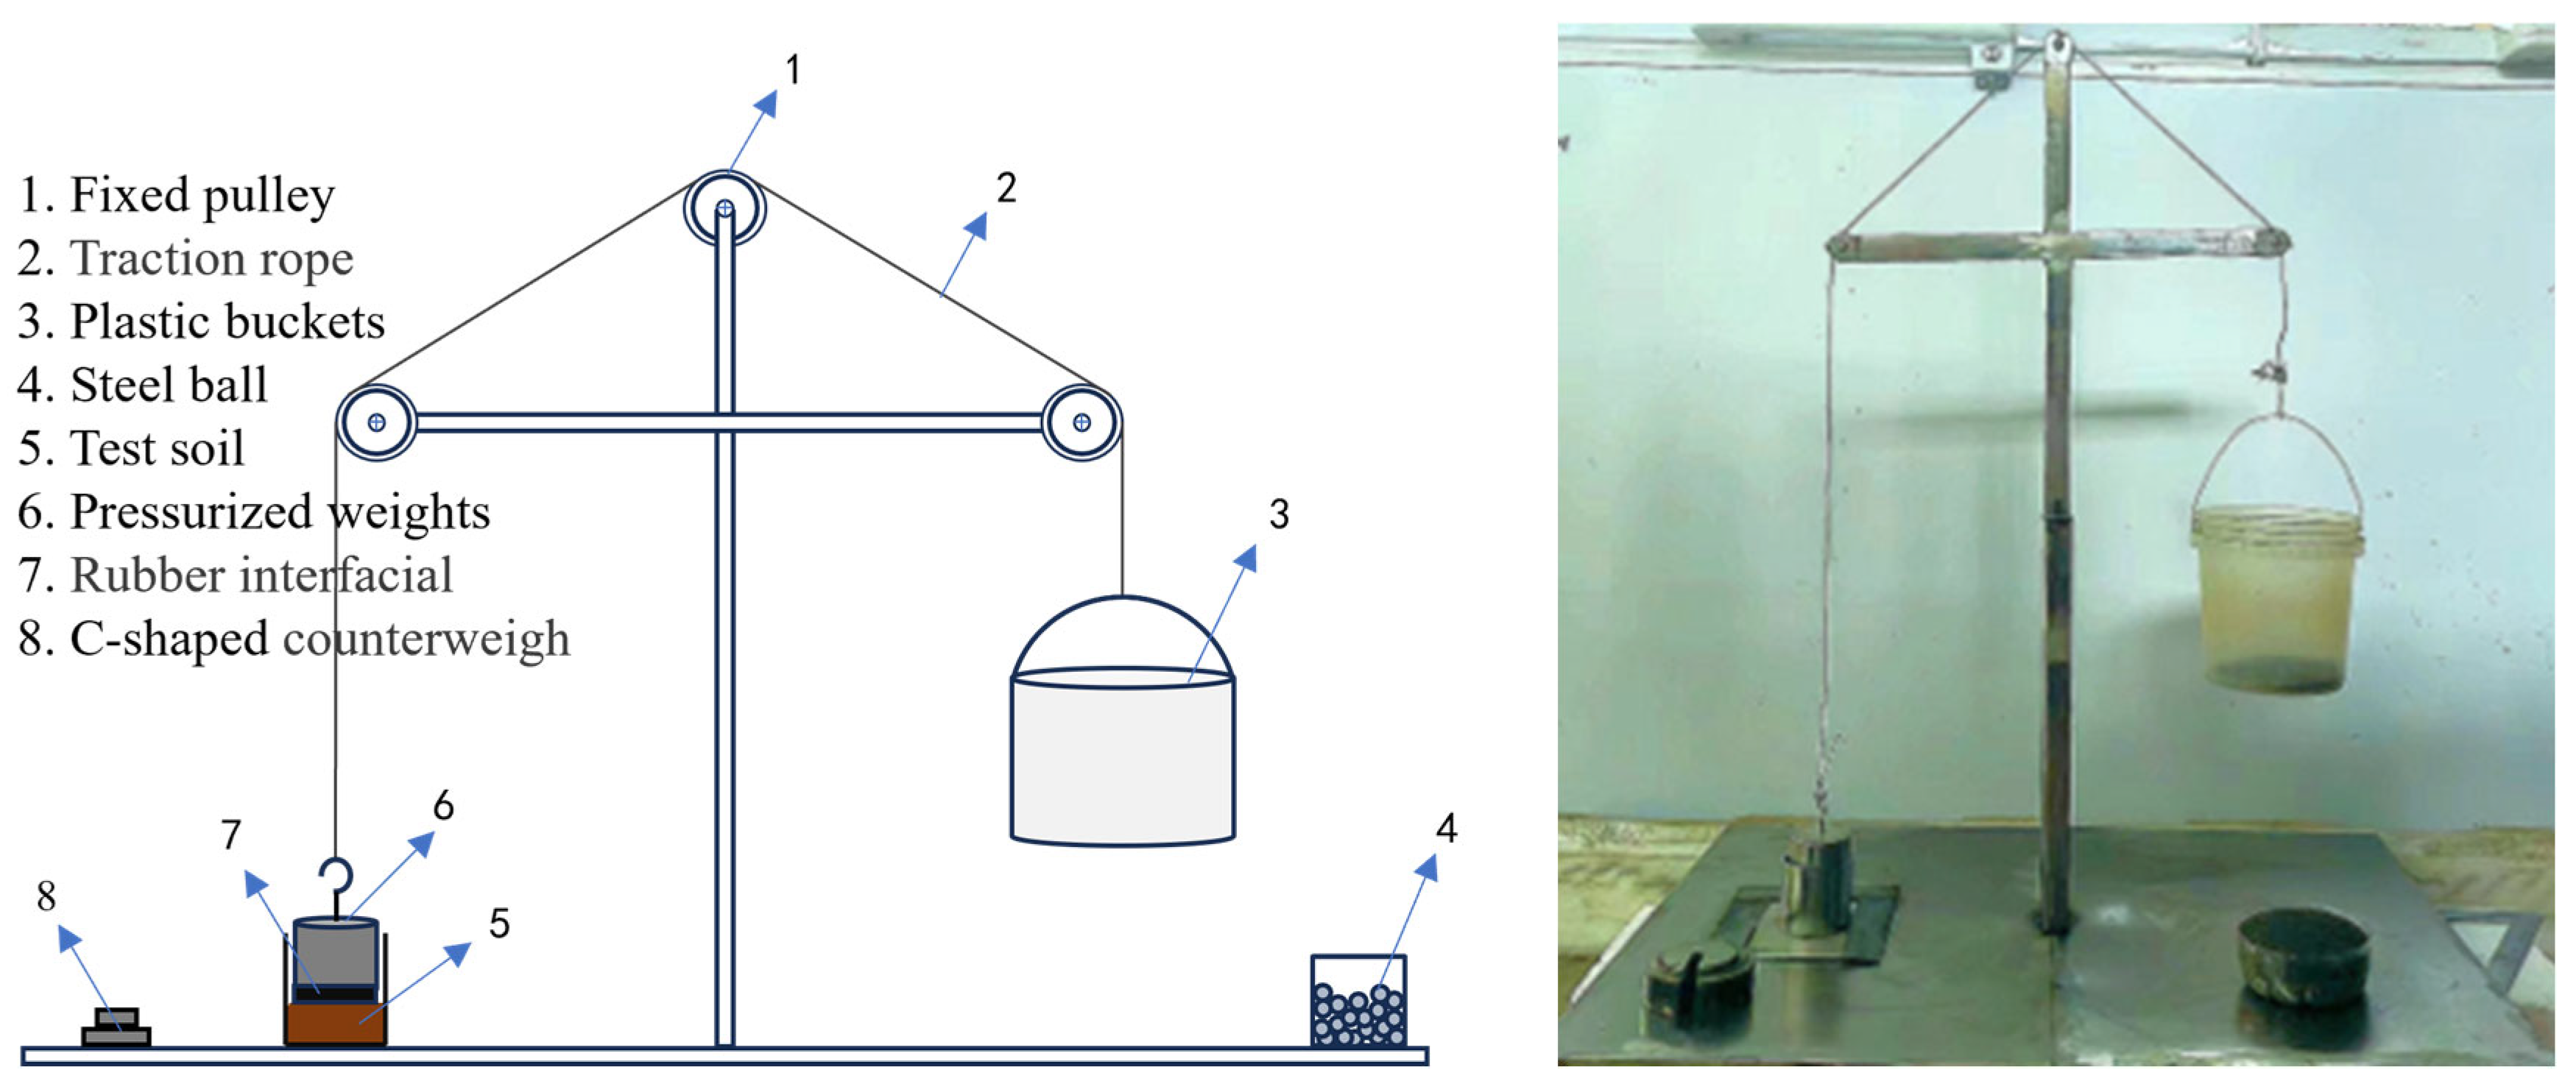
2.2. Experimental Equipment
2.3. Experimental Contents
- The clay and distilled water were mixed into the test soil according to a certain proportion. After stirring evenly, it was placed in an aluminum box, covered with plastic wrap, and allowed to stand for 12 h to ensure uniform water content in all parts of the soil.
- The test soil was taken out from the aluminum box and put into the test container on the left side of the fixed pulley to compact. The rubber sample was placed lightly on the soil, and the weight of the rubber sample was recorded. After standing for 30 s, the rubber sample was tied to the traction rope. The plastic barrel was tied on the right side of the pulley, and the marbles were added to the barrel at a constant speed until the contact surface of the rubber sample was separated from the test soil. The quality of the barrel and the steel ball was measured and recorded. The soil was taken out and the above operation was repeated three times.
- The test soil was sampled, weighed, dried in a blast-drying oven, and the temperature was adjusted to 105 °C. After 8 h, it was taken out and weighed, the moisture content of the test soil was measured, and the adhesion of the soil was calculated.
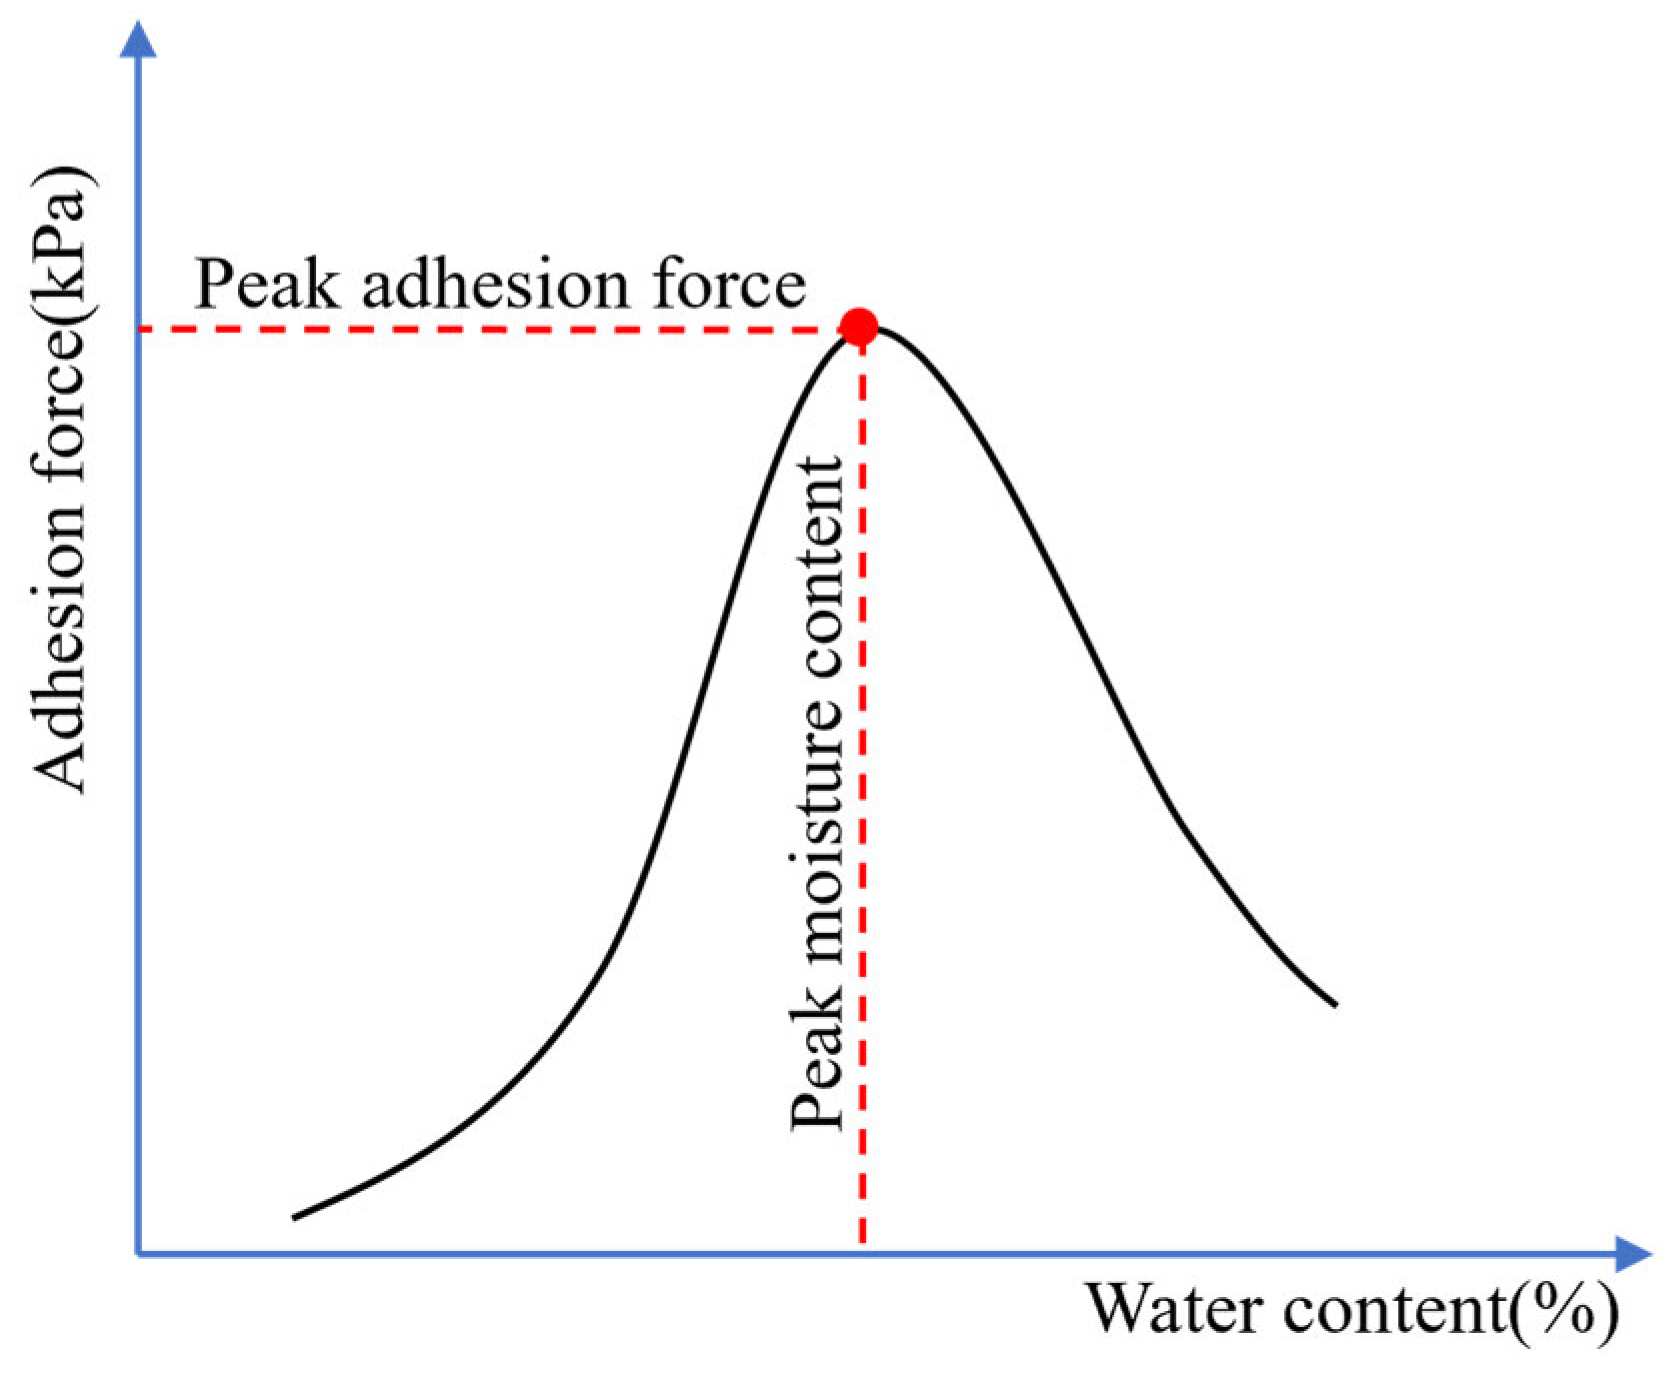
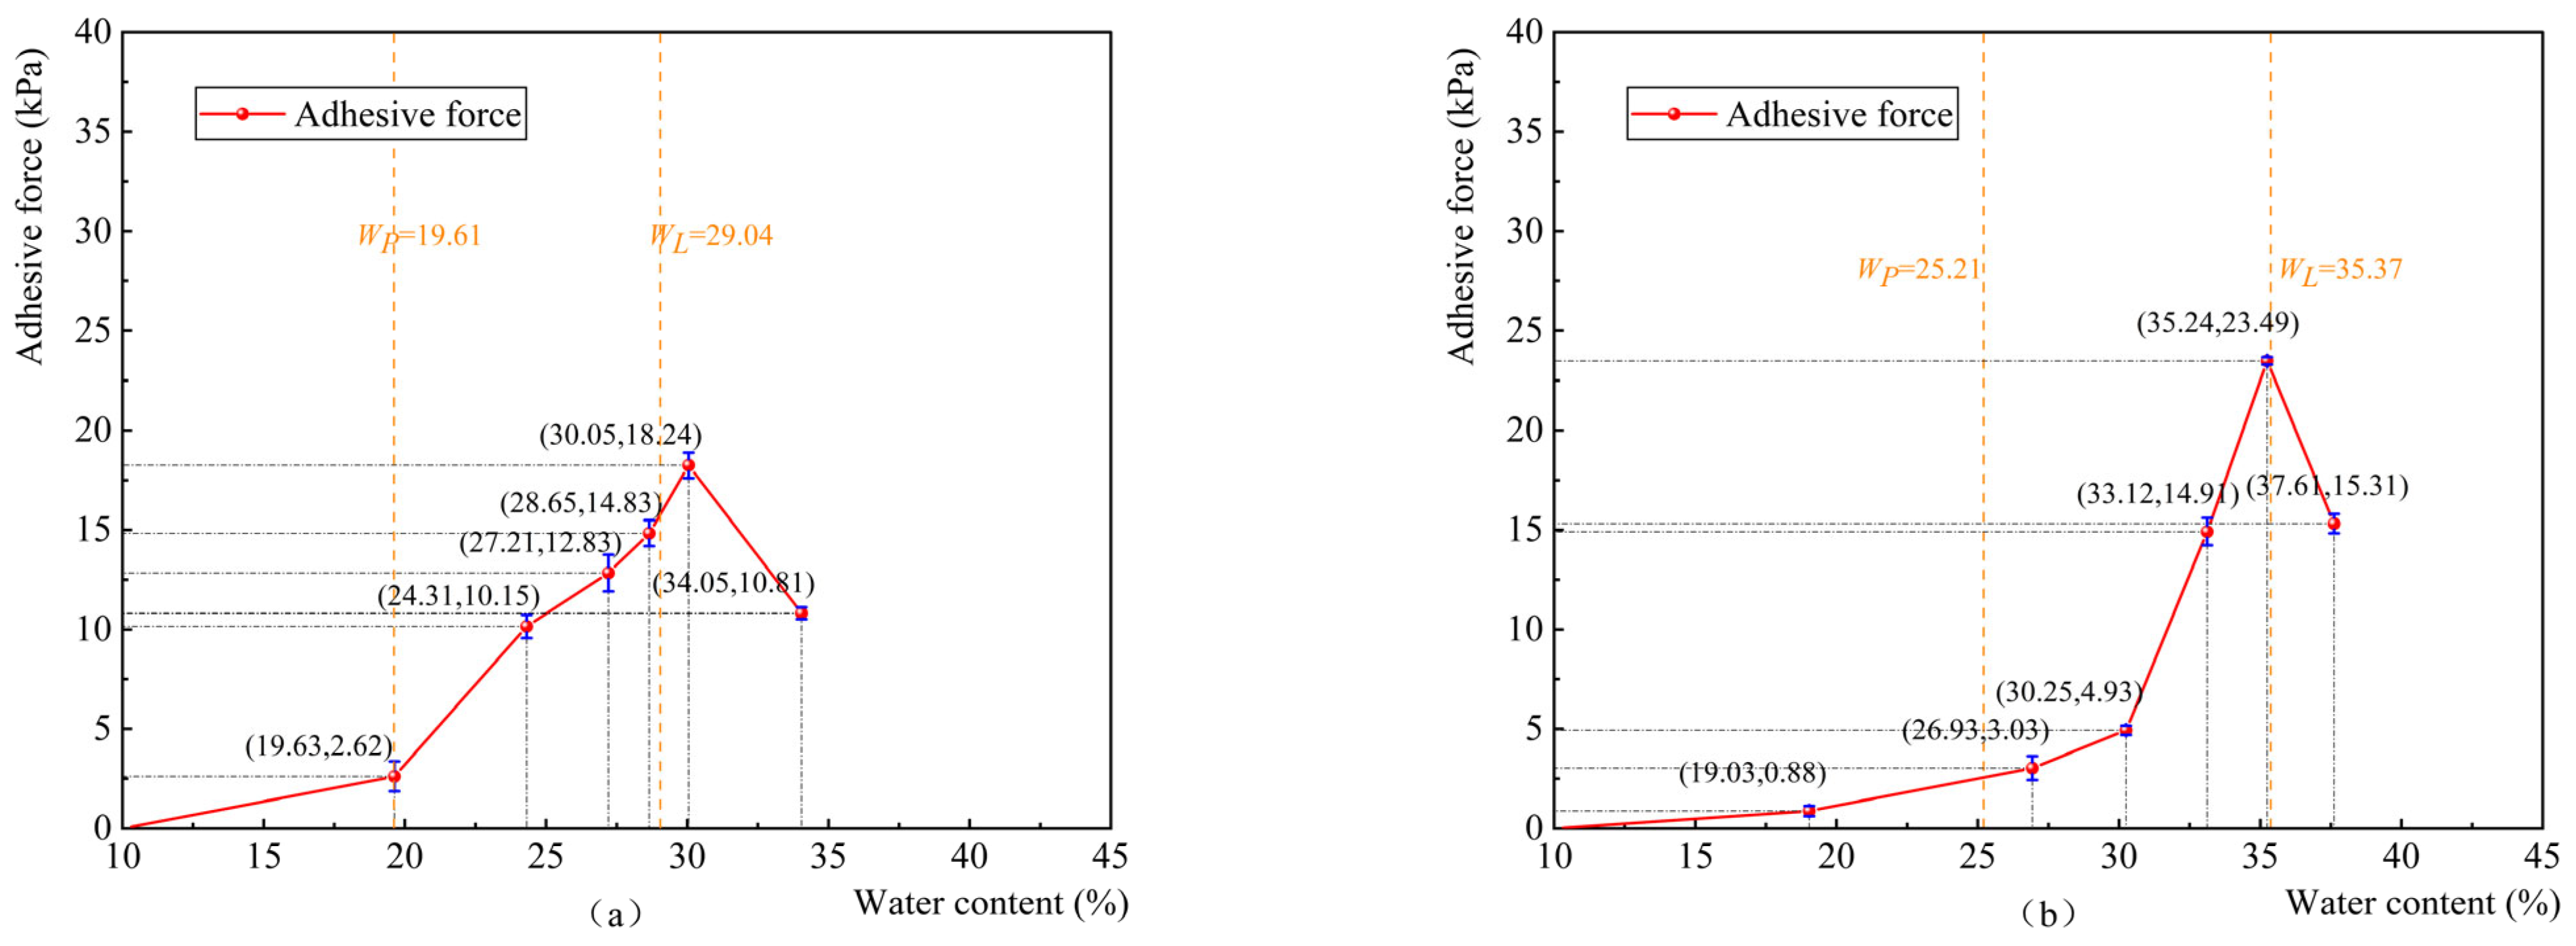
- According to the corresponding relationship between the water content and adhesion force, the curve in Figure 4 was drawn.
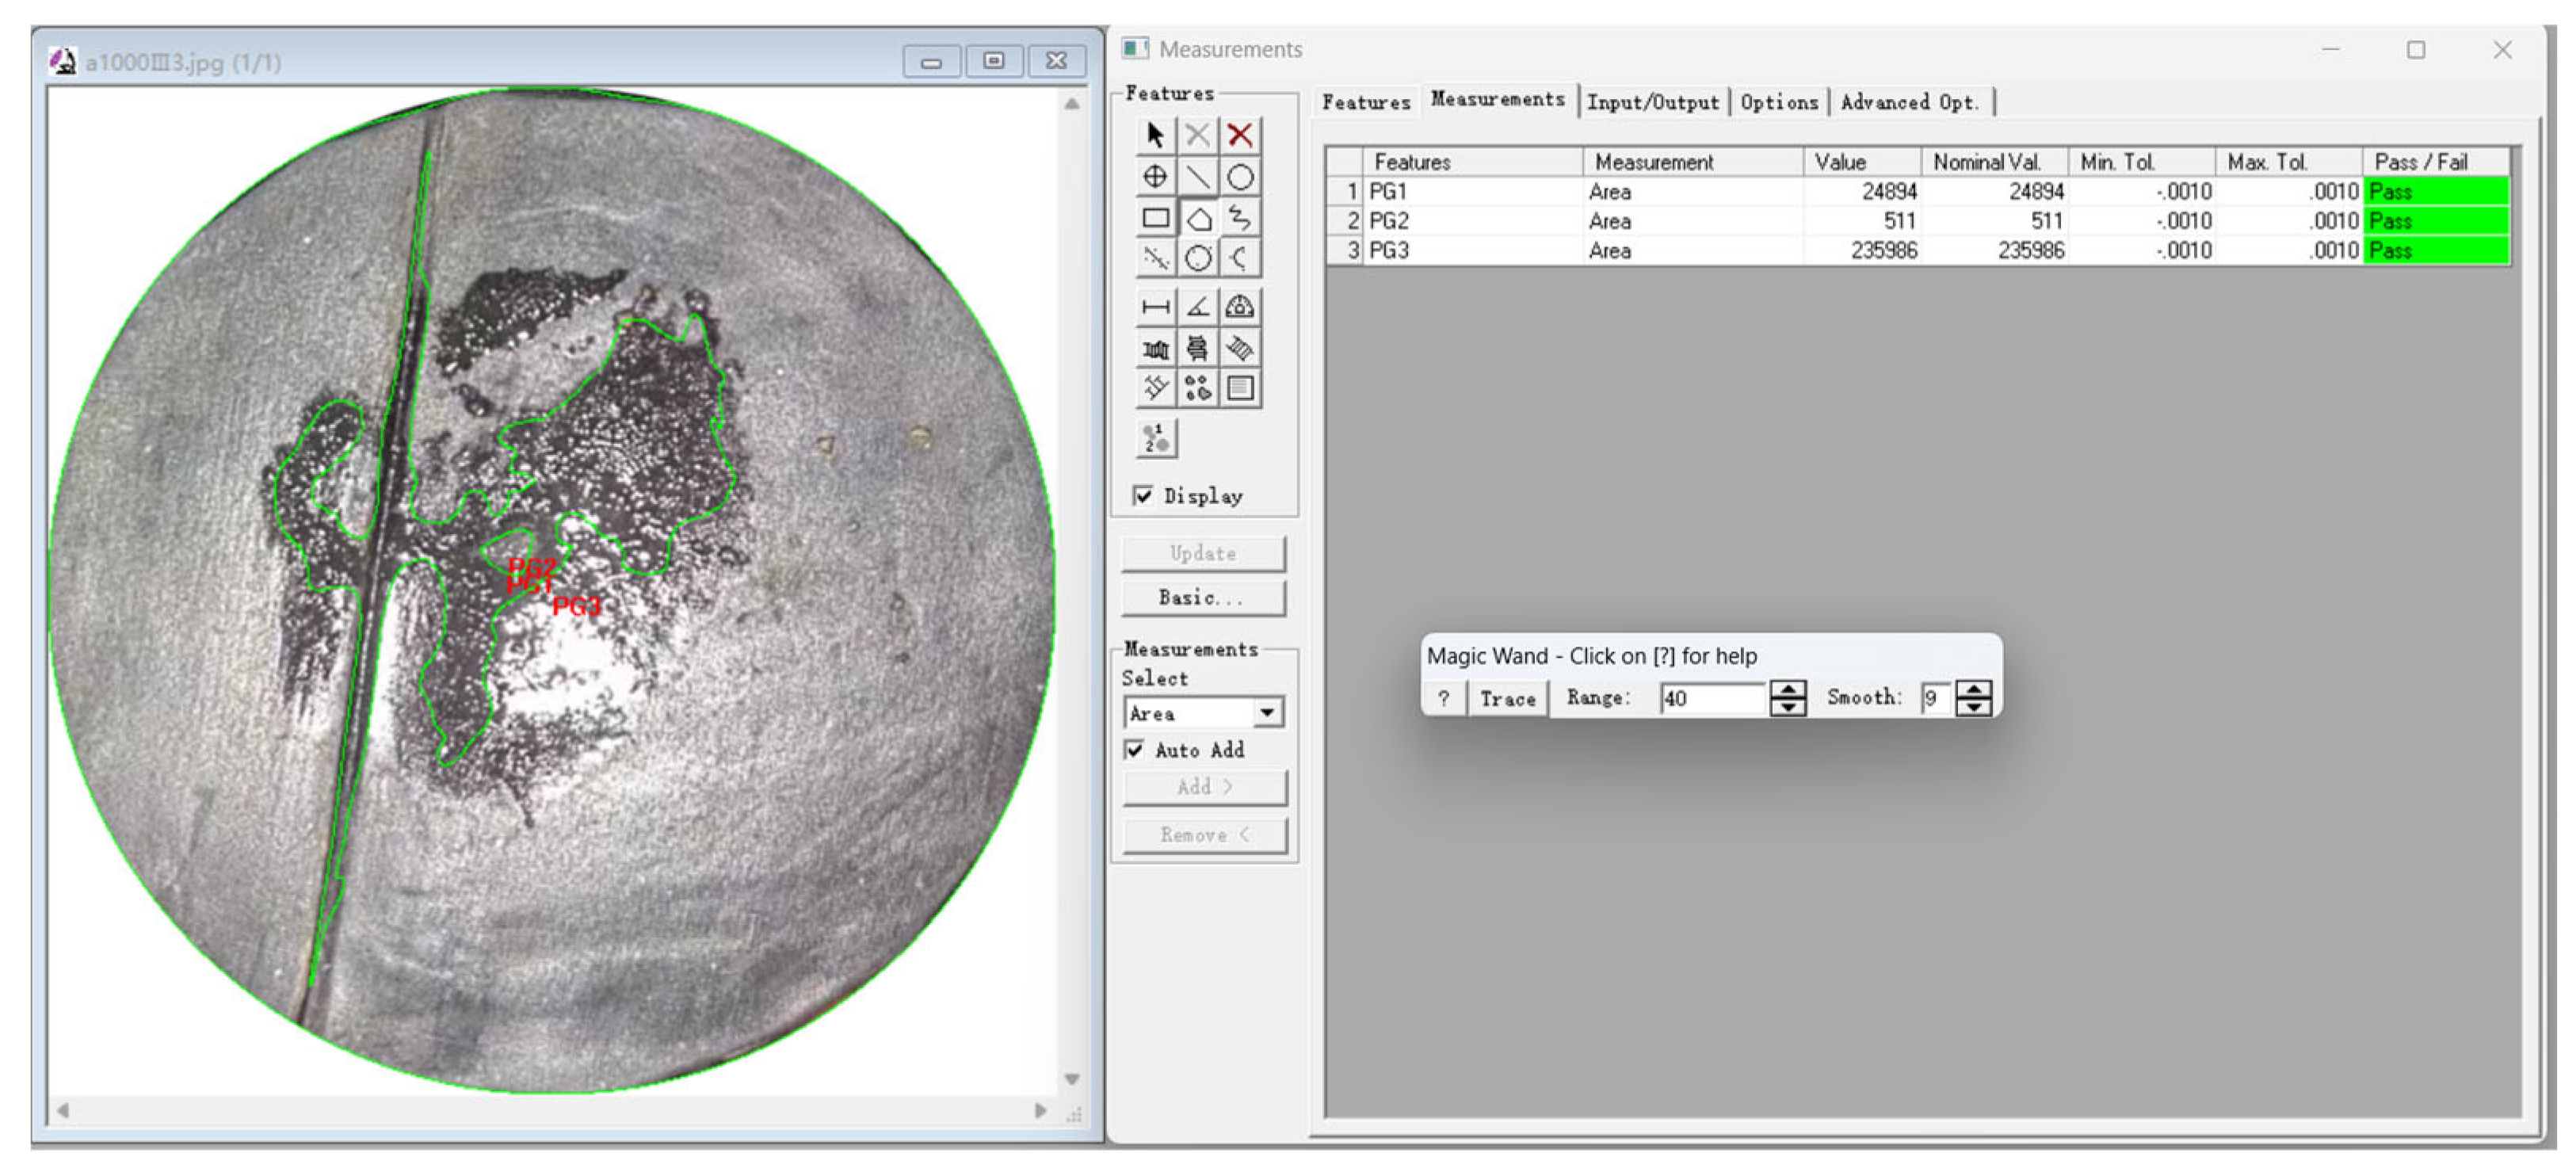
2.4. Experimental Image Data Extraction Method
- The specific steps were as follows:
- Firstly, Adobe Photoshop was used to denoise the image, and the brightness, contrast, saturation, etc., were adjusted to make the feature points of the image more obvious and facilitate the data extraction of the image.
- Then, through the Image-Pro Plus software, the polygon feature selection tool was used to automatically identify the feature points, and the feature points that were not easy to identify were supplemented by manual description.
- Finally, the software was used to automatically calculate the area of the selected feature points and export the data.
3. Analysis of Test Results
4. Discussion
4.1. Rubber Surface Analysis
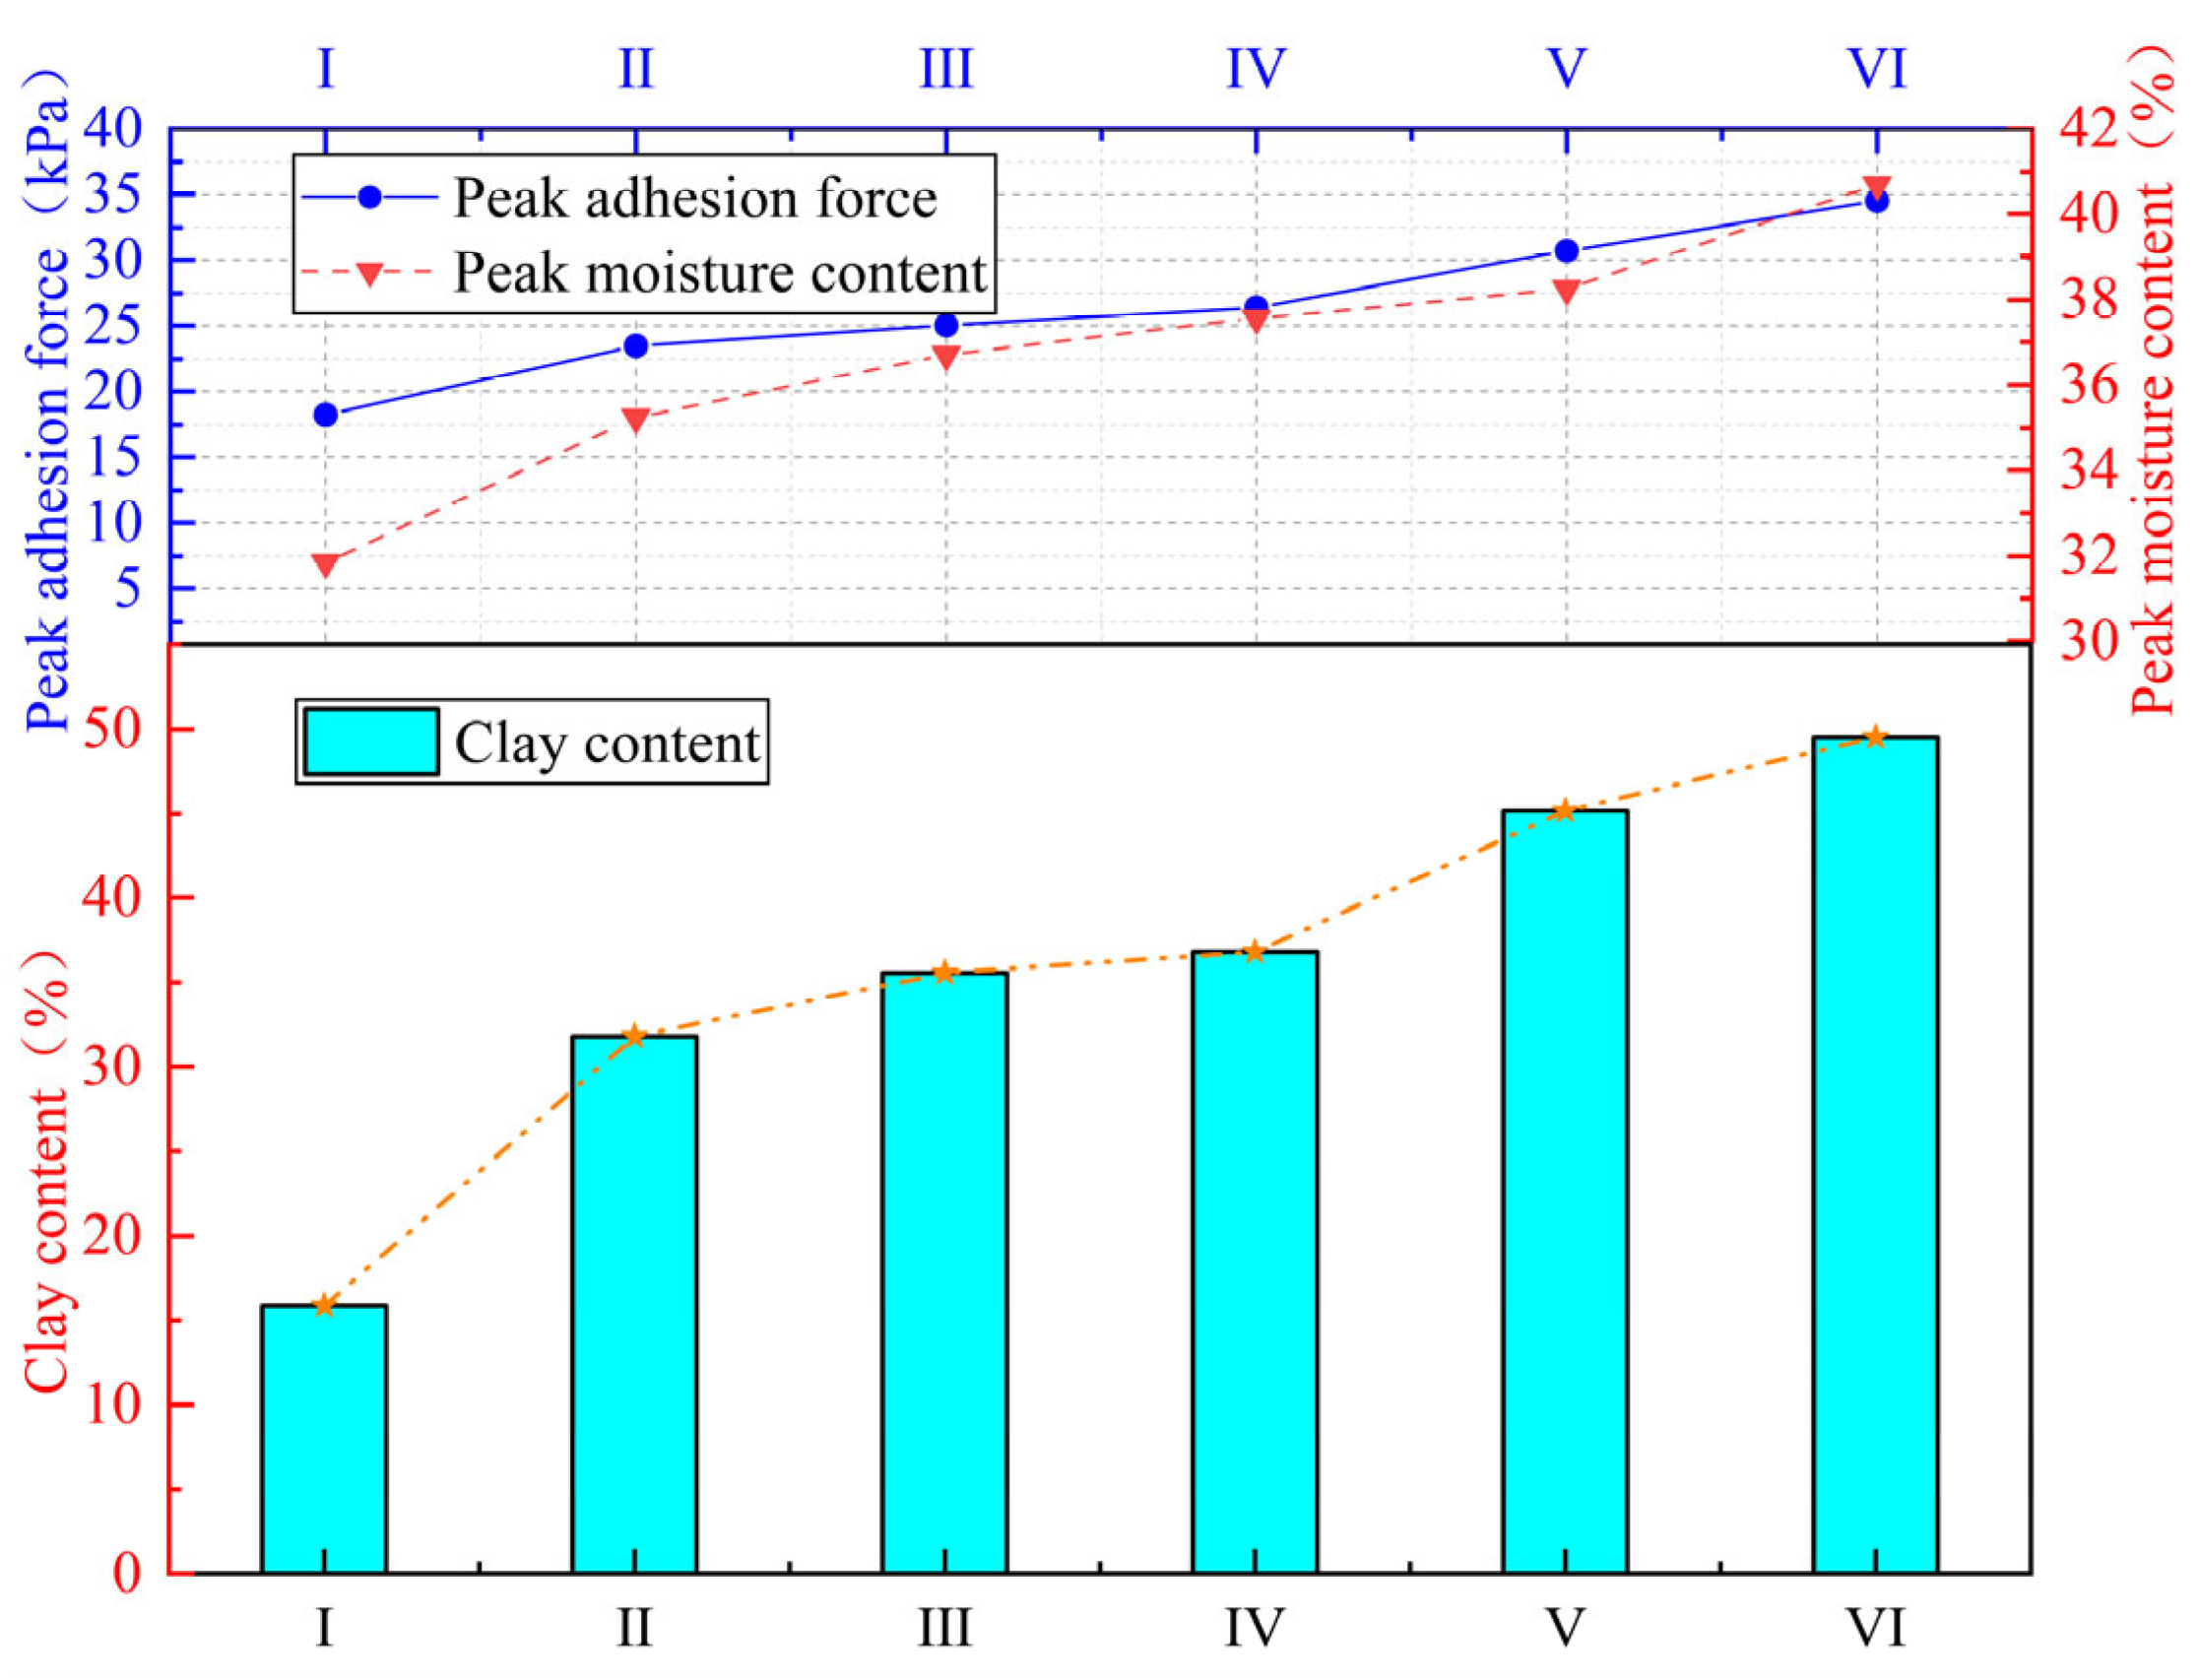
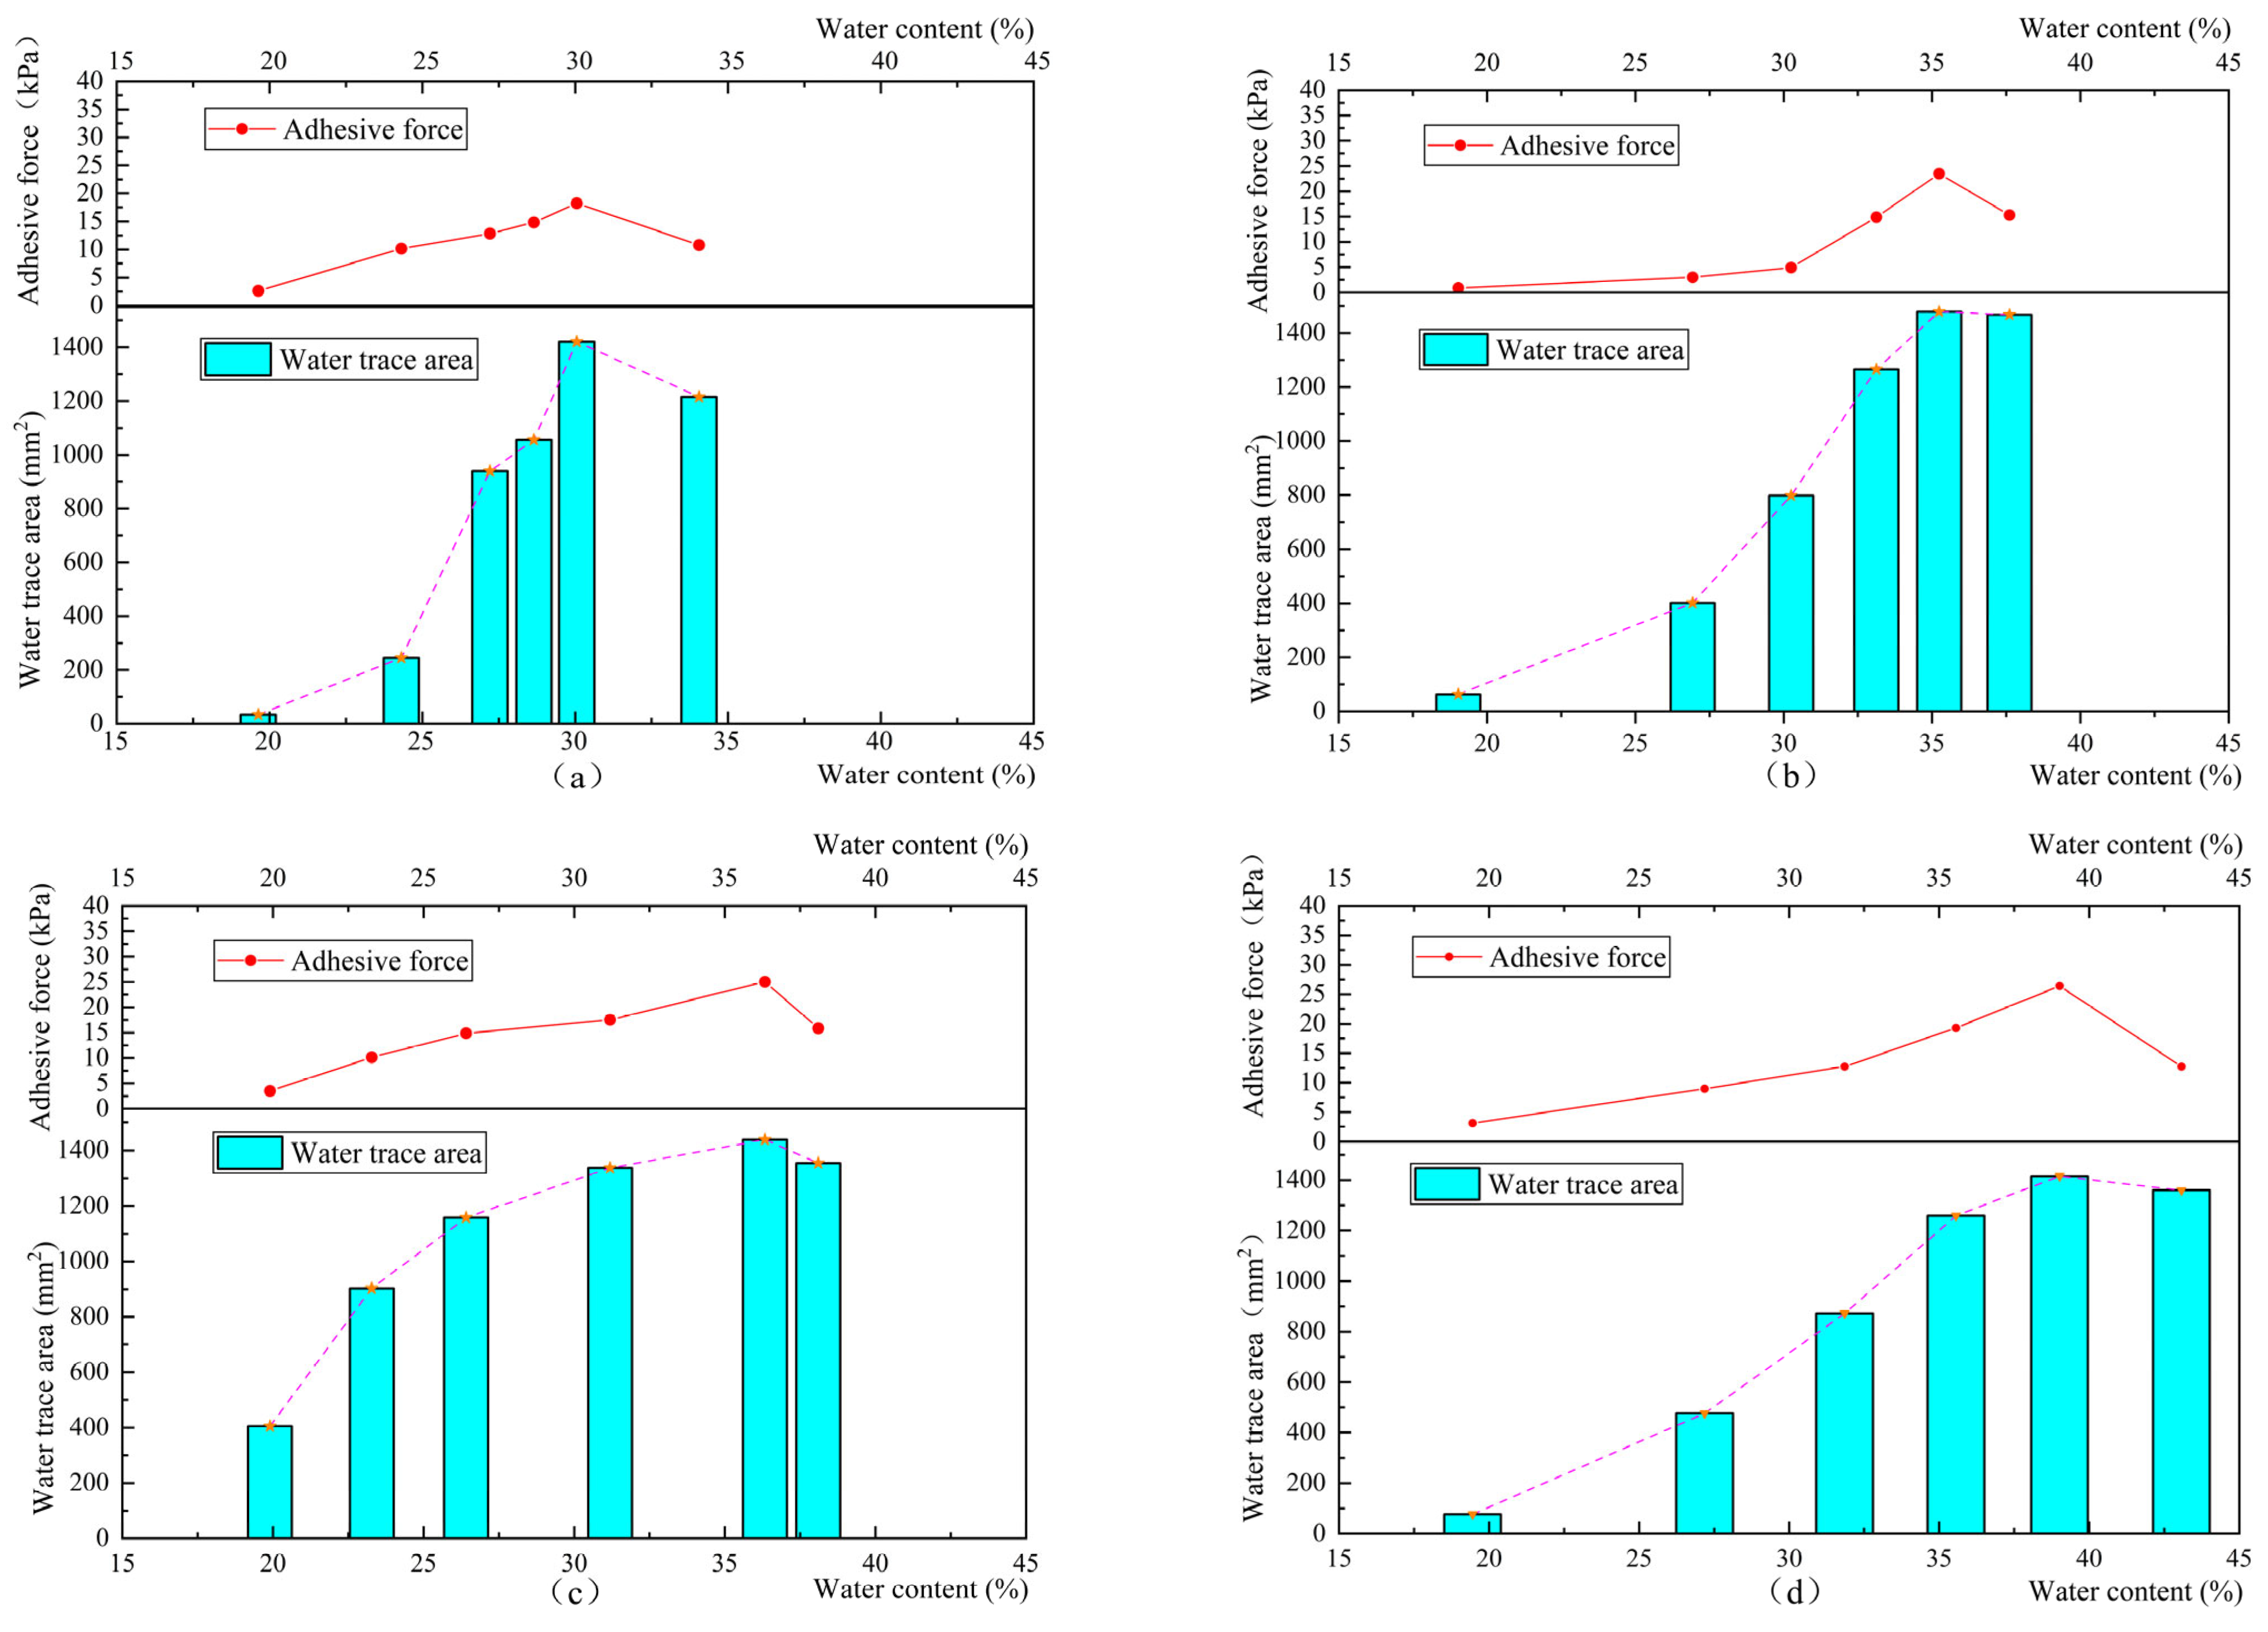
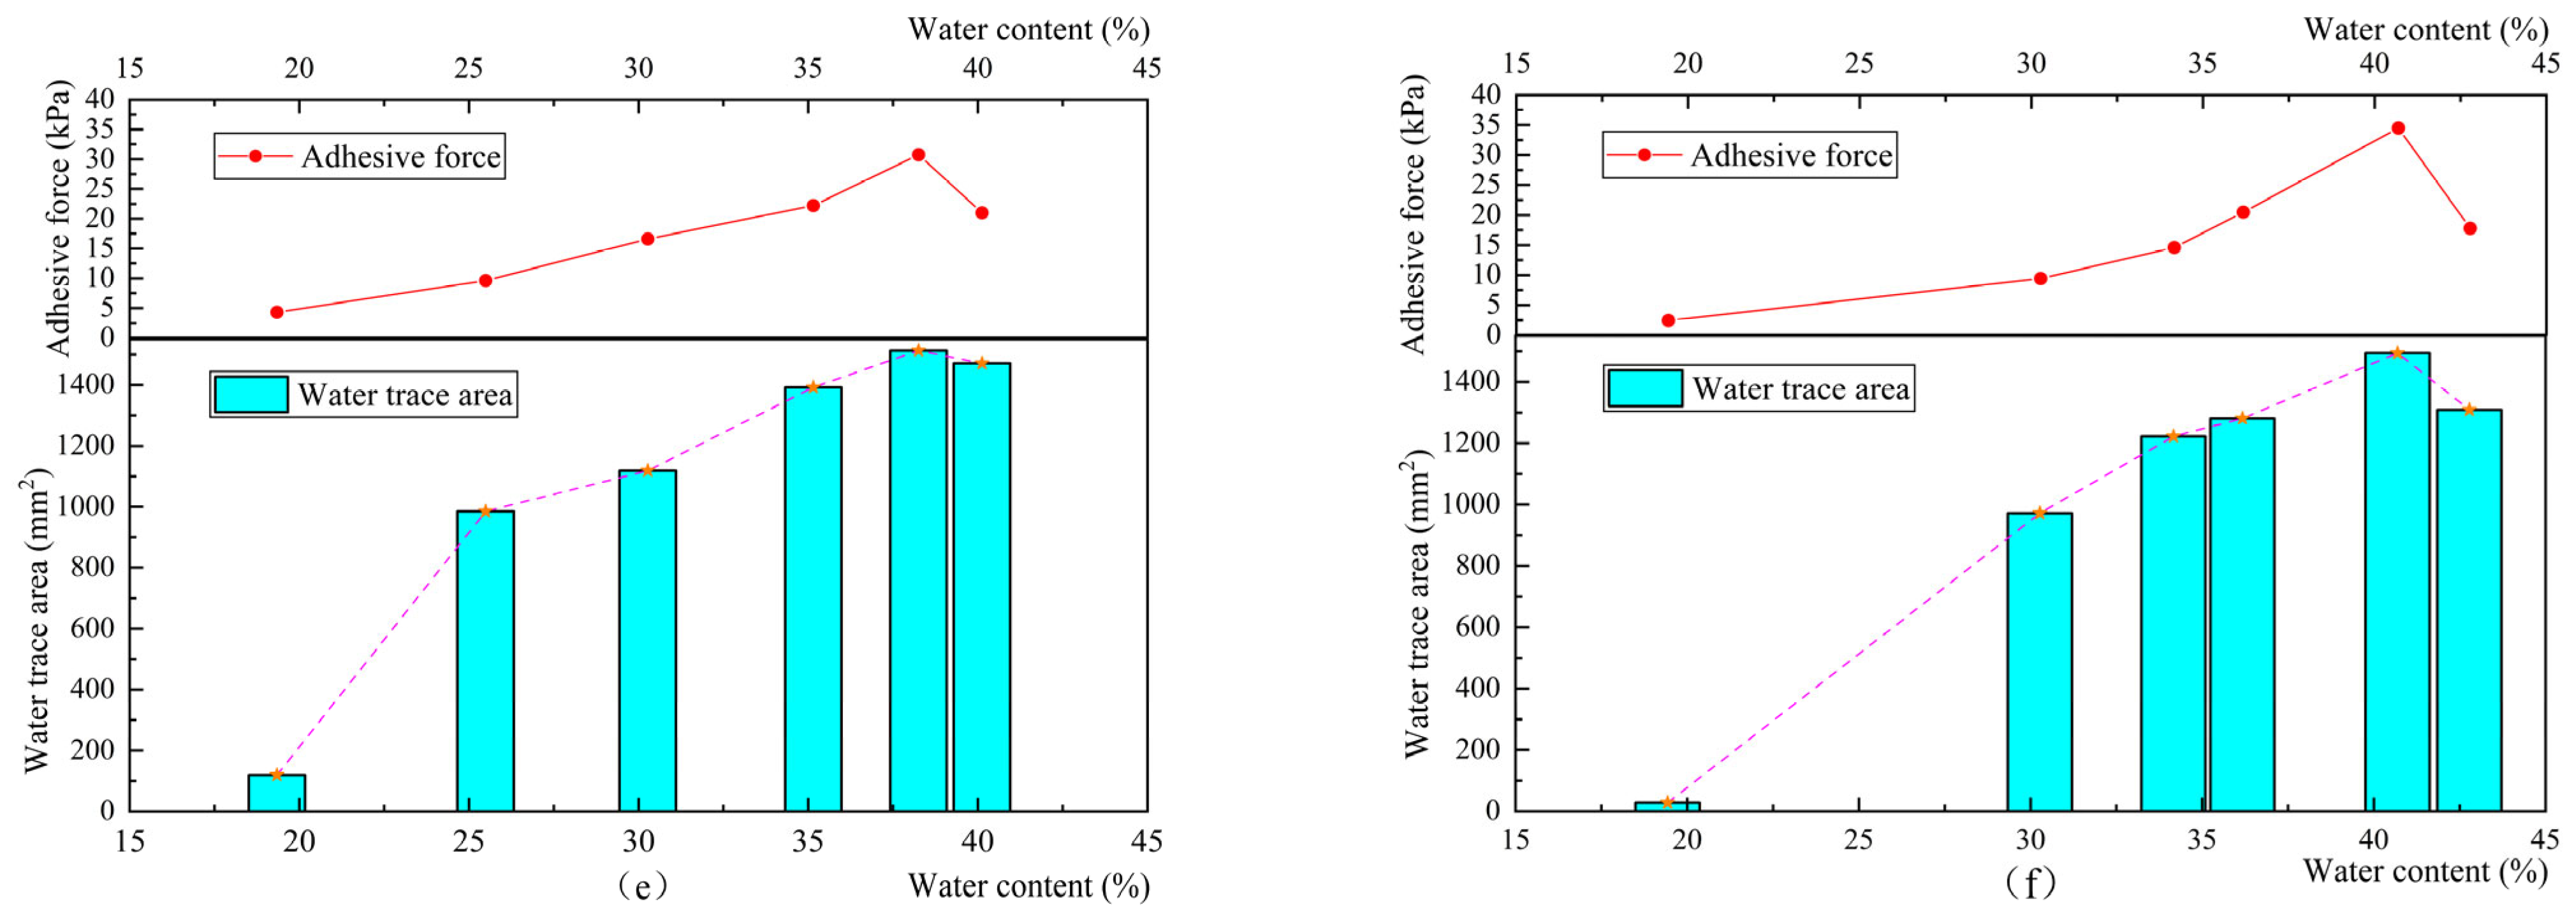
4.2. Relationship Between Water Mark Area and Adhesion Force
4.3. Adhesion Theory Analysis
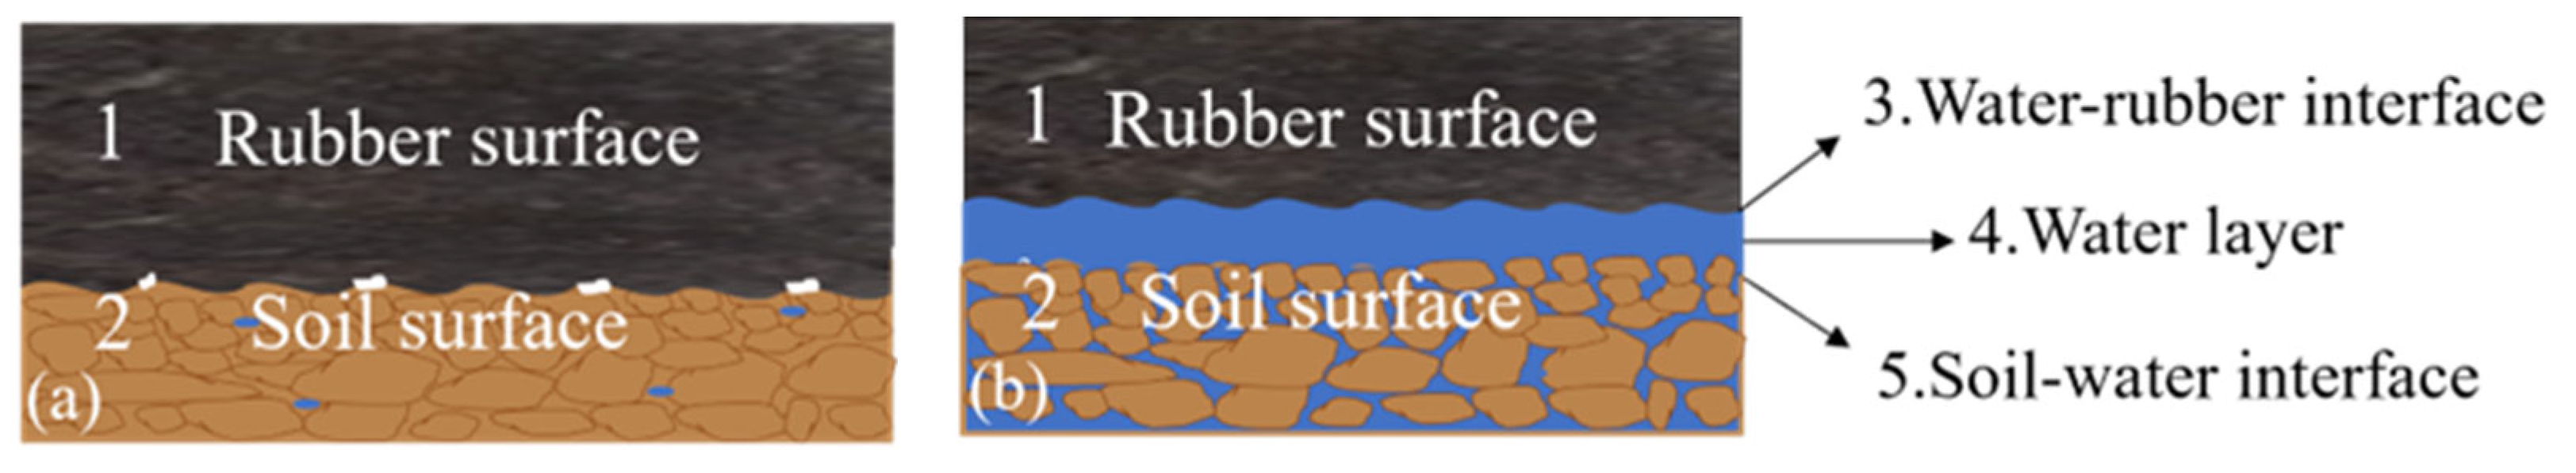
4.3.1. Rubber–Soil Interface Contact Model
4.3.2. Rubber–Soil Interface Adhesion Model
4.3.3. Rubber–Soil Interface Separation Model
5. Conclusions
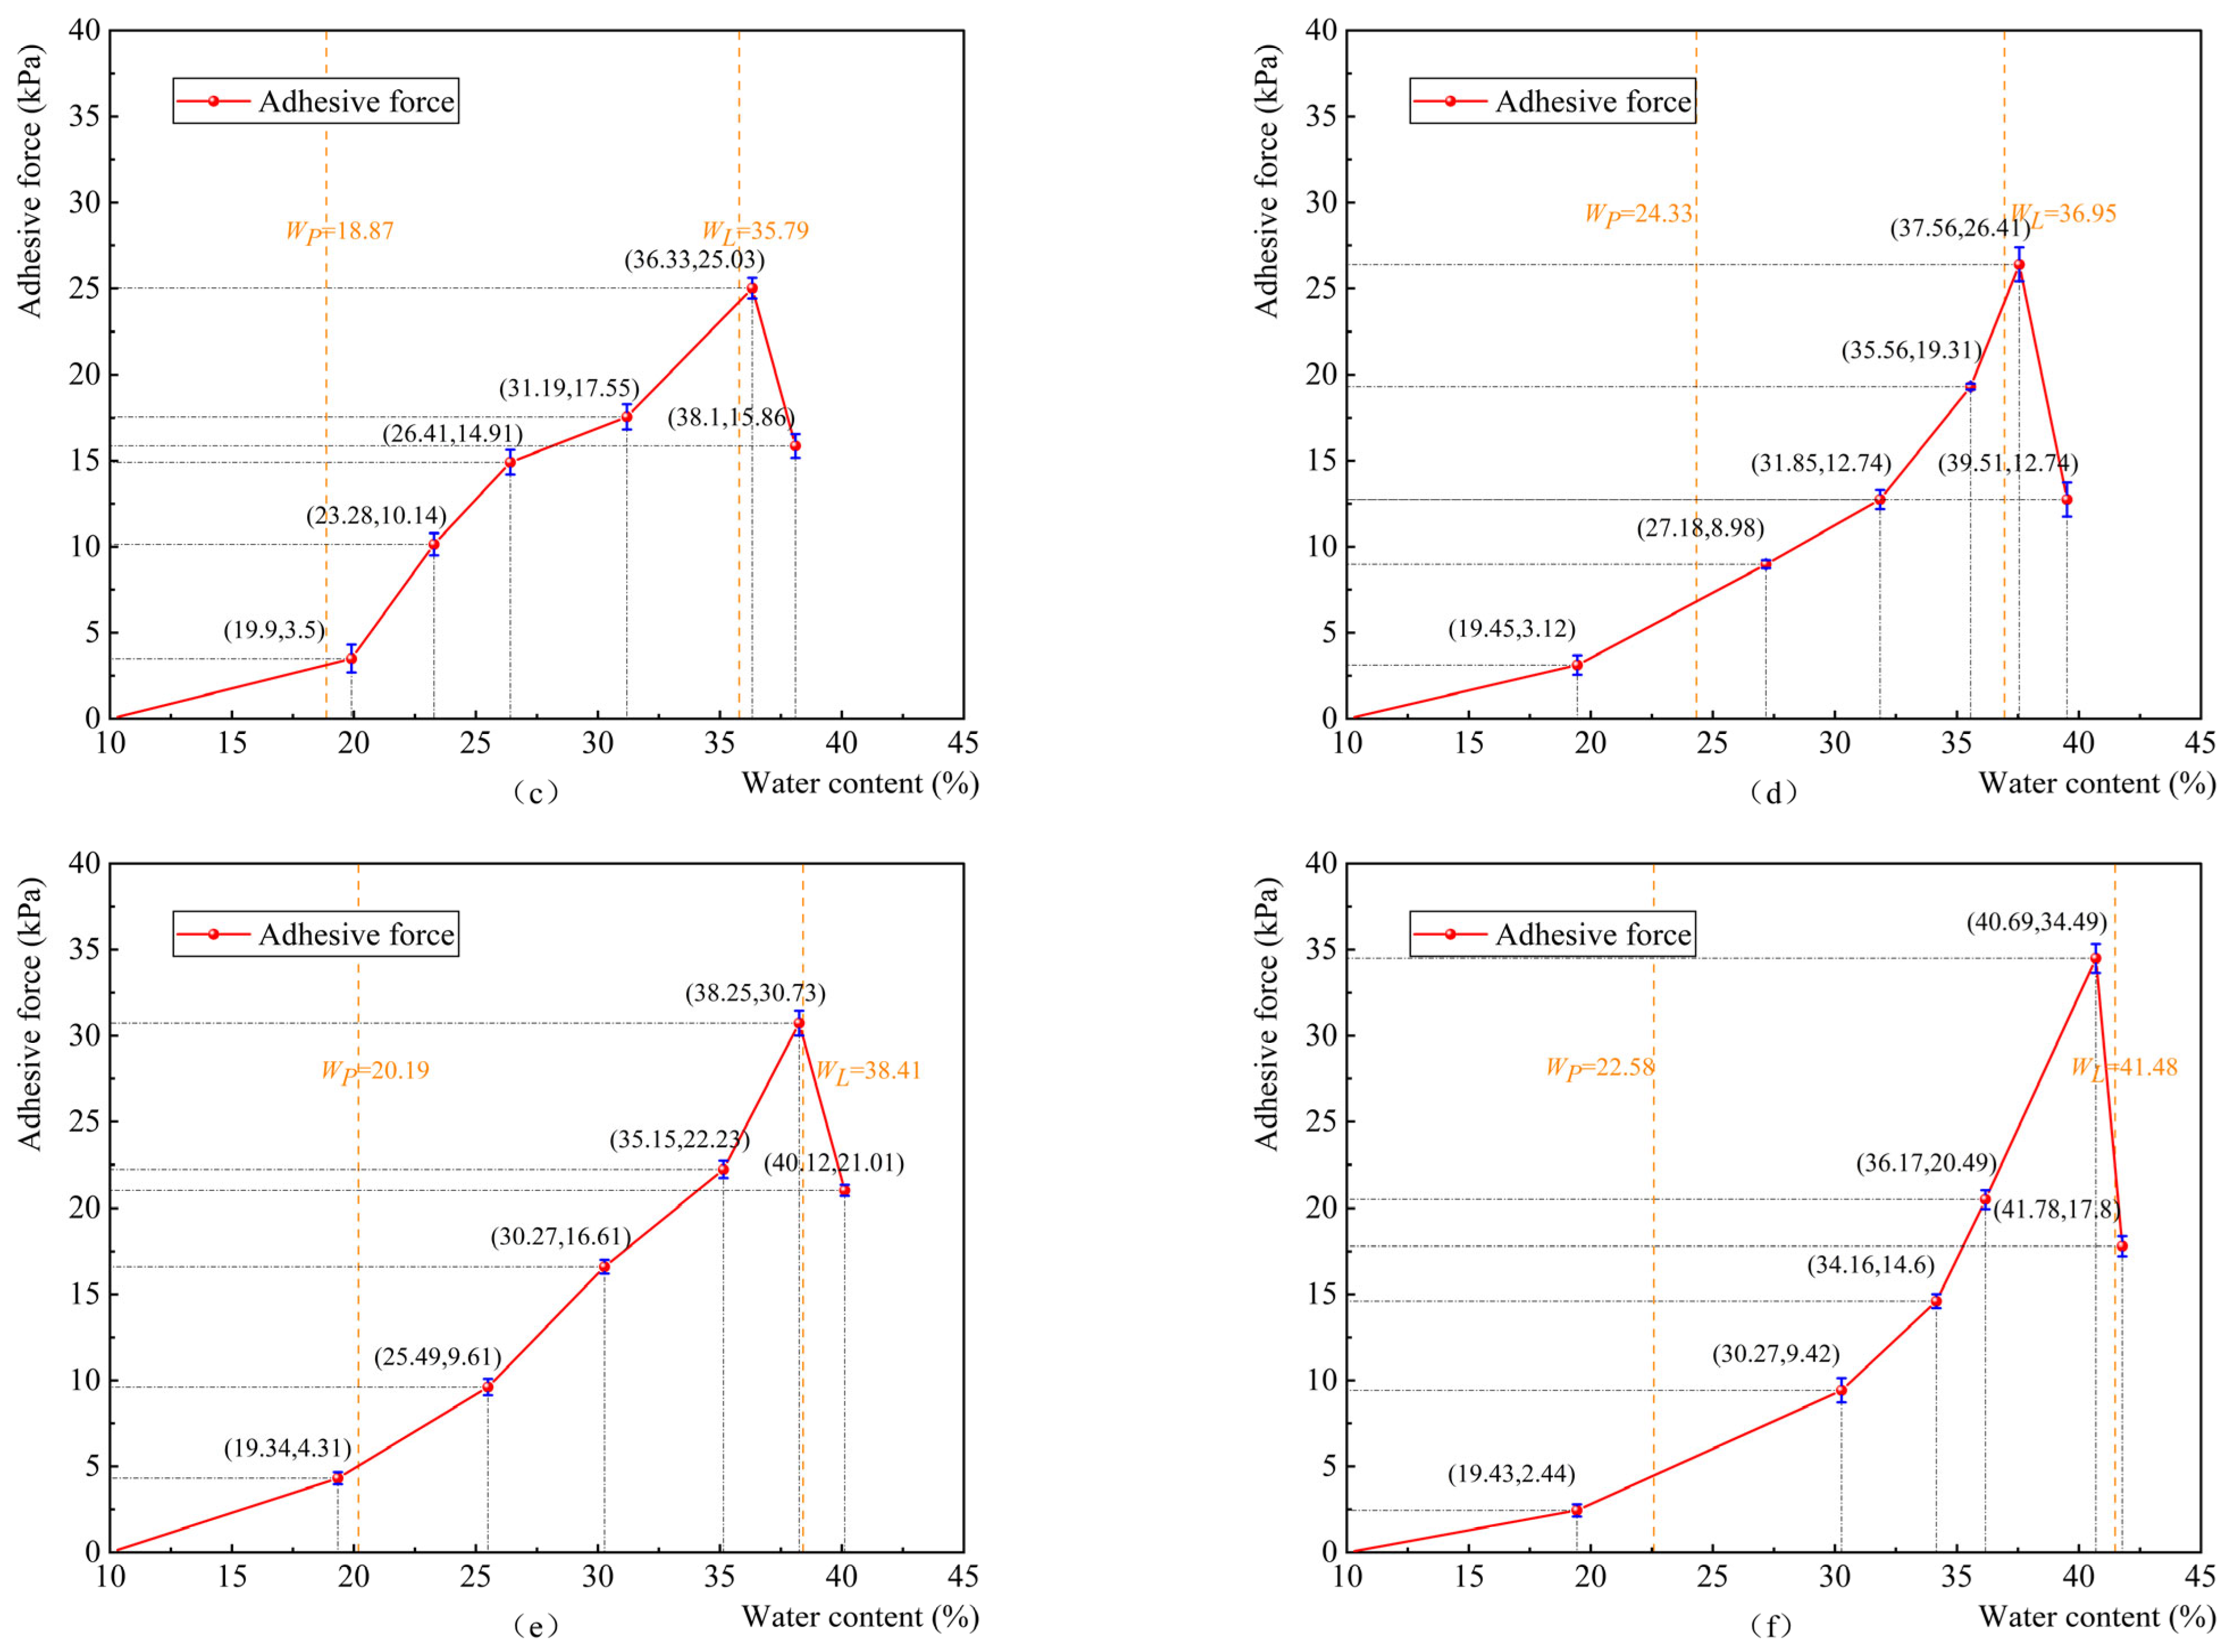
- The adhesion of soil increased first and then decreased with the increase in water content. When the soil moisture content increased to the liquid limit, the soil adhesion reached the peak value, and then the soil adhesion began to decrease. With the increase of clay content from 15.87% to 49.52%, the peak adhesion also increased from 18.2 kPa to 34.5 kPa. When the soil adhesion force reached the peak, the corresponding water content also increased from 31.84% to 40.69%.
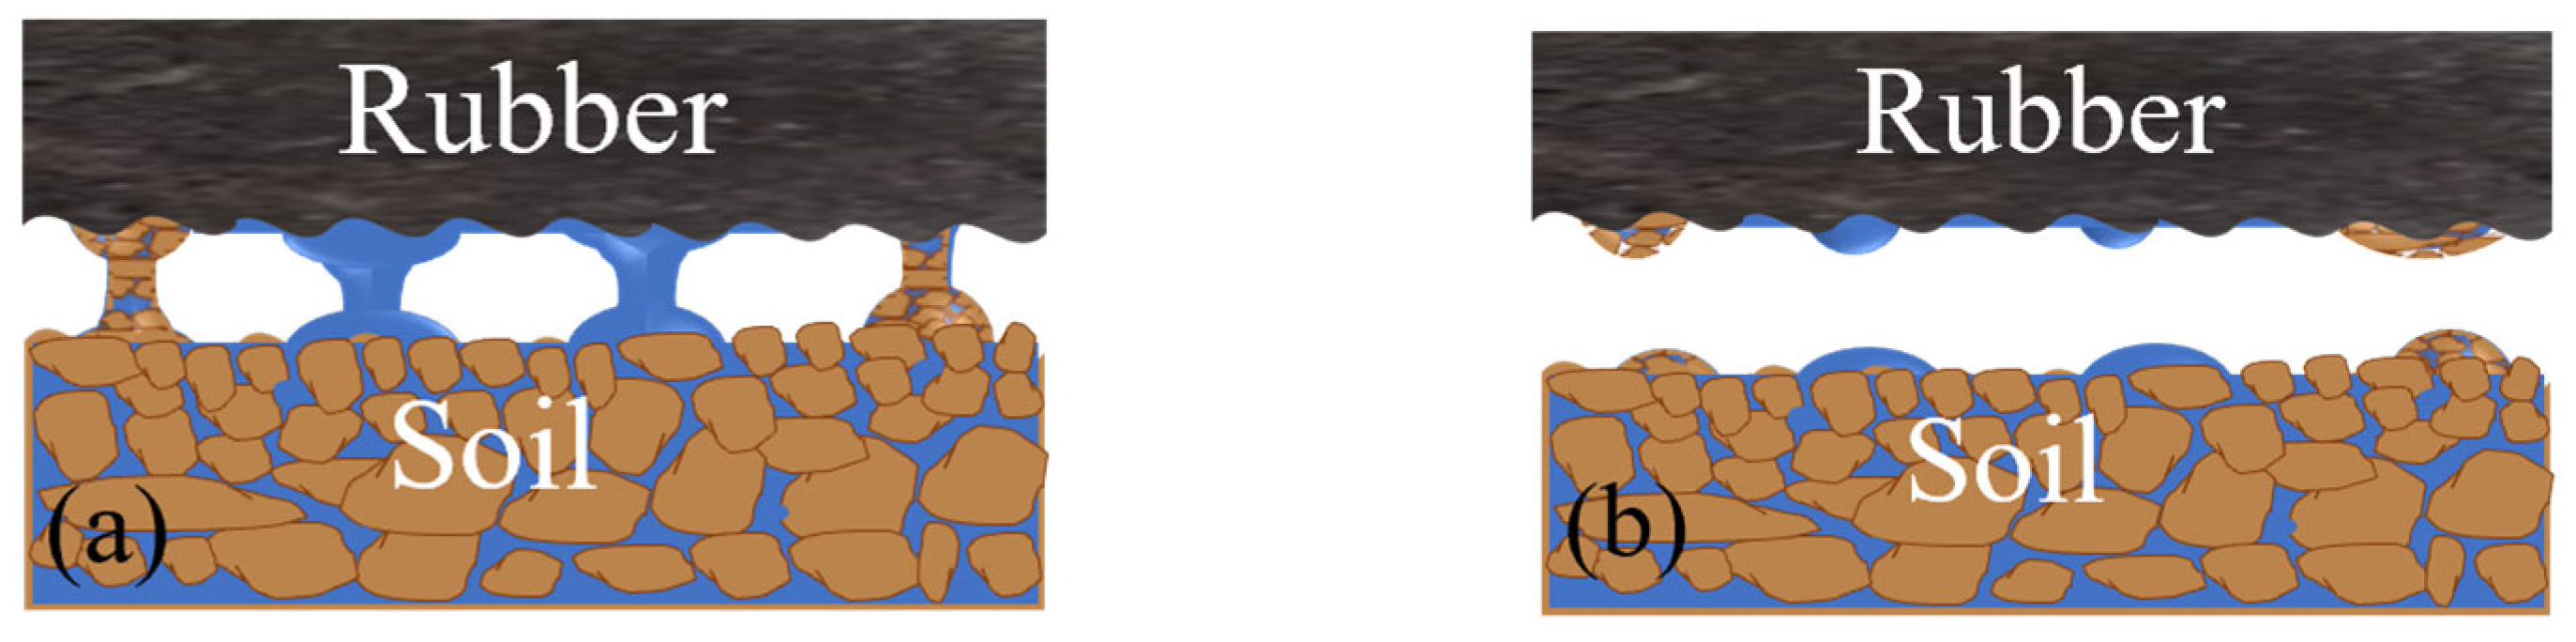
- The size of the soil adhesion was related to the area of the infiltrated rubber surface. With the increase in soil moisture content, the soil fluidity increased, the area of water marks formed on the rubber surface gradually increased, and the soil adhesion also increased. Until the soil moisture content reached the liquid limit, the water mark area on the rubber surface reached the maximum, water droplets appeared, and the soil adhesion reached the peak.
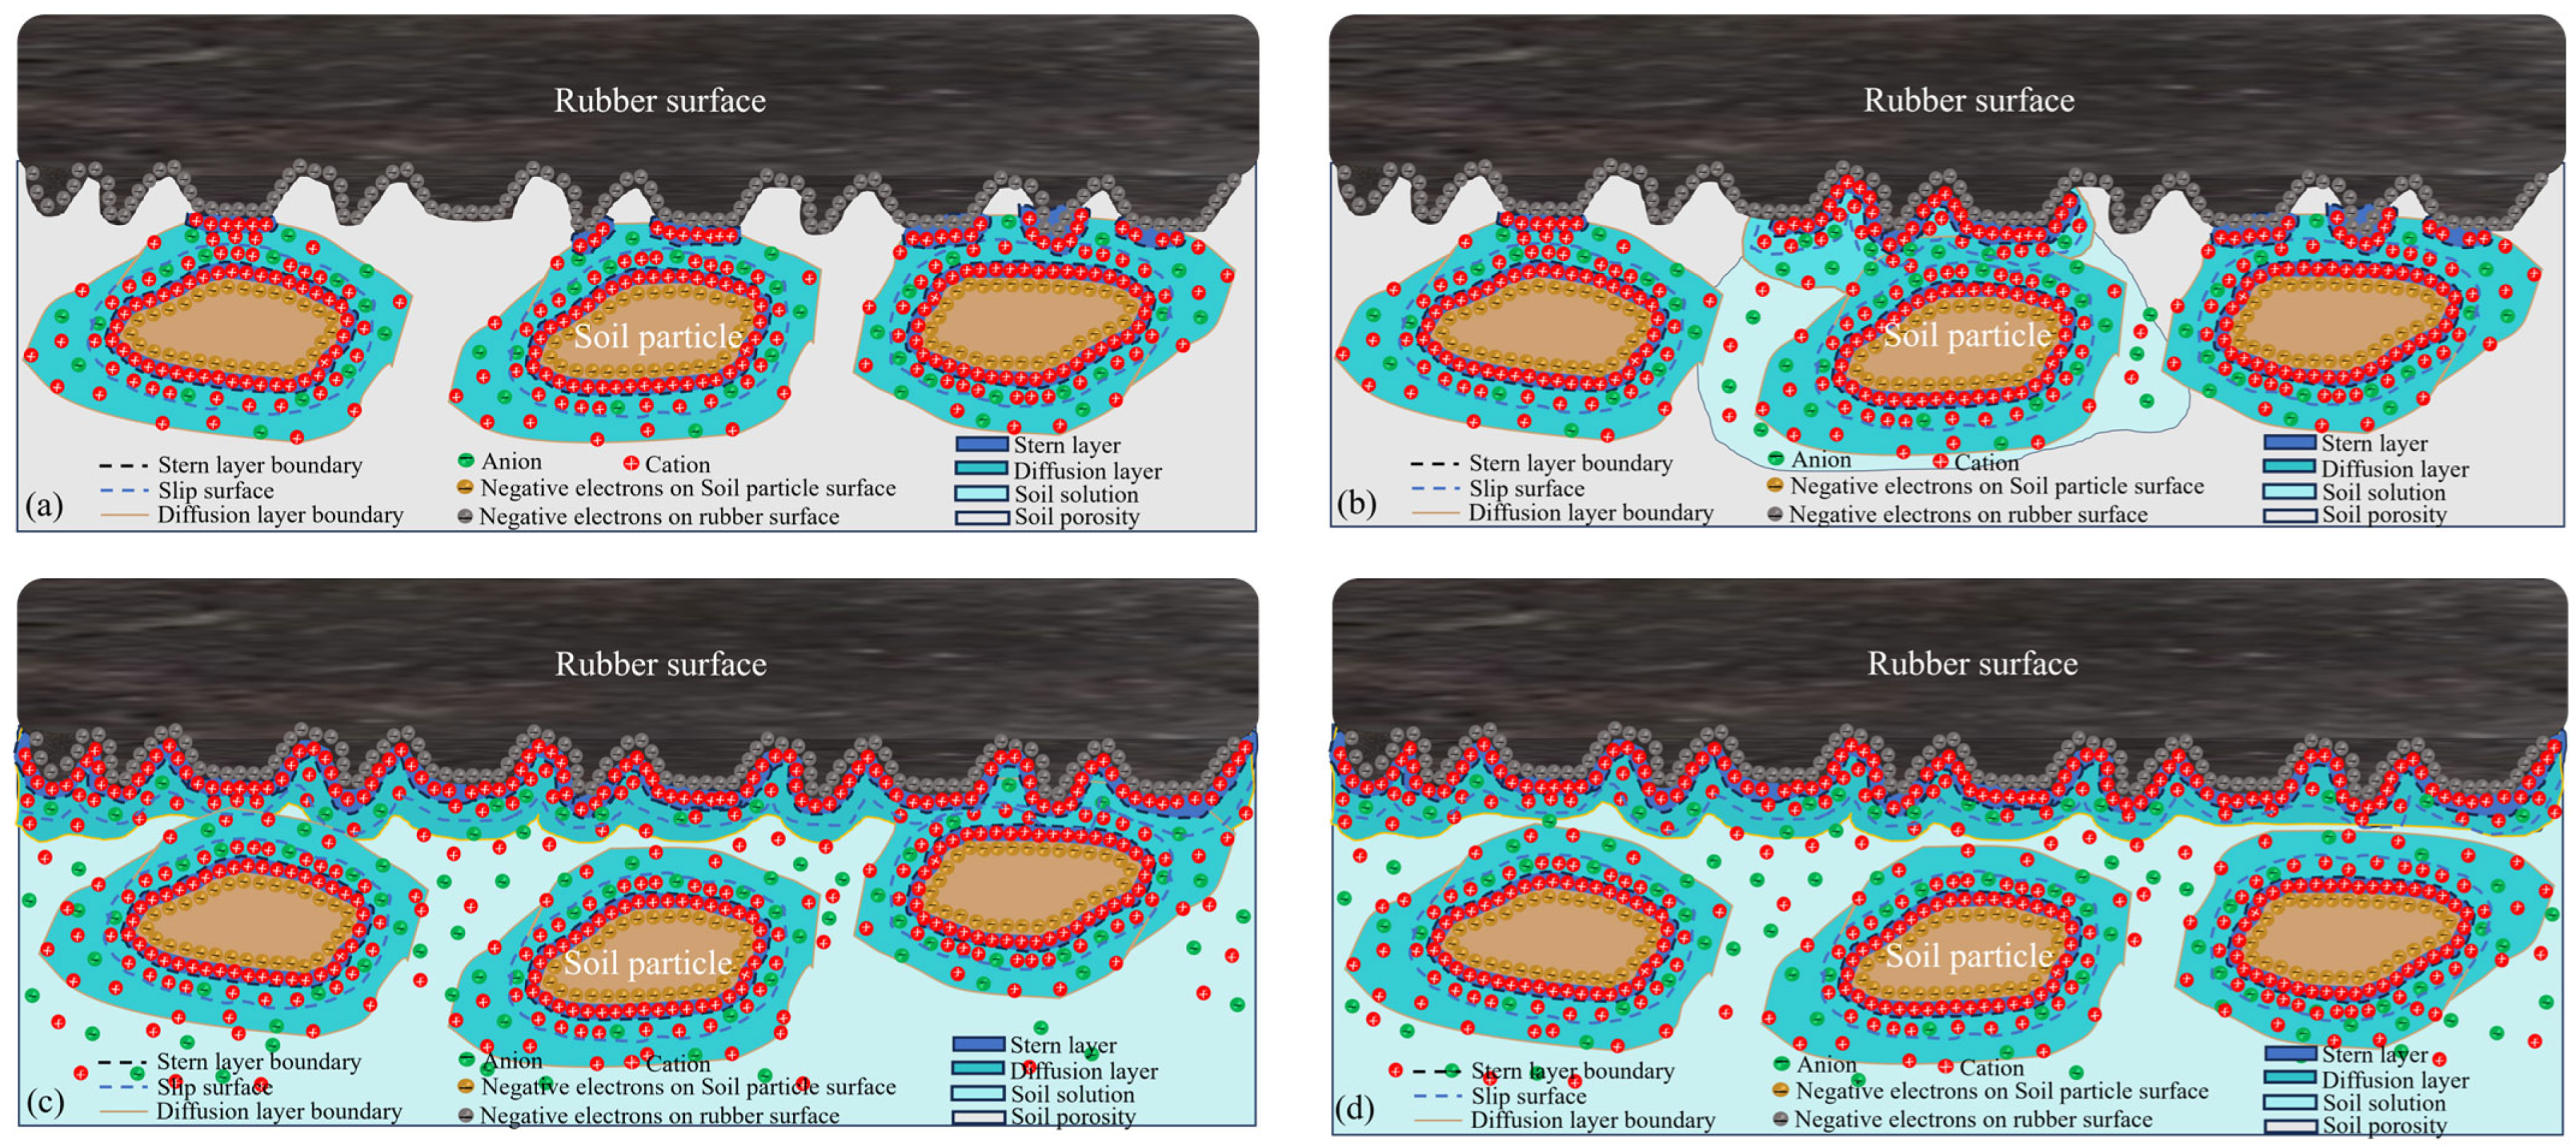
- According to the test results, the contact, adhesion, and separation models of the rubber–soil interface were constructed, and the mechanism of soil adhesion was explained.
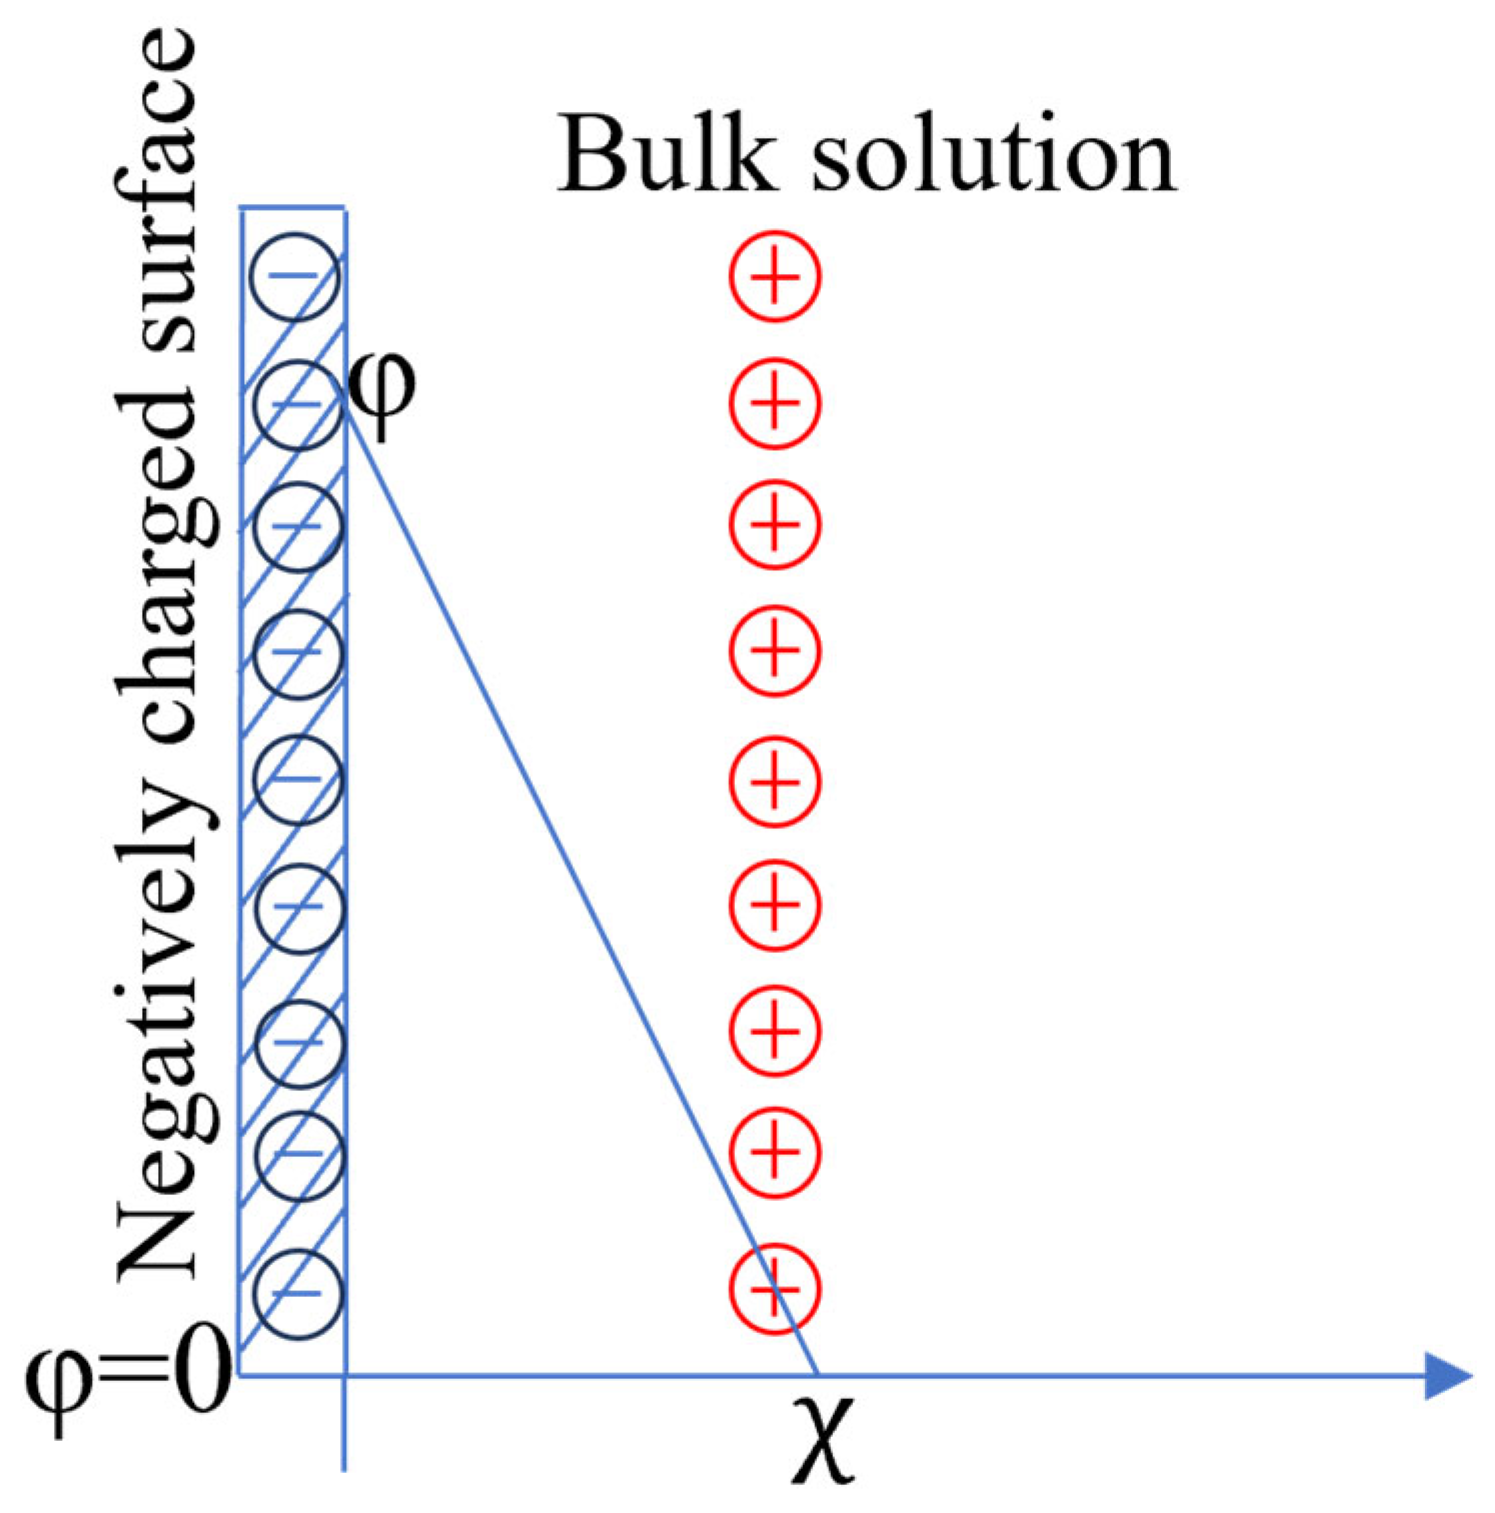
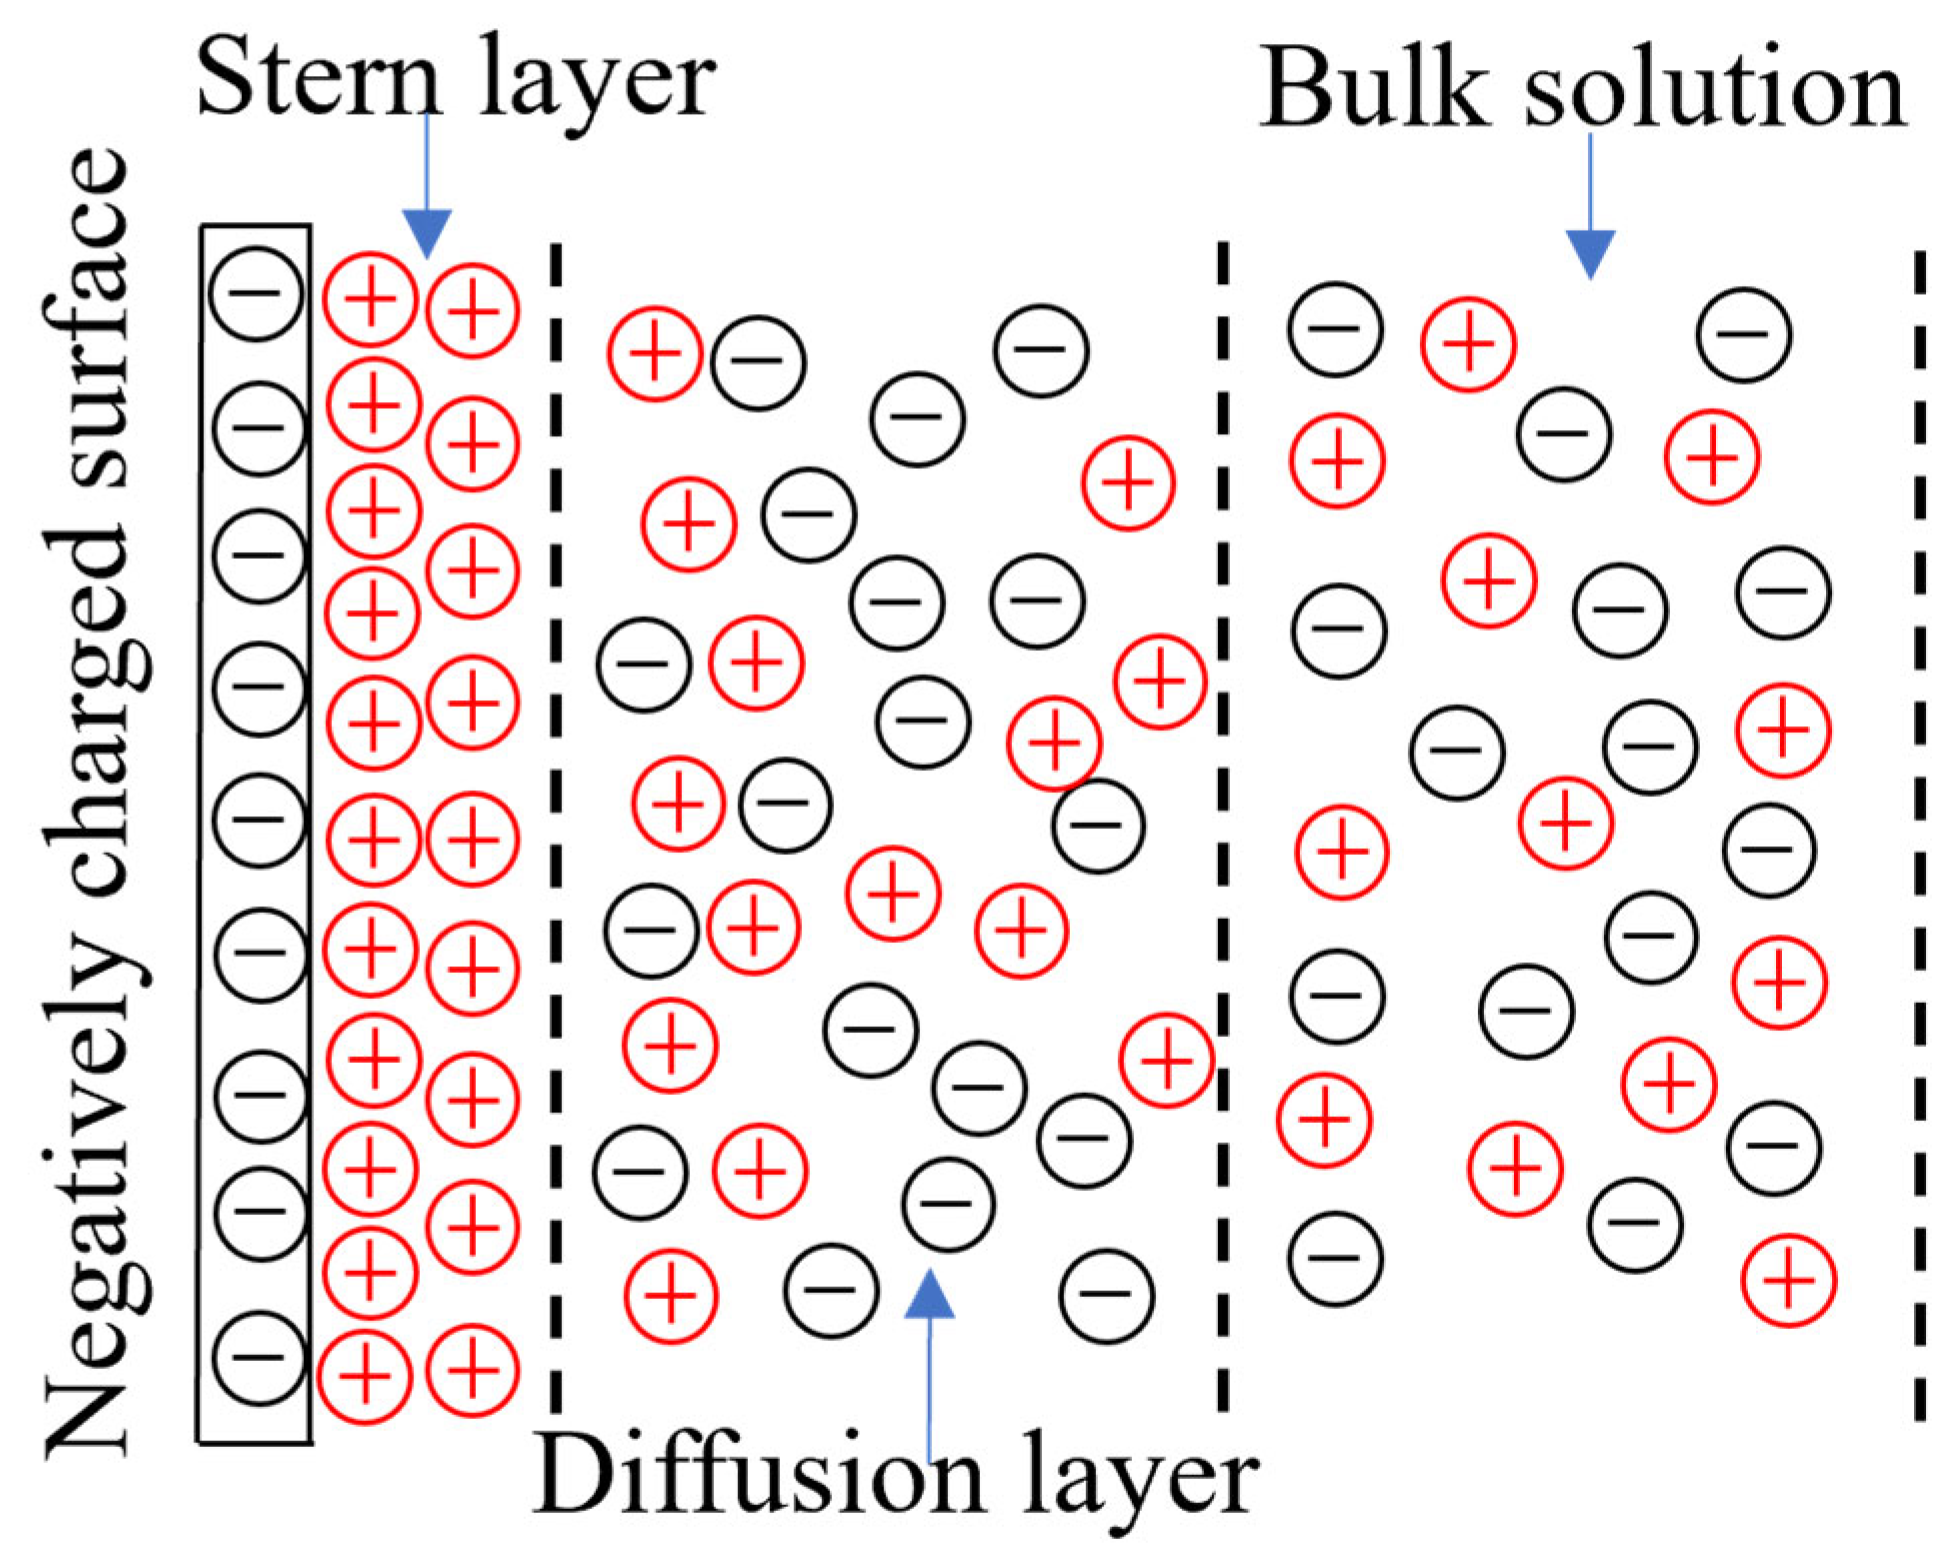
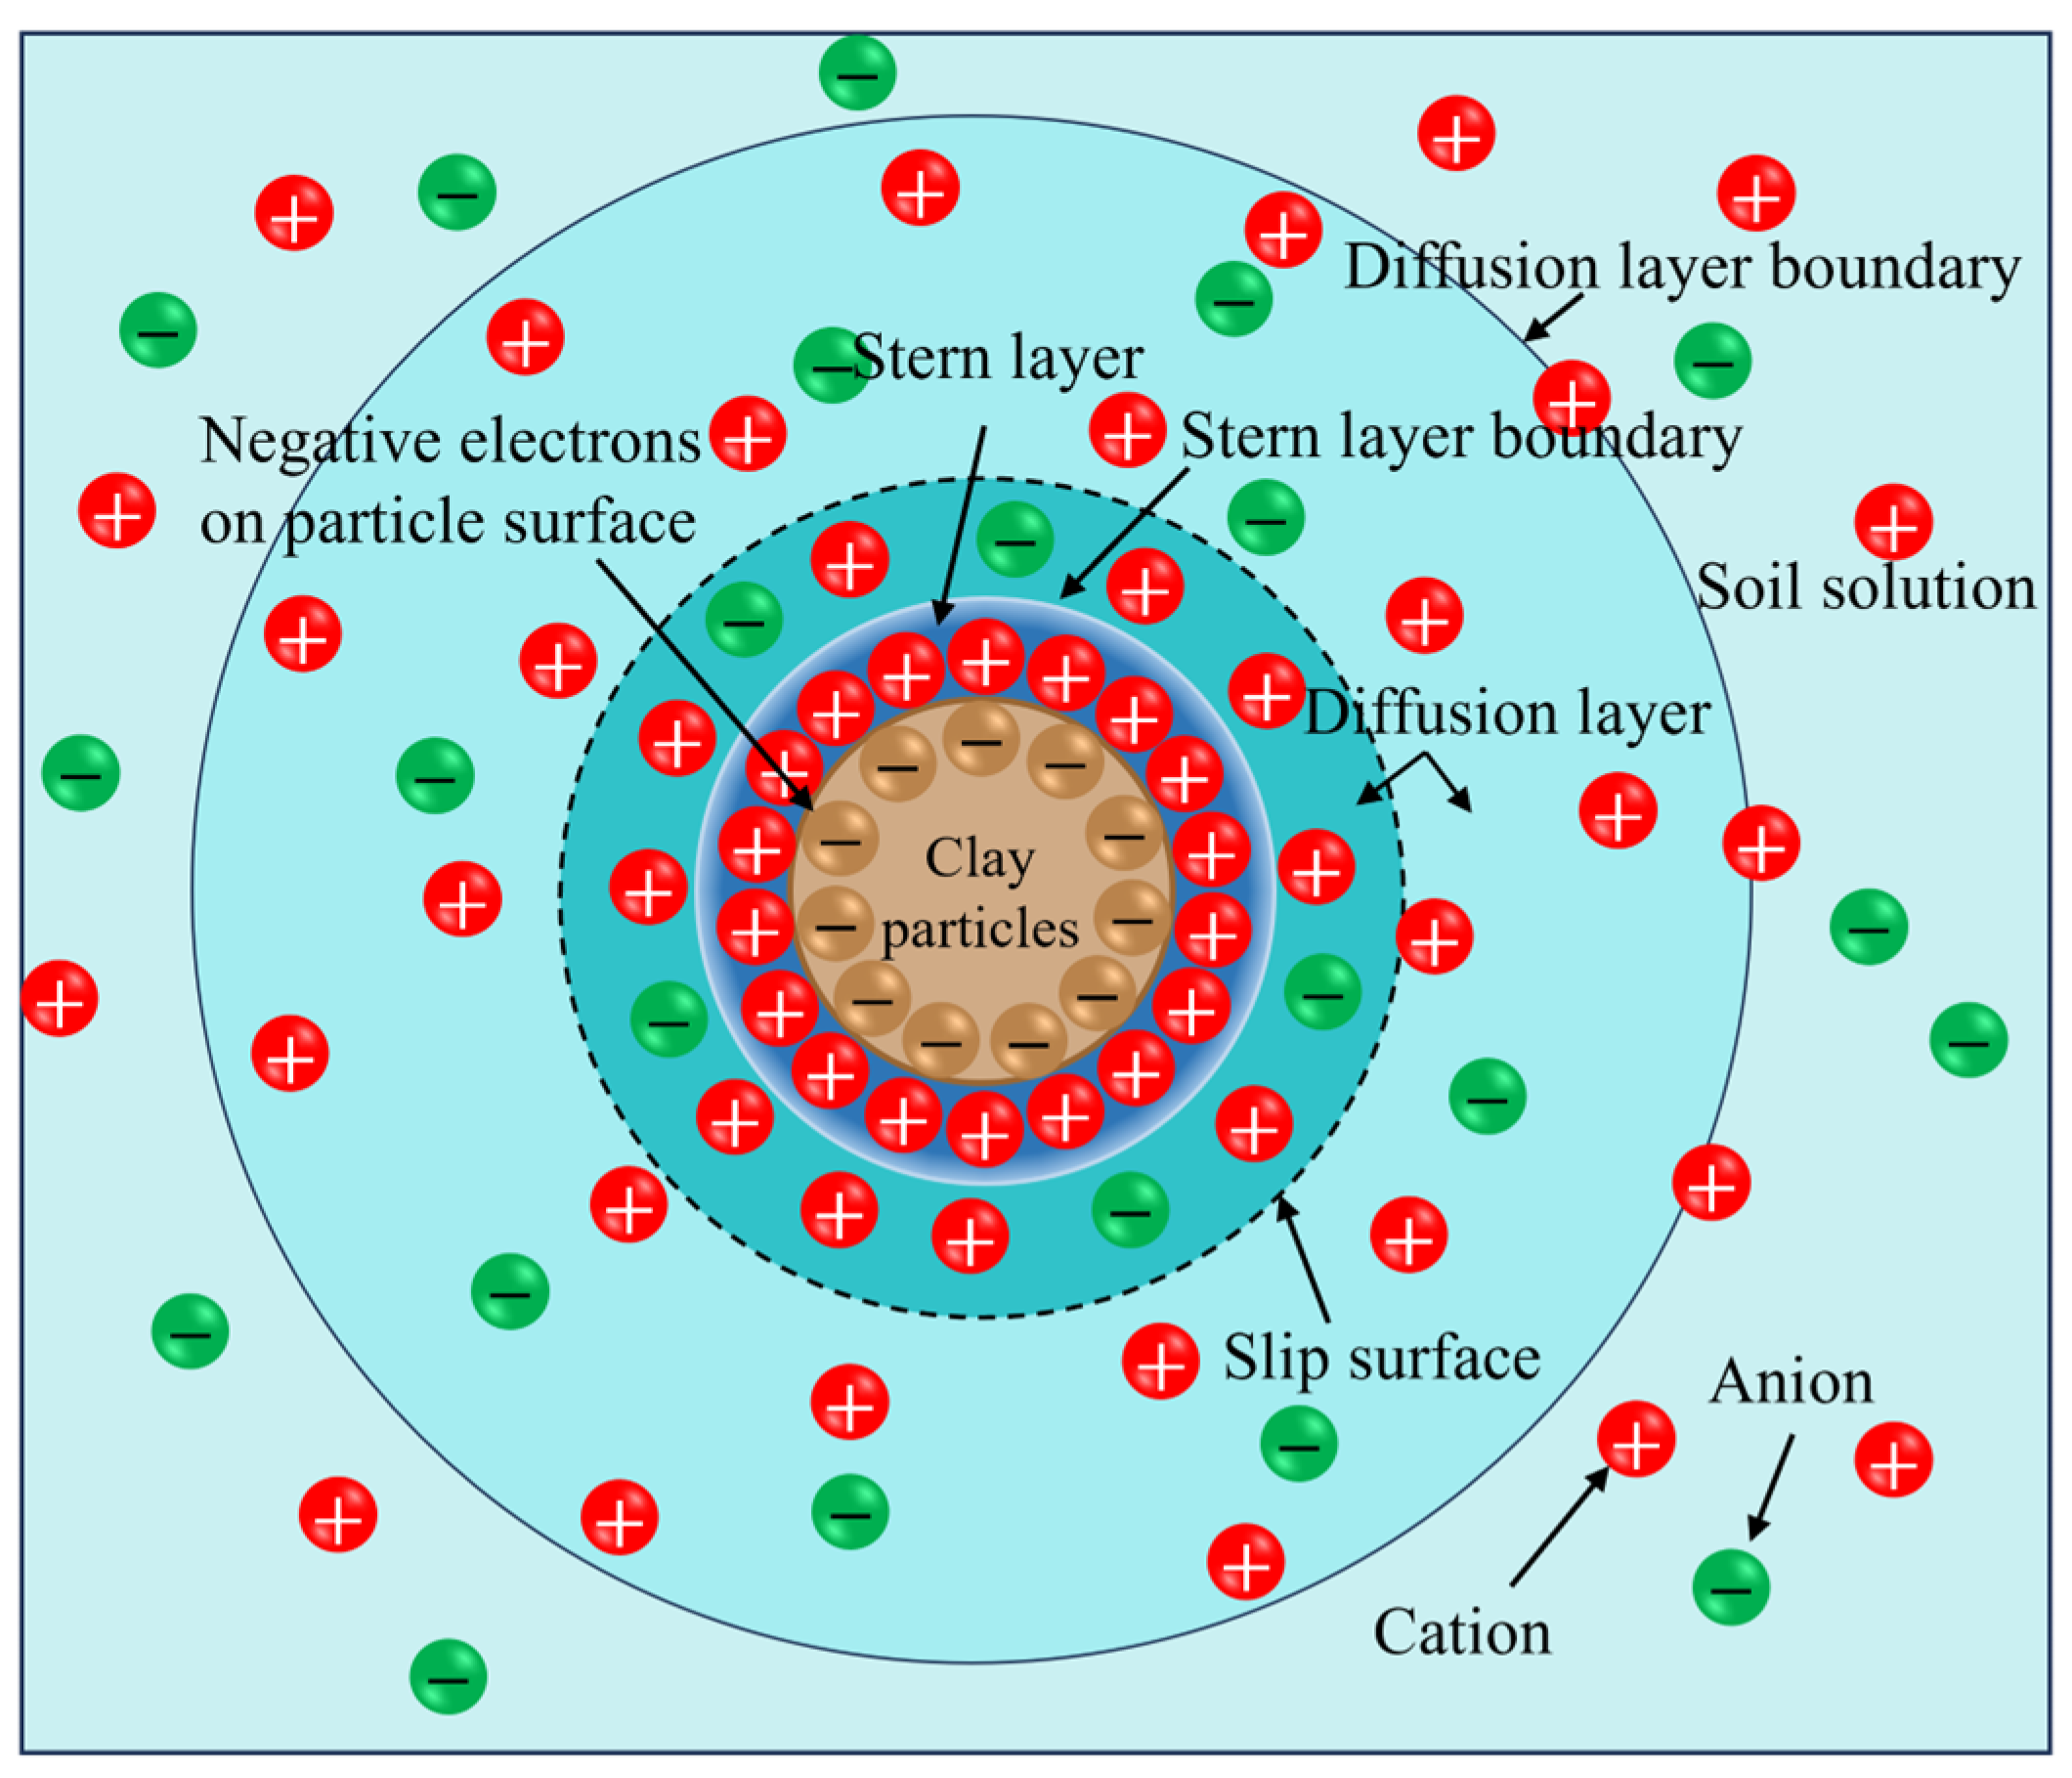
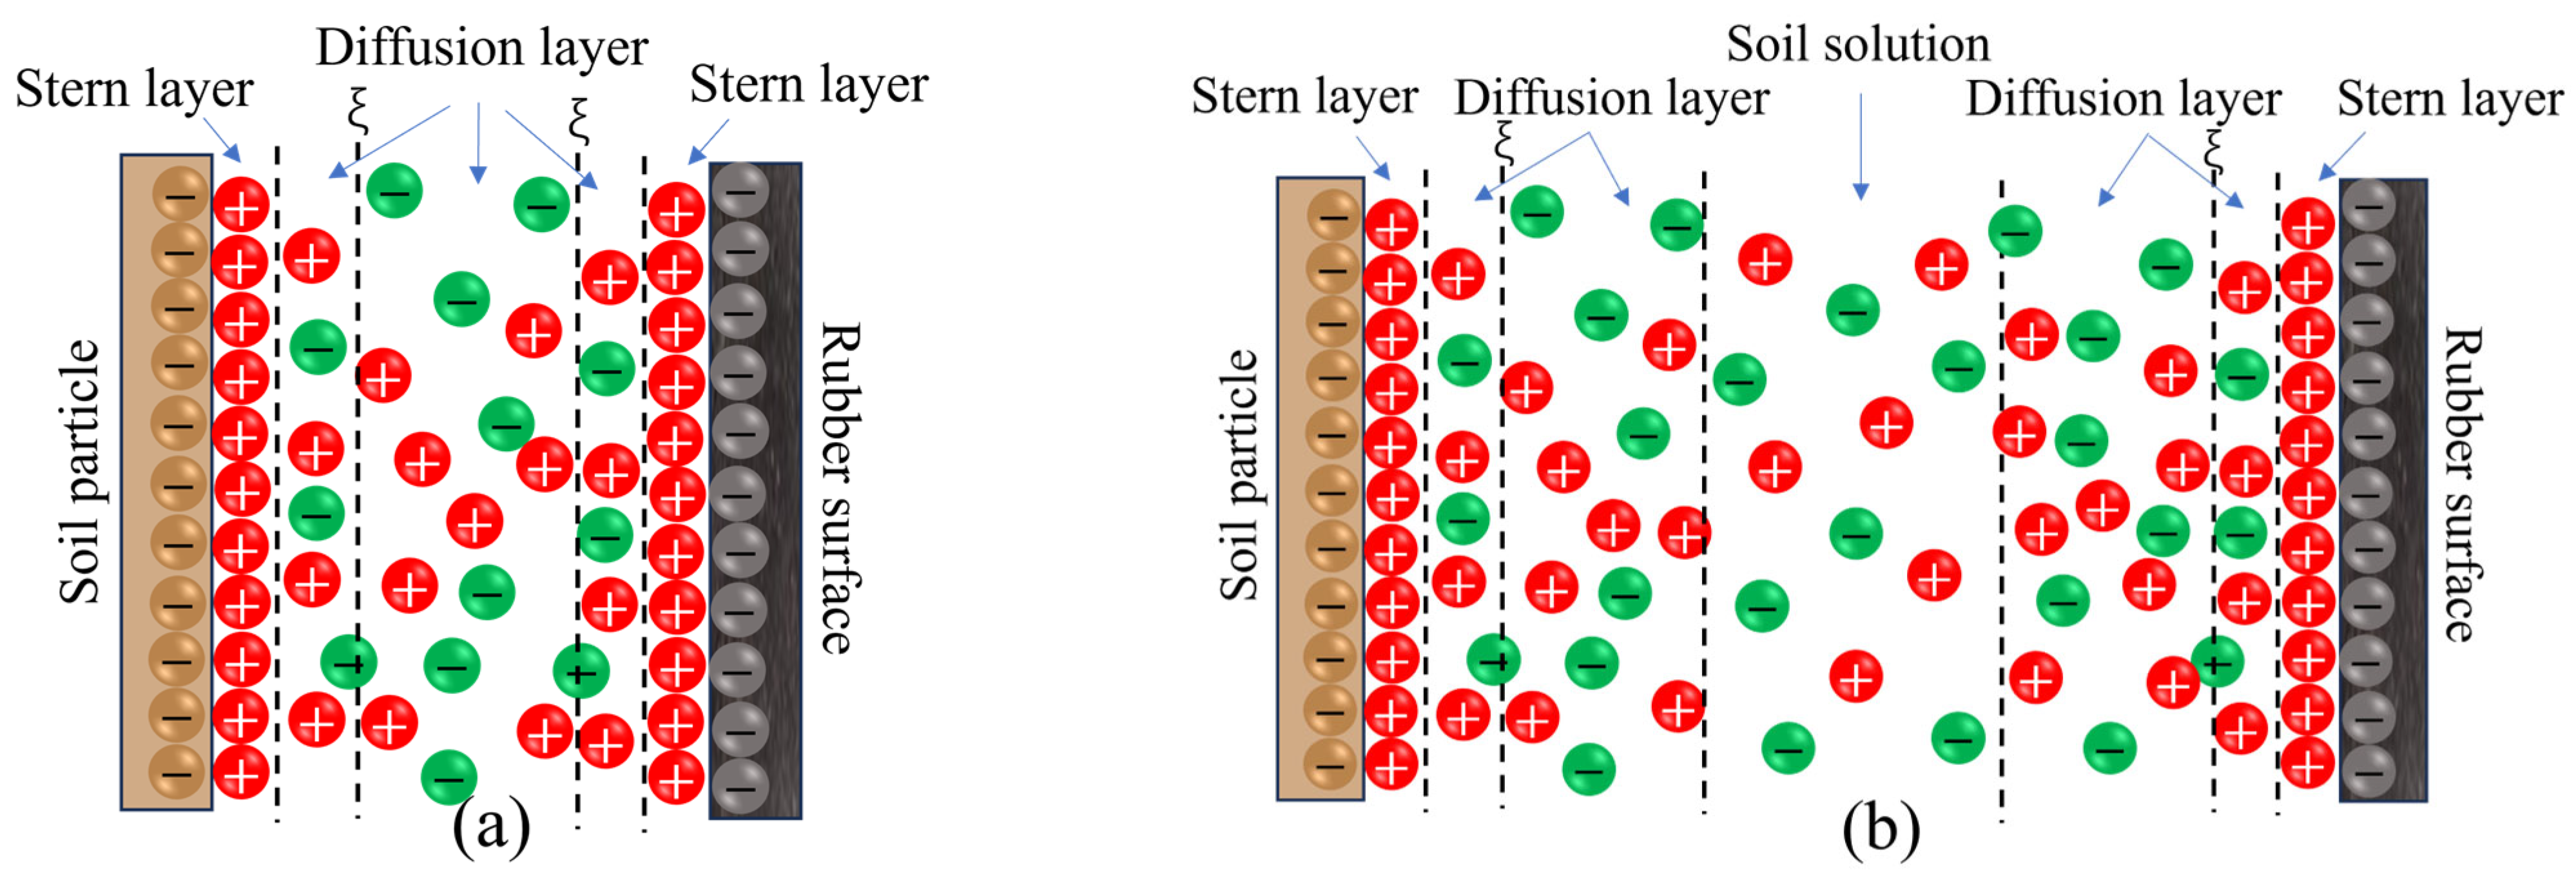
- The electrostatic attraction in the electric double layer was the main component of soil adhesion. The total area of the electric double layer will gradually increase, and the soil adhesion will increase. Near the liquid limit, the total area of the electric double layer reached the maximum, and the soil adhesion also increased to the peak. After the liquid limit, the soil adhesion force mainly acted via the intermolecular force in the soil solution, and the soil adhesion force gradually decreased.
Author Contributions
Funding
Institutional Review Board Statement
Informed Consent Statement
Data Availability Statement
Conflicts of Interest
References
- Pstrowska, K.; Gunka, V.; Sidun, I.; Demchuk, Y.; Vytrykush, N.; Kułażyński, M.; Bratychak, M. Adhesion in bitumen/aggregate system: Adhesion mechanism and test methods. Coatings 2022, 12, 1934. [Google Scholar] [CrossRef]
- Ren, L.; Chen, D.; Chen, B. A summary of study on soil adhesion. Trans. CSAE 1990, 6, 1–7. [Google Scholar]
- Xiong, Y. Composition and compounding of soil colloids. Chin. J. Soil Sci. 1979, 5, 1–8+28. [Google Scholar]
- Jia, X. Unsmooth cuticles of soil animals and theoretical analysis of their hydrophobicity and anti-soil-adhesion mechanism. J. Colloid Interface Sci. 2006, 295, 490–494. [Google Scholar] [CrossRef]
- Zumsteg, R.; Puzrin, A. Stickiness and adhesion of conditioned clay pastes. Tunn. Undergr. Space Technol. 2012, 31, 86–96. [Google Scholar] [CrossRef]
- Tokarz, S. Evaluation of the Sticking Potential of Clays to a Tunnel Boring Machine Cutterhead. Ph.D. Thesis, University of Colorado at Denver, Denver, CO, USA, 2014. [Google Scholar]
- Liu, P.; Wang, S.; Shi, Y.; Yang, J.; Fu, J.; Yang, F. Tangential adhesion strength between clay and steel for various soil softnesses. J. Mater. Civ. Eng. 2019, 31, 04019048.1–04019048.7. [Google Scholar] [CrossRef]
- Burbaum, U.; Sass, I. Physics of adhesion of soils to solid surfaces. Bull. Eng. Geol. Environ. 2017, 76, 1097–1105. [Google Scholar] [CrossRef]
- Feinendegen, M.; Ziegler, M.; Spagnoli, G.; Weh, M.; Stanjek, H. Interfacial processes between mineral and tool surfaces-the problem of clogging in mechanical tunnel driving with EPB-shields. Geotech. Sci. Rep. 2010, 16, 111–125. [Google Scholar]
- Liu, C.; Huang, L.; Xiao, Y.H.; Ma, T.L. Experimental study on the influence of soil moisture content and metal corrugated surface on the interfacial adhesion. J. For. Eng. 2021, 6, 161–165. [Google Scholar]
- Khabbazi Basmenj, A.; Mirjavan, A.; Ghafoori, M.; Cheshomi, A. Assessment of the adhesion potential of kaolinite and montmorillonite using a pull-out test device. Bull. Eng. Geol. Environ. 2017, 76, 1507–1519. [Google Scholar] [CrossRef]
- Nichols, M. The dynamic properties of soil. II. Soil and metal friction. Agric. Eng. 1931, 12, 321–324. [Google Scholar]
- Deng, R. Study on the Mechanism and Disposal Measures of Clay Clogging in TBM Cutter-Head. Master’s Thesis, Southwest Jiaotong University, Chengdu, China, 2018. [Google Scholar]
- Li, H.; Zhang, Z.; Zhai, J.; Yang, L.; Long, H. Correlation between soil structural parameters and soil adhesion based on water film theory. Coating 2022, 12, 1743. [Google Scholar] [CrossRef]
- Abbaspour-Gilandeh, Y.; Hasankhani-Ghavam, F.; Shahgoli, G.; Shrabian, V.R.; Abbaspour-Gilandeh, M. Investigation of the Effect of Soil Moisture Content, Contact Surface Material and Soil Texture on Soil Friction and Soil Adhesion Coefficients. ACTA Technol. Agric. 2018, 21, 44–50. [Google Scholar] [CrossRef]
- Hu, W.; Liu, D.; Fu, M.; Zhou, D.; Wu, B.; Yu, C. Design and DEM Analysis of Bionic Drag-reducing Slant Column Subsoilers. J. Agric. Eng. 2022, 12, 84–88. [Google Scholar]
- Myshkin, N.; Kovalev, A. Adhesion and surface forces in polymer tribology—A review. Friction 2018, 6, 143–155. [Google Scholar] [CrossRef]
- Zhang, J.; Sang, Z.; Gao, R. Study on the Adhesion and Frictional Properties of Solid Materials with Soil. J. Agric. Mech. 1986, 1, 35–43. [Google Scholar]
- Chen, Z.; Bezuijen, A.; Fang, Y.; Wang, K.; Deng, R. Experimental study and field validation on soil clogging of EPB shields in completely decomposed granite. Tunn. Undergr. Space Technol. 2022, 120, 104300. [Google Scholar] [CrossRef]
- Highway Research Institute; Ministry of Transport. Specifications for Highway Geotechnical Testing: JTG 3430-2020; People’s Transportation Publishing House: Beijing, China, 2020. [Google Scholar]
- Qian, D. Study on the adhesion characteristics of traditional plough wall material-white cast iron to heavy clay. Trans. Chin. Soc. Agric. Mach. 1965, 2, 145–150. [Google Scholar]
- Liu, H.; Sun, D.; Hao, J. New Colloid and Interface Chemistry. Chin. J. Anal. Chem. 2016, 44, 1807. [Google Scholar]
- Li, X. Soil Chemistry; Higher Education Press: Beijing, China, 2001. [Google Scholar]
- Wan, H.; Zhan, Z. Physical Chemistry; Higher Education Press: Beijing, China, 2010. [Google Scholar]
- Shao, M.; Wang, Q.; Huang, M. Soil Physics; Higher Education Press: Beijing, China, 2006. [Google Scholar]
- Li, G. Advanced Soil Mechanics; Tsinghua University Press: Beijing, China, 2016. [Google Scholar]
- Qian, J.; Yin, Z. Principle and Calculation of Soil; China Water & Power Press: Beijing, China, 1996. [Google Scholar]
- Li, G.; Zhang, B.; Yu, Y. Soil Mechanics, 2nd ed.; Tsinghua University Press: Beijing, China, 2013. [Google Scholar]
- Li, Y. Study on Bound Water Characteristics and Water Migration of Unsaturated Loess. Ph.D. Thesis, Xi’an University of Architecture and Technology, Xi’an, China, 2015. [Google Scholar]
- Chen, Y.; Zuo, Q.; Huang, P. AFM experimental study on the interaction force between electric double layers. Lubr. Eng. 2013, 38, 57–63. [Google Scholar]
- Ren, L. Soil Adhesion Mechanics; Mechanical Industry Press: Beijing, China, 2011. [Google Scholar]
- Fountaine, E.R. Investigations into the mechanism of soil adhesion. Eur. J. Soil Sci. 1954, 5, 251–263. [Google Scholar] [CrossRef]
- Cong, Q.; Ren, L.; Chen, B. Chemical Adsorption Analysis of Soil Adhesion. Trans. Chin. Soc. Agric. Eng. 1996, 3, 20–24. [Google Scholar]
- Fang, Y.; Wang, Y.; Wang, K.; Qian, J.; Chen, Z. Study on risk assessment method of shield blockage based on interfacial adhesion. Chin. J. Geotech. Eng. 2023, 45, 1813–1821. [Google Scholar]


| Serial Number | Soil Type | Area | Soil Clay Content (%) | Liquid Limit (%) | Plastic Limit (%) | Plasticity Index |
|---|---|---|---|---|---|---|
| I | Silt | Lanshan, Lanzhou City | 15.87 | 29.04 | 19.61 | 9.43 |
| II | Silty clay | Huli Mountain, Greater Khingan Range | 31.81 | 35.37 | 25.21 | 10.16 |
| III | Silty clay | Tahe County, Greater Hinggan Mountains | 35.56 | 35.79 | 18.87 | 16.92 |
| IV | Silty clay | Harbin | 36.79 | 36.95 | 24.33 | 12.62 |
| V | Clay | Beilu River in Qinghai Tibet Plateau | 45.16 | 38.41 | 20.19 | 18.22 |
| VI | Clay | Genhe City | 49.52 | 41.48 | 22.58 | 18.9 |
| Type I soil | ||||||
| Water content (%) | 19.63 | 24.31 | 27.21 | 28.65 | 30.05 | 34.05 |
| Adobe Photoshop pre-processing |  |  |  |  |  |  |
| Image-Pro Plus scanning analysis |  |  |  |  |  |  |
| Type II soil | ||||||
| Water content (%) | 19.03 | 26.93 | 30.25 | 33.12 | 35.24 | 37.61 |
| Adobe Photoshop pre-processing |  |  |  |  |  |  |
| Image-Pro Plus scanning analysis |  |  |  |  |  |  |
| Type III soil | ||||||
| Water content (%) | 19.9 | 23.28 | 26.41 | 31.19 | 36.33 | 38.1 |
| Adobe Photoshop pre-processing |  |  |  |  |  |  |
| Image-Pro Plus scanning analysis |  |  |  |  |  |  |
| Type IV soil | ||||||
| Water content (%) | 19.45 | 27.18 | 31.85 | 35.56 | 37.56 | 39.51 |
| Adobe Photoshop pre-processing |  |  |  |  |  |  |
| Image-Pro Plus scanning analysis |  |  |  |  |  |  |
| Type V soil | ||||||
| Water content (%) | 19.34 | 25.49 | 30.27 | 35.15 | 38.25 | 40.12 |
| Adobe Photoshop pre-processing |  |  |  |  |  |  |
| Image-Pro Plus scanning analysis |  |  | 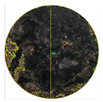 |  |  |  |
| Type VI soil | ||||||
| Water content (%) | 19.43 | 30.27 | 34.16 | 36.17 | 40.69 | 41.78 |
| Adobe Photoshop pre-processing |  |  |  |  |  |  |
| Image-Pro Plus scanning analysis | 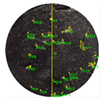 |  |  |  |  |  |
Disclaimer/Publisher’s Note: The statements, opinions and data contained in all publications are solely those of the individual author(s) and contributor(s) and not of MDPI and/or the editor(s). MDPI and/or the editor(s) disclaim responsibility for any injury to people or property resulting from any ideas, methods, instructions or products referred to in the content. |
© 2025 by the authors. Licensee MDPI, Basel, Switzerland. This article is an open access article distributed under the terms and conditions of the Creative Commons Attribution (CC BY) license (https://creativecommons.org/licenses/by/4.0/).
Share and Cite
Yuan, M.; Zhang, Z.; Li, H.; Wang, Z.; Jin, D. Study on Adhesion Characteristics of Rubber–Soil Interface Based on Electric Double-Layer and Water Film Theories. Coatings 2025, 15, 375. https://doi.org/10.3390/coatings15040375
Yuan M, Zhang Z, Li H, Wang Z, Jin D. Study on Adhesion Characteristics of Rubber–Soil Interface Based on Electric Double-Layer and Water Film Theories. Coatings. 2025; 15(4):375. https://doi.org/10.3390/coatings15040375
Chicago/Turabian StyleYuan, Mingyang, Ze Zhang, Hang Li, Zhiyuan Wang, and Doudou Jin. 2025. "Study on Adhesion Characteristics of Rubber–Soil Interface Based on Electric Double-Layer and Water Film Theories" Coatings 15, no. 4: 375. https://doi.org/10.3390/coatings15040375
APA StyleYuan, M., Zhang, Z., Li, H., Wang, Z., & Jin, D. (2025). Study on Adhesion Characteristics of Rubber–Soil Interface Based on Electric Double-Layer and Water Film Theories. Coatings, 15(4), 375. https://doi.org/10.3390/coatings15040375