
Experimental Study Regarding the Synthesis of Iron Oxide Nanoparticles by Laser Pyrolysis Using Ethanol as Sensitizer; Morpho-Structural Alterations Using Thermal Treatments on the Synthesized Nanoparticles

 ,
,  , ,
, ,  and
and 
Abstract
1. Introduction
2. Materials and Methods
3. Results and Discussion
4. Conclusions
Supplementary Materials
Author Contributions
Funding
Institutional Review Board Statement
Informed Consent Statement
Data Availability Statement
Conflicts of Interest
Abbreviations
| NPs | Nanoparticles |
| TEM | Transmission electron microscopy |
| L-dopa | L-3,4-dihydroxyphenylalanine |
| CMCNa | Sodium carboxymethyl cellulose |
| DLS | Dynamic light scattering |
| XPS | X-ray photoelectron spectroscopy |
| XRD | X-ray diffraction analysis |
| TGA | Thermogravimetric analysis |
| DSC | Differential scanning calorimetry |
| EDS | Specific elemental composition |
| Sccm | Standard cubic centimeter per minute |
References
- Materón, E.M.; Miyazaki, C.M.; Carr, O.; Joshi, N.; Picciani, P.H.; Dalmaschio, C.J.; Davis, F.; Shimizu, F.M. Magnetic nanoparticles in biomedical applications: A review. Appl. Surf. Sci. Adv. 2021, 6, 100163. [Google Scholar] [CrossRef]
- Meng, Y.Q.; Shi, Y.N.; Zhu, Y.P.; Liu, Y.Q.; Gu, L.W.; Liu, D.D.; Ma, A.; Xia, F.; Guo, Q.Y.; Xu, C.C.; et al. Recent trends in preparation and biomedical applications of iron oxide nanoparticles. J. Nanobiotechnol. 2024, 22, 24. [Google Scholar] [CrossRef]
- Rajan, A.; Sahu, N.K. Review on magnetic nanoparticle-mediated hyperthermia for cancer therapy. J. Nanoparticle Res. 2020, 22, 319. [Google Scholar] [CrossRef]
- Múzquiz-Ramos, E.M.; Guerrero-Chávez, V.; Macías-Martínez, B.I.; López-Badillo, C.M.; García-Cerda, L.A. Synthesis and characterization of maghemite nanoparticles for hyperthermia applications. Ceram. Int. 2015, 41, 397–402. [Google Scholar] [CrossRef]
- Marcus, M.; Karni, M.; Baranes, K.; Levy, I.; Alon, N.; Margel, S.; Shefi, O. Iron oxide nanoparticles for neuronal cell applications: Uptake study and magnetic manipulations. J. Nanobiotechnol. 2016, 14, 37. [Google Scholar] [CrossRef] [PubMed]
- Sensenig, R.; Sapir, Y.; MacDonald, C.; Cohen, S.; Polyak, B. Magnetic nanoparticle-based approaches to locally target therapy and enhance tissue regeneration in vivo. Nanomedicine 2012, 7, 1425–1442. [Google Scholar] [CrossRef] [PubMed]
- Janik-Olchawa, N.; Dróżdż, A.; Ryszawy, D.; Pudełek, M.; Olbrich, K.; Setkowicz, Z.; Sniegocki, M.; Wytrwał, M.; Gajewska, M.; Chwiej, J. The influence of IONPs core size on their biocompatibility and activity in in vitro cellular models. Sci. Rep. 2021, 11, 21808. [Google Scholar] [CrossRef] [PubMed]
- Hanini, A.; Schmitt, A.; Kacem, K.; Chau, F.; Ammar, S.; Gavard, J. Evaluation of iron oxide nanoparticle biocompatibility. Int. J. Nanomed. 2011, 6, 787–794. [Google Scholar] [CrossRef]
- Rueda-Gensini, L.; Cifuentes, J.; Castellanos, M.C.; Puentes, P.R.; Serna, J.A.; Muñoz-Camargo, C.; Cruz, J.C. Tailoring Iron Oxide Nanoparticles for Efficient Cellular Internalization and Endosomal Escape. Nanomaterials 2020, 10, 1816. [Google Scholar] [CrossRef]
- Schwan, J.; Markert, S.; Rosenfeldt, S.; Schüler, D.; Mickoleit, F.; Schenk, A.S. Comparing the Colloidal Stabilities of Commercial and Biogenic Iron Oxide Nanoparticles That Have Potential In Vitro/In Vivo Applications. Molecules 2023, 28, 4895. [Google Scholar] [CrossRef]
- Aires, A.; Cabrera, D.; Alonso-Pardo, L.; Cortajarena, A.; Teran, F. Elucidation of the Physicochemical Properties Ruling the Colloidal Stability of Iron Oxide Nanoparticles under Physiological Conditions. ChemNanoMat 2017, 3, 183. [Google Scholar] [CrossRef]
- Morjan, I.; Alexandrescu, R.; Dumitrache, F.; Birjega, R.; Fleaca, C.; Soare, I.; Luculescu, C.; Filoti, G.; Kuncser, V.; Vekas, L.; et al. Iron Oxide-Based Nanoparticles with Different Mean Sizes Obtained by the Laser Pyrolysis: Structural and Magnetic Properties. J. Nanosci. Nanotechnol. 2010, 10, 1223–1234. [Google Scholar] [CrossRef]
- Liu, Y.L.; Chen, D.; Shang, P.; Yin, D.C. A review of magnet systems for targeted drug delivery. J. Control. Release Off. J. Control. Release Soc. 2019, 302, 90–104. [Google Scholar] [CrossRef] [PubMed]
- Kianfar, E. Magnetic Nanoparticles in Targeted Drug Delivery: A Review. J. Supercond. Nov. Magn. 2021, 34, 1709–1735. [Google Scholar] [CrossRef]
- Setia, A.; Mehata, A.; Sharma, V.; Malik, A.; Viswanadh, M.; Muthu, M.S. Theranostic magnetic nanoparticles: Synthesis, properties, toxicity, and emerging trends for biomedical applications. J. Drug Deliv. Sci. Technol. 2023, 81, 104295. [Google Scholar] [CrossRef]
- Ansari, M.O.; Ahmad, M.F.; Shadab, G.G.H.A.; Siddique, H.R. Superparamagnetic iron oxide nanoparticles based cancer theranostics: A double edge sword to fight against cancer. J. Drug Deliv. Sci. Technol. 2018, 45, 177–183. [Google Scholar] [CrossRef]
- Dadfar, S.M.; Roemhild, K.; Drude, N.I.; von Stillfried, S.; Knüchel, R.; Kiessling, F.; Lammers, T. Iron oxide nanoparticles: Diagnostic, therapeutic and theranostic applications. Adv. Drug Deliv. Rev. 2019, 138, 302–325. [Google Scholar] [CrossRef] [PubMed]
- Colombo, M.; Carregal-Romero, S.; Casula, M.F.; Gutiérrez, L.; Morales, M.P.; Böhm, I.B.; Heverhagen, J.T.; Prosperi, D.; Parak, W.J. Biological applications of magnetic nanoparticles. Chem. Soc. Rev. 2012, 41, 4306–4334. [Google Scholar] [CrossRef] [PubMed]
- Jat, S.K.; Gandhi, H.A.; Bhattacharya, J.; Sharma, M.K. Magnetic nanoparticles: An emerging nano-based tool to fight against viral infections. Mater. Adv. 2021, 2, 4479–4496. [Google Scholar] [CrossRef]
- Keshta, B.E.; Gemeay, A.H.; Kumar Sinha, D.; Elsharkawy, S.; Hassan, F.; Rai, N.; Arora, C. State of the art on the magnetic iron oxide Nanoparticles: Synthesis, Functionalization, and applications in wastewater treatment. Results Chem. 2024, 7, 101388. [Google Scholar] [CrossRef]
- Sukoviene, A.; Ali, S.; Jagminas, A.; Ramanavicius, S. Magnetic Cobalt and Other Types of Ferrite Nanoparticles: Synthesis Aspects and Novel Strategies for Application in Wastewater Treatment (Review). Appl. Sci. 2025, 15, 857. [Google Scholar] [CrossRef]
- Ali, A.; Shah, T.; Ullah, R.; Zhou, P.; Guo, M.; Ovais, M.; Tan, Z.; Rui, Y. Review on Recent Progress in Magnetic Nanoparticles: Synthesis, Characterization, and Diverse Applications. Front. Chem. 2021, 9, 629054. [Google Scholar] [CrossRef] [PubMed]
- Spreafico, C.; Russo, D.; Degl’Innocenti, R. Laser pyrolysis in papers and patents. J. Intell. Manuf. 2022, 33, 353–385. [Google Scholar] [CrossRef]
- Poterat, D. Synthesis of Nanoparticles by Laser Pyrolysis. U.S. Patent US 8,097,233 B2, 17 January 2012. [Google Scholar]
- Dumitrache, F.; Morjan, I.; Fleaca, C.; Badoi, A.; Manda, G.; Pop, S.; Marta, D.S.; Huminic, G.; Huminic, A.; Vekas, L.; et al. Highly magnetic Fe2O3 nanoparticles synthesized by laser pyrolysis used for biological and heat transfer applications. Appl. Surf. Sci. 2015, 336, 297–303. [Google Scholar] [CrossRef]
- Patterson, A.L. The Scherrer Formula for X-Ray Particle Size Determination. Phys. Rev. 1939, 56, 978–982. [Google Scholar] [CrossRef]
- Mendiburu, A.Z.; Lauermann, C.H.; Hayashi, T.C.; Mariños, D.J.; Rodrigues da Costa, R.B.; Coronado, C.J.R.; Roberts, J.J.; de Carvalho, J.A. Ethanol as a renewable biofuel: Combustion characteristics and application in engines. Energy 2022, 257, 124688. [Google Scholar] [CrossRef]
- Kumar, A. Ethanol Decomposition and Dehydrogenation for Hydrogen Production: A Review of Heterogeneous Catalysts. Ind. Eng. Chem. Res. 2021, 60, 16561–16576. [Google Scholar] [CrossRef]
- Park, J.; Zhu, R.; Lin, M. Thermal decomposition of ethanol. I. Ab Initio molecular orbital/Rice–Ramsperger–Kassel–Marcus prediction of rate constant and product branching ratios. J. Chem. Phys. 2002, 117, 3224–3231. [Google Scholar] [CrossRef]
- Tanzawa, T.; Gardiner, W.C. Thermal decomposition of ethylene. Combust. Flame 1980, 39, 241–253. [Google Scholar] [CrossRef]
- Grau-Crespo, R.; Al-Baitai, A.Y.; Saadoune, I.; De Leeuw, N.H. Vacancy ordering and electronic structure of γ-Fe2O3 (maghemite): A theoretical investigation. J. Phys. 2010, 22, 255401. [Google Scholar] [CrossRef]
- McIntyre, N.S.; Zetaruk, D.G. X-ray photoelectron spectroscopic studies of iron oxides. Anal. Chem. 1977, 49, 1521–1529. [Google Scholar] [CrossRef]
- Grosvenor, A.P.; Kobe, B.A.; Biesinger, M.; McIntyre, N. Investigation of Multiplet Splitting of Fe 2p XPS Spectra and Bonding in Iron Compounds. Surf. Interface Anal. 2004, 36, 1564–1574. [Google Scholar] [CrossRef]
- Biesinger, M.C.; Lau, L.W.M.; Gerson, A.R.; Smart, R.S.C. Resolving surface chemical states in XPS analysis of first row transition metals, oxides and hydroxides: Sc, Ti, V, Cu and Zn. Appl. Surf. Sci. 2010, 257, 887–898. [Google Scholar] [CrossRef]
- Radu, T.; Cristian, I.; Benea, D.; Turcu, R. X-Ray Photoelectron Spectroscopic Characterization of Iron Oxide Nanoparticles. Appl. Surf. Sci. 2017, 405, 337–343. [Google Scholar] [CrossRef]
- Alexandrescu, R.; Bello, V.; Bouzas, V.; Costo, R.; Dumitrache, F.; García, M.A.; Giorgi, R.; Morales, M.P.; Morjan, I.; Serna, C.J.; et al. Iron Oxide Materials Produced by Laser Pyrolysis. AIP Conf. Proc. 2010, 1275, 22–25. [Google Scholar] [CrossRef]
- Batlle, X.; Moya, C.; Escoda-Torroella, M.; Iglesias, Ò.; Fraile Rodríguez, A.; Labarta, A. Magnetic nanoparticles: From the nanostructure to the physical properties. J. Magn. Magn. Mater. 2022, 543, 168594. [Google Scholar] [CrossRef]
- Danaei, M.; Dehghankhold, M.; Ataei, S.; Hasanzadeh Davarani, F.; Javanmard, R.; Dokhani, A.; Khorasani, S.; Mozafari, M.R. Impact of Particle Size and Polydispersity Index on the Clinical Applications of Lipidic Nanocarrier Systems. Pharmaceutics 2018, 10, 57. [Google Scholar] [CrossRef]
- Nobbmann, U. What Does It Mean for DLS and Chromatography. 2014. Available online: https://www.malvernpanalytical.com/en/learn/knowledge-center/insights/polydispersity-what-does-it-mean-for-dls-and-chromatography (accessed on 7 December 2023).
- Kelesidis, G.A.; Pratsinis, S.E. A perspective on gas-phase synthesis of nanomaterials: Process design, impact and outlook. Chem. Eng. J. 2021, 421, 129884. [Google Scholar] [CrossRef]
- Vikash; Kumar, V. Ultrasonic-assisted de-agglomeration and power draw characterization of silica nanoparticles. Ultrason. Sonochem. 2020, 65, 105061. [Google Scholar] [CrossRef] [PubMed]
- Panariti, A.; Lettiero, B.; Alexandrescu, R.; Collini, M.; Sironi, L.; Chanana, M.; Ion, M.; Wang, D.; Chirico, G.; Miserocchi, G.; et al. Dynamic Investigation of Interaction of Biocompatible Iron Oxide Nanoparticles with Epithelial Cells for Biomedical Applications. J. Biomed. Nanotechnol. 2013, 9, 1556–1569. [Google Scholar] [CrossRef] [PubMed]
- Bautista, M.; Bomatí-Miguel, O.; Morales, M.d.P.; Serna, C.; Veintemillas-Verdaguer, S. Surface characterisation of dextran-coated iron oxide nanoparticles prepared by laser pyrolysis and coprecipitation. J. Magn. Magn. Mater. 2005, 293, 20–27. [Google Scholar] [CrossRef]
- Veintemillas-Verdaguer, S.; Morales, M.P.; Serna, C.J. Continuous production of γ-Fe2O3 ultrafine powders by laser pyrolysis. Mater. Lett. 1998, 35, 227–231. [Google Scholar] [CrossRef]
- Veintemillas-Verdaguer, S.; Morales, M.P.; Serna, C.J. Effect of the oxidation conditions on the maghemites produced by laser pyrolysis. Appl. Organomet. Chem. 2001, 15, 365–372. [Google Scholar] [CrossRef]
- Veintemillas-Verdaguer, S.; Bomatí-Miguel, O.; Morales, M.P. Effect of the process conditions on the structural and magnetic properties of γ-Fe2O3 nanoparticles produced by laser pyrolysis. Scr. Mater. 2002, 47, 589–593. [Google Scholar] [CrossRef]
- Morales, M.d.P.; Bomatí-Miguel, O.; Alejo, R.; Ruiz-Cabello, J.; Veintemillas-Verdaguer, S.; O’Grady, K. Contrast agents for MRI based on iron oxide nanoparticles prepared by laser pyrolysis. J. Magn. Magn. Mater. 2003, 266, 102–109. [Google Scholar] [CrossRef]
- Marcu, A.; Pop, S.; Dumitrache, F.; Mocanu, M.; Niculite, C.M.; Gherghiceanu, M.; Lungu, C.P.; Fleaca, C.; Ianchis, R.; Barbut, A.; et al. Magnetic iron oxide nanoparticles as drug delivery system in breast cancer. Appl. Surf. Sci. 2013, 281, 60–65. [Google Scholar] [CrossRef]
- Mejías, R.; Costo, R.; Roca, A.G.; Arias, C.F.; Veintemillas-Verdaguer, S.; González-Carreño, T.; del Puerto Morales, M.; Serna, C.J.; Mañes, S.; Barber, D.F. Cytokine adsorption/release on uniform magnetic nanoparticles for localized drug delivery. J. Control. Release Off. J. Control. Release Soc. 2008, 130, 168–174. [Google Scholar] [CrossRef]
- Lungu, I.I.; Andronescu, E.; Dumitrache, F.; Gavrila-Florescu, L.; Banici, A.M.; Morjan, I.; Criveanu, A.; Prodan, G. Laser Pyrolysis of Iron Oxide Nanoparticles and the Influence of Laser Power. Molecules 2023, 28, 7284. [Google Scholar] [CrossRef]
- Criveanu, A.; Dumitrache, F.; Fleaca, C.; Gavrila-Florescu, L.; Lungu, I.; Morjan, I.P.; Socoliuc, V.; Prodan, G. Chitosan-coated iron oxide nanoparticles obtained by laser pyrolysis. Appl. Surf. Sci. Adv. 2023, 15, 100405. [Google Scholar] [CrossRef]


| Sample | D-Ar Dilution | D-Ar Through Ethanol | D-Ethanol | Laser Power Ar/Gas Mixture | Flame Temperature |
|---|---|---|---|---|---|
| [sccm] | [sccm] | [sccm] | [W]/[W] | [°C] | |
| NP1 | 0 | 50 | 17.2 | 66/64 | 607 |
| NP2 | 25 | 25 | 8.6 | 66/65 | 588 |
| NP3 | 37.5 | 12.5 | 4.3 | 66/65 | 510 |
| NP4 | 40 | 10 | 3.4 | 66/65 | 500 |
| NP6 | 42 | 8 | 2.7 | 67/65 | 500 |
| NP7 | 30 | 20 | 6.9 | 66/64 | 550 |
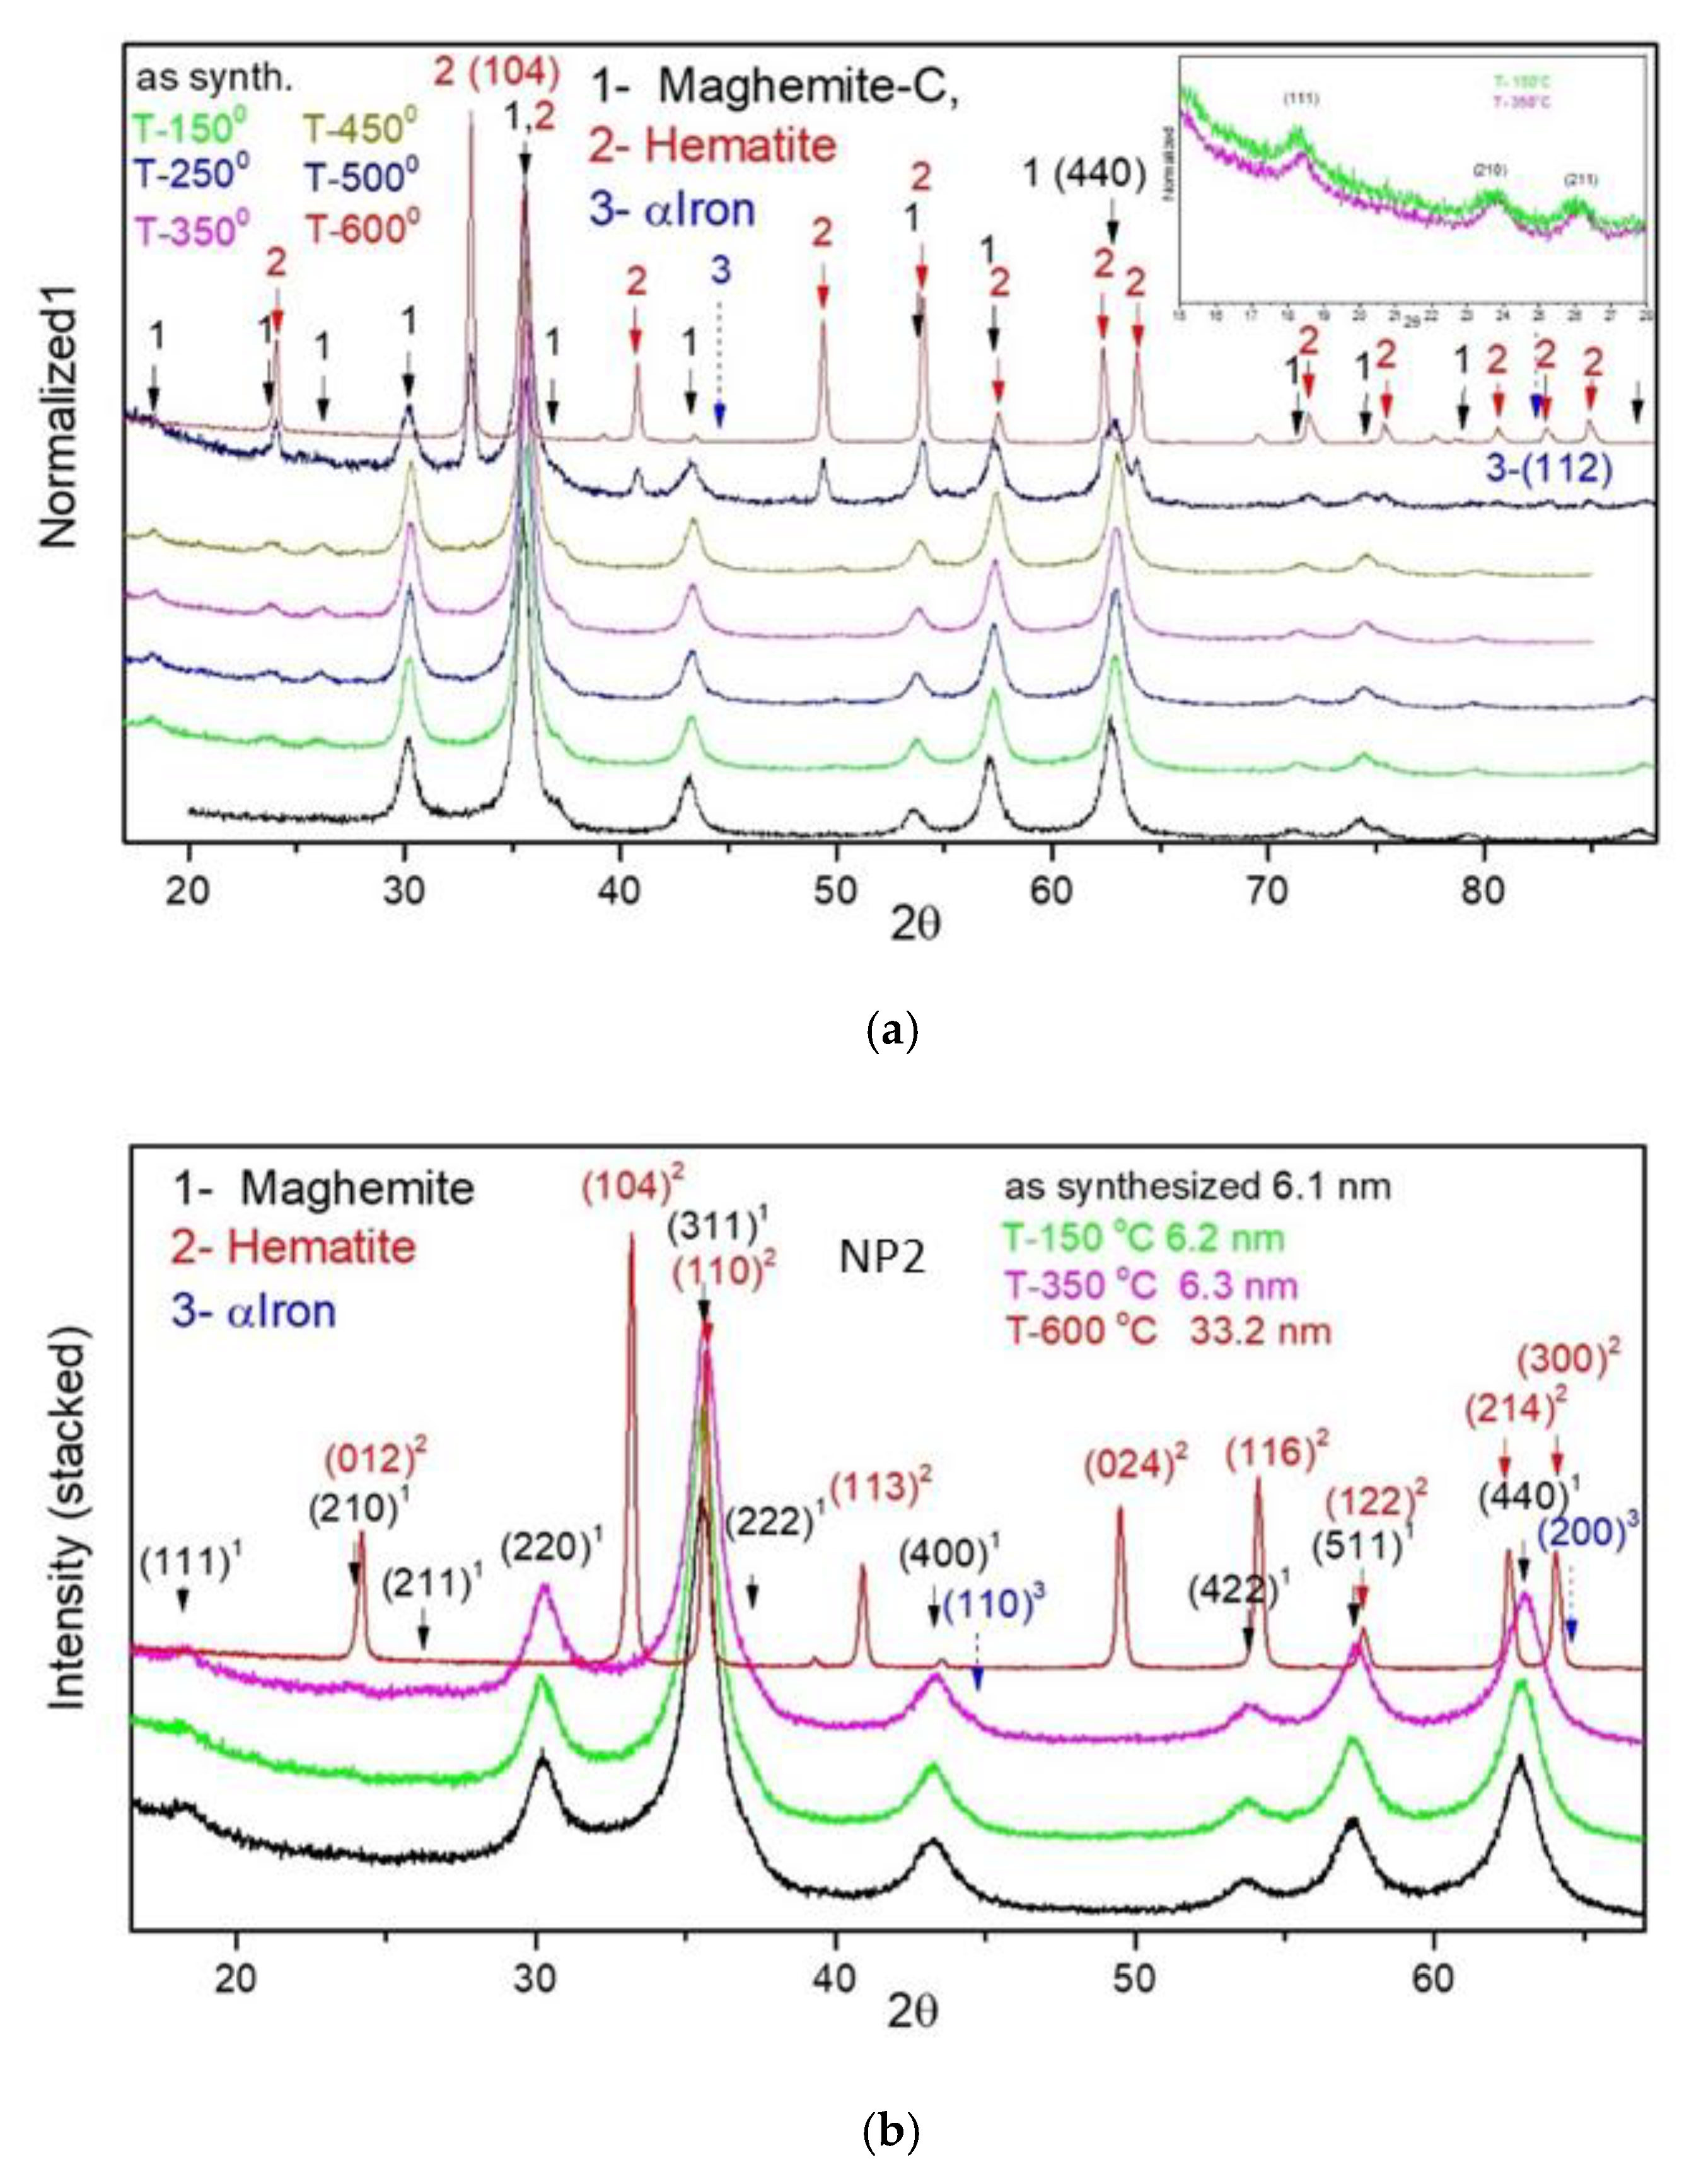
| Sample | γ-Fe2O3-Fe3O4 | α-Fe2O3 | |||
|---|---|---|---|---|---|
| 2θ-440 [o] | a [Å] | Dmean [nm] | 2θ-104 [o] | Dmean [nm] | |
| NP1 as syn | 62.74 | 8.377 | 9.9 | - | - |
| NP1-150 °C | 62.90 | 8.358 | 10.2 | - | - |
| NP1-250 °C | 62.92 | 8.356 | 10.4 | - | - |
| NP1-350 °C | 62.95 | 8.352 | 10.3 | - | - |
| NP1-450 °C | 63.02 | 8.344 | 11.0 | ||
| NP1-500 °C | 62.81 | 8.369 | 7.8 | 33.06 | 22.5 |
| NP1-600 °C | - | - | - | 33.08 | 33.3 |
| NP2 as syn | 62.84 | 8.365 | 5.6 | - | - |
| NP2-150 °C | 62.88 | 8.360 | 6.2 | - | - |
| NP2-350 °C | 62.97 | 8.350 | 6.3 | - | - |
| NP2-600 °C | - | - | - | 33.19 | 33.2 |
| NP6 as syn | 62.82 | 8.368 | 3.0 | ||
| NP6-150 °C | 63.07 | 8.337 | 3.0 | ||
| NP6-350 °C | 62.93 | 8.354 | 3.2 | - | - |
| NP6-450 °C | 43.51 | 8.319 | 3.5 | 33.09 | 20.8 |
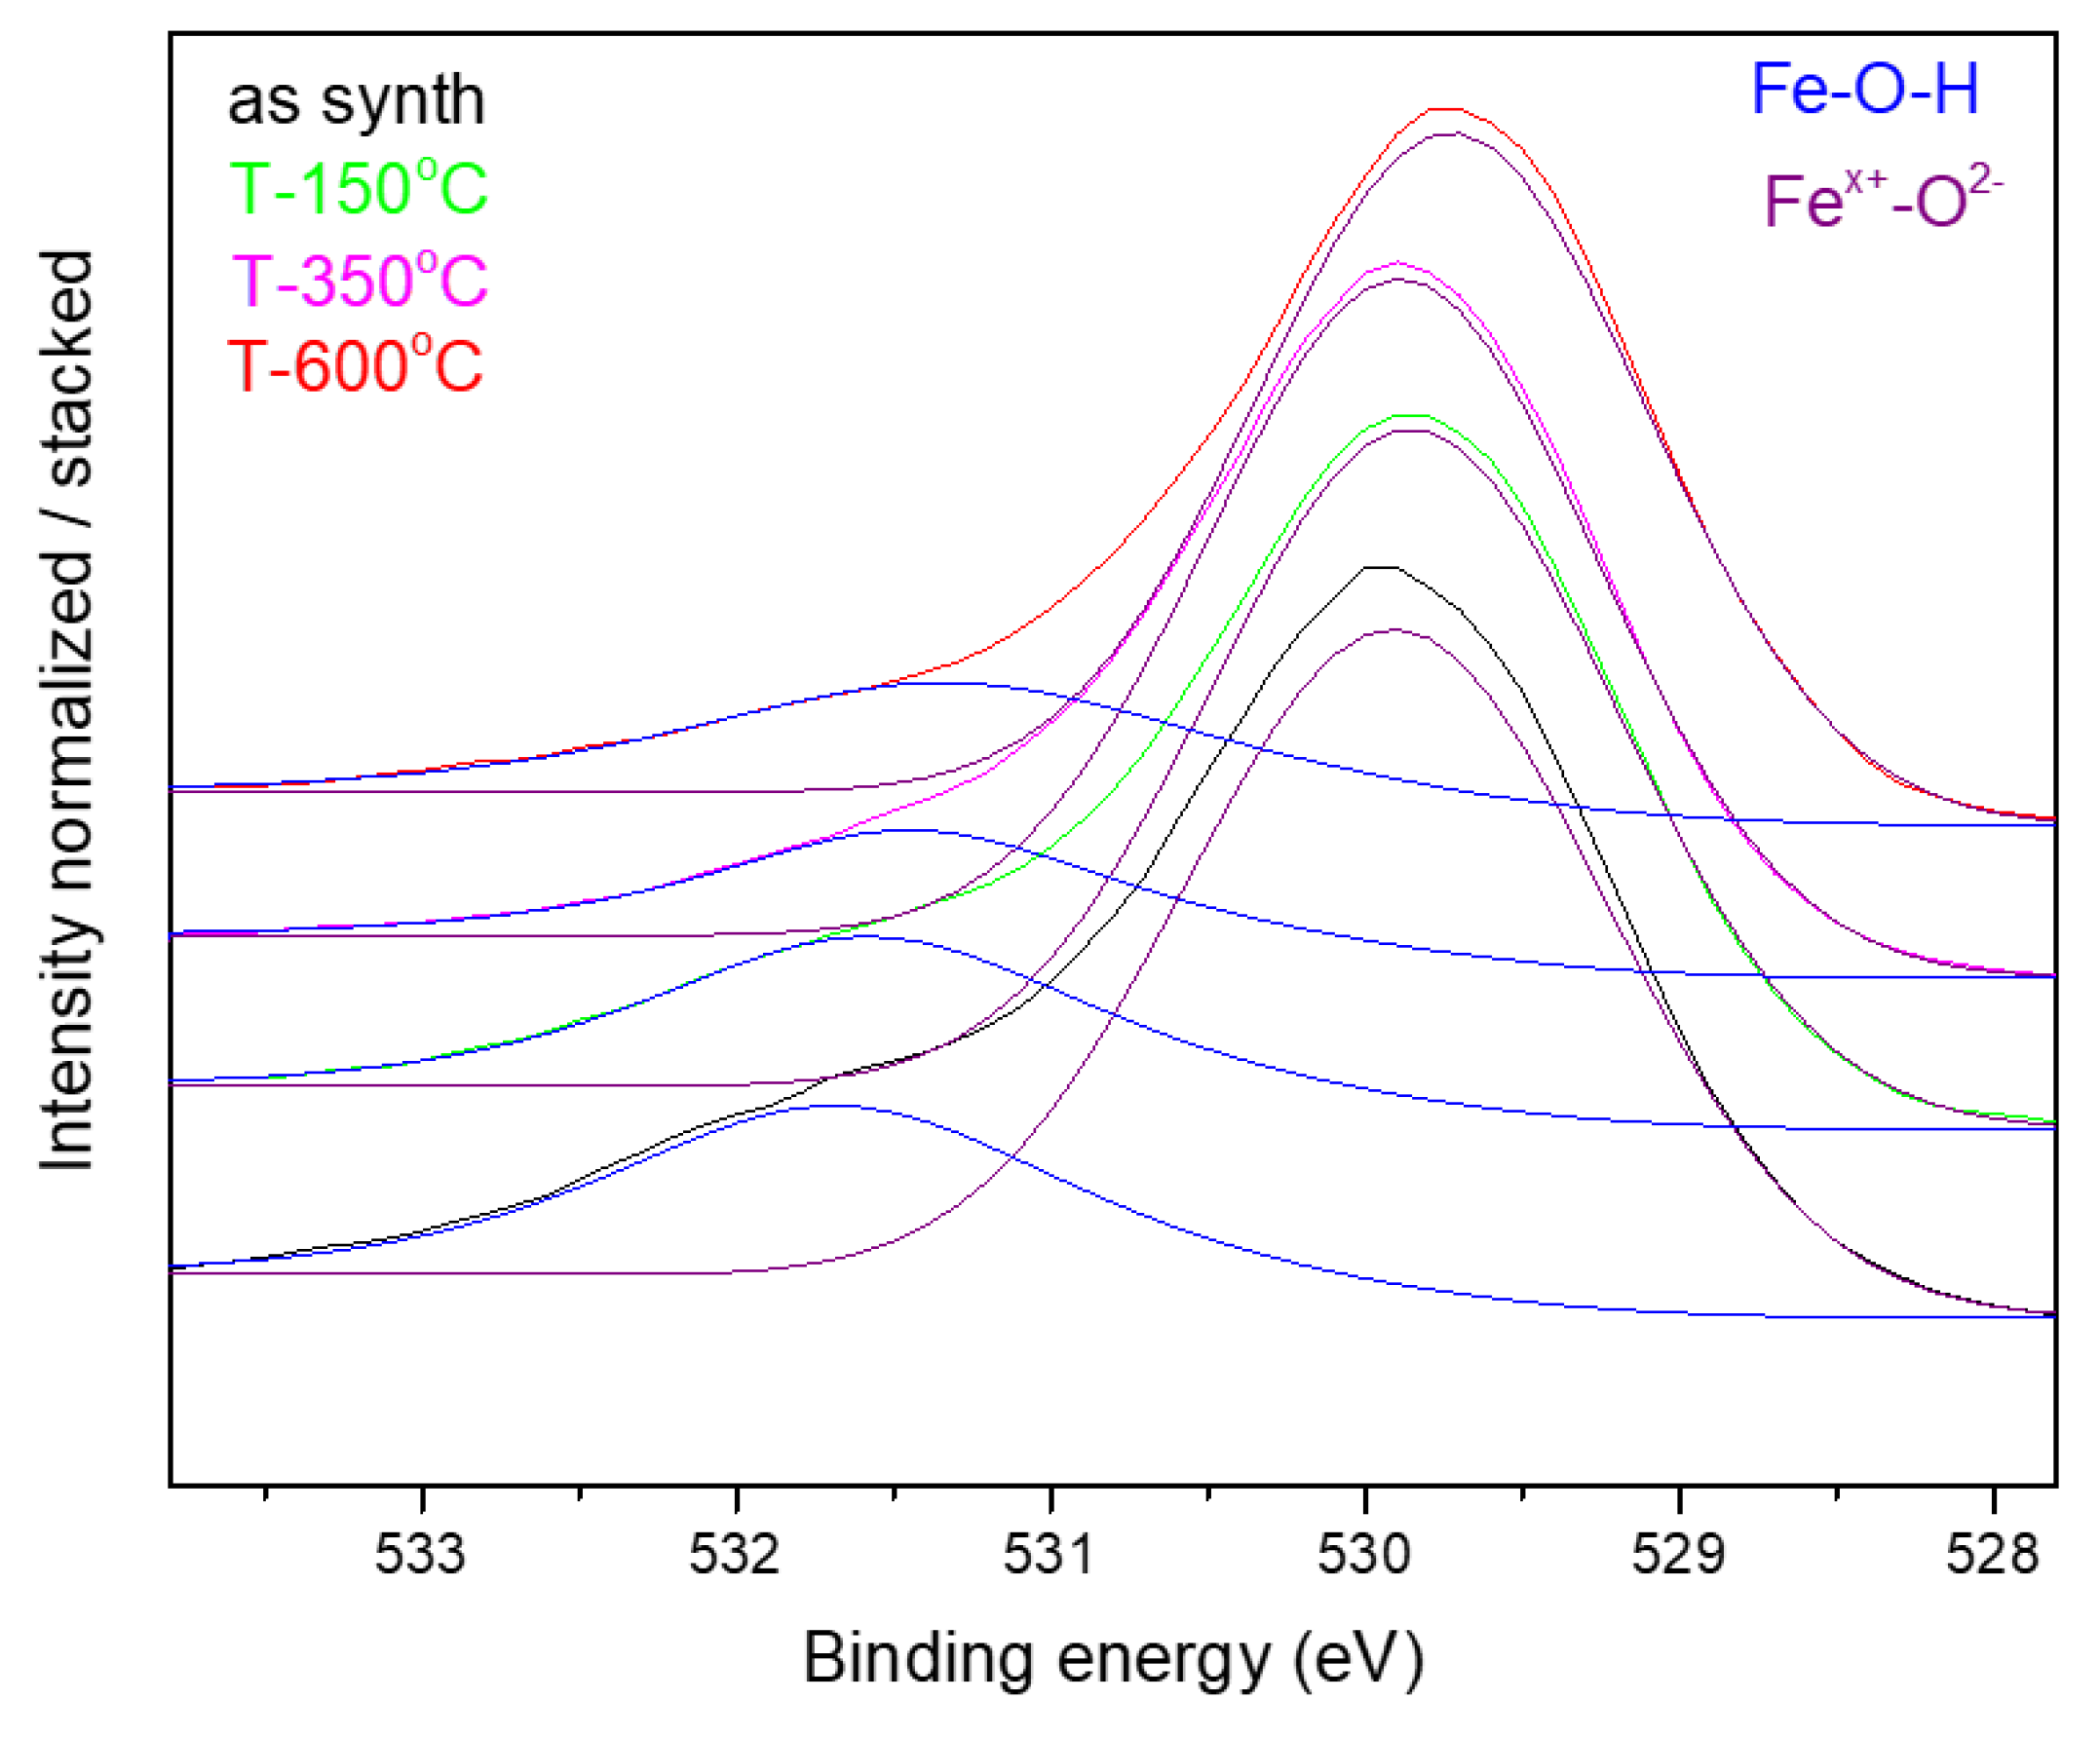
| Sample | Fe (at.%) | C (at.%) | O (at.%) | Fe-O (at.O%) /Peak Energy (eV) | Fe-OH + C-O (at.O%)/Peack Energy (eV) |
|---|---|---|---|---|---|
| NP1 | 29.15 | 22.58 | 48.27 | 73.1/530.0 | 26.9/531.6 |
| NP1 T-350 °C | 21.35 | 25.00 | 53.65 | 76.0/529.9 | 24.0/531.4 |
| NP2 as synth. | 34.14 | 14.29 | 51.56 | 73.8/529.9 | 26.2/531.6 |
| NP2 T-150 °C | 24.61 | 18.68 | 56.71 | 75.0/529.8 | 25.0/531.4 |
| NP2 T-350 °C | 33.75 | 16.53 | 49.72 | 81.2/529.8 | 18.8/531.3 |
| NP2 T-600 °C | 33.73 | 14.52 | 51.75 | 77.6/529.7 | 22.4/531.4 |
| NP4 | 20.37 | 26.39 | 53.24 | 74.3/529.9 | 25.7/531.6 |
| NP6 | 28.73 | 23.67 | 47.6 | 68.0/529.9 | 32.0/531.5 |
| NP6 T-350 °C | 19.96 | 28.8 | 51.24 | 70.9/529.9 | 29.1/531.5 |
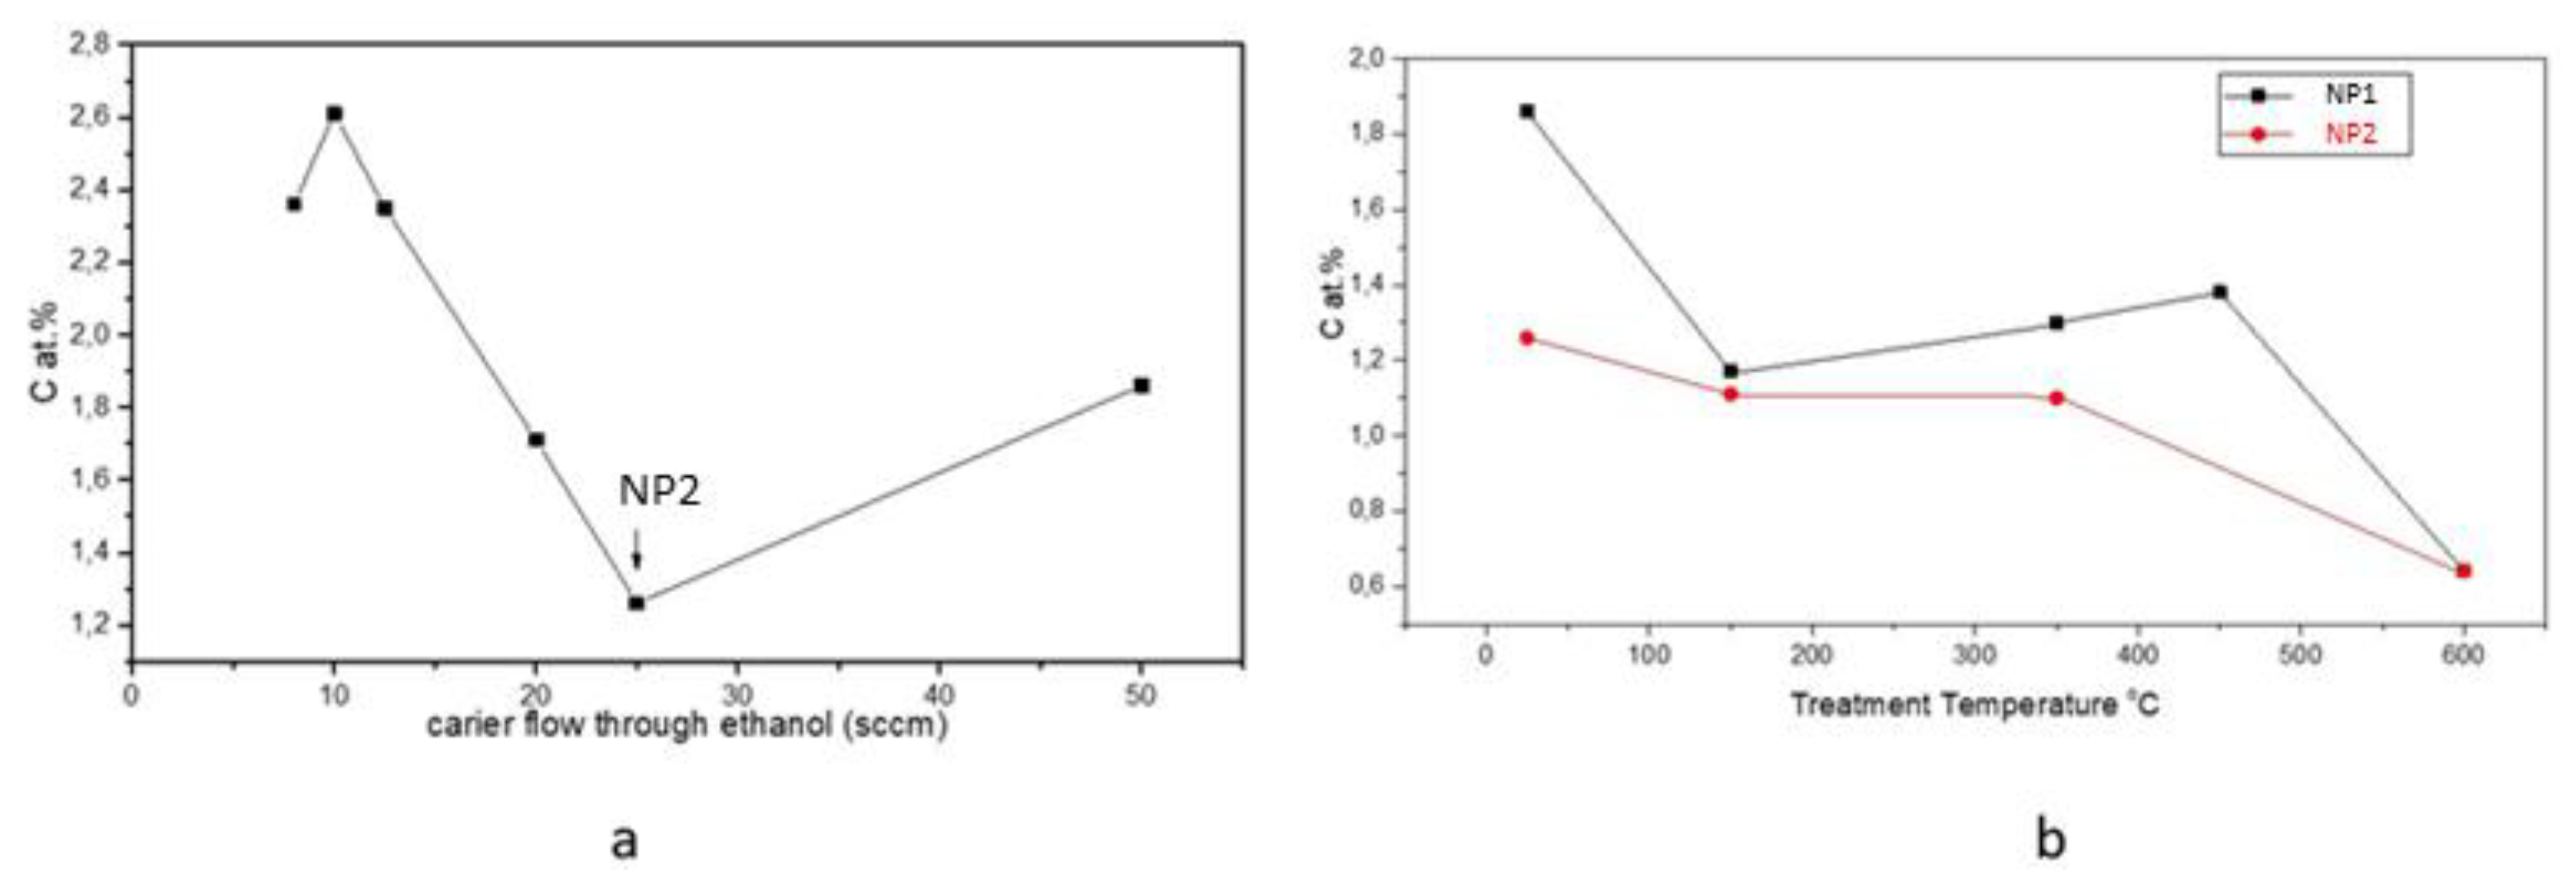
| Sample | C (at.%) | O (at.%) | Fe (at.%) | BET (m2/g) |
|---|---|---|---|---|
| NP1 | 1.86 | 60.64 | 37.71 | 91.47 |
| NP1 T-150 °C | 1.17 | 59.86 | 38.97 | 90.73 |
| NP1 T-350 °C | 1.3 | 58.34 | 40.36 | 84.04 |
| NP1 T-450 °C | 1.38 | 58.56 | 40.06 | 77.20 |
| NP1 T-600 °C | 0.77 | 57.8 | 41.42 | 15.46 |
| NP2 | 1.26 | 64.33 | 34.41 | 135.11 |
| NP2 T-150 °C | 1.11 | 63.69 | 35.20 | - |
| NP2 T-350 °C | 1.10 | 64.42 | 34.48 | - |
| NP2 T-600 °C | 0.64 | 61.56 | 37.80 | - |
| NP3 | 2.35 | 64.6 | 33.04 | 193.52 |
| NP4 | 2.61 | 59.42 | 37.97 | 205.13 |
| NP4 T-350 °C | 1.52 | 58.96 | 39.51 | - |
| NP6 | 2.36 | 59.8 | 37.84 | 210.1 |
| NP6 T-350 °C | 4.13 | 56.46 | 39.40 | 146.50 |
| NP6 T-450 °C | 1.49 | 53.43 | 34.42 | 139.49 |
| NP7 | 1.71 | 59.85 | 38.43 | 148.12 |
| Sample | Z-Average (5 min) | PDI | Zeta | Z-Average (2 h) | PDI |
|---|---|---|---|---|---|
| nm | mV | nm | |||
| NP1 | 111.5 | 0.377 | 44.8 | 125.1 | 0.408 |
| NP1 T-150 °C | 87.4 | 0.23 | 48.6 | 101.2 | 0.292 |
| NP1 T-250 °C | 4048.8 | 0.824 | −4.5 | decanted | - |
| NP1 T-350 °C | 8488.9 | 4.208 | −4.1 | decanted | - |
| NP1 T-450 °C | 4482.1 | 1.007 | −1.0 | decanted | - |
| NP1 T-600 °C | 2571.5 | 0.744 | −39.6 | decanted | - |
| NP2 | 81.5 | 0.331 | 60.1 | 88.6 | 0.376 |
| NP2 T-150 °C | 78.7 | 0.335 | 35.5 | 81.4 | 0.291 |
| NP2 T-350 °C | 2941.2 | 0.638 | −1.5 | decanted | - |
| NP2 T-600 °C | 290.1 | 0.425 | 34.9 | 325.6 | 0.437 |
| NP3 | 81.6 | 0.381 | 0.3 | 100.8 | 0.411 |
| NP4 | 98.5 | 0.389 | 22.0 | 106.1 | 0.416 |
| NP4 T-150 °C | 95.6 | 0.353 | 48.6 | 105.3 | 0.438 |
| NP4 T-250 °C | 2673.0 | 0.675 | 12.7 | decanted | - |
| NP4 T-350 °C | 5871.6 | 0.749 | 6.0 | decanted | - |
| NP4 T-450 °C | 1347.8 | 0.560 | 17.2 | decanted | - |
| NP5 | 80.7 | 0.360 | 39.1 | 116.7 | 0.436 |
| NP6 | 85.5 | 0.372 | 50.1 | 99.3 | 0.430 |
| NP6 T-150 °C | 95.2 | 0.439 | 54.5 | 87.5 | 0.357 |
| NP6 T-250 °C | 4987.7 | 0.823 | −29.6 | decanted | - |
| NP6 T-350 °C | 2984.6 | 0.641 | 8.3 | decanted | - |
| NP6 T-450 °C | 2217.5 | 0.482 | 8.9 | decanted | - |
| NP7 | 81.3 | 0.323 | 50.1 | 92.1 | 0.401 |
| Sample | Z-Average (5min) | PDI | Z-Average (2 h) | PDI |
|---|---|---|---|---|
| nm | nm | |||
| CHITOSAN | ||||
| NP1 | 169.8 | 0.379 | 183.9 | 0.396 |
| NP1 T-150 °C | 143.7 | 0.427 | 150.8 | 0.382 |
| NP1 T-250 °C | 145.0 | 0.396 | 192.0 | 0.386 |
| NP1 T-350 °C | 142.4 | 0.414 | 177.7 | 0.397 |
| NP1 T-450 °C | 134.2 | 0.402 | 153.1 | 0.441 |
| NP1 T-600 °C | 277.1 | 0.357 | 301.2 | 0.328 |
| NP2 | 145.5 | 0.484 | 182.3 | 0.390 |
| NP3 | 156.6 | 0.400 | 171.3 | 0.491 |
| NP4 | 138.3 | 0.399 | 136.7 | 0.504 |
| NP4 T-350 °C | 154.6 | 0.430 | 164.0 | 0.509 |
| NP5 | 123.5 | 0.411 | 153.2 | 0.486 |
| NP6 | 153.7 | 0.438 | 158.9 | 0.410 |
| NP6 T-350 °C | 131.7 | 0.450 | 160.9 | 0.380 |
| NP6 T-450 °C | 140.1 | 0.388 | 197.4 | 0.492 |
| NP7 | 158.4 | 0.456 | 145.5 | 0.424 |
| L-DOPA | ||||
| NP1 | 170.2 | 0.334 | 312.1 | 0.484 |
| NP1 T-150 °C | 147.9 | 0.359 | 483.6 | 0.393 |
| NP1 T-250 °C | 152.8 | 0.312 | 149.0 | 0.353 |
| NP1 T-350 °C | 99.1 | 0.379 | 98.7 | 0.317 |
| NP1 T-450 °C | 87.0 | 0.330 | 111.3 | 0.378 |
| NP1 T-600 °C | 178.0 | 0.290 | 193.8 | 0.268 |
| NP2 | 84.7 | 0.302 | 129.3 | 0.386 |
| NP3 | 103.7 | 0.332 | 112.9 | 0.409 |
| NP4 | 98.9 | 0.379 | 122.1 | 0.336 |
| NP4 T-350 °C | 101.2 | 0.378 | 117.8 | 0.414 |
| NP5 | 98.4 | 0.369 | 117.4 | 0.405 |
| NP6 | 106.0 | 0.314 | 115.8 | 0.375 |
| NP6 T-350 °C | 93.4 | 0.429 | 124.9 | 0.430 |
| NP6 T-450 °C | 99 | 0.304 | 124.0 | 0.422 |
| NP7 | 104.1 | 0.372 | 95.3 | 0.342 |
| CMCNa | ||||
| NP1 | 332.5 | 0.460 | 395.1 | 0.424 |
| NP1 T-150 °C | 240.8 | 0.383 | 321.8 | 0.427 |
| NP1 T-250 °C | 287.1 | 0.275 | 331.3 | 0.433 |
| NP1 T-350 °C | 189.7 | 0.437 | 212.9 | 0.515 |
| NP1 T-450 °C | 242.9 | 0.358 | 271.8 | 0.492 |
| NP1 T-600 °C | 370.5 | 0.324 | 402.0 | 0.288 |
| NP2 | 373.8 | 0.455 | 364.1 | 0.485 |
| NP3 | 300.4 | 0.401 | 298.7 | 0.435 |
| NP4 | 220.6 | 0.463 | 307.6 | 0.442 |
| NP4 T-350 °C | 345.8 | 0.435 | 371.3 | 0.526 |
| NP6 | 319.8 | 0.433 | 362.6 | 0.411 |
| NP6 T-350 °C | 231.9 | 0.525 | 279.3 | 0.481 |
| NP6 T-450 °C | 306.7 | 0.428 | 340.0 | 0.452 |
| NP7 | 331.6 | 0.382 | 277.7 | 0.408 |
Disclaimer/Publisher’s Note: The statements, opinions and data contained in all publications are solely those of the individual author(s) and contributor(s) and not of MDPI and/or the editor(s). MDPI and/or the editor(s) disclaim responsibility for any injury to people or property resulting from any ideas, methods, instructions or products referred to in the content. |
© 2025 by the authors. Licensee MDPI, Basel, Switzerland. This article is an open access article distributed under the terms and conditions of the Creative Commons Attribution (CC BY) license (https://creativecommons.org/licenses/by/4.0/).
Share and Cite
Dumitrache, F.; Criveanu, A.; Lungu, I.; Fleaca, C.; Gavrila-Florescu, L.; Morjan, I.; Stamatin, I.; Balan, A.; Socoliuc, V.; Vasile, B. Experimental Study Regarding the Synthesis of Iron Oxide Nanoparticles by Laser Pyrolysis Using Ethanol as Sensitizer; Morpho-Structural Alterations Using Thermal Treatments on the Synthesized Nanoparticles. Coatings 2025, 15, 234. https://doi.org/10.3390/coatings15020234
Dumitrache F, Criveanu A, Lungu I, Fleaca C, Gavrila-Florescu L, Morjan I, Stamatin I, Balan A, Socoliuc V, Vasile B. Experimental Study Regarding the Synthesis of Iron Oxide Nanoparticles by Laser Pyrolysis Using Ethanol as Sensitizer; Morpho-Structural Alterations Using Thermal Treatments on the Synthesized Nanoparticles. Coatings. 2025; 15(2):234. https://doi.org/10.3390/coatings15020234
Chicago/Turabian StyleDumitrache, Florian, Anca Criveanu, Iulia Lungu, Claudiu Fleaca, Lavinia Gavrila-Florescu, Iuliana Morjan, Ioan Stamatin, Adriana Balan, Vlad Socoliuc, and Bogdan Vasile. 2025. "Experimental Study Regarding the Synthesis of Iron Oxide Nanoparticles by Laser Pyrolysis Using Ethanol as Sensitizer; Morpho-Structural Alterations Using Thermal Treatments on the Synthesized Nanoparticles" Coatings 15, no. 2: 234. https://doi.org/10.3390/coatings15020234
APA StyleDumitrache, F., Criveanu, A., Lungu, I., Fleaca, C., Gavrila-Florescu, L., Morjan, I., Stamatin, I., Balan, A., Socoliuc, V., & Vasile, B. (2025). Experimental Study Regarding the Synthesis of Iron Oxide Nanoparticles by Laser Pyrolysis Using Ethanol as Sensitizer; Morpho-Structural Alterations Using Thermal Treatments on the Synthesized Nanoparticles. Coatings, 15(2), 234. https://doi.org/10.3390/coatings15020234