3.1. Microstructures
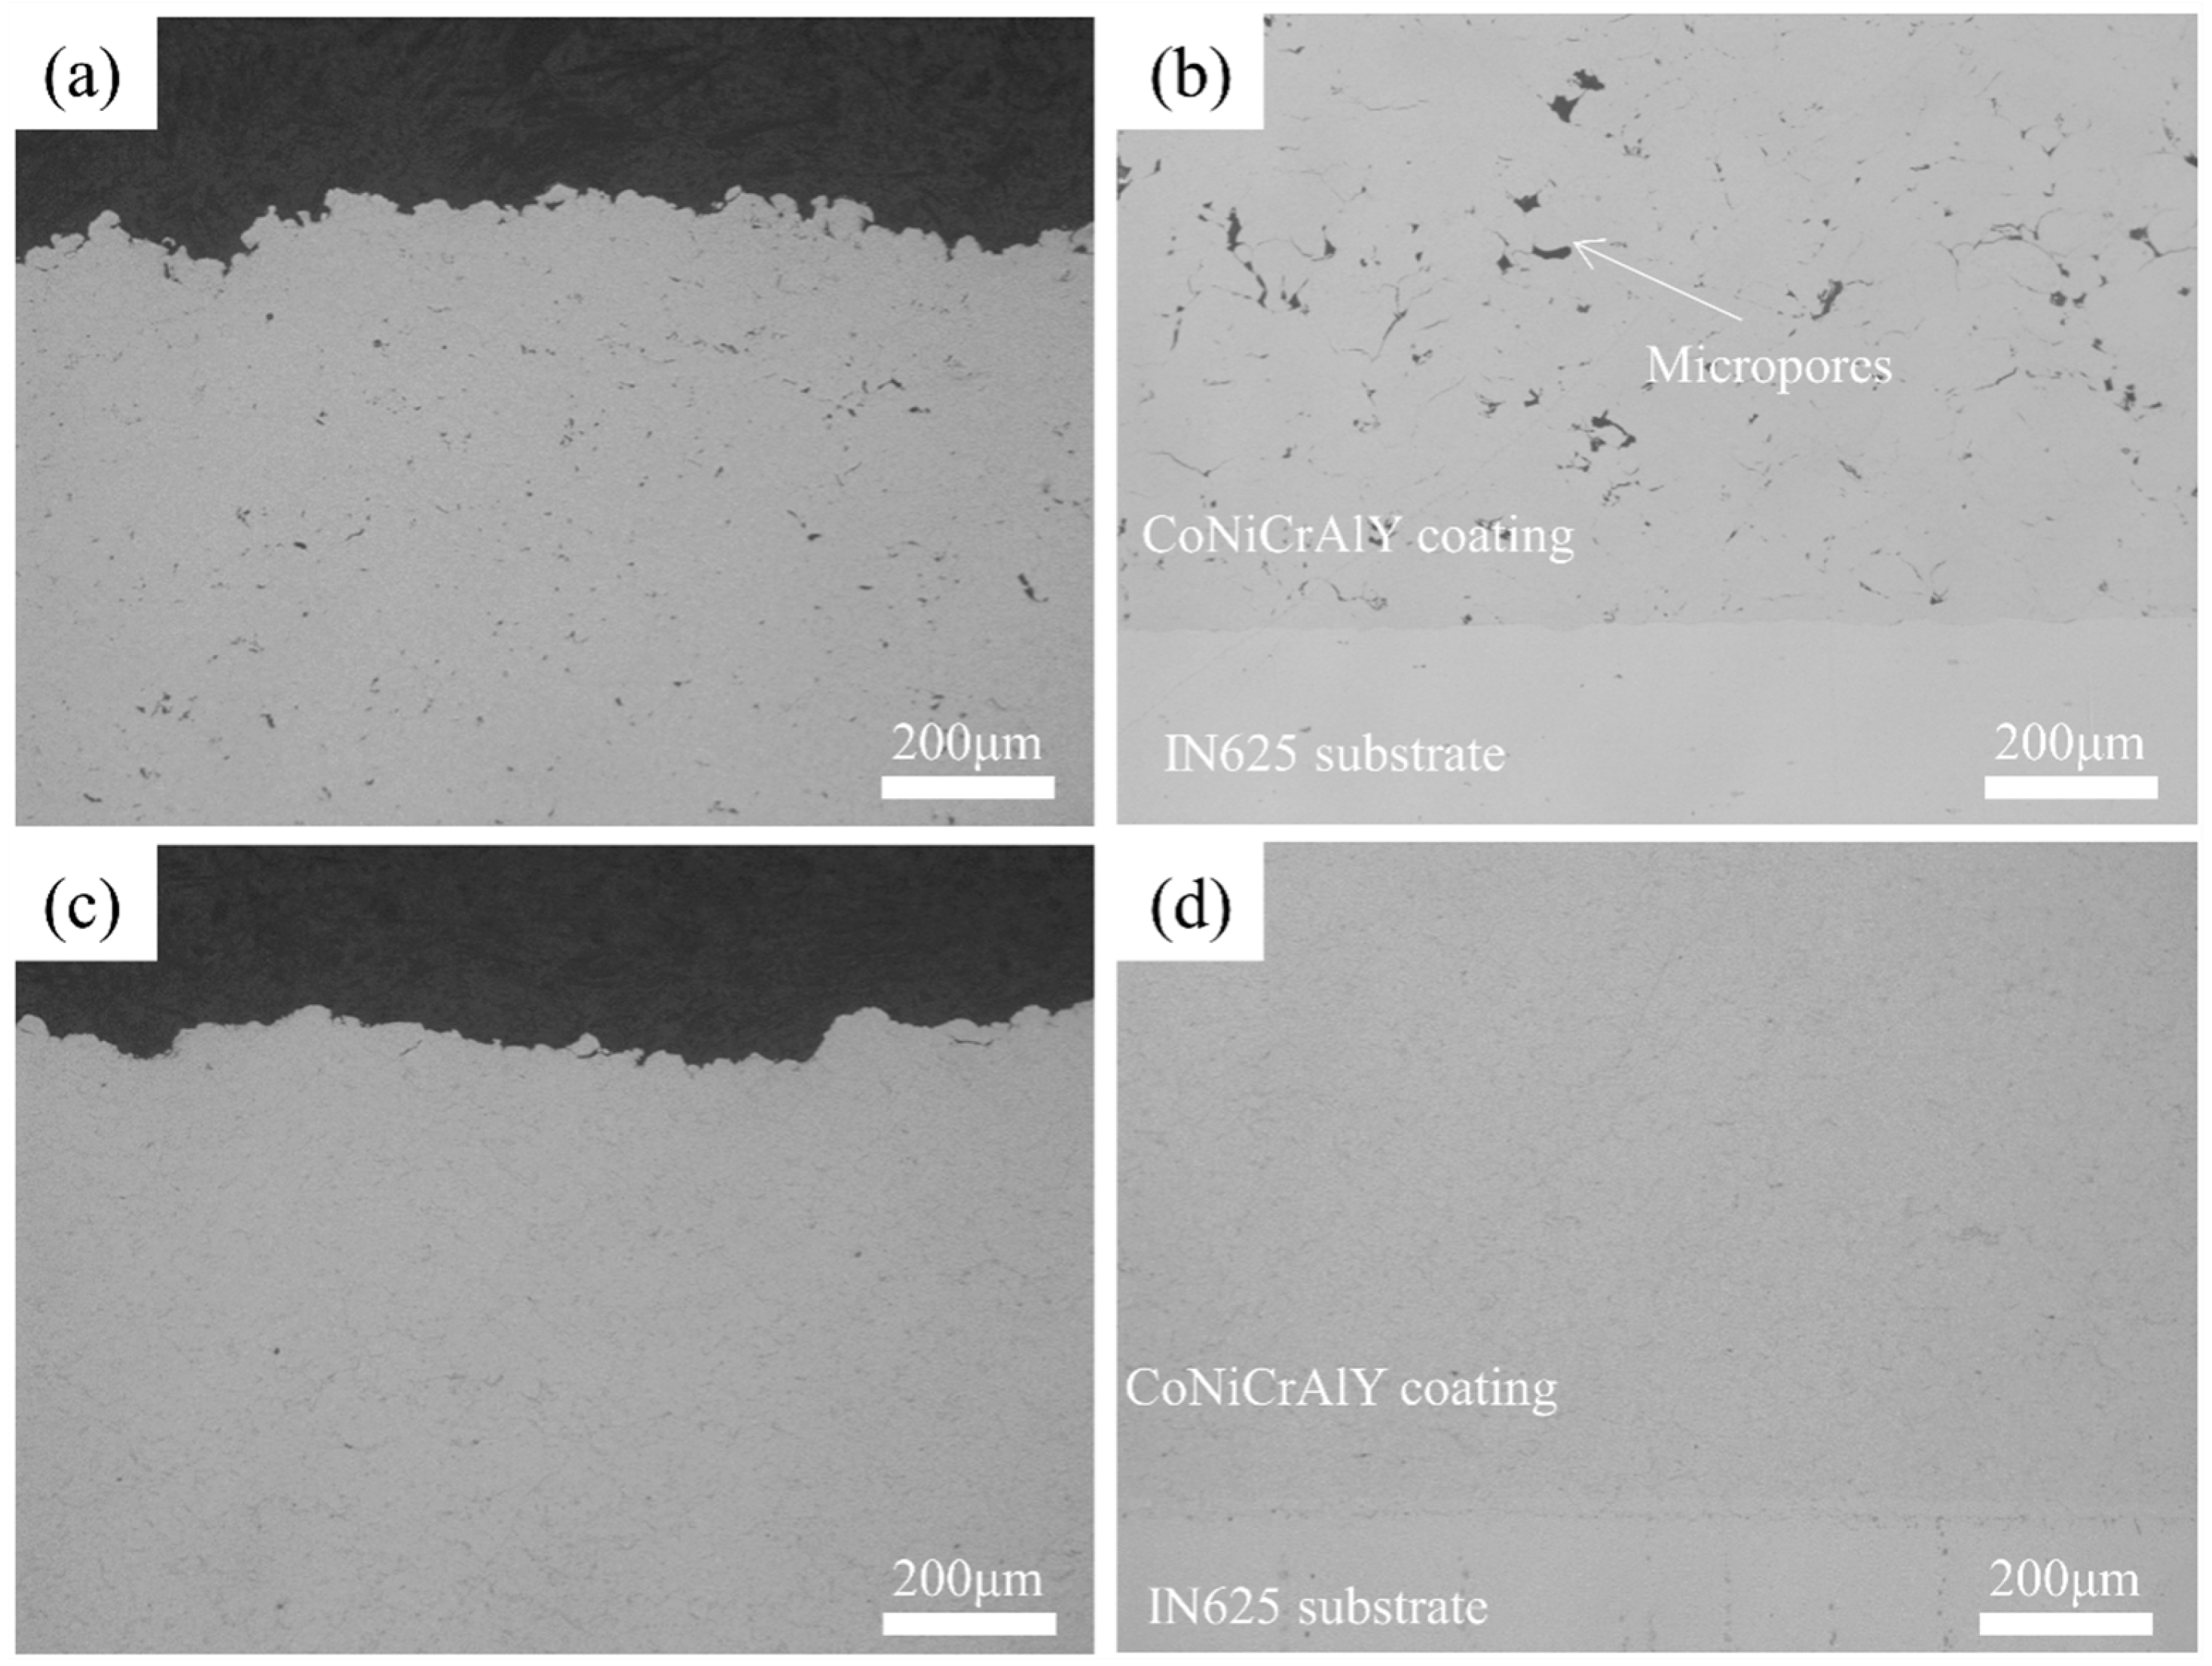
Figure 2 shows the cross-sectional microstructure of the annealed CoNiCrAlY coating, indicating a well-bonded interface between the coating and the substrate, and a dense structure without obvious defects. Some micropores are visible at the particle–particle interfaces, which are caused by uneven deformation of the powder particles under high-speed impact during the cold spray process.
Figure 2a,b depict the CoNiCrAlY coatings prepared using nitrogen as the propellant gas, which showed a porosity of approximately 1.0%. In contrast,
Figure 2c,d show the CoNiCrAlY coating prepared with helium, which is almost free of pores within the coating, resulting in higher densities than the nitrogen coating. This is mainly attributed to the higher impact velocity of the particles under helium, leading to significant heating of the particles, and triggering adiabatic shear instability (ASI). The jets and splats formed during the deformation tend to fill the voids in the coating, resulting in a dense microstructure [
23].
The XRD spectra of CoNiCrAlY powder and cold-sprayed CoNiCrAlY coatings after annealing are shown in
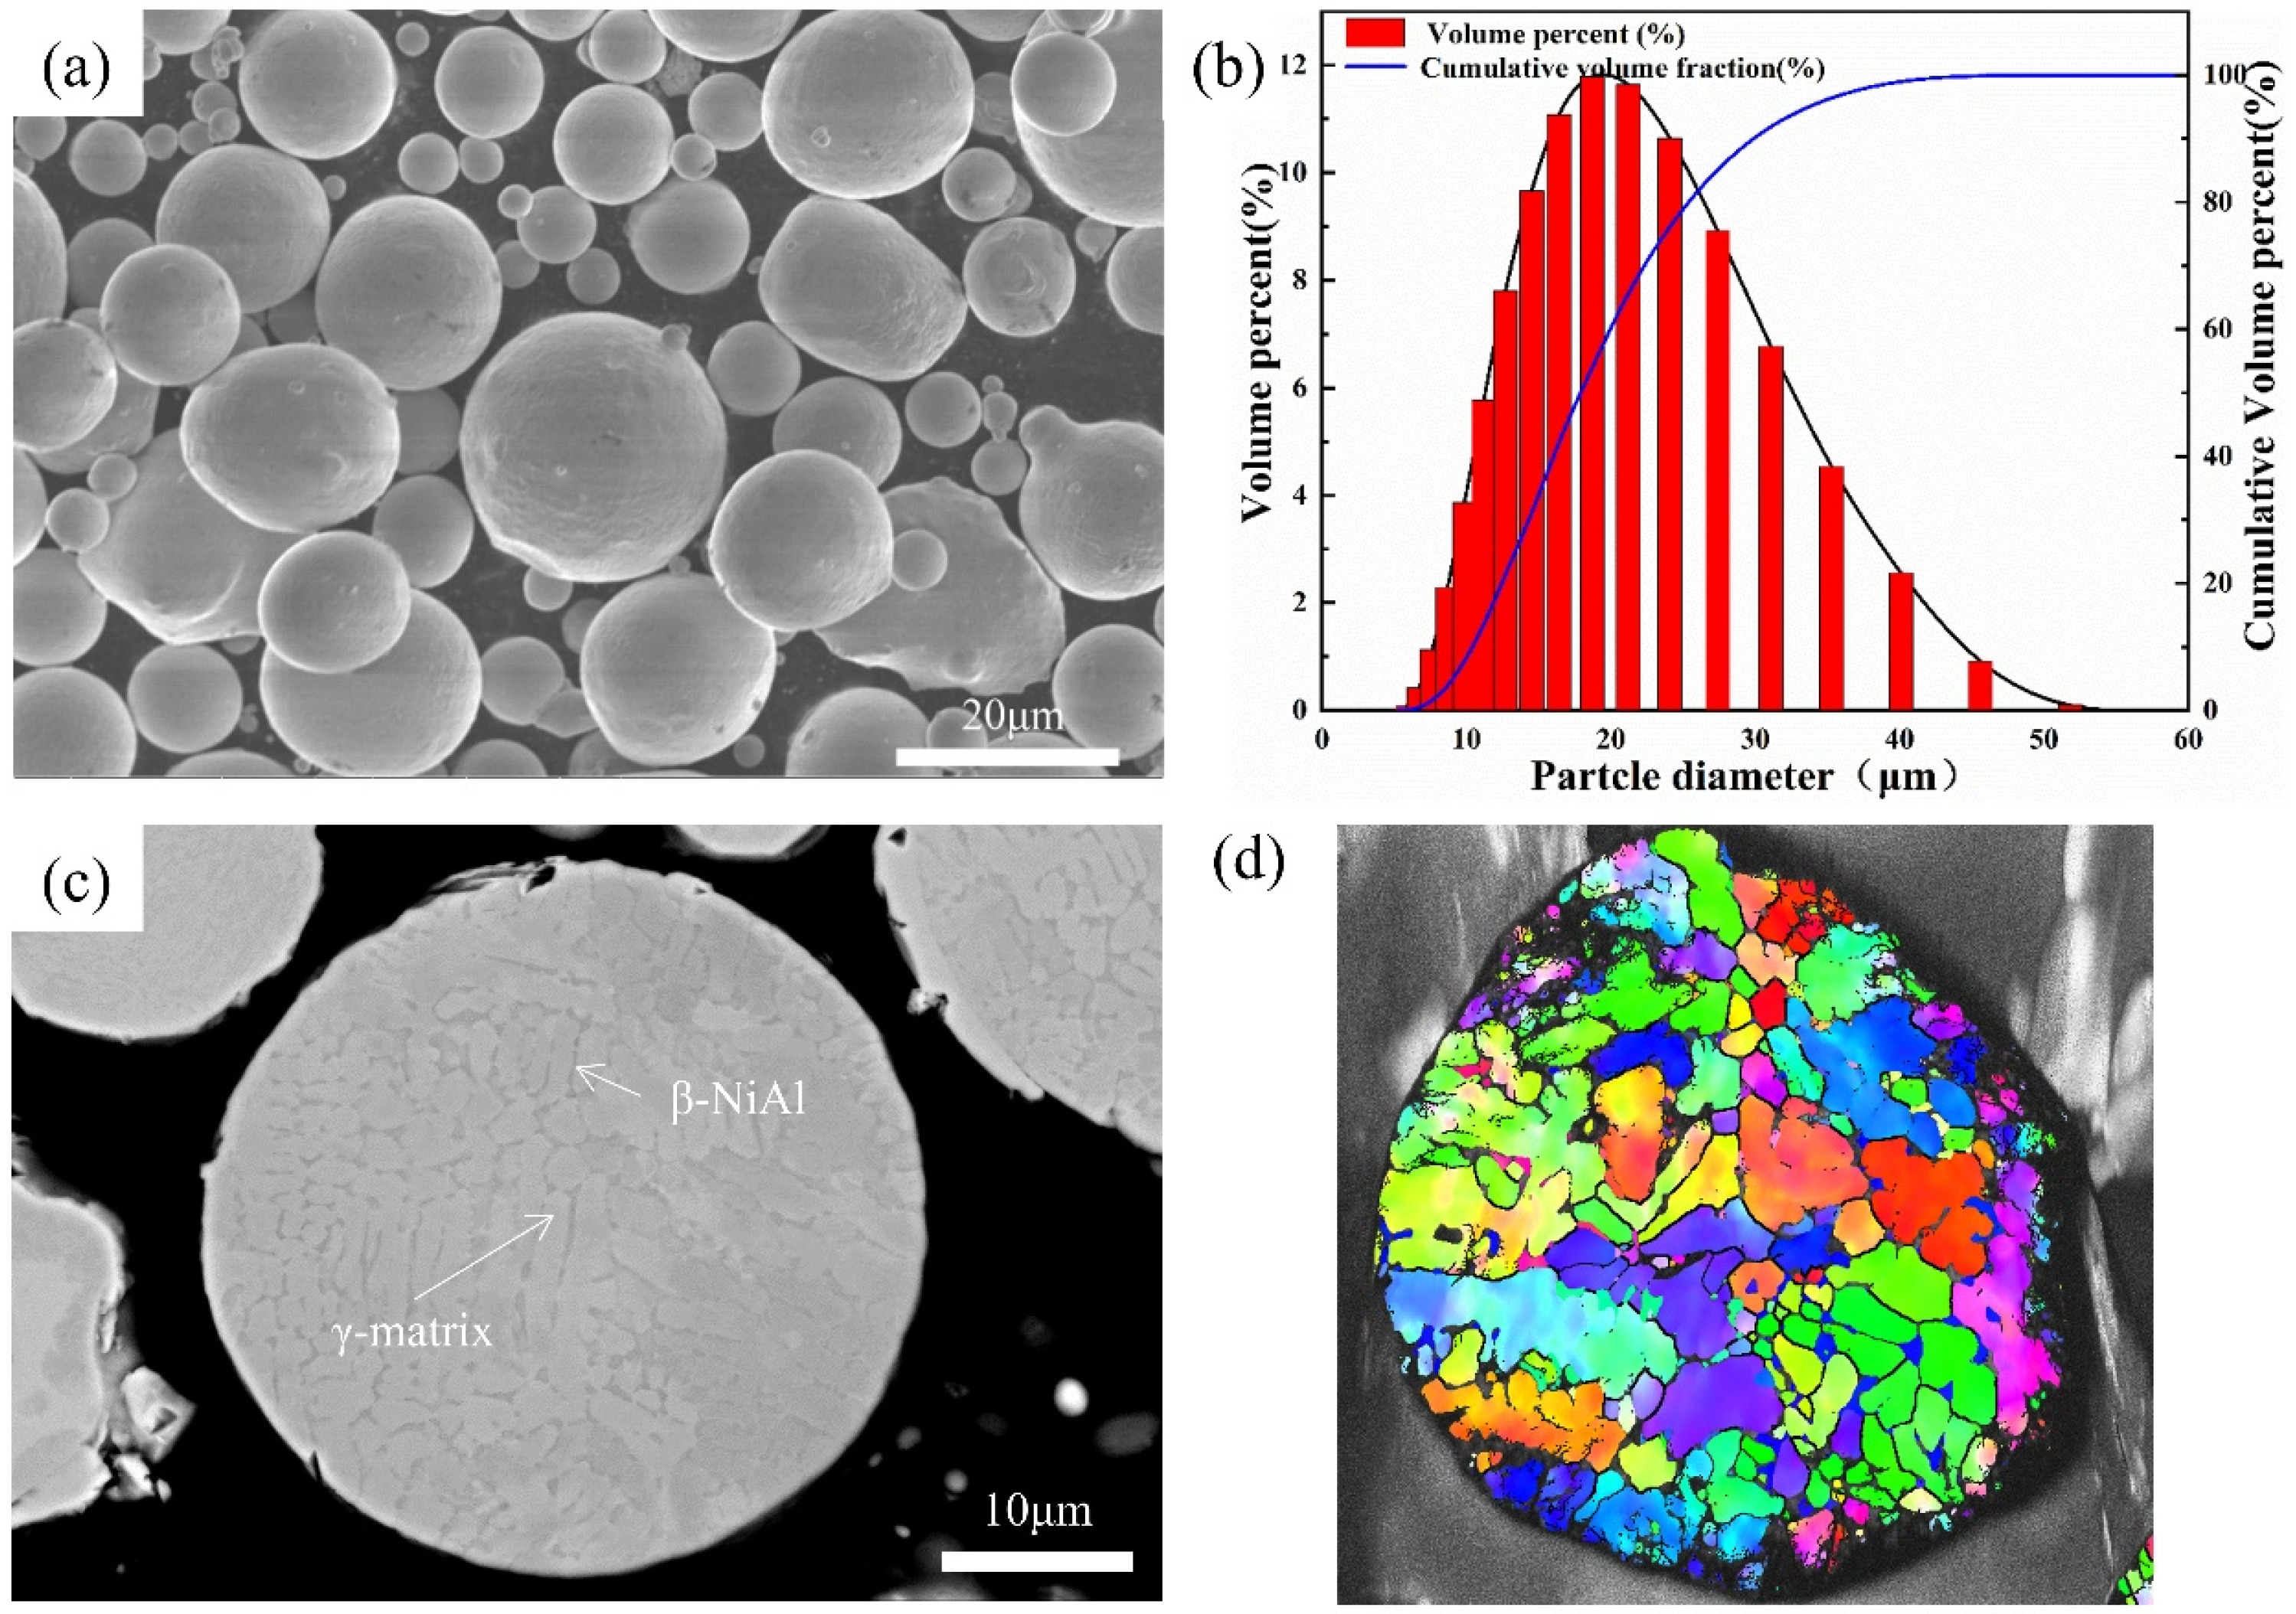
Figure 3. It can be seen that both the coating and the powder are composed of γ-matrix (Co-Ni-Cr) phase and β-NiAl phase, which proves that the cold spray deposition does not change the phase composition and no new phase is formed. It is also clear that the β-NiAl phase is uniformly distributed in the γ-matrix phase by analyzing
Figure 4b,e.
The cross-sectional microstructures of the above CoNiCrAlY coating were characterized by EBSD with an area of 120 μm × 80 μm.
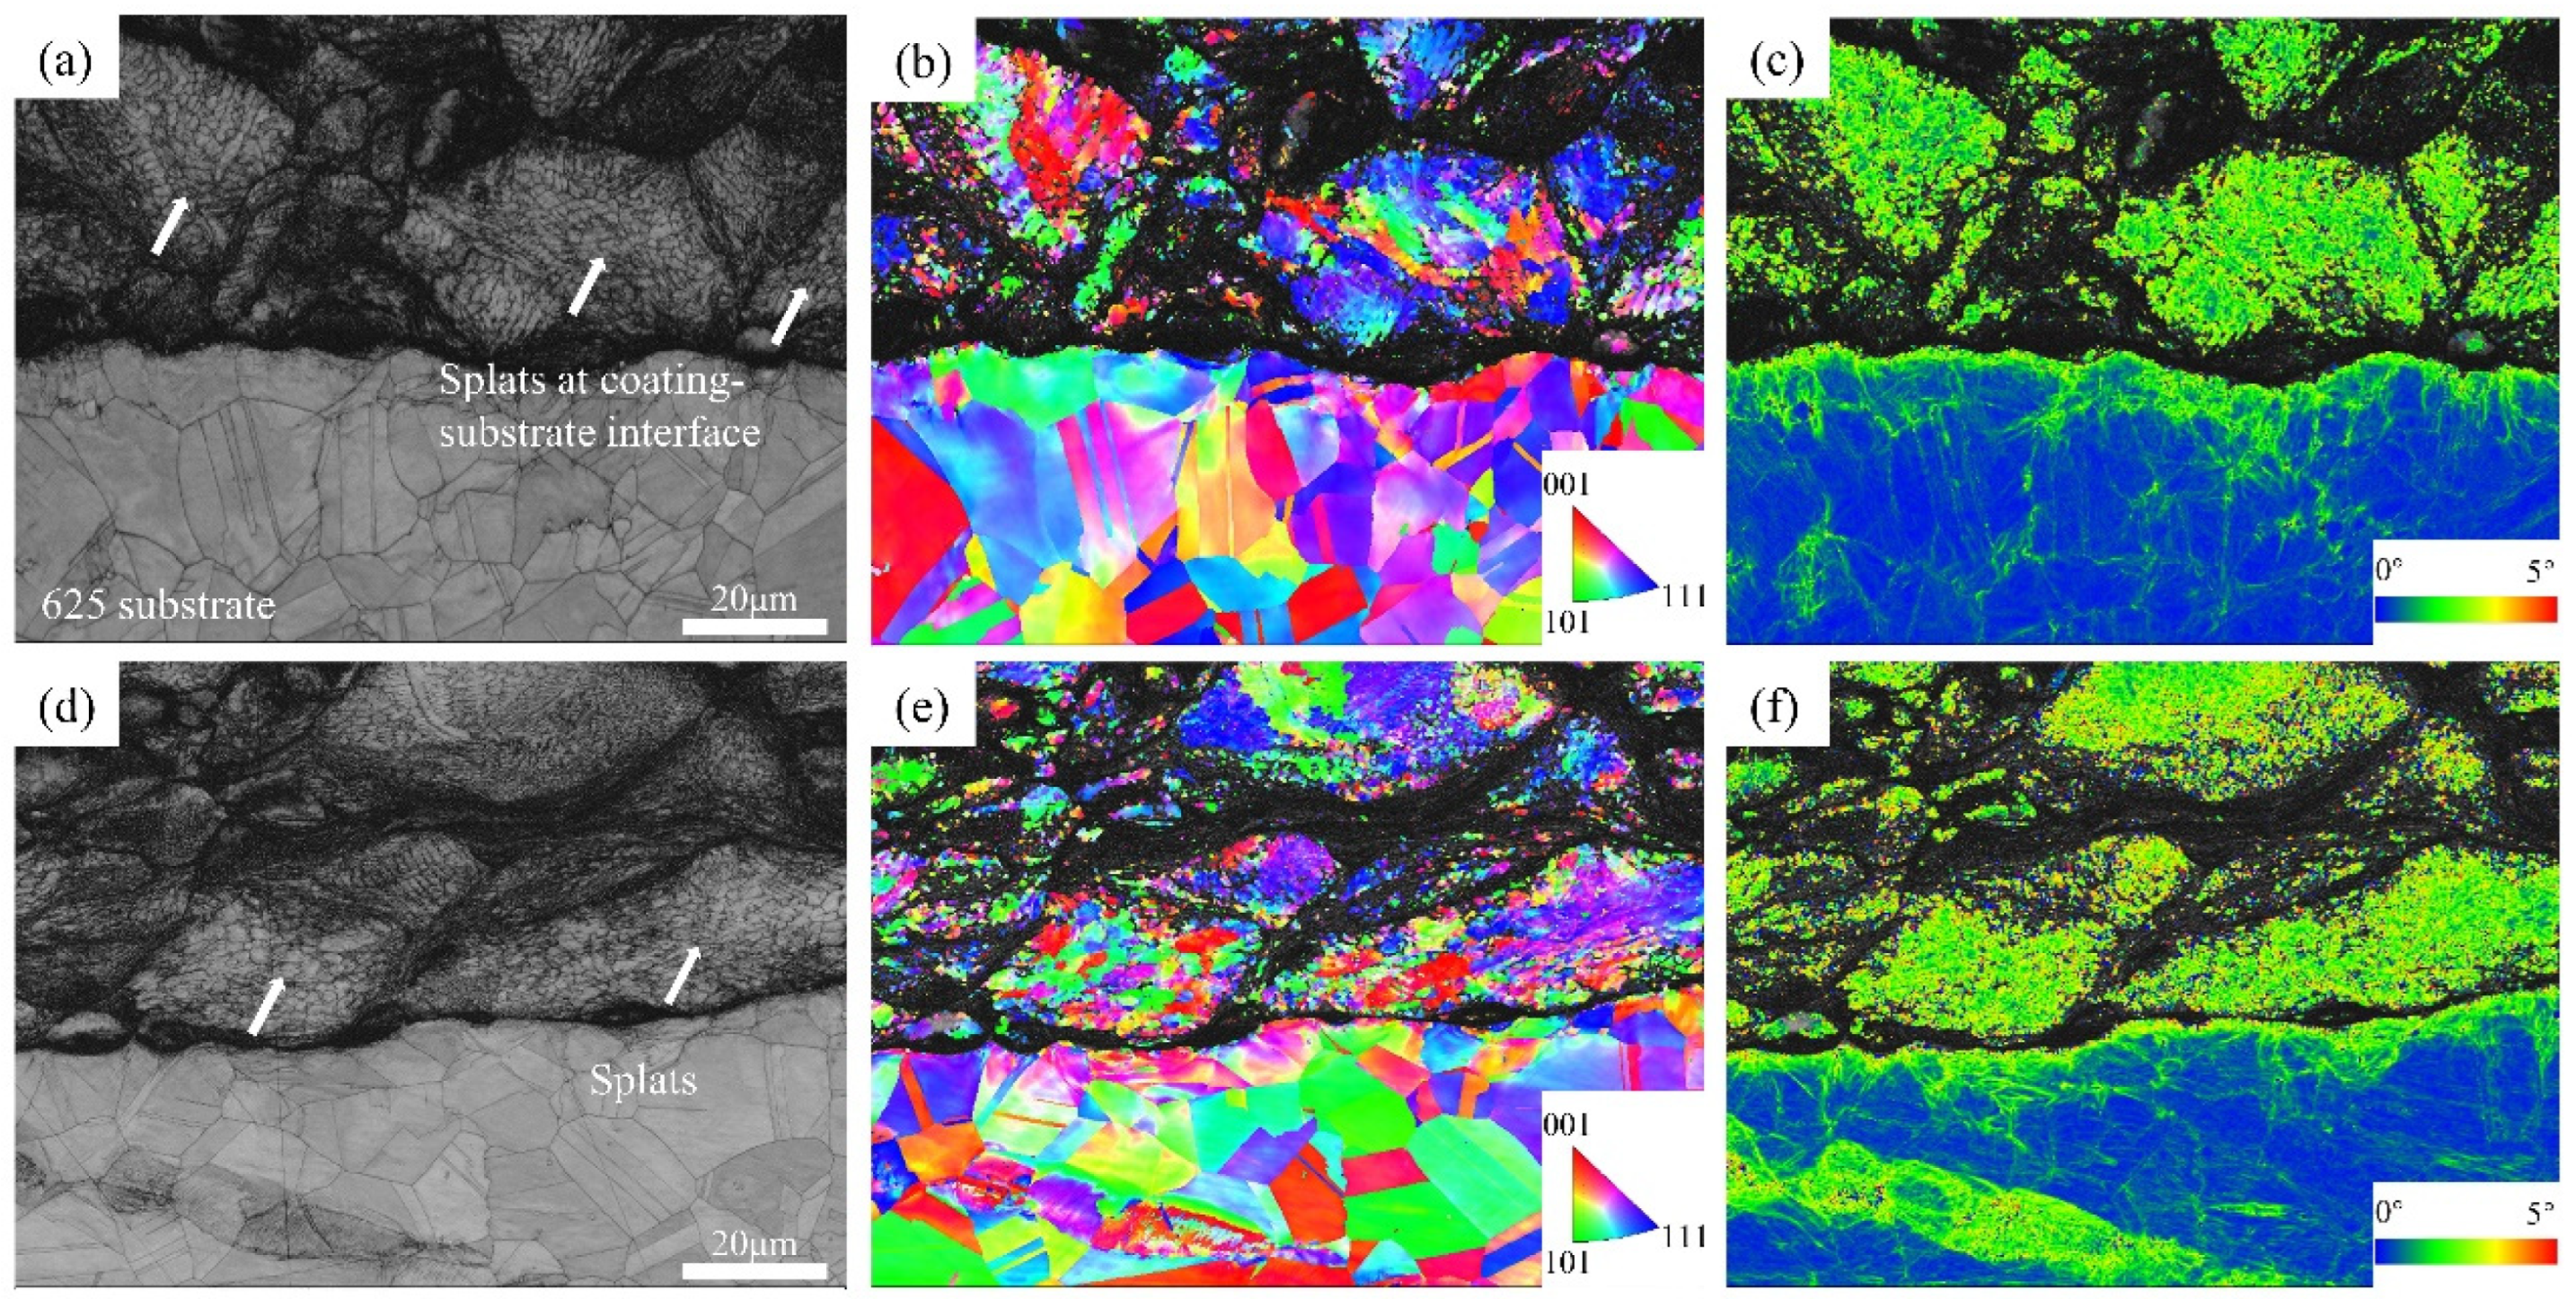
Figure 5 shows the band contrast images, IPF, and local average misorientation (LAM) maps of CoNiCrAlY coatings in different deposition states. From the band contrast (BC) maps (
Figure 5a,d), it can be seen that the CoNiCrAlY powder particles undergo strong plastic deformation during the cold spray deposition process, and the particles also have a distinct flat shape. In particular, strong distortions of the crystal structure and grain refinement occur at the particle-to-particle or particle-to-substrate boundaries (
Figure 5b,e); as can be seen, these areas cannot be captured by EBSD and result in black areas in the IPF maps. It can also be seen that the degree of particle deformation is significantly higher in the helium-sprayed coating than in the nitrogen-sprayed coating, which is related to the higher particle impact velocity accelerated by the helium.
Figure 4a,d and
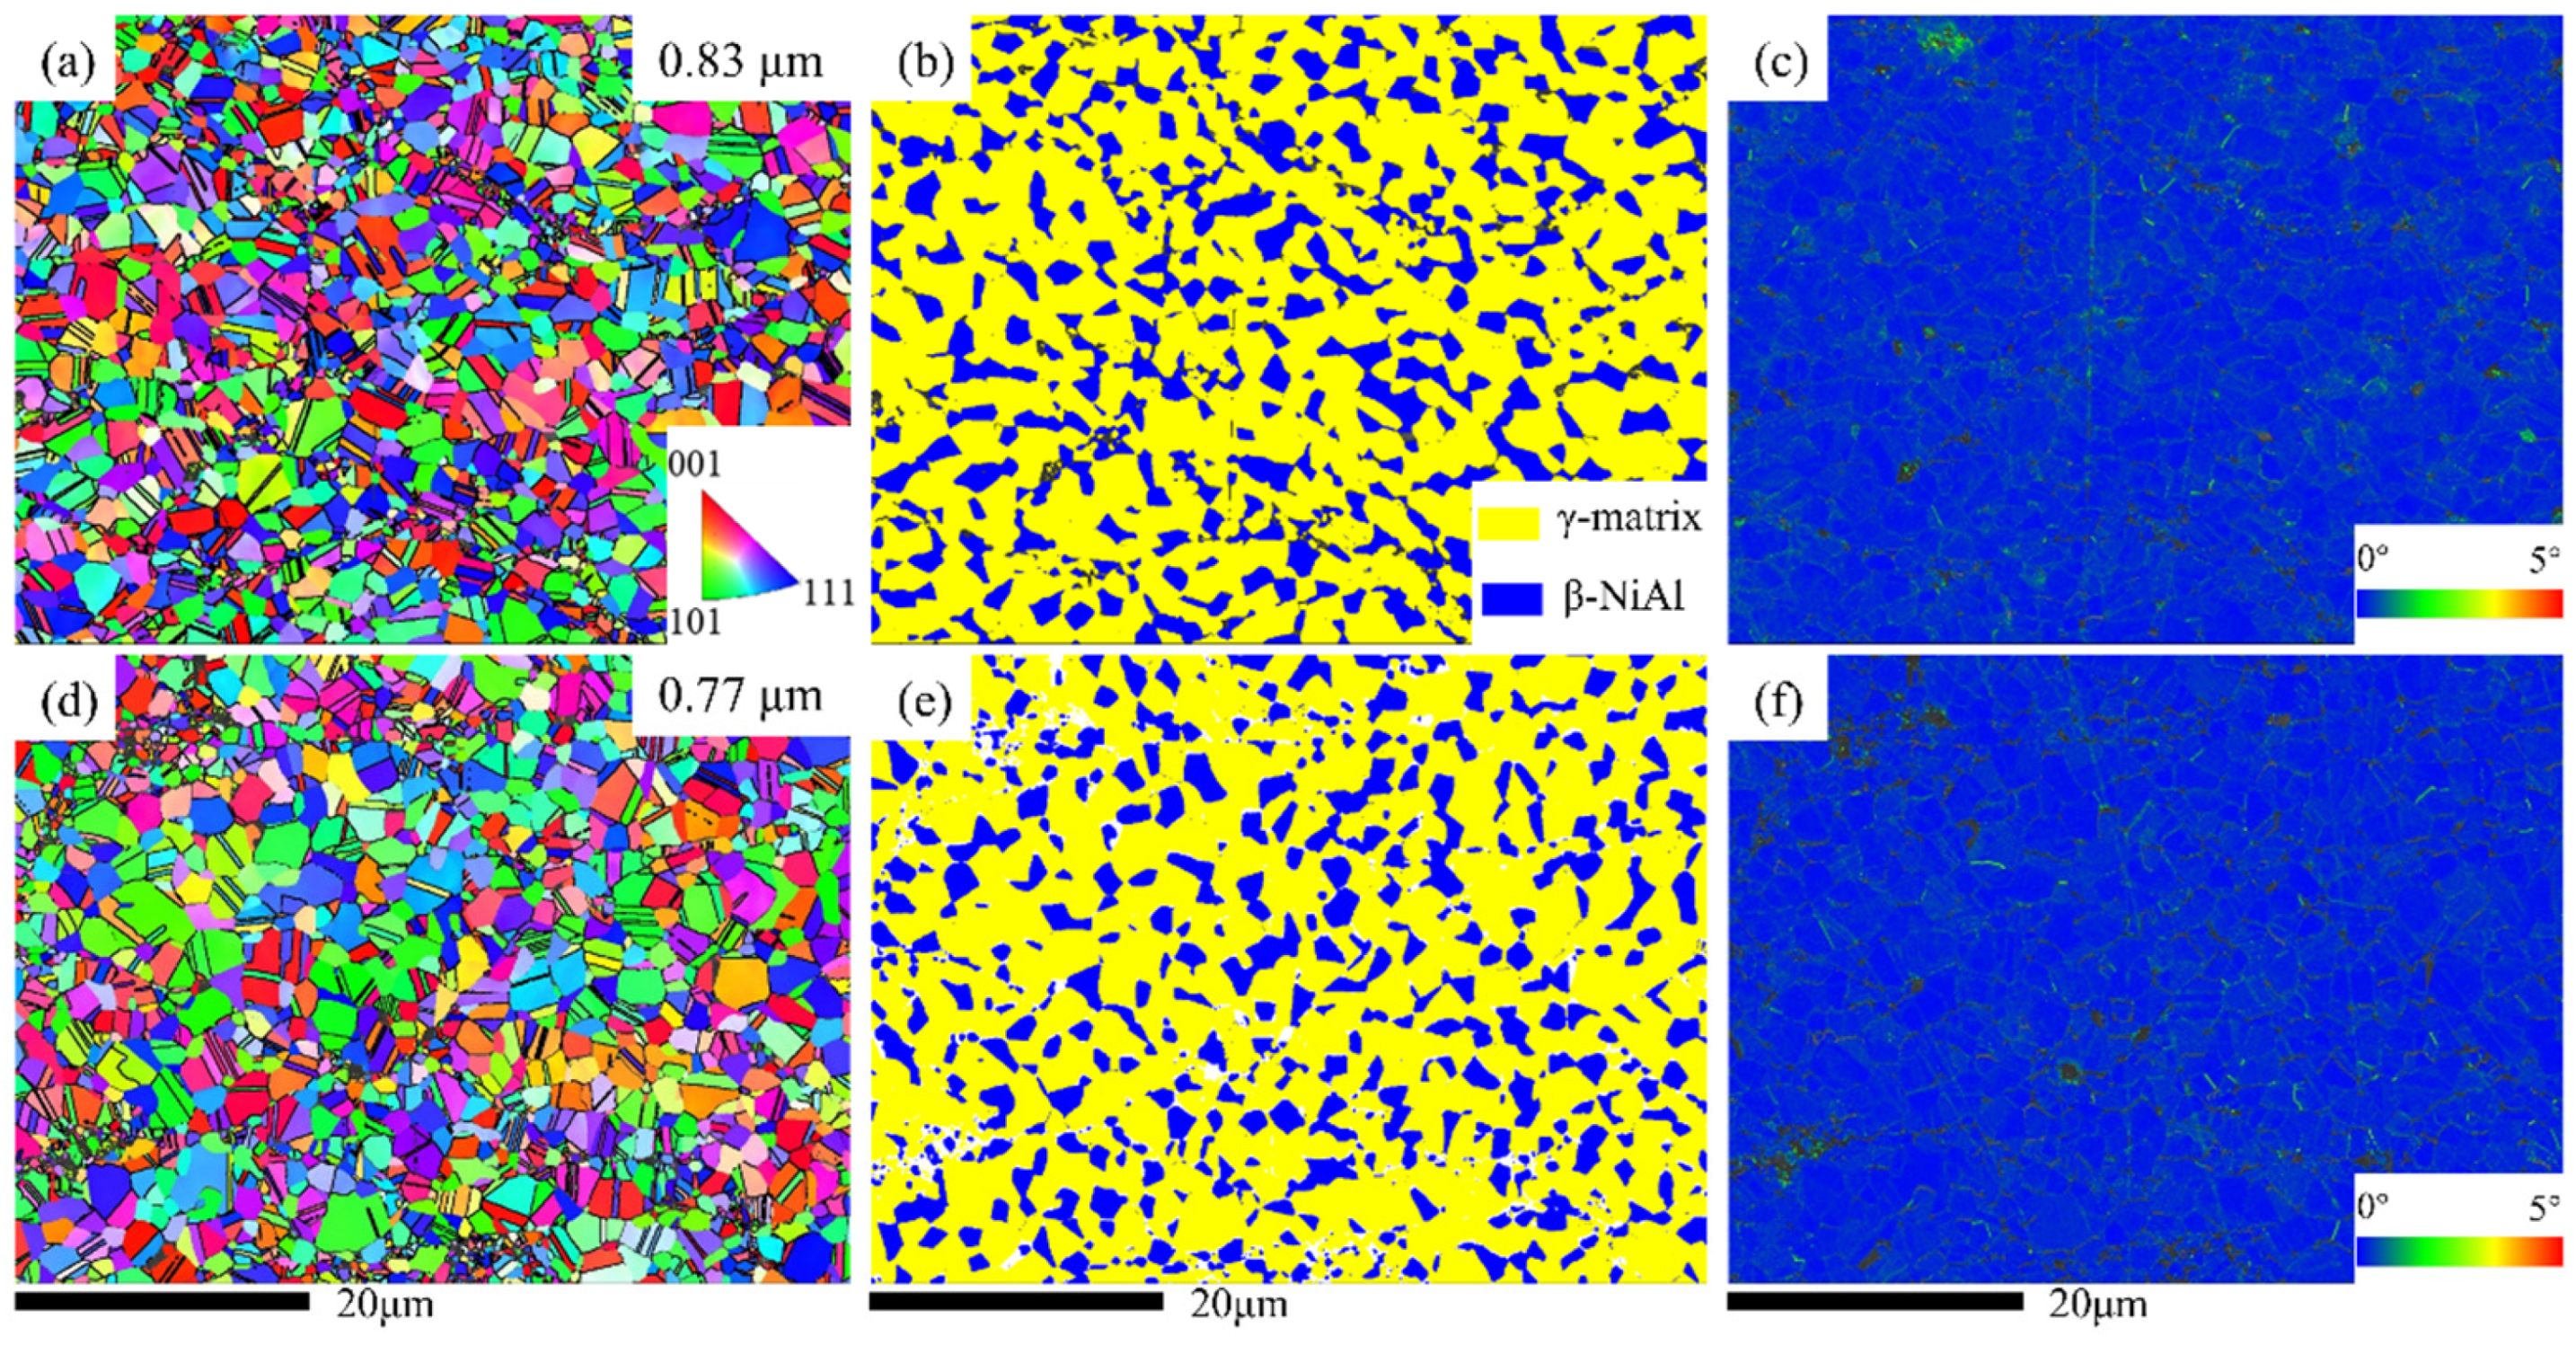
Figure 5b,e show the EBSD inverse pole figure (IPF) maps for the as-deposited and heat-treated coatings, and the grain sizes (mean with standard deviation) within the diagram were calculated.
Figure 4d demonstrates that the grain size of the powder particles is 1.36 μm. However, the internal grains of the deposited state coatings undergo significant grain refinement, with grain sizes of 0.36 μm and 0.32 μm for the two deposited states, respectively. The reason for this is dynamic recrystallization due to severe plastic deformation during deposition. It can also be seen from the IPF maps of the deposited state that the grain size within the coating becomes very heterogeneous, and the grain size in the central region of the powder particles is much larger compared to the boundary location, which is related to the greater degree of plastic deformation occurring at the interface location. After heat treatment, the grain growth can be clearly observed from the IPF maps (
Figure 4a,d), and the average grain size inside the coating increases to 0.83 μm and 0.77 μm, respectively. This also shows that there is basically no unidentified area inside the coating after heat treatment, and similar to the deposited state, the grain size inside the coating is uneven, and the grains at the original interface are smaller than those in the middle of the particles. This phenomenon is mainly related to the static recrystallization and stress relief that occurs during the heat treatment [
24] (the change in stress–strain during the heat treatment phase is explained in detail below).
Figure 4e,f and
Figure 5e,f show the local average misorientation (LAM) for the CoNiCrAlY coatings in the as-deposited and heat treatment states. LAM maps are usually used to highlight the local variations in dislocation density and its distribution.
Figure 4e,f show that the orientation difference is more pronounced in the as-deposited coating compared to the substrate. The substrate is predominantly dark blue and the coating is green to red (with a gradual increase in orientation difference from blue to red), indicating that the coating undergoes strong plastic deformation during the deposition process, thus causing high stress–strain and high dislocation density due to work hardening. By comparing the different deposition states (
Figure 5e,f), it is clear that the coating prepared with helium has more red pixel dots, i.e., the coating is more severely plastic-deformed and has a higher internal stress–strain, which is due to faster particle impact velocity under helium conditions. Compared with the as-deposited state, the heat-treated coatings show a significant recovery (as shown in
Figure 4e,f), proving a significant reduction in the dislocation density inside the coating. The reason is that the grain growth and recrystallization occur during the heat treatment. In addition, residual stress within the coating is significantly reduced during heat treatment, resulting in work hardening being released and the internal dislocation density being reduced [
25].
3.2. Oxidation Behaviors
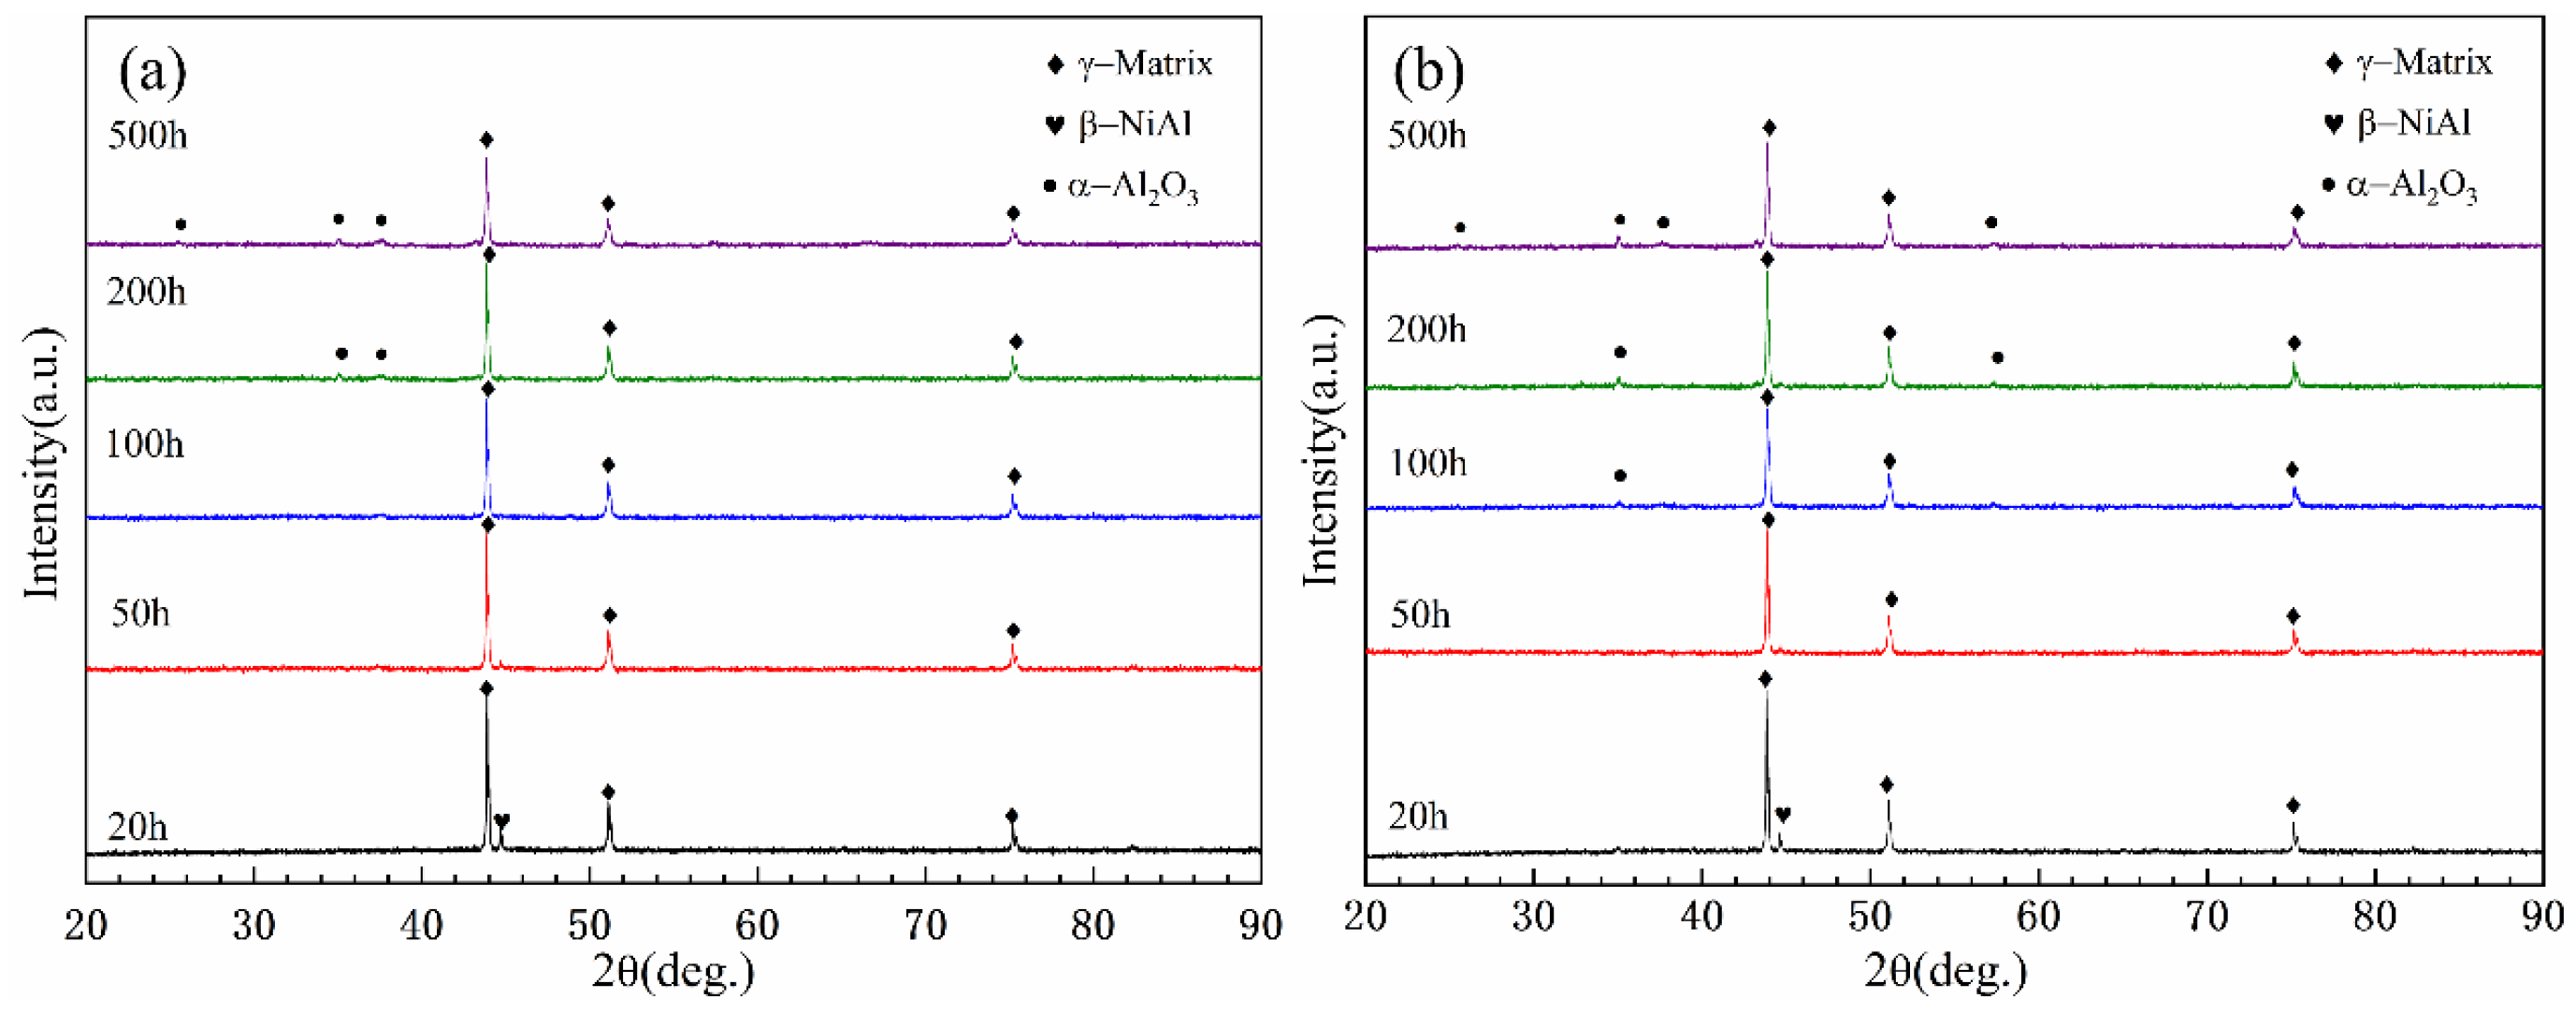
Figure 6 shows the XRD patterns of the coatings after oxidation at 800 °C. The X-ray diffraction results show that the oxidation products of the CoNiCrAlY coatings prepared with different propellant gases are only α-Al
2O
3. However, the peak intensity of α-Al
2O
3 gradually increases with an increase in oxidation time. Additionally, α-Al
2O
3 is not detected during the first 20 h and 50 h of oxidation at 800 °C, which is probably due to the limited amount of oxidation products that formed, which could not be detected.
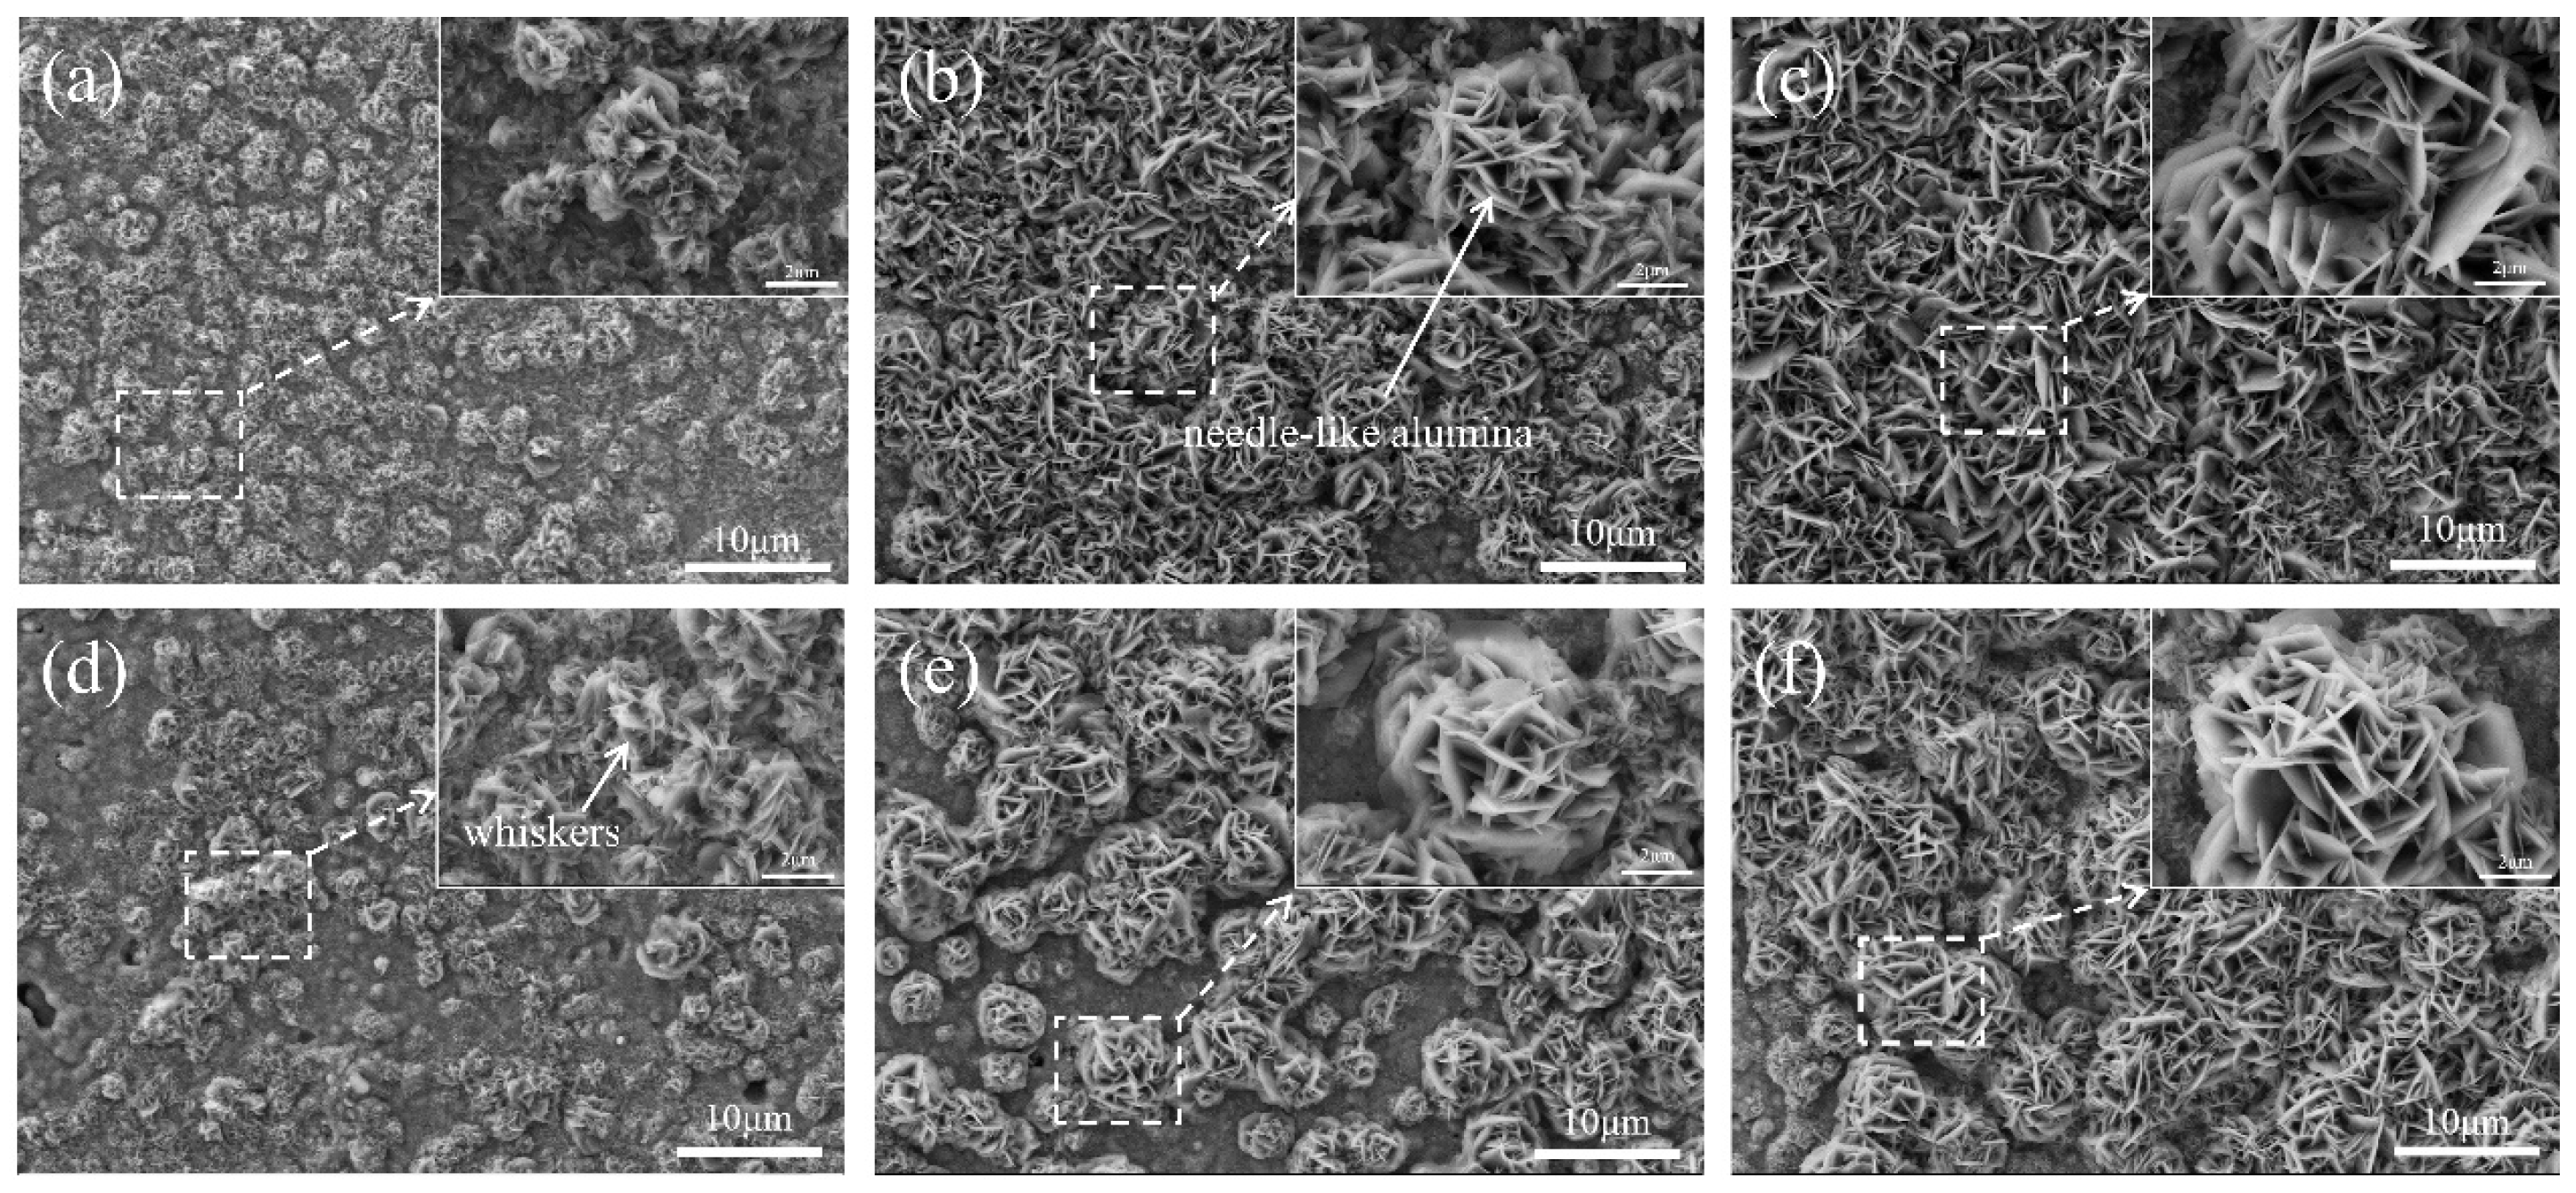
Figure 7 illustrates the surface morphologies of the coatings after oxidation at 800 °C.
Figure 7a,d display the surface morphologies of the N2-sprayed and He-sprayed coatings after 20 h of oxidation. As seen in the enlarged image on the upper right, needle-like oxide particles grow on the coating surface, which are primarily α-Al
2O
3, consistent with the results obtained by XRD (
Figure 6). However, it is evident that the surface of the N2-sprayed coating is covered by uniformly dense needle-like oxide particles after 500 h of oxidation (
Figure 7c), while the He-sprayed coating still has different clusters of particles after 500 h of oxidation, with valleys between the clusters of particles. Thus, the He-sprayed coating has less oxide content under the same oxidation conditions. The needle-like oxide particles are indicative of the formation of θ-Al
2O
3 based on morphological analysis. Previous studies have also reported that θ-Al
2O
3 is present in the early stage of oxidation, which is confirmed by the oxide morphologies. However, it is confirmed by the XRD results in
Figure 6 that the oxidation products are all α-Al
2O
3, indicating that the conversion of θ-Al
2O
3 to α-Al
2O
3 has been essentially completed on the coating surface. Nevertheless, this whisker-like structure is still observed on the coating surface because the surface morphology has not completely transformed [
26]. Tolpygo et al. [
27] have also previously identified θ-Al
2O
3 as a transitional oxide. Although it can quickly transition to steady-state α-Al
2O
3, this phase transition does not lead to a rapid transformation of the whisker structure, which is maintained for a longer period.
In addition to the surface morphologies shown earlier, the coatings also undergo significant microstructural evolution through depth during the oxidation process.
Figure 8 shows the cross-sectional morphology and elemental surface sweeps of the CS CoNiCrAlY coating after 50, 200, and 500 h of oxidation at 800 °C. It can be seen that after 50 h of high-temperature thermal exposure, a uniform and continuous thermally grown oxide (TGO) layer was formed on the surface of both coatings, and the analysis combined with the EDS surface scan (
Figure 8g) showed that the oxide layer was primarily an aluminum oxide scale. With increasing time, the TGO scale of both coatings grows significantly, and the oxide layer gradually thickens. However, the microstructure remains similar, dominated by α-Al
2O
3. Meanwhile, a more detailed observation of
Figure 8g shows that a small but very obvious amount of Y
2O
3 is found at the interface of TGO/coating. It is concluded that Y as an active element can promote the formation of peg-like oxide at the oxide film interface, thus improving the adhesion of the oxide film through the mechanical keying effect (or pegging effect) [
28].
From the cross-sectional elemental surface sweep of the coating after oxidation (
Figure 8g), it can also be seen that the formation and growth of the α-Al
2O
3 oxide layer on the surface of the coating consumes Al in the coating, and an Al depletion zone occurs inside the coating below the oxide layer, leading to the formation of a β-depletion zone. It is clearly seen from
Figure 8 that three different characteristic regions of Al distribution are found in the cross-section of the oxidized coating [
29]: (1) a region of high Al concentration present on the surface (oxide layer); (2) a significant decrease in Al concentration in the region below the oxide layer due to the depletion of the β-phase (Al depletion region); and (3) a distinct Al peak and valley in the lowermost region, indicating that the β-phase is randomly distributed in the γ-phase. With an increase in oxidation time, the depth of the β depletion zone becomes significantly larger as the thickness of the oxide layer gradually increases.
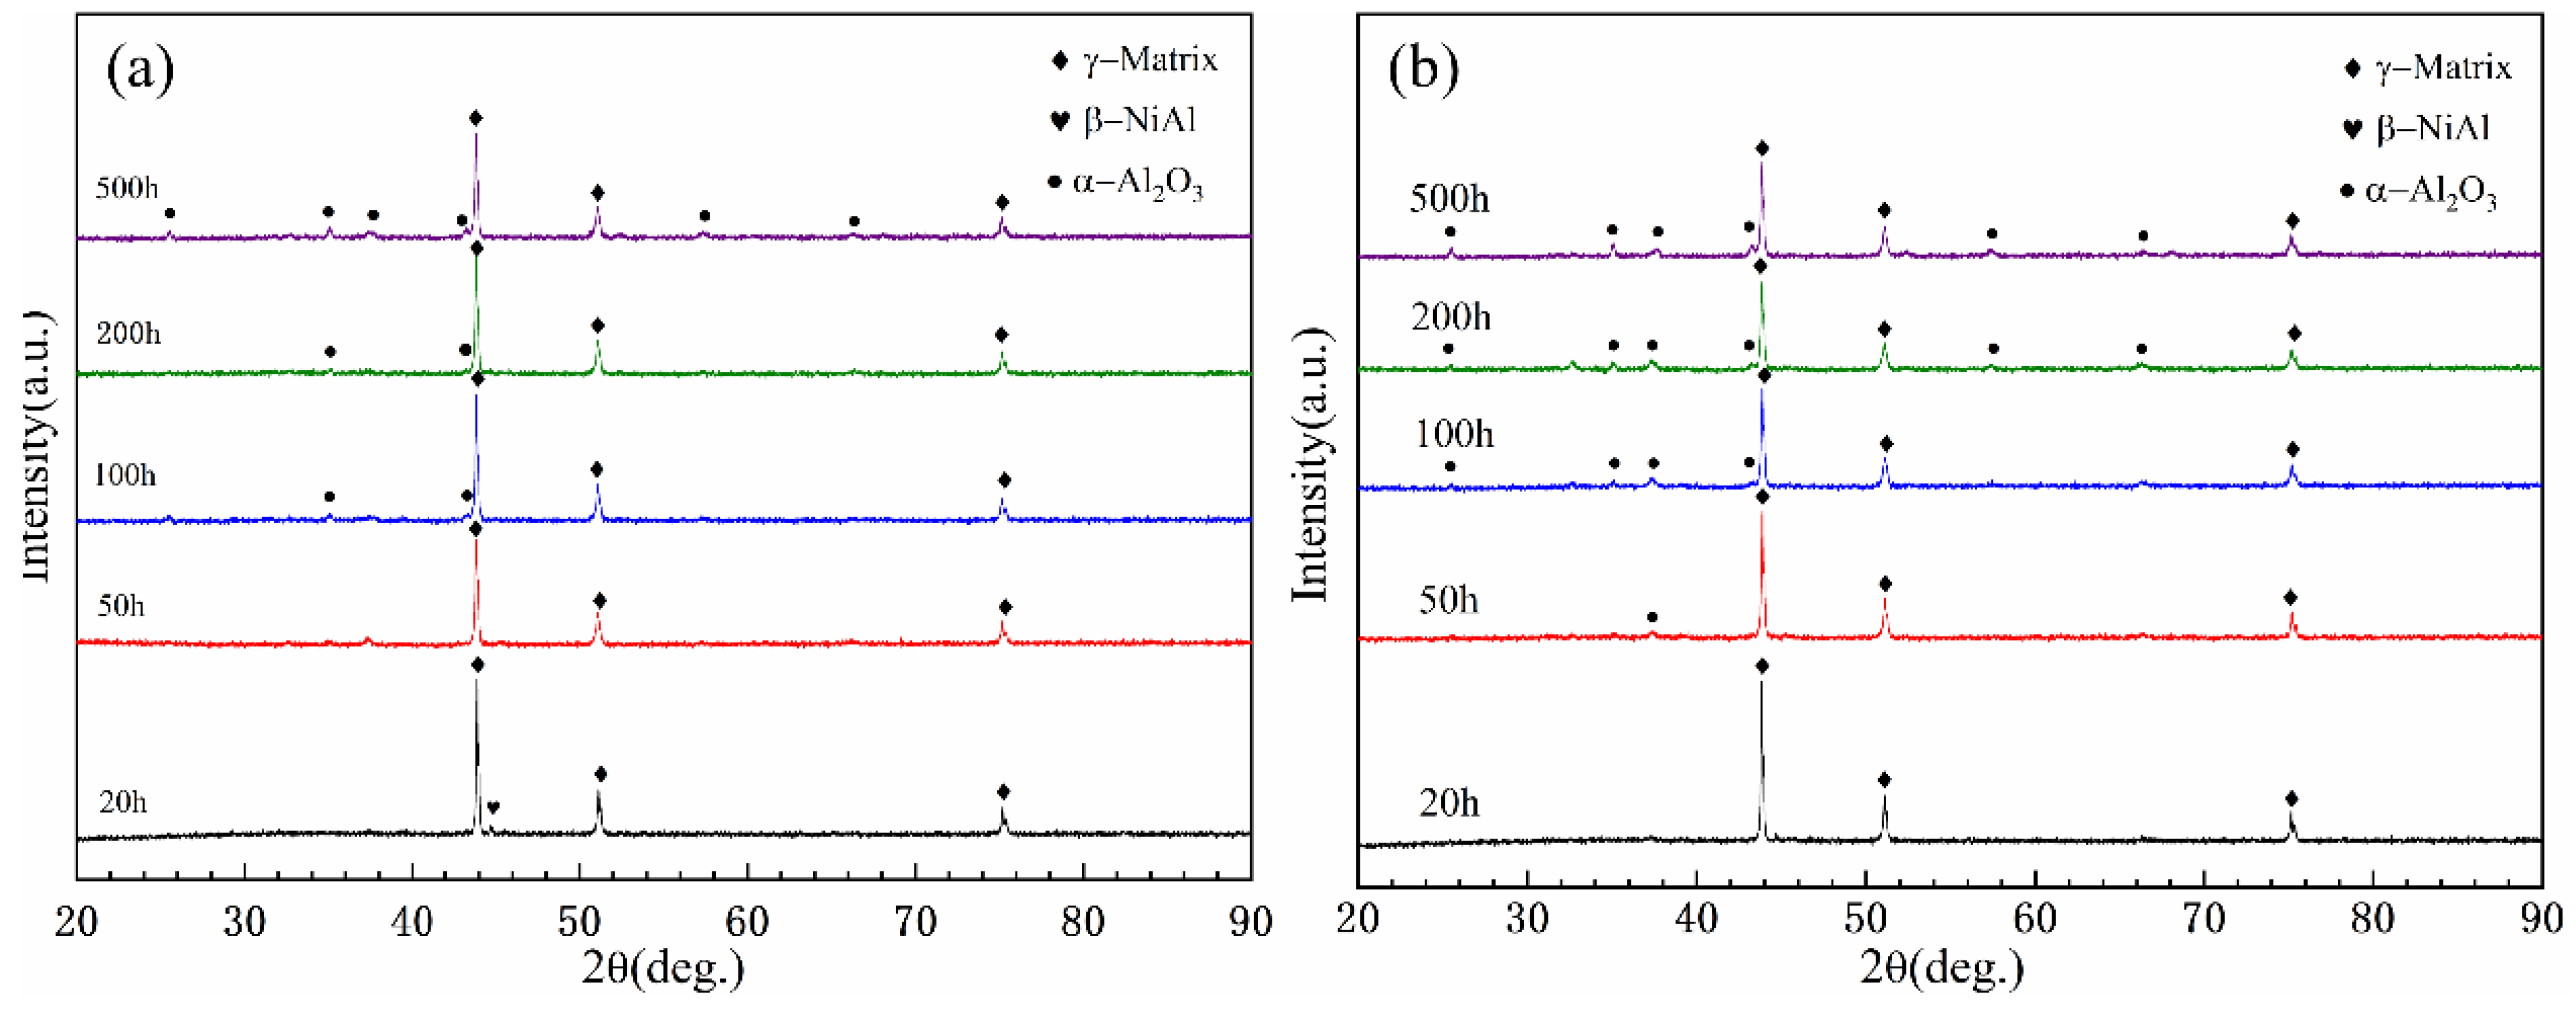
Figure 9 shows the XRD patterns of N
2-sprayed and He-sprayed coatings after oxidation at 900 °C. Similar to the oxidation results at 800 °C, the oxidation products of both coatings can be seen to be primarily α-Al
2O
3 throughout the oxidation process. It can also be seen that no oxidation products were detected in the coating samples at the early stage of oxidation, such as after 20 h of oxidation; both samples showed the detection of the oxide α-Al
2O
3 after 50 h of oxidation, and with an increase in oxidation time, the intensity of the α-Al
2O
3 related peaks also increased in intensity with increasing oxidation time.
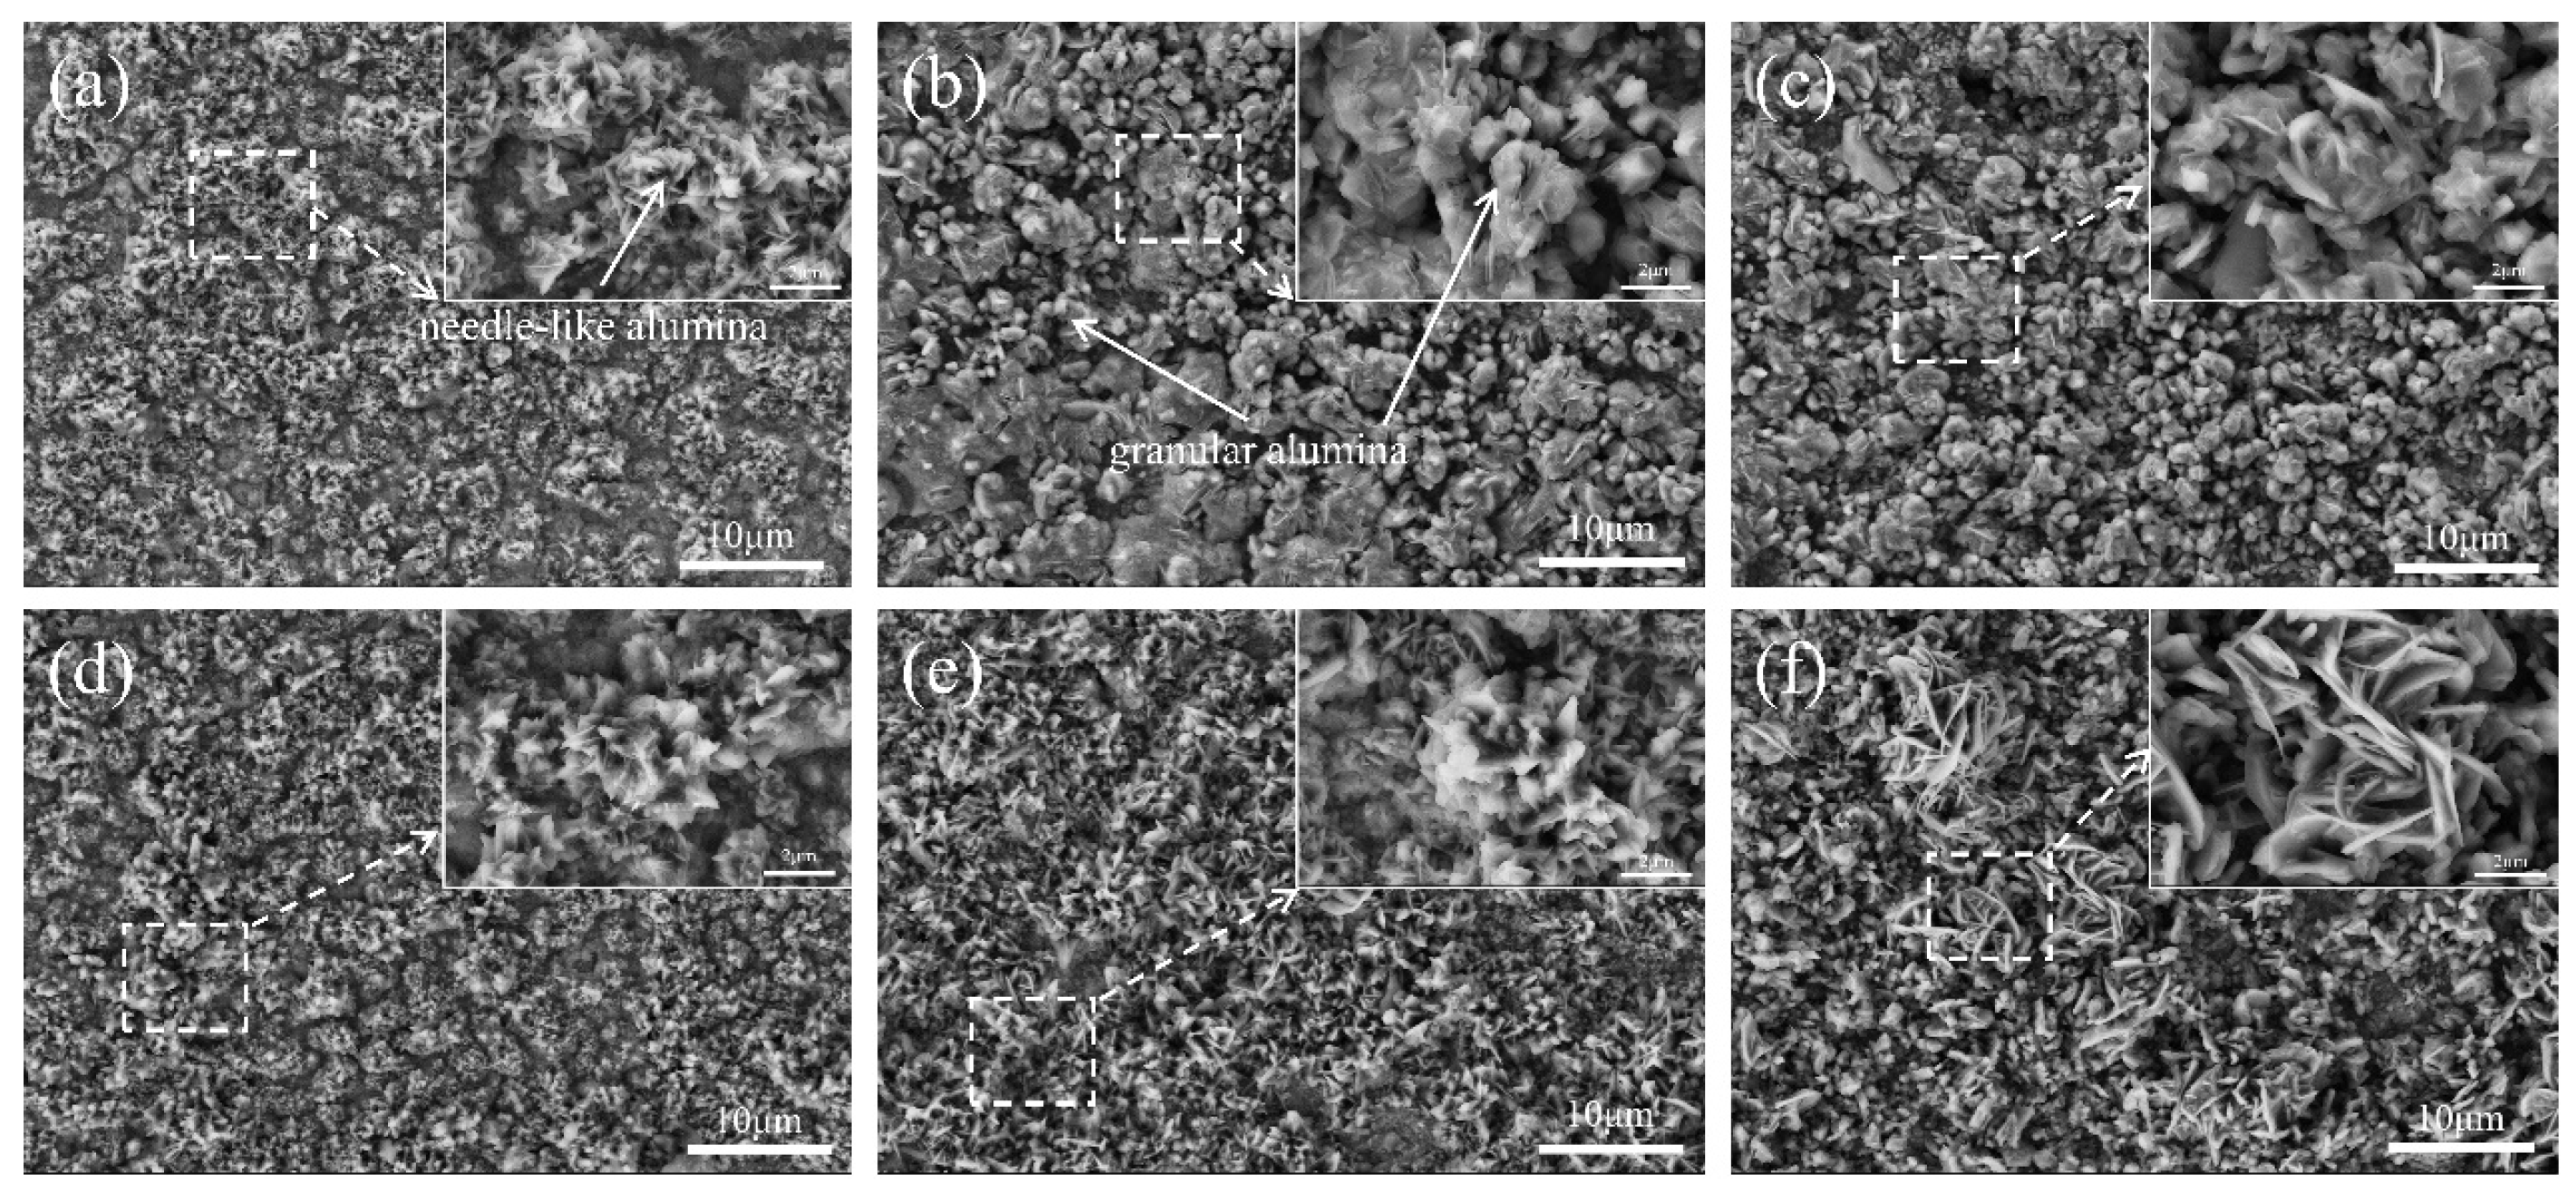
Figure 10 shows the surface morphology of the coating oxidized at 900 °C for 50, 200, and 500 h. It can be observed that after 50 h of oxidation, the surface morphology of the coating changed significantly. Compared with the oxidized surface of the coating at 800 °C under the same oxidation time, the surface morphology differed significantly. From the magnified image, it is evident that there is obvious granular alumina on the surface of the coating in addition to the needle-like alumina. However, upon comparing the same coating at different oxidation times, it can be observed that after 50 h of oxidation (
Figure 10a,d), the surface of the coating is dominated by needle-like alumina, and as the oxidation time increases, oxide particles of this morphology gradually disappear, and the surface of the coating is dominated by granular oxide particles. When the oxidation time reaches 500 h, the coating is almost entirely covered by granular alumina. In contrast, the evolution of the oxide morphology on the coating surface after oxidation of the helium coating is slower than that of the nitrogen coating. It can be seen that after 500 h of oxidation (
Figure 10f), a small amount of whisker-like oxide particles still exist on the coating surface. The transformation from θ-Al
2O
3 to α-Al
2O
3 is also reflected in the different surface morphology change processes.
Figure 11 depicts the cross-sectional morphology of the coating after oxidation at 900 °C. After 500 h of oxidation, the oxide skin on the surface of the coating is well-preserved, and no fracture is observed. However, the oxide layer of the nitrogen coating is thicker and less uniform compared to that of the helium coating. Moreover, small “interfacial oxide pegs” appear at the TGO/coating interface, and since this oxide is at the interface, the characteristic peaks of this oxide are not observed in the XRD spectra. Nevertheless, the results of the EDS analysis indicate that these small white particles are Y
2O
3. In general, these excellent oxide pegs are believed to be beneficial for their adhesion.
Figure 12 shows the XRD spectra of all coatings after oxidation at 1000 °C for various durations. The results reveal that the oxidation products of the helium-sprayed coatings consist mainly of α-Al
2O
3 throughout the entire oxidation process. In contrast, the oxidation products of the nitrogen coating, although mostly α-Al
2O
3, differ from the previous oxidation results at 800 °C and 900 °C in that a small amount of spinel oxide is also present. As seen in
Figure 12a, the diffraction peaks of spinel oxide appear only after 500 h of oxidation, but the low intensity of its characteristic peaks and the absence of other diffraction peaks suggest that the content of this oxide is minimal.
Figure 13 shows the surface morphology of the oxide skin after oxidation at 1000 °C for different lengths of time. It can be observed that the surface of the coating is still an aggregation of various oxide particles. Compared to the results of oxidation at 800 °C and 900 °C, the morphology of the oxide does not change much, but rather, the rate of the oxide morphology change is more rapid. As can be seen in
Figure 13c, the surface of the nitrogen coating is completely covered with granular oxides. However, the magnified image in
Figure 13f shows that there is still a certain amount of needle-like oxide on the surface of the coating. This indicates that the oxidation rate of the helium coating is lower than that of the nitrogen coating.
Figure 14 displays the cross-sectional morphology of the CS CoNiCrAlY coating after oxidation at 1000 °C for 50, 200, and 500 h. It is evident that the thickness of the TGO layer of the coating has increased significantly for the same oxidation time compared to the cross-sectional morphology at 800 °C and 900 °C. At the initial 50 h of oxidation (
Figure 14a,b), the thickness of the oxide layer of the coating is already substantial, and the oxide layer of the coating continues to thicken with increasing oxidation time. There are noticeable white Y
2O
3 particles at the interface between the oxide layer and the coating, which greatly affect the adhesion of the oxide layer.
3.3. Oxidation Kinetics
The thickness of the oxide film was measured by cross-sectional SEM micrographs of the oxidized samples to assess the overall oxide growth rate.
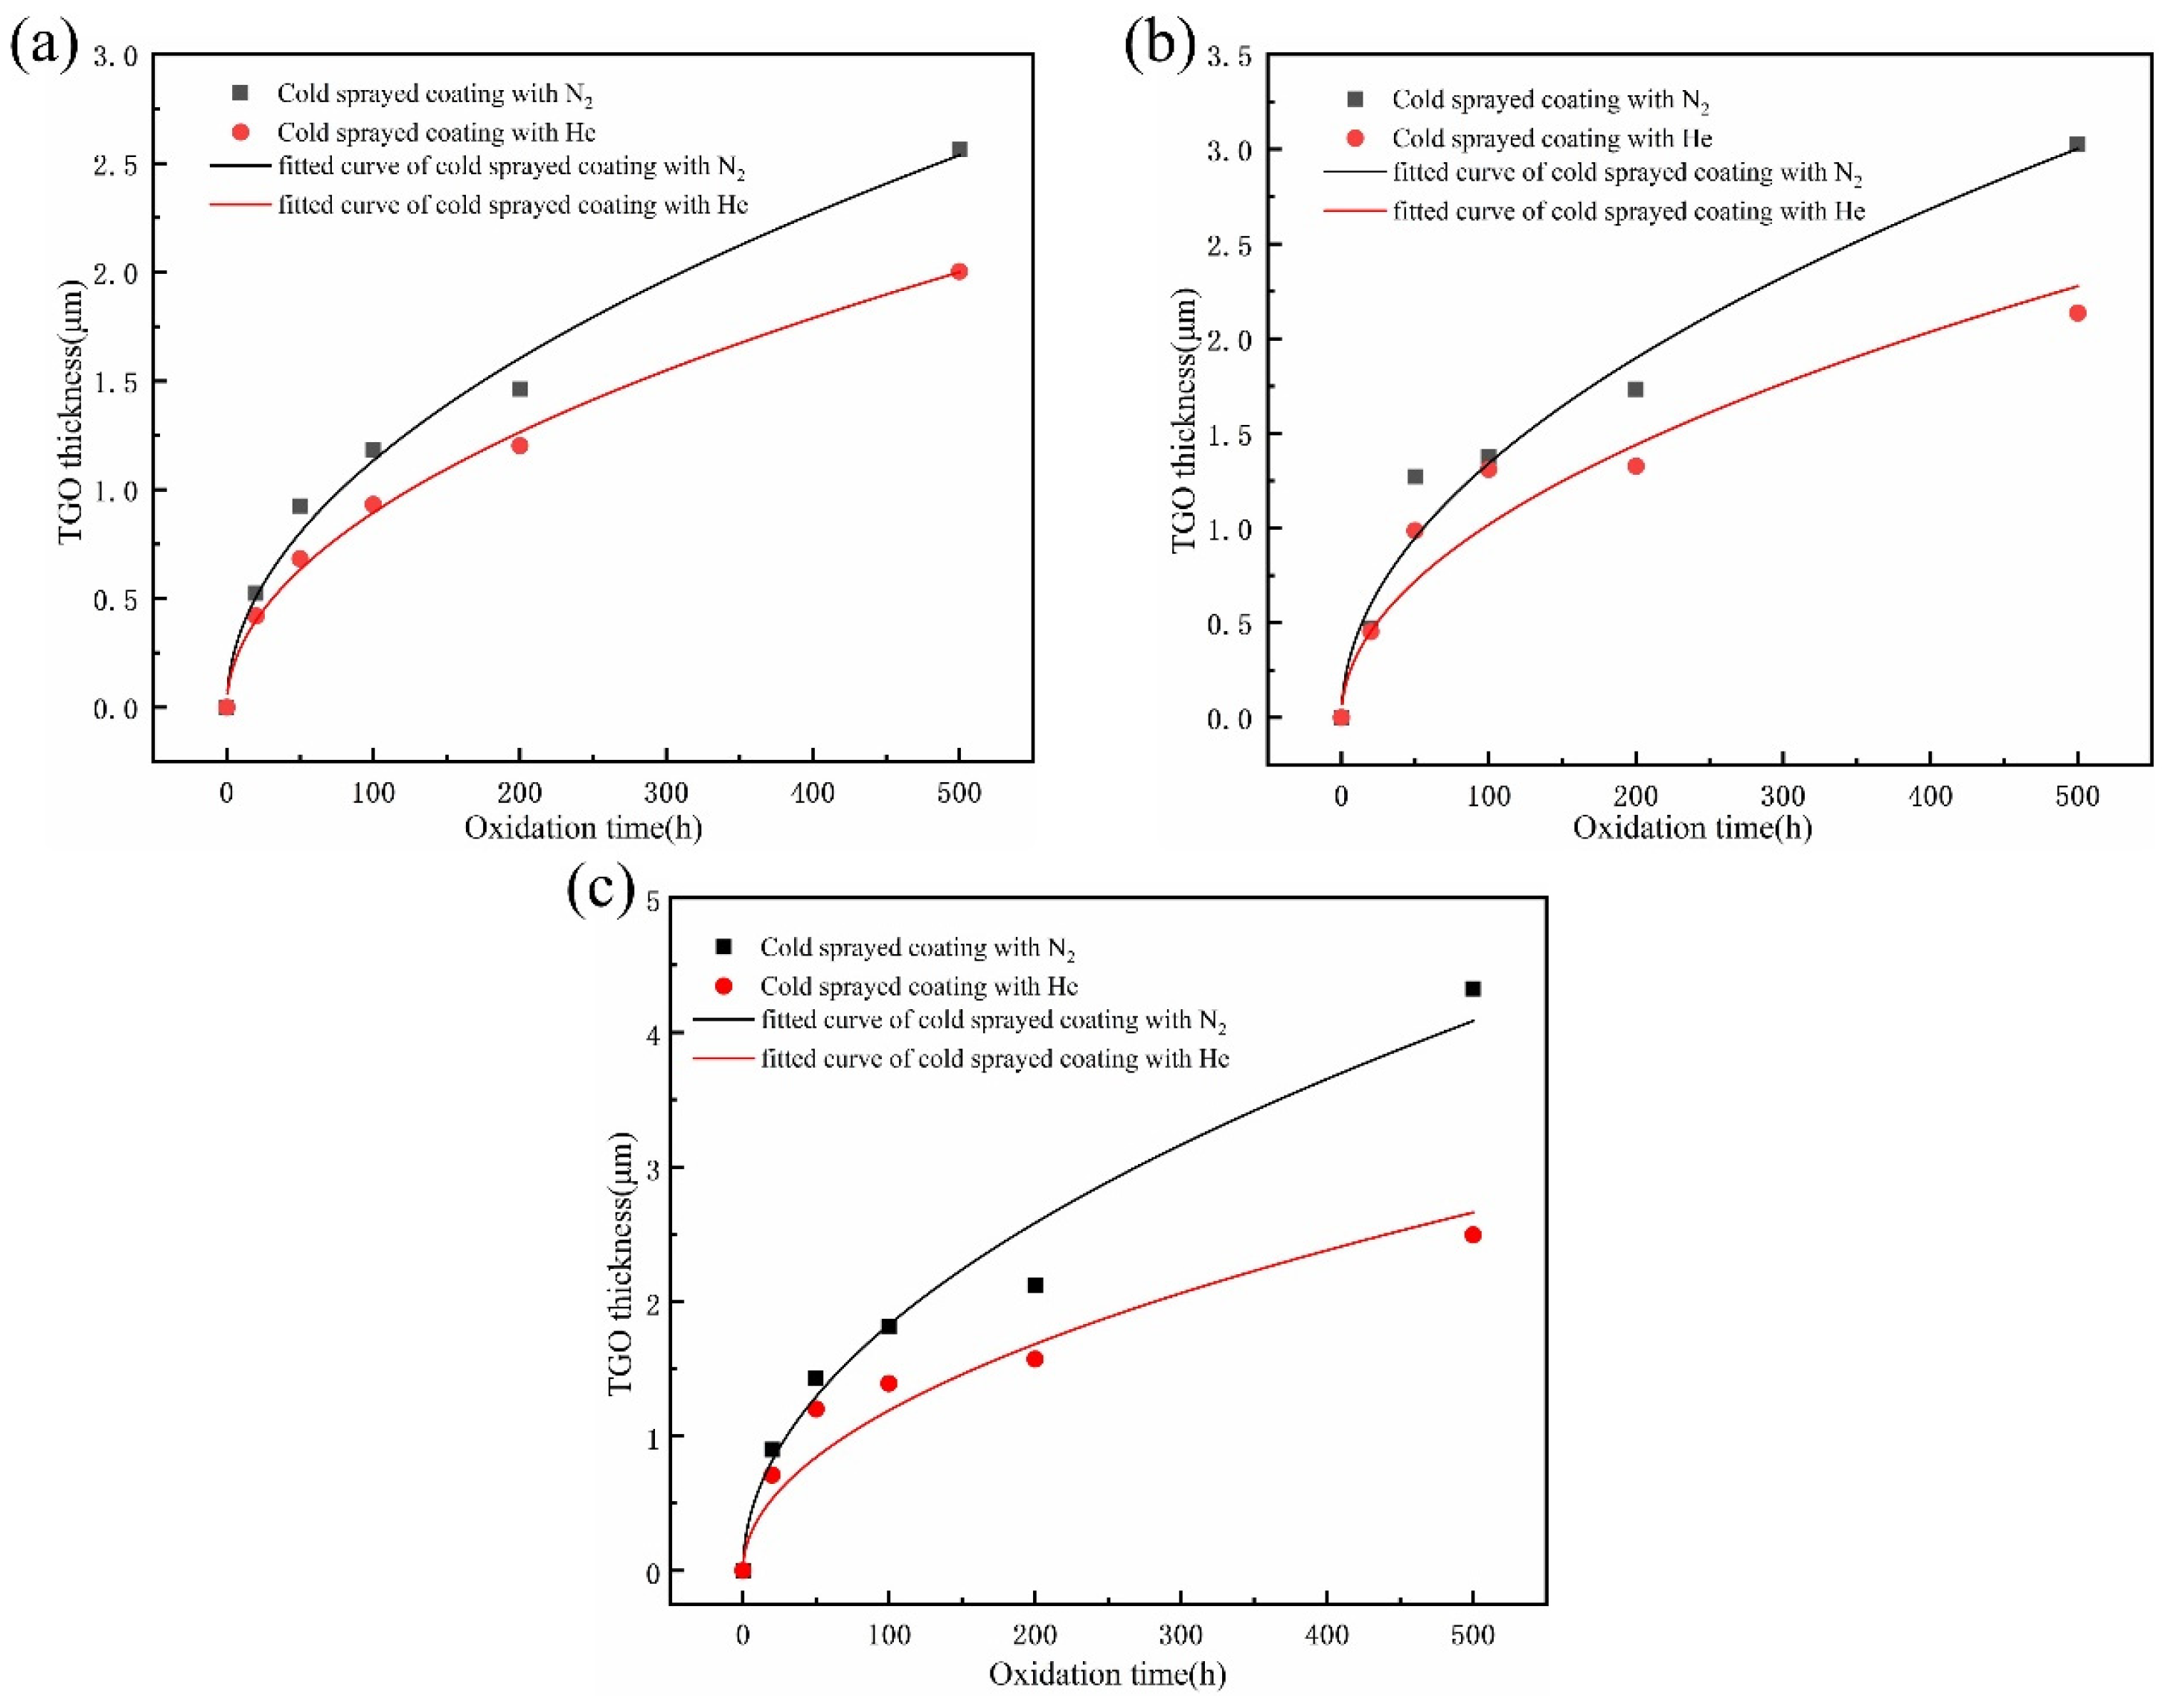
Figure 15 shows the fitted curves of TGO thickness with increasing oxidation time versus oxide film for both coatings at 800 °C, 900 °C, and 1000 °C. It can be found that the thickness of the coating oxide film satisfies the parabolic relationship with time according to Wagner’s theory [
30], that is, the square of the oxide film thickness y (μm) is inversely proportional to the time t (hour) as shown in formula (1).
where
kp is the parabolic velocity coefficient and
C is a constant.
The oxidation behavior of the two coatings at different temperatures is similar, and the increase in the thickness of the oxide film is approximately parabolic with time.
Figure 11a–c show the results of TGO thickness gain for both coatings during oxidation at 800 °C, 900 °C, and 1000 °C, respectively. When integrated with the results of curve fitting, the TGO thickness curves can be viewed as having two stages: (1) at the early stage of oxidation, the oxidation rate is high in the first 50 h of oxidation, and both coatings are in the fast oxidation stage; and (2) at the middle and late stages of oxidation, their growth rate decreases significantly and they are in the slow oxidation stage. This phenomenon is due to the formation of alumina as a protective oxide, which prevents further reactions of oxygen and thus reduces the overall oxidation rate.
In the case of oxidation at 800 °C, as shown in
Figure 11a, the oxide film thickness of the N
2-sprayed coating after 500 h oxidation is 2.6 μm, while that of the He-sprayed coating is 2.0 μm. Thus, it is indicated that the He-sprayed coating has a lower oxidation growth rate. At 900 °C, as shown in
Figure 11b, the oxide films thicken in the order of the He-sprayed coating and the N
2-sprayed coating, and their final thicknesses after 500 h are 2.13 μm and 3.03 μm, respectively. During isothermal oxidation at 1000 °C, as shown in
Figure 11c, the He-sprayed coating has the smallest increase in film thickness of about 2.5 μm, while the oxide film thickness of the N
2-sprayed coating reaches approximately 4.32 μm. In summary, the oxide film thickness of the same coating increases significantly with increasing temperature, and the oxide growth rate of the helium-sprayed coating is consistently lower than that of the nitrogen-sprayed coating at different temperature conditions, as can be seen from the coatings prepared with different parameters. This suggests that helium-sprayed CoNiCrAlY coatings can provide better oxidation performance. For this scenario, the differences in microstructure and grain size of the cold-sprayed CoNiCrAlY coatings with different preparation parameters contribute to the different oxidation behavior. These will be discussed further in the following sections.
First, the microstructure of the coatings shows a more significant difference in porosity between the two coatings, and in general, the coating porosity is more significant for the mass gain, as it represents the additional surface area where oxidation occurs. P. Richer et al. [
12] also experimentally verified that the coating oxide growth rate increases significantly with increasing porosity. As shown in
Figure 2, the difference in oxidation behavior becomes significant as the helium-sprayed coating is extremely dense and almost porosity-free (no porosity), while the nitrogen coating has a relatively large number of pores. Secondly, the grain size of the coating also has a specific effect on the oxidation process. Considering that the oxidation of CoNiCrAlY coatings is the diffusion of Al elements to the coating surface in combination with oxygen, the diffusion rate affects the oxidation growth; whereas the previous EBSD demonstrates that helium coatings have smaller grain size, this smaller grain size and more grain boundaries, which slows down the diffusion rate of Al elements and ultimately the oxidation rate of the coating. In summary, the low porosity and smaller grain size of the helium coating both ensure better oxidation resistance.
3.4. Oxidation Mechanisms
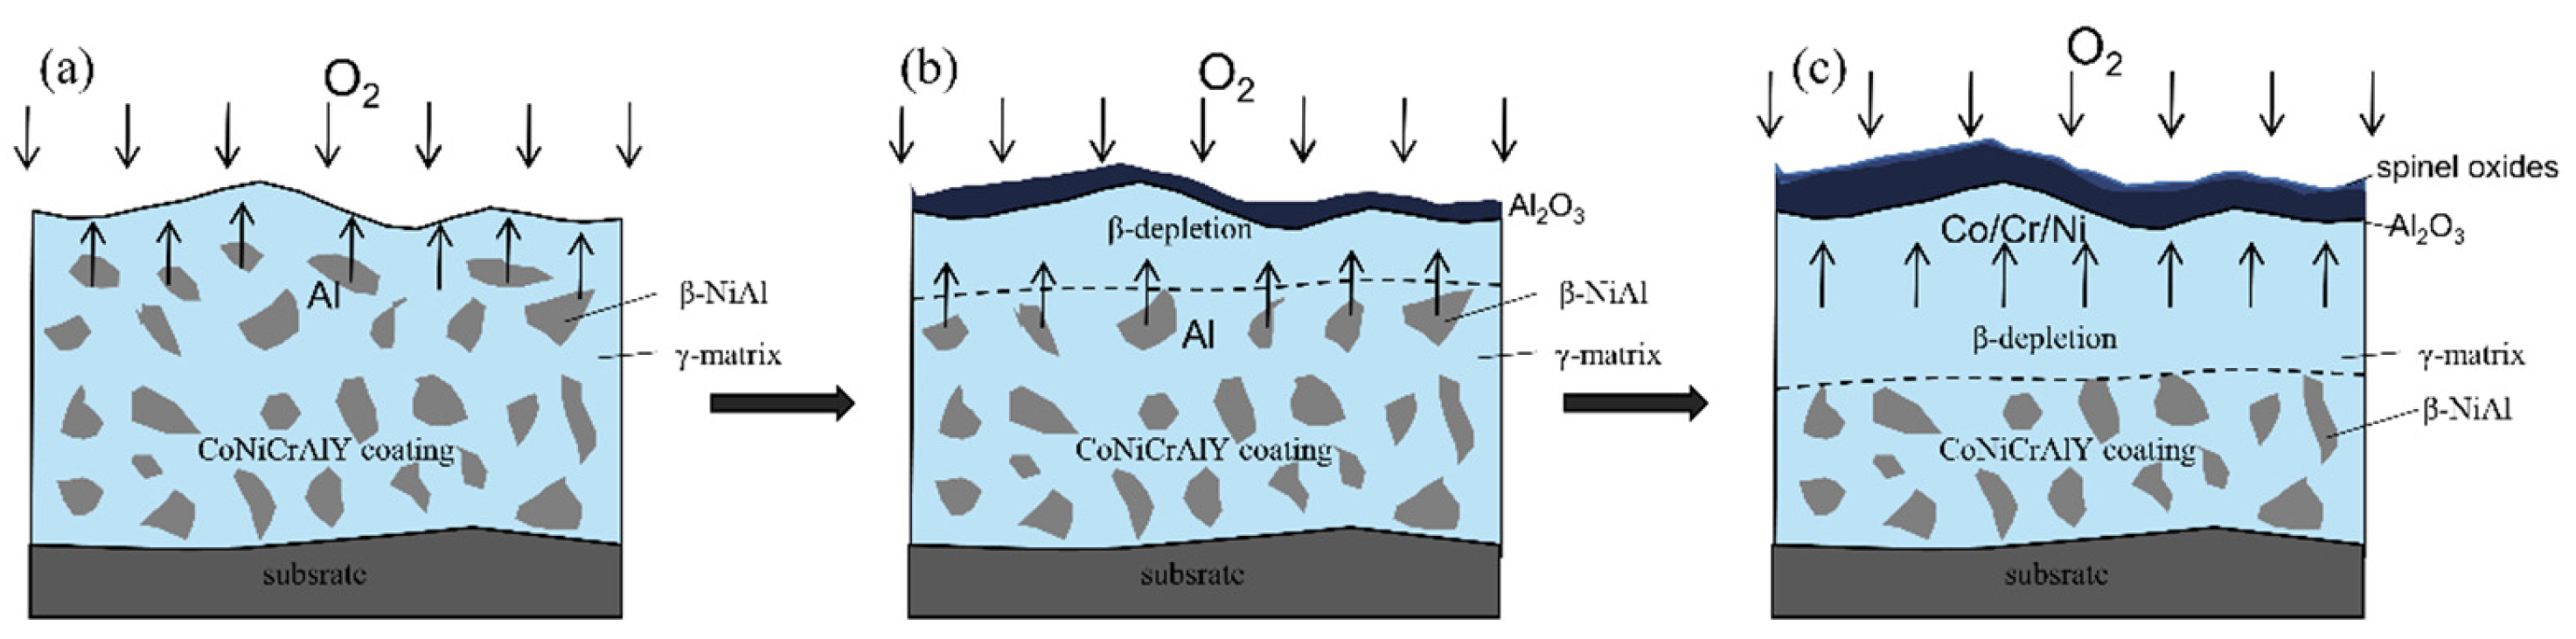
Figure 16 shows a schematic diagram of the oxidation process of the cold-sprayed CoNiCrAlY coating. It can be clearly seen in the figure (
Figure 5b,e) that the coating is a state where the β-NiAl phase is uniformly distributed in the γ phase, and the Al-rich β-phase as an aluminum reservoir is the core region where oxidation occurs.
As shown in
Figure 16a, among all the elements of the coating (Co, Ni, Cr, Al), the Gibbs generation free energy of aluminum oxide generated from aluminum is the lowest and the minimum oxygen partial pressure required is also the lowest [
31,
32], so the Al element in the coating will quickly diffuse to the surface of the coating and combine with oxygen to form a dense layer of aluminum oxide on the surface (
Figure 16b). At the same time, as shown in
Figure 16b, the inner surface of the coating will drop sharply in a short period of time due to the diffusion of Al to the extent that an Al-depletion zone appears, while the Al below the Al-depletion layer will continue to diffuse to maintain the Al concentration on the inner surface of the coating. It is known that this dense, continuous TGO layer acts as a protective oxide to inhibit further oxidation of the coating, and, therefore, the Al consumption rate decreases with time. This process corresponds to the second stage of the oxidation process discussed earlier, which is the (mid-oxidation stage) slow oxidation stage. After a long period of oxidation, as shown in
Figure 16c (third stage), the growth of the TGO layer leads to a reduction in Al elements on the inner surface of the coating, a significant increase in the thickness of the Al-depletion layer of the coating, and an increase in the diffusion path of Al elements in the coating, while the formation of the aluminum oxide film causes the TGO/coating interface, and, therefore, the growth rate of alumina decreases. The oxidation model diagram can also explain why the oxidation growth process of the coating follows a parabolic law (
Figure 15). In addition, according to the periodic table of elements, Cr, Ni, and Co have similar atomic radii as Al elements (Cr: 1.85 Ǻ; Ni: 1.62 Ǻ; Co: 1.67 Ǻ; Al: 1.82 Ǻ), especially Cr
3+ and Al
3+ have the same valence bond, making Cr
2O
3 and Al
2O
3 almost miscible at high temperatures, thus leading to Ni, Cr, and Co elements to be able to diffuse outward in the grain boundaries of the Al
2O
3 film at high temperatures. The final observation of the oxidation model (
Figure 16c) shows that the thickness of the Al-depletion layer in the coating is so large that it cannot maintain a suitable aluminum concentration by diffusion, resulting in an extremely low growth rate of the alumina film and almost no increase in thickness; however, elements such as Cr, Ni, and Co can continue to diffuse, and when the oxidation time is sufficient, a large amount of Cr, Ni, and Co will diffuse to the surface of the alumina film, and a mixture of NiO, Cr
2O
3, and some spinel oxides will be formed on the surface under the high oxygen partial pressure environment, such as NiCr
2O
4, NiAl
2O
4, CoAl
2O
4, CoCr
2O
4, and NiCo
2O
4, or an alternative solid solution of (Ni, Co)(Al, Cr)
2O
4, will be formed on the surface [
33]. At this time, Cr, Ni, and Co oxides distinguished from alumina can be observed on the surface, and this phenomenon was verified in the oxidation study at 1000 °C. The XRD results after 500 h of oxidation (
Figure 12) indicate the presence of diffraction peaks of spinel oxides, while at 800 °C and 900 °C, due to the lower temperatures, the oxides still have not reached this stage after 500 h of oxidation.


