Article

Enhanced Corrosion Protection of Copper Using Nitrogen-Doped Graphene Coatings Synthesized by Chemical Vapor Deposition

by
Zhasulan Nakysbekov
1,2,
Bauyrzhan Zhumadilov
1,2,
Gulmaira Partizan
1,2,3,*,
Botagoz Medyanova
2,3,
Daniyar Ismailov
1,4,
Valentina Grichshenko
1,
Dinara Akhmetsadyk
1,
Bakhodir Aliyev
5 and
Laura Mustafa
3
1
LLP “Institute of Ionosphere”, Almaty 050020, Kazakhstan
2
National Nanotechnology Laboratory of Open Type, Al-Farabi Kazakh National University, Almaty 050040, Kazakhstan
3
JSC “National Center of Space Research and Technology”, Almaty 050010, Kazakhstan
4
National Scientific Laboratory for Collective Use of Information and Space Technologies, Satbayev University, Almaty 050013, Kazakhstan
5
Faculty of Engineering and Information Technology, Almaty Technological University, Almaty 050012, Kazakhstan
*
Author to whom correspondence should be addressed.
Coatings 2025, 15(11), 1345; https://doi.org/10.3390/coatings15111345
Submission received: 10 September 2025 / Revised: 4 November 2025 / Accepted: 14 November 2025 / Published: 19 November 2025
(This article belongs to the Section Corrosion, Wear and Erosion)

Abstract

In this study, nitrogen-doped graphene (NG) films were synthesized on copper foil sur-faces by chemical vapor deposition (CVD), and their anti-corrosion properties were comprehensively investigated. Scanning electron microscopy (SEM) and energy-dispersive X-ray spectroscopy (EDX) results showed that the graphene layer was uniformly formed and nitrogen atoms were successfully incorporated. Raman spectroscopy revealed that the sample obtained on a 30 μm thick copper foil had a high structural quality (low ID/IG value). Electrochemical measurements showed that the NG coatings significantly reduced the corrosion current density and rate compared to pure copper. In short-term tests, the highest inhibition efficiency (91.5%) was observed for the sample synthesized on a 200 μm thick copper foil. In long-term (up to 2 months) seawater immersion tests, the inhibition efficiency decreased slightly over time, but the NG coatings showed much higher anti-corrosion properties than pure copper at all times. Overall results proved that nitrogen-doped graphene is a potential material in protecting metals from long-term corrosion, not only in seawater but also in harsh environments.

1. Introduction

Corrosion is a process of metal degradation caused by environmental factors such as humidity, oxygen, and electrolytes. It adversely affects the structure of metals, reduces their strength and operational efficiency, shortens the service life of infrastructure and technical devices, and leads to significant economic losses and safety risks in industry [1]. Beyond electrochemical degradation, erosion-corrosion in fluid environments (e.g., water systems [2,3]) underscores the need for robust 2D barriers like NG. Therefore, the search for effective methods to mitigate the consequences of corrosion has become the subject of interdisciplinary research, bringing together specialists in materials science, chemistry, chemical engineering, physics, and metallurgy [4].
Graphene is a two-dimensional (2D) nanomaterial composed of sp2-hybridized carbon atoms arranged in a honeycomb-like structure. Its unique architecture provides graphene with high mechanical strength, excellent thermal conductivity, and gas impermeability. These properties make it a promising material for use as a protective coating for metallic surfaces against corrosion [5,6].
However, layers of pure graphene provide only short-term protection. Due to its semi-metallic conductivity, galvanic interactions gradually occur between the metal and graphene: graphene acts as a cathode, while the metal serves as an anode. This process intensifies localized corrosion reactions on the metal surface. Such effects are particularly common in active metals such as copper (Cu), nickel (Ni), and iron (Fe). As a result, corrosion develops beneath the graphene layer, reducing its initial protective efficiency [7,8,9].
Although the high electrical conductivity of graphene is one of its key advantages, this very property limits its application as an anticorrosion coating. The free movement of electrons leads to the formation of galvanic cells, making pristine graphene ineffective for long-term corrosion protection. To address this issue, current research focuses on enhancing the corrosion resistance of graphene by tailoring its electronic properties. In particular, the incorporation of heteroatoms (boron, nitrogen, sulfur) into the graphene lattice imparts semiconducting or even insulating characteristics. Moreover, modified forms such as graphene oxide (GO) demonstrate enhanced corrosion resistance [10,11,12,13,14,15,16,17]. Thus, improving the anticorrosion performance of graphene through modification of its intrinsic structure represents one of the pressing directions in modern materials science.
At present, chemical vapor deposition (CVD) is widely regarded as one of the most effective methods for graphene synthesis [18,19,20,21]. In this process, methane (CH4) and ammonia (NH3) are typically used as carbon and nitrogen sources, respectively [12,22,23,24].
Distinct from earlier N-doped graphene studies that mainly addressed short-term corrosion or fixed-substrate behavior, the present work introduces a tunable approach by varying Cu foil thickness (30–200 µm) to control defect density and adhesion. This strategy enables 91.5% inhibition efficiency and sustained protection above 75% in seawater for two months, highlighting long-term stability under harsh conditions. Recent advances in surface engineering and heteroatom-modified coatings [24,25] emphasize that controlled defect formation and dopant incorporation can fundamentally alter the electronic and protective behavior of materials. Building on these insights, the proposed scalable CVD synthesis using N2 as a cost-effective dopant source provides tunable electronic structures for durable corrosion resistance without complex post-treatments.

2. Materials and Methods

2.1. Catalyst Preparation

Copper foils with thicknesses of 200, 50, and 30 µm, an area of 1 cm2, and a purity of 99.99% were used as substrates and catalysts for the synthesis of nitrogen-doped graphene (NG). All syntheses are performed in triplicate, yielding consistent NG coverage (SEM uniformity variation < 5% across runs), confirming high reproducibility. Prior to use, the substrates underwent chemical cleaning. The treatment was carried out in a solution consisting of a mixture of NH4OH, H2O2, and distilled water in a volume ratio of 1:1:6, at a temperature of 50 °C for 15 min, using ultrasonic waves at a frequency of 850 kHz and a power of 250 W. This was followed by rinsing with distilled water and drying.

2.2. Synthesis of N-Doped Graphene (NG)

The synthesis of NG nanostructures was carried out in a horizontal three-zone tube furnace [22]. The overall schematic of the synthesis process is shown in Figure 1.
First, the copper foils were placed in the center of a quartz tube, and the vacuum was pumped down to a pressure of 10−2 ± 0.1 Torr. Then, the reactor was heated to 1000 ± 5 °C under a flow of H2 for 100 ± 5 min. Once the temperature of 1000 C was reached, the copper foil was annealed without changing the H2 flow rate for 10 ± 1 min.
After annealing, a gas mixture of CH4/H2/N2 (30/20/300 ± 5 sccm) was introduced to grow NG on the copper foil. Although N2 is thermodynamically stable and less reactive than NH3, efficient N-doping can still be achieved under specific CVD conditions. At elevated temperatures (typically above 700 °C) and in the presence of hydrogen and a carbon precursor, partial dissociation of N2 can occur, especially when catalytic or defect-assisted activation sites are available. Transition metals (e.g., Fe, Ni, or Cu) and defect-rich carbon surfaces can promote the dissociation of molecular nitrogen into atomic or radical nitrogen species. These active nitrogen species can then incorporate into the growing carbon network, forming pyridinic, pyrrolic, or graphitic N configurations [1]. Moreover, in hydrogen-rich environments, H2 assists in weakening the N≡N bond via catalytic surface reactions or by generating reactive intermediates (such as NHx species when trace impurities are present), which further enhances nitrogen incorporation. Therefore, N2 can also serve as an effective dopant precursor under optimized conditions involving high temperature, catalytic substrates, and hydrogen assistance. Nitrogen gas (N2) is used as the nitrogen source for its abundance, cost-effectiveness, and compatibility with the high-temperature H2 carrier gas environment, where partial dissociation occurs via interactions with hot Cu surfaces [22]. This yields ~3 at.% substitutional N (vs. <1% physisorbed in controls without N2), per EDX/Raman synergy. Upon completion of the synthesis, the furnace heating was turned off, and the system was allowed to cool naturally under a flow of H2/N2. The duration of the experiment was 10 ± 1 min.

2.3. Characterization of NG-Coated Cu

The obtained samples were analyzed using scanning electron microscopy (SEM, JEOL Ltd., Tokyo, Japan) for visualizing the microstructure, energy-dispersive X-ray spectroscopy (EDS, JED-2300 Analysis Station, JOEL Ltd., Freising, Germany) for elemental composition analysis, and Raman spectroscopy (RS) for studying molecular and structural characteristics at the nanoscale using the NT-MDT NTegra Spectra spectrometer (Zelenograd, Moscow, Russia) (laser emission wavelength λ = 473 nm). X-ray photoelectron spectroscopy (XPS) analysis was carried out using an ESCALAB 250 spectrometer (Thermo VG Corporation, Waltham, MA, USA). All characterizations are from triplicate syntheses, with <5% variation in EDX N-content (2–5 at.%) and Raman peak ratios (SD < 0.05).

2.4. Electrochemical Measurements

Electrochemical corrosion measurements of the samples are performed using a P-40X Potentiostat/Galvanostat at room temperature (22 ± 2 °C). Measurements are carried out in a three-electrode cell with 5% NaCl aqueous solution (50 g/L NaCl in distilled water, adjusted to pH 7.5 with NaOH/HCl, simulating seawater per ASTM D1141). Pure copper foil (with a thickness of 30, 50 and 200 µm), copper with a graphene coating (undoped control), and copper with nitrogen-doped graphene coating (NG) are used as working electrodes (area: 1 cm2). The Ag/AgCl electrode (saturated KCl) and platinum wire electrode (area: ~2 cm2) are used as the reference and auxiliary electrodes, respectively. Potentiodynamic polarization is performed in the voltage range from −450 mV to 290 mV at a constant scan rate of 0.5 mV/s.
Although a 0.5 mV/s scan rate is adopted, no substantial distortions in the polarization curves are verified [23]. Additionally, no deleterious effect is verified when polarization parameters are achieved, as previously reported [23,26]. However, it is worth noting that potential scan rate has an important role in order to minimize the effects of distortion in Tafel slopes and corrosion current density analyses, as also previously reported [23,26]. Tafel extrapolation involves linear fitting of anodic/cathodic regions to determine icorr and Ecorr [23,27].
All electrochemical parameters are derived from triplicate runs via Tafel fits (OriginPro software 9.1), with tables reflecting mean ± SD and direct graph correspondence. Undoped graphene controls (synthesized identically sans N2) are included to isolate N-doping effects.
Using Tafel analysis, the corrosion rate of various metals can be measured, and the role of graphene in the corrosion reactions between graphene and metal substrates can be understood [28]. Thus, the kinetic parameter of the reaction can be determined by constructing a current-voltage curve [29,30].
From the Tafel slopes, the corrosion potential ( E c o r r ) and current density ( i c o r r ) of the samples can be determined. The corrosion rate ( R c o r r ) is determined using the following formula:
R c o r r   =   i c o r r     k     W e q u ρ     A
where k is the corrosion rate constant (3272 mm/year), W e q u is the equivalent weight (31.773 g/eq for copper), ρ is the density (8.96 g/cm3), and A is the sample area (1 cm2).
The corrosion current densities of the synthesized NG samples are determined by extrapolating the linear regions of the cathodic and anodic polarization curves.
The inhibition efficiency ( I E % ) is calculated using Equation (1):
I E %   =   i c o r r 0     i c o r r i c o r r 0     100 %
where i c o r r 0 and i c o r r represent the corrosion current densities without and with the presence of the corrosion inhibitor, respectively.

3. Results and Discussion

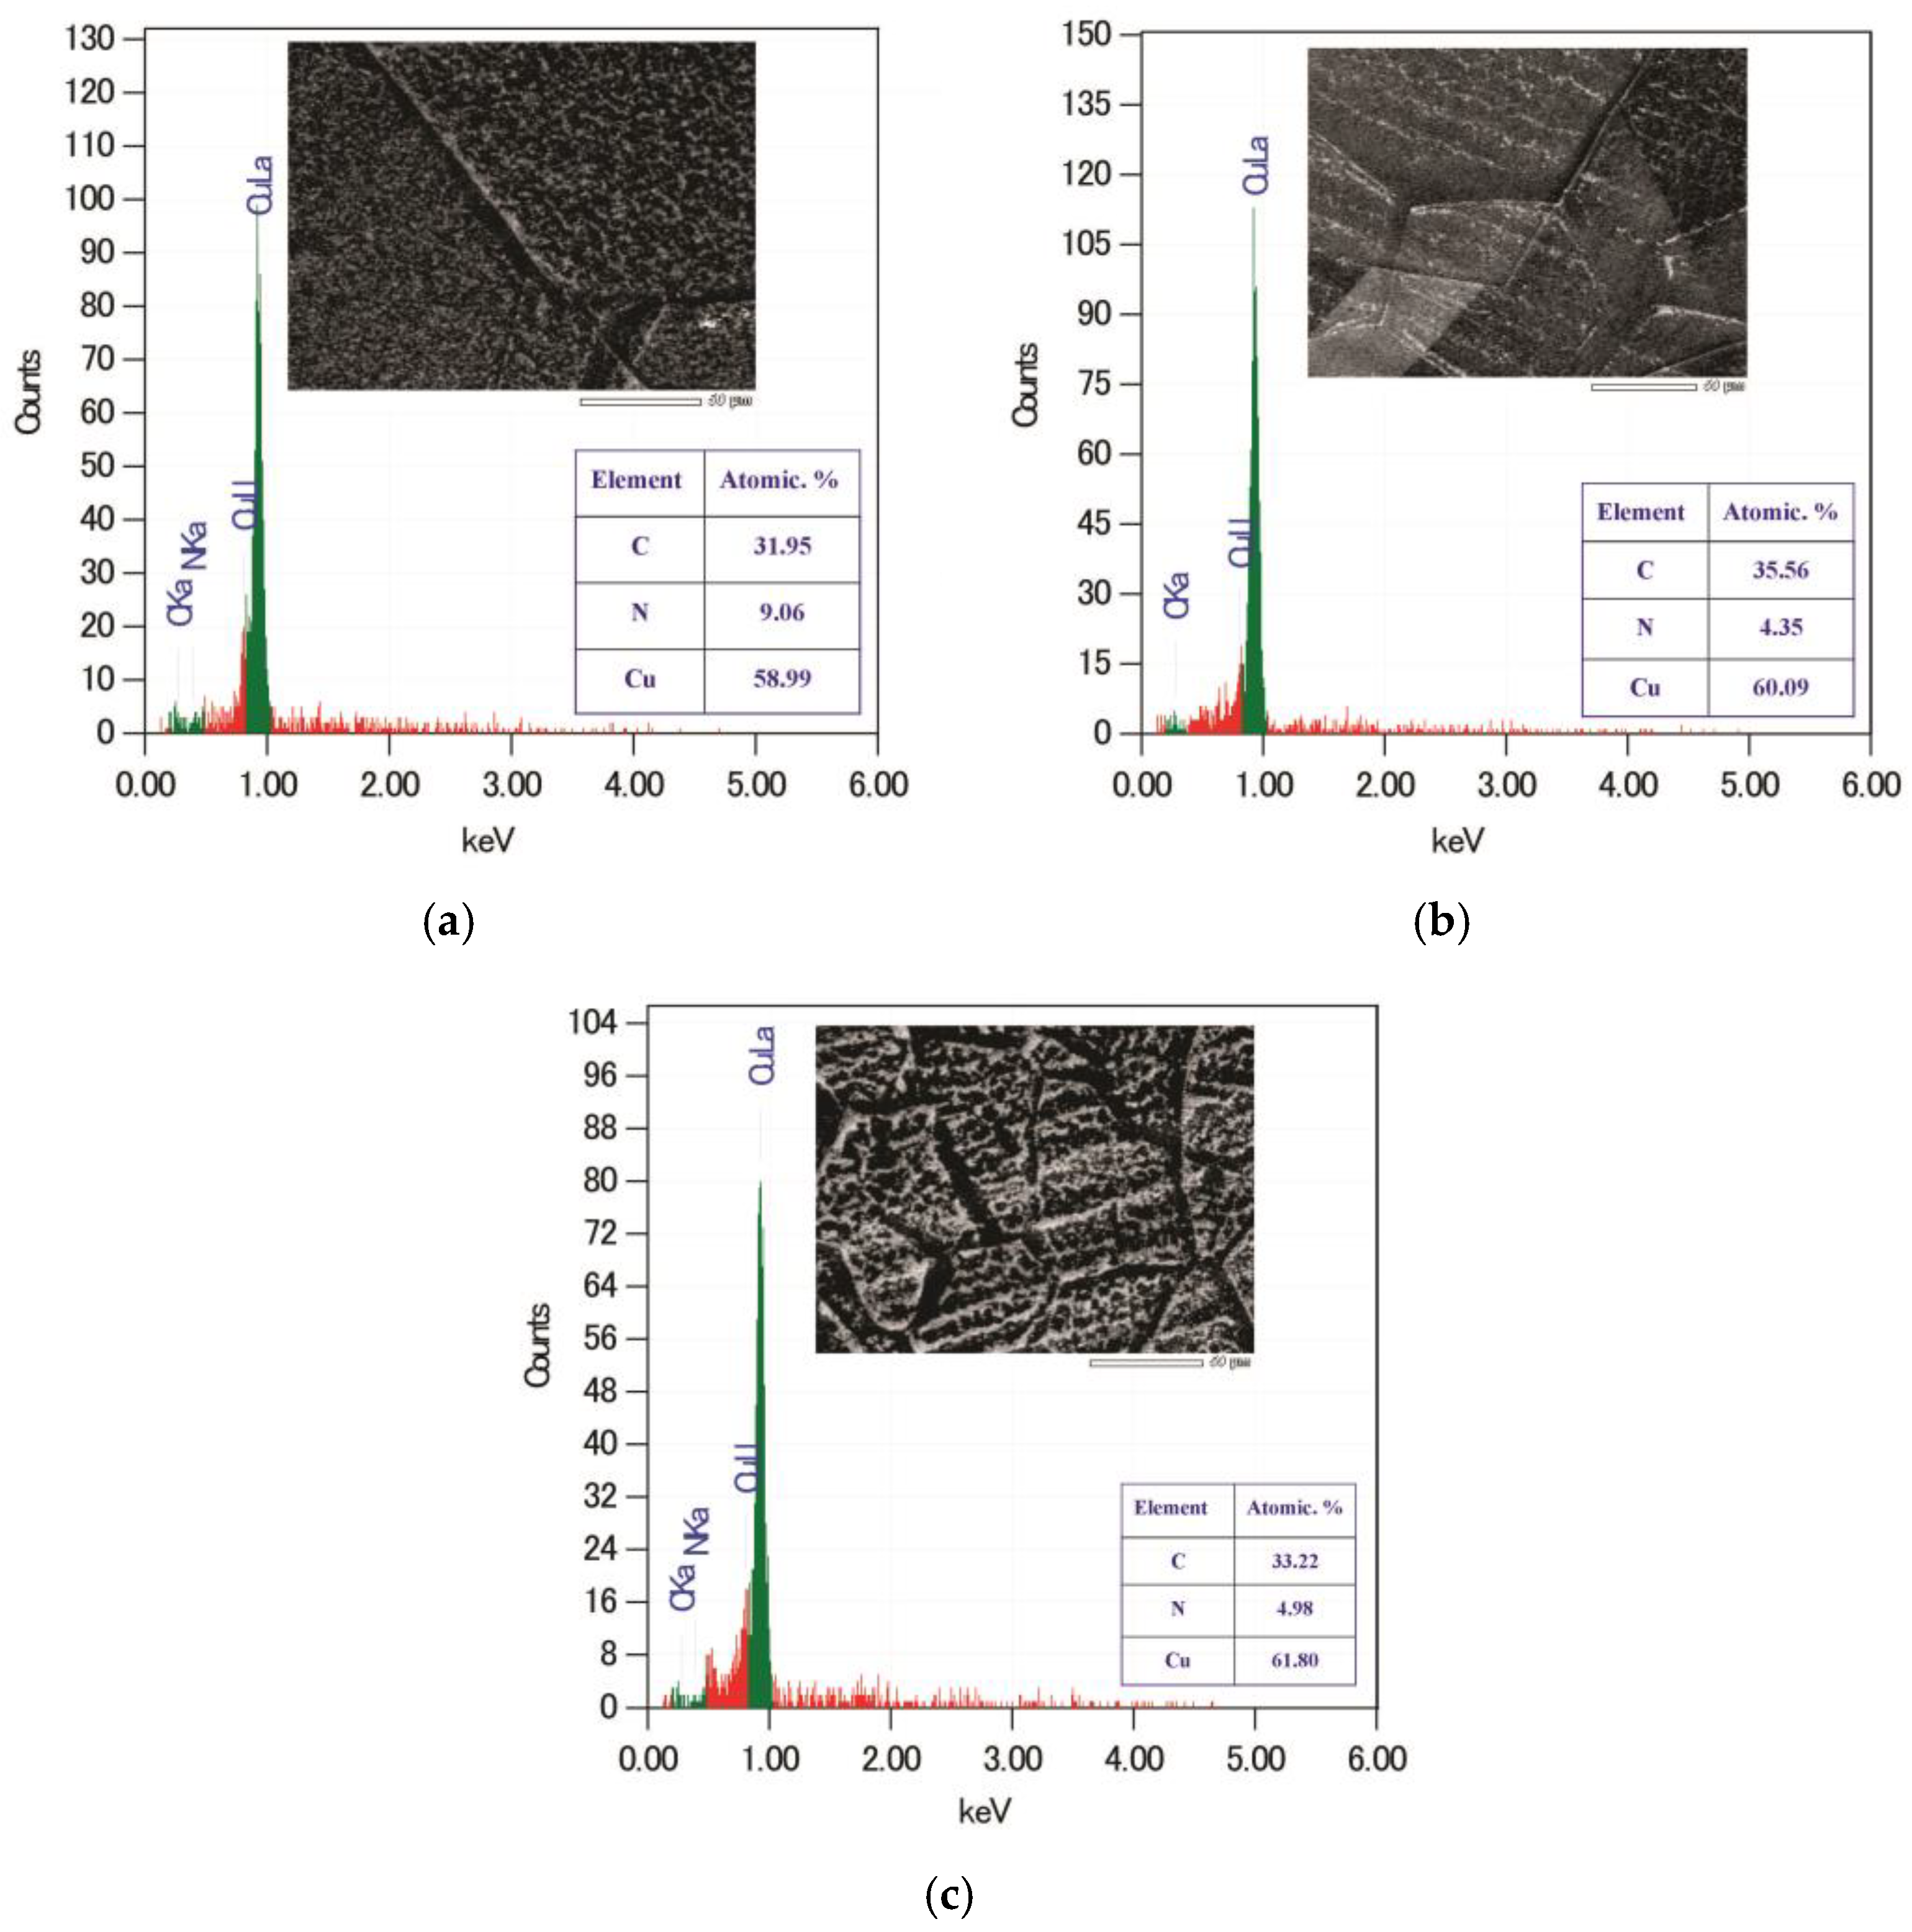
SEM is often used to study the morphology of various materials, including N-doped graphene. A beam of highly energetic electrons (with a kinetic energy of several keV) scans the surface of the sample, and secondary electrons (~50 eV) emitted from the sample generate the SEM image. Figure 2 shows SEM images of the synthesized nanostructures. During the cooling process of the copper foil, wrinkles of graphene sheets form due to the different thermal expansion coefficients of copper and graphene. These wrinkles indicate the presence of ultrathin layers of graphene nanostructures. By analyzing the microphotograph, one can observe graphene films that cover the entire surface of the substrates, with the films being continuous and exhibiting good uniformity.
The presence of nitrogen in the analyzed structures was confirmed by the application of EDX measurements. The amount of each element detected by EDX is shown in Figure 2. Carbon, nitrogen and copper were detected on the surface of the synthesized nanostructure, and the presence of nitrogen on the surface was noteworthy. In EDX, only those elements on the surface can be detected. Therefore, this method cannot provide a complete elemental analysis. The EDX data confirmed the presence of nitrogen in the NG, and accordingly, NG can be said to have formed.
To verify the elemental composition of the nitrogen-doped graphene (NG) coating, X-ray photoelectron spectroscopy (XPS) analysis was performed. As shown in Figure 3, the survey spectrum exhibits distinct peaks at approximately 283 eV (C 1s), 400 eV (N 1s), and 978 eV (Cu 2p), corresponding to carbon, nitrogen, and the underlying copper substrate, respectively. The clear presence of the N 1s peak confirms the successful incorporation of nitrogen into the graphene lattice, which is consistent with the EDX results. The estimated nitrogen concentration from the XPS spectrum is approximately 4.9 at%, which is comparable to previously reported values for CVD-grown N-doped graphene [11,12]. XPS analysis was carried out for the NG film deposited on the 50 μm thick Cu foil, which exhibited the most uniform coating and representative surface morphology among all samples. This sample was therefore chosen to evaluate the elemental composition and nitrogen incorporation. Future work will include a comparative XPS analysis for different Cu foil thicknesses to better understand the relationship between substrate characteristics and nitrogen doping behavior.
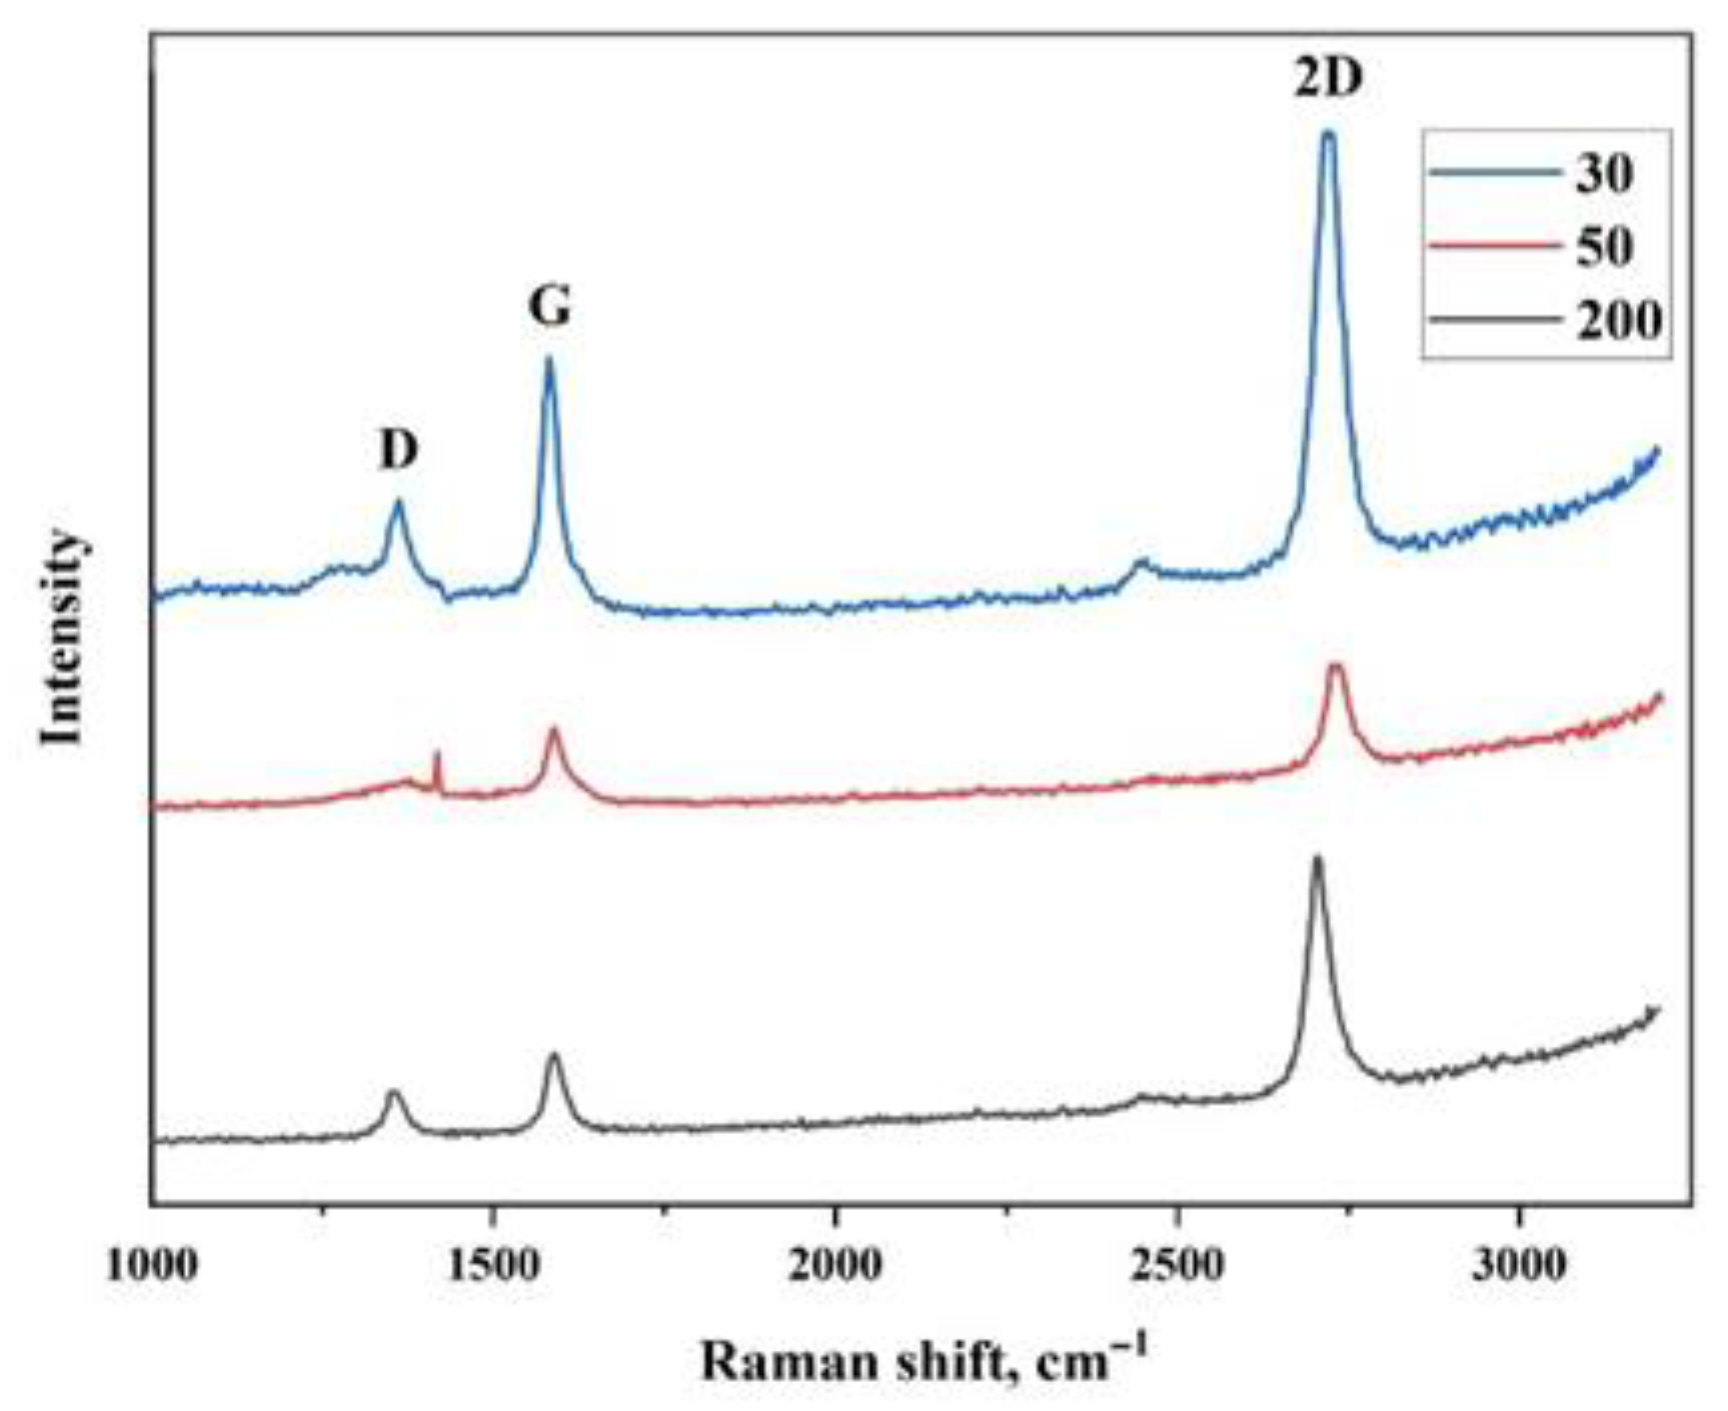
Figure 4 shows that the synthesized graphene films exhibit well-defined Raman bands corresponding to the D, G, and 2D peaks. The D band, typically observed around 1350 cm−1, arises from structural defects in the graphene lattice, such as vacancies, edges, and heteroatom substitution [28]. The G band, near 1580 cm−1, corresponds to the in-plane vibration of sp2-hybridized carbon atoms in crystalline graphite [31]. The 2D peak provides insight into the number of graphene layers and the material’s crystallinity [32,33].
The Raman spectral parameters for nitrogen-functionalized graphene films synthesized on copper foils of various thicknesses (30, 50, and 200 µm) are summarized in Table 1. All samples display the characteristic carbon peaks, confirming the successful synthesis of graphene. The ID/IG ratio, a widely used indicator of defect density in graphene, reflects sp3-type defects—primarily from nitrogen substitution at boundaries and vacancies. A lower ID/IG ratio corresponds to fewer defects and improved graphene quality [10,11,12,34]. As shown, the ID/IG value decreases from 0.83 (200 µm) to 0.66 (30 µm), indicating that thinner copper foils favor the growth of less defective graphene films.
The I2D/IG ratio and the full width at half maximum (FWHM) of the 2D peak are used to estimate the number of graphene layers and assess crystalline order [27,28,29,35,36,37]. Typical I2D/IG values fall in the range of: 2–3 for monolayer graphene, 1–2 for bilayer graphene, <1 for multilayer graphene [27,34]. In this study, I2D/IG values of 1.91 (200 µm), 1.30 (50 µm), and 1.52 (30 µm) suggest the formation of bilayer graphene (~2–3 nm thick) across all samples. The relatively narrow FWHM values of the 2D peak (ranging from 16.95 to 22.81 cm−1) further confirm the high crystallinity and few-layer structure.
The observed correlation between Cu foil thickness and graphene quality is consistent with CVD growth models, where thicker substrates promote more uniform adatom diffusion, leading to reduced vacancy formation [18,21]. This trend is further supported by uniform surface coverage observed in SEM images (Figure 2). For additional structural verification, transmission electron microscopy (TEM) is recommended in future studies. All Raman measurements were performed in triplicate, showing high reproducibility (standard deviation of ID/IG: ±0.03). The analysis of the Raman spectra provides detailed information on the defect structure and the number of graphene layers. The ratio of the D and G peak intensities (ID/IG) is widely used to assess the defect density in graphene. A lower ID/IG value corresponds to fewer defects and higher structural quality. As shown in Table 1, the ID/IG ratio decreases from 0.83 to 0.66 with decreasing Cu foil thickness, indicating that the graphene grown on thinner Cu (30 µm) contains fewer structural defects. The D band observed in all samples is mainly associated with edge and vacancy-type defects, as well as nitrogen-related bonding sites formed during the CVD process.
The I2D/IG ratio and the full width at half maximum (FWHM) of the 2D peak provide information about the number of graphene layers and crystalline order.
Moreover, the relatively narrow FWHM(2D) values (16.95–22.81 cm−1) indicate good crystallinity and confirm the formation of few-layer graphene. These results suggest that the reduction in Cu foil thickness promotes the growth of more uniform and defect-free bilayer graphene films.
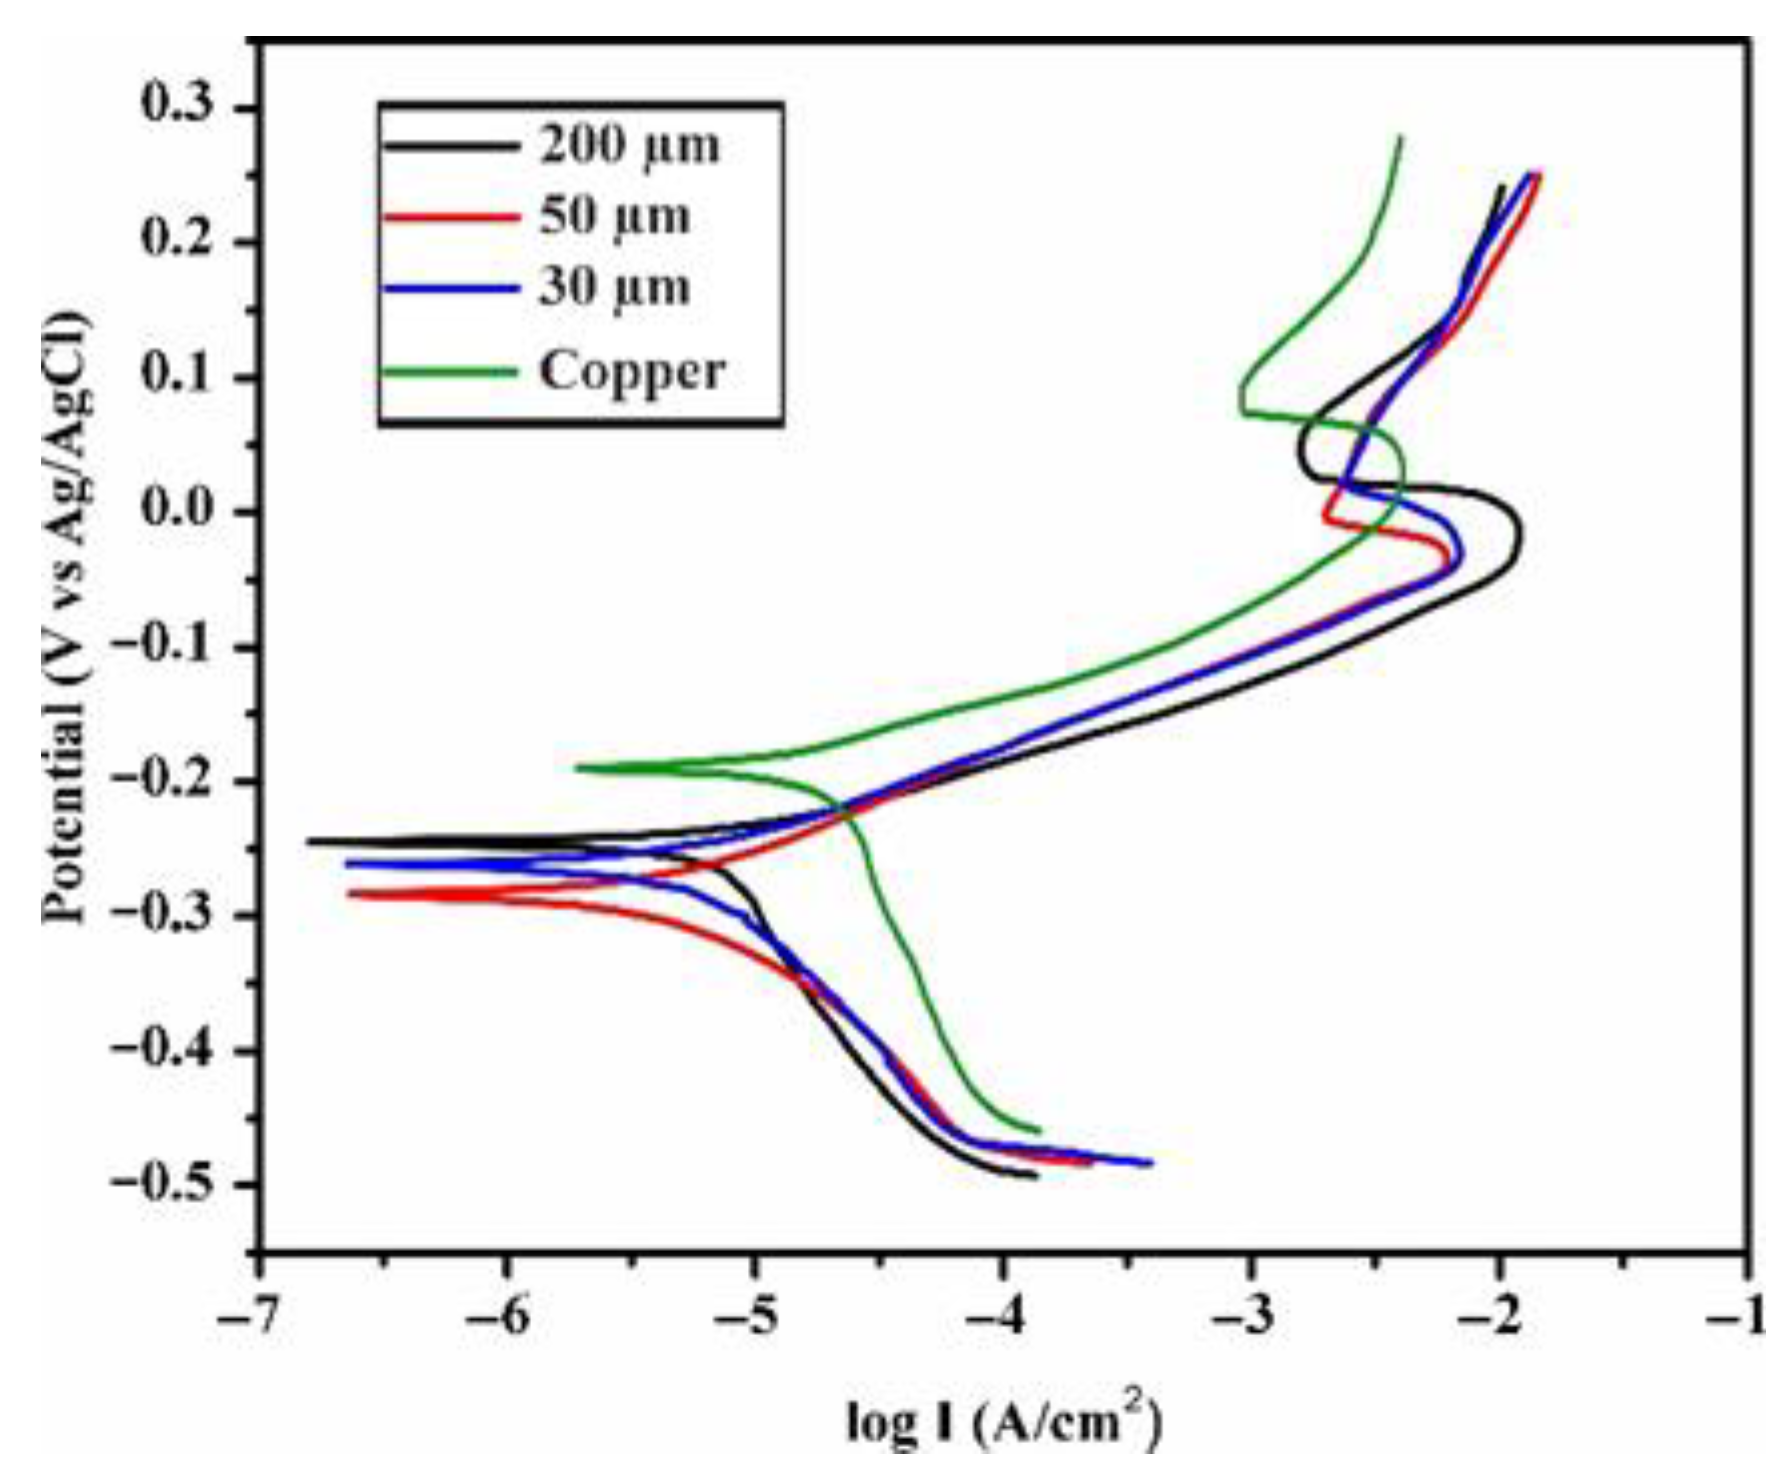
The corrosion protection performance of the nitrogen-doped graphene (NG) coatings synthesized on Cu foils of different thicknesses was evaluated using potentiodynamic polarization (Tafel extrapolation) measurements. This method provides quantitative electrochemical parameters such as the corrosion potential (Ecorr) and corrosion current density (Icorr), which are widely used to assess the protective efficiency of thin graphene-based films. These parameters allow for a reliable comparison of the corrosion resistance among samples with different substrate thicknesses. Although electrochemical impedance spectroscopy (EIS) can provide complementary information on charge transfer and barrier properties, the present study focused primarily on the comparative evaluation of corrosion behavior. Future work will include EIS measurements to further elucidate the interfacial charge transfer and barrier performance of the NG coatings.
Key electrochemical parameters such as corrosion potential ( E c o r r ), corrosion current density ( I c o r r ), corrosion rate (R) and inhibition efficiency (IE%) obtained from polarization measurements are summarized in Table 2.
The unchanged curve shape (parallel shifts in Tafel plots, Figure 5) indicates barrier-dominated protection, not just area reduction, as NG’s gas impermeability limits electrolyte access while maintaining uniform exposure (confirmed by SEM coverage, Figure 2). Corrosion rate (mm/year) calculations used the nominal geometric area (1 cm2, standard for thin coatings [28]), yielding conservative estimates; any localized effects are mitigated by N-doping’s semiconducting shift, which suppresses cathodic reactions on graphene [10,11,12,13]. The unchanged curve shape (parallel shifts in Tafel plots, Figure 4) indicates barrier-dominated protection, not just area reduction, as NG’s gas impermeability limits electrolyte access while maintaining uniform exposure (confirmed by SEM coverage, Figure 2). Corrosion rate (mm/year) calculations used the nominal geometric area (1 cm2, standard for thin coatings [28]), yielding conservative estimates; any localized effects are mitigated by N-doping’s semiconducting shift, which suppresses cathodic reactions on graphene [9,10,11,12]. N-doping introduces electron-withdrawing sites, elevating graphene’s work function and decoupling it from Cu’s Fermi level, thus minimizing anodic dissolution [13]. Undoped graphene controls showed initial IE ~65% dropping to <40% after 1 month due to galvanic acceleration—contrasting NG’s stability.
Annotated Tafel extrapolations (linear fits for anodic/cathodic branches, with icorr intercepts marked); inset: duplicate curves for 200 µm NG sample (triplicate average used; SD < 5% in icorr).
As shown, the copper samples with coatings of different thicknesses exhibited significantly lower corrosion current densities and corrosion rates compared to pure copper, indicating enhanced corrosion resistance. The highest inhibition efficiency (91.5%) was observed for the 200 µm coated sample, followed closely by the 30 µm (88.3%) and 50 µm (86.8%) samples.
Table 3 compares the corrosion protection efficiency of nitrogen-doped graphene layers with other literature data. As can be seen, the nitrogen-modified graphene coatings obtained in this work have high anti-corrosion efficiency. These results are at a very high level compared to the efficiency of modern graphene-based coatings.
Pure graphene itself has been shown in studies [28,29] to provide only short-term protection, while in the long term it actually enhances corrosion through galvanic action. The nitrogen-doped graphene structure synthesized by CVD proposed in this work, in turn, weakens the galvanic process and significantly increases the corrosion resistance of the metal.
N-doping introduces electron-withdrawing sites, elevating graphene’s work function and decoupling it from Cu’s Fermi level, thus minimizing anodic dissolution [13]. Undoped graphene controls showed initial IE ~65% dropping to <40% after 1 month due to galvanic acceleration—contrasting NG’s stability. Some graphene/polymer composite systems in the literature (e.g., graphene-enhanced epoxy coatings [38]) have shown efficiencies of up to 78%. In addition, functionalized graphene oxides (GO) have achieved efficiencies of 85% or higher, but their synthesis is relatively complex and requires multi-step processes [39].
It should be noted that although the anti-corrosion efficiency of the sample obtained on 200 µm copper foil is the highest, its Raman spectroscopy ID/IG value is higher than that of the 30 µm sample, which indicates that there are more defects in the graphene structure. However, the effect of the foil thickness may play a decisive role here: the thermal stability of a thick substrate is higher, so during synthesis the layer is evenly distributed, allowing graphene to form a solid, defect-free coating. The integrity of this layer prevents the penetration of the electrolyte to the metal surface. In addition, since the thick copper foil evenly distributes heat, the adhesion and mechanical strength of the graphene layer are improved. Therefore, despite the defects in the structure, the NG on 200 µm samples provides more effective protection.
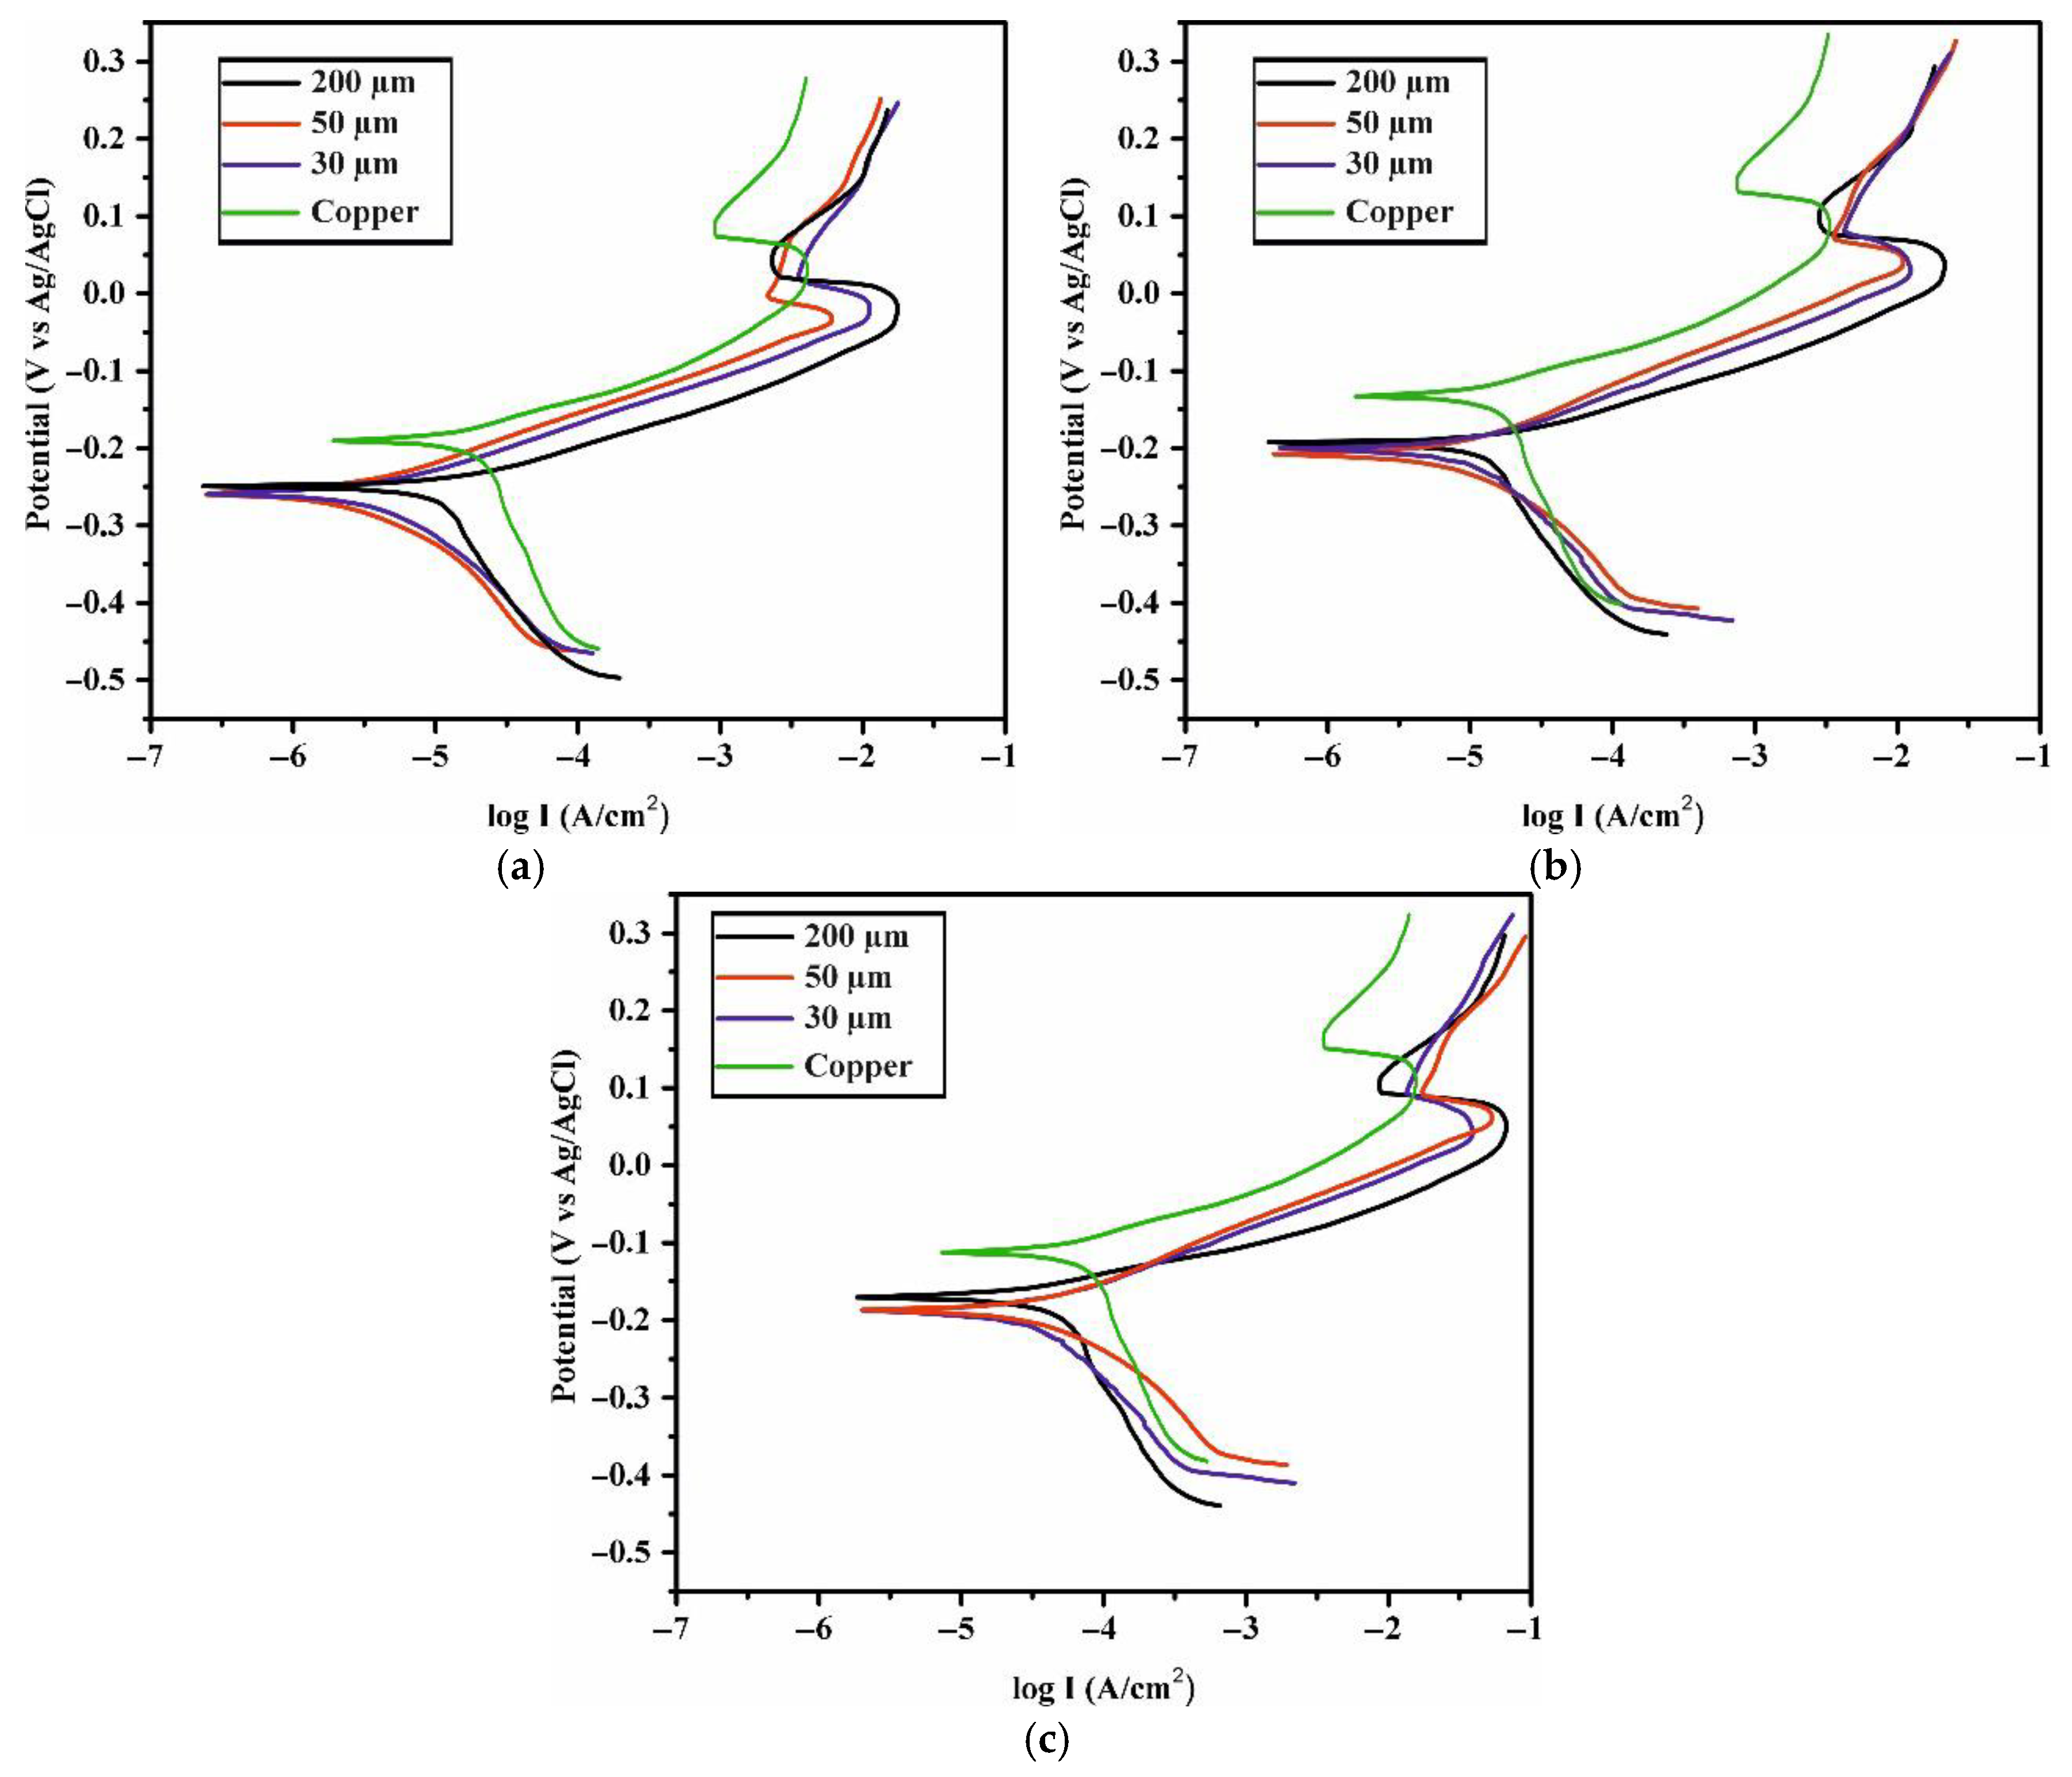
In order to measure the change in corrosion rate of samples after long-term immersion in 5% seawater, a study was conducted in which copper samples coated with NG of different thicknesses (30 μm, 50 μm and 200 μm) were immersed in a seawater solution for a period of up to 2 months (Figure 6).
As can be seen from Table 4, compared with pure copper samples, nitrogen-doped graphene (NG) coatings demonstrate a significant reduction in both corrosion current density and corrosion rate. During 5 days of exposure, all NG coatings effectively inhibit corrosion, with inhibition efficiency (IE) ranging from 86.8% to 91.5%. However, over time (after 1 month and 2 months), a slight decrease in inhibition efficiency is observed. For example, in the sample synthesized on copper foil with 200 µm thickness, the IE value decreases from 91.5% to 75.8%. This means that graphene’s ability to inhibit corrosion slowly decreases over time, attributed to minor pinhole evolution or ion intercalation—common in 2D coatings [8]. Post-immersion surface analyses (e.g., delamination sites via SEM) would elucidate mechanisms, but given the scope, we prioritize comprehensive electrochemical monitoring.
In contrast, the pure copper samples exhibited a significant increase in corrosion current density and corrosion rate with prolonged exposure time. After 2 months of testing, the corrosion rate of pure copper reached 0.0776 mm/year, which clearly demonstrates the importance of NG coatings in protecting the metal against corrosion.
Differences in corrosion resistance are also observed among NG coatings of different thicknesses. The sample synthesized on 200 µm copper foil retains its inhibition efficiency relatively well, showing 75.8% even after 2 months. These results may be attributed to the higher thermal stability of the thick copper foil and the improved adhesion of the graphene layer. Substrate thickness modulates post-growth cooling dynamics: thicker foils sustain prolonged high-temperature exposure, enhancing layer integrity despite uniform 1000 °C ramp-up, as evidenced by superior IE for 200 µm samples.
While 2-month tests affirm NG’s robustness, extrapolating to industrial scales (>6 months) warrants accelerated aging studies; preliminary trends suggest viability in harsh settings, per defect-tuned barriers.

4. Conclusions

In this research work, a nitrogen-doped graphene (NG) film is synthesized on the surface of copper foil by CVD method and its anti-corrosion properties are comprehensively investigated. SEM and EDX analyses show that the graphene layer forms uniformly on the surface of the obtained samples and nitrogen atoms are successfully introduced. Raman spectroscopy results show that the structural quality of the film obtained on 30 µm thick copper foil is higher (low ID/IG value). Electrochemical studies show that NG coatings exhibit much lower corrosion current density and corrosion rate than pure copper. In short-term tests, the highest inhibitory efficiency (91.5%) is observed for the sample synthesized on 200 µm thick copper foil. This is due to the high thermal stability of the thick foil and the homogeneous distribution of the coating. Long-term seawater immersion tests show that, although the inhibitory efficiency slightly decreases over time, NG coatings show much higher anti-corrosion properties than pure copper at all stages.
Overall, the results demonstrate that nitrogen-doped graphene is a promising material capable of protecting metals from long-term corrosion not only in seawater, but also in extreme conditions. Prospects include integration into Cu interconnects for aerospace, where NG’s low permeability outperforms polymers in humid/saline exposure; advantages over paints (no delamination, conductivity retention) justify CVD’s maturity, with costs dropping via atmospheric variants. Future hybrids could blend NG primers with polymers for hybrid affordability.

Author Contributions

Conceptualization, G.P., Z.N., B.Z., B.A., V.G. and B.M.; Methodology, G.P., Z.N., B.Z. and B.M.; Software, G.P., B.Z., B.M., D.A. and L.M.; Validation, G.P., Z.N., B.A., V.G. and D.I.; Formal analysis, G.P., B.A. and V.G.; Investigation, G.P., Z.N. and B.Z.; Resources, V.G. and D.I.; Data curation, G.P., L.M., B.M. and D.A.; Writing—original draft preparation, G.P. and B.A.; Writing—review and editing, G.P.; Visualization, G.P., B.Z., L.M., B.M. and D.A.; Supervision, G.P. and B.A.; Project administration, V.G. and D.I.; Funding acquisition, V.G. and D.I. All authors have read and agreed to the published version of the manuscript.

Funding

This research was funded by the Committee of Science of the Ministry of Science and Higher Education of the Republic of Kazakhstan (Grant No. BR21882375 “Creation and modernization of components of space technology of increased reliability of ground and space segments and ionospheric studies”).

Institutional Review Board Statement

Not applicable.

Informed Consent Statement

Not applicable.

Data Availability Statement

The original contributions presented in this study are included in the article. Further inquiries can be directed to the corresponding author.

Acknowledgments

The authors thank colleagues for valuable discussions during manuscript preparation. All content has been reviewed and edited by the authors, who bear full responsibility.

Conflicts of Interest

The authors declare no conflicts of interest. Authors Zhasulan Nakysbekov, Bauyrzhan Zhumadilov, Gulmaira Partizan, Daniyar Ismailov, Valentina Grishenko, Dinara Akhmetsadyk were employed by the company LLP “Institute of Ionosphere”, Authors Gulmaira Partizan, Botagoz Medyanova and Laura Mustafa were employed by the company JSC “National Center of Space Research and Technology”. The remaining authors declare that the research was conducted in the absence of any commercial or financial relationships that could be construed as a potential conflict of interest.

References

  1. Han, Q.; Wang, R.; Xue, Y.; Camilli, L.; Yu, G.; Luo, B. Optimization strategies for graphene-based protection coatings: A review. Corros. Rev. 2025, 43, 23–59. [Google Scholar] [CrossRef]
  2. Benzarti, Z.; Arrousse, N.; Serra, R.; Cruz, S.; Bastos, A.; Tedim, J.; Carvalho, S. Copper corrosion mechanisms, influencing factors, and mitigation strategies for water circuits of heat exchangers: Critical review and current advances. Corros. Rev. 2025, 43, 429–455. [Google Scholar] [CrossRef]
  3. Gok, K.; Ada, H.D.; Erdem, M.; Gok, A.; Topçuoğlu, K.; Alkan, M.A. Investigation of erosion corrosion caused by drinking water in the faucet with computational fluid dynamics. J. Met. Mater. Res. 2023, 6, 1–6. [Google Scholar] [CrossRef]
  4. Li, L.; Cui, Y.; Zhang, Z.; Tu, P.; Gong, H.; Li, P. Preparation of graphene/Fe3O4 composite varnish with excellent corrosion-resistant and electromagnetic shielding properties. Ceram. Int. 2020, 46, 22876–22882. [Google Scholar] [CrossRef]
  5. Geim, A.K. Graphene: Status and prospects. Science 2009, 324, 1530–1534. [Google Scholar] [CrossRef] [PubMed]
  6. Weitz, R.T.; Yacoby, A. Graphene rests easy. Nat. Nanotechnol. 2010, 5, 699–700. [Google Scholar] [CrossRef]
  7. Chen, C.; Qiu, S.; Cui, M.; Qin, S.; Yan, G.; Zhao, H.; Wang, L.; Xue, Q. Achieving high performance corrosion and wear resistant epoxy coatings via incorporation of noncovalent functionalized graphene. Carbon 2017, 114, 356–366. [Google Scholar] [CrossRef]
  8. Tang, S.; Lei, B.; Feng, Z.; Guo, H.; Zhang, P.; Meng, G. Progress in the graphene oxide-based composite coatings for anticorrosion of metal materials. Coatings 2023, 13, 1120. [Google Scholar] [CrossRef]
  9. Singh Raman, R.K.; Arya, A.K.; Tomy, K.; Dip, F.A.; Lai, E.; Al-Saadi, S. Graphene coatings for corrosion resistance of nickel and copper in acidic, alkaline and neutral environments. J. Mater. Sci. Technol. 2023, 142, 124–133. [Google Scholar] [CrossRef]
  10. Wang, Y.; Shao, Y.; Matson, D.W.; Li, J.; Lin, Y. Nitrogen-doped graphene and its application in electrochemical biosensing. ACS Nano 2010, 4, 1790–1798. [Google Scholar] [CrossRef] [PubMed]
  11. Li, D.; Duan, X.; Sun, H.; Kang, J.; Zhang, H.; Tade, M.O.; Wang, S. Facile synthesis of nitrogen-doped graphene via low-temperature pyrolysis: The effects of precursors and annealing ambience on metal-free catalytic oxidation. Carbon 2017, 115, 649–658. [Google Scholar] [CrossRef]
  12. Wei, D.; Liu, Y.; Wang, Y.; Zhang, H.; Huang, L.; Yu, G. Synthesis of N-doped graphene by chemical vapor deposition and its electrical properties. Nano Lett. 2009, 9, 1752–1758. [Google Scholar] [CrossRef]
  13. Ren, S.; Cui, M.; Li, W.; Pu, J.; Xue, Q.; Wang, L. N-doping of graphene: Toward long-term corrosion protection of Cu. J. Mater. Chem. A 2018, 6, 24136–24148. [Google Scholar] [CrossRef]
  14. Liu, D.; Xie, X.; Chen, X.; Holze, R. Graphenes for corrosion protection in electrochemical energy technology. Corros. Mater. Degrad. 2025, 6, 33. [Google Scholar] [CrossRef]
  15. Akhmetsadyk, D.; Ismailov, D.; Murzalinov, D.; Partizan, G.; Grichshenko, V. A DFT study on the effect of biaxial strain on the electronic properties of graphene doped with B, N, Al, Si, S, and Ga. Materials 2025, 18, 2791. [Google Scholar] [CrossRef]
  16. Xu, Y.; Chu, Z.; Xu, J.; Tang, W.; Gao, L. Research on the corrosion resistance and mechanical properties of graphene oxide–modified AT13 coatings. Materials 2025, 18, 2168. [Google Scholar] [CrossRef]
  17. Yadav, A.; Panjikar, S.; Singh Raman, R.K. Graphene-based impregnation into polymeric coating for corrosion resistance. Nanomaterials 2025, 15, 486. [Google Scholar] [CrossRef] [PubMed]
  18. Yu, Q.; Lian, J.; Siriponglert, S.; Li, H.; Chen, Y.P.; Pei, S.-S.; Siriponglert, S. Graphene segregated on Ni surfaces and transferred to insulators. Appl. Phys. Lett. 2020, 93, 113103. [Google Scholar] [CrossRef]
  19. Reina, A.; Jia, X.; Ho, J.; Nezich, D.; Son, H.; Bulovic, V.; Dresselhaus, M.S.; Kong, J. Large area, few-layer graphene films on arbitrary substrates by chemical vapor deposition. Nano Lett. 2018, 9, 3087. [Google Scholar] [CrossRef]
  20. Kim, K.S.; Zhao, Y.; Jang, H.; Lee, S.Y.; Kim, J.M.; Kim, K.S.; Ahn, J.-H.; Kim, P.; Choi, J.-Y.; Hong, B.H. Large-scale pattern growth of graphene films for stretchable transparent electrodes. Nature 2009, 457, 706–710. [Google Scholar] [CrossRef]
  21. Li, X.; Cai, W.; An, J.; Kim, S.; Nah, J.; Yang, D.; Piner, R.; Velamakanni, A.; Jung, I.; Tutuc, E.; et al. Large-area synthesis of high-quality and uniform graphene films on copper foils. Science 2009, 324, 1312–1314. [Google Scholar] [CrossRef] [PubMed]
  22. Partizan, G.; Mansurov, B.Z.; Medyanova, B.S.; Koshanova, B.; Mansurova, M.E.; Aliyev, B.A.; Jiang, X. Low-temperature synthesis of carbon nanotubeson iron nanopowders. Mater. Res. Express 2016, 3, 115010. [Google Scholar] [CrossRef]
  23. Osório, W.R.; Peixoto, L.C.; Moutinho, D.J.; Gomes, L.G.; Ferreira, I.L.; Garcia, A. Corrosion resistance of directionally solidified Al–6Cu–1Si and Al–8Cu–3Si alloys castings. Mater. Des. 2011, 32, 3832–3837. [Google Scholar] [CrossRef]
  24. Zhang, M.; Ma, X.; Zhang, S.; Hou, L.; Kim, K.H. One-step fabrication of wear resistant and friction-reducing Al2O3/MoS2 nanocomposite coatings on 2A50 aluminum alloy by plasma electrolytic oxidation with MoS2 nanoparticle additive. Surf. Coat. Technol. 2025, 497, 131796. [Google Scholar] [CrossRef]
  25. Hu, W.; Zhang, M.; Ma, X.; Lv, M.; Zhou, X. Investigation of electronic structure, photoelectric and thermodynamic properties of Mg-doped β-Ga2O3 using first-principles calculation. Vacuum 2025, 235, 114145. [Google Scholar] [CrossRef]
  26. Zhang, X.L.; Jiang, Z.H.; Yao, Z.P.; Song, Y.; Wu, Z.D. Effects of scan rate on the potentiodynamic polarization curve obtained to determine the Tafel slopes and corrosion current density. Corros. Sci. 2009, 51, 581–587. [Google Scholar] [CrossRef]
  27. McCafferty, E. Validation of corrosion rates measured by the Tafel extrapolation method. Corros. Sci. 2005, 47, 3202–3215. [Google Scholar] [CrossRef]
  28. Nayak, P.K.; Hsu, C.J.; Wang, S.C.; Sung, J.C.; Huang, J.L. Graphene coated Ni films: A protective coating. Thin Solid Films 2013, 529, 312–316. [Google Scholar] [CrossRef]
  29. Prasai, D.; Tuberquia, J.C.; Harl, R.R.; Jennings, G.K.; Bolotin, K.I. Graphene: Corrosion-inhibiting coating. ACS Nano 2012, 6, 1102–1108. [Google Scholar] [CrossRef]
  30. Yoshimura, A.; Yoshimura, H.; Shin, S.C.; Kobayashi, K.; Tanimura, M.; Tachibana, M. Atomic force microscopy and Raman spectroscopy study of the early stages of carbon nanowall growth by DC plasma-enhanced chemical vapor deposition. Carbon 2012, 50, 2698–2702. [Google Scholar] [CrossRef]
  31. Liu, R.; Chi, Y.; Fang, L.; Tang, Z.; Yi, X. Synthesis of carbon nanowall by plasma-enhanced chemical vapor deposition method. J. Nanosci. Nanotechnol. 2014, 14, 1647–1657. [Google Scholar] [CrossRef]
  32. Ghosh, S.; Polaki, S.R.; Krishna, N.G.; Kamruddin, M. Influence of nitrogen on the growth of vertical graphene nanosheets under plasma. J. Mater. Sci. 2018, 53, 7316–7325. [Google Scholar] [CrossRef]
  33. Kim, S.Y.; Choi, W.S.; Lee, J.-H.; Hong, B. Substrate temperature effect on the growth of carbon nanowalls synthesized via microwave PECVD. Mater. Res. Bull. 2014, 58, 112–116. [Google Scholar] [CrossRef]
  34. Ferrari, A.C.; Meyer, J.C.; Scardaci, V.; Casiraghi, C.; Lazzeri, M.; Mauri, F.; Piscanec, S.; Jiang, D.; Novoselov, K.S.; Roth, S.; et al. Raman spectrum of graphene and graphene layers. Phys. Rev. Lett. 2006, 97, 187401. [Google Scholar] [CrossRef]
  35. Zhumadilov, B.; Kenzhegulov, A.; Nemkayeva, R.; Partizan, G.; Yerlanuly, Y.; Gadbullin, M. Synthesis of carbon nanowalls by oxy-acetylene torch method. J. Met. Mater. Miner. 2023, 33, 1806. [Google Scholar] [CrossRef]
  36. Tuinstra, F.; Koenig, J.L. Characterization of graphite fiber surfaces with Raman spectroscopy. J. Compos. Mater. 1970, 4, 492–499. [Google Scholar] [CrossRef]
  37. Costa, S.; Borowiak-Palen, E.; Kruszyńska, M.; Bachmatiuk, A.; Kalenczuk, R.J. Characterization of carbon nanotubes by Raman spectroscopy. Mater. Sci. Pol. 2008, 26, 1–9. Available online: https://www.materialsscience.pwr.wroc.pl/bi/vol26no2/articles/ms_2007_54INMAT23.pdf (accessed on 1 November 2023).
  38. Prasetya, N.B.A.; Ajizan, A.I.; Widodo, D.S.; Ngadiwiyana, N.; Gunawan, G. A polyeugenol/graphene composite with excellent anti-corrosion coating properties. Mater. Adv. 2023, 4, 248. [Google Scholar] [CrossRef]
  39. Alharbi, B.; Aljeaban, N.; Busaleh, A.; Saleh, T. Efficient corrosion inhibition using graphene oxide-based structures. Mater. Perform. 2024, 63, 40–43. [Google Scholar] [CrossRef]
Figure 1. Process of synthesis of nitrogen-doped graphene (NG).
Coatings 15 01345 g001
Figure 2. SEM images (ac) and corresponding EDX spectra (insets) of NG on Cu foils of varying thickness: (a) 200 µm (uniform coverage, N: 9.06 ± 0.2 at.%); (b) 50 µm (minor wrinkles, N: 4.35 ± 0.2 at.%); (c) 30 µm (high uniformity, N: 4.98 ± 0.2 at.%). Representative images from triplicate experiments (consistent across samples; SD for EDX N: ±0.2 at.%); Scale bars: 50 µm.
Coatings 15 01345 g002
Figure 3. XPS spectra of the N-doped graphene on copper foil with 50 µm thickness. (a) XPS spectra of the as-prepared N-doped graphene samples; (b) XPS fine spectra of C 1s and (c) N 1s for the as-prepared N-doped graphene.
Coatings 15 01345 g003
Figure 4. Raman spectroscopy of samples with different thicknesses of copper foil.
Coatings 15 01345 g004
Figure 5. Polarization curves of NG samples with different thicknesses of copper foil in a 5% sea salt solution.
Coatings 15 01345 g005
Figure 6. Polarization curves (Tafel slopes) of nitrogen-doped graphene (NG) coated copper foils with different thicknesses (30, 50, 200 µm) in 5% seawater solution after immersion for (a) 5 days, (b) 1 month, and (c) 2 months.
Coatings 15 01345 g006
Table 1. Data from the Raman scattering spectroscopy analysis.
Peak Position 200 µm 50 µm 30 µm
Position of the G peak (cm−1)1587.781588.611581.40
Position of the D peak (cm−1)1355.741379.311362.26
Position of the 2D peak (cm−1)2704.262725.242718.39
FWHM G (cm−1)38.8132.8428.39
FWHM D (cm−1)21.4226.0241.60
FWHM 2D (cm−1)50.4516.9522.81
ID/IG0.830.750.66
I2D/IG1.911.301.52
Table 2. Tafel Extrapolation data.
Sample Icorr (µA/cm2)Ecorr (V) Rcorr
(10−3 mm/year)
IE%
Pure Copper1.778−0.18820.6-
200 µm0.151−0.2381.7591.5
50 µm0.234−0.2512.7186.8
30 µm0.209−0.2782.4288.3
Table 3. Comparison of anti-corrosion effectiveness of different graphene-based coatings.
No. Coating Type Synthesis Method Medium (Electrolyte) IE% Reference
1Pure grapheneCVDNaCl<30.0 *[28,29]
2Polymer epoxy/graphene (PE/G)Coating (layering)3.5% NaCl78.0 *[30]
3GF-modified graphene oxide (GO)Chemical treatmentHCl, 90 °C>85.0 *[31]
4N-doped graphene (NG), 50 µmCVD (CH4/H2/N2)5% seawater86.8This work
5N-doped graphene (NG), 30 µmCVD (CH4/H2/N2)5% seawater88.3This work
6N-doped graphene (NG), 200 µmCVD (CH4/H2/N2)5% seawater91.5This work
* Values are presented for qualitative comparison only; testing media and coating thicknesses vary among studies.
Table 4. Tafel Extrapolation data of samples with immersion duration.
Sample Icorr (µA/cm2) Ecorr (V) Rcorr
(10−3 mm/year)
IE (%)
Pure Copper (5 days)1.778−0.18720.6-
200 µm (5 days)0.204−0.2052.3688.5
50 µm (5 days)0.234−0.2122.7186.8
30 µm (5 days)0.224−0.2122.687.4
Pure Copper (1 month)1.95−0.1392.26-
200 µm (1 month)0.355−0.1974.1281.8
50 µm (1 month)0.398−0.2074.6179.6
30 µm (1 month)0.447−0.2015.1877.0
Pure Copper (2 month)6.69−0.11977.6-
200 µm (2 month)1.62−0.17118.875.8
50 µm (2 month)1.95−0.18922.670.9
30 µm (2 month)1.91−0.19022.171.5
Disclaimer/Publisher’s Note: The statements, opinions and data contained in all publications are solely those of the individual author(s) and contributor(s) and not of MDPI and/or the editor(s). MDPI and/or the editor(s) disclaim responsibility for any injury to people or property resulting from any ideas, methods, instructions or products referred to in the content.