Article

Enhancing the Mechanical Robustness of Aerosol-Based Brittle Pt/C Electrodes Through Thermal Annealing

1
Department of Mechanical and Automotive Engineering, Kongju National University, Cheonan-daero 1223-24, Seobuk-gu, Cheonan-si 31080, Republic of Korea
2
Department of Mechanical Engineering, Kongju National University, Cheonan-daero 1223-24, Seobuk-gu, Cheonan-si 31080, Republic of Korea
3
Agency for Defense Development, P.O. Box 35, Yuseong-gu, Daejeon 34186, Republic of Korea
4
Research Institute of Global Manufacturing Technology, Kongju National University, Cheonan-daero 1223-24, Seobuk-gu, Cheonan-si 31080, Republic of Korea
*
Authors to whom correspondence should be addressed.
Coatings 2025, 15(11), 1331; https://doi.org/10.3390/coatings15111331 (registering DOI)
Submission received: 13 October 2025 / Revised: 8 November 2025 / Accepted: 11 November 2025 / Published: 15 November 2025

Abstract

Nanoporous Pt/C electrodes fabricated via aerosol coating offer excellent reactant delivery and electrochemical activity owing to their high porosity. However, the practical application prospects of such electrodes are limited by their poor mechanical properties. Herein, we quantitatively analyze the effects of thermal annealing (at 110, 150, 190, and 230 °C) on the mechanical stability and electrical properties of aerosol-based Pt/C electrodes. Post-annealing at an optimal temperature of 190 °C improved the tensile strength by 65.3%, increased their elongation from 0.82% to 1.78%, and decreased the electrical resistance while maintaining the secondary pore structure. Analyses of the electrode’s surface roughness, pore structure, and contact angle indicate that thermal reconstruction of the ionomer is crucial for stabilizing the electrode structure and controlling its surface properties. Finite element simulations using experimentally measured single-electrode properties enabled accurate prediction of the mechanical behavior of the membrane electrode assembly. These results provide design guidelines for balancing the process efficiency with the mechanical stability of aerosol-based Pt/C electrodes and can be used to improve their application prospects in aerosol-based fuel cell catalyst layers.

1. Introduction

Nanoporous ionomer-bound carbon films are composite nanostructures in which carbon nanoparticles are encapsulated by an ionomer binder polymer such as Nafion. A thin (few nm thick) ionomer layer coats the surface of each carbon nanoparticle, which forms a nano-network structure [1]. The film has a porous internal architecture that comprises primary pores (d < ~20 nm) within agglomerated carbon nanoparticles and secondary pores (d > ~20 nm) that form between adjacent agglomerates [2]. This nanoporous structure typically develops during the drying of the slurry solution [3] and offers uniform porosity and a continuous network throughout the film. The nano-network provides efficient pathways for electron, ion, and gas transport, thereby maximizing the electrical conductivity, ionic conductivity, and gas permeability of the film. Therefore, these carbon films have been widely used in various electronic and energy devices, which take advantage of the excellent electronic conductivity of the carbon nanoparticles, high proton conductivity of the ionomer binder, and superior gas permeability of the pore structure. Representative applications include polymer electrolyte membrane fuel cells [4,5], polymer electrolyte membrane water electrolyzers [6,7], sensors [8], and electroactive polymers [9,10]. Furthermore, recent research has explored their use in wearable and bioelectronic device applications that exploit the flexible structural characteristics afforded by the polymer-based ionomer binder [11].
The pore structure of the nanoporous ionomer-bound carbon films plays a critical role in gas diffusion, liquid water removal, and ion conduction, thereby maximizing the electrochemical reaction efficiency [12]. An increase in porosity facilitates easier oxygen diffusion to the surface of the platinum catalyst via pores, which increases the oxygen concentration in the catalyst layer and improves the electrochemical activity of the cathode reaction. An increase in gas permeability reduces the mass transport resistance for reactant gases, which enables stable operations at high current densities and increases the limiting current density [13,14]. Accordingly, various fabrication methods have been developed to optimize the porosity of these films. The most common of these is aerosol-based spray coating, which yields films with sufficiently high porosities [15,16]. Inkjet printing and sputtering techniques have also been used to fabricate these films [17]. Freeze-drying techniques, in which the solvent is directly removed via vaporization, lead to higher porosities compared with those obtained using other drying methods [3]. The incorporation of pore-forming agents (e.g., ammonium bicarbonate or lithium carbonate) into the ink formulation has also been considered [18,19]. Tranter et al. [20] achieved a decrease in oxygen transport resistance and an increase in power density by intentionally inducing cracks within the film by controlling the ink drying rate via varying the drying temperature. However, pores can also act as defects within the film, leading to mechanical degradation. Pores reduce the effective load-carrying cross-section of the film; thus, the regions surrounding the pores become stress concentration sites, resulting in localized regions of high stress at interfaces [21,22,23]. Consequently, the film’s mechanical properties (e.g., Young’s modulus, tensile strength, and elongation) degrade, which can compromise the long-term durability of devices that use nanoporous ionomer-bound carbon films [24].
In this study, we demonstrate a simple thermal reconfiguration method to improve the mechanical behavior of fragile aerosol-based nanoporous ionomer-bound carbon films. Heating above the glass transition temperature (Tg) of the ionomer can induce structural rearrangement within polymer chains, leading to nanostructural reinforcement [25,26]. This thermally driven rearrangement facilitates crystallization and reorganization of the ionomer matrix, which can improve interparticle connectivity and strengthen the overall network. Aerosol-based nanoporous ionomer-bound carbon films containing 30 wt.% Nafion ionomer were fabricated via spray coating in a free-standing state using a humidity-induced self-delamination method to ensure accurate evaluation of the mechanical properties [27]. The findings of this study can be used to improve the mechanical stability and accelerate the commercialization of devices that utilize nanoporous ionomer-bound carbon films.

2. Materials and Methods

2.1. Coating Solution Materials

The ratio of solid to solvent was set to 1:19, and the ionomer (Nafion D2021, Dupont, Wilmington, DE, USA) content in the solid phase was adjusted to 30 wt.%. Nafion loading governs both the electrochemical activity and mechanical behavior of the catalyst layers. Previous studies have shown that the electrochemical performance of the catalyst improves as the ionomer fraction increases up to 30 wt.% but decreases at higher contents owing to mass-transport limitations, lower electronic conductivity, and the loss of accessible electrochemical surface area [28,29]. Although increasing the ionomer content above 30 wt.% can further reinforce the carbon–ionomer networks and enhance mechanical robustness [30,31], this benefit accompanies a decrease in the electrocatalytic performance. Therefore, an ionomer content of 30 wt.% was adopted in this study as a balanced composition that ensures both sufficient mechanical integrity and desirable electrochemical performance.
Pt/C powder (40 wt.% Pt on Vulcan XC-72, Premetek, Cherry Hill, NJ, USA), isopropyl alcohol, and deionized water (18.3 MΩ·mm) were added to a vial and mixed. Homogeneous dispersion of the powder in the solvent could not be achieved via simple shaking; accordingly, the mixture was shaken gently and subsequently subjected to ultrasonic treatment (30% amplitude, 2 s pulse, 1 s holding time, 10 min total) at 20 °C using an ultrasonic processor (VC-505, Sonics, Newtown, CT, USA) to prepare the aerosol-based coating solution.

2.2. Pt/C Electrode Fabrication

A square glass substrate with a side length of 50 mm was coated with 2 mL of the prepared aerosol solution using a spray gun (Figure 1a) to produce the Pt/C electrode. To prevent the solution from aggregating during coating, approximately 0.2 mL was uniformly sprayed onto the glass substrate in a single layer, followed by rapid drying using an infrared irradiator. The high solvent content on the coated electrode evaporated during this process, which created a large number of pores [15,32]. This process was repeated until the entire solution volume was consumed (Figure 1b). A Pt/C electrode formed on the surface of the glass substrate following the aerosol coating (Figure 1c). The electrode was then annealed at 110 °C for 2 h using a forced convection oven (OF-22GW, JeioTech, Daejeon, Republic of Korea). The coated electrode was then separated from the glass substrate for post-annealing and tensile testing. The coated glass substrate was immersed in deionized water for 1 h (Figure S1a), lifted out of the water, and re-immersed (Figure S1b). The Pt/C electrode detached from the glass substrate owing to the surface tension of the water (Figure S1c). After detachment, the floating Pt/C electrode floating on the water surface after detachment (Figure S1d) was carefully transferred to a Teflon sheet and dried (Figure S1e,f) to obtain a free-standing Pt/C electrode (Figure S1g,h) [33]. The macroscopic shape of the free-standing Pt/C electrode was a thin film (Figure 1d). The electrode’s surface exhibited irregularities and numerous bumps owing to the irregularity of the aerosol coating process (Figure 1e). Primary pores were formed within the primary particles that agglomerated during spraying, whereas secondary pores were formed between the large agglomerates that were formed immediately after deposition (Figure 1f) [2,15]. Post-annealing was performed in a forced convection oven at 150, 190, and 230 °C to strengthen the mechanical properties of the fabricated free-standing electrode [27].

2.3. Free-Standing Tensile Test Specimen Preparation

The Pt/C catalyst layer exhibited poor mechanical properties (Figure 2a). Therefore, a dedicated polytetrafluoroethylene (PTFE) transfer device was used to handle the Pt/C electrode (Figure 2b). PTFE is suitable for electrode handling because of its strong triboelectric charging behavior, in which the contact and friction between two different materials induce charge transfer and generate electrostatic force (Figure 2c,d). The PTFE transfer device was rubbed against a fabric material to induce electrostatic force before the transfer [34]. A thin-film tensile tester (Modular Force Stage, Linkam, Salfords, UK) was used to examine the mechanical properties of the electrode, and a 2 N load cell (force resolution of 1 × 10⁻⁵ N) was used to accurately measure the applied load during the tensile tests (Figure 2e). The Pt/C electrodes were secured using polydimethylsiloxane (PDMS) grips that adhere via van der Waals forces (Figure 2f–h) [35,36]. The electrode specimen was uniformly attached to the PDMS grips to avoid partial detachment or uneven contact. After mounting, a preload of 0.00015 N was applied at the beginning of the tensile test to ensure that all sections were subjected to loading.

2.4. Characterization

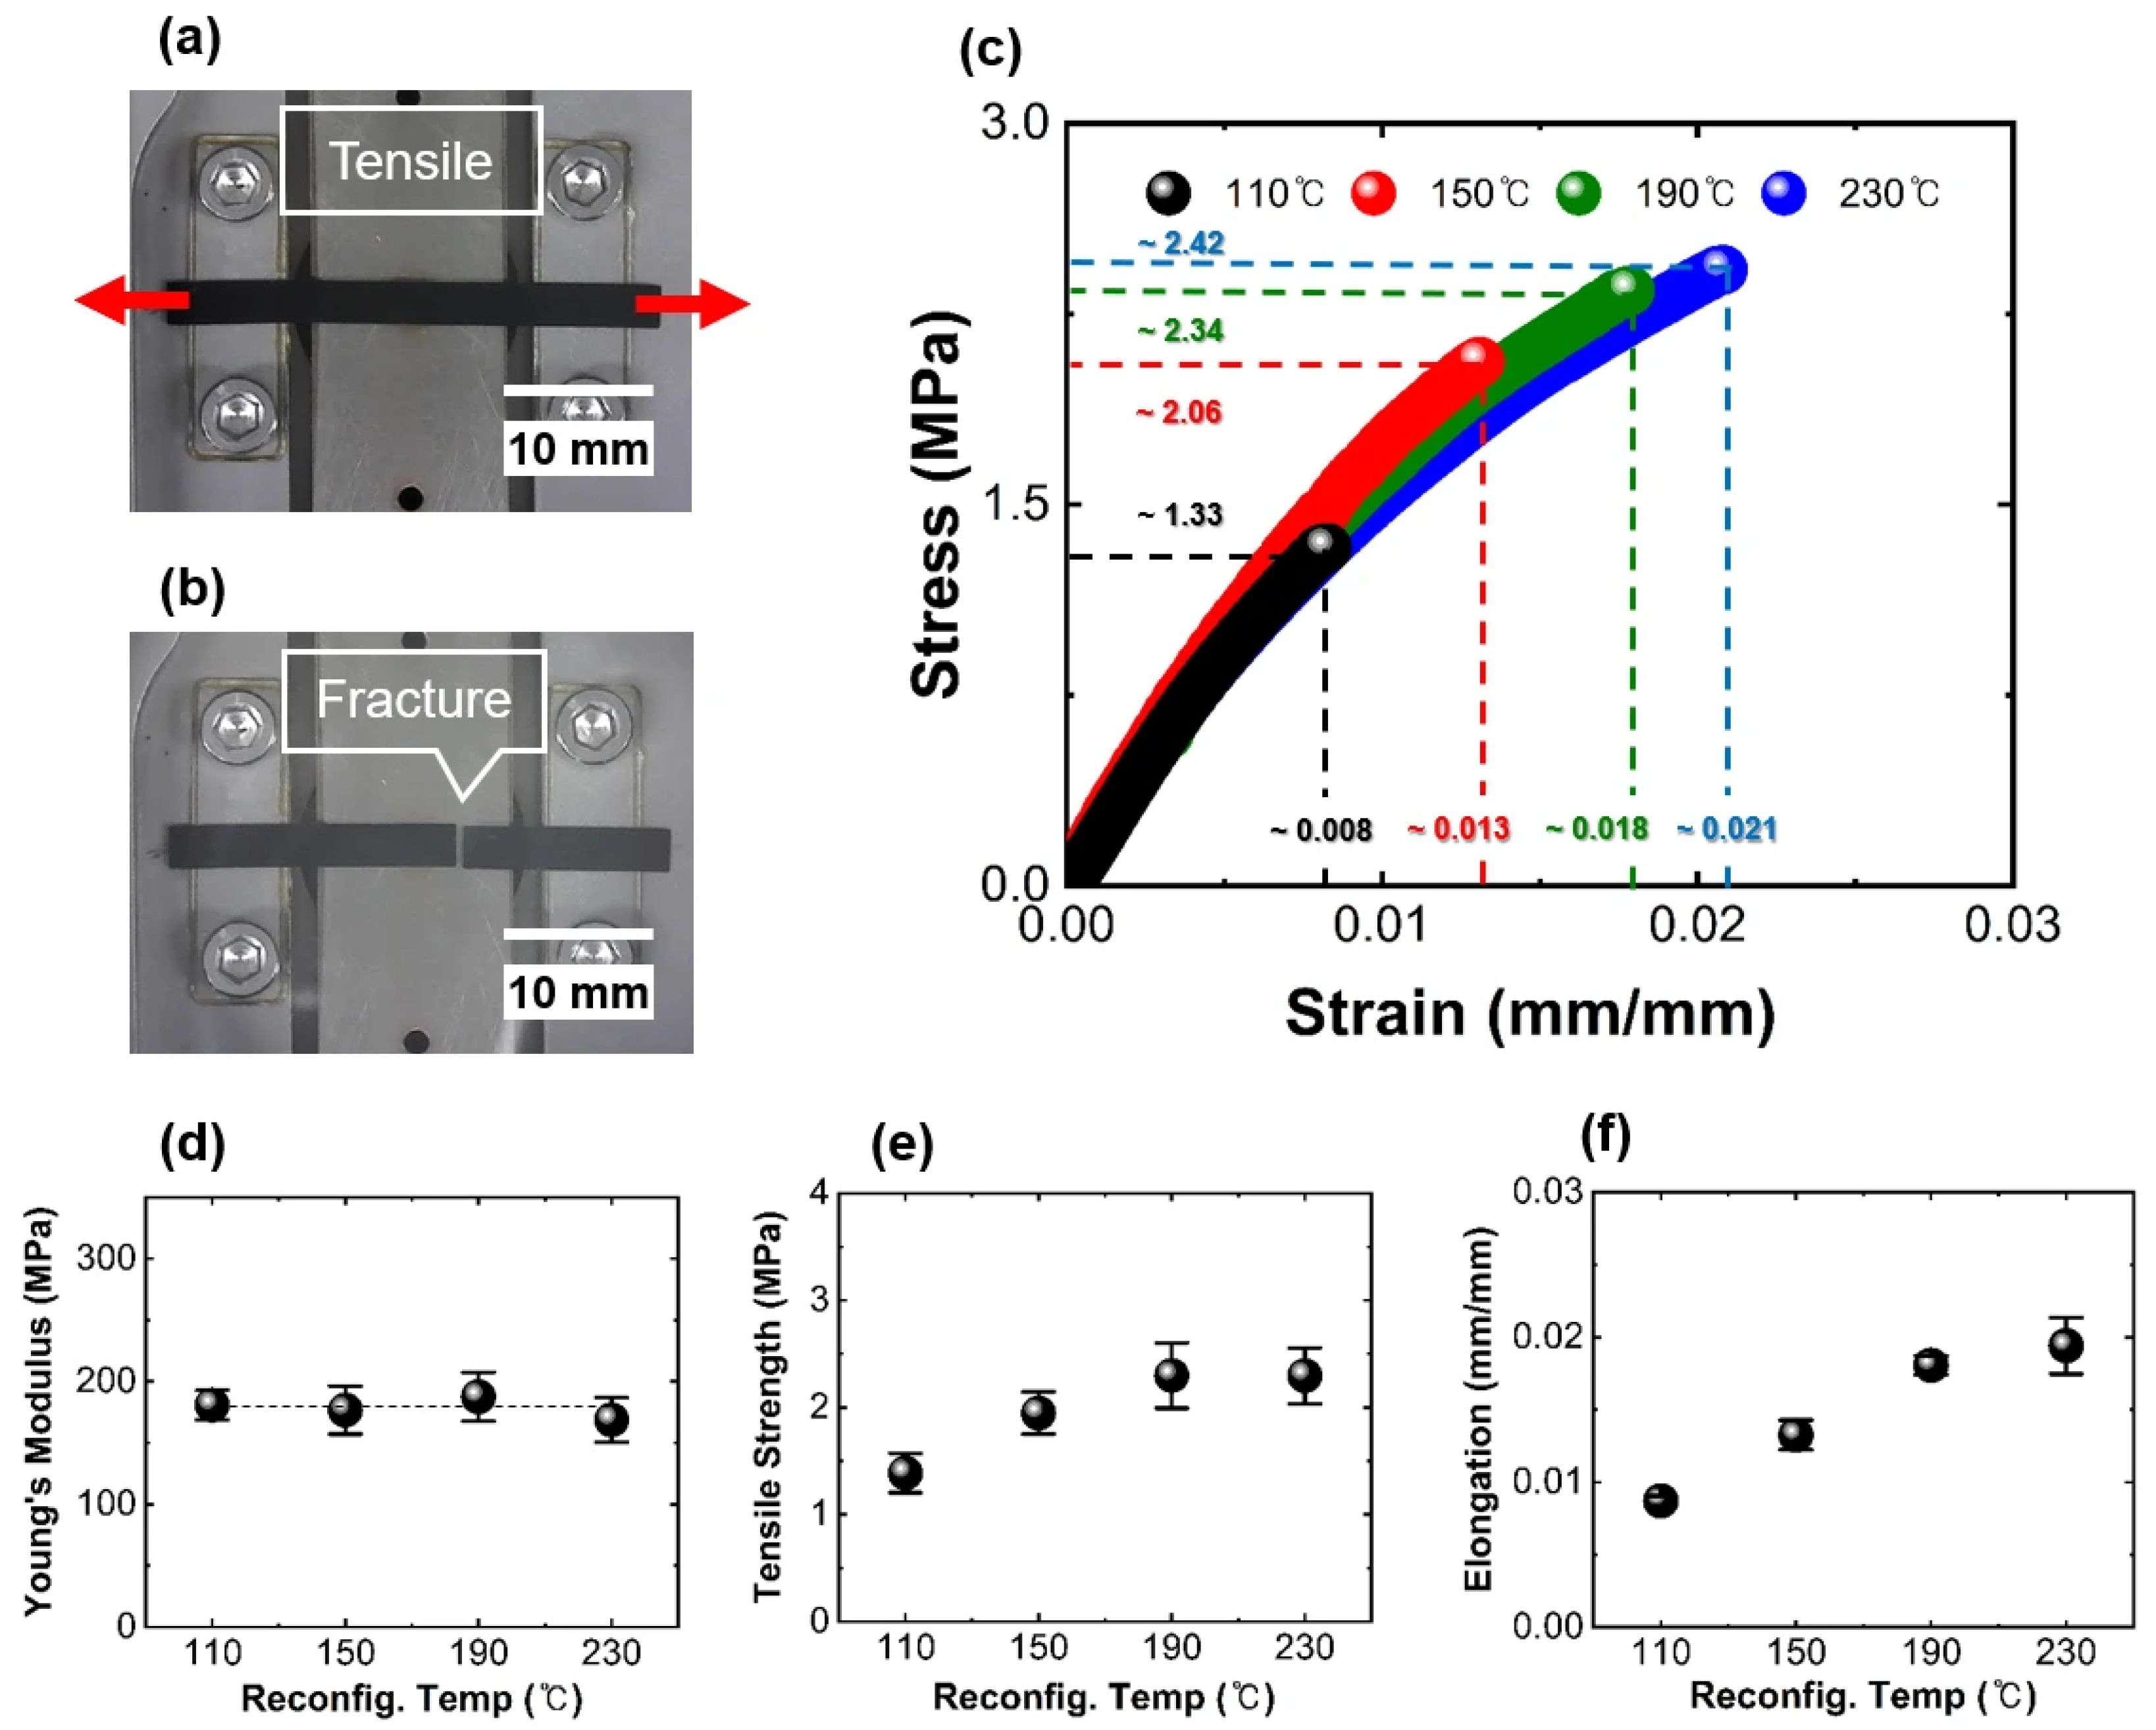
The Young’s modulus, tensile strength, and elongation of the free-standing films were measured using a micro tensile tester. The tensile tests were conducted at a strain rate of 0.6 μm/s (Figure 3a). The specimen dimensions were set to a length of at least 25 mm and a width of 3 mm. The tensile tests were terminated upon fracture of the specimen during elongation (Figure 3b). The tensile tests were repeated at least five times for each post-annealing temperature.
Aerosol-based nanoporous ionomer-bound carbon films generally have rough and irregular surfaces owing to the nature of the spray-coating process. In this process, atomized ink droplets dry and solidify non-uniformly upon deposition, leading to surface topology variations. These rough surfaces can introduce stress concentrations and interfacial defects that eventually cause delamination, cracking, and reduced structural integrity over time [37,38]. The morphologies of the carbon films annealed at 110, 150, 190, and 230 °C were examined using AFM and calibrated using the XEI software 4.3 (Park Systems, Suwon, Republic of Korea). A rotated-tip AFM probe (PR-T300, Probes, Seoul, Republic of Korea) was used with a tip height of 17 µm, a tip radius of 7–10 nm, and a beam-type cantilever (125 µm × 30 µm × 4 µm).
The wettability characteristics of the coated electrodes as a function of the post-annealing temperature were investigated using contact angle measurements. Measuring the angle at the liquid–gas–solid interface when a liquid droplet is placed on a solid surface is a representative method for quantitatively evaluating the surface wettability. In general, a contact angle less than 90° indicates a hydrophilic surface, whereas angles greater than 90° and greater than 150° indicate hydrophobic and superhydrophobic surfaces, respectively. The measurements were performed under static conditions using a contact angle measurement system (Smartdrop, Femtobiomed.inc., Seongnam, Republic of Korea), in which 10 μL of deionized water was dropped onto the specimen surface. The contact angle was measured at least four times for each electrode (Figure S2).
The surface areas and pore characteristics of the films were quantified using Brunauer–Emmett–Teller (BET) and Barrett–Joyner–Halenda (BJH) pore size analyses. The pore characteristics of the electrode after post-annealing were quantified using nitrogen adsorption–desorption measurements. These measurements provide insight into variations in the pore distribution and nanostructure at the various post-annealing temperatures.

2.5. Finite Element Simulations

We developed a method to measure the mechanical properties of the electrode at the single-electrode scale and compared the experimentally obtained SS curves with those obtained using finite element simulations. For each post-annealed membrane electrode assembly (MEA) the measured properties of each constituent layer were incorporated into a three-layer (electrode/Nafion 211/electrode) model in the COMSOL Multiphysics® simulation software ver. 6.3 (COMSOL AB, Stockholm, Sweden) (Figure 4a). The simulation parameters and mechanical property values of each post-annealing condition, reproducible by simulation, are summarized in Table 1. It should be noted that the elastic–linear plastic constitutive model used in this simulation is a valid simplification of the specific and quasi-static tensile conditions that were tested (i.e., a constant strain rate of 0.6 μm/s and at 25 °C, 60% relative humidity) (Figure 4a,b). The computational domain was discretized using a hexahedral mesh comprising 1050 elements (Figure 4c).

3. Results and Discussion

3.1. Mechanical Properties of the Aerosol-Based Electrode

The stress–strain (SS) curves indicate that both the elongation and tensile strength increased with increasing post-annealing temperature (Figure 3c). The Young’s modulus was 178.4 MPa and did not change (within error) with the post-annealing heat treatment temperature (Figure 3d). Compared with the tensile strength of the electrode annealed at 110 °C (1.39 MPa), those of the specimens post-annealed at 150, 190, and 230 °C increased by 40.3%, 65.3%, and 65.2% to 1.95, 2.298, and 2.296 MPa, respectively (Figure 3e). The elongations of these specimens also increased by 52%, 107%, and 123%, respectively, compared with that of the electrode annealed at 110 °C (Figure 3f).
The experimental and simulated SS curves were compared. The proportional limit stress and isotropic tangent modulus of the plastic region are as shown in Figure 4d. The elastic–plastic transition in the MEA was visualized by using stress contour plots (Figure 4e). We acknowledge that ionomer-containing materials can exhibit more complex viscoelastic or rate-dependent behavior, particularly under dynamic loading or variable hygrothermal conditions. However, the primary goal of these simulations was not to predict the dynamic behavior of the specimens but to validate whether the single-electrode properties measured under quasi-static conditions could accurately predict the mechanical behavior of the full MEA. The simulated SS curves for the MEA closely matched the experimental data (Figure 4f–i); therefore, this model was sufficient and effective for the specific validation scope of this study.

3.2. Electrode Surface Characteristics

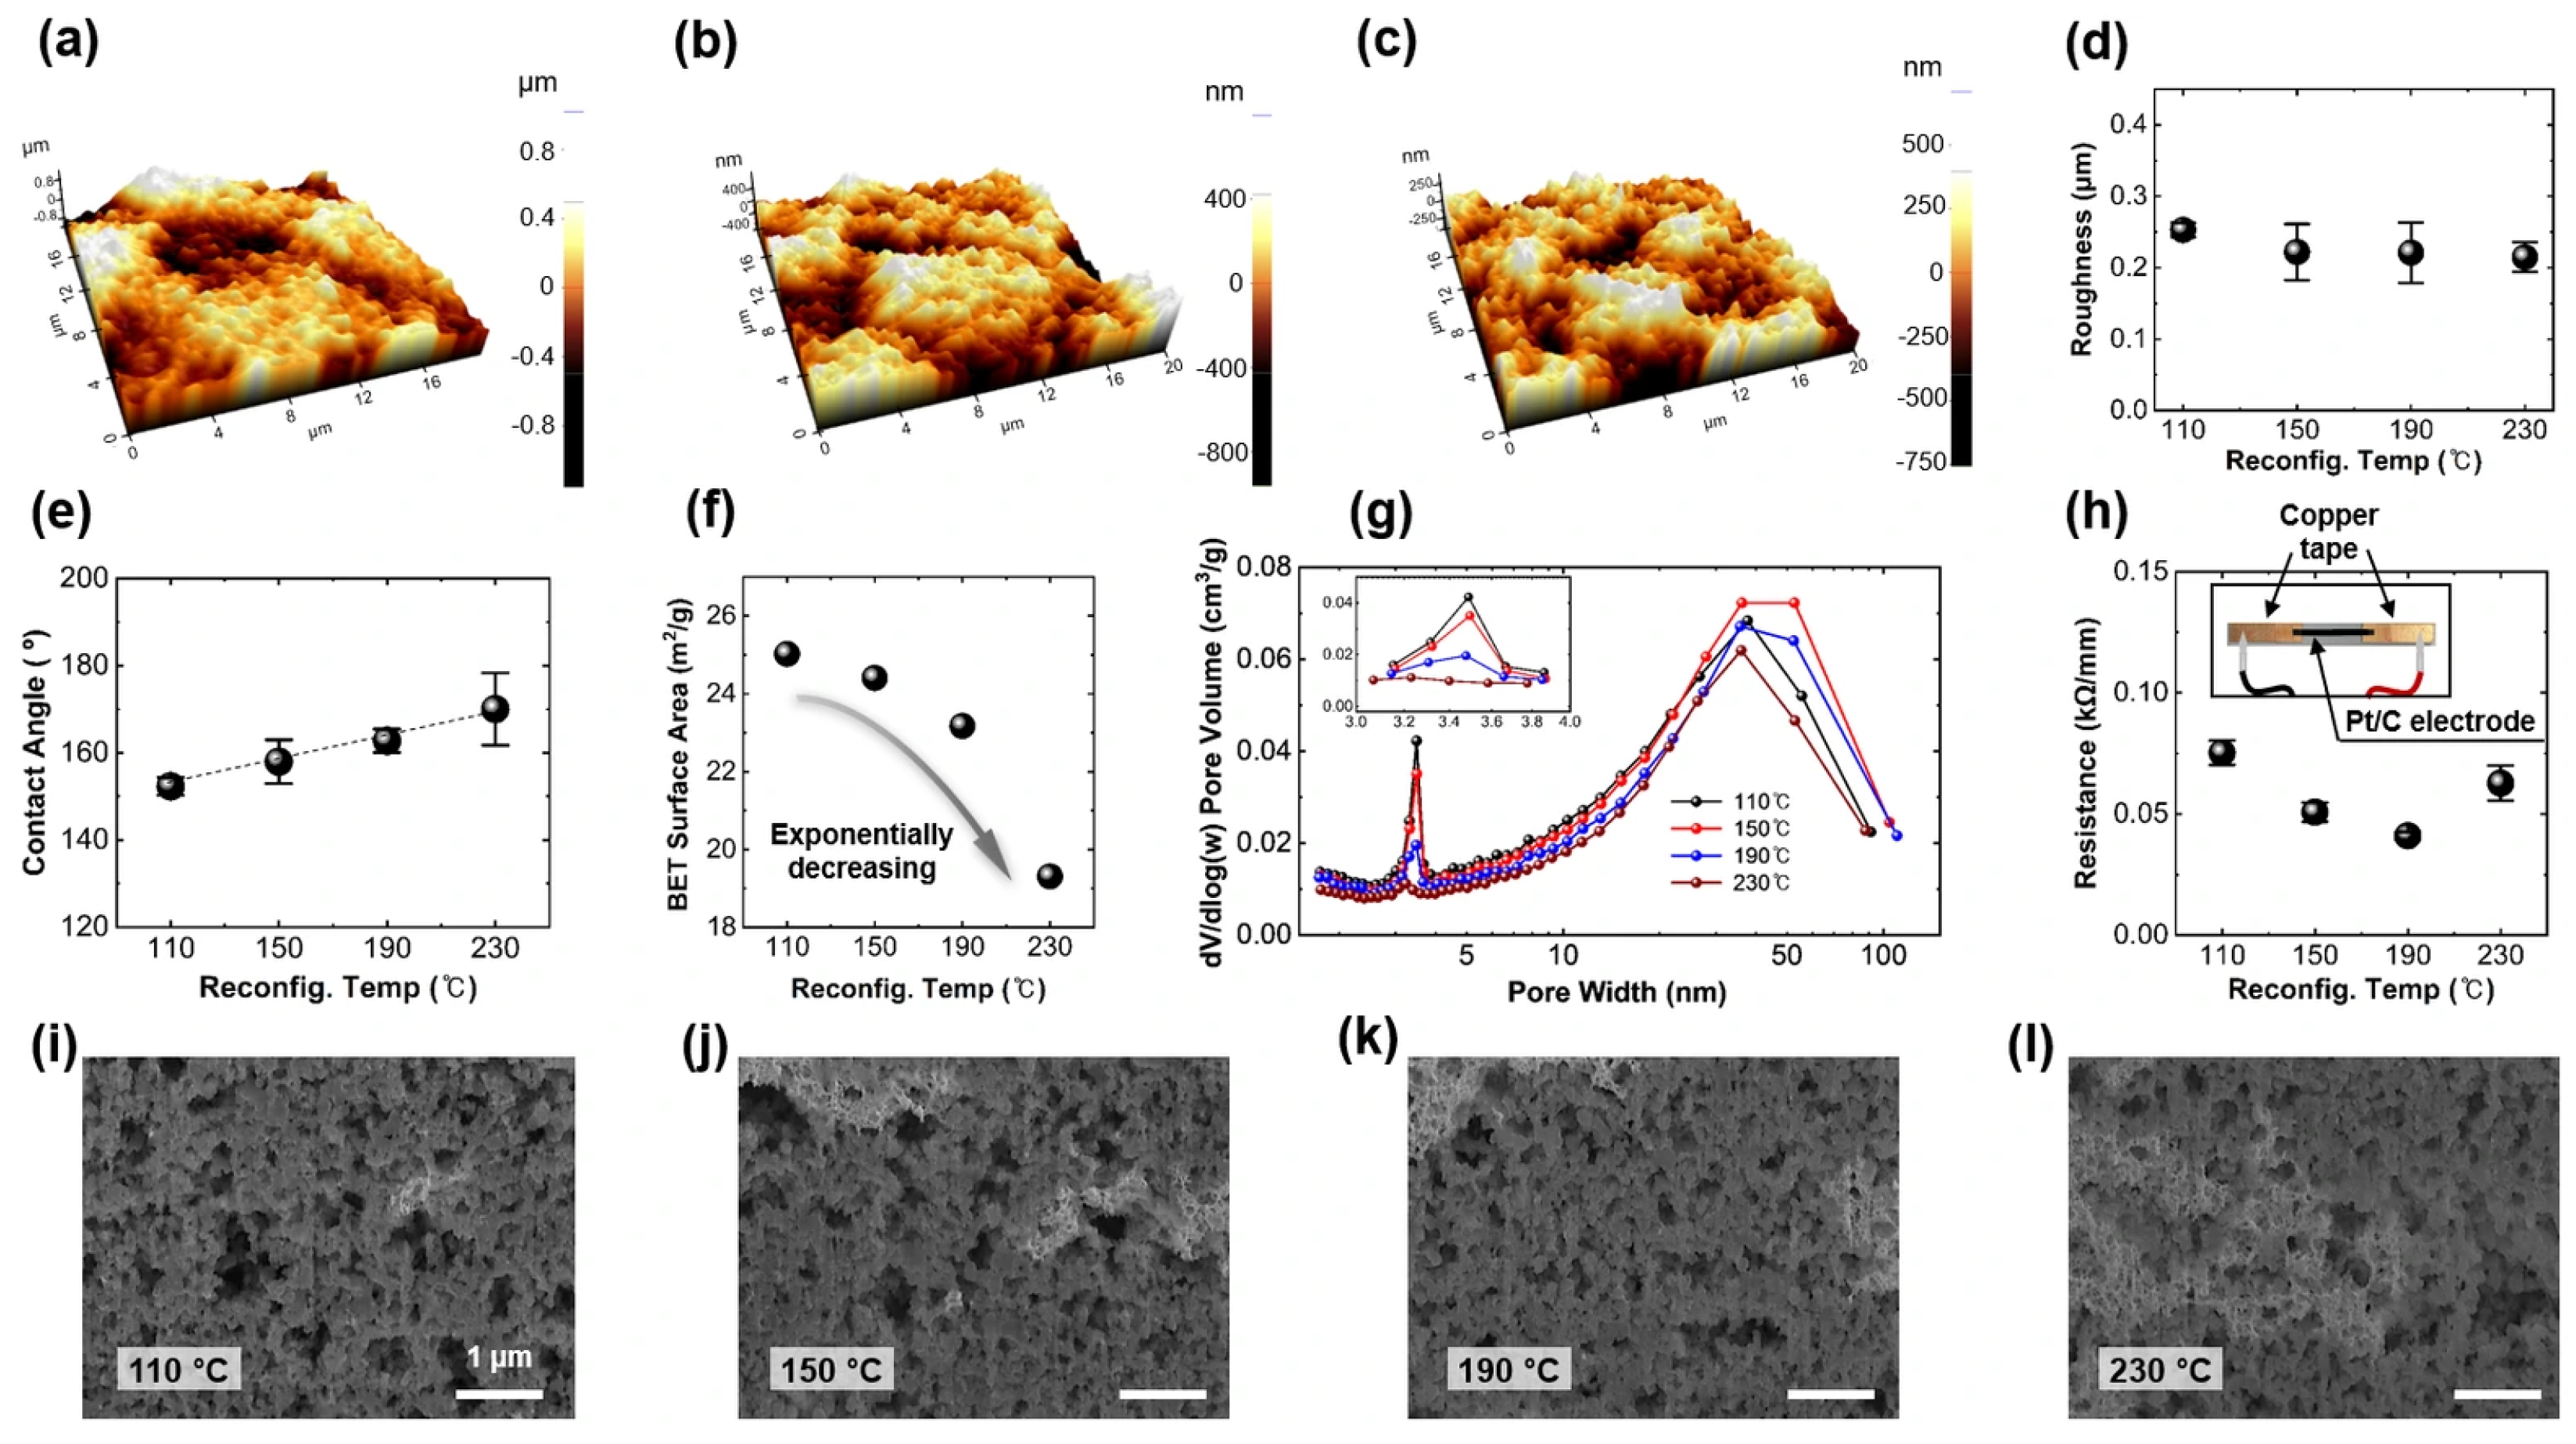
As shown in Figure 5a, the electrode annealed at 110 °C exhibited microscale surface roughness, whereas the electrode post-annealed at 190 °C exhibited reduced (i.e., nanoscale) surface roughness (Figure 5b). The electrode post-annealed at 230 °C exhibited an even smaller scale of surface roughness compared with that of the electrode post-annealed at 190 °C (Figure 5c). The AFM results (Figure 5d) indicate that the surface roughness decreased slightly with increasing post-annealing temperature. This decrease can be attributed to nanopore shrinkage and internal nanostructure rearrangement owing to increased crystallization of the ionomer chains when heated above Tg, which decreased the difference between the heights of the protrusions and depressions on the surface. Thus, by planarizing the internal interface of the film, post-annealing can improve layer adhesion, mitigate mechanical degradation, and ultimately improve the durability of devices incorporating these films.
The contact angle for the electrode annealed at 110 °C was approximately 152° (Figure S2a). The electrodes post-annealed at 150 °C and 190 °C had contact angles of 158° and 162°, respectively (Figure S2b,c). The contact angle increased linearly with increasing post-annealing temperature (Figure 5e). The contact angle of the electrode post-annealed at 230 °C was approximately 170° (Figure S2d). This increase can be attributed to the thermal reorganization of the ionomer’s polymer chains. At higher post-annealing temperatures, the chains gain enhanced mobility, which allows the hydrophilic sulfonic acid side chains to reorient away from the film–air interface. This reorientation simultaneously promotes the exposure and alignment of the intrinsically hydrophobic PTFE main chain at the surface, which strengthens the surface hydrophobicity [43]. The observed linear trend suggests that the post-annealing temperature enables continuous and predictable modulation of the surface structure.

3.3. Pore Structure Characteristics of the Pore Structure of the Electrodes

The BET analysis indicates a sharp decrease in the BET surface area with increasing post-annealing temperatures (Figure 5f). In addition, the BJH analysis indicates that the primary pore (d < ~20 nm) volume decreases as the post-annealing temperature increases (Figure 5g). These changes in the pore structure resulted from the thermal restructuring of the ionomer binder within the film. In Nafion, the ionomer undergoes crystallization above Tg, which leads to a dense packing of the PTFE backbone and a corresponding thermal contraction that reduces the specific surface area and primary pore volume. Specifically, under post-annealing at 230 °C (above the second transition temperature of the Nafion ionomer), the melting and redistribution of the ionomer nearly eliminate the primary pores and lead to a considerable decrease in the specific surface. However, in nanoporous ionomer-bound carbon films, the reactive sites where the Pt catalyst, conductive carbon, and ionomer membrane form a three-phase boundary correspond to the secondary pores that are formed between the carbon nanoparticle agglomerates. Therefore, the loss of the primary pores owing to thermal reconfiguration is not expected to significantly affect the electrochemical performance.
To visually compare the changes in the pore structure of the specimens, cross-sectional focused ion beam-scanning electron microscopy images of the Pt/C electrodes post-annealed at different temperatures were obtained (Figure 5i–l). Image analysis indicates that the variations in pore distribution among the post-annealed specimens were not pronounced enough to be distinguishable by visual inspection. This result can be attributed to the fact that most of the pore alterations occurred in the primary nanopore region (d < ~20 nm) between the carbon nanoparticles and ionomer binder.
The change in resistance resulting from internal structural changes in the electrodes owing to post-annealing was analyzed using electrode resistance measurements. The aerosol-coated Pt/C electrodes were mounted on a highly conductive copper tape, and the resistance was measured using a digital multimeter (KEW 1009, Kyoritsu, Tokyo, Japan). The resistance of the electrode annealed at 110 °C was 0.07527 kΩ/mm, whereas those of the electrodes post-annealed at 150 and 190 °C were 0.05075 and 0.041 kΩ/mm, respectively, indicating a gradual decrease in resistance with an increase in the post-annealing temperature (Figure 5h). However, the resistance of the electrode post-annealed at 230 °C (i.e., above the Tg of 205 °C) was 0.06272 kΩ/mm. This result deviates from the expectation that the electrode resistance decreases monotonically with increasing post-annealing temperature. Up to 190 °C, ionomer chain mobility and crystallization cause shrinkage and reduce the spacing between the Pt/C particles, thereby facilitating electron transport. However, at 230 °C, the ionomer undergoes a melt-flow phenomenon. Consequently, the ionomer, which intrinsically has a lower electrical conductivity, obstructs the contact points between the Pt/C particles and disrupts electronic pathways, leading to an increase in resistance [26].

3.4. Thermally Induced Reconfiguration

The electrode annealed at 110 °C contained numerous micropores, and the bond between the ionomer and Pt/C particles was weak; hence, fracture occurred readily under tensile stress (Figure 6a,d). The electrode post-annealed at 190 °C slightly cracked without being completely broken when tensile stress occurred, owing to the crystallization and folding of the ionomer (Figure 6b,e) [26]. For the electrode post-annealed at 230 °C (i.e., above the second glass transition temperature), folding and melt-bonding of the ionomer occurred. Consequently, the ionomer firmly and densely filled the fine gap, and the Pt/C electrode resisted fracture under tensile stress, leading to high elongation and tensile strength values (Figure 6c,f) [26,27].
However, an increase in the post-annealing temperature did not have a consistently positive effect on the aerosol-based Pt/C electrodes. The BJH analysis results confirmed that the primary pore volume decreased considerably as the post-annealing temperature increased. However, the secondary pore volume also tended to decrease (Figure 5g), which suggests that optimal conditions are essential because of the decrease in porosity caused by post-annealing. The electrode resistance decreased monotonically up to post-annealing temperatures of 190 °C but increased at 230 °C (Figure 5h). Therefore, 190 °C is the optimal post-annealing temperature with respect to electrical performance. In addition, the SS curve analysis indicates that the electrodes post-annealed at 190 and 230 °C exhibited similar mechanical properties (Figure 3c). However, the electrode post-annealed at 190 °C did not undergo melt-bonding, which ensured that adequate porosity was maintained. Therefore, post-annealing at 190 °C is optimal because it ensures that the effective porous structure produced by the aerosol process is retained while improving the mechanical properties. These findings are further supported by the results demonstrating that ionomer-bound carbon electrodes annealed at 190 °C exhibit the highest electrochemical performance among those treated from 110 to 230 °C, as confirmed by cell performance analysis (IV polarization curves and power density measurements) [31].
Furthermore, the surface properties described in Section 3.2 provide an additional advantage at the optimal 190 °C condition. An increased surface hydrophobicity has direct implications for water management, which requires a delicate balance. Although excessive hydrophilicity can cause pore ‘flooding’ [44], excessive hydrophobicity may hinder ionomer hydration. Therefore, the moderate increase in hydrophobicity observed at 190 °C is advantageous, as it should facilitate liquid water removal and mitigate flooding. This complements the observation that the electrode post-annealed at 190 °C adequately retained its secondary pore structure, unlike the electrode post-annealed at 230 °C. The combination of an open pore network for gas diffusion and a moderately hydrophobic surface for water removal could improve mass transport and stabilize performance, particularly at high humidities or current densities.

4. Conclusions

The mechanical stability of brittle aerosol-based Pt/C electrodes was considerably improved by thermal annealing in this study. We investigated the properties of the ionomer binder by controlling its main and side-chain glass transition temperatures during thermal treatment. After post-annealing, the mechanical properties of the electrode tended to improve. Comprehensive BET, BJH, and electrical resistance analyses confirmed that post-annealing at 190 °C yielded the optimal balance between pore distribution and resistance reduction. These findings can be used to design aerosol-based Pt/C electrodes that balance process efficiency with mechanical robustness. Furthermore, by measuring the mechanical properties at the single-electrode scale and incorporating them into detailed simulations, the true mechanical behavior of MEAs, which were previously considered bulk materials, in the design process can be predicted accurately. Our simulation results were in excellent agreement with the experimental tensile data, thereby confirming the reliability of both the measurements and the modeling approach. This integrated methodology establishes a solid foundation for future research on catalyst layer performance and long-term operational durability, enabling the precise optimization of both material selection and processing conditions. Although this study successfully optimized the mechanical properties of an aerosol-based Pt/C electrode, a dedicated long-term durability study (e.g., an accelerated stress test) should be performed in the future to fully validate the operational stability of these robust electrodes.

Supplementary Materials

The following supporting information can be downloaded from https://www.mdpi.com/article/10.3390/coatings15111331/s1: Figure S1: Process for obtaining free-standing Pt/C electrodes. (a) The electrode was soaked in deionized (DI) water. (b) The substrate was briefly removed from DI water. (c) Separation of the glass substrate and the Pt/C electrode. (d) Pt/C electrodes floating on the water surface. (e) Pt/C Electrode scooped up on the surface of DI water. (f) Electrode moisture drying. (g) Removing the electrode from Teflon. (h) Resulting free-standing Pt/C electrode; Figure S2: Photographs of the electrode contact angle measurements for different heat-treatment temperatures. (a) Pt/C electrode annealed at 110 °C. Pt/C electrode post-annealed at (b) 150 °C, (c) 190 °C, and (d) 230 °C.

Author Contributions

Conceptualization: N.H. and J.-B.P.; Methodology: N.H., W.-Y.J. and J.H.K.; Software: W.-Y.J. and J.-B.P.; Validation: N.H. and W.-Y.J.; Formal Analysis: N.H., J.H.K. and J.-B.P.; Investigation: N.H., W.-Y.J. and J.H.K.; resources: J.-B.P.; Writing—Original Draft Preparation: N.H., W.-Y.J., J.H.K. and J.-B.P.; Writing—Review & Editing: N.H. and J.-B.P.; Visualization: N.H., W.-Y.J. and J.H.K.; Supervision: J.H.K. and J.-B.P.; Project Administration: J.-B.P.; Funding Acquisition: J.-B.P. All authors have read and agreed to the published version of the manuscript.

Funding

This study was supported by the National Research Foundation of Korea (NRF) grant funded by the Korea government (MSIT) (No. 2022R1F1A1073173) and the Regional Innovation System & Education (RISE) program through the Chungnam RISE Center, funded by the Ministry of Education (MOE) and Chungcheongnam-do, Republic of Korea (No. 2025-RISE-12-003). This study was also supported by a research grant by the Kongju National University in 2022.

Institutional Review Board Statement

Not applicable.

Informed Consent Statement

Not applicable.

Data Availability Statement

The raw data supporting the conclusions of this article will be made available by the authors on request.

Conflicts of Interest

The authors declare no conflicts of interest.

Abbreviations

The following abbreviations are used in this manuscript:
AFMatomic force microscopy
BETBrunauer–Emmett–Teller
BJHBarrett–Joyner–Halenda
MEAmembrane electrode assembly
PDMSPolydimethylsiloxane
PTFEPolytetrafluoroethylene
SSstress–strain
Tgglass transition temperature

References

  1. Lopez-Haro, M.; Guétaz, L.; Printemps, T.; Morin, A.; Escribano, S.; Jouneau, P.H.; Bayle-Guillemaud, P.; Chandezon, F.; Gebel, G. Three-dimensional analysis of Nafion layers in fuel cell electrodes. Nat. Commun. 2014, 5, 5229. [Google Scholar] [CrossRef] [PubMed]
  2. Wang, M.; Park, J.H.; Kabir, S.; Neyerlin, K.C.; Kariuki, N.N.; Lv, H.; Stamenkovic, V.R.; Myers, D.J.; Ulsh, M.; Mauger, S.A. Impact of catalyst ink dispersing methodology on fuel cell performance using in-situ X-ray scattering. ACS Appl. Energy Mater. 2019, 2, 6417–6427. [Google Scholar] [CrossRef]
  3. Mo, S.; Du, L.; Huang, Z.; Chen, J.; Zhou, Y.; Wu, P.; Meng, L.; Wang, N.; Xing, L.; Zhao, M.; et al. Recent advances on PEM fuel cells: From key materials to membrane electrode assembly. Electrochem. Energy Rev. 2023, 6, 28. [Google Scholar] [CrossRef]
  4. Fink, C.; Karpenko-Jereb, L.; Ashton, S. Advanced CFD analysis of an air-cooled PEM fuel cell stack predicting the loss of performance with time. Fuel Cells 2016, 16, 490–503. [Google Scholar] [CrossRef]
  5. Cao, X.; Guo, H.; Han, Y.; Li, M.; Shang, C.; Zhao, R.; Huang, Q.; Li, M.; Zhang, Q.; Lv, F.; et al. Sandwiching intermetallic Pt3Fe and ionomer with porous N-doped carbon layers for oxygen reduction reaction. Nat. Commun. 2025, 16, 2851. [Google Scholar] [CrossRef]
  6. Feng, Q.; Yuan, X.Z.; Liu, G.; Wei, B.; Zhang, Z.; Li, H.; Wang, H. A review of proton exchange membrane water electrolysis on degradation mechanisms and mitigation strategies. J. Power Sources 2017, 366, 33–55. [Google Scholar] [CrossRef]
  7. Long, C.; Fang, F.; Wang, J.; Xia, B.; Shao, C.; Yu, Y.; Wang, Y. Tailoring carbon supports for high-stability platinum-based catalysts in proton exchange membrane water electrolysis. Fuller. Nanotub. Carbon Nanostruct. 2025, 33, 1–12. [Google Scholar] [CrossRef]
  8. Dai, J.; Liu, D.; Yin, X.; Wen, X.; Cai, G.; Zheng, L. Anisotropic elastomer ionomer composite-based strain sensors: Achieving high sensitivity and wide detection for human motion detection and wireless transmission. ACS Sens. 2024, 9, 2156–2165. [Google Scholar] [CrossRef]
  9. Lee, J.W.; Yoo, Y.T. Preparation and performance of IPMC actuators with electrospun Nafion®–MWNT composite electrodes. Sens. Actuators B 2011, 159, 103–111. [Google Scholar] [CrossRef]
  10. Xu, B.; Wang, S.; Zhang, Z.; Ling, J.; Wu, X. Improving the torsion performance of IPMC by changing the electrode separation. Sci. Rep. 2021, 11, 7639. [Google Scholar] [CrossRef] [PubMed]
  11. Wang, C.; Xia, K.; Wang, H.; Liang, X.; Yin, Z.; Zhang, Y. Advanced carbon for flexible and wearable electronics. Adv. Mater. 2019, 31, e1801072. [Google Scholar] [CrossRef]
  12. Suzuki, T.; Tanaka, H.; Hayase, M.; Tsushima, S.; Hirai, S. Investigation of porous structure formation of catalyst layers for proton exchange membrane fuel cells and their effect on cell performance. Int. J. Hydrogen Energy 2016, 41, 20326–20335. [Google Scholar] [CrossRef]
  13. Sabharwal, M.; Pant, L.M.; Putz, A.; Susac, D.; Jankovic, J.; Secanell, M. Analysis of catalyst layer microstructures: From imaging to performance. Fuel Cells 2016, 16, 734–753. [Google Scholar] [CrossRef]
  14. Larbi, B.; Alimi, W.; Chouikh, R.; Guizani, A. Effect of porosity and pressure on the PEM fuel cell performance. Int. J. Hydrogen Energy 2013, 38, 8542–8549. [Google Scholar] [CrossRef]
  15. Ahn, K.H.; Pyo, J.B.; Song, H.; Kim, T.S. Evaluation of stress distribution in carbon-based nanoporous electrode by three-dimensional nanostructural reconstruction. Sustain. Mater. Technol. 2024, 41, e01112. [Google Scholar] [CrossRef]
  16. Yu, H. Optimization of Ultra-Low Loading Catalyst Layers for Pemfc and Pemw Using Reactive Spray Deposition Technology; University of Connecticut: Storrs, CT, USA, 2017; Available online: https://www.proquest.com/dissertations-theses/optimization-ultra-low-loading-catalyst-layers/docview/3073206907/se-2 (accessed on 20 August 2025).
  17. Fouzaï, I.; Gentil, S.; Bassetto, V.C.; Silva, W.O.; Maher, R.; Girault, H.H. Catalytic layer-membrane electrode assembly methods for optimum triple phase boundaries and fuel cell performances. J. Mater. Chem. A 2021, 9, 11096–11123. [Google Scholar] [CrossRef]
  18. Zhao, J.; He, X.; Wang, L.; Tian, J.; Wan, C.; Jiang, C. Addition of NH4HCO3 as pore-former in membrane electrode assembly for PEMFC. Int. J. Hydrogen Energy 2007, 32, 380–384. [Google Scholar] [CrossRef]
  19. Fischer, A.; Jindra, J.; Wendt, H. Porosity and catalyst utilization of thin layer cathodes in air operated PEM-fuel cells. J. Appl. Electrochem. 1998, 28, 277–282. [Google Scholar] [CrossRef]
  20. Tranter, T.G.; Tam, M.; Gostick, J.T. The effect of cracks on the in-plane electrical conductivity of PEFC catalyst layers. Electroanalysis 2019, 31, 619–623. [Google Scholar] [CrossRef]
  21. Chen, Z.; Wang, X.; Giuliani, F.; Atkinson, A. Analyses of microstructural and elastic properties of porous SOFC cathodes based on focused ion beam tomography. J. Power Sources 2015, 273, 486–494. [Google Scholar] [CrossRef]
  22. Gumirova, V.; Razumovskaya, I.; Apel, P.; Bedin, S.; Naumov, A. The influence of mechanical stress micro fields around pores on the strength of elongated etched membrane. Membranes 2022, 12, 1168. [Google Scholar] [CrossRef] [PubMed]
  23. Zeleniakienė, D.; Kleveckas, T.; Liukaitis, J.; Fataraitė, E. The influence of porosity value and mode on soft polymer materials behaviour. Mater. Sci. 2003, 9, 201–205. [Google Scholar]
  24. Qiu, D.; Peng, L.; Lai, X.; Ni, M.; Lehnert, W. Mechanical failure and mitigation strategies for the membrane in a proton exchange membrane fuel cell. Renew. Sustain. Energy Rev. 2019, 113, 109289. [Google Scholar] [CrossRef]
  25. Jung, H.Y.; Kim, J.W. Role of the glass transition temperature of nafion 117 membrane in the preparation of the membrane electrode assembly in a direct methanol fuel cell (DMFC). Int. J. Hydrogen Energy 2012, 37, 12580–12585. [Google Scholar] [CrossRef]
  26. Pyo, J.B.; Kim, J.H.; Kim, K.; Kim, T.S. Electrical resistance change in thermally reconfigured nanoporous ionomer-bound carbon films. J. Mater. Chem. A 2021, 9, 13019–13025. [Google Scholar] [CrossRef]
  27. Pyo, J.B.; Kim, J.H.; Kim, T.S. Highly robust nanostructured carbon films by thermal reconfiguration of ionomer binding. J. Mater. Chem. A 2020, 8, 24763–24773. [Google Scholar] [CrossRef]
  28. Suzuki, A.; Sen, U.; Hattori, T.; Miura, R.; Nagumo, R.; Tsuboi, H.; Hatakeyama, N.; Endou, A.; Takaba, H.; Williams, M.C.; et al. Ionomer content in the catalyst layer of polymer electrolyte membrane fuel cell (PEMFC): Effects on diffusion and performance. Int. J. Hydrogen. Energy 2011, 36, 2221–2229. [Google Scholar] [CrossRef]
  29. Qi, Z.; Kaufman, A. Low Pt loading high performance cathodes for PEM fuel cells. J. Power Sources 2003, 113, 37–43. [Google Scholar] [CrossRef]
  30. Kim, S.; Kim, J.H.; Oh, J.G.; Jang, K.L.; Jeong, B.H.; Hong, B.K.; Kim, T.S. Mechanical behavior of free-standing fuel cell electrodes on water surface. ACS Appl. Mater. Interfaces 2016, 8, 15391–15398. [Google Scholar] [CrossRef]
  31. Pyo, J.B.; Kim, J.H.; Kim, T.S. Prevention of frost-driven self-fracture of ionomer-bound carbon films by controlling freezable water domain size. Carbon Energy 2025, 7, e70098. [Google Scholar] [CrossRef]
  32. Palma, V.; Vaiano, V.; Matarangolo, M.; Anello, G. Comparison of Pt/C electrocatalyst deposition methods for PEM fuel cells. Chem. Eng. Trans. 2018, 70, 1525–1530. [Google Scholar] [CrossRef]
  33. Pyo, J.B.; Lee, S.; Kim, T.S. Intrinsic swelling behavior of free-standing nanoporous ionomer-bound carbon films. Polym. Test. 2021, 100, 107241. [Google Scholar] [CrossRef]
  34. Ciniero, A.; Fatti, G.; Marsili, M.; Dini, D.; Righi, M.C. Defects drive the tribocharging strength of PTFE: An ab-initio study. Nano Energy 2023, 112, 108502. [Google Scholar] [CrossRef]
  35. Kim, J.H.; Nizami, A.; Hwangbo, Y.; Jang, B.; Lee, H.J.; Woo, C.S.; Hyun, S.; Kim, T.S. Tensile testing of ultra-thin films on water surface. Nat. Commun. 2013, 4, 2520. [Google Scholar] [CrossRef]
  36. Lee, T.I.; Kim, J.H.; Oh, E.S.; Kim, T.S. Direct tensile testing of free-standing ultrathin polymer films on liquid surface at high temperature. Small Methods 2025, 9, e2401291. [Google Scholar] [CrossRef]
  37. Ma, S.; Qin, Y.; Liu, Y.; Sun, L.; Guo, Q.; Yin, Y. Delamination evolution of PEM fuel cell membrane/CL interface under asymmetric RH cycling and CL crack location. Appl. Energy 2022, 310, 118551. [Google Scholar] [CrossRef]
  38. Bahrami, M.; Chen, Y.; Kumar, N.; Orfino, F.P.; Dutta, M.; Lauritzen, M.; Setzler, E.; Agapov, A.L.; Kjeang, E. Degradation and deformation patterns in reinforced fuel cell membranes subjected to chemo-mechanical stress testing. J. Electrochem. Soc. 2025, 172, 054502. [Google Scholar] [CrossRef]
  39. Wang, Q.; Tang, F.; Li, B.; Dai, H.; Zheng, J.P.; Zhang, C.; Ming, P. Numerical analysis of static and dynamic heat transfer behaviors inside proton exchange membrane fuel cell. J. Power Sources 2021, 488, 229419. [Google Scholar] [CrossRef]
  40. Bozkurt, K.; Akyalçın, L.; Kjelstrup, S. The thermal diffusion coefficient of membrane-electrode assemblies relevant to polymer electrolyte membrane fuel cells. Int. J. Hydrogen. Energy 2023, 48, 1501–1513. [Google Scholar] [CrossRef]
  41. Vokoun, D.; Samal, S.; Stachiv, I. Impact of Initial Cyclic Loading on Mechanical Properties and Performance of Nafion. Sensors 2023, 23, 1488. [Google Scholar] [CrossRef]
  42. Uchiyama, T.; Kato, M.; Ikogi, Y.; Yoshida, T. Mechanical degradation mechanism of membrane electrode assemblies in buckling test under humidity cycles. J. Fuel Cell Sci. Technol. 2012, 9, 061005. [Google Scholar] [CrossRef]
  43. Paul, D.K.; Karan, K. Conductivity and wettability changes of ultrathin Nafion films subjected to thermal annealing and liquid water exposure. J. Phys. Chem. C 2014, 118, 1828–1835. [Google Scholar] [CrossRef]
  44. Park, Y.J.; Choi, W.Y.; Park, S.H.; Choi, H.; Choi, S.W.; Jyoung, J.Y.; Lee, E.; Park, J.L.; Ko, M.J.; Lee, K.T.; et al. Crack-engineered microporous layer for mitigating cathode flooding in polymer electrolyte fuel cells. ACS Energy Lett. 2025, 10, 3241–3248. [Google Scholar] [CrossRef]
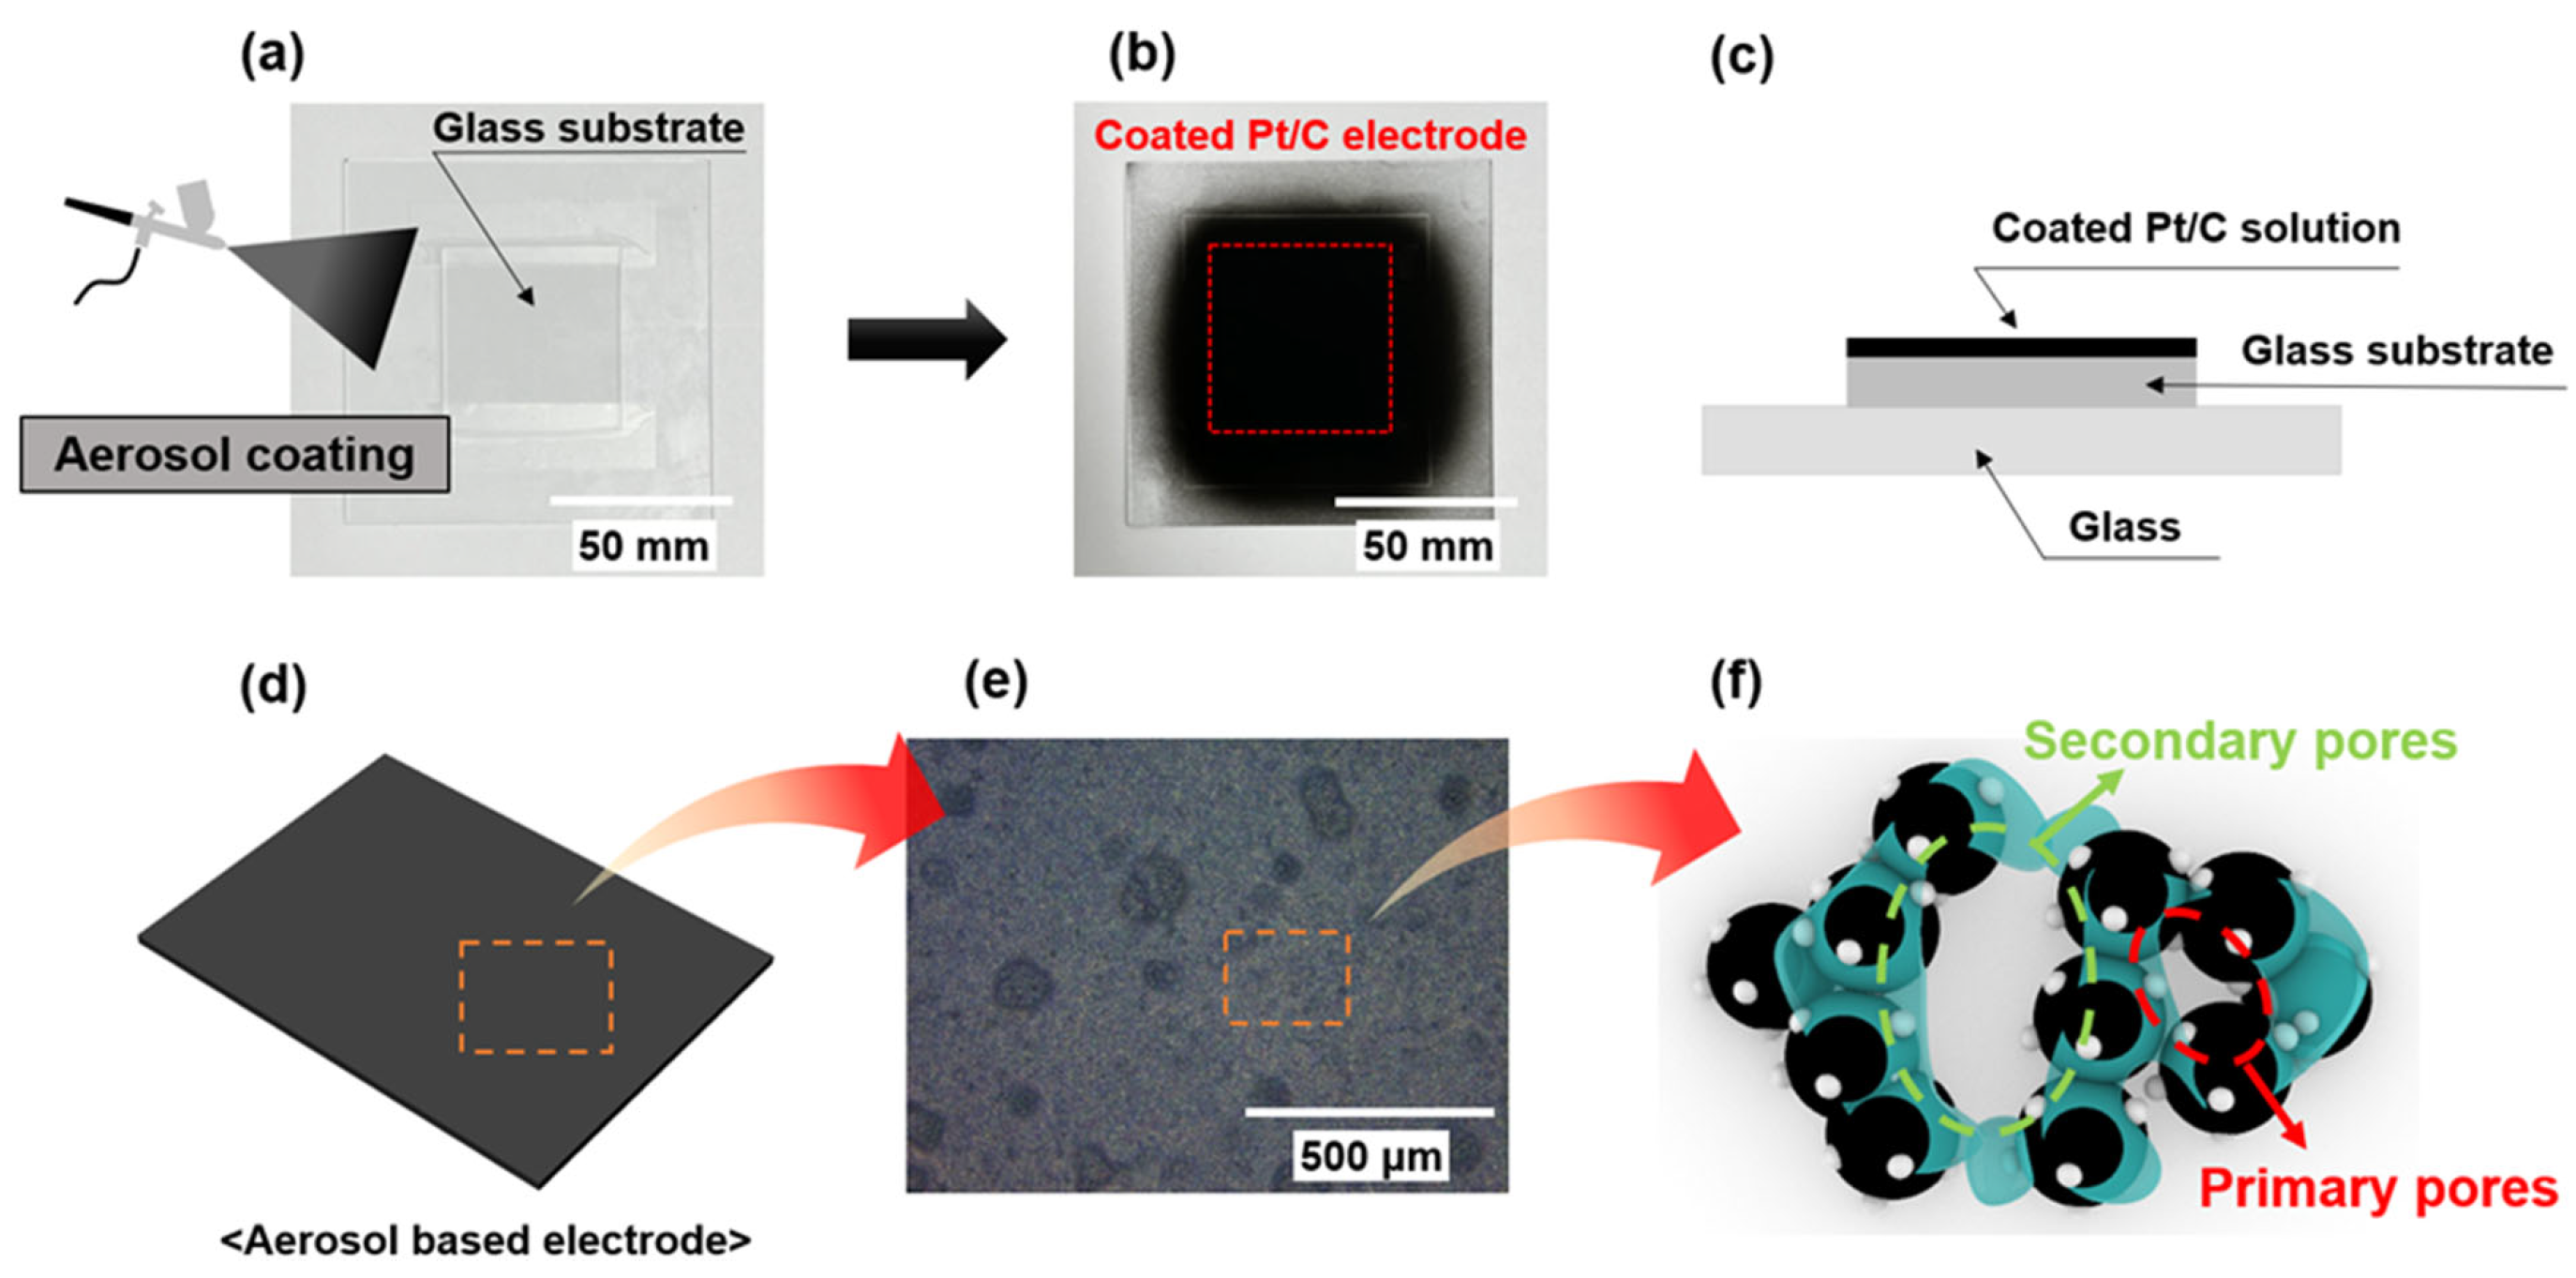
Figure 1. Fabrication and surface shapes of the aerosol-coated Pt/C electrodes. (a) Spray coating of the Pt/C solution over the glass substrate. (b) Image of the glass substrate spray-coated with the Pt/C solution. (c) Cross-sectional view after spray coating. (d) Macroscopic geometry of the aerosol-based Pt/C electrode. (e) Microscopic-scale surface shapes on the aerosol-based Pt/C electrode. (f) Nanoscale structures on the aerosol-based Pt/C electrode.
Coatings 15 01331 g001
Figure 2. Preparation for tensile tests. (a) Size of the aerosol-coated Pt/C electrode used for tensile testing (3 mm width, >20 mm length). (bd) Electrode transport process. (e) Thin-film tensile tester used for the tensile tests. (f) Polydimethylsiloxane (PDMS) grip used to hold the Pt/C electrode during the tensile tests. (g) Shape of the PDMS grip. (h) Schematic of Pt/C electrode adhesion (Scale bar = 10 mm).
Coatings 15 01331 g002
Figure 3. (a) Tensile tests at a constant strain rate of 0.6 μm/s. (b) Fractured specimen after the tensile test. (c) Representative stress–strain curves. Plots of the (d) Young’s modulus, (e) tensile strength, and (f) elongation at various post-annealing temperatures.
Coatings 15 01331 g003
Figure 4. Numerical analyses of the annealed Pt/C electrode and nafion-211 membrane assemblies. (a) Representation of the three-dimensional (3 × 30 × 0.01 mm 3 ) numerical model. (b) The right edge was constrained from moving in the y direction, and a uniform strain rate (υ = 0.6 μm/s) was applied to the left edge. (c) The computational domain was discretized using a hexahedral mesh. (d) The isotropic tangent modulus and proportional limit stress were defined for each layer. (e) Stress contour plots of the membrane electrode assembly (MEA) at incremental strain rates, illustrating the elastic–plastic transition (T = 25 °C, RH = 60%). (fi) Comparisons of the experimental and simulated stress–strain curves at T = 25 °C, RH = 60% (proportional limit stress indicated).
Coatings 15 01331 g004
Figure 5. Experimental characterization of the structure of the electrodes. (a) Atomic force microscopy (AFM) images of the electrodes annealed at (a) 110 °C, (b) 190 °C, and (c) 230 °C. Variations in the (d) roughness, (e) contact angle, and (f) Brunauer–Emmett–Teller (BET) surface area at various annealing temperatures. (g) Barrett–Joyner–Halenda (BJH) pore volume analysis. (h) Variations in resistance with increasing annealing temperature. Scanning electron microscopy (SEM) images of the electrodes annealed at (i) 110 °C, (j) 150 °C, (k) 190 °C, and (l) 230 °C.
Coatings 15 01331 g005
Figure 6. Schematic of changes in the nanostructure of the aerosol-based Pt/C electrodes at different post-annealing temperatures. Schematics of the internal structures of electrodes post-annealed at (a) 110 °C, (b) 190 °C, and (c) 230 °C. Schematics of internal structural fractures in the electrodes annealed at (d) 110 °C, (e) 190 °C, and (f) 230 °C under tensile loading.
Coatings 15 01331 g006
Table 1. Mechanical properties of the electrode and membrane at each post-annealing temperature, including the proportional limit stress (σ_pl), elastic modulus (E), isotropic tangent modulus (E_T), density, and Poisson’s ratio, which were used for the finite element simulations.
MaterialsParameters
σ pl (MPa)E (MPa) E T (MPa)Reference
Membrane @ 110   ° C 6.34132.7510.99Measured
Membrane @ 150   ° C 6.32153.08.69Measured
Membrane @ 190   ° C 4.1695.9117.71Measured
Membrane @ 230   ° C 6.33150.7312.21Measured
Electrode @ 110   ° C 0.81192.7977.89Measured
Electrode @ 150   ° C 1.31176.6769.78Measured
Electrode @ 190   ° C 1.62190.4155.82Measured
Electrode @ 230   ° C 1.54186.7451.19Measured
ParametersMaterials
ElectrodeMembraneReference
Density, kg / m 3 21,4501970[39,40]
Poisson’s ratio, ν0.250.4[41,42]
Disclaimer/Publisher’s Note: The statements, opinions and data contained in all publications are solely those of the individual author(s) and contributor(s) and not of MDPI and/or the editor(s). MDPI and/or the editor(s) disclaim responsibility for any injury to people or property resulting from any ideas, methods, instructions or products referred to in the content.