Article

Effect of Laser Surface Melting on the Microstructure and Corrosion Resistance of Laser Powder Bed Fusion and Wrought Ti-6Al-4V Alloys

1
Department of Materials Science and Engineering, University of Ioannina, 45110 Ioannina, Greece
2
Institute of Materials Research, Slovak Academy of Sciences, 04001 Kosice, Slovakia
3
Physics Department, Pryazovskyi State Technical University, 49044 Dnipro, Ukraine
*
Author to whom correspondence should be addressed.
Coatings 2025, 15(11), 1285; https://doi.org/10.3390/coatings15111285
Submission received: 13 September 2025 / Revised: 20 October 2025 / Accepted: 29 October 2025 / Published: 3 November 2025

Abstract

Ti-6Al-4V, a popular biomedical alloy, is increasingly fabricated by additive manufacturing methods, like laser powder bed fusion (LPBF). However, rapid thermal cycling and steep temperature gradients often induce mechanical degradation, corrosion, and wear. To address these challenges, laser surface modification is explored. This study investigates the microstructure and corrosion behaviour (simulated body fluid, 37 °C) of LPBF and wrought Ti-6Al-4V after laser surface melting (LSM) treatment. LSM produced modified layers of 1250–1350 µm (LPBF) and 1530–1600 µm (wrought), with gradients from remelted dendrites to acicular martensite. Microhardness in the layers increased to 655–680 HV due to lattice expansion, crystallite refinement, and higher dislocation density. However, LSM-treated alloys showed higher corrosion rates and weaker passive films, attributed to increased surface roughness, martensite formation, residual stresses, and microstructural inhomogeneity. Aluminium silicate surface films/residues further compromised passivity. Nevertheless, both LSM-LPBF and LSM-wrought specimens displayed low corrosion current densities (10−4 mA/cm2), true passivity (10−3–10−4 mA/cm2), and high resistance to localised corrosion. After cyclic polarisation, rutile-rich TiO2 surface films with aluminium silicate hydrates were observed. LSM-LPBF specimens showed slightly inferior general corrosion resistance compared to LSM-wrought counterparts, due to pronounced surface texture variations, phase/composition differences, higher microstrains and dislocation density.

1. Introduction

Titanium alloys, particularly Ti-6Al-4V (Ti-6-4) (ASTM F136 [1]), are widely used in implants and prosthetics, due to their excellent biocompatibility, corrosion resistance, and mechanical properties. However, they present some limitations for long-term use due to their low wear resistance, low shear and fatigue strength, stress shielding, and weak bonding [2,3,4]. Long-term use can lead to the release of toxic and allergenic ions (Al, V) and Ti particles from wear and corrosion, triggering inflammatory responses that can cause peri-implantitis or allergic reactions and systemic effects such as yellow nail syndrome [3,5,6]. Passivation films on Ti implants further hinder bone bonding and may degrade under shear forces and body fluids [7].
Additive manufacturing (AM) technologies such as LPBF (laser powder bed fusion), DED (Directed Energy Deposition) including WAAM (Wire Arc Additive Manufacturing), EBM (Electron Beam Melting), LMD (Laser Metal Wire/Powder Deposition), SMD (Shaped Metal Deposition), CSAM (Cold Spraying Additive Manufacturing), and BJP (Binder Jetting 3D Printing) are increasingly used to produce Ti-6-4 implants [8,9,10,11,12,13]. However, rapid thermal cycling and steep temperature gradients result in corrosion inducers, like residual stresses, porosity, anisotropy, brittle, Widmanstätten or martensitic structures, and stable β-phase depletion [10,14]. Certain implants, like dental and hip prosthetics, require high surface roughness to improve osseointegration and cell proliferation and reduce the risk of implant rejection in the body [15,16].
To address these issues, surface property enhancement through surface modification is recommended. Among the available methods, laser beams, characterised by coherence, directionality, high energy, and precise thermal control, have been applied to modify metallic surfaces [4,7]. Laser surface melting, texturing, cladding, patterning, and alloying may overcome limitations of conventional techniques (e.g., coating and surface hardening), such as poor adhesion, weak bonding, cracks, porosity, substrate deformation, and contamination [4,7,17,18]. Liu et al. [19] reviewed extensive research on laser surface modification towards improving osseointegration and tissue regeneration, with laser surface melting (LSM) and texturing being the most used [17]. However, no single surface modification method can simultaneously improve wear, corrosion, and elastic modulus, while some methods may adversely affect other properties [20,21].
Laser surface modification generally increases Ti-alloy surface roughness and surface hardness due to martensitic transformation, grain refinement and dislocation density increase, depending on the laser parameters [17]. The increased surface roughness and porosity of Ti-6-4 can promote Ca-phosphate growth on the melted surface, indicating increased bioactivity [22]. However, residual stresses produced during remelting and solidification can induce cracks [23].
Laser surface modification of Ti alloys often improves corrosion resistance, though results remain inconsistent. Positive effects are attributed to grain refinement [24,25], compressive residual stress gradients [24], and homogenised and refined melted zones with less defective/more stable passive films [25,26]. Majumdar and Manna [27] reported an increased pitting potential and wettability of LSM Ti-6-4 in SBF. According to Amaya-Vazquez et al. [28], laser remelting did not alter the corrosion resistance of TiG2 alloy but increased the corrosion resistance of Ti-6-4 due to the martensitic structure (However, martensite is commonly associated with reduced corrosion resistance, as it is a non-equilibrium strained phase, defect-rich, and supersaturated with V, whose oxides are less stable than Ti-oxides [29,30,31]).
Conversely, other works yield negative outcomes. Mohazzab et al. [32] observed a shortened passive range and more conductive passive film, but no pitting, in Hank’s solution after pulsed laser ablation of a titanium plate. Ataiwi et al. [33] noted an increased corrosion rate of Ti-6-4 in ethanol containing saliva after laser surface modification. Jażdżewska et al. [34] attributed deterioration in Ringer’s solution of preheated and laser surface remelted Ti-6-4 to cracking due to compressive stresses. Gil et al. [35] found that laser marking of CP-Ti and Ti-6-4 deteriorated the resistance to corrosion and corrosion fatigue in SBF owing to residual stresses and grain refinement. Zieliński et al. [36] observed pitting in Ringer’s solution of Ti-6-4 laser surface remelted at cryogenic conditions, attributed to high internal stresses due to ultra-fast crystallisation. Singh et al. [37] reported decreased passive currents and increased corrosion potentials in Ringer’s solution after LSM of Ti-6-4 in N2-gas but decreased pitting potentials due to a discontinuous TiN surface film and increased surface roughness. Khosroshahi et al. [38] noted a decreased corrosion rate of Ti-6-4 in Hank’s solution after laser surface treatment but unstable passivity.
The vast majority of laser surface modification studies concern conventionally fabricated Ti-alloys, with limited literature on AM Ti-alloys. Porwal et al. [39] reported increased surface roughness and nitride surface formation by in situ nitrogen-assisted laser surface remelting (LSR) of LPBF Ti-6-4. In contrast, Feng et al. [40] noted a decrease in roughness and V ion release through LSR of LPBF Ti-6-4. Lu et al. [41] reported reduced corrosion and passive current densities of LPBF Ti-6-4 through LSR, attributed to grain refinement and macroscopic defect elimination. Krishna Pradeep et al. [42] observed reduced wear of EBM γ-TiAl after fibre laser surface melting. Molatlhegi et al. [43] reported decreased roughness with increased residence time and irradiance during LSR of LPBF Ti-6-4. Laser shock pinning increased the fatigue strength of EBM and LPBF Ti-6-4, but laser polishing lowered it [44]. Vaithilingam et al. [45] applied an additional laser scan on LPBF Ti-6-4, which led to reduced surface roughness and enriched surface oxides with Al and V at the expense of Ti.
The authors previously compared the microstructure, electrochemical and tribological responses of LPBF and wrought Ti-6-4 alloys in SBF at 37 °C. LPBF led to higher sliding wear resistance but slightly inferior uniform corrosion resistance [29]. A preliminary effort further showed that LSM improved the wear resistance of LPBF Ti-6-4 in SBF, inversely proportional to laser scanning speeds [46].
Considering both the limited number of laser surface modification studies on the corrosion behaviour of AM Ti-alloys and the importance of electrochemical assessment for biocompatibility, a comparative study was deemed essential. The aim was to investigate the effect of laser surface melting on the corrosion performance of LPBF and wrought Ti-6-4 in order to understand the intrinsic corrosion behaviour. LSM was performed using the lowest scanning speed reported in [46], as this resulted in the lowest wear rate and largest melting depth, the latter in agreement with Sun et al. [47] and Singh et al. [37].

2. Materials and Methods

Ti-6Al-4V (Ti-6-4) specimens, with dimensions of 5 × 10 × 20 mm, were produced via laser-based powder bed fusion (hereafter denoted as “LPBF”) using a “ProX DMP 320 3D” printer (3D Systems, Rock Hill, SC, USA). The feedstock powder, with an average particle size of 39 ± 3 μm, was provided by Electro-Optical Systems (Krailling, Germany) and had a nominal composition (wt.%): 5.5–6.75 Al, 3.5–4.5 V, O < 0.2, N < 0.05, C < 0.08, H < 0.015, Fe < 0.3, Ti–balance. LPBF Ti-6-4 was analysed in comparison with commercially wrought Ti-6-4 (referred to as “WR”), provided as an 8 mm thick plate with the following composition (wt.%): 5.90 Al, 4.24 V, 0.01 Si, 0.02 Fe, 0.005 C, Ti–balance. The WR and LPBF specimens underwent laser processing (laser surface melting-LSM) using a “TruFiber 400” (TRUMPF, Ditzingen, Germany) fiber laser (1064 nm) in continuous scanning mode with the following process settings: (a) 400 W power, (b) 1.3 mm beam spot, (c) 50% track overlap, (d) 20 mm focus distance, (e) air atmosphere. A scanning speed of 10 mm/s was chosen to achieve surface melting in consistency with [46]. The laser-treated specimens were designated as LSM-LPBF and LSM-WR. The laser-processed surface was sandblasted to remove any residual unfused powder from laser surface melting and improve its surface finish. The aluminium silicate sand ASILIKOS® (supplied by EP Power Minerals, Dinslaken, Germany) was used, complying with ISO 11126 [48] N/CS/G specification (containing 42–58 wt.% SiO2, 23–32 wt.% Al2O3, 3–15 wt.% Fe2O3, 2–8.5 wt.% CaO, 0.5–4.6 wt.% K2O). All evaluation studies and tests of LSM specimens described below were conducted on sandblasted specimens.
Microstructure analysis involved standard metallographic preparation: grinding with SiC papers, polishing with Al2O3 suspensions, and etching with Kroll’s reagent (5 mL HF, 5 mL HNO3, 90 mL H2O). The microstructure was examined via optical microscopy (OM) (“GX71”, Olympus, Tokyo, Japan) and scanning electron microscopy (SEM) (“JSM-7000F”, JEOL, Tokyo, Japan). Grain size was quantified using the intercept method, based on five to six SEM images taken from areas measuring 180 μm × 240 μm, with the results subsequently averaged. Phase chemical composition was determined with an “INCAx-sight” energy-dispersive X-ray (EDX) detector (Oxford Instruments, High Wycombe, UK); the reported chemical composition values represent the average of measurements taken from 4–5 points within the same phase constituent.
The phase constituents were identified by X-ray diffraction (XRD) (“X’Pert PRO”, PANalytical, Waltham, MA, USA) with a Co-Kα source. The lattice parameter and quantitative indicators of line broadening were derived from the XRD patterns using the MAUD software (version 2.9995). Electron backscatter diffraction (EBSD) examination was carried out with the “Symmetry S3” EBSD system (Oxford Instruments, High Wycombe, UK) on an “Apreo S Hivac” (Thermo Fisher Scientific, Waltham, MA, USA) field-emission SEM, employing a 20 kV acceleration voltage and a 0.12 μm step size for sampling.
The Vickers microhardness was measured by an “LM 700AT” (Leco Corporation, St. Joseph, MO, USA) tester using the pyramid diamond indenter under the normal load of 25 g. The distribution of microhardness across the laser-modified layer was measured along four separate lines that intersected the heat-affected zone at a distance of 1200–1250 µm from the surface. The hardness values at a specific depth were determined by averaging the data from all four lines.
The corrosion performance was assessed on specimens that had been sealed along their periphery with silane tape and PTFE, leaving roughly 1 cm2 of surface area in contact with a simulated body fluid (SBF). The SBF recipe (pH 7.4, 37 °C), after Bellini et al. [49], comprised, per litre of bidistilled water, 7.996 g. NaCl, 0.350 g. NaHCO3, 0.224 g. KCl, 0.228 g. K2HPO4·3H2O, 0.305 g. MgCl2·6H2O, 40 mL 1N HCl, 0.278 g. CaCl2, 0.071 g. Na2SO4, 6.057 g. NH2C(CH2OH)3.
The electrochemical tests were carried out on an ACM Gill AC (ACM Instruments, Cumbria, UK) galvanostat/potentiostat using the classic three-electrode configuration: an Ag/AgCl (3 M KCl) reference, a platinum mesh counter, and the exposed alloy surface as the working electrode. After a 1 h open-circuit stabilisation period, potentiodynamic polarisation scans were swept at 10 mV min−1. The corrosion current density (icorr) values were extracted via Tafel extrapolation, applying least-squares linear fits to the potential vs. log (current density) data. To keep the analysis rigorous, the fitting procedure conformed to the following guidelines [50,51]:
  • Slow scan rate (10 mV min−1) to minimise capacitive artefacts at the electrode/solution interface.
  • Wide Tafel span for the linear region to cover at least one decade of current density; only the cathodic branch was used, because it showed the clearest linearity free of concentration polarisation or roughness effects.
  • Starting point ≥ 50 mV from the open circuit potential to ensure pure Tafel behaviour without overlap of anodic and cathodic reactions.
  • Linear fit (R2 > 0.98)—fits not meeting this criterion were rejected.
The resistance to localised attack was evaluated through reverse (cyclic) polarisation. A counterclockwise hysteresis, where the reverse anodic portion carries a higher current than the forward portion at the same potential, was taken as evidence of pitting or crevice attack [52].
The rates of uniform corrosion were calculated from the corrosion current density values in accordance with ASTM G102 [53]. All electrochemical metrics reported are averages of four independent specimens to ensure statistical reliability.
A “JSM 6510 LV” (JEOL, Tokyo, Japan) EDX detector (Oxford Instruments, High Wycombe, UK) was used to study the microstructure of corrosion on free surfaces and polished cross-sections. A “Labram HR” spectrometer (HORIBA Scientific, Kyoto, Japan) was used to perform Raman spectroscopy (RS) for characterising the surface corrosion products. The measurements were conducted using an Argon-ion laser with an excitation wavelength of 514.5 nm, delivering 2 mW of power to the sample. The laser beam was focused on a spot size of ~0.6–0.7 μm in diameter.

3. Results

3.1. Microstructure Characterisation

3.1.1. As-Fabricated Microstructure

The microstructure of the WR Ti-6-4 alloy consists of thin α and β phase lamellae. The α-lamellae grew along particular crystallographic planes of the prior β phase, as observed in Figure 1a. Fine β-rods with specific orientations are distributed between the α-lamellae, as depicted in Figure 1b. The β-rods are enriched with V (a β-stabiliser), which is confirmed by their brighter contrast in the backscattered electron image (BSEI) (right side of Figure 1b). More detailed information on the microstructure of WR Ti-6-4 can be found in a previous authors’ effort [29]. In summary, the WR alloy exhibits a coarse-grained morphology featuring elongated, deformed grains with lengths of 50–700 µm and widths of 40–250 µm. The average grain sizes were determined to be 381 ± 74 µm longitudinally and 138 ± 23 µm transversely.
Figure 1c illustrates the microstructure of the as-built LPBF specimen, revealing a basket-weave pattern typical for AM-processed Ti-6-4 alloys [54] along with the hemispherical patterns reflecting the shape of a molten pool on the substrate surface melted under the laser beam [29,55]. The microstructure exhibits α′-martensite needles arranged along multiple crystallographic planes (Figure 1d). The formation of α′-martensite in the LPBF alloy is attributed to the high temperature gradients during the LPBF process [29,56]. Occasional discontinuity defects (lack-of-fusion pores) have been detected in the LPBF alloy’s structure. The hierarchical cellular/columnar structure characteristic of AM alloys [57,58] was hardly distinguished, possibly masked by martensite needles that crossed cellular sub-grains as they developed inside prior β grains and by a disordered epitaxial grain pattern resulting from the shear deformation accompanying the martensite formation. The prior β-grain size was found to be 21.2 ± 7.6 µm (left side of Figure 1d), over one order of magnitude smaller than the grain size in the WR alloy. Again, for more details, the reader is referred to the previous authors’ work [29].
EDX analysis conducted on areas of 30 × 40 µm yielded the average chemical composition of the alloys as follows: (a) WR: 5.52 ± 0.38 wt.% Al, 4.19 ± 0.21 wt.% V, Ti (balance); (b) LPBF: 5.85 ± 0.55 wt.% Al, 3.59 ± 0.44 wt.% V, Ti (balance). These compositions are consistent with ASTM F136 for Ti 6Al-4V and closely match each other, making the comparison of WR and LPBF valid.

3.1.2. Laser Beam Surface-Modified Microstructure

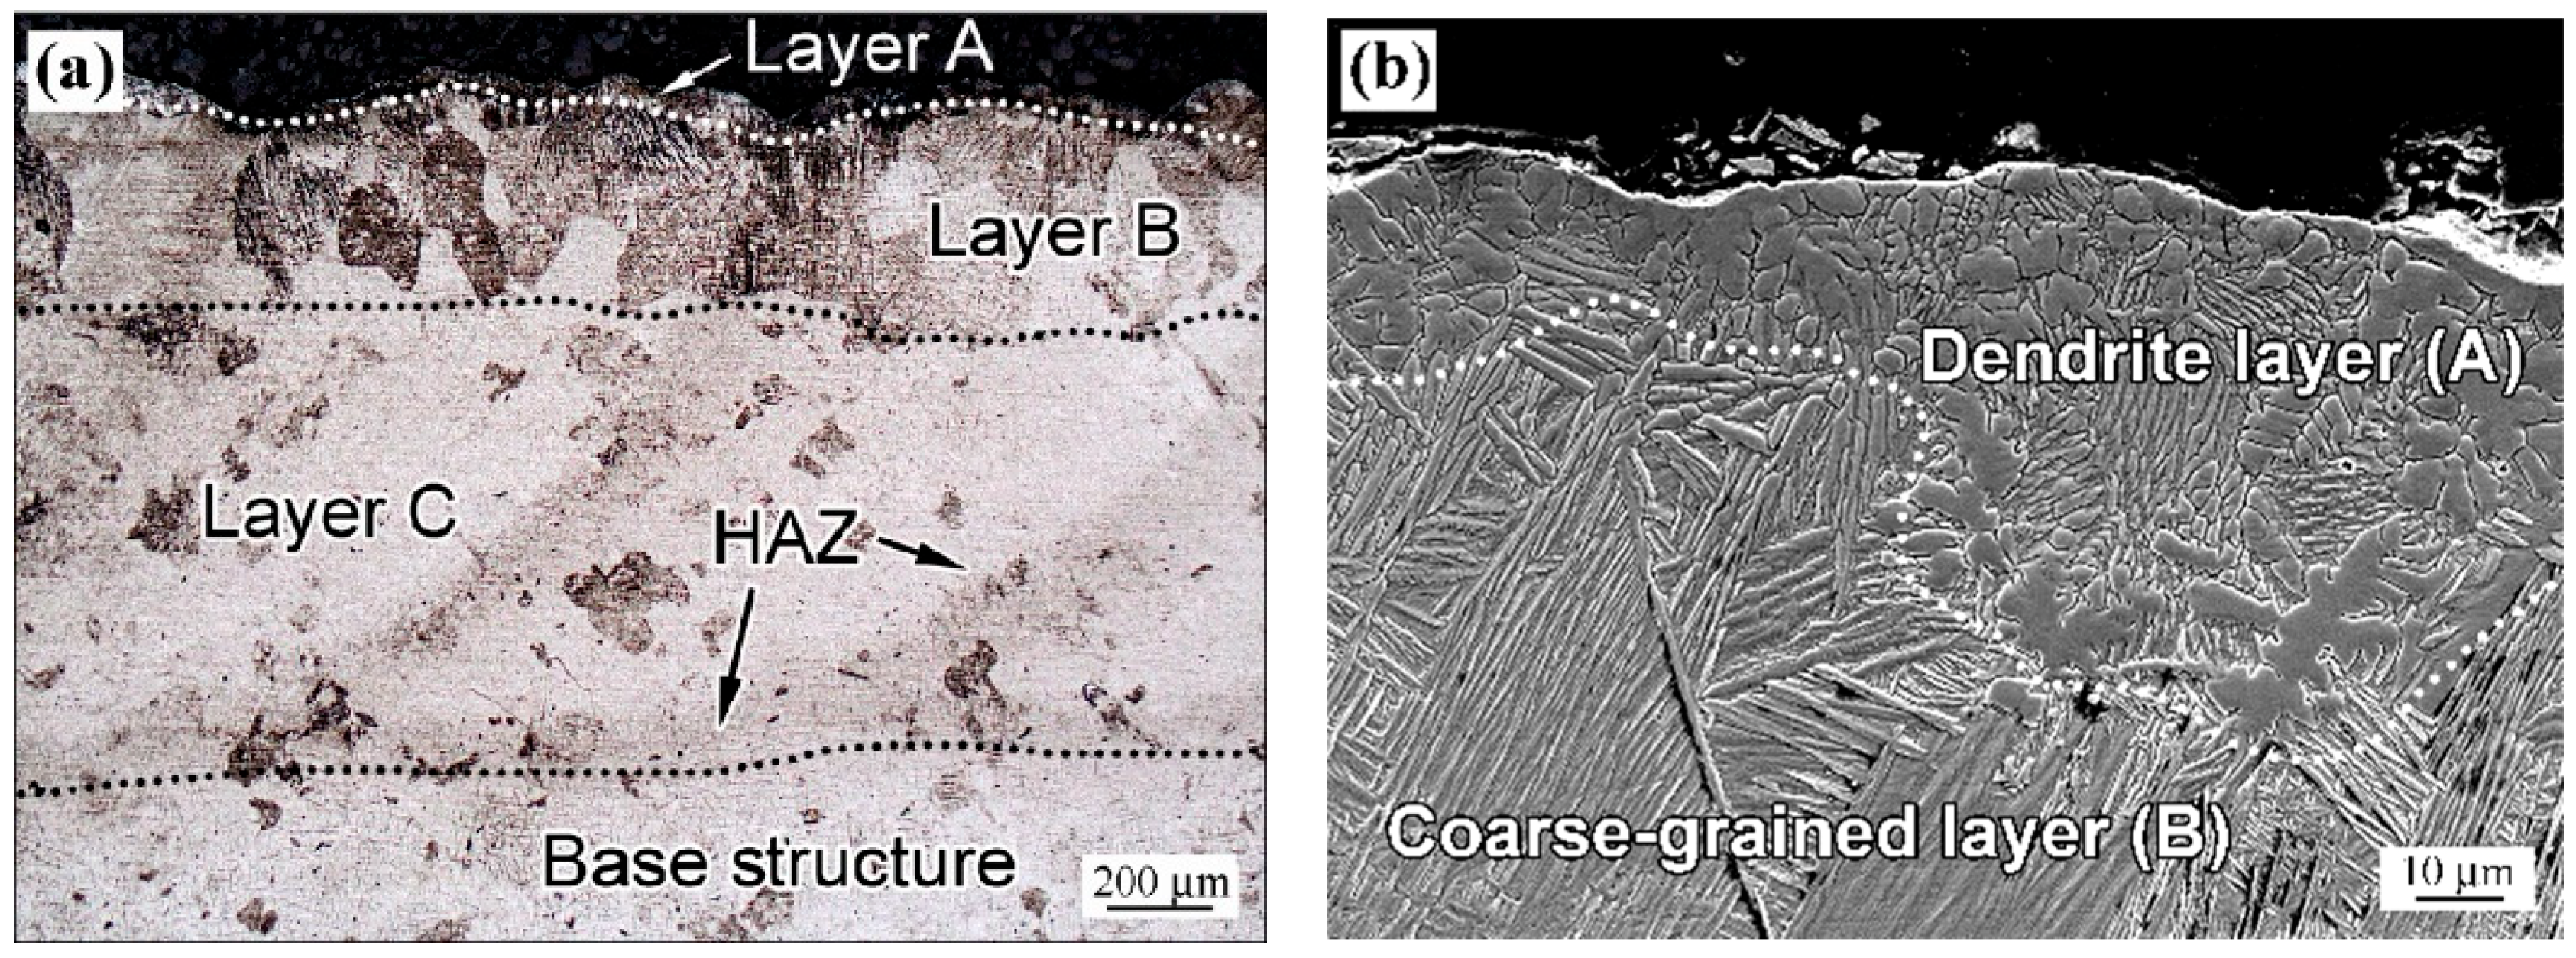
Figure 2 shows the cross-sectional microstructure of an LSM-LPBF specimen. The modified layer of a total thickness of 1250–1350 µm is easily identified by the heat-affected zone, denoting a contour of the laser beam’s impact area (seen in Figure 2a due to more pronounced etching). The laser-affected free surface is uneven, consisting of protrusions and depressions, with variations at a maximum height of 145 µm. Within the specimen, there is a structure gradient from the surface to the centre, presented by successive structural layers A, B, and C.
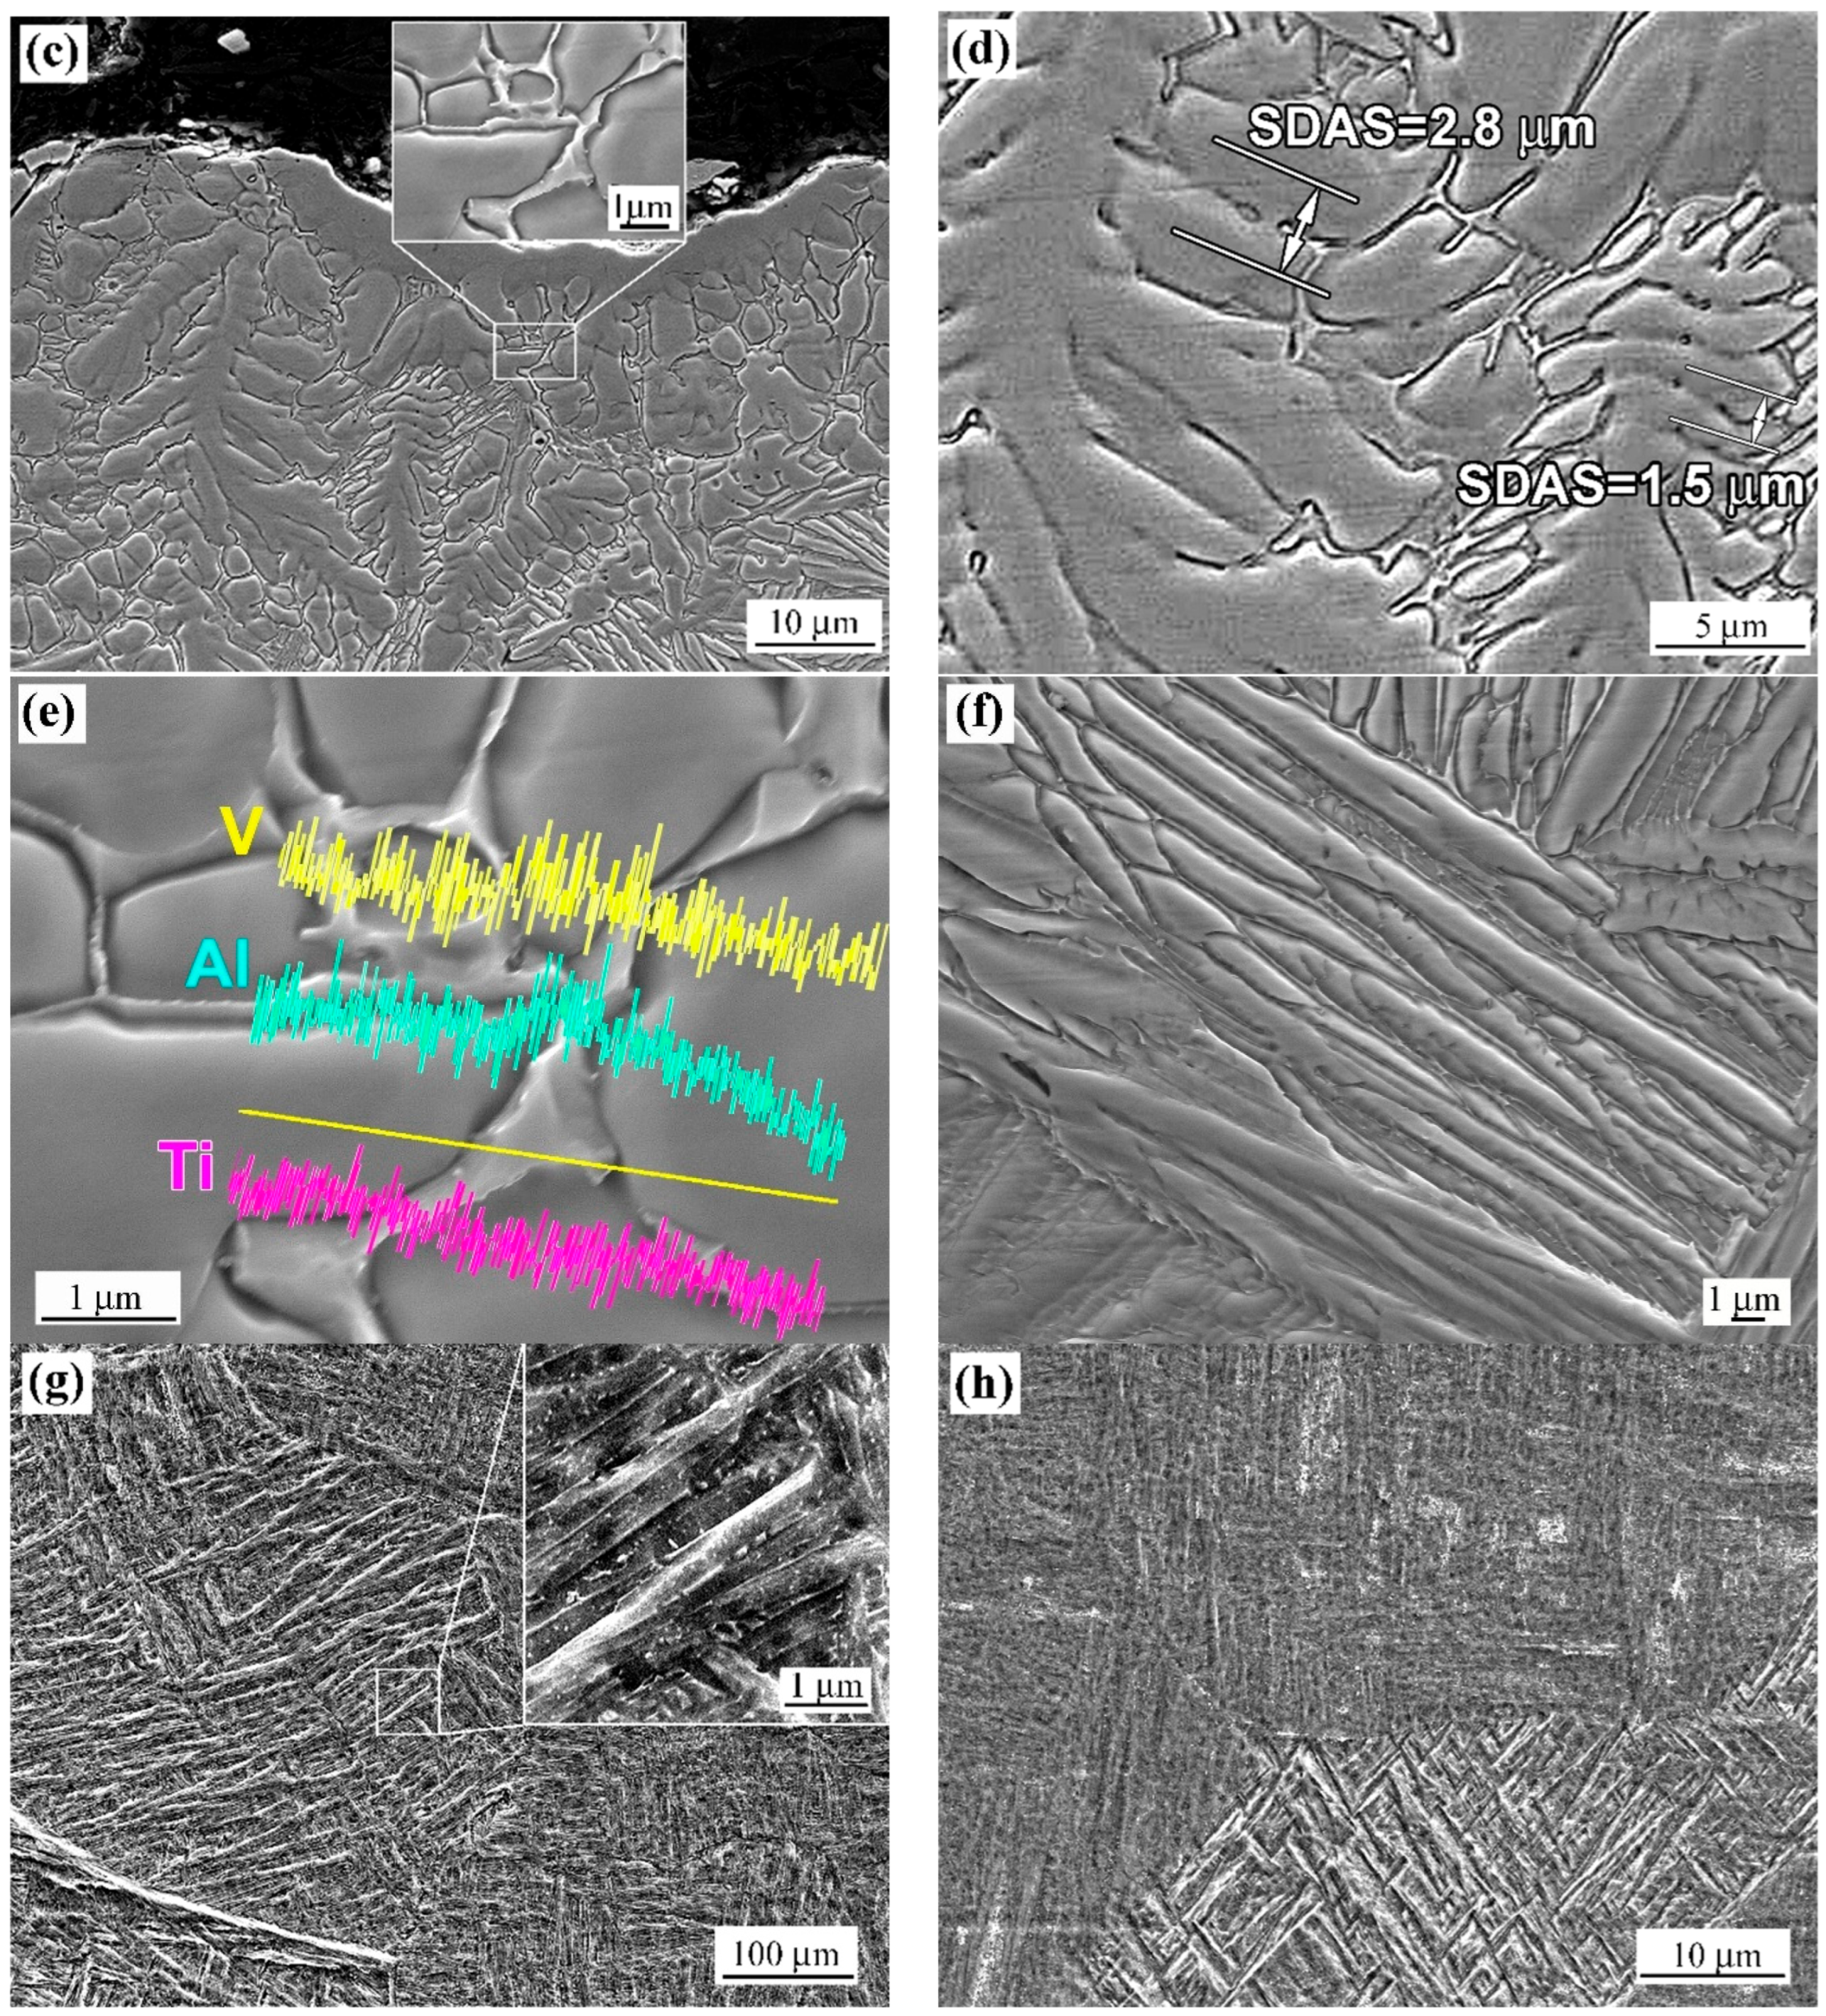
At the top surface, a thin layer A of irregular thickness (in the range of 10–60 µm) is observed (Figure 2b). It consists of solid solution dendrites (Figure 2c) with lengths up to 20 µm and SDAS (secondary dendrite arm spacing) of 1–3 µm (Figure 2d). Within layer A, in the interdendritic areas, light contrast inclusions of a second phase are revealed in the form of a continuous network of 0.1–1.0 µm thickness (insert in Figure 2c,e). These inclusions are enriched in Al and V and depleted in Ti (Figure 2e). Based on EDS analysis (Table 1), the average contents of Al and V in the inclusions are 8.3 ± 0.2 wt.% and 6.9 ± 0.3 wt.%, respectively, which is 2 and 4 times higher than in the adjacent dendrite regions.
Beneath layer A, a coarse-grained layer B is located up to a depth of 480 µm from the surface. Layer B consists of coarse grains of 140–175 µm diameter (154.3 ± 15.3 µm in average). At the boundary with the dendritic layer, coarse grains are formed by colonies of coarse parallel needles (plates) with thicknesses up to 2 µm and lengths up to tens of µm (Figure 2f). With the distance from the surface, the thickness of the needles in layer B decreases.
Layer B transitions into fine-grained layer C having a grain size of 23.6 ± 12.1 µm and a fine-needle microstructure (Figure 2g). The thickness of layer C is 800–900 µm, and it is separated from the base structure by the HAZ contour. In the HAZ, the grain size is increased to 38.5 ± 9.2 µm. Below the HAZ, the base structure has retained the initial microstructure, unaffected by laser heating (Figure 2h). The needles of the base metal are coarser than those in the HAZ.
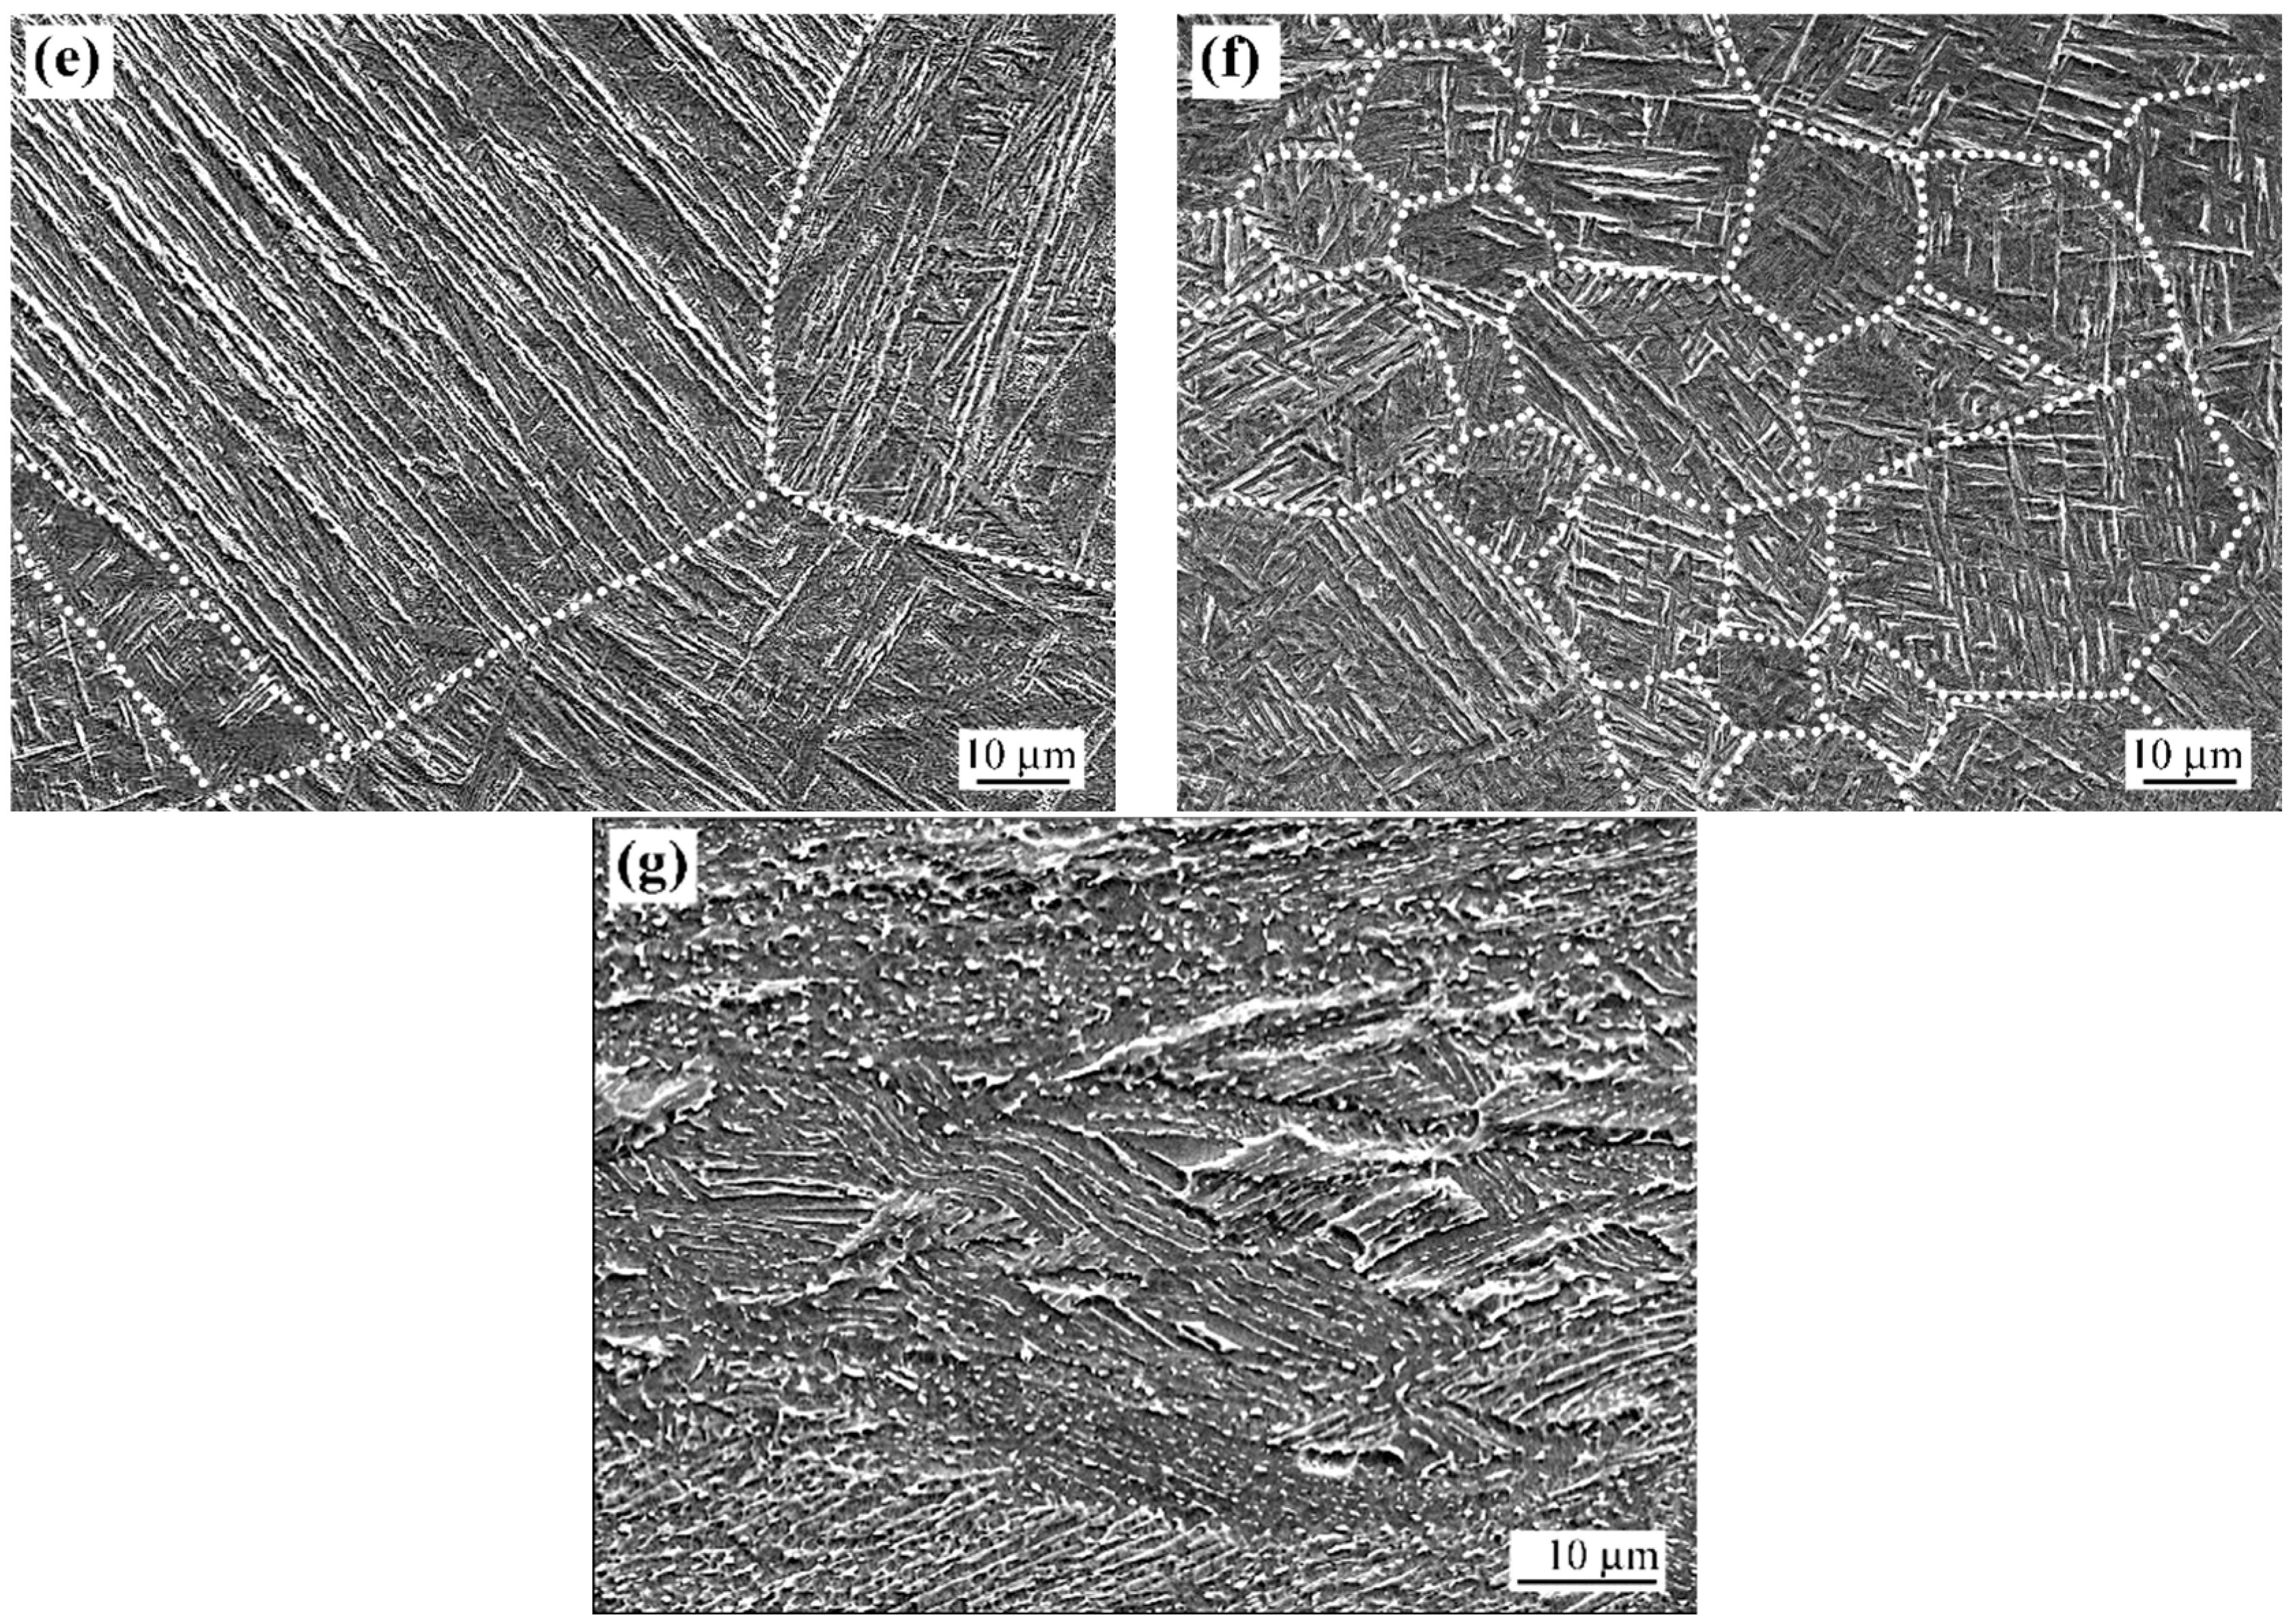
The cross-sectional microstructure of the laser-processed WR specimens is shown in Figure 3. The processed surface also exhibits height irregularities, though with less pronounced relief compared to the LPBF sample (the maximum height difference is not higher than 100 µm). The modified layer is clearly identified in Figure 3a, extending to a depth of 1530–1600 µm. It consists of layers A, B, and C (Figure 3b), indicating a structural gradient similar to that of the LPBF sample.
Layer A has a thickness of 5–12 µm, which is much lower than that of the LSM-LPBF specimen. Layer A consists of coarse dendrites up to 4 µm thick (Figure 3c), between which a network of a second phase is observed (Figure 3d), having a fourfold higher V content as compared with the dendrite body (Figure 3d, Table 1).
Layer A transitions into layer B (extending to 60–110 µm depth), which presents a coarse-acicular pattern within coarse grains of 69–93 µm diameter (average size of 75.1 ± 10.3 µm) (Figure 3b). Layer C beneath layer B has a distinct grain size gradient, ranging from an average of 123.2 ± 15.1 µm (at the boundary with layer B) to 60.6 ± 8.4 µm (in the middle of layer C) and 16.5 ± 3.6 µm at the boundary with the base structure. Accordingly, the structure of layer C transitions from that of coarse-needle α′-martensite in the upper part (Figure 3e) to the fine-needle α′-phase next to the base structure (Figure 3f). Below layer C, the base α + β structure, unaltered by laser heating, is located (Figure 3g).
The interdendritic bright contrast phase is most likely a β-phase (rich in β-stabilisers V and Fe supersaturated in Al), as will be discussed in Section 4.
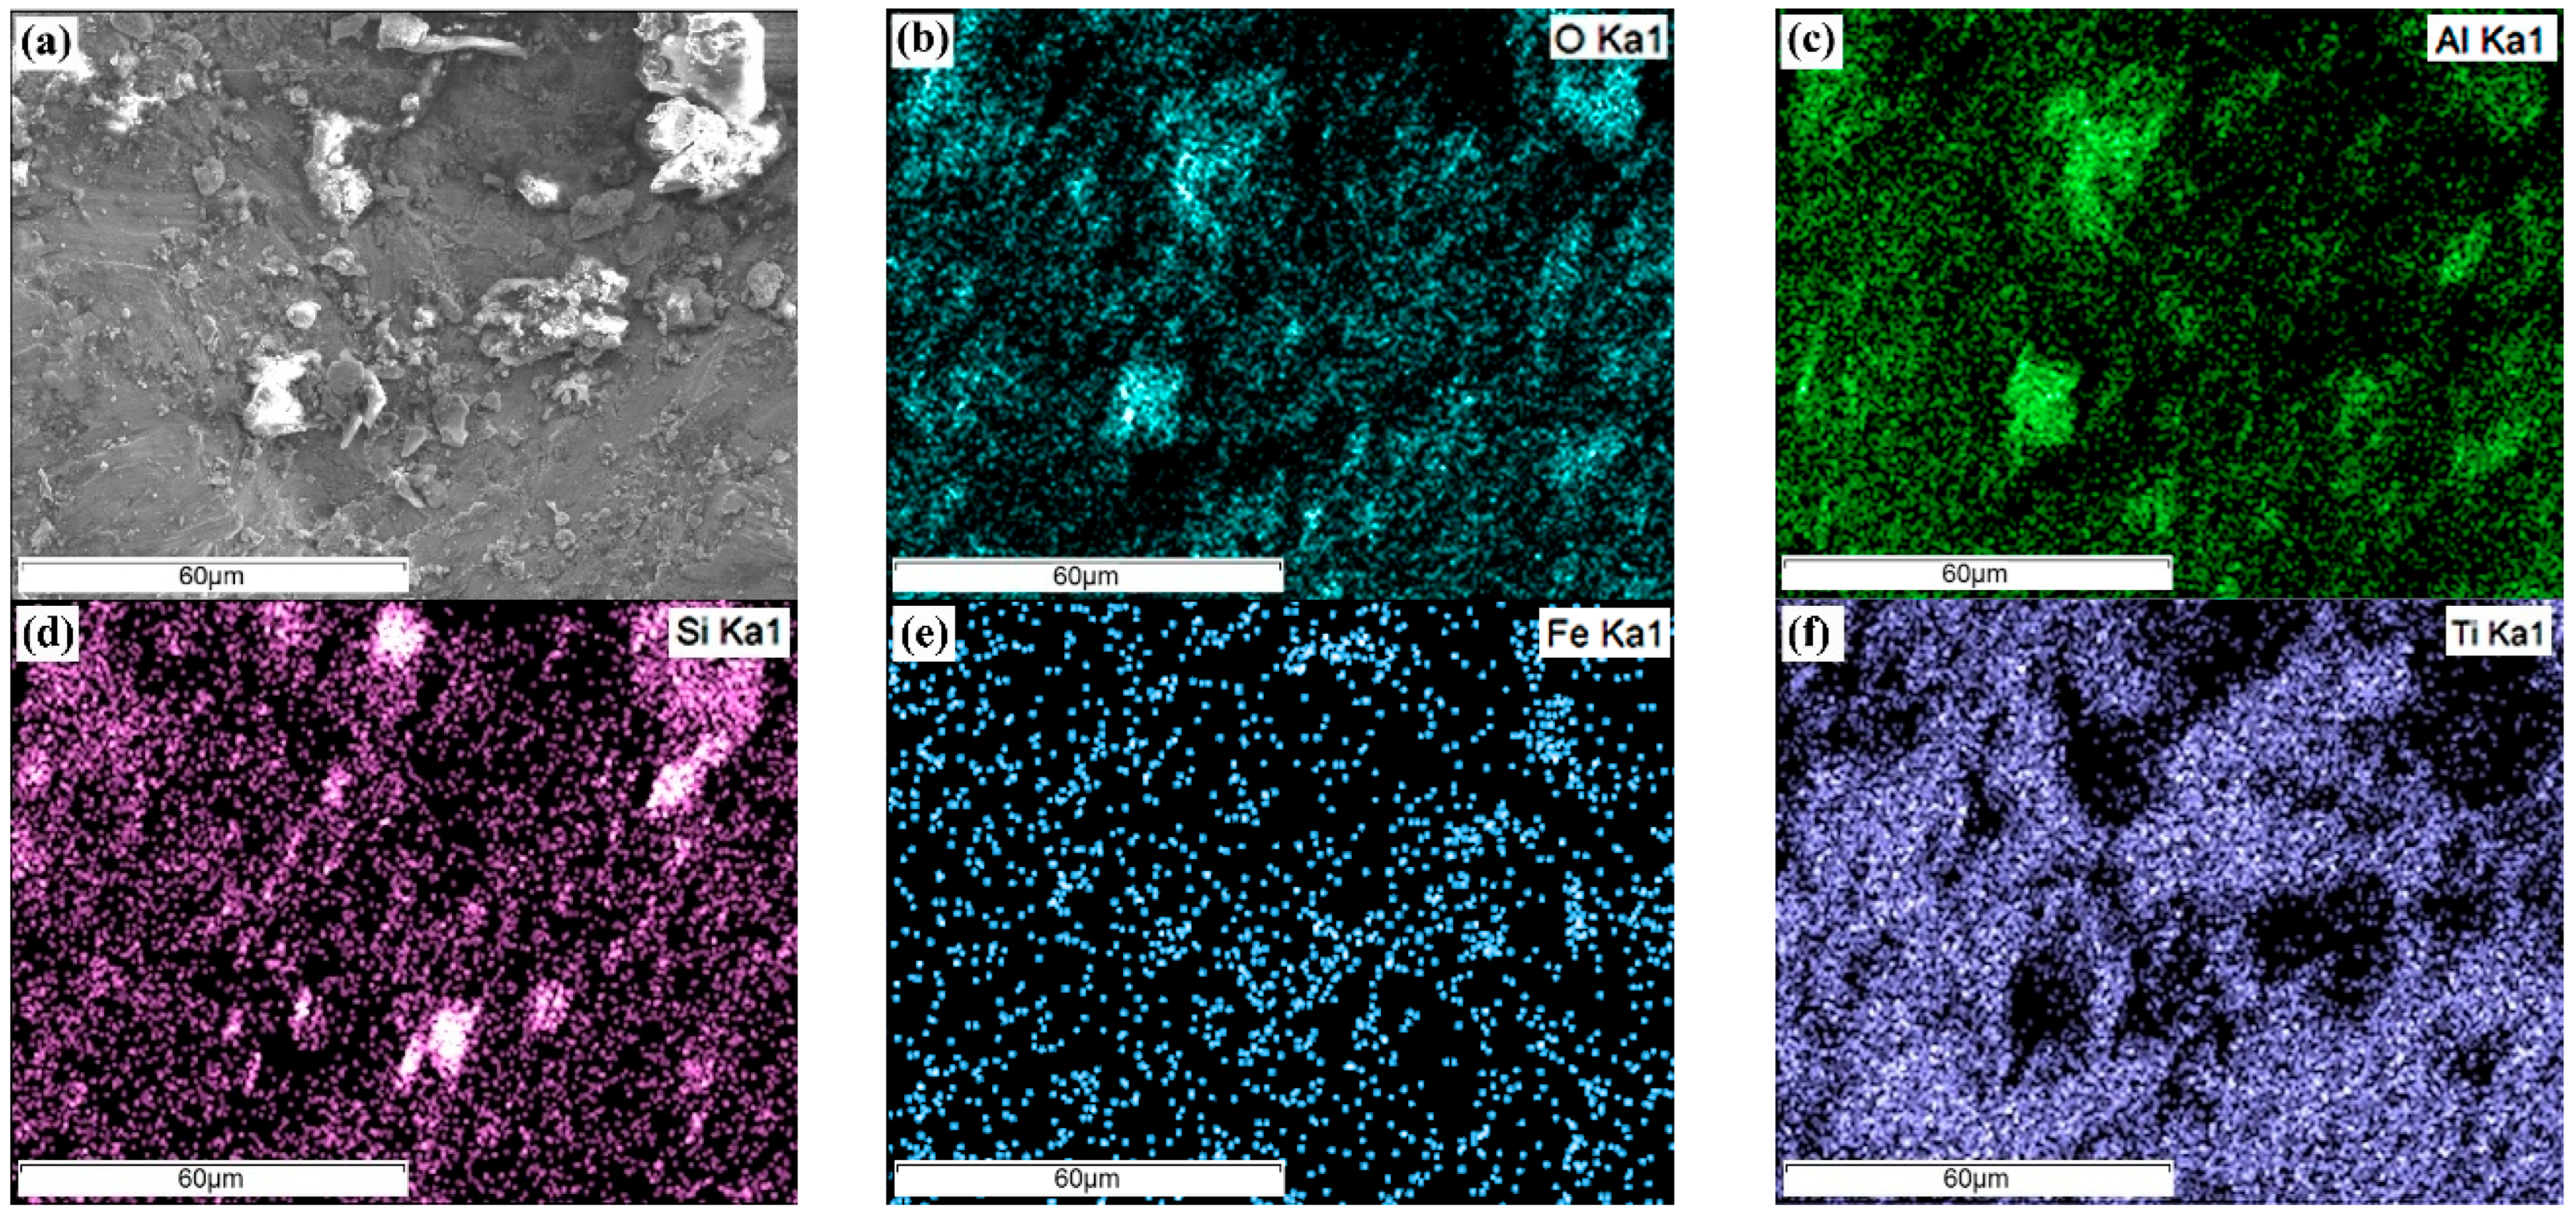
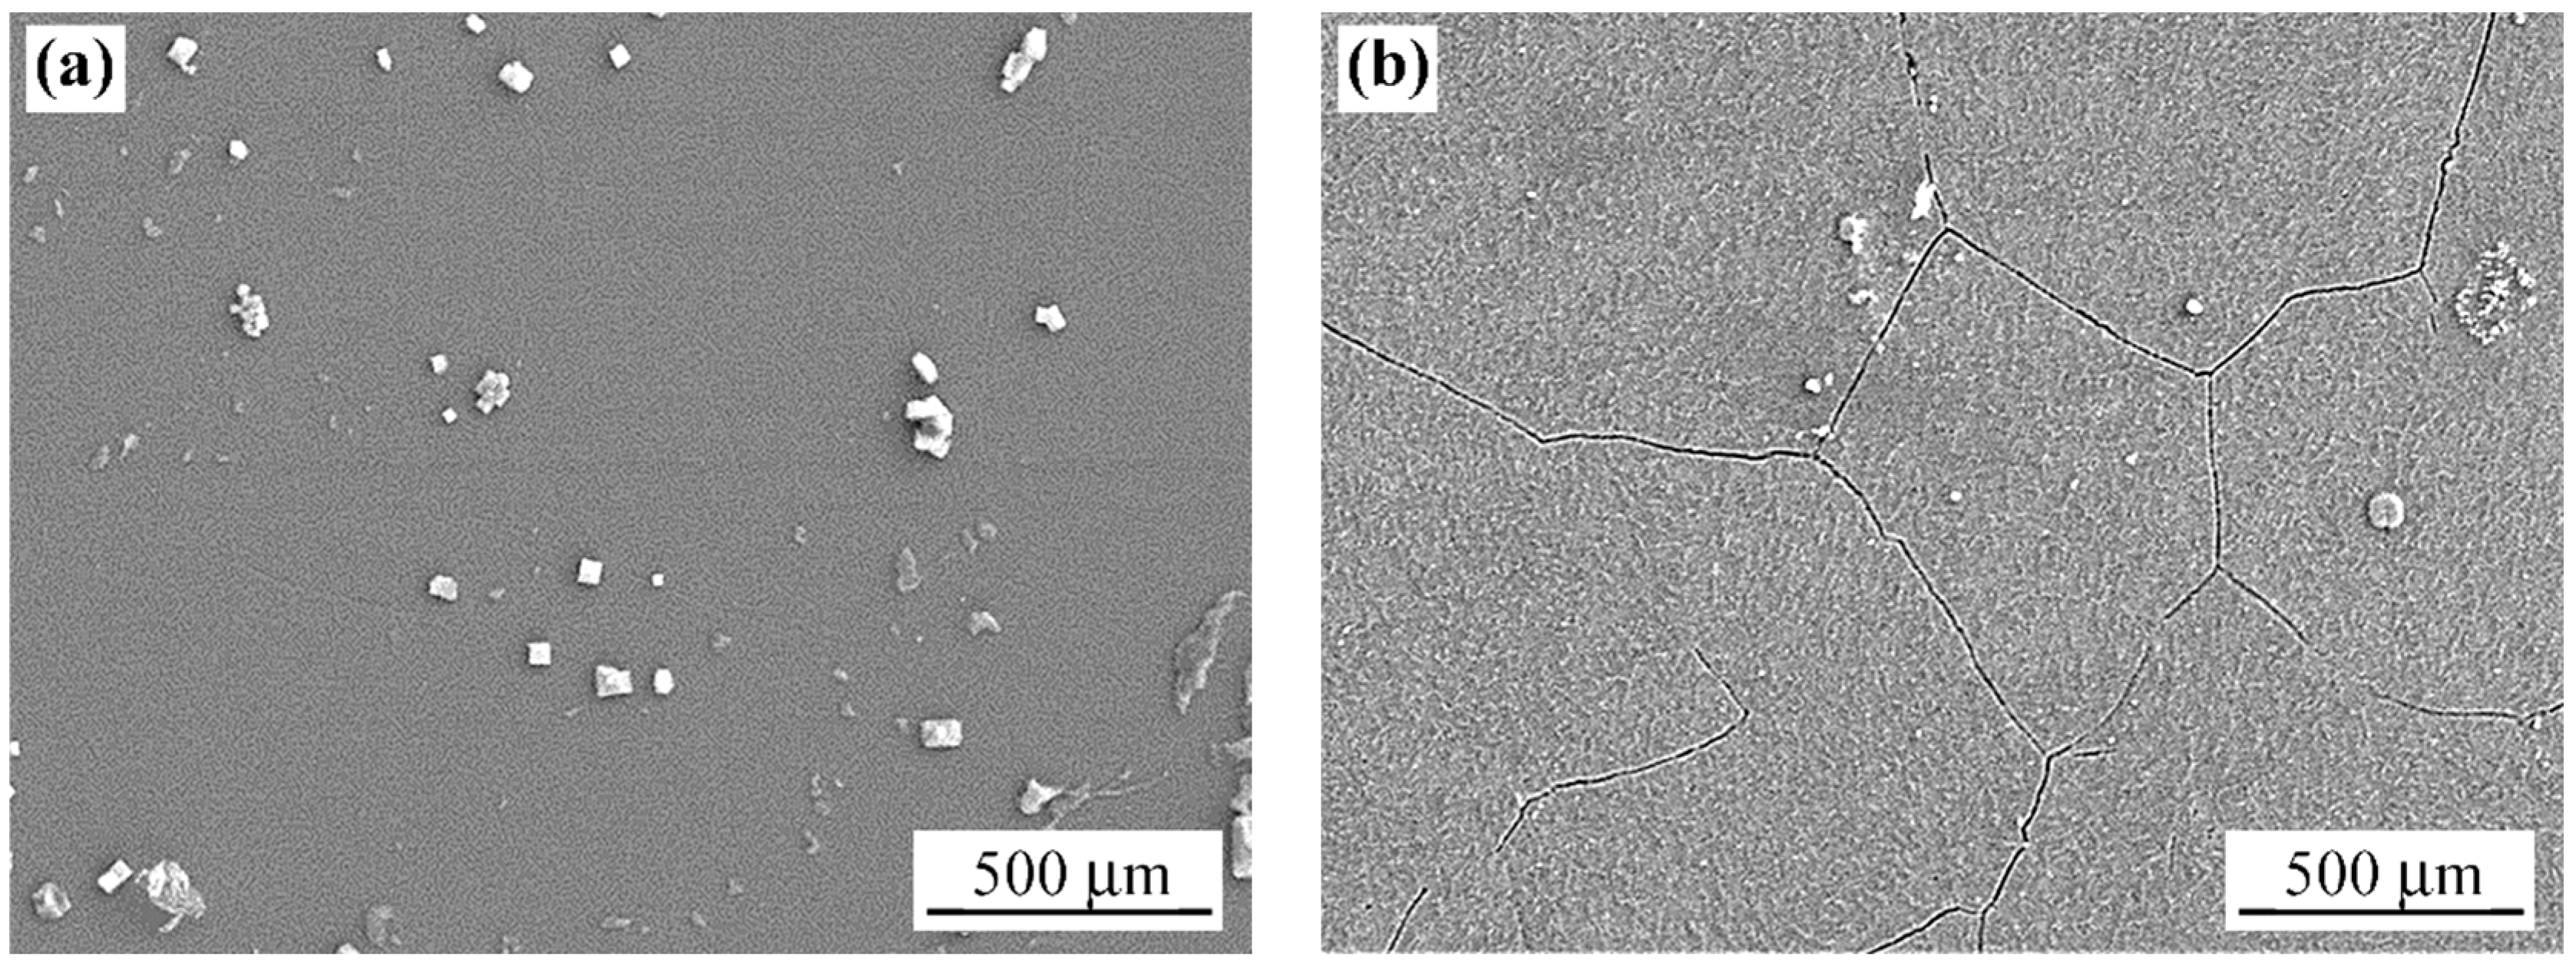
Finally, Figure 4 reveals angular particles rich in Si, Al, Fe and O, dispersed on the surface of the LSM-WR specimen. Their presence will be discussed in Section 4.2.

3.1.3. Electron Backscattered Diffraction Analysis

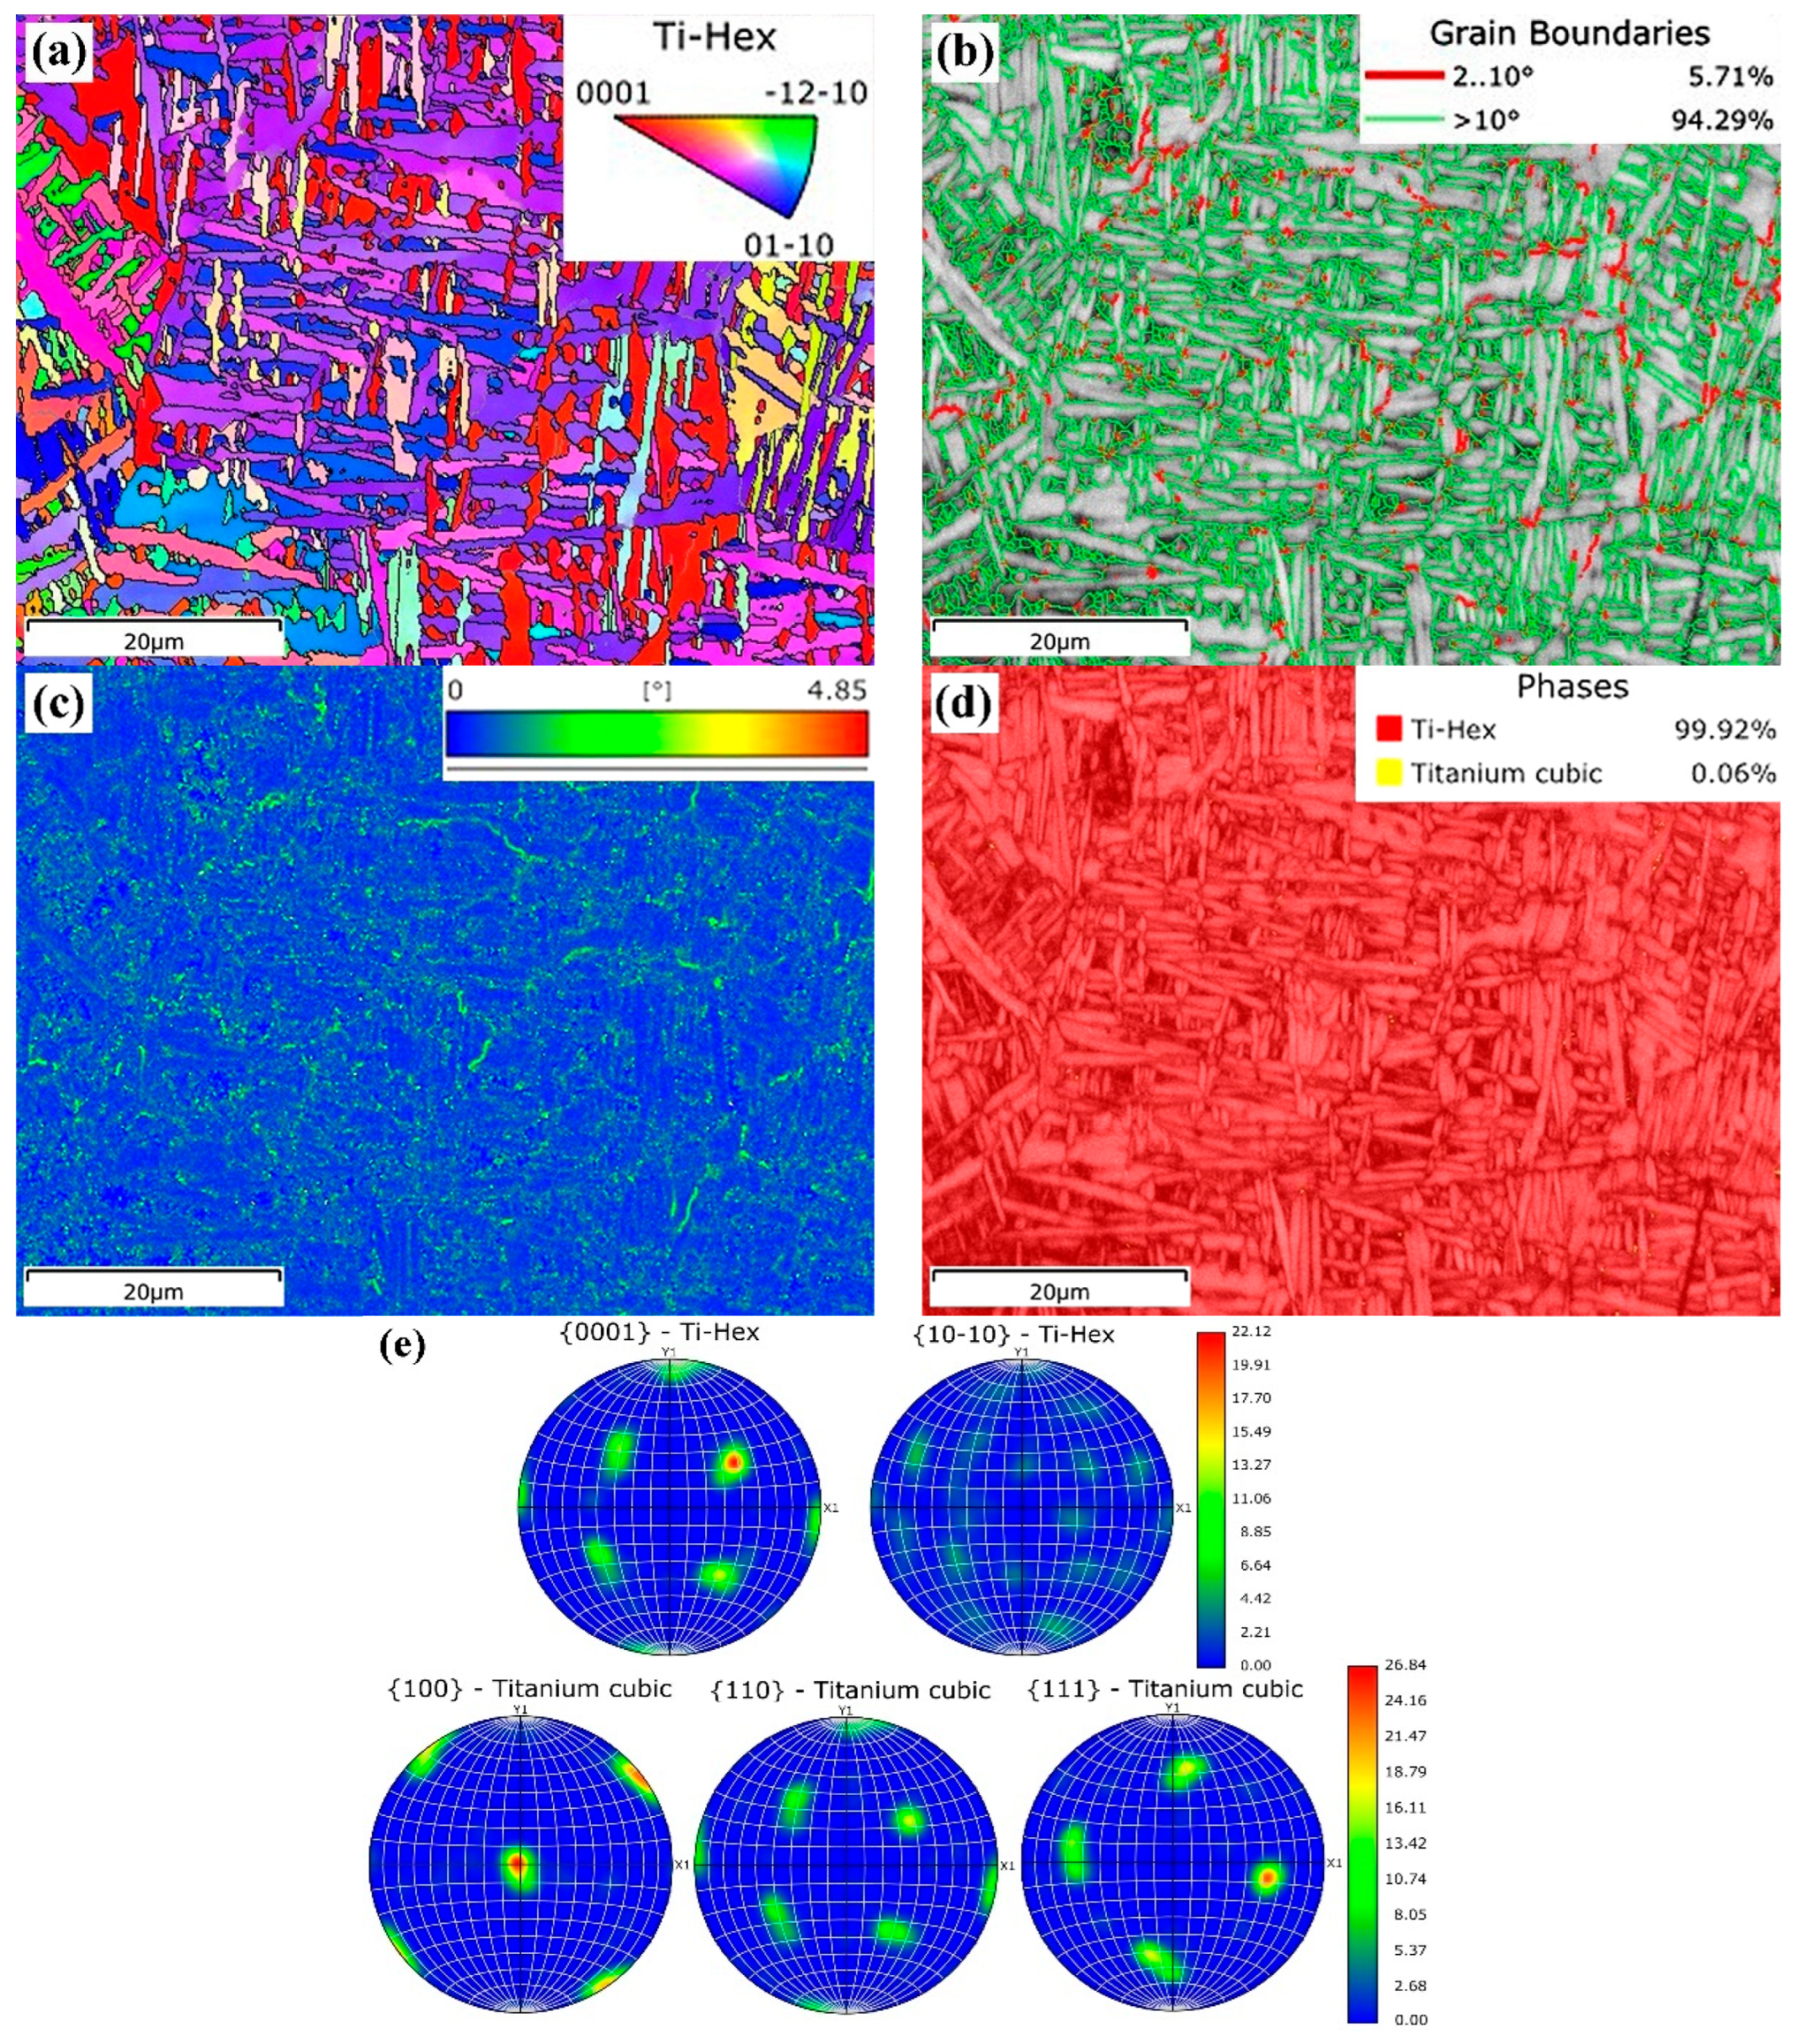
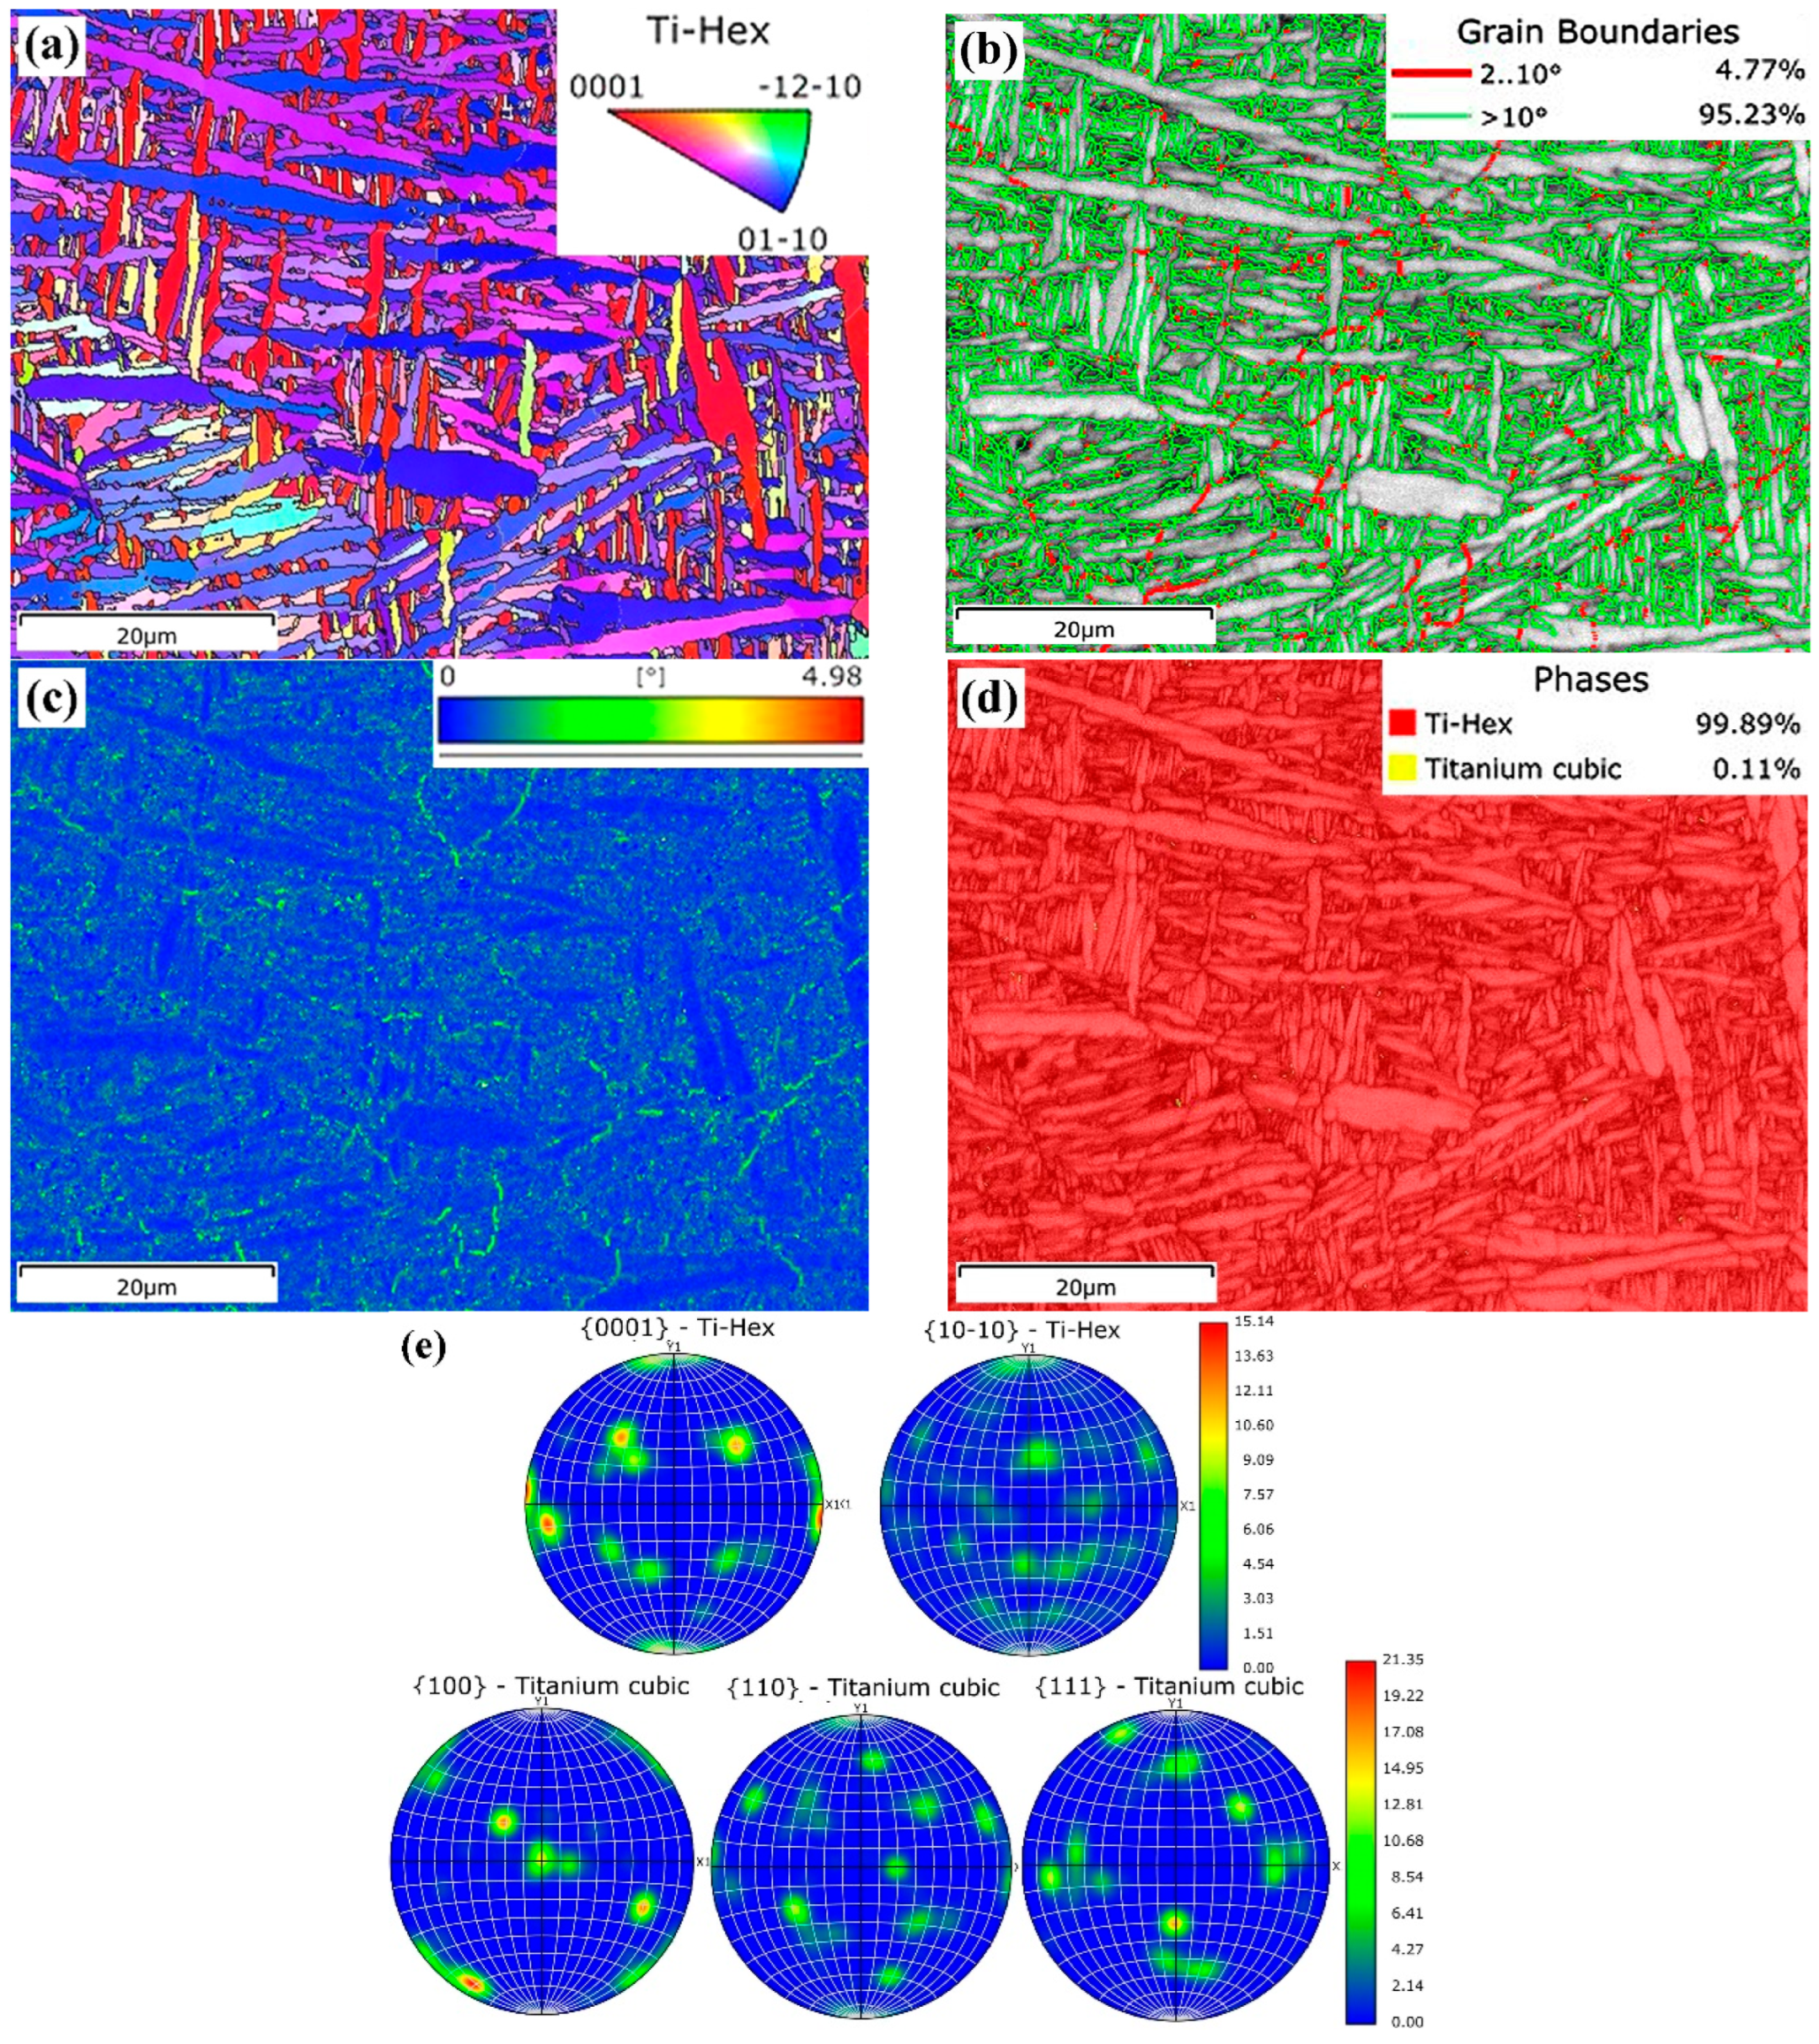
An EBSD study was conducted on the LSM-WR and LSM-LPBF specimens at a depth of 60–70 µm, i.e., within layer B of both specimens. The results are presented in Figure 5 and Figure 6, respectively.
The modified layer in the LSM-WR specimen exhibits a basket-weave pattern composed of needles preferentially oriented along the {0001} and 01 1 ¯ 0 directions, as indicated by the inverse pole Figure (IPF) map shown in Figure 5a. According to the superimposed grain boundary (GB) and band contrast (BC) map (Figure 5b), the individual needles are divided by high-angle grain boundaries (HAGBs), which constitute the majority (94.3%) of all grain boundaries. In contrast, the boundaries of the needle colonies are characterised by low-angle grain boundaries (LAGBs). Figure 5c shows the Kernel Average Misorientation (KAM) map, which quantifies local misorientations within the structure and the corresponding local lattice distortion. The KAM values of the LSM-WR specimen ranged from 0 to 4.85, with an average value of 0.47, being elevated at the needle boundaries and along the LAGBs. According to the phase map (PM) (Figure 5d), the laser-modified layer of the LSM-WR specimen consists almost entirely of the α-Ti (or α′) (HCP) phase (99.92%).
The EBSD analysis of the LSM-LPBF specimen reveals results similar to those of the LSM-WR specimen, in terms of the qualitative texture pattern (Figure 5a and Figure 6a) and the ratio of HAGBs: LAGBs (95.2%:4.8%) (Figure 5b and Figure 6b), as well as the average KAM value (0.47) (Figure 5c and Figure 6c). This also applies to the phase composition, which is almost entirely composed of the α (or α′)-phase (99.89%) (Figure 5d and Figure 6d).
The similarity in the EBSD results for LSM-WR and LSM-LPBF alloys (regarding layer B) is also evident from the analysis of the pole figures presented in Figure 5e and Figure 6e. A similarity in texture is observed in the {0001} direction for the αTi (HCP) and in the {100}, {110} and {111} directions for the βTi (BCC).
Overall, the pole figure analysis indicates that both laser surface-treated WR and LPBF alloys exhibited a significant texture and developed similar textures after LSM.

3.1.4. X-Ray Diffraction

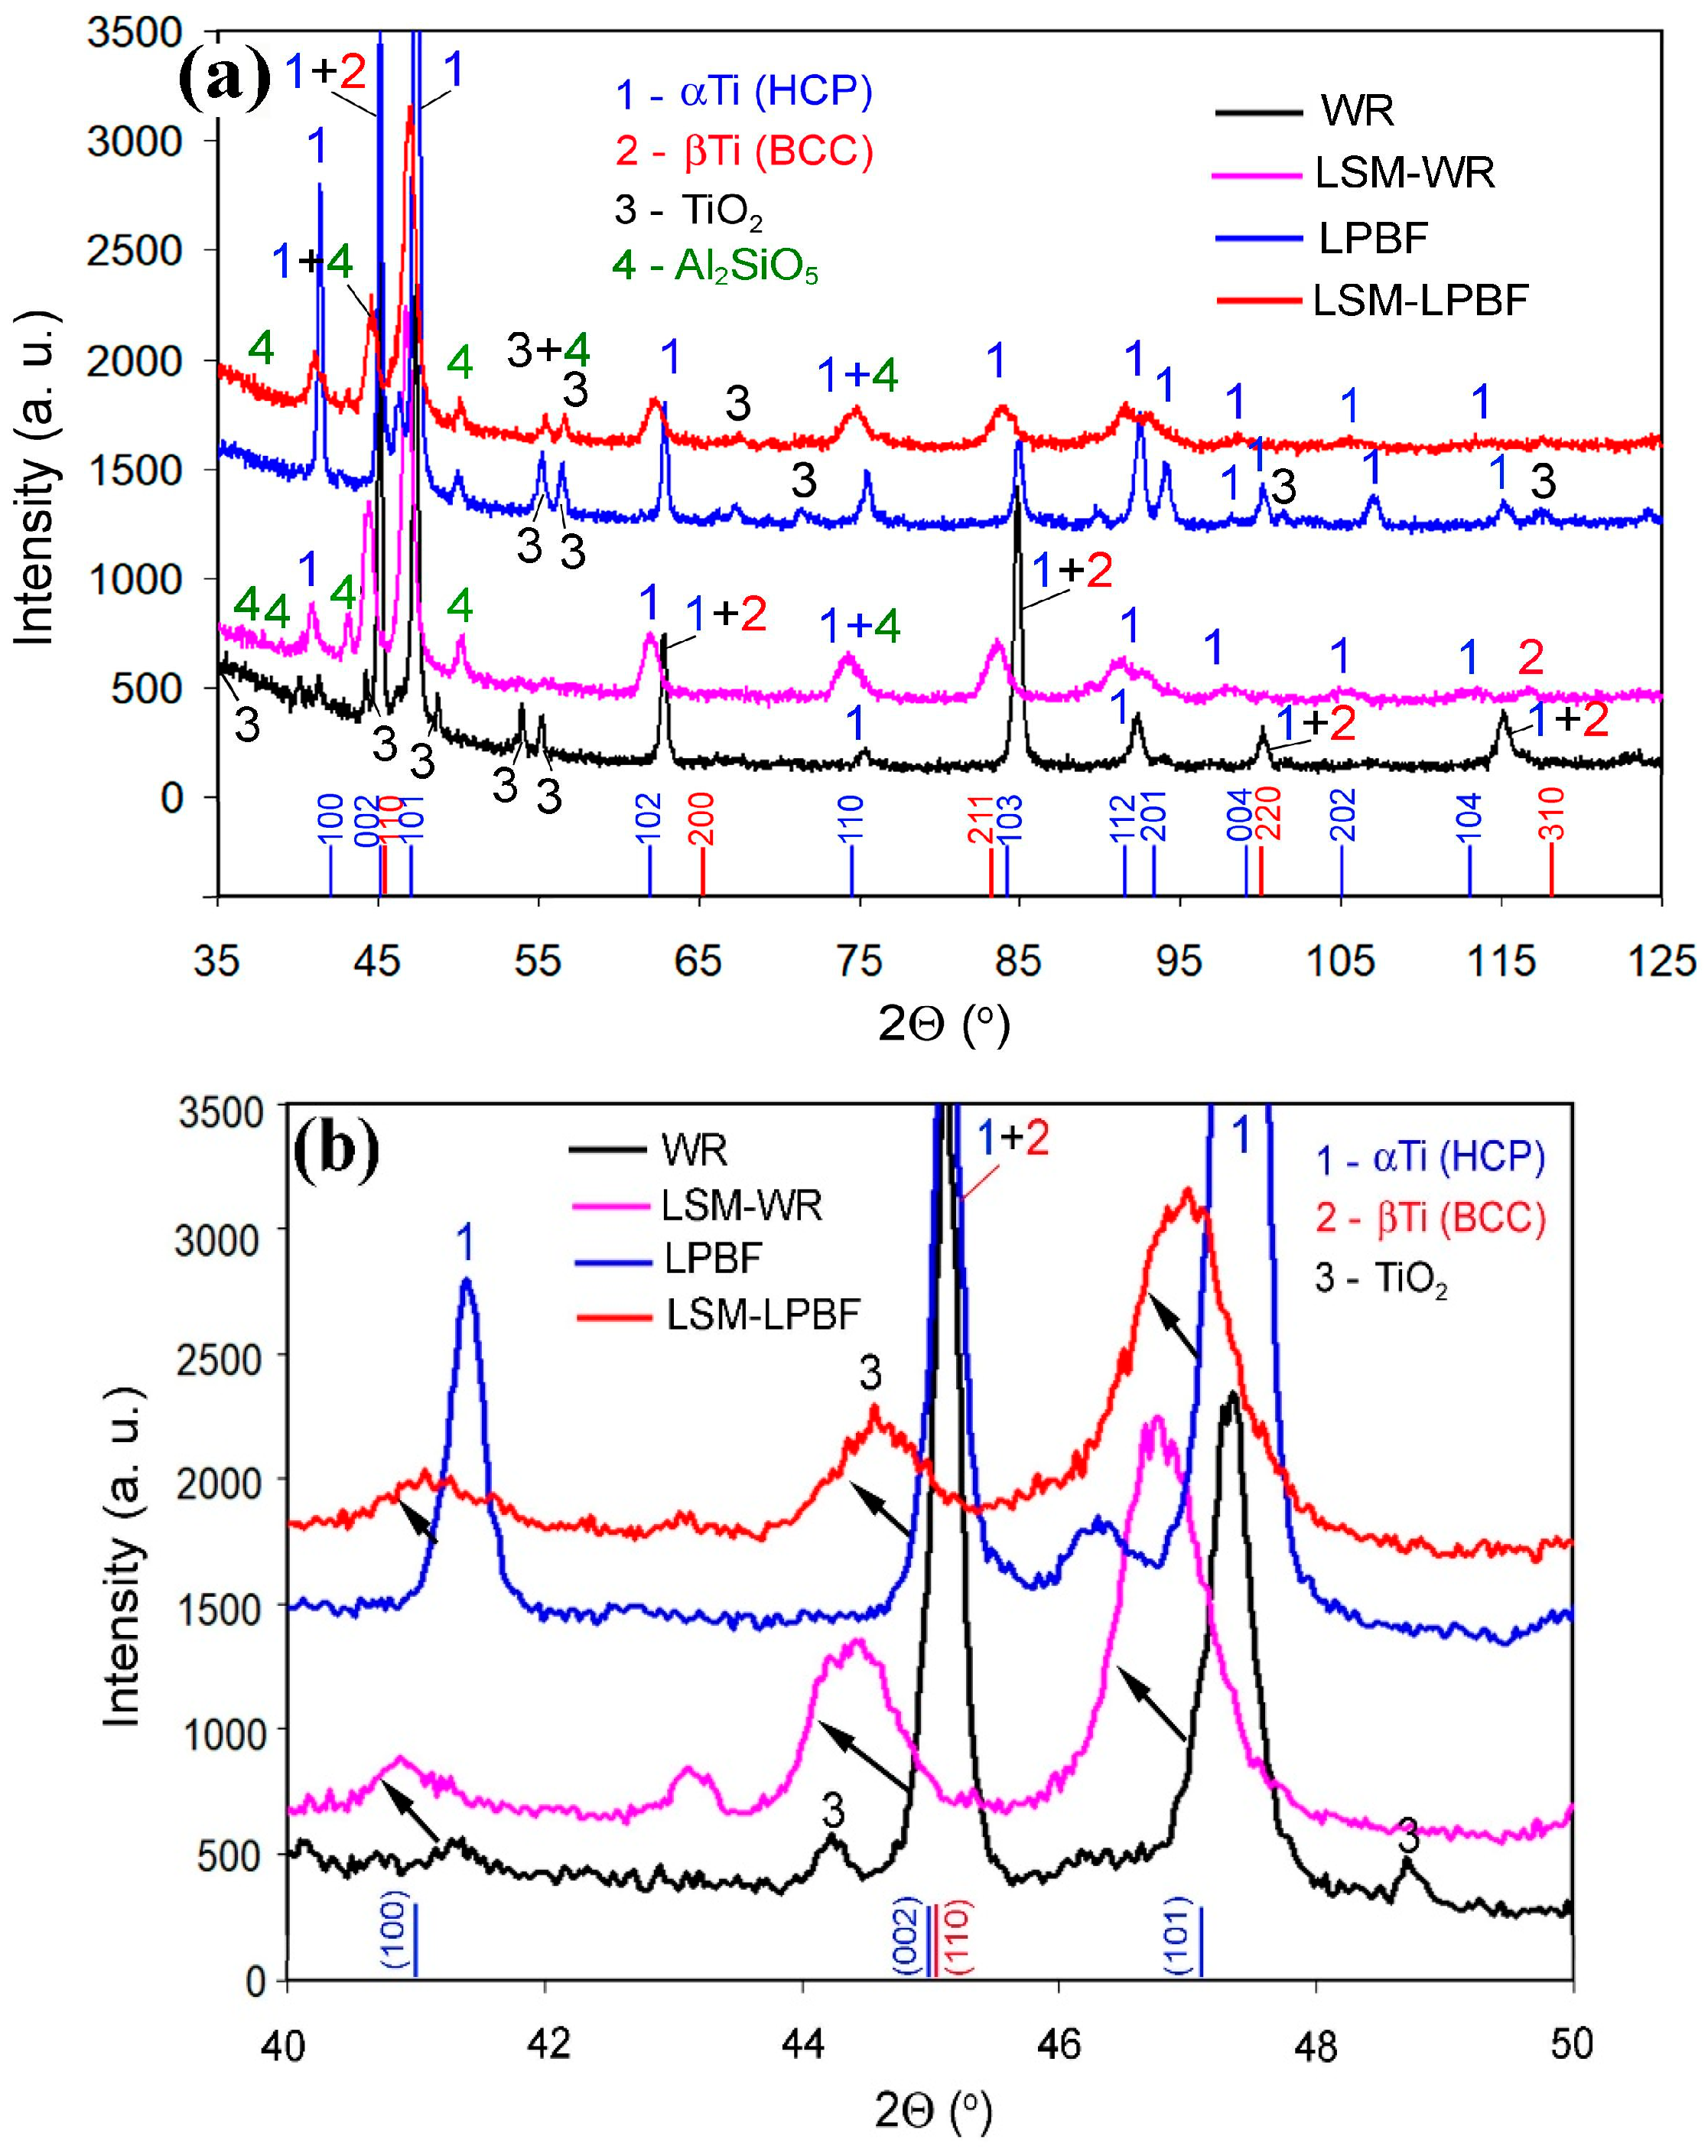
Figure 7 presents the X-ray diffraction patterns of the investigated alloys in their initial state and after laser modification. Specifically, Figure 7a shows the overall view of the diffraction pattern across the entire studied range of 2θ angles, while Figure 7b provides a detailed view of the 2θ range of 40–50°.
The XRD pattern of the WR alloy primarily consists of peaks attributed to βTi and αTi, with a few weak peaks corresponding to TiO2. More details can be found in Appendix A. Considering the high crystallisation rate during LPBF promoting an α′-martensite structure, it is suggested that all “Ti” peaks in the diffraction pattern of the LPBF sample belong solely to α-Ti. Both alloys present minor peaks corresponding to the three polymorphs of TiO2 (rutile, brookite and anatase). These peaks exhibit higher intensities in the pattern of the LPBF alloy, reflecting a more intensive oxidation of Ti-6-4 during LPBF, which is compatible with Derimow et al. [59].
The XRD patterns of the LSM-WR and LSM-LPBF specimens contain nearly the same set of peaks as the patterns of the WR and LPBF specimens, respectively. However, the primary peak of the WR alloy pattern at 2θ = 45° does not appear in the LSM-WR alloy’s pattern. The new primary peak in the LSM-WR alloy’s pattern is at 2θ = 46.8°, which is attributed to the primary peak of α-Ti. Therefore, considering (a) the XRD indications; (b) the high thermal gradients of the LSM process; and (c) the results of the EBSD analysis, which showed nearly 100% α(HCP) phase, though in the “B”-laser-modified layers of both alloys, it can be induced that all “Ti” peaks in the diffraction patterns of the laser-treated samples belong solely to α-Ti.
Distinctive features of the XRD patterns of the LSM-WR and LSM-LPBF specimens include (a) the appearance of minor peaks corresponding to polymorphs of aluminium silicate Al2SiO5 (andalusite and kyanite), (b) a significant broadening of all α-Ti peaks, and (c) their shifting toward lower angles (shown by arrows in Figure 7b). Changes (b) and (c) indicate substantial alterations in the crystalline structure of the alloys due to laser modification, specifically an increase in the lattice parameter (feature “b”) and a reduction in crystallite size (mosaic block size) and/or an increase in microstrains (feature “c”) [60]. These changes are corroborated by data derived from the XRD patterns and shown in Table 2 and Table 3.
Table 2 presents the Full Width at Half Maximum (FWHM) values of the αTi diffraction peaks. As indicated, laser processing resulted in the broadening of all analysed α-phase lines, with the broadening increasing monotonically as the line angle increased, reaching a 3–4-fold increase compared to the initial state. Additionally, the LSM-LPBF sample exhibited more significant broadening of all lines compared to the LSM-WR sample. The line broadening is mainly ascribed to the crystallite size reduction, which is more pronounced in the LSM-LPBF specimen as compared to the LSM-WR specimen (Table 3). Micro-strains increased equally for both alloys. The data in Table 3 also show an increase in lattice parameters due to laser processing, which also follows from the line shifting (Figure 7b).
Based on D (crystallite size) and ε (microstrain), the dislocation density (ρXRD) was derived from the XRD pattern using the Williamson–Smallman equation [61,62] provided in the Appendix A. Table 3 shows that after laser processing, the ρXRD values increased by one order of magnitude. The ρXRD data are compatible with those reported in the work of Muiruri et al. [63] for α′-martensite in Ti-6-4. Furthermore, LSM-LPBF Ti-6-4 presents slightly higher microstrain and dislocation density values than LSM-WR Ti-6-4.
To conclude, the predominant metallic phase after LSM is that of α′ Ti (martensite).

3.2. Microhardness Distribution

Laser surface treatment led to changes in the mechanical properties of the alloys. This is evident from the microhardness distribution across the modified layer, as shown in Figure 8. It is clear that laser processing significantly increased the microhardness of the near-surface layer. At a depth of up to 10 µm (layer A), the hardness reached peak values of 680 HV in the LSM-LPBF specimen and 655 HV in the LSM-WR specimen (Figure 8a). As the depth increased to 50 µm (layer A for the LSM-LPBF specimen and layer B for the LSM-WR specimen), the microhardness gradually decreased to 645 HV and 634 HV, respectively. With a further depth increase to 150 µm (layer B for the LSM-LPBF specimen and layer C for the LSM-WR specimen), the microhardness sharply declined to 355–410 HV (Figure 8b). Below the depth of 150–200 µm, the hardness of the LSM-LPBF specimen stabilised at 345–380 HV, except for a drop to approximately 300 HV at a depth of ~1250 µm, corresponding to the intersection of the heat-affected zone (HAZ) contour influenced by the laser beam.
In the LSM-WR specimen, at the depths of 200–800 µm (layer C), microhardness stabilised at 300–340 HV, then decreased to 270–285 HV in the HAZ. Subsequently, it rose to 334–357 HV at the depth of ~1500 µm followed by a decline to stabilise at 270–300 HV. The distribution of microhardness aligns with the structure gradient, realised by the sequence of layers (A, B, C, HAZ) through the depth of the modified zone.

3.3. Electrochemical Testing

Figure 9 exhibits the cyclic polarisation curves of LPBF and wrought Ti-6-4, as-fabricated and laser surface-melted (LSM), in SBF, at 37 °C. The critical electrochemical values are included in Table 4.

3.3.1. Effect of Laser Surface Melting on the Cyclic Polarisation Behaviours of LPBF and Wrought Ti-6-4

Figure 9a,b and Table 4 show that the LSM specimens present higher corrosion current density (i.e., corrosion rate) and passive currents compared to the untreated specimens, indicating inferior resistance to general corrosion. The current fluctuations during forward anodic polarisation of the LSM specimens further confirm the inferior corrosion performance of the laser-treated specimens.
The cathodic polarisation curves of the LSM specimens shift to markedly greater currents, i.e., the laser-treated surfaces are more capable of supporting cathodic reactions, indicating larger effective reaction areas and greater charge transfer.
Despite faster corrosion kinetics (higher corrosion, passive, and cathodic polarisation current densities), the LSM specimens present notably more noble Ecorr values than the as-fabricated specimens and true passivity (ip << 10−1 mA/cm2).
Nevertheless, the counterclockwise hysteresis loops suggest resistance to localised corrosion for both laser-treated and untreated specimens. This is further supported by anodic-to-cathodic transition potential (Ea/c tr) values being well above the corrosion potential (Ecorr) values, showing that the surface becomes more noble compared to the surface at the corrosion potential. As previously explained [64], an Ea/c tr higher than Ecorr means that already-corroded areas become cathodic and are protected by intact regions, promoting uniform rather than localised corrosion.
Anodic current transient spikes, indicating metastable pitting, are observed in the passive regimes of the LSM specimens. They are most pronounced in the curves of the LSM-LPBF specimens, persisting throughout the passive regime. In contrast, for the as-built LPBF specimens, the spikes occur only at higher passive potentials. Nonetheless, during reverse polarisation, the metastable pits did not transition into stable pits, as shown by the large counterclockwise hysteresis loop in Figure 9.

3.3.2. Comparison of Cyclic Polarisation Behaviour of LSM-LPBF with LSM-WR Specimens

Figure 9c presents the cyclic polarisation curves of LSM-LPBF and LSM-wrought Ti-6-4 in SBF at 37 °C. As seen in Figure 9c and Table 4, the LSM-LPBF specimens present higher corrosion current density and higher passive currents than the LSM-WR specimens, indicating inferior resistance to general corrosion. Still, the corrosion rate of LSM-LPBF Ti-6-4 is well below 0.02 mm/year, qualifying as “outstanding” per Fontana’s classification [65]. While calculated using the bulk alloy composition, this still indicates the high corrosion resistance of the modified surface.
The significant current fluctuations during forward anodic polarisation of the LSM-LPBF specimens further indicate their inferior corrosion performance compared to their LSM-WR counterparts. Moreover, the cathodic polarisation curves of the LSM-LPBF specimens shift to higher currents, showing their greater ability to sustain cathodic reactions compared to the LSM-WR specimens.

3.4. Microstructure of Corrosion

3.4.1. Effect of Laser Treatment (LSM) on the Cyclic Polarisation Behaviours of LPBF and Wrought Ti-6-4

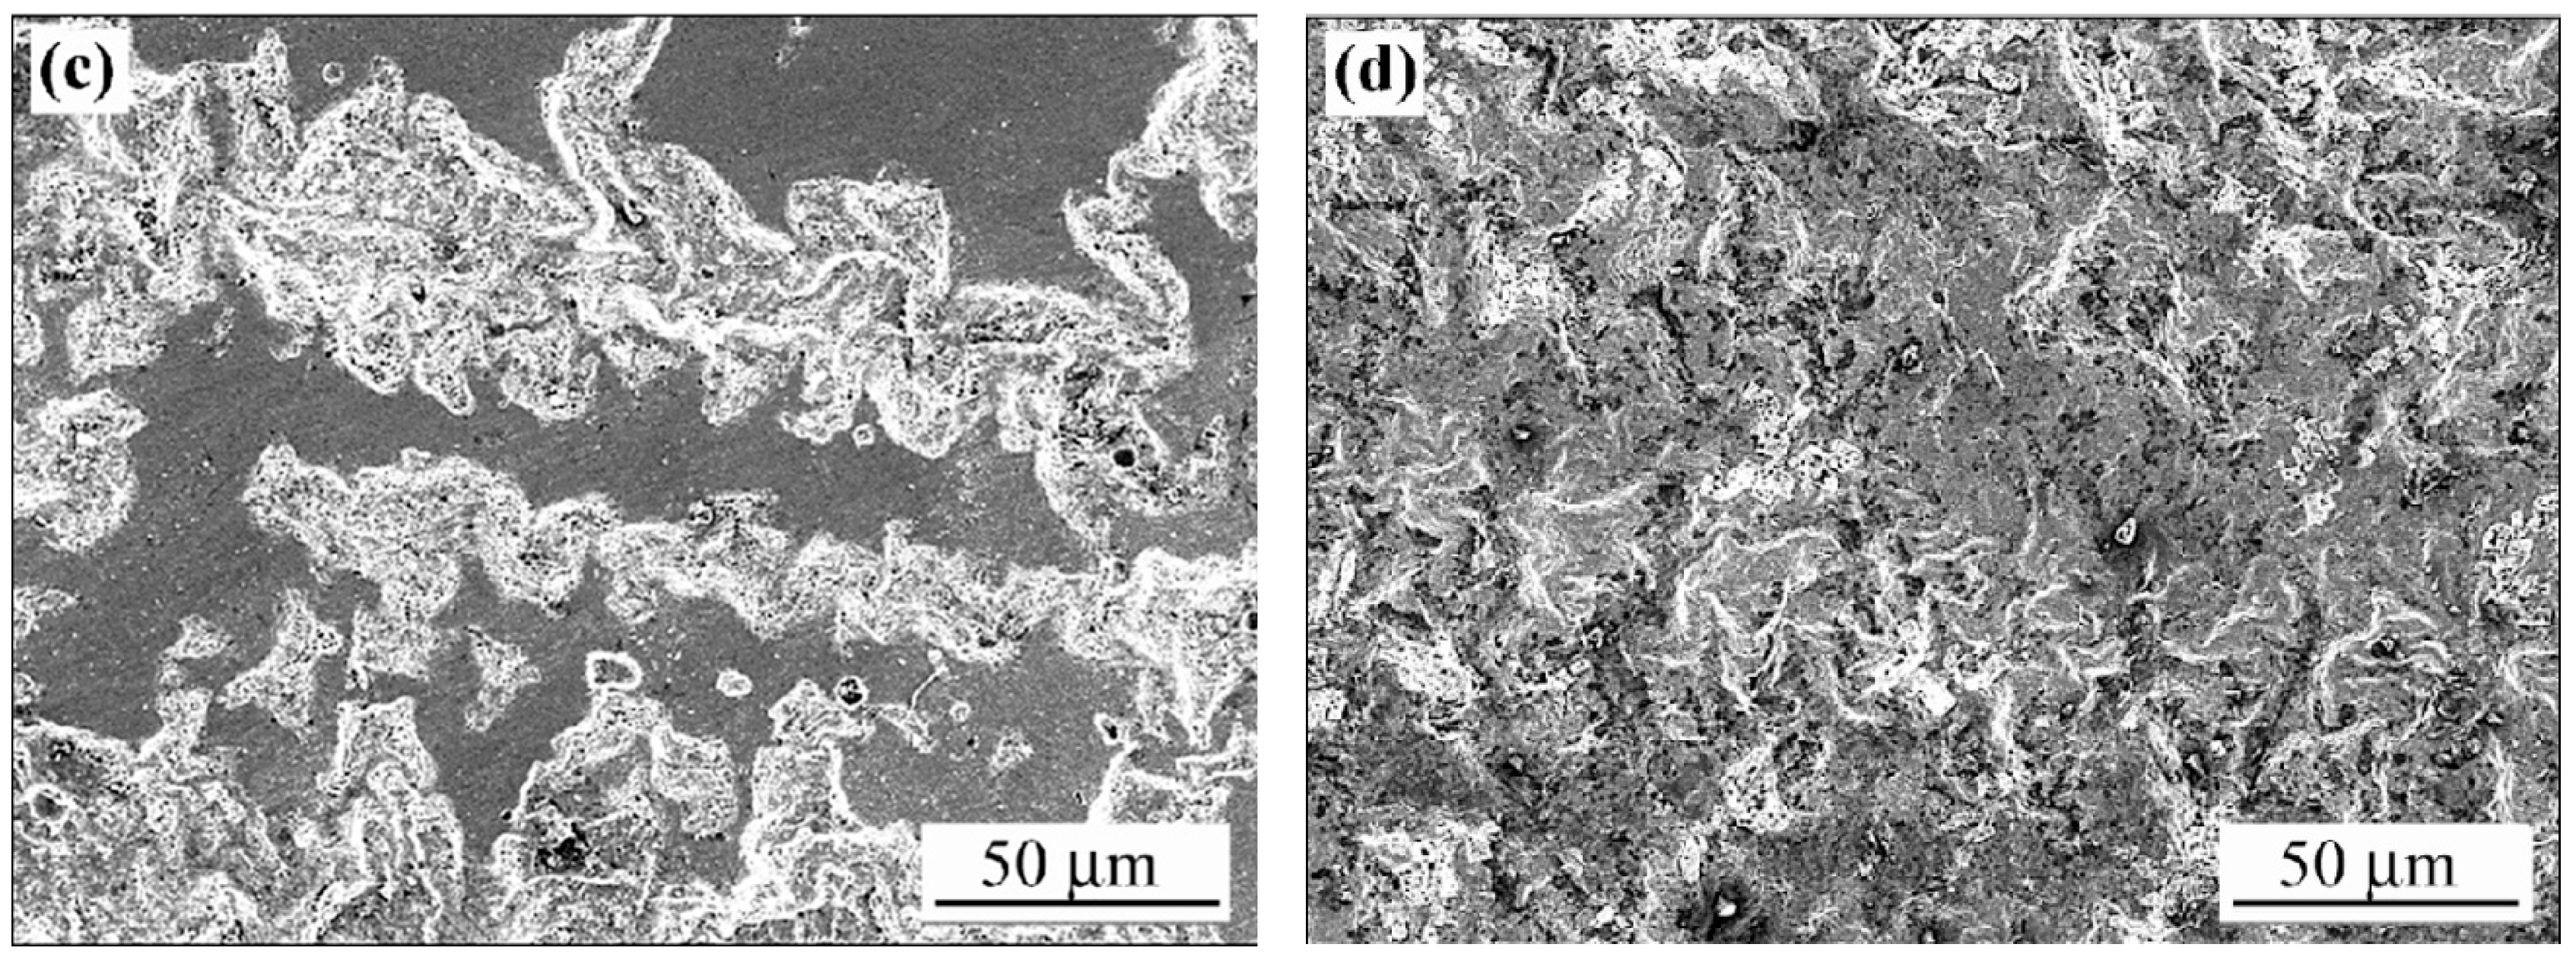
Figure 10 illustrates the free surfaces of as-fabricated Ti-6-4 ((a) LPBF, (b) WR), and LSM Ti-6-4 ((c) LPBF, (d) WR) after cyclic polarisation in SBF at 37 °C. Although no corrosion is visible, the as-fabricated surfaces appear smooth with salt crystal deposits, whereas the LSM surfaces are rough with marked relief, as already noted in Section 3.1.2. No pitting is discerned in either state.
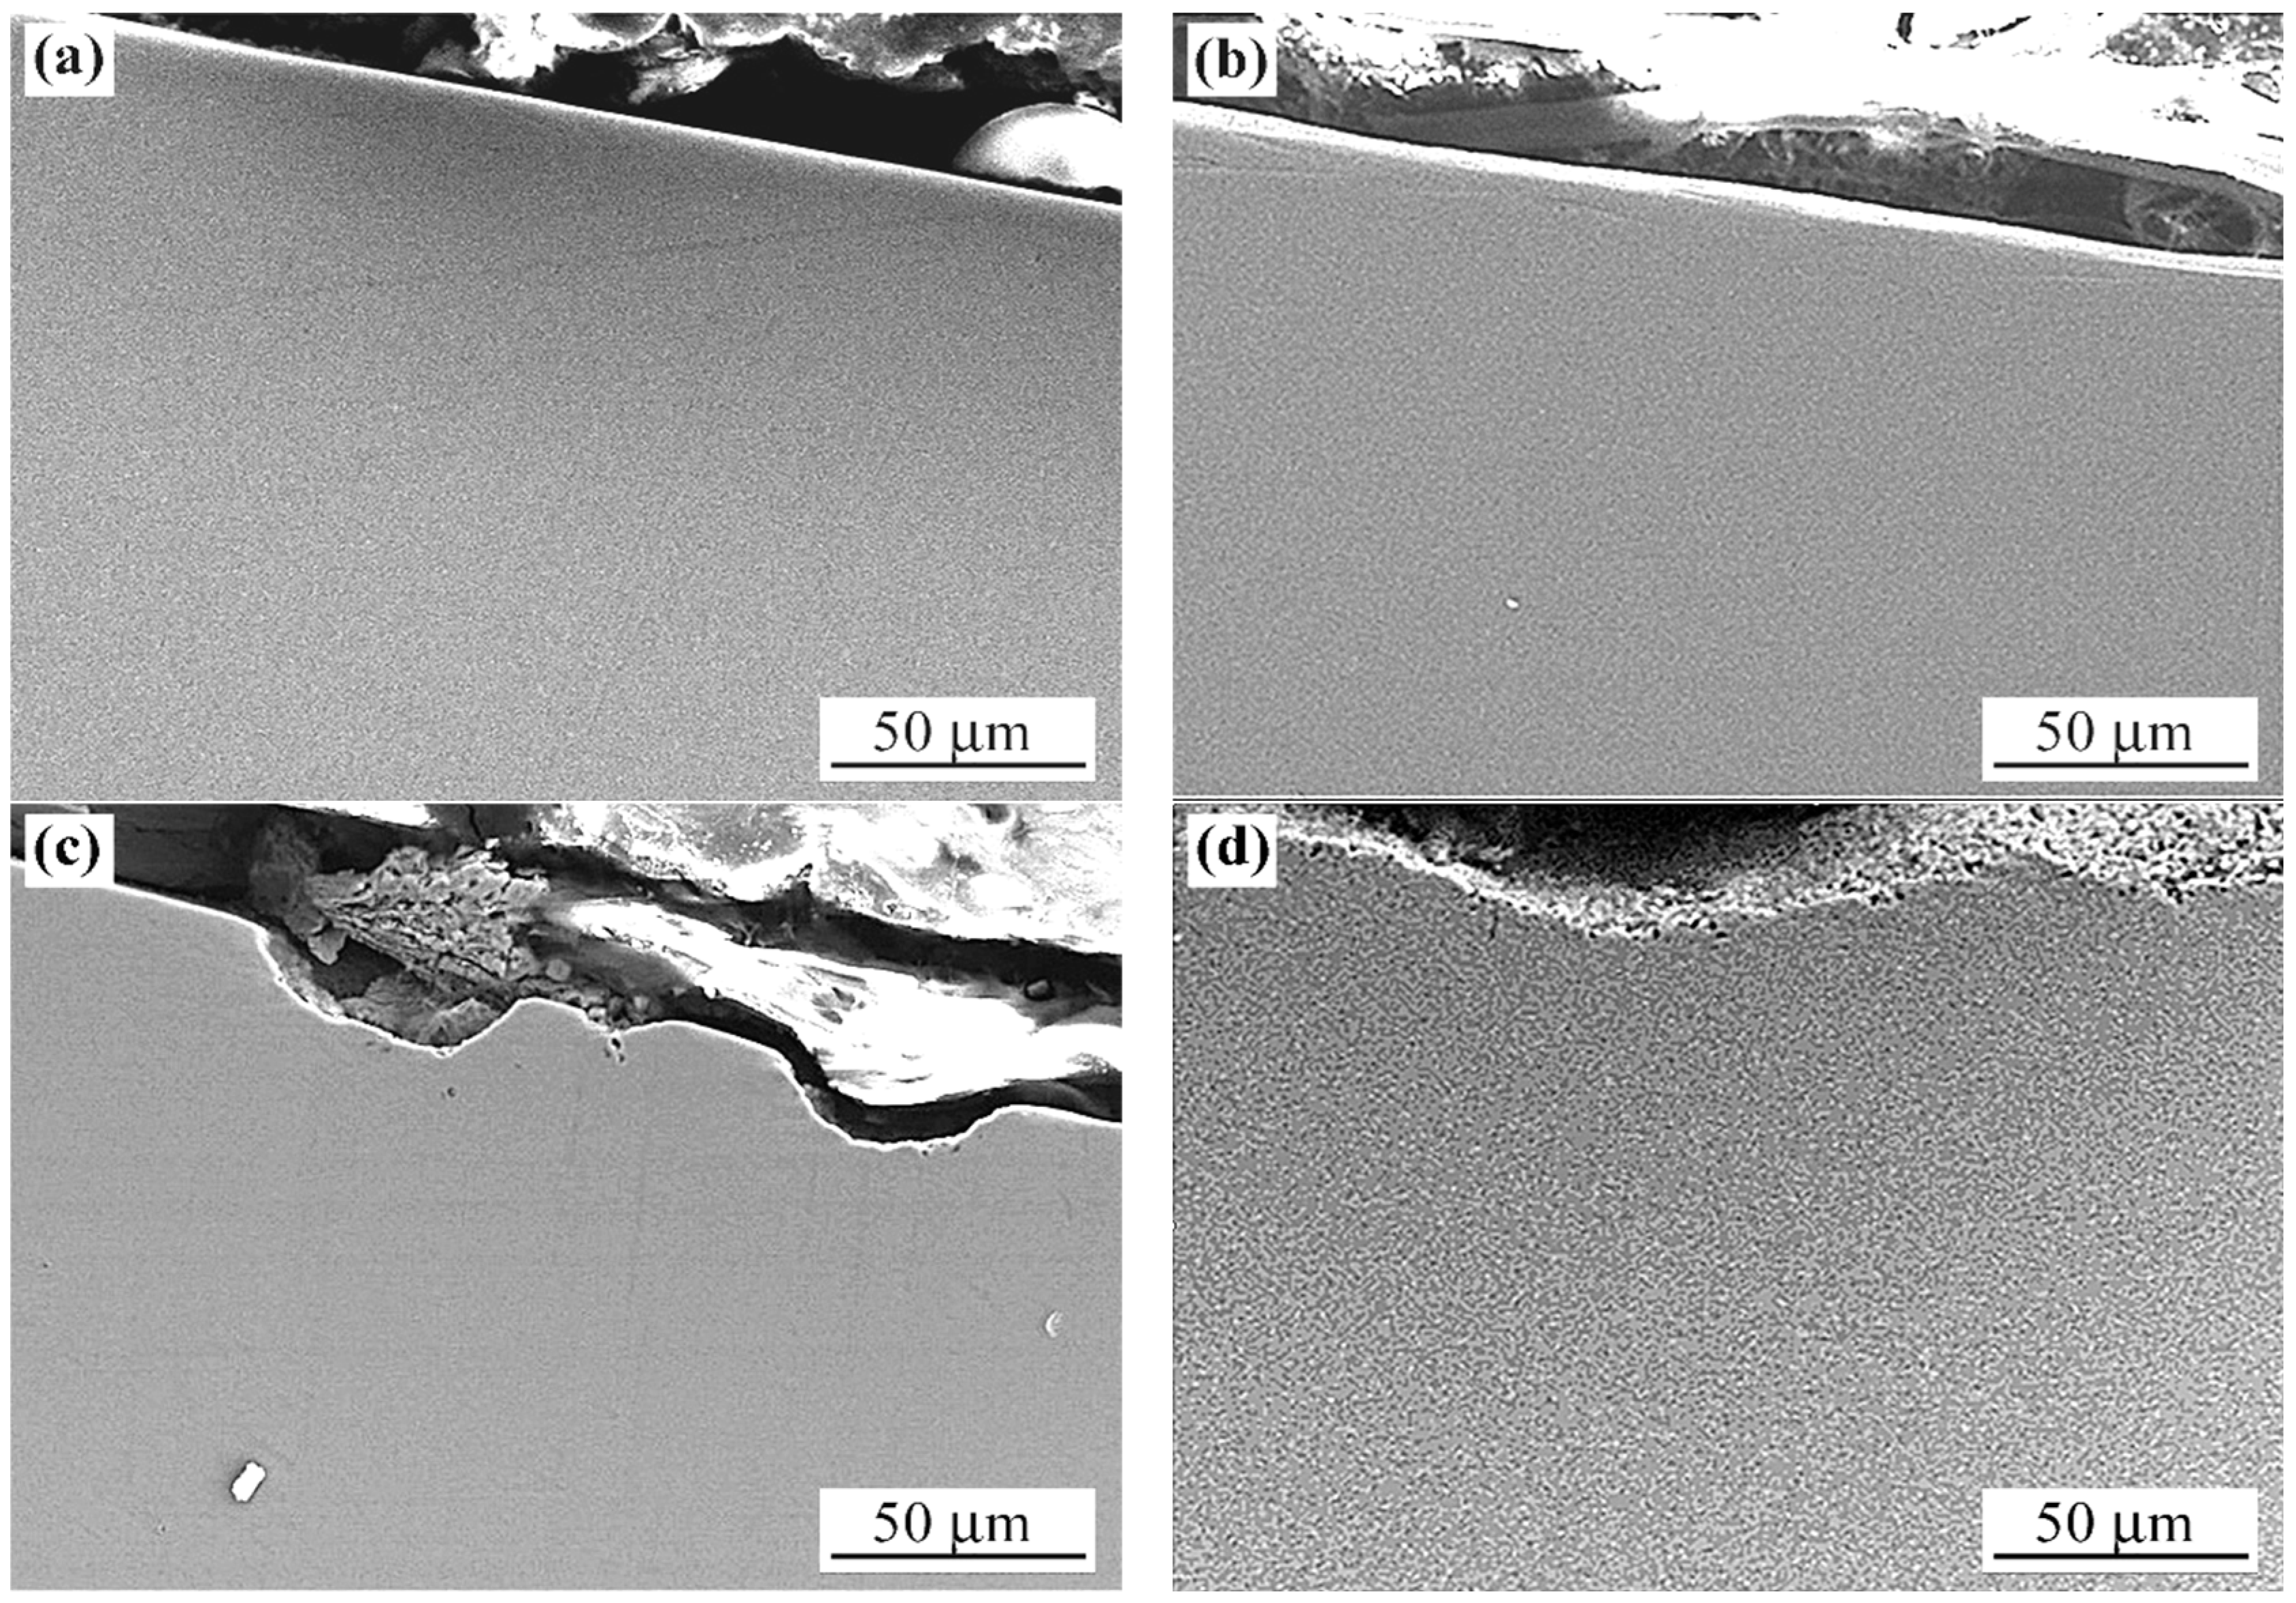
The non-occurrence of pitting is confirmed in the cross-sectional micrographs of the as-fabricated Ti-6-4 (Figure 11a,b) and LSM Ti-6-4 (Figure 11c,d) after cyclic polarisation in SBF at 37 °C, corroborating the counterclockwise hysteresis in Figure 9.
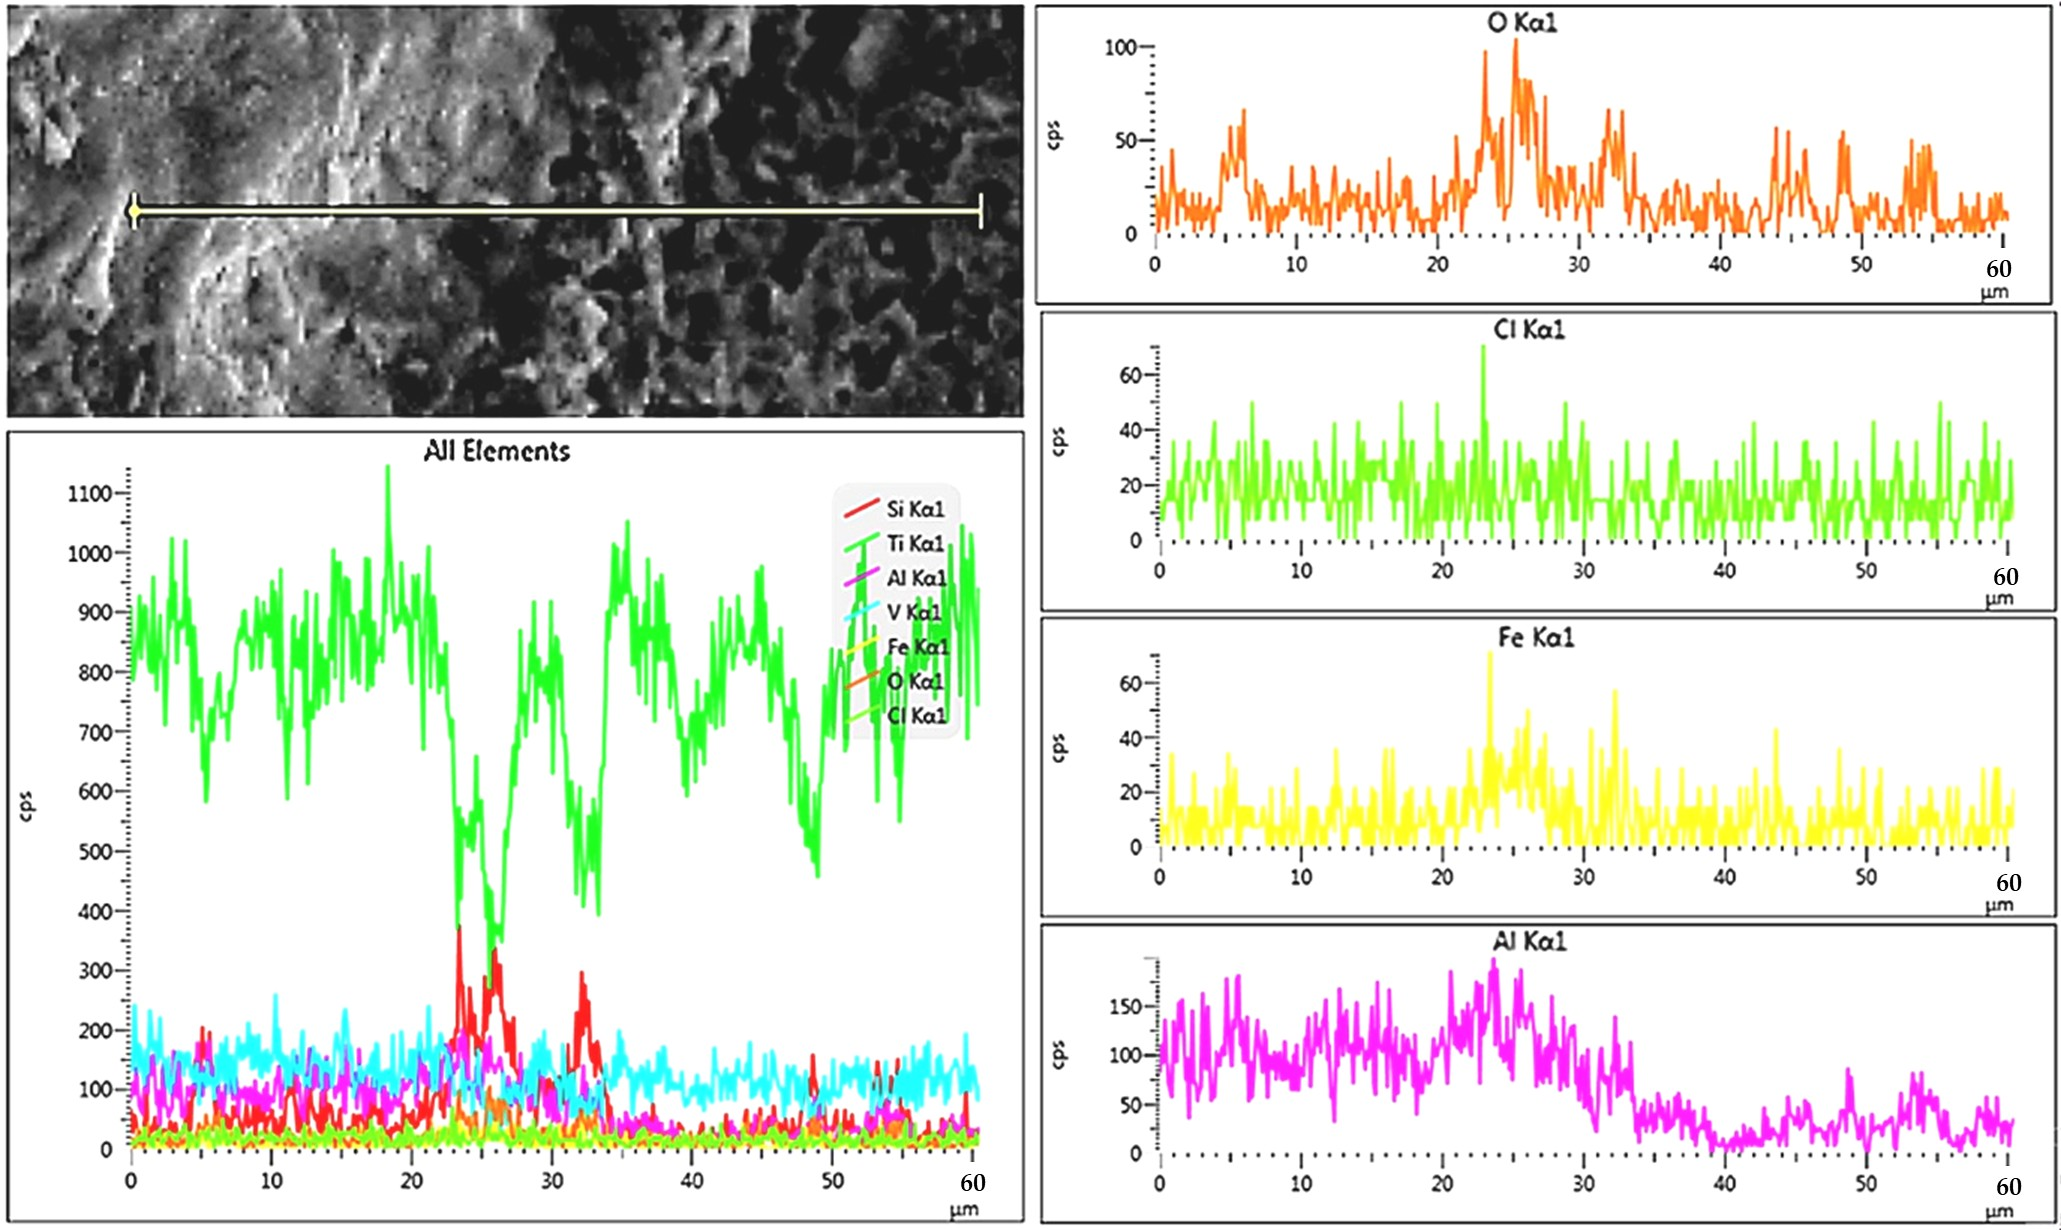
Figure 10c illustrates the free surface of LSM-LPBF Ti-6-4 after cyclic polarisation. The laser-treated surface presents an intense relief alternating between smooth metallic and rough scraped-like zones. Higher magnification and EDX (Figure 12) show that the rough zones are enriched in Si, Fe, O and Cl but slightly depleted in Ti. A similar oxide presence is observed on the LSM-WR surfaces (Figure 13). The intensive surface relief in Figure 13 could promote the formation of differential aeration cells under more aggressive electrolyte conditions. Nevertheless, in the present case, the thick and compact surface layers have inhibited electrolyte access to the substrate; the oxide layers have covered the entire surface, unlike the partial coverage in Figure 12.

3.4.2. Comparison of LSM-WR and LSM-LBPF Ti-6-4 After Corrosion

Figure 10c,d illustrate the free surfaces of LSM Ti-6-4 after cyclic polarisation in SBF at 37 °C. The LSM surface presents an intensive relief with alternating smooth and rough, scraped-like zones (Figure 10c), whereas the LSM-WR surface is uniformly rough (Figure 10d). The higher surface roughness of the LSM-LPBF specimens compared to the LSM-WR specimens is evident in the cross-sectional images of Figure 11.

3.4.3. Nature of Corrosion Products-Raman Spectroscopy

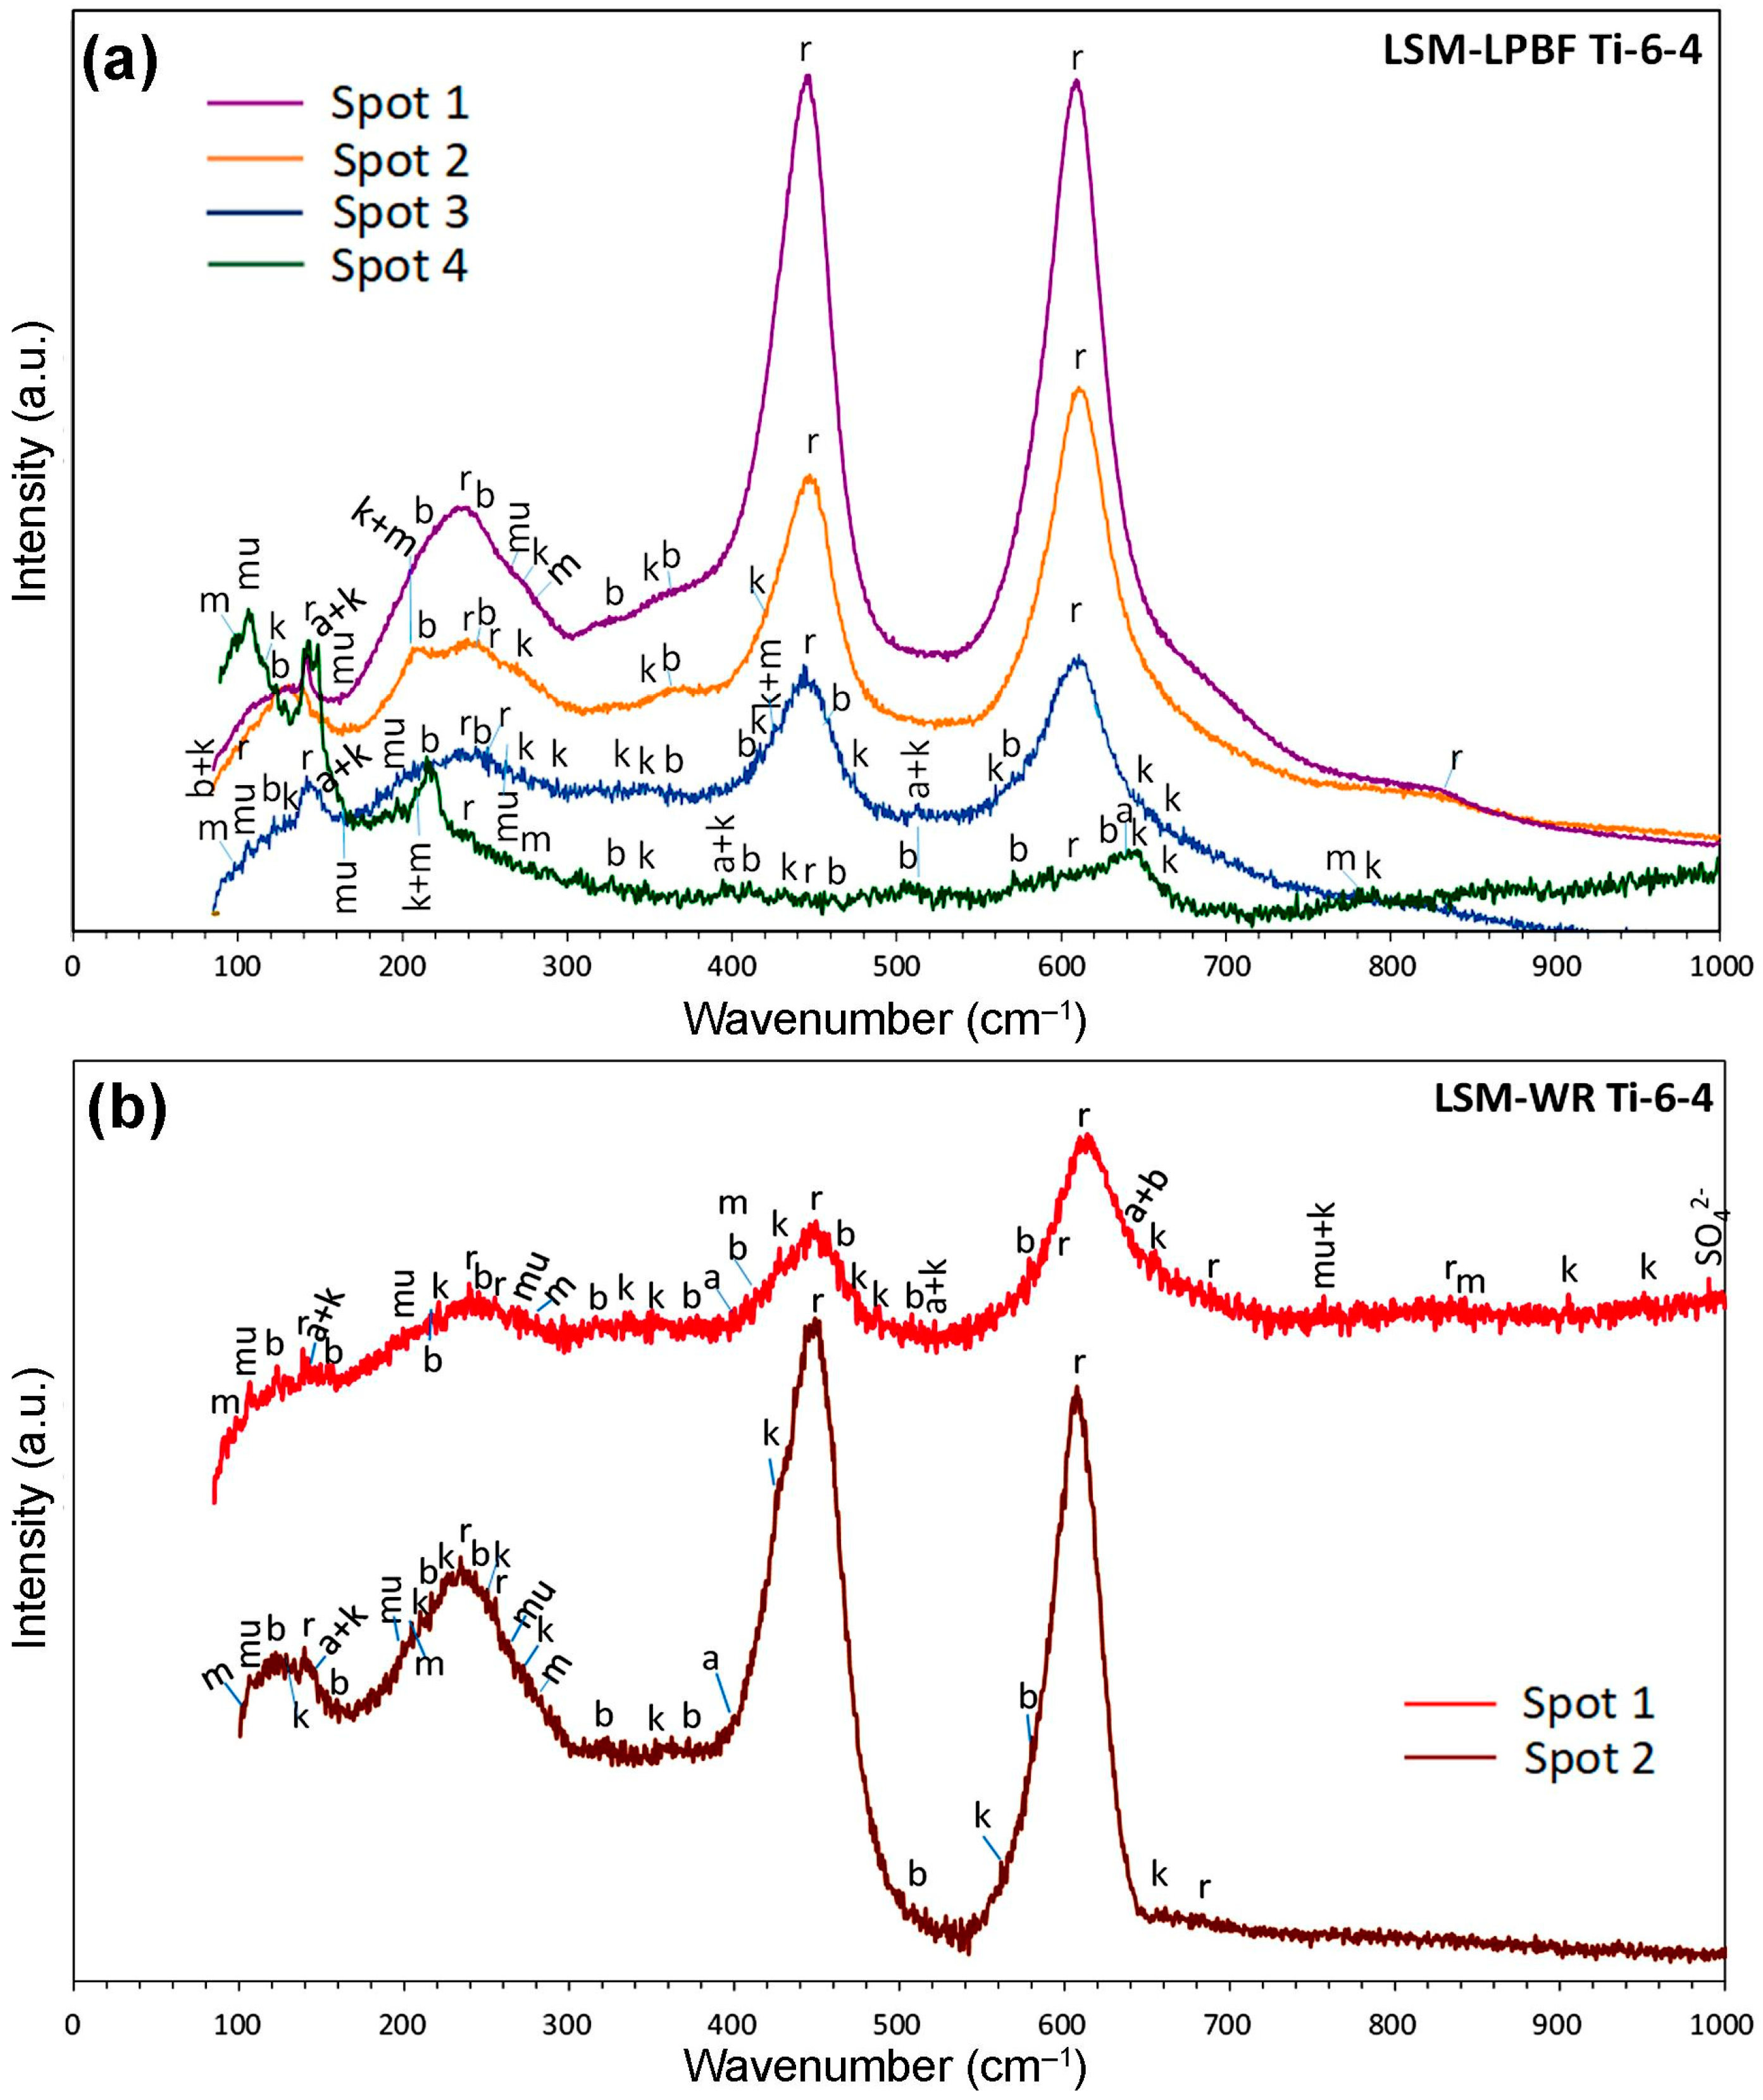
Figure 14 shows representative Raman spectra from surface spots of the LSM-LPBF (Figure 14a) and LSM-WR (Figure 14b) specimens after cyclic polarisation. Variations in spectral intensity across the same surface indicate surface heterogeneity caused by factors such as roughness, compositional differences, or local strain fields. High noise in some spectra might be due to surface irregularities that deform or scatter the laser, reducing effective collection [66,67]. On a rough surface, the incident laser light scatters diffusely rather than reflecting specularly, while the rough topology distorts the Raman focal spot produces a weaker, inconsistent Raman signal.
All spectra in Figure 14a,b are dominated by four strong bands (139–143 cm−1, 235–239 cm−1, 444–448 cm−1, and 608–614 cm−1) corresponding to rutile lattice vibrations [68,69]. Weak brookite bands are identified by the consistent peak at 151–157 cm−1, a band serving as a brookite phase marker for brookite. Anatase-specific bands at 144–147 cm−1 and 636–640 cm−1 [68,69,70,71] are rarely observed and may also be attributed to rutile and kaolinite, respectively, making anatase identification ambiguous; if present, anatase likely coexists in minor quantities with rutile and brookite (More details can be found in the Appendix A).
Several minor peaks can be attributed to clay minerals, particularly kaolin-group minerals (kaolinite, dickite: Al2Si2O5(OH)4; halloysite: Al2Si2O5(OH)4·2H2O), formed by interaction between the aluminium silicate abrasive and the electrolyte [72,73]. Bands at 96–97 cm−1 and 106–108 cm−1 suggest the coexistence of smectite-type minerals (montmorillonite) and phyllosilicates (mica/muscovite), respectively [74,75], likely from leaching of aluminosilicate glass in near-neutral aqueous solutions containing alkalis and alkaline earths.
Generally, bands attributed to aluminium silicate hydrates are incorporated in broad, jagged, and complex bands with a high background noise, indicative of poorly crystalline layers [76]. In the ~160–300 cm−1 range, weak aluminium silicate hydrate peaks occur alongside the main rutile Eg mode at 235–239 cm−1, as well as peaks at 250–255 cm−1, possibly associated with nanostructured rutile.
Figure 14a,b show that the surface layers of the LSM-LPBF and LSM-WR specimens are dominated by rutile. Spectra from rough “hill” zones of the LSM-LPBF specimen exhibit pronounced bands from clay and phyllosilicate minerals (lowest spectrum in Figure 14a). Still, the dominant peaks remain at rutile wavenumbers, though broadened and jagged, with additional contributions from aluminium silicate hydrates.
A weak, sharp band near 990 cm−1 may be assigned to SO42−2 mode) from the SBF solution, while the other principal SO42− band (ν4 mode) may be masked by the dominant rutile peak at 608–614 cm−1 [77].
Overall, Raman spectroscopy of the corroded surfaces corroborated the microstructural findings, verifying Al- and Si-rich oxide structures (Figure 12 and Figure 13) and identifying them as kaolin-type minerals, phyllosilicates and smectites. The results also support the XRD findings on uncorroded specimens, which revealed the presence of Al2SIO5 polymorphs on the melted surfaces. Moreover, Raman analysis revealed TiO2 as the main oxide, predominantly in the rutile form, which is compatible with several studies reporting that passive films on biomedical Ti alloys consist of rutile accompanied by anatase [78,79]. Nevertheless, the identified surface Ti-oxides were at least partly present on LSM surfaces prior to corrosion (Figure 4 and Figure 7) [80].
Although both LSM-WR and LSM-LPBF specimens exhibit similar surface film compositions, substantial differences exist between different spots on the same surface, reflecting variations in the film extent, thickness, and roughness.

4. Discussion

4.1. Microstructure Modification Mechanisms

Analysis of the microstructure distribution across the laser-modified samples revealed the following structural gradients from the surface toward the centre:
(a)
LPBF sample: dendritic zone A → coarse-grained zone B (grain size of 140–175 µm) → fine-grained zone C → base (unmodified) structure.
(b)
WR sample: dendritic zone A → medium-grained zone B (grain size of 75.1 µm) → zone C with variable grain size (ranging from 123 µm to 16.5 µm) → base structure.
Though both samples show similar gradients, LPBF exhibited ~20% less modification depth, a thicker dendritic layer, and coarser grains in zone B. These differences are due to greater overheating in LPBF, attributed to its lower thermal conductivity. LPBF alloys typically show reduced conductivity due to the reduced free path of electrons caused by their enlarged scattering in pores, grain boundaries, lattice defects, cell walls, oxides and precipitates, as well as segregated atoms [81]. Thermal conductivity for LPBF Ti-6-4 ranges from 4.00 to 6.18 W/(m·K) [82,83], while wrought Ti-6-4 shows 6.60–7.50 W/(m·K) [84,85]. Thus, LPBF Ti-6-4 is more prone to surface overheating, resulting in higher surface roughness and coarser laser-modified (layer B) structures.
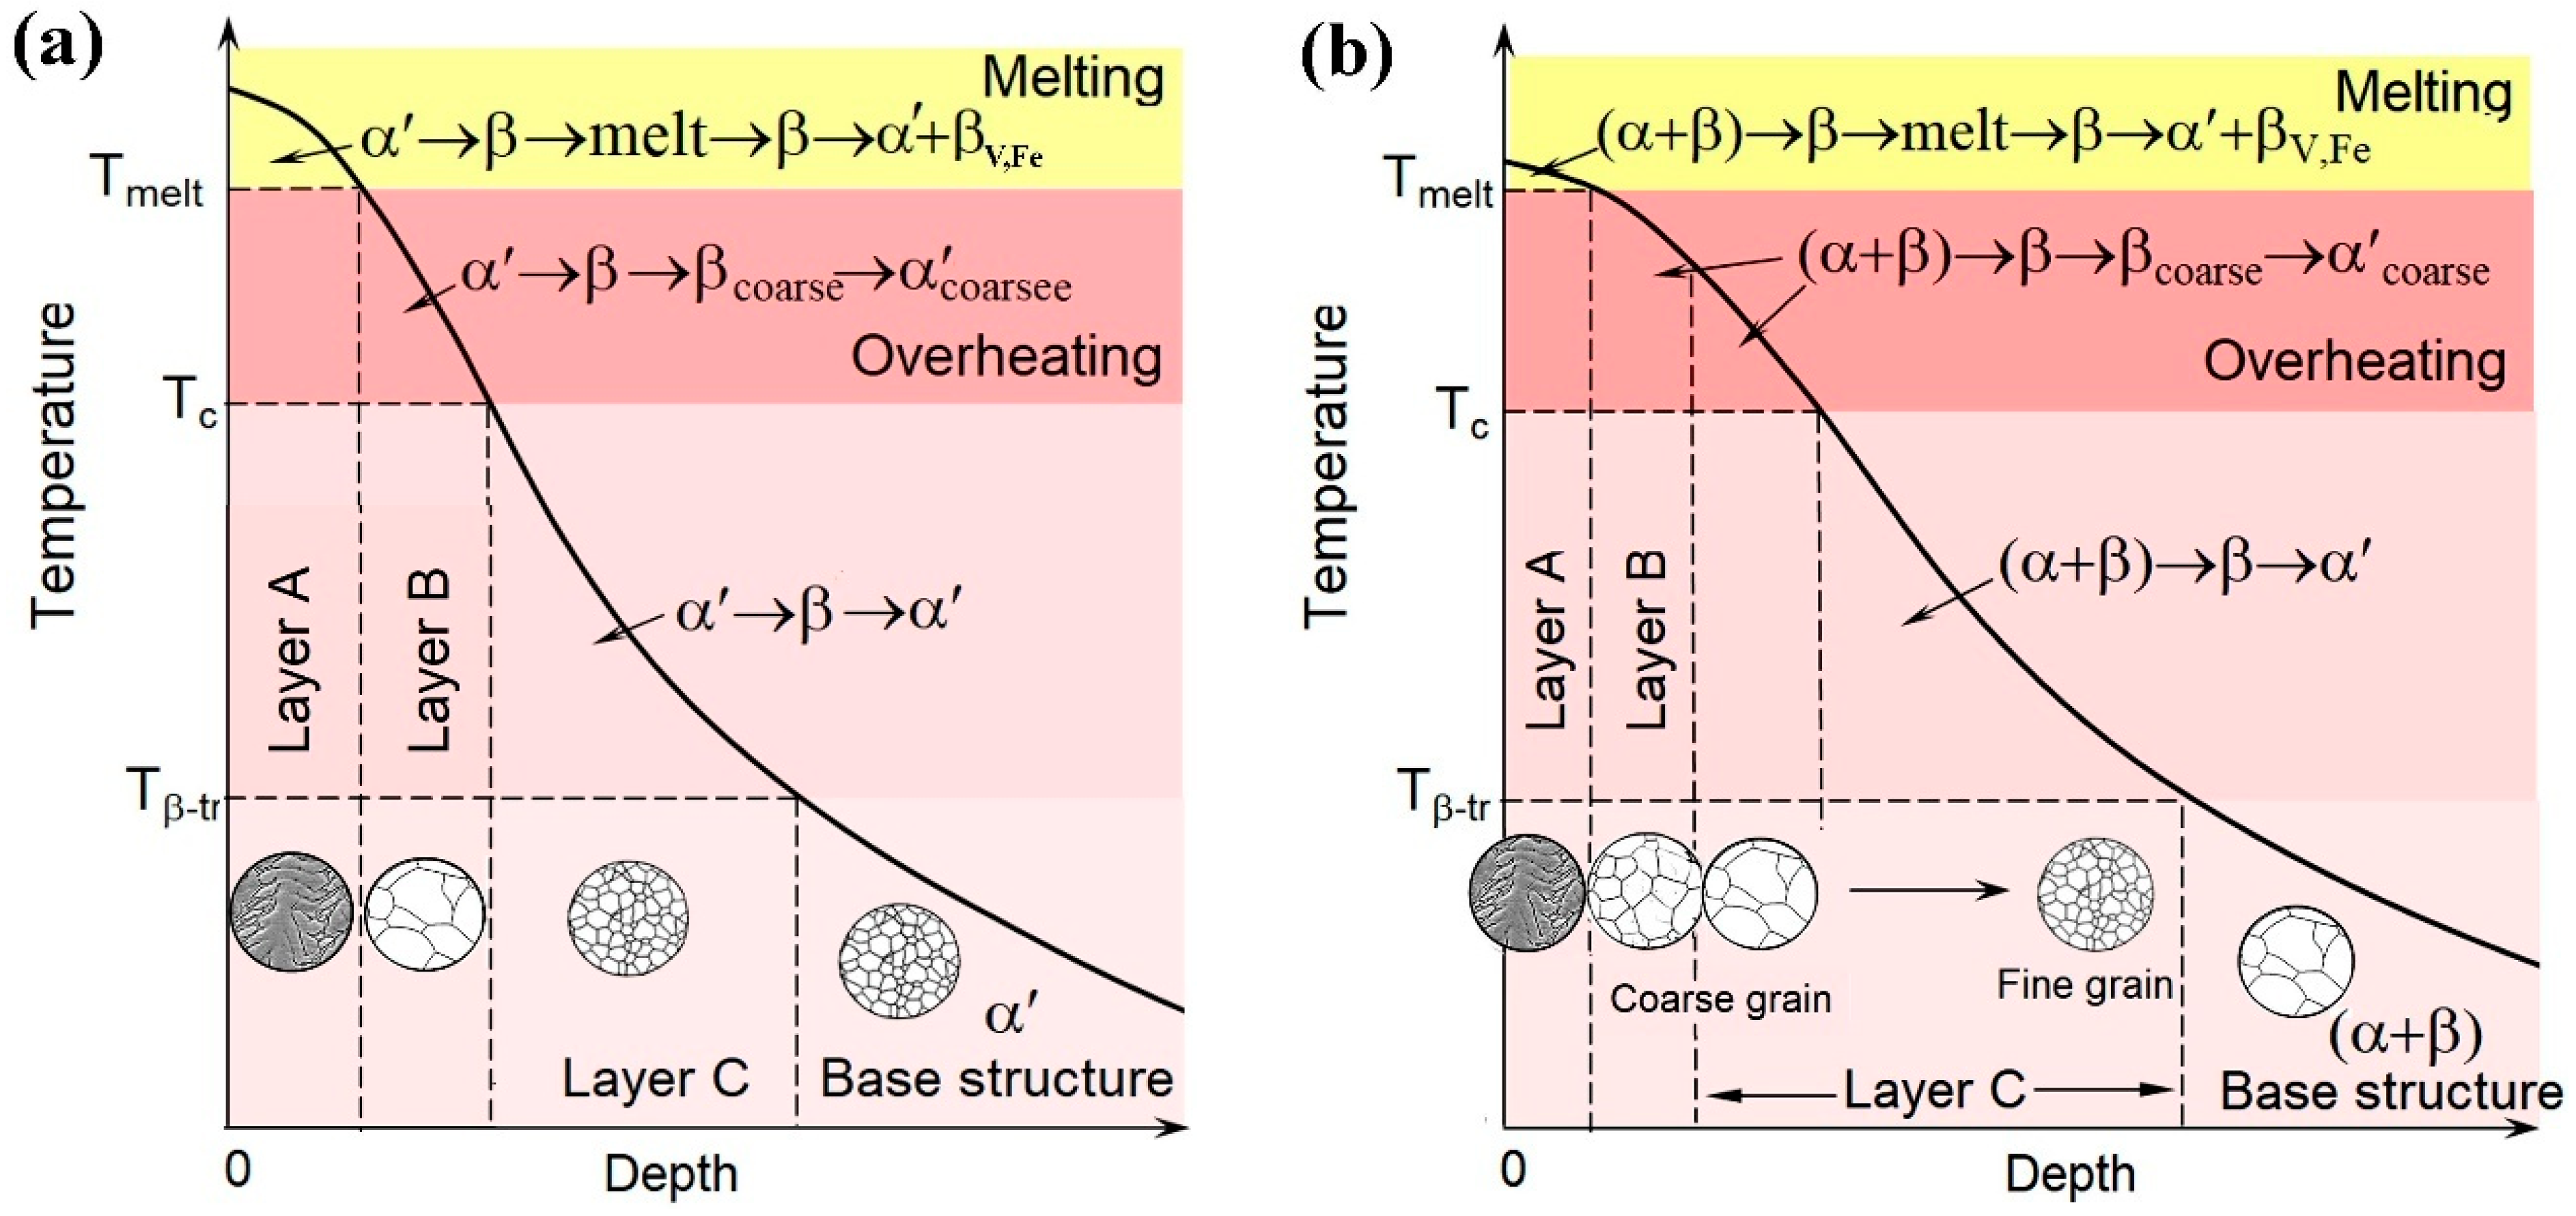
Based on the microstructural analysis results (Section 3.1), the layer-by-layer mechanism of microstructure formation in the LPBF specimen under laser heating can be described as follows (Figure 15a). Being heated by the laser beam, the surface temperature rises rapidly, reaching the β-transus temperature (Tβ-tr) and then the melting temperature (Tmelt). Consequently, the initial α′-phase transforms into the β-phase and melts. During cooling, the melt solidifies as β-phase dendrites, which subsequently transform into α′-martensite [26,27,80], forming layer A. This transformation sequence (α′ → β → melt → β → α′) aligns with studies by Yang et al. and Kenel et al. [86,87] on phase evolution in Ti-6-4 during laser heating/cooling. During solidification, the β-stabilising elements (Fe and V), with partition coefficients (K) below unity (KFe = 0.38–0.71, KV = 0.89–0.96 [88]), segregate into the last solidified liquid, i.e., the interdendritic regions, which solidify more slowly owing to solute (Fe and V) enrichment and limited heat extraction pathways [89].
As such, the interdendritic regions may undergo two plausible transformation paths:
(a)
β-annealing → lamellar α-phase and retained β-phase; and/or
(b)
quenching → metastable β-solid solution enriched in α-stabilising Al (around the dendrites) [90].
The microstructure observation suggests path (b), forming a supersaturated β-phase network. V and Fe microsegregation in interdendritic zones and grain boundaries has often been reported in [91,92,93]. The complete allocation of Fe in the interdendritic network (Table 1) is owing to its strong β-stabilising effect (stronger than that of V [92]) and its very low partition coefficient [88,93].
The low thermal conductivity of the LPBF sample causes laser energy to accumulate in the sub-surface layer, leading to deeper melting and overheating of the layer beneath the melt, where the temperature (T) was Tmelt > T > Tβ-tr. In this layer, the α′ → β transformation is followed by intensive β-grain growth, which further transformed into coarse-needle martensite (layer B, Figure 2f). Beyond layer B, temperatures remained below the grain coarsening threshold (Tc). In the layer heated to the Tc–Tβ-tr range, the α′-phase transformed to the β-phase, with grains remaining fine and, upon cooling, transforming to fine-needle α′ martensite. Thus, the α′ → β → α′ transformation sequence did not significantly change the grain size from the as-built fine-grained state. This behaviour characterised the entire layer C down to the lower HAZ boundary (Figure 2a). The HAZ, heated below Tβ-tr, showed partial martensite softening, as evidenced by the reduced microhardness (Figure 8a). Below the HAZ, the microstructure remained unchanged, matching layer C, as supported by the comparable microhardness levels (Figure 8a) and Figure 2g,h.
The WR specimen followed a similar formation path, except that the initial structure was a two-phase (α + β) structure, which transformed into the β-phase when heated above Tβ-tr (Figure 15b). Due to its higher thermal conductivity, the WR sample experienced a smoother temperature gradient and deeper heating, with a reduced melt depth, forming a thinner dendritic A (Figure 3c). Below this, layer B formed without melting (Tmelt > T > Tβ-tr), containing moderately large grains (Figure 3b), followed by layer C, with a grain size gradient from coarse to fine. In this zone, transformations proceeded as follows: (α + β) → β → α′. The β-phase nucleated at α/β interfaces as fine β-nuclei. Depending on temperature, β-nuclei either grew to 123.2 ± 15.1 µm (at the B/C boundary) or remained fine (16.5 ± 3.6 µm near the HAZ, Figure 3f), forming a gradient across layer C, from coarse to fine acicular α′-martensite. Notably, in layer B, directly beneath the molten zone, grains were smaller (75.1 ± 10.3 µm) than those in deeper layer C (Figure 3b). This is due to layer B’s proximity to the surface, leading to a higher cooling rate that limited β-grain growth. Beyond the HAZ, the original coarse lamellar (α + β) structure persisted (Figure 3g), indicating the depth where temperature reached Tβ-tr.

4.2. Effect of LSM on the Hardness of LPBF and WR Ti-6-4

Laser processing significantly enhanced the surface hardness of the alloy, increasing it by 1.8–2.0 times for the LPBF alloy and 2.2–2.4 times for the WR alloy. The peak hardness values (655–680 HV) align with the work of Li et al. [60] (7.43 GPa for AM Ti-6-4 laser-treated with a 75 J mm−2 energy) but exceed the 450–500 HV reported in [94,95]. The high-hardness zone extends in both samples to a depth of ~30 µm, corresponding to layer A (LSM-LPBF) and layer A/upper layer B (LSM-WR). Hardness surpassed that of α′-martensite in as-built LPBF Ti-6-4 (Figure 8), as confirmed by [96,97].
LSM significantly enhanced the surface hardness of the alloy by 1.8–2.0 times (LSM-LPBF) and 2.2–2.4 times (LSM-WR). The high hardness likely resulted from oxygen absorbed during laser melting and retained after cooling [94]. Oxygen occupies octahedral sites in the HCP lattice [94], stabilises the α-phase, and, as an interstitial element in Ti, distorts the lattice, causing solid solution strengthening. Ti can dissolve up to 14.2 wt.% oxygen [95], which proportionally increases hardness and tensile strength [54]. The oxygen saturation of the near-surface layer of the LSM-LPBF and LSM-WR specimens is indirectly confirmed by the increased lattice parameters after laser processing (Table 3). The increase in lattice constants a, c, and the c/a ratio (by 1.13%) was more pronounced in the WR sample. Unlike LPBF, which accumulates oxygen during printing, WR has low initial oxygen, making this increase notable after LSM.
Another contributing factor is lattice microdistortion from crystallite refinement and high dislocation density (~1015 m−2, Table 3) due to rapid cooling (103–108 K/s [86]). This correlates with the hardness reduction in layer B at 60–70 µm depth (500–570 HV) due to slower cooling. EBSD analysis showed at this depth an average KAM of 0.47, indicating moderate lattice distortion, consistent with Basak et al. [96].
A third factor contributing to the high hardness of the upper LSM layers is the presence of Al-silicates, particularly andalusite, which are harder than TiO2 polymorphs [97].

4.3. Effect of LSM on the Corrosion Performance of LPBF and WR Ti-6-4

Figure 10c,d, Figure 11c,d and Figure 12 reveal that laser treatment can generate corrosion cells in the metallic regions or regions of thin or defective oxide existence: differential aeration cells (crevices’ or valleys’ bottom/upper walls). Therefore, the high surface roughness likely causes the inferior corrosion performance of the laser-treated specimens compared to the as-received ones. The increased surface roughness is an expected outcome of the LSM process for several concurrent reasons: (a) Rapid thermal cycling causes surface tension effects and shrinkage during cooling, resulting in an uneven surface topography [98]. (b) Thermal gradients in the melt pool induce Marangoni flow, redistributing molten metal unevenly [99]. (c) Localised evaporation splashes out metal microdroplets that resolidify on the surface, forming bulges and cavities [46]. (d) Rapid oxide layer formation (TiO2, Al2O3) during LSM, facilitated by oxygen diffusion through the liquid metal [80], proceeds non-uniformly, yielding irregular surface features.
A second reason reducing the corrosion resistance of the LSM samples is the almost exclusive presence of martensite and increased residual stresses/lattice strain, as evident in the XRD results (Figure 7, Table 3). Although α′Ti is also the main phase in the LPBF specimens, the broadened α peaks of the LSM specimens indicate further martensitic transformation, residual stresses/lattice strain and/or structure refinement (Table 3) [46,80]. The α → α′ transformation through LSM, realised by the very high quench rates (103–106 Ks−1) owing to the small melted zone, is well-established [40]. As a metastable, high-energy structure [30] with a distorted lattice and high defect density (dislocations, twins) [100], martensite can accelerate corrosion processes, increasing both corrosion and passive current densities. Supersaturation of α′ with vanadium could further weaken surface oxide protection, as vanadium oxides are less stable than titanium oxides [31]. Additionally, rapid remelting and cooling raise the dislocation density in the melting zone (Table 3) and increase the tensile (quench) stresses [25].
A third reason for the degradation of the corrosion performance of the LSM samples is the presence of surface oxides rich in Si, Al, Fe, and O, which are less protective than the TiO2 passive film. Two explanations are likely:
(a)
These oxides originate from Fe and Si impurities in the Ti-6-4 alloy. The low density of Si (almost half that of Ti) facilitates its diffusion to the surface, where it readily binds with oxygen. Although SiO2 has slightly less negative free energy of formation than TiO2 [101], its higher electronegativity compared to Ti [102] enables stronger covalent bonding with O. Similarly, Al, being lighter and more reactive with oxygen [101], forms oxides more readily than Ti. However, Al-silicates are less resistant to aqueous Cl than TiO2, especially when bearing iron [103], consistent with Cl detection in them (Figure 12 and Figure 13). LSM has also been reported to cause the formation of Al-silicate layers on Inconel-718 [104] and 316L stainless steel [105].
(b)
These oxides may also derive from residual sandblasting media (aluminium silicate with Fe2O3, Cao and K2O) used to remove any surface contamination during the laser treatment. Indeed, the XRD of the LSM specimens revealed a minor presence of Al2SiO5 (Figure 7a), while SEM/EDX showed angular Si-, Al-, Fe- and O-rich particles (Figure 4). RS on the corroded surfaces identified aluminium silicate hydrates, such as kaolinite, likely formed through the transformation of Al2SiO5 (Figure 7a) to kaolinite (Figure 14) [106]. Kaolin minerals may also form through weathering of muscovite and smectites [107], whereas smectites and micas often coexist with kaolinite [108].
A fourth reason contributing to the inferior corrosion performance of the LSM specimens is the microstructural heterogeneity of layer A in both LSM-WR and LSM-LPBF alloys (dendrite (martensite)/interdendrite network (oversaturated βTi)), which may accelerate corrosion. The protruding dendrite boundaries (Figure 2c–e and Figure 3d), likely resulting from selective etching, suggest their cathodic role in galvanic coupling with the dendrite interior. Nevertheless, in the present case, no intergranular corrosion was observed, although it might occur under more aggressive electrolyte conditions.
The weakened passivity of the LSM specimens due to the aforementioned reasons seems to be associated with metastable pitting. Among these, the enhanced martensite presence is considered a paramount factor. Cui et al. [109], using the Point Defect Model, explained metastable pitting in α′Ti as follows: Ti atoms replace cation vacancies in the passive film, generating Ti ions that oxidise and form oxygen vacancies. These vacancies adsorb chloride ions, resulting in local positive charge. This charge imbalance drives cation–vacancy pair formation within the passive layer. As cation vacancies migrate toward the metal/film interface, they interact with metal cations. Unconsumed vacancies form voids, weakening passive film adhesion and potentially causing local detachment. Whether pits remain metastable or grow depends on the alloy’s repassivation ability. The passive film on martensitic Ti has a higher oxygen-vacancy flux, facilitating chloride adsorption and hence greater susceptibility to localised corrosion.
The increased corrosion potential values of the laser-treated surfaces, compared to the as-fabricated LPBF Ti-6-4, can likely be attributed to the presence of compressive residual stresses within the melted layer [110].
The notably greater cathodic current densities of the laser-modified surfaces compared to the as-fabricated ones (Figure 9a,b) can be attributed to their high roughness, which increases the effective reaction area. Surface asperities can also locally intensify the electric field, accelerating electron transfer and, consequently, cathodic reactions. Popov et al. [111] showed that the limiting diffusion current density on a protrusion tip is larger than that on a flat surface, thereby raising the overall current density. Similar increases in the cathodic current density after laser surface modification have been reported elsewhere [112].
Despite their high roughness, the laser-treated surfaces showed no signs of localised degradation (Figure 11c,d), due to the (i) oxide layer formation preventing Cl attack even in rough areas; (ii) gradient structure of the modified layers, hindering pit propagation by creating structural barriers; and (iii) surface topography promoting uniform corrosion. In the LSM-wrought alloy, the roughness is evenly distributed with shallow relief, while in the LSM-LPBF alloy, the repeated rough/smooth pattern leads to a relatively uniform distribution of corrosion cells, facilitating lateral rather than vertical penetration.
Therefore, LSM has led to three corrosion cell types: stress cells (smooth/rough or poor/rich microstrain zones), composition cells (dendrites/intendendritic, alloy/defective film regions), and differential aeration cells (valley bottom/upper walls).
Sandblasting with aluminium silicates should be followed by meticulous surface cleaning, as it leaves oxide residues prone to Cl penetration and hydrolysis, while they also form aluminium silicate hydrates. Alternative abrasives may also be tested. Nevertheless, sandblasting has been shown to enhance osseointegration compared to other mechanical surface treatments (machining, grinding, polishing) [113], even laser surface modification [114].

4.4. Comparison of LSM-WR and LSM-LBPF Ti-6-4 After Corrosion

The alternating relief of the LSM-LPBF surface (Figure 10c) can induce galvanic cells at the boundaries between smooth and rough zones due to texture differences. A related reason for the slightly inferior corrosion performance of the LSM-LPBF specimens is the compositional contrast between these zones (Figure 12). EDX analysis reveals that smooth areas have retained the original Ti-6-4 (α′-phase) composition, whereas rough zones are richer in Fe, Si, Cl and O but slightly poorer in Ti. Galvanic corrosion (SBF) at structured/unstructured interfaces in laser-surface-textured Ti-6-4 has been observed by Madapana et al. [80]. Nevertheless, the periodic roughness pattern can benefit biocompatibility by promoting protein adsorption, cell adhesion and bioactivity [22].
Beyond textural and compositional disparities, likely phase variations between alternating bands may have contributed to the inferior corrosion performance of the LSM-LPBF compared to the LSM-wrought specimens. Chen et al. [115] observed a similar microstructural arrangement of alternating bands in laser-reheated LPBF Ti-6-4: bands consisting of ultrafine α + β + α′ phases within a martensitic matrix.
The preferential presence of Si-, Al- and Fe-rich oxides on the rough LSM-LPBF bands (Figure 12 and Figure 14a—lowest spectrum) supports the hypothesis that these bands consist of α + β + α′ phases. These zones, being more ductile than the martensitic matrix, deform more under sandblasting, leading to increased surface energy and exposure of fresh surfaces. This promotes oxide formation from minor alloying elements or impurities like Fe and Si. The higher plasticity of these zones also enhances roughness and facilitates mechanical interlocking and adherence of abrasive-derived oxides, whereas brittle regions deform less and retain fewer oxides.
As shown in Table 3, LSM-WR Ti-6-4 features lower microstrains and dislocation density than LSM-LPBF, leading to weaker stress cells and more stable passive films. Τhe notably more intense metastable pitting of LSM-LPBF Ti-6-4 arises from its higher dislocation density and microstrains, which, along with the alternating relief, increase the oxygen vacancy flux. The increased metastable pitting throughout the passive stage also contributes to the higher passive currents of LSM-LPBF Ti-6-4 compared to its LSM-WR counterpart (Figure 9, Table 3).

5. Conclusions

  • Laser processing produced modified layers of 1250–1350 µm (LPBF) and 1530–1600 µm (WR) thickness. The modified layers presented a structural gradient—from a thin (tens of micrometres), remelted dendritic zone to a coarse acicular structure, and further to fine-acicular α′ martensite. Within the melted layer, microhardness increased to 655–680 HV, attributed to lattice parameter expansion, likely due to oxygen interstitial dissolution, increased lattice distortion owing to crystallite refinement and higher dislocation density, and aluminium silicate surface oxides originating from oxidation of Al and impurities during LSM or sandblasting residues.
  • The laser surface-melted (LSM) specimens (both LPBF and wrought) exhibited higher corrosion rates and less stable passive films compared to the untreated ones. This deterioration is primarily attributed to several factors induced by LSM: increased surface roughness, enhanced martensite formation, elevated residual stresses, lattice strain and dislocation density, and microstructural heterogeneity (dendrite (martensite)/interdendritic (oversaturated βTi)) in the melted top layer. Additionally, the presence of aluminium silicate surface films containing iron further weakened passivity.
  • Raman spectroscopy supported by EDX indicated that post-polarisation surface films were mainly composed of TiO2 polymorphs, dominated by rutile. Aluminium silicate hydrates—primarily kaolin-type, with minor mica (muscovite), and smectite (montmorillonite)—were also present, especially in the rough zones of the LSM-LPBF specimens.
  • Nevertheless, the LSM specimens (LPBF and wrought) presented very low corrosion current densities (order of 10−4 mA/cm2) and true passivity ((order of 10−3–10−4 mA/cm2) without breakdown in the studied range of potentials (up to 1000 mV vs. Ag/AgCl). Furthermore, both LSM Ti-6-4 alloys appeared resistant to localised corrosion, primarily owing to the extensive presence of TiO2 polymorphs.
  • The LSM-LPBF Ti-6-4 specimens presented slightly inferior resistance to general corrosion compared with the wrought counterparts in SBF at 37 °C, mainly due to (a) intensive surface relief, with alternating smooth and rough zones; (b) differences in phase and chemical composition between the alternating zones; and (c) higher microstrains and dislocation density.
  • Sandblasting with aluminium silicates as the final surface treatment should be followed by meticulous surface cleaning as it leaves oxide residues that are susceptible to Cl penetration and hydrolysis.

Author Contributions

Conceptualisation, A.G.L. and V.E.; methodology, A.G.L., V.E. and I.P.; software, S.E. and B.E.; validation, K.T. and Y.C.; formal analysis, I.P. and V.S.; investigation, V.S., B.E., S.E., I.P., K.T. and Y.C.; resources, A.G.L., V.E. and I.P.; writing—original draft preparation, A.G.L., V.S., B.E. and V.E.; writing—review and editing, A.G.L., B.E. and V.E.; visualisation, B.E.; supervision, A.G.L. and V.E.; project administration, Y.C.; funding acquisition, V.E. and I.P. All authors have read and agreed to the published version of the manuscript.

Funding

This research was funded by the Ministry of Education and Science of Ukraine (project No. 0123U101834) and by the EU NextGenerationEU through the Recovery and Resilience Plan for Slovakia under the project No. 09I03-03-V01-00061.

Institutional Review Board Statement

Not applicable.

Informed Consent Statement

Not applicable.

Data Availability Statement

Data is contained within the article.

Acknowledgments

The authors appreciate the support of Kaiming Wu (Wuhan University of Science and Technology) in conducting the EBSD study.

Conflicts of Interest

The authors declare no conflict of interest.

Abbreviations

The following abbreviations are used in this manuscript:
AMAdditive manufacturing
CSAMCold spraying additive manufacturing
DEDDirected energy deposition
EBSDElectron backscattered diffraction
EDXEnergy-dispersive X-ray spectroscopy
HAZHeat-affected zone
LMDLaser metal wire/powder deposition
LPBFLaser powder bed fusion
LSMLaser surface melting
LSRLaser surface remelting
RSRaman spectroscopy
SBFSimulated body fluid
Ti-6-4Ti-6Al-4V
TZTreated zone
WAAMWire arc additive manufacturing
WRWrought

Appendix A. Some Extra Details in the XRD Patterns and Raman Spectra Illustrated in Figure 7 and Figure 14, Respectively

The XRD pattern of the WR alloy primarily consists of peaks attributed to βTi and αTi, with a few weak peaks corresponding to TiO2. Peaks at 2θ angles of 41.3°, 47.0°, 63.2°, 75.3°, and 92.1° (Co lamp) authentically correspond to αTi, while peaks at 100.1°, 115.0°, and the most intense peak at 2θ = 45.0° may correspond to β-Ti or result from the overlapping of the peaks of both phases. Also, note that the primary peak in the pattern of βTi (44–1288) is also the primary peak in the pattern of the WR alloy. Therefore, and in conjunction with the microstructural analysis results of the WR specimen, which revealed an α + β structure, the diffraction pattern of this alloy reflects its two-phase nature with the predominance of the α-phase, as seen in Figure 1b.
Based on D (crystallite size) and ε (microstrain), the dislocation density (ρXRD) was derived from the XRD pattern using the Williamson–Smallman equation [61]:
ρ X R D = 3 k ε D b
where b is the Burgers vector magnitude (taken as 0.295 nm for a-type dislocation of HCP lattice [62]) and k is a parameter reflecting the elastic properties of the alloy and the dislocation disposition (taken as 1.2 [61]).
The strongest Raman bands at 444–448 cm−1 and 608–614 cm−1 are assigned to the Eg and A1g lattice modes, respectively. The bands at 139–143 cm−1 and the broad band peaking at 235–239 cm−1 (the latter a broad multiphonon envelope) are assigned to the B1g and E1g modes [68,69]. Additional weak bands at 250–255 cm−1 (B1g + Eg) and 825–835 cm−1 (B2g, often a shoulder) may be related to lattice defects and nanocrystallinity [69,70,71].
Several minor peaks can be attributed to clay minerals, particularly kaolin group minerals (kaolinite and dickite: Al2Si2O5(OH)4; halloysite: Al2Si2O5(OH)4·2H2O). Characteristic bands are observed at 124–129 cm−1 (O-Si-O symmetric bending), 201–206 and 215–221 cm−1 (A1g(v1) of the AlO6 octahedron), 243–247 and 264–270 cm−1 (B2(v3) of the O-H-O triangle), 335–348 and 358–361 cm−1 (A1(v1) of the O-H-O triangle), 392–398 and 426–436 cm−12(e) of the SiO4 tetrahedron), 474–484 and 509–512 cm−14(f2) of the SiO4 tetrahedron), 647–648, 664–668 and 704–715 cm−1 (Si-O-Al translation), and 787–792, 905–915 and 944–951 cm−1 (Al2OHx translation) [72,73]. The consistent presence of bands at 96–97 cm−1 and 106–108 cm−1 suggests the coexistence of smectite-type minerals and phyllosilicates, respectively. The former band may be attributed to vibrations of interlayer cations in montmorillonite containing CaO, Fe2O3, MgO and Na2O [74], while the latter may correspond to the Bg vibration mode of mica/muscovite [75]. Other minor bands assignable to montmorillonite appear at 194–200 cm−1 (symmetric A1g mode of the AlO6 tetrahedron) and 279–285 cm−1 (symmetric A1 mode of the O-H-O triangle); both peaks form part of a broad band extending from ~160 to ~300 cm−1 and also incorporating peaks assigned to kaolin-type minerals, rutile and brookite. Additional minor montmorillonite-related bands include 428–433 cm−1 (OH libration), 704–711 cm−1 (symmetric A1 mode of the SiO4 tetrahedron), and 783–787 cm−1 and 839–844 cm−1 (δ(OH) bonded to octahedral cations) [74]. Weak peaks that may be associated with mica/muscovite (KAl2(AlSi3O10)·(OH)2) include 195–200 cm−1 (Ag), 264–268 cm−1 (Bg), 703 cm−1 (Bg), 755–763 cm−1 (Bg), and 811–814 cm−1 (Bg) [75].

References

  1. ASTM F136; Standard Specification for Wrought Titanium-6Aluminum-4Vanadium ELI (Extra Low Interstitial) Alloy for Surgical Implant Applications (UNS R56401). ASTM International: West Conshohocken, PA, USA, 2021.
  2. Geetha, M.; Singh, A.K.; Asokamani, R.; Gogia, A.K. Ti Based Biomaterials, the Ultimate Choice for Orthopaedic Implants—A Review. Prog. Mater. Sci. 2009, 54, 397–425. [Google Scholar] [CrossRef]
  3. Abd-Elaziem, W.; Darwish, M.A.; Hamada, A.; Daoush, W.M. Titanium-Based Alloys and Composites for Orthopedic Implants Applications: A Comprehensive Review. Mater. Des. 2024, 241, 112850. [Google Scholar] [CrossRef]
  4. Adesina, O.; Popoola, P.; Fatoba, O. Laser Surface Modification—A Focus on the Wear Degradation of Titanium Alloy. In Fiber Laser; Paul, M.C., Ed.; IntechOpen: London, UK, 2016; pp. 367–381. [Google Scholar] [CrossRef]
  5. Chen, L.; Tong, Z.; Luo, H.; Qu, Y.; Gu, X.; Si, M. Titanium Particles in Peri-Implantitis: Distribution, Pathogenesis and Prospects. Int. J. Oral Sci. 2023, 15, 49. [Google Scholar] [CrossRef] [PubMed]
  6. Kim, K.T.; Eo, M.Y.; Nguyen, T.T.H.; Kim, S.M. General Review of Titanium Toxicity. Int. J. Implant Dent. 2019, 5, 10. [Google Scholar] [CrossRef]
  7. Zhang, L.-C.; Chen, L.-Y.; Wang, L. Surface Modification of Titanium and Titanium Alloys: Technologies, Developments, and Future Interests. Adv. Eng. Mater. 2020, 22, 1901258. [Google Scholar] [CrossRef]
  8. Zhang, L.-C.; Chen, L.-Y.; Zhou, S.; Luo, Z. Powder Bed Fusion Manufacturing of Beta-Type Titanium Alloys for Biomedical Implant Applications: A Review. J. Alloys Compd. 2023, 936, 168099. [Google Scholar] [CrossRef]
  9. Nguyen, H.D.; Pramanik, A.; Basak, A.K.; Dong, Y.; Prakash, C.; Debnath, S.; Shankar, S.; Jawahir, I.S.; Dixit, S.; Buddhi, D. A Critical Review on Additive Manufacturing of Ti-6Al-4V Alloy: Microstructure and Mechanical Properties. J. Mater. Res. Technol. 2022, 18, 4641–4661. [Google Scholar] [CrossRef]
  10. Tshephe, T.S.; Akinwamide, S.O.; Olevsky, E.; Olubambi, P.A. Additive Manufacturing of Titanium-Based Alloys—A Review of Methods, Properties, Challenges, and Prospects. Heliyon 2022, 8, e09041. [Google Scholar] [CrossRef]
  11. Jin, B.; Wang, Q.; Zhao, L.; Pan, A.; Ding, X.; Gao, W.; Song, Y.; Zhang, X. A Review of Additive Manufacturing Techniques and Post-Processing for High-Temperature Titanium Alloys. Metals 2023, 13, 1327. [Google Scholar] [CrossRef]
  12. Liu, S.; Shin, Y. Additive Manufacturing of Ti6Al4V Alloy: A Review. Mater. Des. 2019, 164, 107552. [Google Scholar] [CrossRef]
  13. Neikter, M.; Åkerfeldt, P.; Pederson, R.; Antti, M.L.; Sandell, V. Microstructural Characterization and Comparison of Ti-6Al-4V Manufactured with Different Additive Manufacturing Processes. Mater. Charact. 2018, 143, 68–75. [Google Scholar] [CrossRef]
  14. Balbaa, M.; Mekhiel, S.; Elbestawi, M.; McIsaac, J. On Selective Laser Melting of Inconel 718: Densification, Surface Roughness, and Residual Stresses. Mater. Des. 2020, 193, 108818. [Google Scholar] [CrossRef]
  15. Menci, G.; Gökhan, A.; Waugh, D.G.; Lawrence, J.; Previtali, B. Laser Surface Texturing of β-Ti Alloy for Orthopaedics: Effect of Different Wavelengths and Pulse Durations. Appl. Surf. Sci. 2019, 489, 175–186. [Google Scholar] [CrossRef]
  16. Laketić, S.; Rakin, M.; Momčilović, M.; Ciganović, J.; Veljović, Đ.; Trifković, B. Surface Modifications of Biometallic Commercially Pure Ti and Ti-13Nb-13Zr Alloy by Picosecond Nd:YAG Laser. Int. J. Miner. Metall. Mater. 2021, 28, 285–295. [Google Scholar] [CrossRef]
  17. Sypniewska, J.; Szkodo, M. Influence of Laser Modification on the Surface Character of Biomaterials: Titanium and Its Alloys—A Review. Coatings 2022, 12, 1371. [Google Scholar] [CrossRef]
  18. Yan, X.; Cao, W.; Li, H. Biomedical Alloys and Physical Surface Modifications: A Mini-Review. Materials 2022, 15, 66. [Google Scholar] [CrossRef]
  19. Liu, W.; Liu, S.; Wang, L. Surface Modification of Biomedical Titanium Alloy: Micromorphology, Microstructure Evolution and Biomedical Applications. Coatings 2019, 9, 249. [Google Scholar] [CrossRef]
  20. Wei, G.; Tan, M.; Attarilar, S.; Li, J.; Uglov, V.V.; Wang, B.; Liu, J.; Lu, L.; Wang, L. An Overview of Surface Modification, A Way toward Fabrication of Nascent Biomedical Ti–6Al–4V Alloys. J. Mater. Res. Technol. 2023, 24, 5896–5921. [Google Scholar] [CrossRef]
  21. Ge, J.; Pillay, S.; Ning, H. Post-Process Treatments for Additive-Manufactured Metallic Structures: A Comprehensive Review. J. Mater. Eng. Perform. 2023, 32, 7073–7122. [Google Scholar] [CrossRef]
  22. Das, B.; Srivastava, S.K.; Manna, I.; Majumdar, J.D. Mechanically Tailored Surface of Titanium Based Alloy (Ti6Al4V) by Laser Surface Treatment. Surf. Coat. Technol. 2024, 479, 130560. [Google Scholar] [CrossRef]
  23. Jażdżewska, M.; Kwidzińska, D.B.; Seyda, W.; Fydrych, D.; Zieliński, A. Mechanical Properties and Residual Stress Measurements of Grade IV Titanium and Ti-6Al-4V and Ti-13Nb-13Zr Titanium Alloys after Laser Treatment. Materials 2021, 14, 6316. [Google Scholar] [CrossRef]
  24. Lu, Y.J.; Zhang, Z.L.; Liu, Y.J.; Yu, C.; Zhang, X.; Liu, X.C. Improving Mechanical Properties and Corrosion Behavior of Biomedical Ti-3Zr-2Sn-3Mo-25Nb Alloy through Laser Surface Remelting. Surf. Coat. Technol. 2024, 490, 131135. [Google Scholar] [CrossRef]
  25. Huang, S.; Zeng, J.; Wang, W.; Zhao, Z. Study on Laser Polishing of Ti6Al4V Fabricated by Selective Laser Melting. Micromachines 2024, 15, 336. [Google Scholar] [CrossRef] [PubMed]
  26. Al-Sayed, S.R.; Abdelfatah, A. Corrosion Behavior of a Laser Surface-Treated Alpha-Beta 6/4 Titanium Alloy. Metallogr. Microstruct. Anal. 2020, 9, 553–560. [Google Scholar] [CrossRef]
  27. Majumdar, J.D.; Manna, I. 21-Laser Surface Engineering of Titanium and Its Alloys for Improved Wear, Corrosion and High-Temperature Oxidation Resistance. In Laser Surface Engineering; Lawrence, J., Waugh, D.G., Eds.; Woodhead Publishing: Cambridge, UK, 2015; pp. 483–521. [Google Scholar] [CrossRef]
  28. Amaya-Vazquez, M.R.; Sánchez-Amaya, J.M.; Boukha, Z.; Botana, F.J. Microstructure, Microhardness and Corrosion Resistance of Remelted TiG2 and Ti6Al4V by a High Power Diode Laser. Corros. Sci. 2012, 56, 36–48. [Google Scholar] [CrossRef]
  29. Lekatou, A.G.; Efremenko, B.V.; Haoui, V.; Efremenko, V.G.; Emmanouilidou, S.; Zurnadzhy, V.I.; Petryshynets, I.; Chabak, Y.G.; Sili, I.I. Microstructure, Electrochemical, Wear and Corrosive Wear Performance of Laser-Based Powder Bed Fusion and Wrought Biomedical Ti-6Al-4V Alloys. Trans. Nonferrous Met. Soc. China 2025, 35, 2612–2631. [Google Scholar] [CrossRef]
  30. Dai, N.; Zhang, L.-C.; Zhang, J.; Chen, Q.; Wu, M. Corrosion Behavior of Selective Laser Melted Ti-6Al-4V Alloy in NaCl Solution. Corros. Sci. 2016, 102, 484–489. [Google Scholar] [CrossRef]
  31. Metikos-Hukovic, M.; Kwokal, A.; Piljac, J. The Influence of Niobium and Vanadium on Passivity of Titanium-Based Implants in Physiological Solution. Biomaterials 2003, 24, 3765–3775. [Google Scholar] [CrossRef]
  32. Mohazzab, B.F.; Jaleh, B.; Fattah-alhosseini, A.; Mahmoudi, F.; Momeni, A. Laser Surface Treatment of Pure Titanium: Microstructural Analysis, Wear Properties, and Corrosion Behavior of Titanium Carbide Coatings in Hank’s Physiological Solution. Surf. Interfaces 2020, 20, 100597. [Google Scholar] [CrossRef]
  33. Ataiwi, A.H.; Majed, R.A.; Muhsin, A.A. Effect of Laser Surface Modification on the Corrosion Resistance of Dental Alloys in Artificial Saliva Containing Alcoholic Beverages. Iraqi J. Laser 2019, 12, 43–52. [Google Scholar] [CrossRef]
  34. Jażdżewska, M.; Zieliński, A.; Skalski, I.; Majkowska-Marzec, B. Effects of the Preheating Laser Treatment on Microstructure and Corrosion Resistance of Ti6Al4V Bioalloy. Eng. Biomater. 2013, 16, 122–123. Available online: https://bibliotekanauki.pl/articles/284890.pdf (accessed on 26 February 2025).
  35. Gil, F.J.; Delgado, L.; Espinar, E.; Llamas, J.M. Corrosion and Corrosion-Fatigue Behavior of cp-Ti and Ti-6Al-4V Laser-Marked Biomaterials. J. Mater. Sci. Mater. Med. 2012, 23, 885–890. [Google Scholar] [CrossRef] [PubMed]
  36. Zieliński, A.; Serbiński, W.; Majkowska, B.; Jażdżewska, M.; Skalski, I. Conditions on Corrosion Resistance of Non-Ferrous Alloys. Adv. Mater. Sci. 2009, 9, 22–28. [Google Scholar] [CrossRef]
  37. Singh, R.; Chowdhury, S.G.; Tiwari, S.K.; Dahotre, N.B. Laser Surface Processing of Ti6Al4V in Gaseous Nitrogen: Corrosion Performance in Physiological Solution. J. Mater. Sci. Mater. Med. 2008, 19, 1363–1369. [Google Scholar] [CrossRef]
  38. Khosroshahi, M.E.; Mahmoodi, M.; Saeedinasab, H.; Tahriri, M. Evaluation of Mechanical and Electrochemical Properties of Laser Surface Modified Ti–6Al–4V for Biomedical Applications: In Vitro Study. Surf. Eng. 2008, 24, 209–218. [Google Scholar] [CrossRef]
  39. Porwal, A.; Dhara, S.; Kumar, C.S. Surface Modification of LPBF Ti6Al4V through in Situ Nitrogen-Assisted Laser Surface Remelting. J. Manuf. Sci. Eng. 2025, 147, 031012. [Google Scholar] [CrossRef]
  40. Feng, W.; Wang, N.; Weng, F.; Su, J.; Lim, P.G.H.; Yan, L.; O’Neill, G.K. The Influence of Laser Surface Remelting on the In Vitro Cell Viability of Additively Manufactured Ti–6Al–4V Plates. Prog. Addit. Manuf. 2023, 8, 997–1005. [Google Scholar] [CrossRef]
  41. Lu, W.Q.; Liu, Y.J.; Wu, X.; Liu, X.C.; Wang, J.C. Corrosion and Passivation Behavior of Ti-6Al-4V Surfaces Treated with High-Energy Pulsed Laser: A Comparative Study of Cast and 3D-Printed Specimens in a NaCl Solution. Surf. Coat. Technol. 2023, 470, 129849. [Google Scholar] [CrossRef]
  42. Pradeep, G.V.K.; Duraiselvam, M.; Sivaprasad, K. Tribological Behavior of Laser Surface Melted γ-TiAl Fabricated by Electron Beam Additive Manufacturing. J. Mater. Eng. Perform. 2022, 31, 1009–1020. [Google Scholar] [CrossRef]
  43. Molatlhegi, G.; Hoosain, S.; Popoola, A.P.I.; Malatjia, N.; Pityana, S. The Effect of Laser Surface Re-melting on the Surface Roughness and Micro-Hardness of Selective Laser Melting (SLM) Fabricated Ti-6Al-4V Samples. S. Afr. Tydskr. Natuurwet. Tegnol. 2021, 40, 186–189. [Google Scholar] [CrossRef]
  44. Kahlin, M.; Ansell, H.; Basu, D.; Kerwin, A.; Newton, L.; Smith, B.; Moverare, J.J. Improved Fatigue Strength of Additively Manufactured Ti6Al4V by Surface Post Processing. Int. J. Fatigue 2020, 134, 105497. [Google Scholar] [CrossRef]
  45. Vaithilingam, J.; Goodridge, R.D.; Hague, R.J.M.; Christie, S.D.R.; Edmondson, S. The Effect of Laser Remelting on the Surface Chemistry of Ti6Al4V Components Fabricated by Selective Laser Melting. J. Mater. Process. Technol. 2016, 232, 1–8. [Google Scholar] [CrossRef]
  46. Efremenko, B.V.; Petryshynets, I.; Chabak, Y.G.; Zurnadzhy, V.I.; Wu, K.; Efremenko, V.G.; Fedun, V.I.; Kromka, F.; Kulyk, V.V. Structure and Wet-Sliding Characterization of a Laser Powder Bed Fusion Ti-6Al-4V Biomedical Alloy: Effect of Laser Surface Modification. Rom. J. Phys. 2024, 69, 613. [Google Scholar] [CrossRef]
  47. Sun, Z.; Annergren, I.; Pan, D.; Mai, T.A. Effect of Laser Surface Remelting on the Corrosion Behavior of Commercially Pure Titanium Sheet. Mater. Sci. Eng. A 2003, 345, 293–300. [Google Scholar] [CrossRef]
  48. ISO 11126; Preparation of Steel Substrates Before Application of Paints and Related Products—Specifications for Non-Metallic Blast-Cleaning Abrasives—Part 1: General Introduction and Classification. ISO: Geneva, Switzerland, 2025.
  49. Bellini, D.; Cencetti, C.; Meraner, J.; Stoppoloni, D.; D’Abusco, A.S.; Matricardi, P. An In-Situ Gelling System for Bone Regeneration of Osteochondral Defects. Eur. Polym. J. 2015, 72, 642–650. [Google Scholar] [CrossRef]
  50. Emmanouilidou, S.N.; Lekatou, A.G.; Papagiannopoulos, A.D.; Siaraka, Z.Z.; Tzala, I.E.; Lekatou, A.G. Effect of Nb Low-Alloying on the Microstructure, Corrosion and Wear Performance of a Co-28Cr-6Mo Alloy Fabricated by Vacuum Arc Melting. Int. J. Refract. Met. Hard Mater. 2025, 133, 107330. [Google Scholar] [CrossRef]
  51. Lekatou, A.G.; Sfikas, A.K.; Karantzalis, A.E. The Influence of the Fabrication Route on the Microstructure and Surface Degradation Properties of Al Reinforced by Al9Co2. Mater. Chem. Phys. 2017, 200, 33–39. [Google Scholar] [CrossRef]
  52. Lekatou, A.G.; Sioulas, D.; Grimanelis, D. Corrosion and Wear of Coatings Fabricated by HVOF-Spraying of Nanostructured and Conventional WC–10Co-4Cr Powders on Al7075-T6. Int. J. Refract. Met. Hard Mater. 2023, 112, 106164. [Google Scholar] [CrossRef]
  53. ASTM G102; Standard Practice for Calculation of Corrosion Rates and Related Information from Electrochemical Measurements. ASTM International: West Conshohocken, PA, USA, 2015.
  54. Dietrich, K.; Diller, J.; Dubiez-Le Goff, S.; Bauer, D.; Forêt, P.; Witt, G. The Influence of Oxygen on the Chemical Composition and Mechanical Properties of Ti-6Al-4V during Laser Powder Bed Fusion (L-PBF). Addit. Manuf. 2020, 32, 100980. [Google Scholar] [CrossRef]
  55. Chabak, Y.; Efremenko, B.; Petryshynets, I.; Efremenko, V.; Lekatou, A.G.; Zurnadzhy, V.; Bogomol, I.; Fedun, V.; Koval’, K.; Pastukhova, T. Structural and Tribological Assessment of Biomedical 316 Stainless Steel Subjected to Pulsed-Plasma Surface Modification: Comparison of LPBF 3D Printing and Conventional Fabrication. Materials 2021, 14, 7671. [Google Scholar] [CrossRef] [PubMed]
  56. Ettefagh, A.H.; Guo, S.; Rauch, J. Corrosion Behavior of Additively Manufactured Ti-6Al-4V Parts and the Effect of Post Annealing. Addit. Manuf. 2019, 28, 252–258. [Google Scholar] [CrossRef]
  57. Efremenko, V.G.; Lekatou, A.G.; Chabak, Y.G.; Efremenko, B.V.; Petryshynets, I.; Zurnadzhy, V.I.; Emmanouilidou, S.; Vojtko, M. Micromechanical, Corrosion and Wet Sliding Wear Behaviours of Co-28Cr-6Mo Alloy: Wrought vs. LPBF. Mater. Today Commun. 2023, 35, 105936. [Google Scholar] [CrossRef]
  58. Efremenko, B.V.; Zurnadzhy, V.I.; Chabak, Y.G.; Efremenko, V.G.; Kudinova, K.V.; Mazur, V.A. A Comparison Study on the Effect of Counter Ball Material on Sliding Wear Response of SLM-Printed Biomedical 316L Steel. Mater. Today Proc. 2022, 66, 2587–2593. [Google Scholar] [CrossRef]
  59. Derimow, N.; Hrabe, N. Oxidation in Reused Powder Bed Fusion Additive Manufacturing Ti-6Al-4V Feedstock: A Brief Review. JOM 2021, 73, 3618–3638. [Google Scholar] [CrossRef]
  60. Li, Y.; Song, L.; Xie, P.; Cheng, M.; Xiao, H. Enhancing Hardness and Wear Performance of Laser Additive Manufactured Ti6Al4V Alloy through Achieving Ultrafine Microstructure. Materials 2020, 13, 1210. [Google Scholar] [CrossRef]
  61. Gubicza, J. Reliability and Interpretation of the Microstructural Parameters Determined by X-ray Line Profile Analysis for Nanostructured Materials. Eur. Phys. J. Spec. Top. 2022, 231, 4153–4165. [Google Scholar] [CrossRef]
  62. Aubry, S.; Rhee, M.; Hommes, G.; Bulatov, V.V.; Arsenlis, A. Dislocation dynamics in hexagonal close-packed crystals. J. Mech. Phys. Solids 2016, 94, 105–126. [Google Scholar] [CrossRef]
  63. Muiruri, A.; Maringa, M.; du Preez, W. Evaluation of Dislocation Densities in Various Microstructures of Additively Manufactured Ti6Al4V (ELI) by the Method of X-ray Diffraction. Materials 2020, 13, 5355. [Google Scholar] [CrossRef]
  64. Lekatou, A.G.; Tsouli, S. Cyclic Polarization of Corrugated Austenitic Stainless Steel Rebars in Acid Rain: Effect of Fly Ash, pH and Steel Type. Corros. Mater. Degrad. 2022, 3, 75–100. [Google Scholar] [CrossRef]
  65. Fontana, M.G. Corrosion Engineering, 3rd ed.; McGraw-Hill: New York, NY, USA, 1986; p. 172. ISBN 978-0070214637. [Google Scholar]
  66. Beard, M.A.; Ghita, O.R.; Evans, K.E. Using Raman spectroscopy tomonitor surface finish and roughness of components manufactured by selective laser sintering. J. Raman Spectrosc. 2011, 42, 744–748. [Google Scholar] [CrossRef]
  67. Medel-Ruiz, C.I.; Chiu, R.; Sevilla-Escoboza, J.R.; Casillas-Rodríguez, F.J. Nanoscale Surface Roughness Effects on Photoluminescence and Resonant Raman Scattering of Cadmium Telluride. Appl. Sci. 2024, 14, 7680. [Google Scholar] [CrossRef]
  68. Frank, O.; Zukalova, M.; Laskova, B.; Kürti, J.; Koltai, J.; Kavan, L. Raman Spectra of Titanium Dioxide (Anatase, Rutile) with Identified Oxygen Isotopes (16, 17, 18). Phys. Chem. Chem. Phys. 2012, 14, 14567–14572. [Google Scholar] [CrossRef]
  69. Tompsett, G.A.; Bowmaker, G.A.; Cooney, R.P.; Metson, J.B.; Rodgers, K.A.; Seakins, J.M. The Raman Spectrum of Brookite, TiO2 (Pbca, Z = 8). J. Raman Spectrosc. 1995, 26, 57–62. [Google Scholar] [CrossRef]
  70. Iliev, M.N.; Hadjiev, V.G.; Litvinchuk, A.P. Raman and Infrared Spectra of Brookite (TiO2): Experiment and Theory. Vib. Spectrosc. 2013, 64, 148–152. [Google Scholar] [CrossRef]
  71. Tian, F.; Zhang, Y.; Zhang, J.; Pan, C. Raman Spectroscopy: A New Approach to Measure the Percentage of Anatase TiO2 Exposed (001) Facets. J. Phys. Chem. C 2012, 116, 7515–7519. [Google Scholar] [CrossRef]
  72. Kloprogge, J.T. Raman and Infrared Spectroscopies of Intercalated Kaolinite Groups Minerals. In Infrared and Raman Spectroscopies of Clay Minerals; Madejova, J., Bergaya, F., Gates, W., Kloprogge, J.T., Eds.; Developments in Clay Science Series; Elsevier: Amsterdam, The Netherlands, 2017; Volume 8, pp. 343–410. ISBN 978-0081003558. [Google Scholar]
  73. Frost, R.L.; Tran, T.H.; Rintoul, L.; Kristof, J. Raman Microscopy of Dickite, Kaolinite and Their Intercalates. Analyst 1998, 123, 611–616. [Google Scholar] [CrossRef]
  74. Ritz, M.; Vaculíková, L.; Kupková, J.; Plevová, E.; Bartoňová, L. Different Level of Fluorescence in Raman Spectra of Montmorillonites. Vib. Spectrosc. 2016, 84, 7–15. [Google Scholar] [CrossRef]
  75. McKeown, D.A.; Bell, M.I.; Etz, E.S. Vibrational Analysis of the Dioctahedral Mica: 2M1 Muscovite. Am. Mineral. 1999, 84, 1041–1048. [Google Scholar] [CrossRef]
  76. Lekatou, A.; Zois, D.; Karantzalis, A.E.; Grimanelis, D. Electrochemical Behaviour of Cermet Coatings with a Bond Coat on Al7075: Pseudopassivity, Localized Corrosion and Galvanic Effect Considerations in a Saline Environment. Corros. Sci. 2010, 52, 2616–2635. [Google Scholar] [CrossRef]
  77. Sfikas, A.K.; Lekatou, A.G. Electrochemical Behavior of Al–Al9Co2 Alloys in Sulfuric Acid. Corros. Mater. Degrad. 2020, 1, 249–272. [Google Scholar] [CrossRef]
  78. Addison, O.; Davenport, A.J.; Newport, R.J.; Kalra, S.; Monir, M.; Mosselmans, J.F.W.; Proops, D.; Martin, R.A. Do “Passive” Medical Titanium Surfaces Deteriorate in Service in the Absence of Wear? J. R. Soc. Interface 2012, 9, 3161–3164. [Google Scholar] [CrossRef] [PubMed]
  79. Kuphasuk, C.; Oshida, Y.; Andres, C.J.; Hovijitra, S.T.; Barco, M.T.; Brown, D.T. Electrochemical Corrosion of Titanium and Titanium-Based Alloys. J. Prosthet. Dent. 2001, 85, 195–202. [Google Scholar] [CrossRef] [PubMed]
  80. Madapana, D.; Bathe, R.; Manna, I.; Majumdar, J.D. Effect of Process Parameters on the Corrosion Kinetics and Mechanism of Nanosecond Laser Surface Structured Titanium Alloy (Ti6Al4V). Appl. Surf. Sci. Adv. 2024, 20, 100580. [Google Scholar] [CrossRef]
  81. Ghasemi, A.; Fereiduni, E.; Balbaa, M.; Elbestawi, M.; Habibi, S. Unraveling the Low Thermal Conductivity of the LPBF Fabricated Pure Al, AlSi12, and AlSi10Mg Alloys through Substrate Preheating. Addit. Manuf. 2022, 59, 103148. [Google Scholar] [CrossRef]
  82. Bartsch, K.; Bossen, B.; Chaudhary, W.; Landry, M.; Herzog, D. Thermal Conductivity of Ti-6Al-4V in Laser Powder Bed Fusion. Front. Mech. Eng. 2022, 8, 830104. [Google Scholar] [CrossRef]
  83. Strumza, E.; Landau, P.; Kimmel, G.; Ganor, Y.I.; Yeheskel, O.; Hayun, S. Thermophysical Properties of Ti-6Al-4V Fabricated by Powder Bed Fusion Methods. Addit. Manuf. 2022, 58, 103045. [Google Scholar] [CrossRef]
  84. Bolzoni, L.; Ruiz-Navas, E.M.; Gordo, E. Flexural Properties, Thermal Conductivity and Electrical Resistivity of Prealloyed and Master Alloy Addition Powder Metallurgy Ti–6Al–4V. Mater. Des. 2013, 52, 888–895. [Google Scholar] [CrossRef]
  85. Saini, A.; Pabla, B.S.; Dhami, S.S. Developments in Cutting Tool Technology in Improving Machinability of Ti6Al4V Alloy: A Review. Proc. Inst. Mech. Eng. Part B 2016, 230, 1977–1989. [Google Scholar] [CrossRef]
  86. Yang, J.; Yu, H.; Yin, J.; Gao, M.; Wang, Z.; Zeng, X. Formation and Control of Martensite in Ti-6Al-4V Alloy Produced by Selective Laser Melting. Mater. Des. 2016, 108, 308–318. [Google Scholar] [CrossRef]
  87. Kenel, C.; Grolimund, D.; Li, X.; Panepucci, E.; Samson, V.A.; Sanchez, D.F.; Marone, F.; Leinenbach, C. In Situ Investigation of Phase Transformations in Ti-6Al-4V under Additive Manufacturing Conditions Combining Laser Melting and High-Speed Micro-X-ray Diffraction. Sci. Rep. 2017, 7, 16358. [Google Scholar] [CrossRef]
  88. Doridot, E.; Hans, S.; Jardy, A.; Bellot, J.-P. Industrial Applications of Modelling Tools to Simulate the PAMCHR Casting and VAR Process for Ti64. MATEC Web Conf. 2020, 321, 10011. [Google Scholar] [CrossRef]
  89. Kurz, W.; Fisher, D.J. Fundamentals of Solidification, 4th ed.; Chapters 4–5; Trans Tech Publications: Aedermannsdorf, Switzerland, 1984; ISBN 978-0878495221. [Google Scholar]
  90. Lekatou, A. Engineering Alloys; Papasotiriou Publications: Athens, Greece, 2005. (In Greek) [Google Scholar]
  91. Mizukami, H.; Shirai, Y.; Kawakami, A.; Mitchell, A. Solidification Behavior of Ti-6Al-4V Alloy. ISIJ Int. 2020, 60, 2455–2461. [Google Scholar] [CrossRef]
  92. Ding, L.; Hu, R.; Gu, Y.; Zhou, D.; Chen, F.; Zhou, L.; Chang, H. Effect of Fe Content on the As-Cast Microstructures of Ti–6Al–4V–xFe Alloys. Metals 2020, 10, 989. [Google Scholar] [CrossRef]
  93. Mitchell, A.; Kawakami, A.; Cockcroft, S.L. Segregation in Titanium Alloy Ingots. High Temp. Mater. Process. 2007, 26, 59–77. [Google Scholar] [CrossRef]
  94. Montanari, R.; Costanza, G.; Tata, M.E.; Testani, C. Lattice Expansion of Ti-6Al-4V by Nitrogen and Oxygen Absorption. Mater. Charact. 2008, 59, 334–337. [Google Scholar] [CrossRef]
  95. Fang, Z.Z.; Pamore, J.D.; Sun, P.; Chadran, K.S.R.; Zhang, Y.; Xia, Y.; Cao, F.; Koopman, M. Powder Metallurgy of Titanium—Past, Present, and Future. Int. Mater. Rev. 2018, 63, 407–459. [Google Scholar] [CrossRef]
  96. Basak, S.; Lee, S.-H.; Lee, J.-R.; Kim, D.-H.; Lee, J.H.; Byun, M.; Kim, D.-H. Modification of Mechanical Properties of Ti–6Al–4V Using L-PBF for Anatomical Plates. Metals 2025, 15, 32. [Google Scholar] [CrossRef]
  97. Schumann, W. Gemstones of the World, Revised & Expanded ed.; Sterling Publishing Co., Inc.: New York, NY, USA, 1997; p. 21. ISBN 978-0806994611. [Google Scholar]
  98. Dahotre, N.B.; Harimkar, S. Laser Fabrication and Machining of Materials; Springer: New York, NY, USA, 2008; p. 558. ISBN 978-0-387-72344-0. [Google Scholar] [CrossRef]
  99. Pham, D.-P.; Tran, H.-C. Multi-Physics Simulation for Predicting Surface Roughness of Laser Powder Bed Fused Parts after Laser Polishing. Addit. Manuf. 2024, 94, 104486. [Google Scholar] [CrossRef]
  100. Huang, Q.; Hu, N.; Yang, X.; Zhang, R.; Feng, Q. Microstructure and Inclusion of Ti–6Al–4V Fabricated by Selective Laser Melting. Front. Mater. Sci. 2016, 10, 428–431. [Google Scholar] [CrossRef]
  101. Chase, M.W. (Ed.) NIST-JANAF Thermochemical Tables, 4th ed.; Journal of Physical and Chemical Reference Data, Monograph 9; American Chemical Society and American Institute of Physics: Washington, DC, USA, 1998; ISBN 978-1563968310. [Google Scholar]
  102. National Center for Biotechnology Information. Electronegativity in the Periodic Table of Elements. Available online: https://pubchem.ncbi.nlm.nih.gov/periodic-table/electronegativity (accessed on 26 February 2025).
  103. Frankel, G.S.; Vienna, J.D.; Lian, J.; Scully, J.R.; Gin, S.; Ryan, J.V.; Wang, J.; Kim, S.H.; Windl, W.; Du, J. A Comparative Review of the Aqueous Corrosion of Glasses, Crystalline Ceramics, and Metals. npj Mater. Degrad. 2018, 2, 15. [Google Scholar] [CrossRef]
  104. Efremenko, V.G.; Lekatou, A.G.; Efremenko, B.V.; Chabak, Y.G.; Petryshynets, I.; Margariti, D.; Emmanouilidou, S.N.; Puchy, V. Laser Beam Surface Modification of Additively Manufactured Ni-Based Superalloy: Correlations of Microstructure and Tribological/Corrosion Properties. J. Mater. Res. Technol. 2025, 35, 4390–4411. [Google Scholar] [CrossRef]
  105. Carboni, C.; Peyre, P.; Béranger, G.; Lemaitre, C. Influence of High Power Diode Laser Surface Melting on the Pitting Corrosion Resistance of Type 316L Stainless Steel. J. Mater. Sci. 2002, 37, 3715–3723. [Google Scholar] [CrossRef]
  106. Jiménez-Millán, J.; Velilla, N.; Vázquez, M. Two-Stage Formation of Kaolinite in Shear-Zone Slates, Southern Iberian Massif, SE Spain. Clay Miner. 2007, 42, 273–286. [Google Scholar] [CrossRef]
  107. Dill, H.G. Kaolin: Soil, Rock and Ore from the Mineral to the Magmatic, Sedimentary and Metamorphic Environments. Earth-Sci. Rev. 2016, 161, 16–129. [Google Scholar] [CrossRef]
  108. Rengasamy, P. Substitution of Iron and Titanium in Kaolinites. Clays Clay Miner. 1976, 24, 265–266. [Google Scholar] [CrossRef]
  109. Cui, Y.-W.; Chen, L.-Y.; Qin, P.; Li, R.; Zang, Q.; Peng, J.; Zhang, L.; Lu, S.; Wang, L.; Zhang, L.-C. Metastable Pitting Corrosion Behavior of Laser Powder Bed Fusion Produced Ti-6Al-4V in Hank’s Solution. Corros. Sci. 2022, 203, 110333. [Google Scholar] [CrossRef]
  110. Vignal, V.; Delrue, O.; Heintz, O.; Peultier, J. Influence of the Passive Film Properties and Residual Stresses on the Micro-Electrochemical Behavior of Duplex Stainless Steels. Electrochim. Acta 2010, 55, 7118–7125. [Google Scholar] [CrossRef]
  111. Popov, K.I.; Nikolić, N.D.; Živković, P.M.; Branković, G. The Effect of the Electrode Surface Roughness at Low Level of Coarseness on the Polarization Characteristics of Electrochemical Processes. Electrochim. Acta 2010, 55, 1919–1925. [Google Scholar] [CrossRef]
  112. Gnilitskyi, I.; Bellucci, S.; Marrani, A.G.; Shepida, M.; Mazur, A.; Zozulya, G.; Kordan, V.; Babizhetskyy, V.; Sahraoui, B.; Kuntyi, O. Femtosecond Laser-Induced Nano- and Microstructuring of Cu Electrodes for CO2 Electroreduction in Acetonitrile Medium. Sci. Rep. 2023, 13, 8837. [Google Scholar] [CrossRef]
  113. Manjaiah, M.; Laubscher, R.F. Review of the Surface Modifications of Titanium Alloys for Biomedical Applications. Mater. Technol. 2017, 51, 181–193. [Google Scholar] [CrossRef]
  114. Karacs, A.; Joob Fancsaly, A.; Divinyi, T.; Pet, G.; Kovách, G. Morphological and Animal Study of Titanium Dental Implant Surface Induced by Blasting and High Intensity Pulsed Nd-Glass Laser. Mater. Sci. Eng. C 2003, 23, 431–435. [Google Scholar] [CrossRef]
  115. Chen, X.; Qiu, C. In-Situ Development of a Sandwich Microstructure with Enhanced Ductility by Laser Reheating of a Laser Melted Titanium Alloy. Sci. Rep. 2020, 10, 15870. [Google Scholar] [CrossRef]
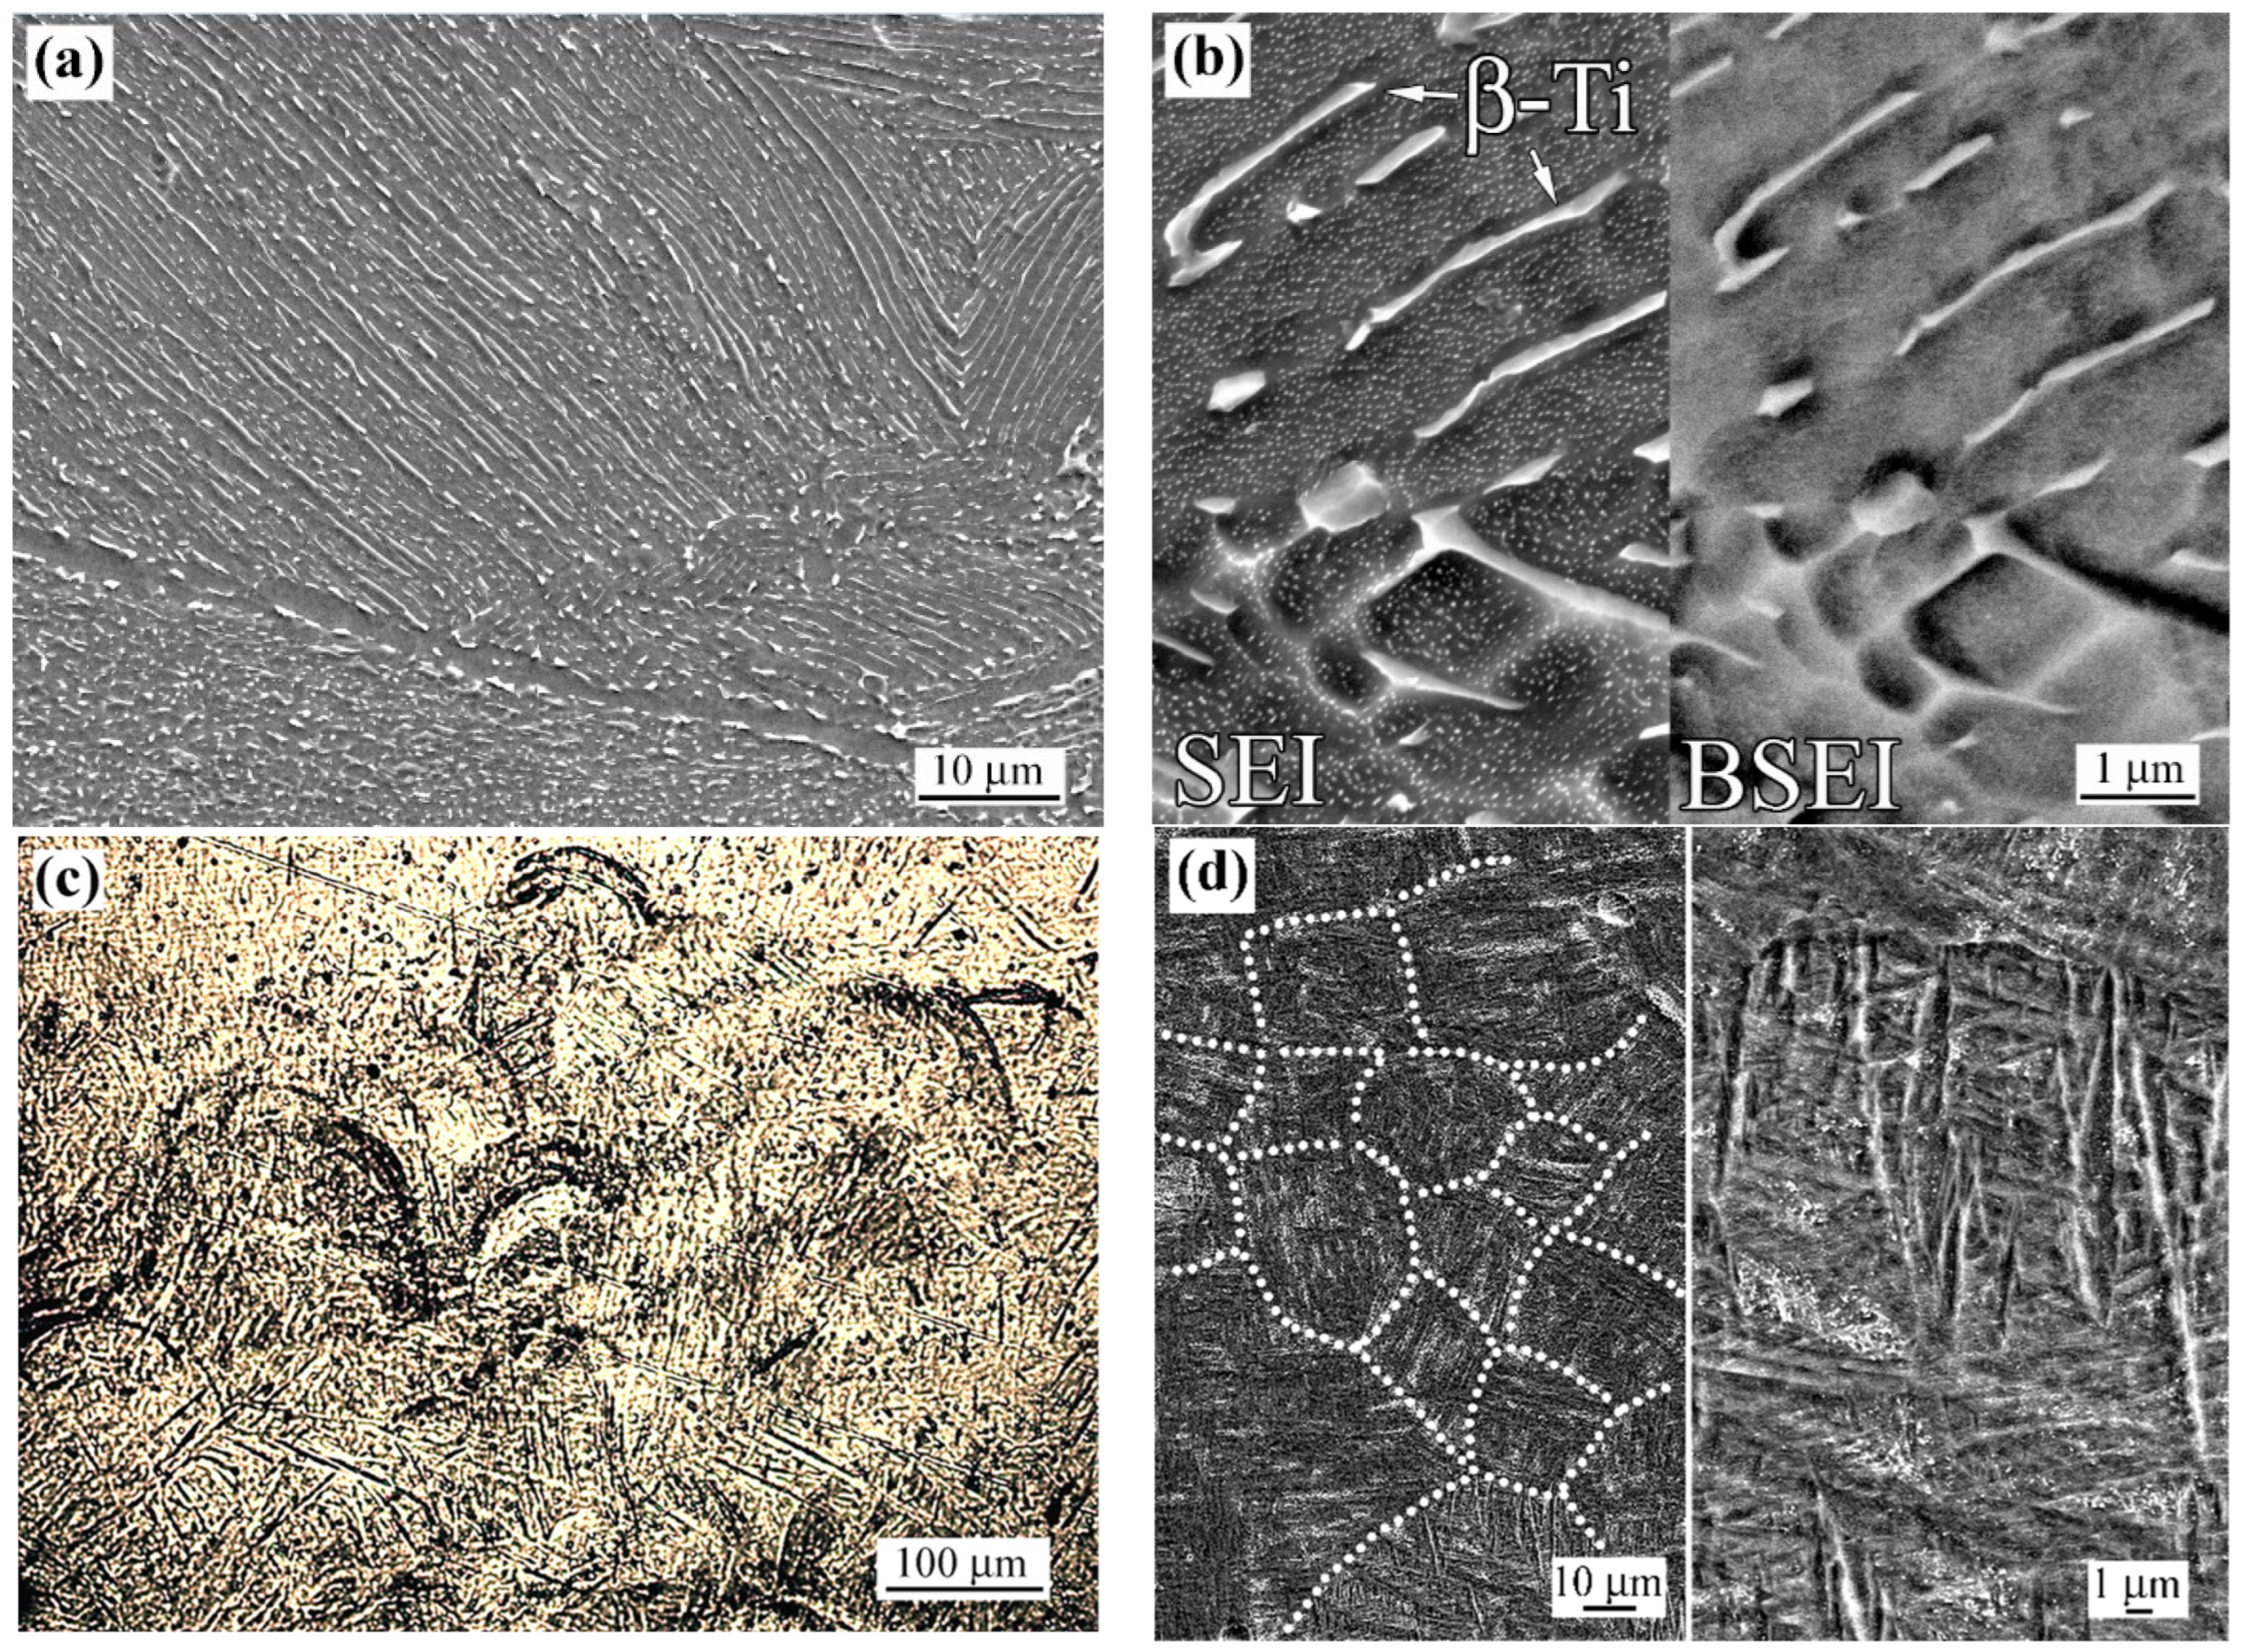
Figure 1. Microstructure of the Ti-6-4 specimens in the as-fabricated states: (a) WR Ti-6-4 overview image; (b) β-lamellae in α-matrix in the WR specimen; (c) LPBF Ti-6-4 overview image; (d) α′-martensite in the LPBF specimen; prior β grains are denoted by white dotted lines ((a,d)—SEI, (b)—SEI/BSEI, (c)—OM).
Coatings 15 01285 g001
Figure 2. Microstructure of the LSM-LPBF specimen: (a) overview of the laser-modified layers; (b) layers A and B; (c) the dendrite morphology in layer A and, in the inset, the interdendritic network; (d) presenting SDAS of the dendrites; (e) distribution of V, Al and Ti across the interdendritic network; (f) coarse needles in layer B; (g) fine-needle structure in layer C, and, in the inset, the magnified structure of the square in the center of the image; (h) base non-modified structure; ((a)—OM, (bh)—SEM/SEI).
Coatings 15 01285 g002aCoatings 15 01285 g002b
Figure 3. Microstructure of the LSM-WR specimen: (a) overview of the laser-modified layers; (b) layers A, B and C at higher magnification; (c) the dendrites in layer A; (d) interdendritic network and EDX line distribution of V, Al and Ti across an inclusion; (e) coarse-needle structure in layer C (near the border with layer B); (f) fine-needle structure in layer C (near the border with base structure); (g) base non-modified structure; prior β grains are denoted by white dotted lines ((a)—OM, (bf)—SEM/SEI).
Coatings 15 01285 g003aCoatings 15 01285 g003b
Figure 4. Free surface of LSM-WR Ti-6-4 and EDX elemental maps: (a) Electron image; (bf): EDX maps for O (b), Al (c), Si (d), Fe (e), and Ti (f).
Coatings 15 01285 g004
Figure 5. The results of the EBSD analysis of the specimens LSM-WR Ti-6-4 specimens: (a) IPF map; (b) (BC + GB) map (green lines are the HAGBs, red lines are LAGBs); (c) KAM map; (d) phase map (red colour is α-Ti, yellow colour is β-Ti); (e) pole Figures for {0001} and {10-10} of Ti-Hex; {100}, {110} and {111} are the crystallographic directions of Ti-cubic.
Coatings 15 01285 g005
Figure 6. The results of the EBSD analysis of the LSM-LPBF Ti-6-4 specimen: (a) IPF map; (b) (BC + GB) map (green lines are the HAGBs, red lines are LAGBs); (c) KAM map; (d) phase map (red colour is α-Ti, yellow colour is β-Ti); (e) pole Figures for {0001} and {10-10} of Ti-Hex; {100}, {110} and {111} are the crystallographic directions of Ti-cubic.
Coatings 15 01285 g006
Figure 7. XRD patterns of the specimens: (a) in the range of 2θ = 35–125° (Co lamp); (b) detailed in the range of 2θ = 40–50° (1: 44-1294, 2: 44-1288, 3: 21-1272, 21-1276, 29-1360, 4: 39-376, 72-1441).
Coatings 15 01285 g007
Figure 8. Microhardness profiles of the laser-processed specimens: (a) to the depth of 2500 µm; (b) detailed analysis of the near-surface layers (up to 500 µm depth).
Coatings 15 01285 g008
Figure 9. Cyclic polarisation curves of Ti-6-4, as-fabricated and laser surface-melted (LSM), in SBF, at 37 °C. (a) Effect of laser surface melting on the polarisation behaviour of LPBF Ti-6-4; (b) effect of laser surface melting on the polarisation behaviour of wrought Ti-6-4; (c) comparison of the polarisation behaviours of LSM-LPBF and LSM-WR Ti-6-4; F: forward polarisation, R: reverse polarisation.
Coatings 15 01285 g009
Figure 10. SEM micrographs of the free surfaces of as-fabricated Ti-6-4 and LSM Ti-6-4 after cyclic polarisation in SBF at 37 °C: (a) LPBF; (b) WR; (c) LSM-LPBF; and (d) LSM-WR.
Coatings 15 01285 g010aCoatings 15 01285 g010b
Figure 11. Cross-sectional SEM micrographs of (ad) as-fabricated Ti-6-4 and LSM Ti-6-4 after cyclic polarisation in SBF at 37 °C; (a) LPBF; (b) WR; (c) LSM-LPBF; (d) LSM-WR.
Coatings 15 01285 g011
Figure 12. Free surface of LSM-LPBF Ti-6-4 after cyclic polarisation in SBF at 37 °C, under SEM and EDX elemental maps: (a) Electron image; (bi): EDX maps for Ti (b), Al (c), V (d), O (e), Si (f), Fe (g), Cl (h), and Na (i).
Coatings 15 01285 g012
Figure 13. Free surface of LSM-WR Ti-6-4 after cyclic polarisation in SBF at 37 °C under the SEM and EDX elemental line scan (along the yellow horizontal line).
Coatings 15 01285 g013
Figure 14. Representative Raman spectra from surface spots of the LSM-LPBF and the LSM-WR specimens after cyclic polarisation in SBF at 37 °C. r: rutile, b: brookite, a: anatase, k: kaolin minerals (kaolinite, dickite, halloysite), m: montmorillonite, mu: muscovite. (a) LSM-LPBF Ti-6-4; (b) LSM-WR Ti-6-4.
Coatings 15 01285 g014
Figure 15. Schematic of maximum temperature distribution under laser heating and corresponding phase transformations during heating/cooling in the (a) LPBF sample and (b) WR sample. (Tmelt, Tc, Tβ-tr: melting, grain coarsening onset, and β-transus temperature, respectively; βV,Fe: interdentritic (V,Fe)-rich β-phase).
Coatings 15 01285 g015
Table 1. Phase chemical compositions (wt.%) of dendrites and interdendritic network in layer A of the LSM specimens.
SpecimenPhaseAlVSiFeTi
LSM-LPBFDendrite3.8 ± 0.41.7 ± 0.60.6 ± 0.193.9 ± 1.1
Interdendritic network8.3 ± 0.26.9 ± 0.30.7 ± 0.31.0 ± 0.383.1 ± 0.1
LSM-WRDendrite 6.0 ± 0.32.7 ± 0.11.1 ± 0.290.2 ± 0.2
Interdendritic network6.4 ± 0.210.3 ± 0.30.9 ± 0.20.3 ± 0.182.1 ± 0.1
Table 2. The FWHM values (°) of α-Ti diffraction peaks for different specimens.
α-Ti LineWRLSM-WR(LSM-WR)/WRLPBFLSM-LPBF(LSM-LPBF)/LPBF
(100)0.470.501.060.340.772.26
(101)0.420.681.620.290.873.00
(102)0.431.002.330.371.072.89
(110)0.631.402.220.561.412.52
(112)0.732.473.380.672.503.73
Table 3. The lattice parameter and line broadening indicators derived from the XRD patterns (a and c are the HCP lattice parameters, D is the crystallite size, ρXRD is the dislocation density).
Specimena (nm)c (nm)c/aD (nm)MicrostrainsρXRD (m−2)
WR0.2935 ± 0.193 × 10−40.4676 ± 0.195 × 10−41.59357.2 ± 2.10.0014 ± 6.34 × 10−51.57 × 1014
LSM-WR0.2964 ± 0.287 × 10−40.4744 ± 0.577 × 10−41.611 21.5 ± 0.60.0046 ± 7.70 × 10−51.37 × 1015
LPBF0.2931 ± 0.114 × 10−40.4675 ± 0.269 × 10−41.59588.3 ± 5.40.0018 ± 5.34 × 10−51.31 × 1014
LSM-LPBF0.2956 ± 0.344 × 10−40.4720 ± 0.878 × 10−41.597 16.7 ± 0.30.0053 ± 2.76 × 10−52.03 × 1015
Table 4. Electrochemical values of LSM Ti-6-4 and as-built, LPBF and wrought Ti-6-4 immersed in SBF at 37 °C. Ecorr: corrosion potential, Ea/c tr: anodic-to-cathodic transition potential, Ecp: critical passivation potential, icorr: corrosion current density, ip: passive current density (middle of passive region), rcorr: corrosion rate, R2: regression coefficient of Tafel extrapolation.
ValuesLPBFLSM-LPBFWRLSM-WR
Ecorr (mV, Ag/AgCl)−468 ± 41−110 ± 8−489 ± 23−157 ± 2
Ea/c tr (mV, Ag/AgCl)130 ± 46432 ± 47109 ± 24503 ± 47
Ecp (mV, Ag/AgCl)−184 ± 18175 ± 5−92 ± 14−112 ± 6
icorr (mA/cm2)(5.3 ± 2.0) × 10−5(32.0 ± 4.9) × 10−5(2.0 ± 0.8) × 10−5(11.0 ± 1.3) × 10−5
ip (mA/cm2)(4.5 ± 0.4) × 10−4(16 ± 1.9) × 10−4(3.0 ± 0.3) × 10−4(8.5 ± 2.1) × 10−4
rcorr (mm/y)(4.5 ± 1.7) × 10−4(27 ± 4.2) × 10−4(1.7 ± 0.7) × 10−4(9.4 ± 1.1) × 10−4
R20.989 ± 0.0030.992 ± 0.0010.991 ± 0.0040.988 ± 0.006
Pitting (x out of four replicates)No (4/4)No (4/4)No (4/4)No (4/4)
Disclaimer/Publisher’s Note: The statements, opinions and data contained in all publications are solely those of the individual author(s) and contributor(s) and not of MDPI and/or the editor(s). MDPI and/or the editor(s) disclaim responsibility for any injury to people or property resulting from any ideas, methods, instructions or products referred to in the content.