Article

Discovery and Quantification of Microplastic Generation in the Recycling of Coated Paper-Based Packaging

1
Department of Chemistry, Materials and Chemical Engineering “Giulio Natta”, Politecnico di Milano, Piazza Leonardo Da Vinci, 32, 20133 Milano, Italy
2
Innovhub—Stazioni Sperimentali per l’Industria S.r.l., Via Giuseppe Colombo, 83, 20133 Milano, Italy
*
Author to whom correspondence should be addressed.
Coatings 2025, 15(11), 1284; https://doi.org/10.3390/coatings15111284
Submission received: 3 October 2025 / Revised: 21 October 2025 / Accepted: 25 October 2025 / Published: 3 November 2025

Abstract

Microplastics (MPs) are found almost everywhere in the environment and the food chain. The long-term effects of MPs on living organisms are still unclear, so preventing anthropogenic MP generation has become crucial. Fibre-based packaging recycling is investigated here, shedding light on possible MP generation and its consequences. As a typically overlooked source of secondary MPs, cellulosic packaging often consists of thin polymeric coatings that can fragment during recycling. Dispersion coating technology for paper substrates is considered here. The coating formulation was tagged with rhodamine-B and investigated using semi-automatised techniques, including fluorescence microscopy, optical microscopy, and Raman spectroscopy. The results raise concerns as the coating under investigation (8 g/m2) broke into more than 75,000 secondary MPs, whose equivalent diameter and particle count density in the recycled material averaged 75.4 µm and 4.7 particles/mm2, respectively. Wastewater analysis found finer particles (average equivalent diameter: 51.4 µm) with a higher particle count density (6.7 particles/mm2). Overall, 72% of the retrieved particles were smaller than 100 µm. Without proper wastewater screening, such particles (representing 87% in the wastewater filter) may enter the environment, hence representing a hazard for living organisms including humans.

Graphical Abstract

1. Introduction

The issue of microplastics (MPs) and their environmental leakage has gained significant attention [1,2,3]. MPs are particles ranging from 1 μm to 5 mm [4]; much interest is on secondary microplastics generated due to breakdown processes [5,6]. Secondary MPs arise from chemical and mechanical weathering, abrasion, or photodegradation, primarily from land-based debris [6]. Such fragmentation occurs due to natural processes or human-related activities, leading to toxic accumulation in living organisms [7,8,9]. Preventing MP production, leaching, and transportation is essential; hence, different waste sources of MPs require exploration [10,11,12].
Globally, and in the European Union, packaging waste has consistently increased since 2010 [13,14]. In 2021, around 60% of the total packaging waste was cellulosic (34.0 Mt) and plastic (16.1 Mt) packaging [13].
Secondary MPs can be generated during various packaging industry stages, including production, transport, recycling, and disposal [1,15]. A previous review highlighted the need for advanced wastewater treatment methods for the effective removal of MPs [16], e.g., membrane bioreactors, electrocoagulation, or rapid sand filtration that can reach >98% MP removal efficiency. In one study [17], the analysis of plastic recycling facility wastewater samples detected MPs as small as a few micrometres, supporting previous findings; similarly, most MPs have been found to be smaller than 300 µm in water treatment plants [18].
Given the industry’s shift towards fibre-based packaging—known as the “paperisation” process—high-performance polymeric, inorganic, or hybrid coatings are being developed [19,20,21,22,23]. Among these, dispersion coatings are taking a share of the market. The introduction of non-fibrous materials in recycling streams must be managed to ensure secondary raw material quality and prevent anthropogenic MPs from entering the environment through wastewater. These MPs can enter the food chain via aquatic organisms and ultimately affect human health [24,25,26] by entering the body [9]. To the authors’ knowledge, what happens to polymeric coating particles during different stages of cellulosic packaging recycling remains undocumented.
Dispersion-coated fibre-based packaging is generally considered recyclable due to the low reject rates observed during recycling [27,28,29,30]. Coated substrates should be included in discussions on MP generation since coating fragments may bypass mechanical separation at paper mills, explaining the low amounts of coarse and fine rejects during lab testing. Current technical standards for assessing fibre-based product recyclability include the Italian recycling standard [31] and the European harmonised methodology [32]. The methodologies include the analysis of coarse and fine rejects, and of macrostickies separated by mechanical means. Moreover, parameters such as recycled material stickiness and optical inhomogeneities are assessed. Such methods are representative of the paper mill process at a laboratory scale. On the contrary, to date, no standard or technical procedure exists to measure or assess secondary MP release.
From a paper mill perspective, possible MP accumulation in water increases suspended solids and burdens on flocculation and sedimentation [33,34], possibly necessitating micro-filtering treatments to prevent environmental leakage. Before reaching the flocculation and sedimentation stage, MPs may contaminate the secondary raw material, i.e., recycled paper, which may raise concerns about particle migration in food contact applications. MPs might also be generated during the composting of packaging, further leaking into and contaminating the soil. Previous studies and standards [35,36] introduced multiple methodologies to identify and track MPs and determine their constituents in polymeric composites, including Raman spectroscopy, micro-FTIR, the fluorescent dyeing of polymeric particles, fluorescence microscopy, and image analysis. In one study, Tong et al. [37] investigated the best solvent for rhodamine-B (RhB) to observe and track MPs with fluorescence microscopy. RhB was physically adsorbed on the surface of multiple polymers, including polyethylene, polypropylene, and polystyrene, and did not fade after rinsing with water. In another study, Purington et al. [38] focused on a waterborne styrene–butadiene coating using RhB to understand binder migration in the cellulosic substrate through confocal laser scanning microscopy and fluorescence microscopy. Brown et al. [17] and Erni-Cassola et al. [39] employed Nile red dye for detecting MPs in environmental and industrial samples and quantifying common packaging polymer particles in the 20–1000 µm range, respectively. Nile red is similar to RhB as it is fluorescent and capable of visibly colouring the sample. However, it is poorly soluble in water, often requiring methanol or acetone as a solvent. Kwon et al. [40] tracked hydroxyethyl methacrylate using fluorescein o-methacrylate to tag latex in dispersion coatings.
The novel hypotheses of this work are that thin coatings on cellulosic substrates generate large amounts of micrometric secondary MPs during paper recycling, and that fluorescent species can help track, count, and measure them at different stages of the recycling testing methodology.
The focus in this work was on a styrene–butadiene dispersion coating tagged with RhB to provide contrast for detection and measurement purposes. As dispersion coatings are mainly water-based products, RhB was adopted as a tagging species due to its higher solubility. The aim of this work was to advance the knowledge of MP generation for dispersion-coated paper substrates, suggesting a method and comparing multiple analysis techniques that may be used to define a shared method to assess MPs in the paper recycling stream that integrates with current recycling testing methodologies. Recycling was tested according to the UNI 11743:2019 [31] standard at the laboratory scale. The study was limited to a specific family of polymeric dispersion coatings tagged before application, which may limit is applicability to already-coated substrates or products. Additionally, the experimentation was carried out at the laboratory scale, based on the hypothesis that current methodologies are representative of industrial-scale reprocessing. The adopted analysis techniques were suitable for extensive investigations. The authors wanted to provide preliminary data to raise possible concerns on the topic.

2. Materials and Methods

MetsäBoard (Espoo, Finland) Natural WKL Bright (130 g/m2), a fully bleached uncoated white kraftliner, was used as a substrate. A commercial waterborne styrene–butadiene latex similar to DL966—a grade broadly investigated in previous literature [41,42]—was used. It is highly cross-linked, showing a solid content of 53% and a Tg ≅ 15 °C. Rhodamine-B powder was bought from Sigma-Aldrich (St. Louis, MO, USA).

2.1. Rhodamine-B-Tagged Latex Preparation and Application

The preparation of RhB-tagged latex followed the description provided by Purington et al. [38]. Briefly, 0.03 wt% of RhB (on a dry weight basis) was added to the latex while on a magnetic stirrer that operated at 300 rpm for at least 16 h; while stirring, the beaker was kept closed using a paraffine film.
The substrate was coated with a K-Bar number 2 (12 μm wet film thickness) at a speed of 40 mm/s. Next, it was dried in a VWR (Radnor, PA, USA) VentiLine 112 Prime oven at 120 °C for 90 s and conditioned to 23 °C and 50% relative humidity for at least 24 h before further testing.

2.2. Physical and Mechanical Testing

The dry coat grammage was determined by the grammage difference between the coated and uncoated substrates, measured according to ISO 536:2019 on 6 measures. A Lorentzen & Wettre (Kista, Sweden) micrometre was used for the thickness measurement according to ISO 534:2011, averaging the result of 10 measures. An Andersson & Sørensen (Ishøj, Denmark) model 6 Bendtsen Tester was used to measure the surface roughness according to the Bendtsen method, ISO 8791-2:2013, averaging the result of 6 measures.
A Lorentzen & Wettre Gurley densometer was used to measure air permeance according to the Gurley method, ISO 5636-5:2013, averaging the result of 6 measures. Both coated and uncoated substrates were tested. An Acquati (Arese, Italy) AG/MC 1 Electronic Dynamometer measured the tensile strength and strain at break according to ISO 1924-2:2008 at a constant rate of elongation (20 mm/min), averaging the result of 5 measures. Both coated and uncoated substrates were tested.
All results related to substrate physical and mechanical testing are reported in the Supporting Information (SI).

2.3. Recycling

The recyclability test was carried out according to the UNI 11743:2019 standard with a few deviations from the specified test procedure (Figure S4), as follows. Due to material limitations, each test was carried out in a single replica using 25 g dry weight sample, maintaining the pulped batch consistency to 2.5%, as per the standard. Consistency was coherent to UNI 11743:2019 to ensure consistent results. The use of a single replica represents a limitation of this work; however, the repulping process with standardised equipment and operating parameters provides reproducible results, with limited uncertainty. The following procedure was added to the methodology defined in the standard to obtain samples for further analysis.
Visible and UV light analysis occurred before and after inking the macrostickies’ filter, as described in Section 2.5. Before sheet formation, the secondary raw material (fine screening accept pulp) was filtered on a 200-mesh wire and the wastewater was recovered in a dedicated container. The recovered wastewater was filtered on a filter paper of grade 1289 with a diameter of 240 mm (basis weight 84 g/m2, filtration speed 20 s/10 mL, deposition range 8–12 μm) with the Lab Sheet Former. The filter was dried for 10 min at 93 °C, and sheet images were acquired and analysed to identify possible microplastics. The filter deposition range limits the minimum particle size retained on the filter, though solid buildup on the filter may enhance filtration efficiency initially by trapping finer particles.
In accordance with the testing method, the equipment included a Haage Anagramm Technologien GmbH (Peißenberg, Germany) AG 04 Disintegrator for the pulping stage, a FRANK-PTI (Birkenau, Germany) Somerville analyser for the coarse and fine screening, a Haage Anagramm Technologien GmbH (Peißenberg, Germany) Lab Sheet Former BBS-3 to produce recycled sheets, macrosticky filters, and wastewater filters.

2.4. Raman Spectroscopy and Fluorescence Mapping

A Horiba Jobin-Yvon (Kyoto, Japan) LabRam HR800 coupled with a Peltier-cooled charge-coupled device was used to subject samples to Raman spectroscopy. An Olympus (Tokyo, Japan) BX41 microscope with a 50× objective was coupled with the Horiba Jobin-Yvon (Kyoto, Japan) LabRam HR800 spectrometer to focalise the laser in a small sample region. The spatial resolution of the setup was 1 µm.
The analysis was performed for near-infrared (785 nm) and green (532 nm) laser sources. Figure S5 in the Supporting Information shows the Raman shift for latex, rhodamine-B, and cellulose fibres. Laser excitation at 785 nm emphasises vibrational bands and avoids fluorescence. Here, it was used to detect potentially tagged MPs and to confirm that cellulose fibres were not tagged with RhB.
Due to the low concentration of RhB relative to latex, laser excitation at 532 nm was also applied to detect the RhB fluorescence peak. The low concentration of RhB was not sufficient to observe characteristic Raman bands for this species; however, the excitation at 532 nm enabled the fluorescence identification of latex particles.
RhB-tagged particles and cellulose fibres were analysed from wastewater filters and the recycled sheet to confirm proper latex tagging and physical RhB adsorption stability.
The wastewater sample was also mapped at both 785 nm and 532 nm over a 100 × 100 µm area (10 µm measurement point spacing for 785 nm and 1 µm for 532 nm) to support RhB tagging and MP identification.

2.5. Microscopy

The substrate fibre constituents were investigated with an Olympus (Tokyo, Japan) BX-51 optical microscope after fibre reaction with Herzberg and Graff C reactive. The presence of microscopic coating fragments or fibre staining was assessed with an Olympus (Tokyo, Japan) SZ-61 stereomicroscope at all stages of the recycling methodology.
A Tescan scanning electron microscope (SEM) equipped with a Bruker (Billerica, MA, USA) energy-dispersive X-ray (EDX) probe was used to analyse coating fragmentation and its interaction with cellulose fibres. Before recycling, the coating thickness was measured. SEM analysis was performed on a 2 × 2 cm specimen for the recycled paper, macrosticky filter, and wastewater filter. The specimens were sputtered with a gold–palladium alloy and investigated for morphological (secondary electrons), constitutive (backscattered electrons), and chemical (EDX) information. EDX was used to confirm Raman analysis.
An EPSON (Suwa, Japan) V750 PRO flatbed colour scanner equipped with a colour charge-coupled device line sensor was used to retrieve sample scansions at 600–1800 dpi resolution and to measure the macrosticky area after recycling, alongside the image analysis software PTS DOMAS 3.02. Particle density was calculated as the total number of MPs divided by the scanned area, i.e., 80 × 80 mm2.
Reflectance fluorescence analyses were performed on an Olympus (Tokyo, Japan) BX51WI fixed-stage upright microscope, mounting a U-MNIBA3 filter (excitation filter: 470–495 nm, emission filter: 510–550 nm). The exposure time was 20 ms. A 40× lens maximised the scanned field (2.2 × 1.7 mm). At least 20 random measurements were acquired for each sample to determine the average particle area of the scanned surface.
Filtered wastewater, the recycled material sheet, and the macrosticky filter were analysed.
The scanned and fluorescence microscopy images were analysed using ImageJ v.1.54g, computing the data with Microsoft Excel v.2409. Raman spectra were analysed using the HORIBA (Kyoto, Japan) Scientific LabSpec 6 spectroscopy suite.

3. Results

3.1. Material Preparation

RhB was successfully tagged on the latex particles, providing a bright-coloured dispersion formulation, as reported in Supplementary Section A. The coated substrates were characterised by the typical RhB intense colour, as shown in Figure S1. The possible presence of untagged RhB in the dispersion that could tag cellulose fibres upon coating application should be avoided. A first indicator was the absence of residual colour on the rod coater after tagged dispersion application, suggesting no free RhB molecules that could stain the equipment. To ensure that no untagged RhB was present in the waterborne dispersion, an optical microscopy observation of the pulped samples was carried out, qualitatively observing that the fibres maintained their original colour (see Supplementary Section E). Additionally, Raman spectroscopy analysis was conducted, as described in Section 3.4.

3.2. Coated and Uncoated Substrate Characterisation

RhB was successfully tagged on the latex particles, providing a bright-coloured dispersion formulation, as reported in Supplementary Section A. The coated substrates were characterised by the typical RhB intense colour, as shown in Figure S1. The possible presence of untagged RhB in the dispersion that could tag cellulose fibres upon coating application should be avoided. A first indicator was the absence of residual colour on the rod coater after tagged dispersion application, suggesting that no free RhB molecules were present that could stain the equipment. To ensure that no untagged RhB was present in the waterborne dispersion, the optical microscopy observation of the pulped samples was carried out, qualitatively observing that the fibres maintained their original colour (see Supplementary Section E). Additionally, Raman spectroscopy analysis was conducted, as described in Section 3.4.

3.3. Recycling

The results of the laboratory recyclability tests are reported in Table 1, which also reports the level of recyclability according to the Aticelca 501:2023 [43] evaluation system. The results indicate that the coated substrate investigated here can be considered non-recyclable; the outcome is solely due to the high levels of macrostickies, which depend on the coating formulation. Macrosticky analysis, related to adhesive particles that can endanger the continuous process at a paper mill, is currently optional in a recycling methodology similar to the one adopted in this work (i.e., Cepi); recent methodological advancement means that the role of this analysis is crucial. According to the results, and differently to the statements made in previous literature, not all dispersion coatings should be considered recyclable within paper recycling streams, especially when based only on the coating grammage or technology used. Very small amounts of coating (5.8% in this case) can render the paper technically non-recyclable.
The sample provided no or negligible coarse rejects and some fine rejects (3.8%), composed of fibre flakes and coating particles (Figure S7). This finding highlights the fragmentation tendency of the coating, the particles of which mostly pass through a 5 mm wide hole plate and are likely to pass through a 0.15 mm wide slot plate. Specifically, the RhB-tagged coating fragments were visible in the fine reject and the secondary raw material, possessing a slightly elongated shape.
Thanks to their bright colour, coating particles in the range of millimetres were visible to the naked eye in the recycled sheet, as well as in the macrosticky filter. The wastewater filter was characterised by a much finer particle distribution, barely visible to the naked eye. Filtering the wastewater generated some issues due to the presence of extremely fine fractions that almost clogged the pores of the filter paper, requiring long draining times. Yet, the stereomicroscope analysis highlighted an even finer RhB-tagged particle distribution, qualitatively demonstrating the presence of MPs even in the wastewater.

3.4. Raman Spectroscopy

RhB-tagged particles were identified using Raman spectroscopy; the relative spectra are shown in Figure 1a. The Raman shift of the latex (Figure S5) highlights peaks at 622 cm−1 (C=C-H ring bending of styrene), 1003 cm−1 (aromatic ring breathing of styrene), and 1033 cm−1 (C-H in-plane bending of the ring) [44]. The characteristic peaks of RhB are not visible except for the coating particles in the wastewater sample, where a peak at 1530 cm−1 can be observed. Furthermore, the presence of RhB can be inferred from the increasing fluorescence signal at lower wavenumbers, consistent with Figure S5.
Additionally, peaks associated with cellulose were observed around 390 cm−1, 900 cm−1, and 1100 cm−1, with the latter being more defined. Indeed, cellulose fibres often surround the rhodamine-B-tagged polymer particles. The recorded Raman signal may also originate from regions beneath the tagged particle where cellulose fibres are present. The Raman spectra of fibres from a blank sample (i.e., untagged and uncoated cellulosic substrate) show spectra that overlap with the wastewater spectrum in Figure 1b, indicating that RhB does not leach during recycling.
Analysing the Raman shift for fibre samples (Figure 1b) shows that both the intensity of the signal and the peaks are consistent with those of cellulose fibres, as shown in Figure S5. No significant fluorescence backgrounds (potentially related to RhB) were observed at the analysed points, nor were characteristic wavelengths of either latex or RhB. A peak around 1083 cm−1 was sometimes found in the wastewater analysis. In one case, the spectrum result was completely different from what was expected for cellulose fibres (see the cyan curve in Figure 1b). It is possible to highlight three characteristic Raman shifts for calcium carbonate: around 283 cm−1, 714 cm−1, and 1083 cm−1 [45].
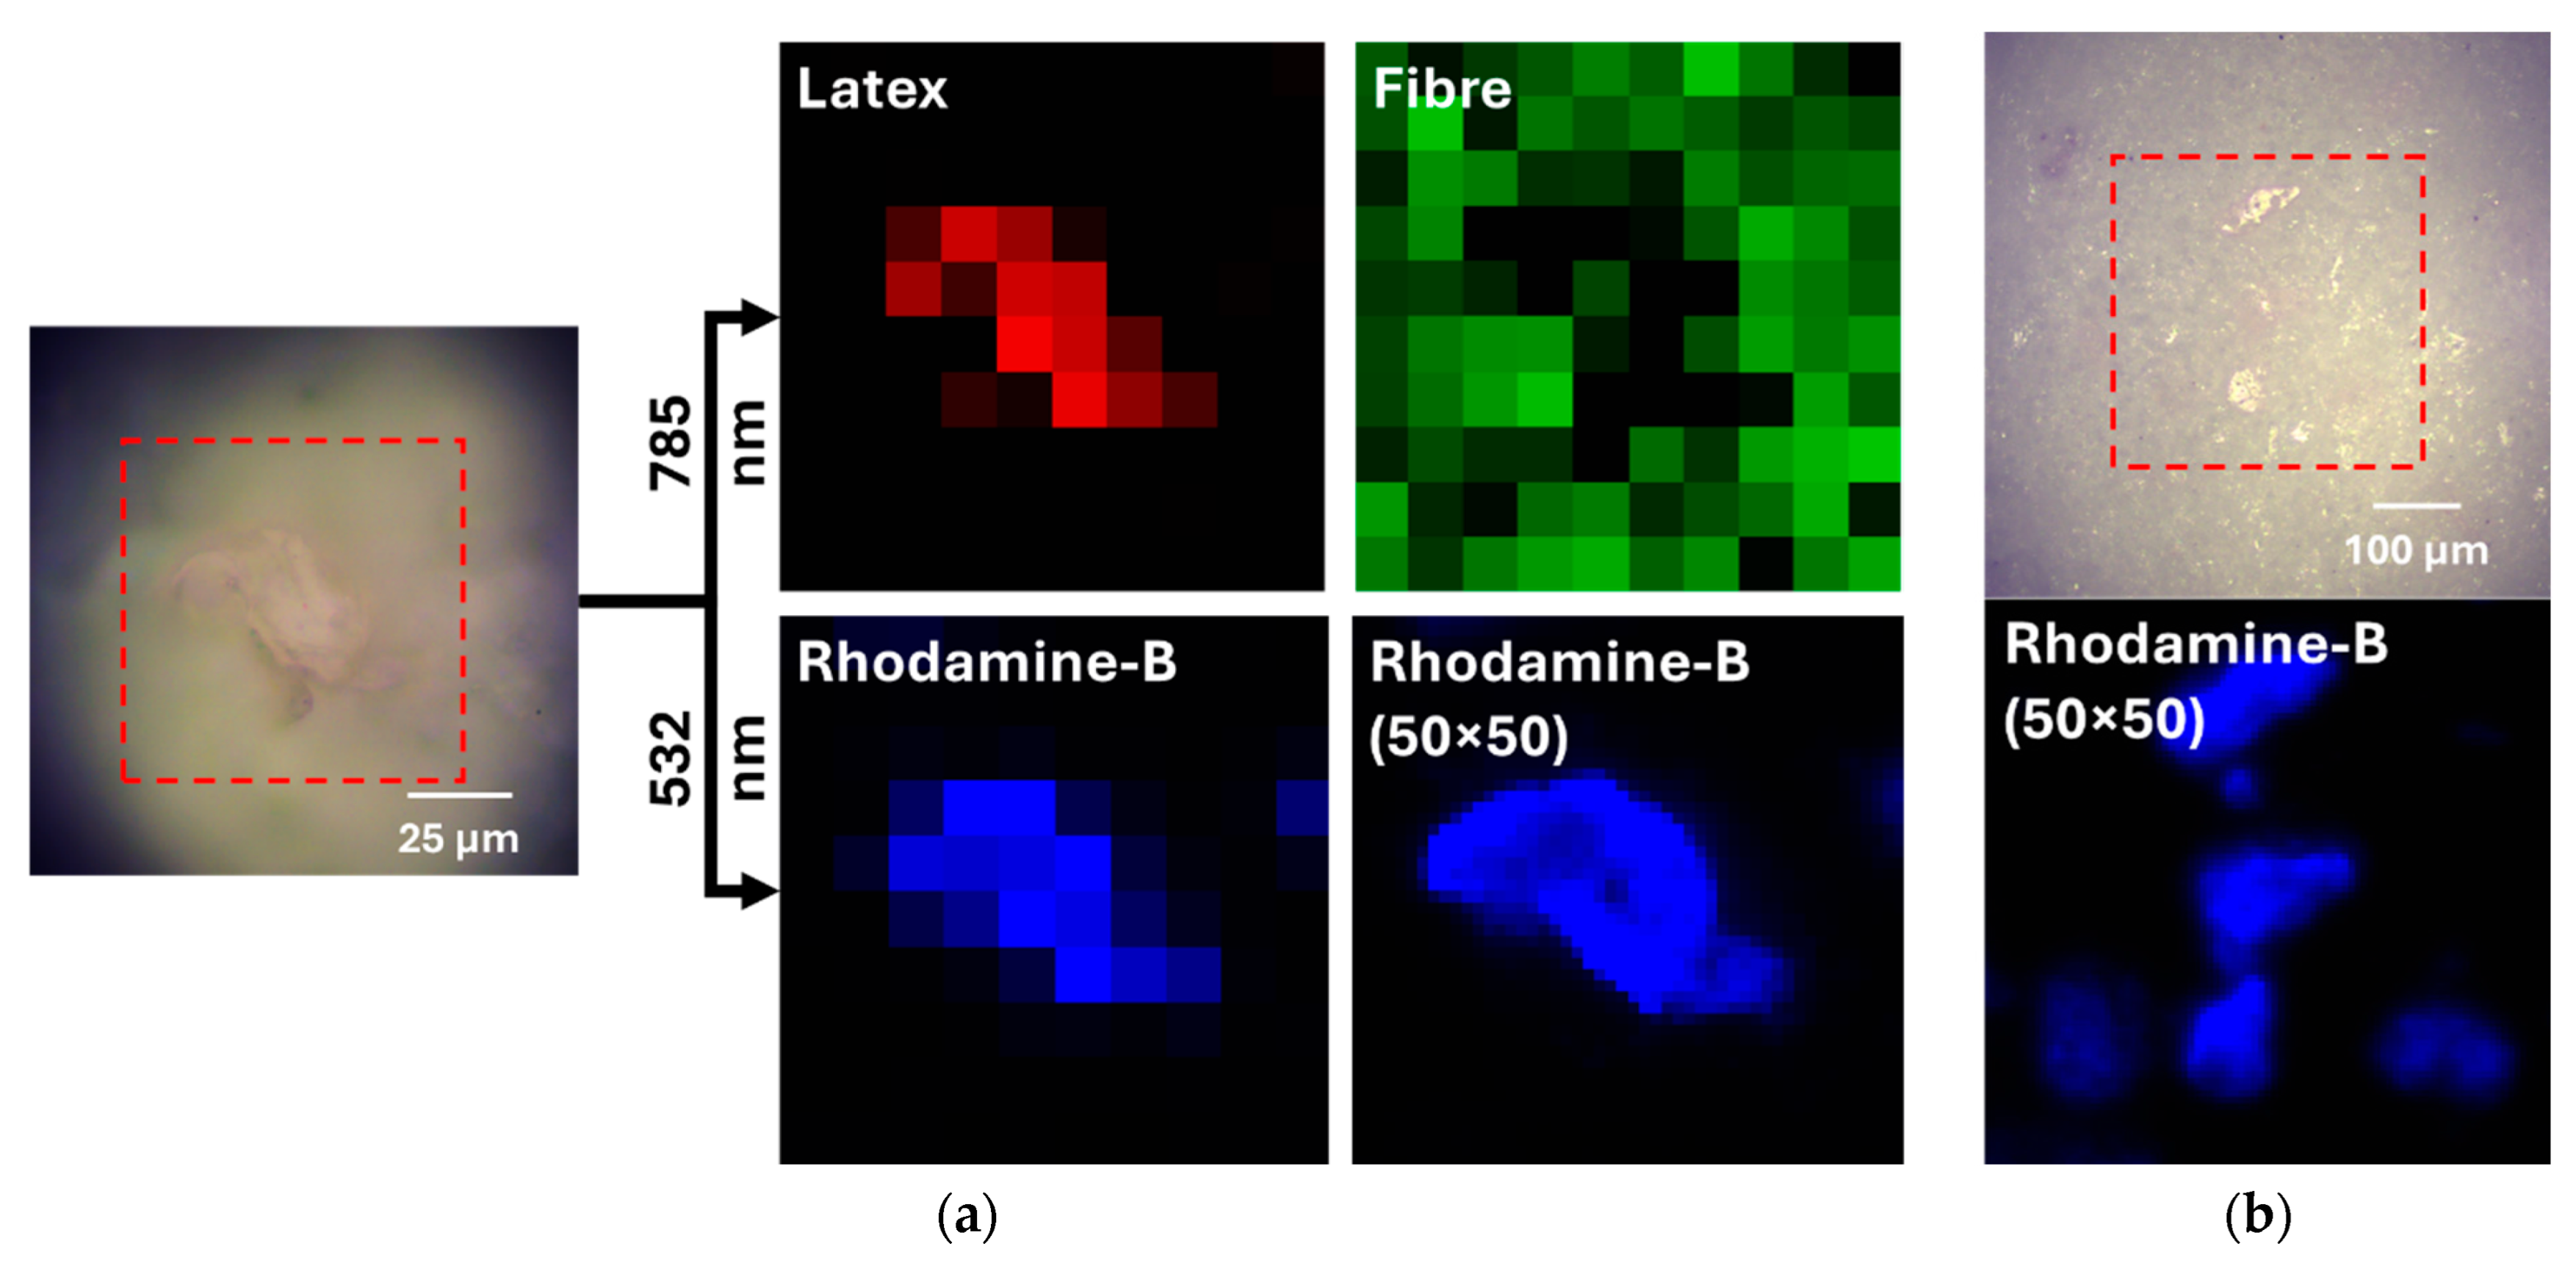
Raman spectroscopy was also used to perform fluorescence mapping of the surface, analogously to what was carried out with microscopy. The mapping procedure involves the collection of Raman spectra over a grid of points on the sample. For each grid point, we selected the 990–1018 cm−1 band for latex and 1070–1159 cm−1 band for the fibres. Regarding RhB, we focused on the 685–1774 cm−1 band that represents a portion of its broad fluorescence emission band. For each band, a colour scale proportional to the peak area was automatically determined by the software. Figure 2a shows the mapping results obtained by excitation at 785 nm and 532 nm, displaying signals for latex and fibres (at 785 nm) and RhB (at 532 nm). The fluorescence signal for RhB is visible, demonstrating that it is directly associated with the latex particles, with a fluorescence intensity difference of over 60-fold between areas with and without particles. The dual capability of the Raman instrument to detect both Raman shifts and fluorescence enables comprehensive information to be obtained on the chemical nature of the analysis points, confirming that the observed signals correspond to tagged polymers. Tagging techniques can be effectively used for imaging, as demonstrated here, providing immediate feedback on sample characteristics. Moreover, a representative map at 532 nm is shown in Figure 2b (area: 350 × 350 µm), highlighting the presence of multiple and close MPs that were only partially detected by visible light imaging.

3.5. Visible Light Imaging

Information on the equivalent area occupied by secondary MPs according to multiple dpi resolution is reported in the Supporting Information.
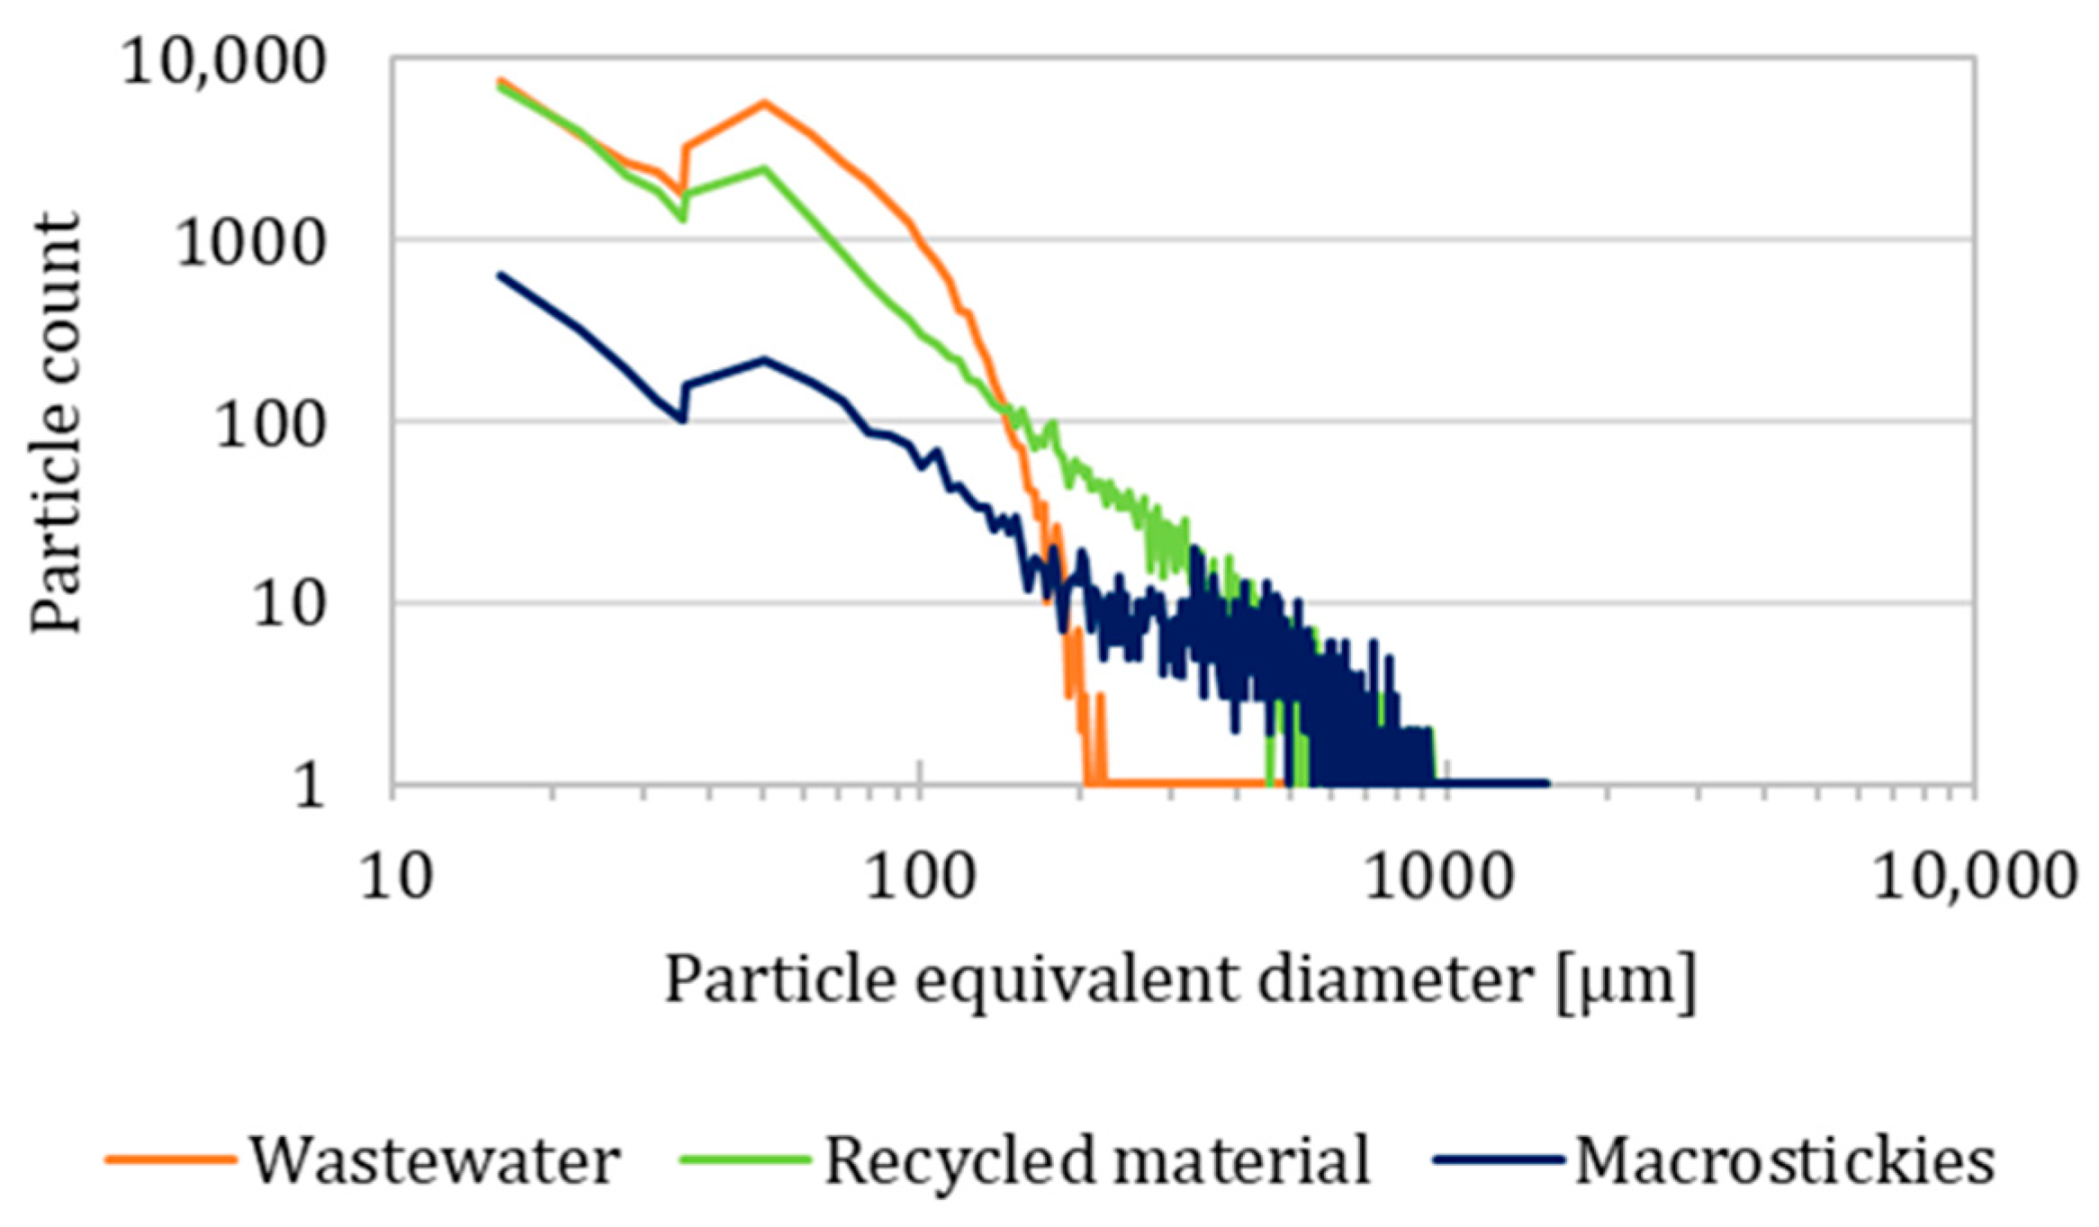
Here, 1800 dpi scans were further analysed to determine the representative distribution of the MP size for each sample, as reported in Figure 3. The wastewater filter contained 42,981 particles, i.e., 6.7 particles/mm2, whose average equivalent diameter was 51.4 ± 34.0 µm (median: 50.5 µm; min: 15.9 µm; max: 653.1 µm). Such results highlight the fact that secondary MPs elude mechanical screens and the sheet former mesh thanks to their reduced dimensions.
The analysis of the recycled material identified 30,166 particles, i.e., 4.7 particles/mm2; the average equivalent diameter was 75.4 ± 110.6 µm (median: 31.9 µm; min: 15.9 µm; max: 1527.7 µm), highlighting a broad particle size distribution. Compared to the observations for the wastewater filter, the lower median value highlights the fact that the recycled sheet holds several fine MPs. However, many large particles were mechanically separated in phase 4 (as in Figure S4) and collected by the macrosticky filter (total particle count: 4713; average equivalent diameter: 209.9 ± 222.3 µm; median: 107.0 µm; min: 16 µm; max: 1547.2 µm).
It should be considered that the counted particles are the ones visible on a specific side of the samples. Possible additional particles, partially or totally covered by fibres or located on the opposite side of the samples, are not included, implying that the generated MP number represents a minimum value. Moreover, the identified MPs with an equivalent diameter <20 µm could not be correctly determined due to resolution limitations, as their signal was within the image analysis baseline; therefore, their fraction was neglected in the calculations. However, there is indeed evidence of their presence when other techniques are used (see Figure S11e and Figure 2b).
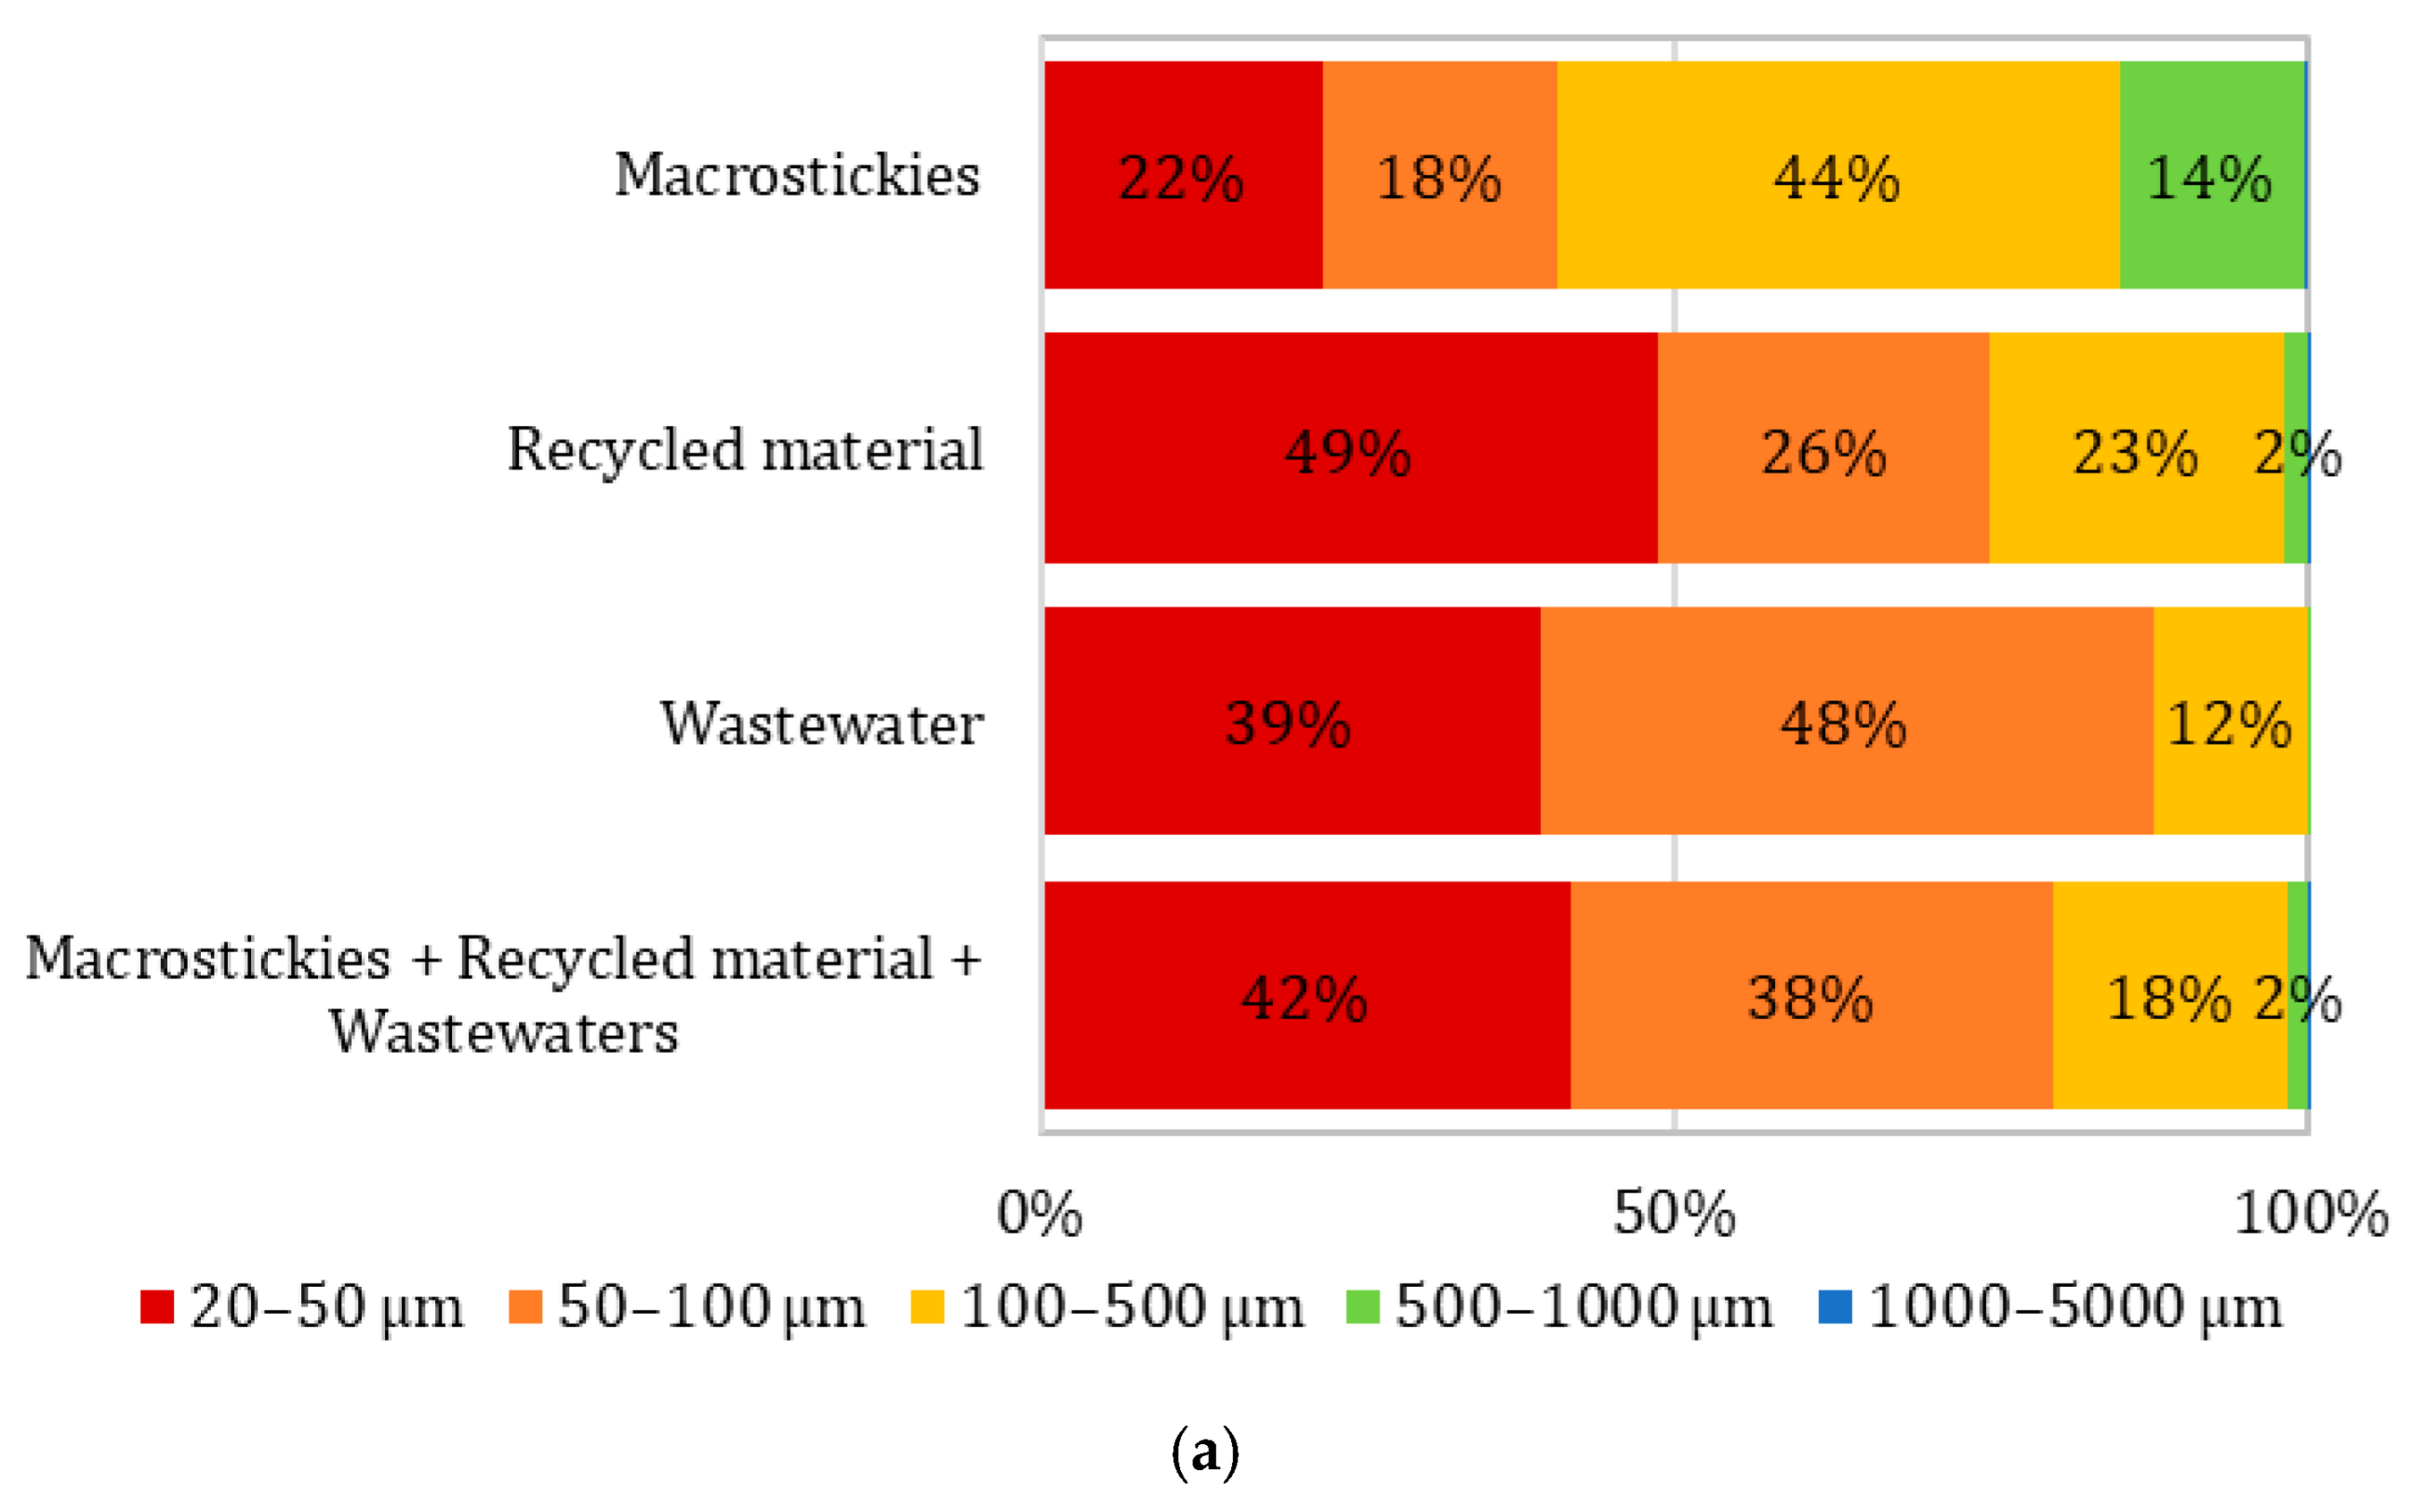
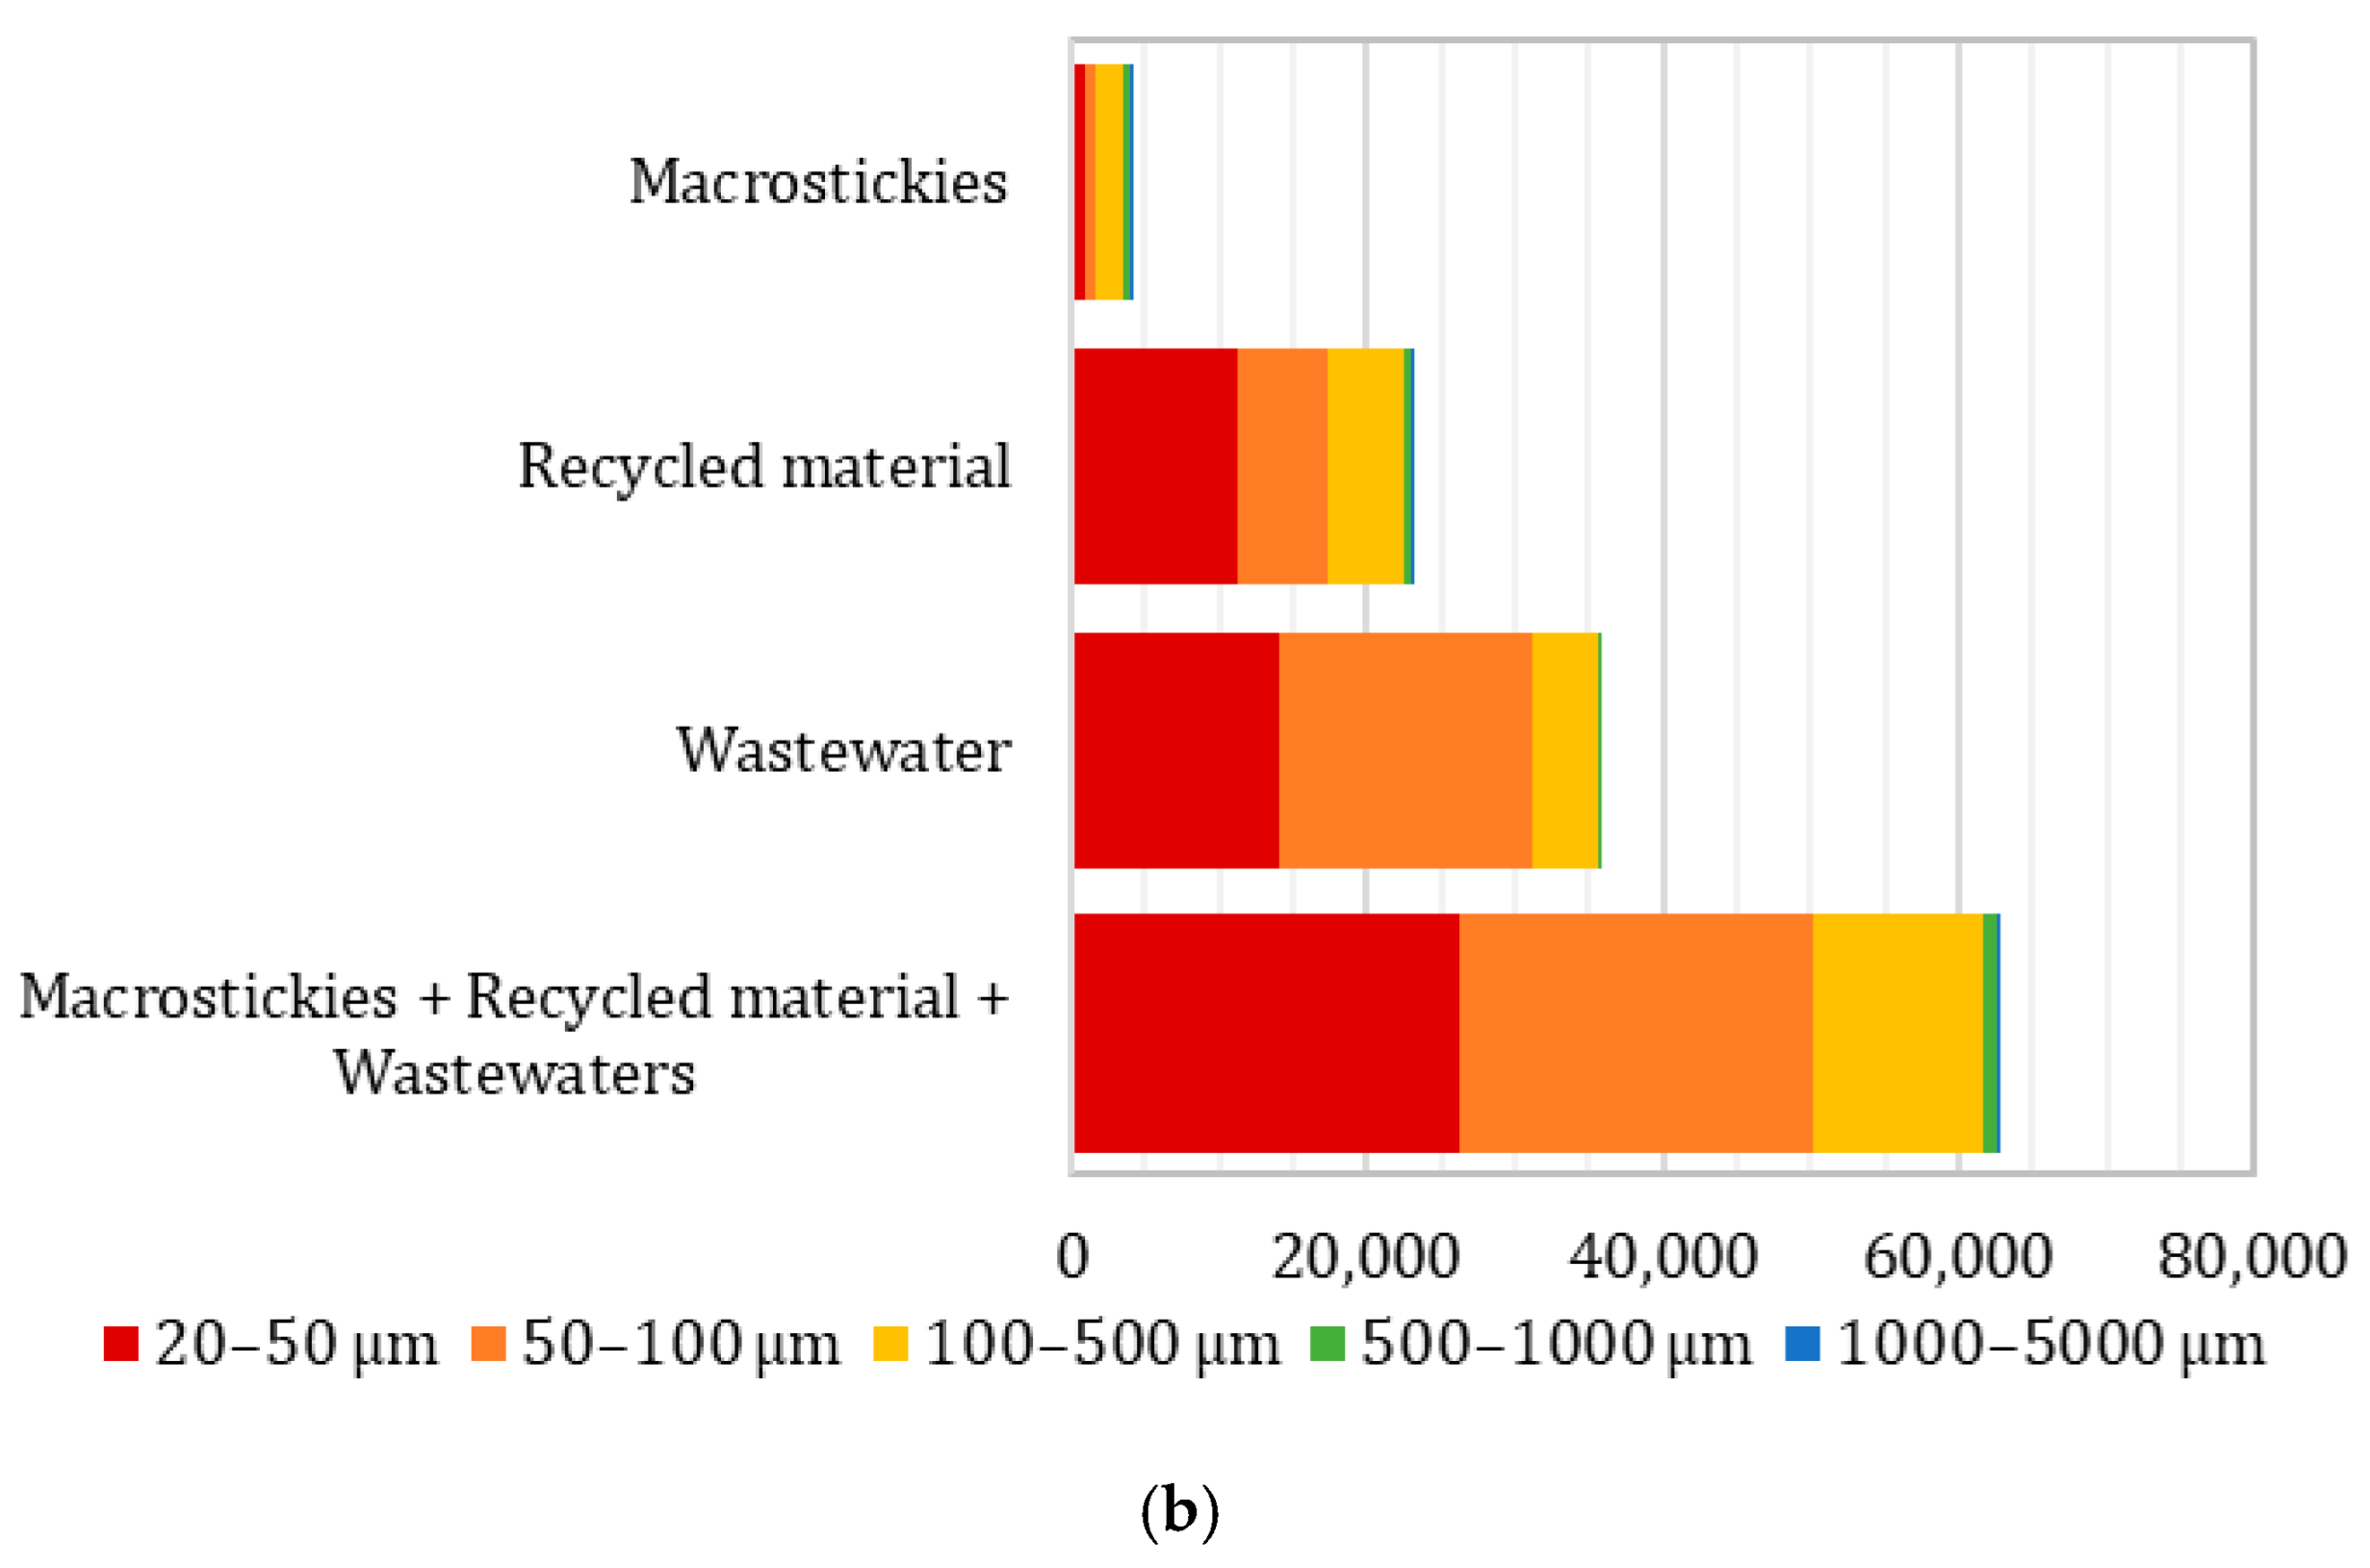
The average MP size distribution shown in Figure 4, neglecting the fraction <20 µm because it is too close to the lower measurement range boundary. The growing fraction of finer particles moving from macrostickies to wastewater is explained by the mechanical filtering system sequence that intrinsically involves finer slots, as per the adopted recycling methodology. Therefore, from a broader perspective, Figure 4 also gives indication of the overall particle size distribution of the analysed macrostickies, recycled material, and wastewater filter samples.

3.6. Fluorescence Microscopy

Fluorescence microscopy analyses were performed randomly on previously analysed surfaces to achieve a more detailed reading thanks to a better resolution. The percentage of the total scanned area occupied by RhB-tagged particles is represented in Table 2.
Fluorescence microscopy returned values around twofold higher than visible light imaging (Figure S9). The reason for this is the higher magnification and radiation penetration of the former method. Higher magnification is associated with increased resolution (619 px/mm), whereas radiation penetration is associated with the signal acquisition of particles even partially covered by fibres.
The further manual measurement of 230 particles from wastewater micrographs (using ImageJ) returned an average length of 68 ± 38 µm (minimum: 14 µm; maximum: 202 µm). The size distribution of the manual measurement was coherent with the wastewater distribution shown in Figure 4. The selected particles were limited by the low visibility in the micrographs due to possible overlying fibres. Nevertheless, the result is coherent with the particle equivalent diameter measured and reported in Figure 3.
The measured standard deviation reported in Table 2 is high for the macrostickies (both inked and not inked) because the surface features large particles distributed on a broad surface and sometimes only partially present in the image. This is coherent with the sampling methodology.
The inking of the macrosticky filter hinders microplastic detection (Figure S11).

3.7. SEM

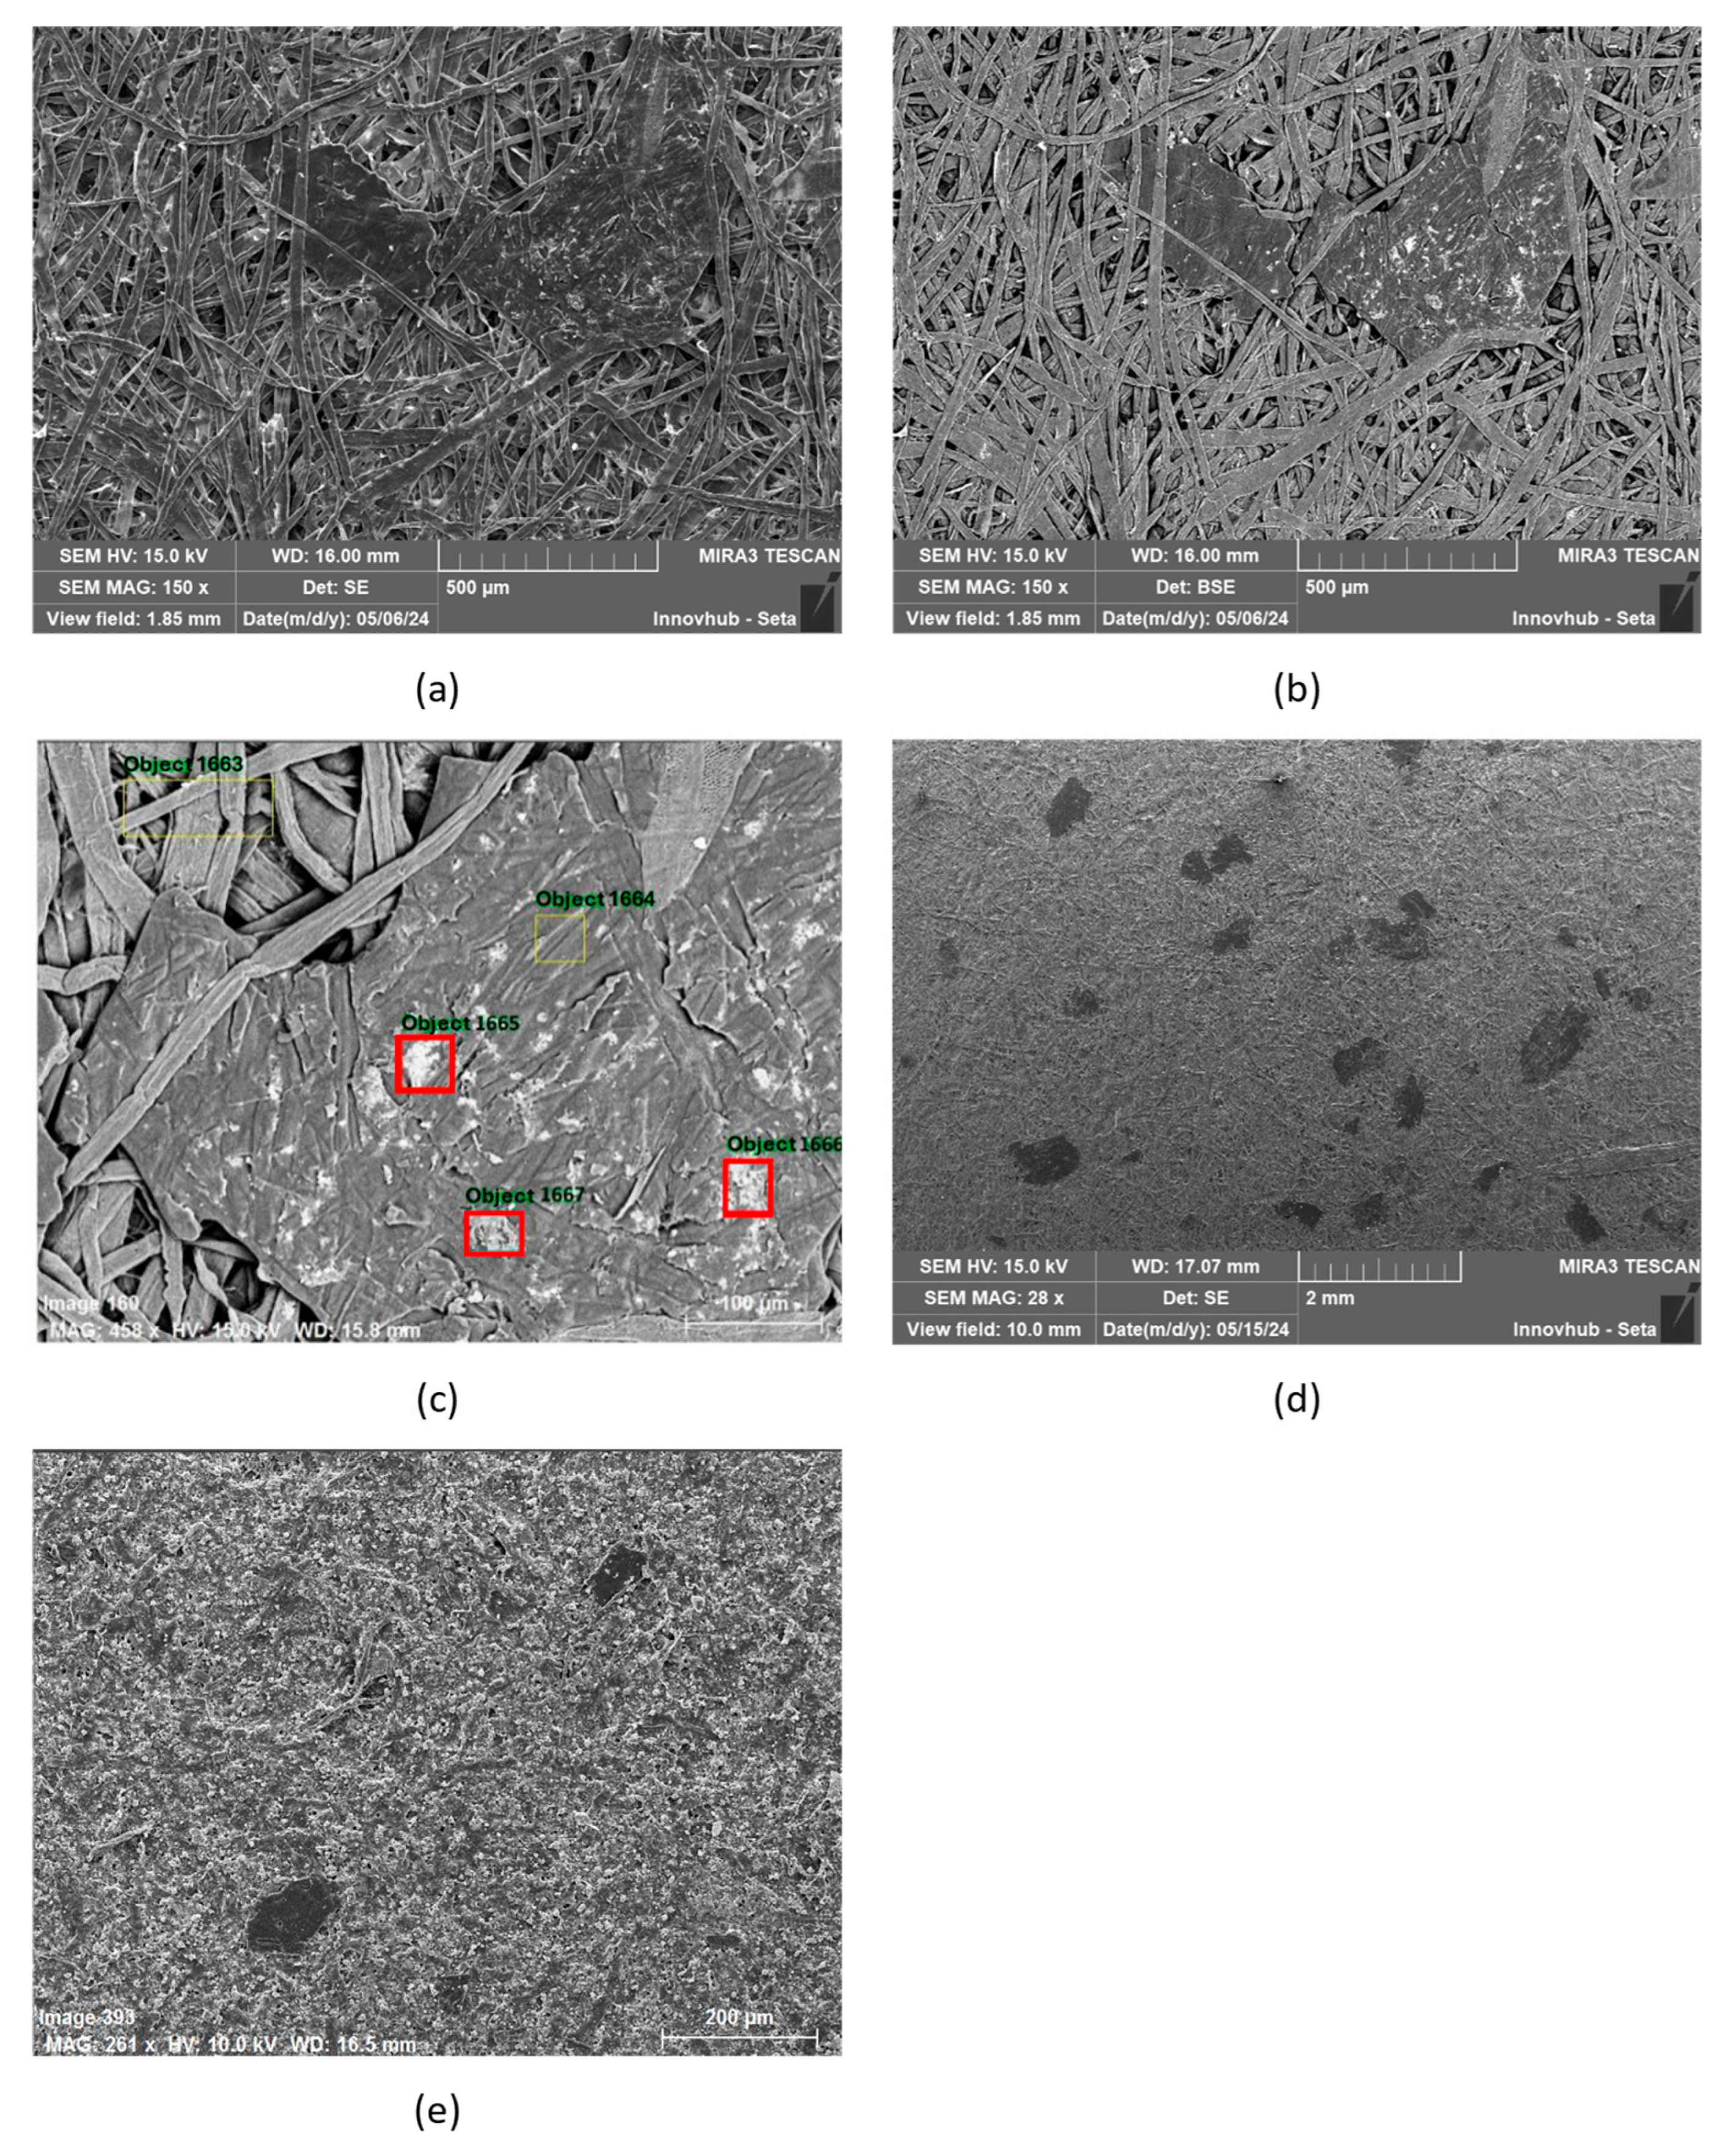
A low-magnification observation of the recycled sheet revealed difficulties in the identification of coating particles for both the secondary and backscattered electron detectors. The fibre braiding of the sheet held and hid some coating particles, preventing the clear identification of their borders.
The higher magnification of backscattered electrons highlighted brighter deposits (Figure 5c) on the coating particles’ surface. EDX analysis identified the presence of calcium, aluminium, silicon, and magnesium. The presence of CaCO3 is coherent with the Raman analyses (Figure 1b) and is related to common pigments used in paper production. Aluminium, magnesium, silicon, and sulphur are associated with the presence of kaolin and talc, as well as other substances commonly involved in paper production.
The SEM observation of the MS filter (Figure 5d) allowed the authors to identify the perimeter of the coating particles on the filter surface that were not hidden by the fibre braiding. Imaging obtained with secondary electrons highlighted the different morphologies and fragmentation of the coating particles, with diameters ranging from 200 μm to 1 mm.
The presence of coating particles is also evident in the wastewater sample. Morphological images highlighted a greater coating fragmentation with particle diameters smaller than 100 μm.

4. Discussion

From a methodological perspective, the technologies adopted in this work proved adequate to identify the presence of RhB-tagged MPs in different fractions of paper-based material recycling. Due to its intrinsic characteristics, RhB behaved similarly to Nile red, the latter having been broadly discussed in recent literature [25,39,46]; both provide a characteristic colour under visible light radiation and feature fluorescence under specific laser wavelengths. Therefore, both document-scanning equipment and fluorescence microscopy—to be used alongside image analysis software, e.g., ImageJ—can spot the presence of coating fragments. Raman analysis confirms that the RhB-coloured fragments are actual anthropogenic MPs. Due to the high fluorescence of RhB at the given concentration under excitation at 532 nm, short scanning times (around 0.2 s) allow the determination of high-density (i.e., high-definition) maps. However, when analysing large areas—in the order of squared centimetres and decimetres—fluorescence imaging becomes helpful to achieve larger mapping. This is particularly true for the analysis time. The fastest technique for analysing the scanned area was visible light imaging, which also involves the use of affordable low-tech devices; however, it necessitates tagging species that provide high contrast to the fibres of the substrate. The possible use of UV scanners could be investigated to explore fast image acquisition. Table 3 presents the main considerations about the techniques involved in this study.
Given the nature of the samples involved in this study, i.e., cellulose and polymeric coatings, the proposed method enables the analysis of MPs without the need for density separation or peroxide oxidation and enzymatic digestion, as in other standard practices used to detect MPs [35,36] that are not related to fibre-based materials. This type of workflow, besides neglecting covered or partially covered MPs in the recycled material or wastewater samples, may provide a fast and non-destructive method that can be integrated into the already-defined recyclability testing methodologies.
The obtained results are alarming. Despite the laboratory scale of this study, anthropogenic secondary MPs were produced and detected in large amounts. Due to their dimensions and considering the absence, or limited abundance, of filtration systems in current plants, MPs elude mechanical filtering systems and enter the environment and possibly the food chain [25,47]. As highlighted elsewhere [16], proper wastewater treatment should become a mandatory prevention mechanism. A recent study involving paper mills in Germany [48] confirmed that tertiary filtration can drastically reduce the volume of MPs entering the environment, otherwise reaching 106–108 MPs/m3. Another study related to Finland [49] reported 900–1600 MPs/kg in primary sludges. Moreover, previous studies typically assessed outbound process wastewater (Table 4). Some discussion in the industry is related to MPs present in the inbound water from paper mills. Previous research on industrial case studies did not shed light on how many MPs are generated during recycling compared to those already there and not separated in the process. This work provides further insights, since only the MPs generated during recycling were assessed, excluding possible interference from MPs already present in the process.
Paper and board packaging waste accounts for almost 41% of the total packaging waste generated in the European Union, exhibiting a positive trend over the last decade [13]. A remarkable share is related to functionalised substrates, typically featuring polymeric layers to improve barrier performance. Conventional one-sided coatings are easily managed at paper mills, whereas liquid containers and other structures with, e.g., water barrier coatings on both sides are generally managed by specialised facilities. Recent market trends show an increase in coated paper and board packaging on the market, with a growing multitude of functional layer materials. There are several reasons for this, from new regulatory frameworks and recent changes in design for recycling guidelines to the increased attention paid to recycling performance and testing methodologies and strong material innovation. The “paperisation” process requires higher-performance coatings, as well as thinner coating layers. This is coherent with the push to develop packaging that is recyclable at scale, and the development of “monomaterial” packaging, i.e., with <5% non-cellulosic content, as opposed to composite materials [51]. The more businesses that switch from polymeric to fibre-based packaging, the higher the number of coated products that reach paper mills and possibly fragment into fine secondary MPs. Therefore, defining a tracking and quantifying methodology for MP generation during fibre-based packaging recycling can support both developers and regulators to steer the decision-making process.
The identified secondary MPs possess a dimension that differs by one order of magnitude from macrostickies to wastewater. Wastewater does contain bigger particles, but most are smaller than those found in secondary raw materials and are typically undetectable to the naked eye. Assuming a circular shape, the equivalent diameter of wastewater MPs is coherent with the smallest MPs detected or measured in other works [15,25,52]. This work supports, as in previous literature [15,18,25], the need for the further investigation and treatment of fine MPs. Of greatest interest are fractions <0.1 mm, which constitute the majority of particles found within the wastewater analysed in this work and others that focus on sludges [48,49],
Therefore, possible wastewater treatment, e.g., membrane filtering or clarification, should be required for wastewater effluents from paper mills. Similar work related to the counting and identification of MPs in living organisms and sediments [26,53] highlighted the fact that prevention and proper policies should be mandatory, particularly in the case of recycling and production plants. Indeed, it is uncommon for conventional systems to intercept smaller MP fractions [48].
The results also showed that MPs had accumulated in the secondary raw material. Hence, these generated secondary MPs might embed in new products and possibly pollute other streams. As an example, consumers may improperly handle or sort packaging waste [54] by, for example, conferring fibre-based packaging contaminated with MPs into the organic fraction meant for compost production. MPs could also persist in the cellulose-based packaging supply chain, possibly further reducing their size in subsequent recycling processes, making their interception even more difficult and their related hazard higher.
As discussed in previous research [55,56,57,58], different coating grades, whether commercial or experimental, feature variable properties and therefore potentially different fragmentation behaviour during pulping. The behaviour depends on multiple factors, e.g., filler content and dimension, latex chemistry, glass transition temperature, and degree of cross-linking; such factors can also highly impact the recyclability outcomes, as observed in this study with the macrosticky area (Table 1). However, although this work only addresses a single type of latex, considerations drawn from these results can be applied to all similar systems. Indeed, under the hypothesis of similar behaviour at the industrial scale, the present results highlight critical issues that require further understanding and investigation.
The present tagging methodology proved feasible when the coating grade is available as dispersion, i.e., before the coating application and drying; evaluating samples that are already coated requires procedure modifications and further investigation.

5. Conclusions

The present study tracked the coating fragments produced during the recycling of coated paper-based packaging material. A tagging and analysis methodology of different fractions was proposed to successfully count and measure secondary microplastics. The main conclusions are as follows:
(1)
Rhodamine-B can tag styrene–butadiene latex. No residual rhodamine-B remained untagged for concentrations of 0.03 wt%, as observed with Raman spectroscopy analysis.
(2)
Secondary microplastics were found in the macrosticky filter, recycled material, and wastewater filter. The particle number increased and average size reduced from the macrostickies to wastewater filter, up to an average of 51 µm in the wastewater.
(3)
High-resolution scanning under visible radiation proved adequate for broad area investigation; however, fractions below 20 µm require further investigation due to limits on the adopted equipment.
(4)
Raman spectroscopy and UV microscopy possess higher resolution and allow the measurement of particles partially covered by cellulose fibres (in the recycled material or in the wastewater filter) or in proximity to the surface.

Supplementary Materials

The supporting information can be downloaded at https://www.mdpi.com/article/10.3390/coatings15111284/s1: Figure S1. Picture representing (a) the RhB-tagged latex and b) the coated substrate. The white frame around the characteristic pink in (b) is the appearance of the uncoated substrate. Table S1. Results for the physical and mechanical of both the uncoated and coated substrates. Figure S2. SEM image of the coated substrate before recyclability testing. The quote highlights the thickness of the coating, which is coherent with the one retrieved from the difference in the grammage (pre- and post-coat). Figure S3. Results for the tensile test of both coated and uncoated samples: (a) Maximum force; (b) Strain at break. Error bars represent standard deviation. (*) Statistically significant (p < 0.05). Figure S4. Schematic representation of the modified procedure according to the UNI 11743:2019 recyclability testing methodology. Figure S5. Raman shift for cellulose fibre, latex, and rhodamine-B at 785 nm laser source. Due to the high fluorescence, the rhodamine-B spectrum was manually scaled down to fit the plot. Figure S6. Fibrous paste composition, as observed at the optical microscope: (a) Bleached softwood; (b) Unbleached softwood; (c) Bleached hardwood; (d) Unbleached hardwood. Figure S7. Fine rejects as visible under stereomicroscopy. Both coating fragments (RhB-coloured particles) and white fibres anchored to the coating are visible. Figure S8. RhB-tagged coating particles: (a) Original image; (b) Colour threshold-identified coating particles (ImageJ). Figure S9. RhB-coloured area as a percentage of the total area of the sample, representing coating fragments. The scans of the samples were obtained using visible radiation techniques at variable resolution. Figure S10. Details of different samples: (a) Wastewater filter; (b) Recycled sheet; (c) Macrostickies filter. Images (d), (e), and (f) represent the wastewater filter, recycled sheet, and macrostickies filter scans processed with ImageJ, respectively. Figure S11. UV microscopy scans and ImageJ threshold area detection at different conditions for both inked and not-inked MS samples. Figure S12. EDX map for wastewater filter, highlighting the broad presence of calcium in areas outside darker spots, representing secondary MPs.

Author Contributions

Conceptualisation, A.M. and B.D.C.; methodology, A.M., M.V.D., and D.B.; validation, M.V.D.; formal analysis, A.M., S.B., D.B., and L.P.; investigation, A.M., S.B., D.B., A.B., A.L., and L.P.; resources, B.D.C.; data curation, A.M.; writing—original draft preparation, A.M., D.B., and M.V.D.; writing—review and editing, A.M. and M.V.D.; visualisation, A.M.; supervision, B.D.C.; project administration, B.D.C.; funding acquisition, B.D.C. All authors have read and agreed to the published version of the manuscript.

Funding

The study was performed under the framework of the funded project Composite materials for packaging applications, MUR PRIN 2022 (BOOMERANG) code 2022WRNTLK—CUP D53D23004230006 CUP MASTER B53D23006530006.

Institutional Review Board Statement

Not applicable.

Informed Consent Statement

Not applicable.

Data Availability Statement

Data available on request. Most data are contained within the article.

Acknowledgments

The authors would like to thank Paolo Tarsini for the help with the fluorescence microscopy, and Eugenio Di Pasquale for the discussions during the early stages of the study.

Conflicts of Interest

Authors Sara Baracani, Daniele Bussini, Alessandra Boschi were employed by the company Innovhub—Stazioni Sperimentali per l’Industria S.r.l. The remaining authors declare that the research was conducted in the absence of any commercial or financial relationships that could be construed as a potential conflict of interest.

References

  1. Rahman, M.M.; Sultan, M.B.; Alam, M. Microplastics and adsorbed micropollutants as emerging contaminants in landfill: A mini review. Curr. Opin. Environ. Sci. Health 2023, 31, 100420. [Google Scholar] [CrossRef]
  2. Ha, J.; Yeo, M.-K. The environmental effects of microplastics on aquatic ecosystems. Mol. Cell. Toxicol. 2018, 14, 353–359. [Google Scholar] [CrossRef]
  3. Roy, P.; Mohanty, A.K.; Misra, M. Microplastics in ecosystems: Their implications and mitigation pathways. Environ. Sci. Adv. 2022, 1, 9–29. [Google Scholar] [CrossRef]
  4. Frias, J.P.G.L.; Nash, R. Microplastics: Finding a consensus on the definition. Mar. Pollut. Bull. 2019, 138, 145–147. [Google Scholar] [CrossRef]
  5. Arthur, C.; Baker, J.E.; Bamford, H.A. Summary of the International Research Workshop on the Occurrence, Effects, and Fate of Microplastic Marine Debris. In Proceedings of the International Research Workshop on the Occurrence, Effects, and Fate of Microplastic Marine Debris, Tacoma, WA, USA, 9–11 September 2008; National Oceanic and Atmospheric Administration: Tacoma, WA, USA, 2009; pp. 7–17. [Google Scholar]
  6. Li, W.C.; Tse, H.F.; Fok, L. Plastic waste in the marine environment: A review of sources, occurrence and effects. Sci. Total Environ. 2016, 566–567, 333–349. [Google Scholar] [CrossRef] [PubMed]
  7. Deng, Y.; Zhang, Y.; Lemos, B.; Ren, H. Tissue accumulation of microplastics in mice and biomarker responses suggest widespread health risks of exposure. Sci. Rep. 2017, 7, 46687. [Google Scholar] [CrossRef]
  8. Hwang, J.; Choi, D.; Han, S.; Choi, J.; Hong, J. An assessment of the toxicity of polypropylene microplastics in human derived cells. Sci. Total Environ. 2019, 684, 657–669. [Google Scholar] [CrossRef]
  9. Leslie, H.A.; van Velzen, M.J.M.; Brandsma, S.H.; Vethaak, A.D.; Garcia-Vallejo, J.J.; Lamoree, M.H. Discovery and quantification of plastic particle pollution in human blood. Environ. Int. 2022, 163, 107199. [Google Scholar] [CrossRef] [PubMed]
  10. Rafiq, A.; Xu, J.-L. Microplastics in waste management systems: A review of analytical methods, challenges and prospects. Waste Manag. 2023, 171, 54–70. [Google Scholar] [CrossRef] [PubMed]
  11. Golwala, H.; Zhang, X.; Iskander, S.M.; Smith, A.L. Solid waste: An overlooked source of microplastics to the environment. Sci. Total Environ. 2021, 769, 144581. [Google Scholar] [CrossRef]
  12. Samanta, P.; Dey, S.; Kundu, D.; Dutta, D.; Jambulkar, R.; Mishra, R.; Ghosh, A.R.; Kumar, S. An insight on sampling, identification, quantification and characteristics of microplastics in solid wastes. Trends Environ. Anal. Chem. 2022, 36, e00181. [Google Scholar] [CrossRef]
  13. Packaging Waste Statistics. Eurostat. Available online: https://ec.europa.eu/eurostat/statistics-explained/index.php?title=Packaging_waste_statistics (accessed on 14 March 2025).
  14. Global Waste Generation. Statista. Available online: https://www.statista.com/study/58790/global-waste-generation/ (accessed on 3 September 2024).
  15. Guo, Y.; Xia, X.; Ruan, J.; Wang, Y.; Zhang, J.; LeBlanc, G.A.; An, L. Ignored microplastic sources from plastic bottle recycling. Sci. Total Environ. 2022, 838, 156038. [Google Scholar] [CrossRef]
  16. Krishnan, R.Y.; Manikandan, S.; Subbaiya, R.; Karmegam, N.; Kim, W.; Govarthanan, M. Recent approaches and advanced wastewater treatment technologies for mitigating emerging microplastics contamination—A critical review. Sci. Total Environ. 2023, 858, 159681. [Google Scholar] [CrossRef] [PubMed]
  17. Brown, E.; MacDonald, A.; Allen, S.; Allen, D. The potential for a plastic recycling facility to release microplastic pollution and possible filtration remediation effectiveness. J. Hazard. Mater. Adv. 2023, 10, 100309. [Google Scholar] [CrossRef]
  18. Kankanige, D.; Babel, S. Contamination by ≥6.5 μm-sized microplastics and their removability in a conventional water treatment plant (WTP) in Thailand. J. Water Process Eng. 2021, 40, 101765. [Google Scholar] [CrossRef]
  19. Marinelli, A.; Diamanti, M.V.; Pedeferri, M.P.; Del Curto, B. Kaolin-Filled Styrene-Butadiene-Based Dispersion Coatings for Paper-Based Packaging: Effect on Water, Moisture, and Grease Barrier Properties. Coatings 2023, 13, 195. [Google Scholar] [CrossRef]
  20. Bakker, S.; Bosveld, L.; Metselaar, G.A.; Esteves, A.C.C.; Schenning, A.P.H.J. Understanding and Improving the Oil and Water Barrier Performance of a Waterborne Coating on Paperboard. ACS Appl. Polym. Mater. 2022, 4, 6148–6155. [Google Scholar] [CrossRef] [PubMed]
  21. Zhang, X.; Zhang, H.; Cheng, Y.; Zhang, L.; Shen, W. Superhydrophobic surfaces with dual-scale roughness and water vapor-barrier property for sustainable liquid packaging applications. Cellulose 2022, 29, 9777–9790. [Google Scholar] [CrossRef]
  22. Ferrer, A.; Pal, L.; Hubbe, M. Nanocellulose in packaging: Advances in barrier layer technologies. Ind. Crops Prod. 2017, 95, 574–582. [Google Scholar] [CrossRef]
  23. Thitsartarn, W.; Jinkarn, T. Water resistance improvement of paperboard by coating formulations based on nanoscale pigments. J. Coat. Technol. Res. 2020, 17, 1609–1617. [Google Scholar] [CrossRef]
  24. Jung, M.R.; Horgen, F.D.; Orski, S.V.; Rodriguez, C.V.; Beers, K.L.; Balazs, G.H.; Jones, T.T.; Work, T.M.; Brignac, K.C.; Royer, S.-J.; et al. Validation of ATR FT-IR to identify polymers of plastic marine debris, including those ingested by marine organisms. Mar. Pollut. Bull. 2018, 127, 704–716. [Google Scholar] [CrossRef]
  25. Imasha, H.U.E.; Babel, S. Microplastics contamination in the green mussels (Perna viridis) cultured for human consumption in Thailand. Reg. Stud. Mar. Sci. 2023, 67, 103203. [Google Scholar] [CrossRef]
  26. Idowu, G.A.; Olanipekun, O.O.; Adelodun, A.A.; Gbadamosi, O.K.; Adu, B.W.; Aiyesanmi, A.F. Meso- and micro-plastics contamination of water, sediments and fish species in coastal communities of Ondo State, Nigeria. Reg. Stud. Mar. Sci. 2024, 77, 103727. [Google Scholar] [CrossRef]
  27. Chi, K.; He, J.; Lin, W.-S.; Bokhari, S.M.Q.; Catchmark, J.M. Electrostatically Complexed Natural Polysaccharides as Aqueous Barrier Coatings for Sustainable and Recyclable Fiber-Based Packaging. ACS Appl. Mater. Interfaces 2023, 15, 12248–12260. [Google Scholar] [CrossRef]
  28. Bugnicourt, E.; Schmid, M.; Nerney, O.M.; Wildner, J.; Smykala, L.; Lazzeri, A.; Cinelli, P. Processing and validation of whey-protein-coated films and laminates at semi-industrial scale as novel recyclable food packaging materials with excellent barrier properties. Adv. Mater. Sci. Eng. 2013, 2013, 496207. [Google Scholar] [CrossRef]
  29. Bakker, S.; Kloos, J.; Metselaar, G.A.; Catarina, A.; Esteves, A.C.C.; Schenning, P.H.J. About Gas Barrier Performance and Recyclability of Waterborne Coatings on Paperboard. Coatings 2022, 12, 1841. [Google Scholar] [CrossRef]
  30. Lee, T.J.; Yoon, C.; Ryu, J.Y. A new potential paper resource; recyclability of paper cups coated with water-soluble polyacrylate-based polymer. Nord. Pulp Pap. Res. J. 2017, 32, 155–161. [Google Scholar] [CrossRef]
  31. UNI 11743:2019; Carta e Cartone—Determinazione dei Parametri di Riciclabilità di Materiali e Prodotti a Prevalenza Cellulosica. UNI: Milano MI, Italy, 2019. Available online: https://store.uni.com/uni-11743-2019 (accessed on 2 July 2019).
  32. Cepi. Harmonised European Laboratory Test Method to Generate Parameters Enabling the Assessment of the Recyclability of Paper and Board Products in Standard Paper and Board Recycling Mills. 2022. Available online: https://www.cepi.org/cepi-recyclability-test-method-version-2/ (accessed on 3 August 2023).
  33. Toczyłowska-Mamińska, R. Limits and perspectives of pulp and paper industry wastewater treatment—A review. Renew. Sustain. Energy Rev. 2017, 78, 764–772. [Google Scholar] [CrossRef]
  34. Allender, B.; Covey, G.; Shore, D. Low-effluent Recycled Paper Mills. Appita Technol. Innov. Manuf. Environ. 2010, 63, 186–194. [Google Scholar]
  35. ASTM D8333-20; Standard Practice for Preparation of Water Samples with High, Medium, or Low Suspended Solids for Identification and Quantification of Microplastic Particles and Fibers Using Raman Spectroscopy, IR Spectroscopy, or Pyrolysis-GC/MS. Available online: https://store.astm.org/d8333-20.html (accessed on 20 October 2025).
  36. BSI PD CEN ISO/TR 21960:2020; Plastics—Environmental Aspects—State of Knowledge and Methodologies. Available online: https://bsol.bsigroup.com/Bibliographic/BibliographicInfoData/000000000030379025 (accessed on 20 October 2025).
  37. Tong, H.; Jiang, Q.; Zhong, X.; Hu, X. Rhodamine B dye staining for visualizing microplastics in laboratory-based studies. Environ. Sci. Pollut. Res. 2021, 28, 4209–4215. [Google Scholar] [CrossRef]
  38. Purington, E.; Blakeley, A.R.; Bousfield, D.; Gramlich, W.M. Visualization of latex and starch in paper coatings by tagging with fluorescent dyes. Nord. Pulp Pap. Res. J. 2017, 32, 395–406. [Google Scholar] [CrossRef]
  39. Erni-Cassola, G.; Gibson, M.I.; Thompson, R.C.; Christie-Oleza, J.A. Lost, but Found with Nile Red: A Novel Method for Detecting and Quantifying Small Microplastics (1 mm to 20 μm) in Environmental Samples. Environ. Sci. Technol. 2017, 51, 13641–13648. [Google Scholar] [CrossRef]
  40. Kwon, S.; Oh, K.; Shin, S.J.; Lee, H.L. Effects of hydroxyethyl methacrylate comonomer in styrene/acrylate latex on coating structure and printability. Prog. Org. Coat. 2020, 147, 105862. [Google Scholar] [CrossRef]
  41. Kugge, C.; Johnson, B. Improved barrier properties of double dispersion coated liner. Prog. Org. Coat. 2008, 62, 430–435. [Google Scholar] [CrossRef]
  42. Mesic, B.B.; Cairns, M.; Järnstrom, L.; Le Guen, M.J.; Parr, R. Film formation and barrier performance of latex based coating: Impact of drying temperature in a flexographic process. Prog. Org. Coat. 2019, 129, 43–51. [Google Scholar] [CrossRef]
  43. Aticelca. Sistema di Valutazione 501:2023—Valutazione del Livello di Riciclabilità di Materiali e Prodotti a Prevalenza Cellulosica Sulla Base Della Norma UNI 11743:2019. 2023. Available online: https://www.aticelca.it/1/wp-content/uploads/2024/11/Sistema-di-valutazione-501-2023.pdf (accessed on 12 December 2024).
  44. Sears, W.M.; Hunt, J.L.; Stevens, J.R. Raman scattering from polymerizing styrene. I. Vibrational mode analysis. J. Chem. Phys. 1981, 75, 1589–1598. [Google Scholar] [CrossRef]
  45. Barroso-Solares, S.; Mediavilla-Martinez, I.; Sanz-Velasco, C.; Prieto, A.C.; Pinto, J. Pigments identification and analysis of the state of conservation of the decorative elements of the castle of Coca (XV-XVI AC, Segovia, Spain) by Raman Spectroscopy. J. Phys. Conf. Ser. 2022, 2204, 012010. [Google Scholar] [CrossRef]
  46. Kukkola, A.T.; Senior, G.; Maes, T.; Silburn, B.; Bakir, A.; Kröger, S.; Mayes, A.G. A large-scale study of microplastic abundance in sediment cores from the UK continental shelf and slope. Mar. Pollut. Bull. 2022, 178, 113554. [Google Scholar] [CrossRef] [PubMed]
  47. Bakir, A.; Desender, M.; Wilkinson, T.; Van Hoytema, N.; Amos, R.; Airahui, S.; Graham, J.; Maes, T. Occurrence and abundance of meso and microplastics in sediment, surface waters, and marine biota from the South Pacific region. Mar. Pollut. Bull. 2020, 160, 111572. [Google Scholar] [CrossRef] [PubMed]
  48. Steinfeld, F.; Kersten, A.; Schabel, S.; Kerpen, J. Microplastics in German paper mills’ wastewater and process water treatment plants: Investigation of sources, removal rates, and emissions. Water Res. 2025, 271, 123016. [Google Scholar] [CrossRef]
  49. Yli-Rantala, E.; Pham, T.; Sarlin, E.; Kokko, M. Extraction and analysis of microplastics in wastewater sludges of a multi-product pulp and paper mill. Environ. Pollut. 2024, 363, 125251. [Google Scholar] [CrossRef]
  50. Colakoglu, E.B.; Uyanik, I.; Elbir, H.; Sahinkaya, E.; Yurtsever, A. A novel gravity-driven dynamic membrane filtration reactor for microplastic removal from plastic recycling facility wastewater. J. Environ. Chem. Eng. 2025, 13, 115793. [Google Scholar] [CrossRef]
  51. Regulation (EU) 2025/40 of the European Parliament and of the Council of 19 December 2024 on Packaging and Packaging Waste, Amending Regulation (EU) 2019/1020 and Directive (EU) 2019/904, and Repealing Directive 94/62/EC. European Parliament and Council. Available online: https://eur-lex.europa.eu/eli/reg/2025/40/oj/eng (accessed on 27 January 2025).
  52. Ta, A.T.; Pupuang, P.; Babel, S.; Wang, L.P. Investigation of microplastic contamination in blood cockles and green mussels from selected aquaculture farms and markets in Thailand. Chemosphere 2022, 303, 134918. [Google Scholar] [CrossRef] [PubMed]
  53. Murphy, L.; Germaine, K.; Kakouli-Duarte, T.; Cleary, J. Assessment of microplastics in Irish river sediment. Heliyon 2022, 8, e09853. [Google Scholar] [CrossRef]
  54. Marinelli, A.; Papile, F.; Del Curto, B. Coated Paper-Based Packaging Waste: Investigation on Sensorial Properties Affecting the Material Class Perception. Sustainability 2023, 15, 16474. [Google Scholar] [CrossRef]
  55. Marinelli, A.; Lyytikäinen, J.; Tanninen, P.; Del Curto, B.; Leminen, V. Barrier, converting, and tray-forming properties of paperboard packaging materials coated with waterborne dispersions. Packag. Technol. Sci. 2023, 37, 149–165. [Google Scholar] [CrossRef]
  56. Marinelli, A.; Profaizer, M.; Diamanti, M.V.; Pedeferri, M.; Del Curto, B. Heat-Seal Ability and Fold Cracking Resistance of Kaolin-Filled Styrene-Butadiene-Based Aqueous Dispersions for Paper-Based Packaging. Coatings 2023, 13, 975. [Google Scholar] [CrossRef]
  57. Devisetti, S.; Lempsink, G.; Malla, P.B. Use of kaolin clay in aqueous barrier coating applications. TAPPI J. 2023, 22, 685–697. [Google Scholar] [CrossRef]
  58. Ovaska, S.-S.; Sami-Seppo, K.; Lyytikäinen, J.; Hirn, U.; Backfolk, K. Determination of Repulpability of Talc-Filled Biopolymer Dispersion Coatings and Optimization of Repulped Reject for Improved Material Efficiency by Tailoring Coatings. In Proceedings of the Tappi PaperCon 2017 Proceedings, Minneapolis, MN, USA, 23–26 April 2017; pp. 36–48. [Google Scholar]
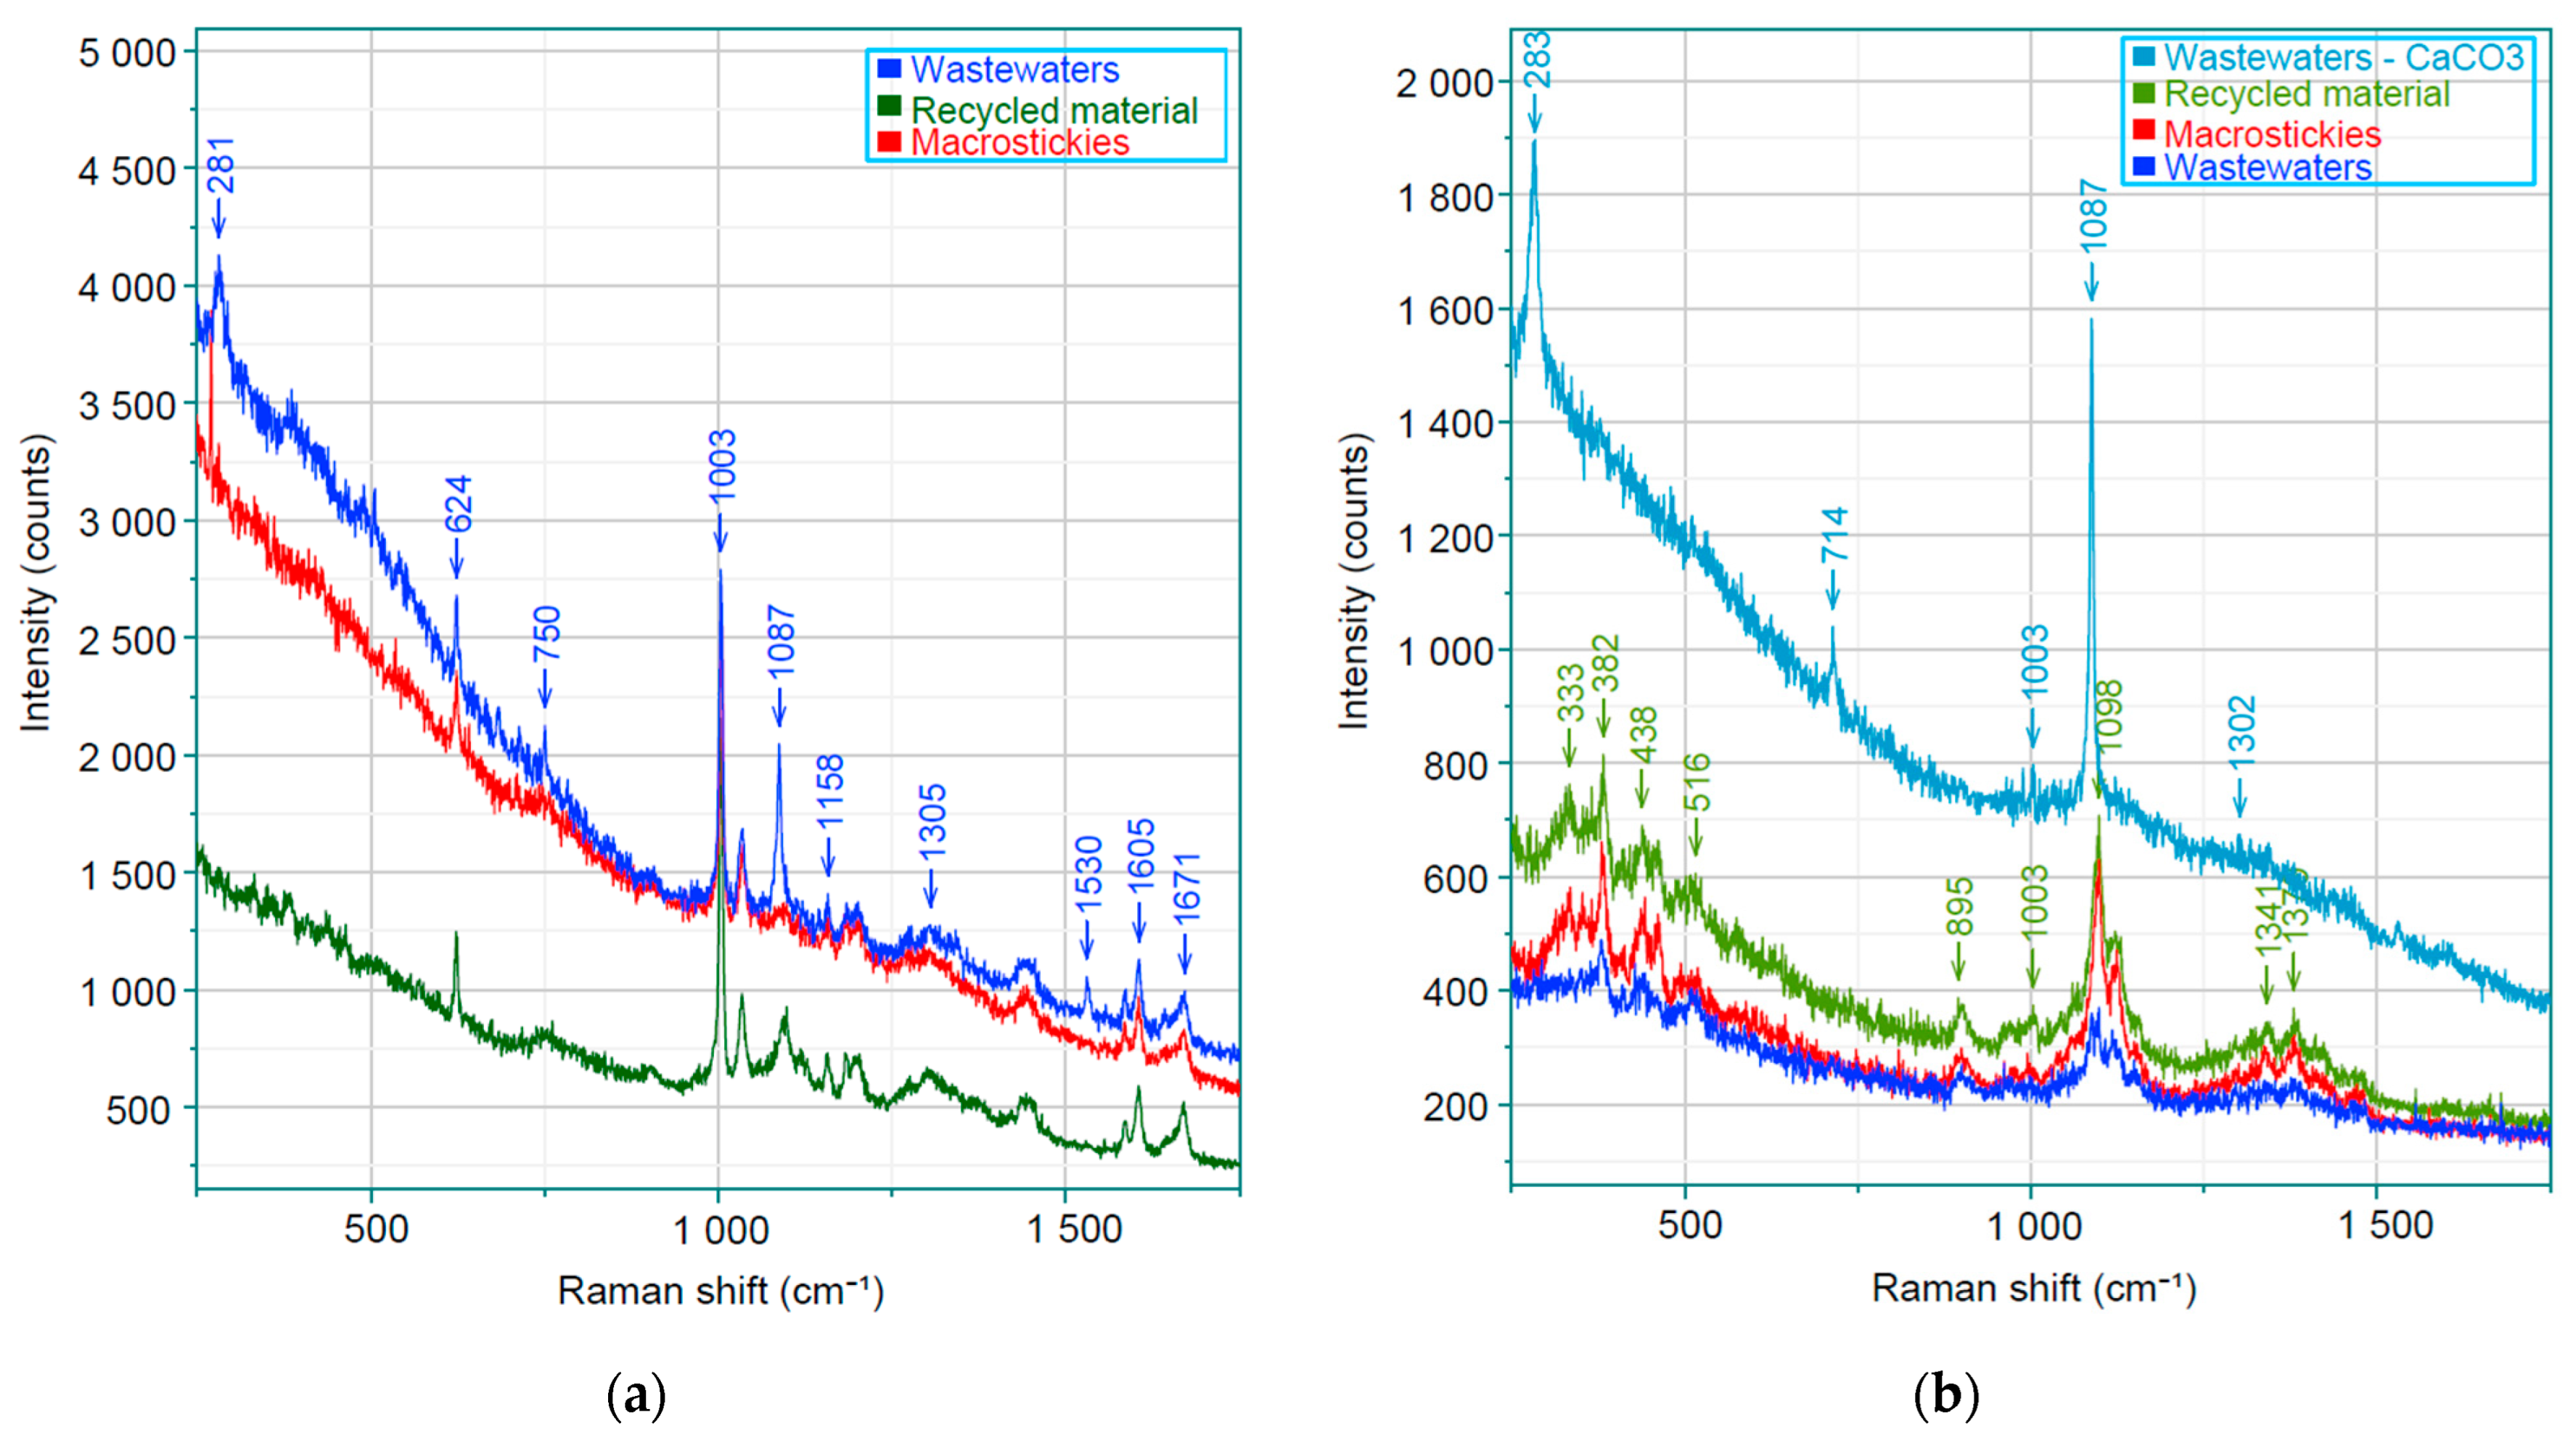
Figure 1. Raman spectra of (a) rhodamine-B-tagged coating particles from the wastewater filter, recycled material, and macrosticky filter; and (b) fibres from the wastewater filter, recycled material, and macrosticky filter. The wastewater–CaCO3 spectrum was manually scaled down to fit the plot.
Coatings 15 01284 g001
Figure 2. Raman spectroscopy (785 nm) and fluorescence (532 nm) mapping of RhB-tagged latex particles and substrate fibres. (a) Latex and fibre (785 nm) and rhodamine-B (532 nm) mapping using 50× objective. The latex signal was proportional to the peak intensity (990–1020 cm−1), similar to the fibre signal (1070–1170 cm−1). (b) Rhodamine-B, measured as area intensity (685–1775 cm−1) and mapped at high resolution (50 × 50, 4 µm resolution) using a 10× objective (laser source: 532 nm, 0.01 mW source power, 0.2 s acquisition time, two accumulations).
Coatings 15 01284 g002
Figure 3. Particle equivalent diameter distribution curves for 1800 dpi scans of the wastewater filter, recycled sheet, and macrosticky filter.
Coatings 15 01284 g003
Figure 4. Particle equivalent diameter distribution curves for 1800 dpi scans of the wastewater filter, recycled sheet, and macrosticky filter: (a) representation as the fraction of total MPs of the sample; (b) absolute number of detected particles.
Coatings 15 01284 g004aCoatings 15 01284 g004b
Figure 5. SEM micrographs of different samples. (a) Secondary electron and (b) backscattered electron micrographs of recycled paper. (c) White deposits on the MP surface of recycled paper enclosed in red rectangles. Fibre braiding partially overlies secondary MPs. (d) Secondary electron micrograph of MS filter. (e) Secondary electron micrograph of wastewater filter.
Coatings 15 01284 g005
Table 1. Recycling test results according to the modified methodology of UNI 11743:2019.
ParametersUncoated SubstrateCoated Substrate
Coarse Rejects [%]<0.1<0.1
Area of Macrostickies < 2000 µm [mm2/kg]250272,740
Fiber Flakes [%]0.23.8
Recycled sheets—Adhesion testNot detectableNot detectable
Recycled sheets—Optical inhomogeneityLevel 1Level 2 1
Assessment of recyclability according to Aticelca 501:2023 evaluation systemLEVEL A+NOT RECYCLABLE with paper
1 Due to the presence of rhodamine-B.
Table 2. Images acquired with fluorescence microscopy. Average area (± standard deviation) covered by RhB-tagged particles.
SampleArea (%)
Macrostickies—Not inked5.67 ± 4.98
Macrostickies—Inked4.28 ± 4.04
Recycled material sheet10.01 ± 2.81
Filtered waters4.59 ± 0.95
Table 3. Advantages and disadvantages of the investigation techniques involved in this work.
TechniqueProsCons
Visible scanning imaging
-
Fast and cheap
-
Analysis of large areas (up to dm2)
-
Suitable only for coloured (visible light) tagging species
-
Quite low resolution—depends on device specs
-
Fibres might partially or totally cover MPs
Fluorescence microscopy
-
Fast analysis
-
MPs underneath fibres are identified
-
Suitable only for fluorescent species
-
Scanned area up to cm2
Raman spectroscopy
-
MPs underneath fibres are identified
-
Maximum resolution
-
Chemical species can be identified
-
Also suitable for fluorescence analysis
-
Time-intensive for mapping at 785 nm
-
Scanned area up to hundreds of µm2
SEM-EDX
-
Broadly variable scanned area
-
Possible tagging substance identification
-
Need to know the chemistry of the system
Table 4. Sample preparation, analysis techniques, and MP dimension of outbound waters or sludges at recycling facilities.
Ref.FocusSample PreparationAnalysis TechniquesMP Dimensions
This workTracking MPs generated at lab scale during recycling processCoating tagging with RhBVisible light imaging, Raman spectroscopy and fluorescence mapping/microscopyMainly <100 μm;
Lower limit: 15 μm
[48]Outbound wastewater analysis of paper mills in GermanyOxidative treatment + density separationμ-Raman spectroscopyMainly <100 μm; Fraction >500 μm was negligible
Lower limit: 20 μm
[49]Sludges from a multi-purpose paper mill in FinlandChemical-enzymatic digestion + density separationRaman spectroscopyMainly <200 μm
Lower limit: 20 μm
[17]Outbound wastewater analysis of plastic recycling facilities in the United KingdomDigestion + Nile Red taggingFluorescence microscopyMainly <10 μm
Lower limit: 2.6 μm
[50]Outbound wastewater and sludge analysis of plastic recycling facilities in TürkiyeDensity separationOptic microscopeMainly <250 μm
Lower limit: 45 μm
Disclaimer/Publisher’s Note: The statements, opinions and data contained in all publications are solely those of the individual author(s) and contributor(s) and not of MDPI and/or the editor(s). MDPI and/or the editor(s) disclaim responsibility for any injury to people or property resulting from any ideas, methods, instructions or products referred to in the content.