Abstract
This study presents numerical simulations of ice crystal accretion on aircraft surfaces under mixed-phase icing conditions, where ice crystals coexist with supercooled water droplets. The Finite Element Navier–Stokes Analysis Program (FENSAP-ICE) suite, incorporating the Discrete Roughness Optimization Program in 3D (DROP3D) and Ice Accretion Simulation in 3D (ICE3D) solvers, was applied to the Common Research Model with Natural Laminar Flow (CRM-NLF) to examine the effects of crystal size, aspect ratio, and concentration on ice growth. The results show that the presence of ice crystals produces smoother, more uniform, and substantially thicker ice compared with droplet-only cases, where distinct horns and roughness dominate. At peak growth locations, the predicted ice thickness increases by up to 75% under mixed-phase conditions. Quantitative analyses reveal that increasing crystal diameter from 50 μm to 200 μm raises ice growth by 25%–75%, increasing aspect ratios from 0.05 to 1 increases growth by 20%–75%, and raising concentrations from 0.25 to 2 kg/m3 enhances growth by nearly 450%. These findings demonstrate the critical role of ice crystals in promoting layered ice accumulation, clarify the mechanisms driving mixed-phase icing, and provide theoretical guidance for advancing anti-icing and de-icing technologies in aviation.
1. Introduction
Aircraft icing remains a significant challenge in the fields of aviation safety, aerodynamics, and aircraft performance. When supercooled water droplets in the atmosphere come into contact with the aircraft surface, they freeze upon impact, forming ice layers that degrade the aerodynamic efficiency of the airframe and, in severe cases, may lead to catastrophic flight accidents [1]. Over the years, extensive research has been conducted to elucidate the mechanisms of ice formation, its effects on flight dynamics, and the development of preventive and mitigation strategies. Investigations into aircraft icing play a crucial role in ensuring aviation safety and operational efficiency [2,3].
The importance of studying aircraft icing extends beyond safety considerations [4]; it also holds substantial economic significance by reducing the need for de-icing and anti-icing measures, thereby minimizing maintenance costs and flight delays for airlines. Furthermore, as the aviation industry expands into colder regions and high-altitude environments, understanding and mitigating icing risks have become increasingly vital [5].
The primary impacts of aircraft icing include alterations to wing geometry, leading to increased drag and reduced lift. Studies have shown that even minimal ice accretion can significantly impair the aircraft’s ability to generate sufficient lift [6]. Ice accumulation on control surfaces may result in reduced responsiveness, increased stall speeds, and potential jamming of these surfaces. In addition, icing can obstruct pitot tubes, static ports, and other flight instruments, causing inaccurate readings and malfunctions of flight systems. Ice formation within engine inlets and on fan blades can decrease thrust efficiency and, under extreme conditions, lead to engine flameouts [7]. Excessive ice buildup also increases structural loads and may cause damage, particularly in rotorcraft and small aircraft.
Given these risks, regulatory authorities such as the Federal Aviation Administration (FAA) and the European Union Aviation Safety Agency (EASA) have established stringent certification standards to ensure that aircraft can operate safely in known icing conditions [8]. Nevertheless, due to the multi-scale, interdisciplinary, and coupled complexity of aircraft icing phenomena [9], a comprehensive understanding of the evolution and development mechanisms of ice structures during actual flight remains limited.
With the expansion of the aviation industry into cold regions and high-altitude areas, research on aircraft icing has advanced significantly. Scientists have gained a deeper understanding of the mechanisms of ice formation. They have also studied how icing affects the aerodynamic performance of airframes. In addition, new de-icing and anti-icing technologies have been developed. For example, Myles Morelli et al. [10] proposed an approach for updating the moving ice boundary generated during aircraft icing simulations by employing radial basis function (RBF) mesh deformation techniques. The control points selected near the region of ice accumulation demonstrated the effectiveness of this method for local deformation, and the results indicated that RBF mesh deformation is well-suited for both two-dimensional and three-dimensional problems. Brun et al. [11] calculated the water collection efficiency at the leading edge of a NACA0012 airfoil using the Lagrangian method. Zhihong Zhou et al. enhanced the computational efficiency of the Lagrangian method by introducing a target diffusion tracking approach. The Eulerian method was first proposed by Durst et al. [12], treating droplets as a continuous phase and solving the governing equations of the droplet phase to obtain impact characteristics.
Yihua Cao et al. [13] developed a three-dimensional numerical simulation method for aircraft wing icing based on Eulerian two-phase flow theory and an extended heat transfer model. This method showed better agreement with experimental data and allowed for separate investigation and analysis of the effects of various meteorological parameters on ice formation. Potapczuk et al. [14] were the first to apply the Reynolds-Averaged Navier–Stokes (RANS) method to calculate the aerodynamic characteristics of a two-dimensional multi-element airfoil after ice accretion. Marongiu et al. [15] simulated the aerodynamic performance of the NLF-0414 airfoil with horn-shaped ice using both the Spalart–Allmaras (S–A) and Shear Stress Transport (SST) turbulence models, revealing that the SST model provided more accurate results under strong flow separation conditions. Raj et al. [16] investigated the aerodynamic characteristics of a multi-element airfoil under supercooled large droplet (SLD) icing scenarios. Flow field analysis indicated that with increasing mean effective droplet diameter, ice accumulation intensified, flow separation and reattachment phenomena became more pronounced, and ice blockage at the junctions of multi-element wings could easily lead to control surface jamming. D.I. Ignatyev et al. [17] conducted a wind tunnel study on the longitudinal steady and unsteady aerodynamic characteristics of a transport aircraft under icing conditions. Their research demonstrated that the shape of the ice accretion reduced the stall angle of attack, decreased the maximum lift coefficient, and impaired airflow stability.
Many studies have explored aircraft icing caused by supercooled liquid droplets and achieved important progress. However, the role of ice crystals is still not well understood, especially their effect on the icing process and aircraft aerodynamics. In cold regions, ice crystals often coexist with supercooled droplets in the atmosphere. They can form either through the direct condensation of water vapor or by the freezing of droplets. The size, concentration, and shape of ice crystals influence how fast they settle and how they are distributed in the air. During severe weather events, such as blizzards or blowing snow, large numbers of ice crystals can appear. This makes the aircraft icing process more complex and less predictable.
This study focuses on understanding aircraft icing when ice crystals and supercooled droplets exist together. It analyzes the ice accretion process in complex weather conditions. The interaction between ice crystals and droplets during icing was examined. Based on this, the features of ice formation were identified. The effect of ice crystals on aircraft aerodynamic performance was also studied in detail. The findings expand knowledge of icing processes in severe environments. They also provide theoretical guidance for improving anti-icing technologies in aviation.
2. Numerical Method
2.1. Simulation Process
Numerical simulations are now a key method for studying how ice forms on aircraft surfaces. They allow researchers to predict ice shapes with good accuracy and efficiency. This is especially useful when examining icing behavior under complex weather conditions [18]. Among the available tools, FENSAP-ICE [19,20,21] is one of the most widely used. It has been applied in many studies because of its strong ability to model ice accretion.
In this study, the FENSAP-ICE tool is used to predict ice formation on the surface of the Common Research Model with Natural Laminar Flow (CRM-NLF). The goal is to examine how ice develops on the aircraft and how it affects aerodynamic performance under complex weather conditions. The numerical simulation steps followed in this work are shown in Figure 1 [18].
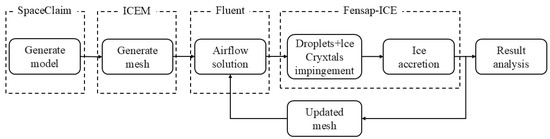
Figure 1.
Numerical simulation calculation process.
2.2. Airflow Solution
The airflow solution is obtained using Fluent 2022R1 software. To address the aerodynamic problem, the Fluent solver employs the continuity equation, the momentum equation, and the energy equation. The governing equations are presented in Equations (1)–(3) [22].
The continuity equation is expressed as follows:
where represents time, is the airflow velocity vector, and denotes air density.
The momentum equation is given as follows:
where represents the components of the stress tensor, and is the gravitational acceleration vector.
The energy equation is expressed as follows:
where is the internal energy of air, and is the enthalpy of air.
The Spalart–Allmaras (S–A) turbulence model is a widely applied one-equation model, developed by Philippe Spalart and Serge Allmaras in 1992. It was originally designed to simulate boundary layer flows in aerospace and external aerodynamics, particularly in shear layers and free-stream regions [22]. The model is valued for its simplicity, robustness, and relatively low computational cost, which makes it attractive for large-scale aerodynamic simulations where flow–structure or flow–icing coupling already demands significant resources.
The S–A model predicts turbulent viscosity through a single transport equation for the kinematic eddy viscosity. This formulation is less complex than two-equation models such as - or -, which can sometimes yield higher accuracy in flows with strong separation or complex turbulence structures. However, the S–A model remains popular because of its efficiency and stability for external aerodynamic flows.
Despite these advantages, the model has limitations in the context of icing. Ice accretion can introduce surface roughness and lead to large-scale separation, where the baseline S–A model may not perform well without modifications. In practice, turbulence roughness corrections are often applied when using S–A for icing simulations, but this detail is sometimes omitted. Without such clarification, the description of the model may overstate its predictive accuracy for icing-specific aerodynamics.
The Spalart–Allmaras model defines turbulent viscosity and its transport equation as shown in Equations (4) and (5).
Here is the density, and is the turbulent kinematic viscosity. is the viscous damping function. represents the production of turbulent viscosity, while accounts for its destruction. and are constants of the model. is the molecular kinematic viscosity. is a user-defined source term [17].
2.3. Droplet and Crystal Field Solution
The DROP3D solver in FENSAP-Ice is used to simulate the collision of droplets and ice crystals with solid surfaces. For both particle types, it assumes thermal equilibrium between droplets and ice crystals by default. As a result, the equations for the two dispersed phases are solved independently [22]. The solver applies an Eulerian framework to describe how droplets and ice crystals move in the flow field.
The governing equations include the continuity and momentum equations, as shown in Equations (6) and (7).
The continuity equation is given as follows:
The momentum equation is expressed as follows:
where and represent the particle volume fraction and the mean velocity of the dispersed phase, respectively. represents the particle inertia parameter, while is the drag coefficient. The symbol refers to the Froude number.
In the DROP3D solver, droplet drag is calculated under the assumption that droplets are spherical. The drag model for droplets is expressed in Equation (8).
The drag coefficient () of a droplet depends on the Reynolds number () When is greater than 250, the droplet undergoes deformation and no longer maintains a spherical geometry. In modeling the drag of ice crystals, the particles are typically treated as rigid spheres for simplicity. The governing drag formulation for ice crystals is expressed in Equation (9) [22].
The drag coefficients for ice crystals are determined using an assumed aspect ratio of 0.05. These coefficients are still applicable when the aspect ratio increases beyond 0.5 [22].
2.4. Calculation of Ice Accretion Shapes
The ICE3D module of FENSAP-ICE is employed to calculate ice accretion shapes. It utilizes input from the DROP3D solver to simulate ice growth, which is determined by the collection efficiency of droplets and ice crystals on solid surfaces. The governing partial differential equations for mass conservation and energy transfer in ICE3D are presented in Equations (10) and (11).
The corresponding equation for the surface water film is expressed as follows:
In these formulations, denotes the density of the surface water film, is the film thickness, and represents the velocity of the film. The freestream velocity is expressed as while the liquid water content () and the droplet collection efficiency () characterize the amount of water available for accretion. The terms and correspond to the evaporation and freezing rates, respectively.
Based on these definitions, the governing equation for energy conservation in the water film can be written as follows:
On the right-hand side of the equation, the first three terms correspond to heat transfer from the impingement of supercooled droplets, evaporation, and ice accretion.The remaining terms represent radiative, convective, and one-dimensional conductive heat fluxes. In this context, is the specific heat capacity of the surface water film, is the equilibrium temperature at the interface between air, water film, ice, and wall, and denotes the droplet impact velocity. The symbol refers to the heat flux supplied for anti-icing protection. To complete the formulation, compatibility conditions are introduced.
These conditions, derived from physical considerations, are expressed as follows [23]:
These constraints guarantee that the model does not predict the presence of liquid water when the equilibrium temperature falls below 0 °C, and that ice formation is prevented when the film temperature rises above this threshold. The NTI module within FENSAP is employed to examine the impact and adhesion characteristics of ice crystals. Upon striking cold surfaces, ice crystals generally bounce off and continue along the flow path.
The NTI module within FENSAP is employed to examine the impact and adhesion characteristics of ice crystals. Upon striking cold surfaces, ice crystals generally bounce off and continue along the flow path; however, upon striking wet surfaces, they may partially adhere. The rebound and adhesion processes are influenced by the normal velocity (), the thickness of the liquid film (), and the particle diameter (). To characterize this phenomenon, a rebound coefficient is introduced as a function:
In rime ice regions, ice crystals completely rebound (). In contrast, in glaze ice regions, some ice crystals adhere to the surface, while in liquid film regions, the ice crystals fully adhere (). A critical velocity is defined as . When , ice crystals partially rebound, whereas they fully rebound when .
3. Establishment of the Icing Model for Aircraft
3.1. Flow Field Domain and Mesh
In aircraft icing simulations, the nose, wing leading edge, and wing-fuselage junction are subject to the greatest load variations and are most susceptible to ice accumulation. Accordingly, this study concentrates on the numerical analysis of these three key regions—the symmetric fuselage section and the inner and outer portions of the wings—to examine the ice accretion process in detail.
The Common Research Model with Natural Laminar Flow (CRM-NLF), a high-lift general research configuration, was selected for this study, with a fuselage length (L) of 1.185 m. The experimental test of the NASA Common Research Model with Natural Laminar Flow wing was completed in the fall of 2018. The aircraft model was positioned 15 L upstream of the flow field inlet and 30 L downstream of the outlet, with a distance of 7.5 L between the aircraft and the lateral boundaries of the computational domain, as illustrated in Figure 2a. The inlet was defined as a velocity inlet, and the outlet as a pressure outlet. The aircraft surfaces were set as no-slip boundaries. The turbulence intensity was maintained at its default setting, while the turbulence length scale was specified as 1.185 m.
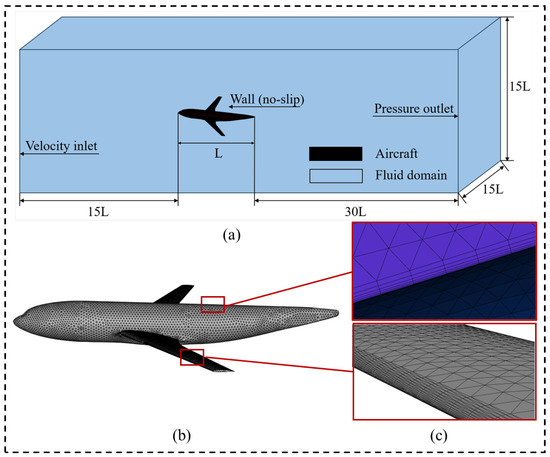
Figure 2.
Computational domain: (a) overall domain, (b) aircraft, and (c) mesh details.
Mesh refinement was applied in key regions such as the nose, the leading edge of the wing, and the wing-fuselage junction, as shown in Figure 2b,c.
3.2. Mesh Independence Verification
The mesh size significantly affects the simulation results. To examine this effect, we tested five different mesh densities. For each case, we calculated the lift force (Lift) and the mass of ice per unit surface area (Ice Growth), as shown in Figure 3.
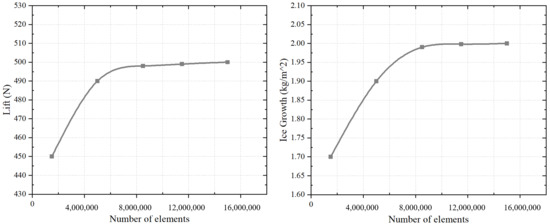
Figure 3.
Lift forces and Ice Growth versus number of elements.
As shown in Figure 3, both lift and ice growth converge with increasing mesh density. The lift approaches approximately 500 N, while the ice growth stabilizes at around 2 kg/m2. When the mesh contains approximately 11.5 million elements, a mesh quality of 0.92 is achieved, as illustrated in Figure 2b.
3.3. Alpha Sweep Numerical Simulation
In October 2018, a test was conducted on the NASA Common Research Model with a Natural Laminar Flow (CRM-NLF) semispan wing at the NASA Langley National Transonic Facility (NTF). The primary objective was to assess the extent of laminar flow on the CRM-NLF wing across different Reynolds numbers and test conditions. Measurements were collected at chord Reynolds numbers ranging from 10 to 30 million and Mach numbers between 0.84 and 0.86. This study provided important guidance for laminar flow testing procedures within the NTF and contributed significantly to the development of a carbon-based heating layer technique, enhancing the quality of transition visualization using temperature-sensitive paint (TSP) in a cryogenic wind tunnel.
Based on the experimental data, Alpha Sweep and Reynolds Sweep numerical simulations were carried out for validation. The numerical results demonstrated excellent agreement with the experimental measurements.
At a fixed Mach number and free-stream dynamic pressure (), the lift coefficient (), drag coefficient (), and pitching moment coefficient () were evaluated by varying the angle of attack (Alpha) to analyze changes in the aerodynamic performance of the aircraft. The environmental parameters are listed in Table 1, and the validation results are shown in Figure 4.

Table 1.
Parameter settings for simulating variation law of torque coefficient.
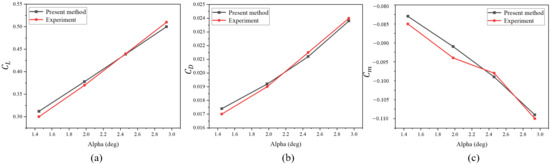
Figure 4.
The influence of the Angle of attack on aerodynamic performance: (a)
, (b)
and (c)
.
The results indicate that within the angle of attack range from approximately 1.4° to 3°, the lift coefficient (), drag coefficient (), and pitching moment coefficient () all exhibit significant variations with increasing angle of attack. The lift coefficient () increases linearly from about 0.31 to 0.50, demonstrating the wing’s strong lift response capability. The drag coefficient () shows a slight increase from approximately 0.0174 to 0.0238 with increasing angle of attack, reflecting the typical characteristic of induced drag rising alongside lift generation. The pitching moment coefficient () decreases linearly from around –0.083 to –0.109, indicating that a larger tail balancing moment is required as the angle of attack increases, which aligns with the design principles of conventional aircraft longitudinal stability.
Overall, the angle of attack has a pronounced effect on aerodynamic performance, particularly evident in the linear trends observed for both and , reflecting the model’s excellent lift-generating capability and stability characteristics.
3.4. Sweep Numerical Simulation
Under approximately constant Mach number and angle of attack, the Reynolds number () was varied by adjusting pressure and temperature. The same aerodynamic parameters—lift coefficient (), drag coefficient (), and pitching moment coefficient ()—were measured to investigate the influence of Reynolds number on aerodynamic performance. The environmental parameters are listed in Table 2, and the verification results are shown in Figure 5.
Table 2.
Parameter settings for simulating variation law of torque coefficient.
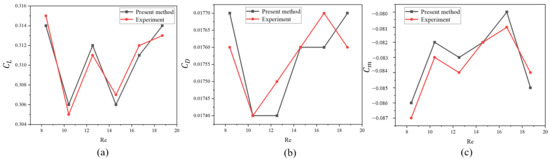
Figure 5.
The influence of the Re on aerodynamic performance: (a)
, (b)
and (c)
.
The results indicate that both exhibit slight fluctuations as Re increases but remain relatively stable in trend. The variation in is minimal, suggesting that the Reynolds number has little influence on the pitching moment at this angle of attack. When Re increases from approximately 10 to 20 with the angle of attack fixed at 1.423°, the lift coefficient remains steady at around 0.30–0.31, indicating that shows minimal fluctuation within the range of 0.0174–0.0177, implying that the transition between turbulent and laminar boundary layers has not significantly changed. The pitching moment coefficient remains stable between –0.080 and –0.086, suggesting that changes in Reynolds number have a limited effect on longitudinal stability.
At small angles of attack, the influence of Reynolds number on lift, drag, and pitching moment coefficients is relatively minor, indicating that the wing design exhibits consistent aerodynamic performance across varying flow scales. The model demonstrates favorable lift generation capability and pitch stability while maintaining adaptability to changes in Reynolds number, making it suitable for subsonic cruise design analysis.
4. Results and Discussion
The icing process consists of two distinct stages: droplet impingement and droplet freezing. Upon impact with a solid surface, droplets generally undergo five phases: spreading [24], shrinking [25], oscillating [26], splashing [27], and recoiling [28] adhering [29]. Adhered droplets tend to form a liquid film that spreads downstream under the influence of high-speed airflow. This liquid film freezes as it exchanges heat with the solid surface via conduction and with the surrounding air via convection.
The freezing process can be categorized into five stages according to temperature transition characteristics: liquid cooling [30], nucleation [31], recalescence [32], solidification [33], and solid cooling [34]. Ice crystals exert a significant influence on the spatial distribution of ice accumulation on aircraft surfaces and play distinct roles during both droplet impingement and freezing stages. Extending prior research on aircraft icing, recent studies have provided new insights into the interactions between ice crystals and droplets throughout the icing process.
When ice crystals collide with the liquid film, they can induce secondary droplet splashing, generating finer droplets. Moreover, ice crystals in the natural environment typically exhibit flake-like structures, which adhere more easily to the liquid film. As ice crystals attach to the film, the film’s mobility decreases significantly, leading to higher liquid film concentrations at the leading edge of the ice accretion structure. The film freezes by releasing energy through convective and conductive heat transfer. As this process repeats, ice accumulates progressively at the leading edge, forming a layered structure, which substantially increases the ice thickness. In addition, ice crystals impacting the existing ice layer can cause a certain degree of erosion to the already formed ice. However, this erosion has little significant effect on the final ice shape.
4.1. Numerical Simulation of Ice Crystal Effects on Ice Shape
Three cross-sections of the aircraft, which are most affected by ice accretion, were selected for study, as shown in Figure 6. Section 1 (a) represents the symmetric fuselage plane to investigate icing at the nose. Section 2 (b) corresponds to the wing-fuselage junction, and Section 3 (c) represents the wingtip cross-section for analyzing wing icing.
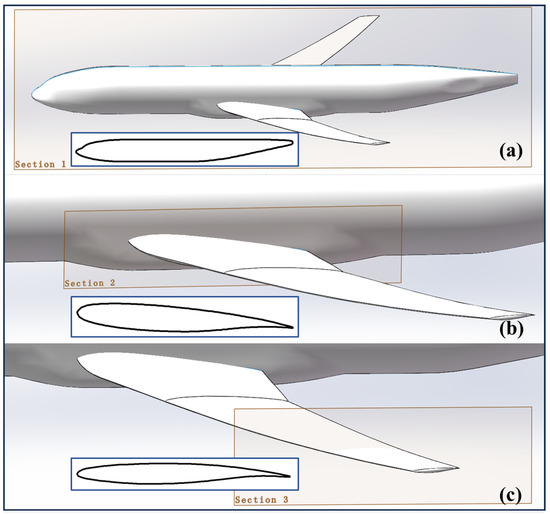
Figure 6.
Cross-section of the areas of concern for aircraft icing: (a) Section 1, (b) Section 2 and (c) Section 3.
Numerical simulations were conducted under two conditions: with supercooled droplets only (Droplets) and with the coexistence of supercooled droplets and ice crystals (Droplets + Crystals). The environmental parameters are listed in Table 3. The droplet size distribution followed a customized profile [29], as shown in Figure 7.
Table 3.
Parameter settings for simulating the influence of ice crystals on icing.
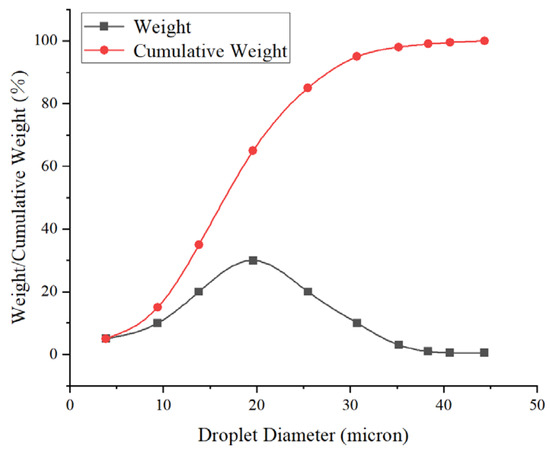
Figure 7.
Custom droplet distribution.
This analysis employed the FENSAP-ICE suite, which includes the Discrete Roughness Optimization Program in 3D (DROP3D) for droplet and ice crystal tracking and the Ice accretion simulation in 3D (ICE3D) for predicting ice growth based on collected phase change data. In DROP3D, the droplet collection efficiency distributions for both conditions are shown in Figure 8. In simulations of the Droplets + Crystals case, Collection Efficiency–Droplet and Collection Efficiency–Crystal are calculated separately; thus, Collection Efficiency–Droplet (Droplets + Crystals) coincides perfectly with Collection Efficiency–Droplet (Droplets only). From the curve of Collection Efficiency–Crystal (Droplets + Crystals), it can be seen that ice crystals concentrate at the leading edge, where droplet collection is also most intense. This supports the hypothesis that ice crystals adhering to the liquid film impede its flow, as illustrated in Figure 9.
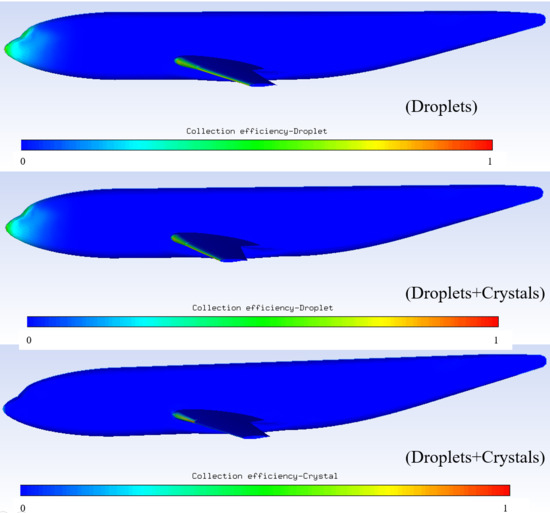
Figure 8.
Distribution of collection efficiency (Droplets/Droplets + Crystals).
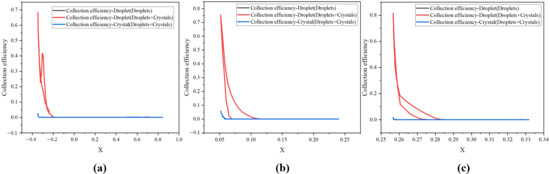
Figure 9.
Collection efficiency: (a) Section 1, (b) Section 2, and (c) Section 3.
In ICE3D, the ice accretion results for both cases are shown in Figure 10 and Figure 11. In Figure 11a, two peaks in Ice Growth appear—one at the aircraft’s nose and another at the windshield area—which is consistent with practical observations. The Ice Growth curves for the three cross-sections clearly demonstrate that in the Droplets + Crystals condition, Ice Growth at the leading edge is significantly higher than that in the Droplets-only condition. This finding corroborates the theory that the adhesion of ice crystals to the liquid film restricts its mobility, causing an increased film concentration at the leading edge, which subsequently freezes via convective and conductive heat transfer. As this process repeats, ice progressively accumulates at the leading edge, forming a layered structure and substantially increasing ice thickness. At the peak regions, ice growth is enhanced by approximately 75% compared with the case without ice crystals, as illustrated in Figure 11. Taking Section 3 as an example, the resulting ice shape is shown in Figure 12.
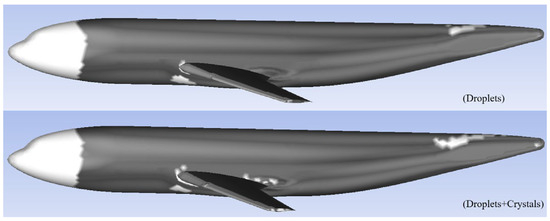
Figure 10.
Ice cover under different operating conditions.
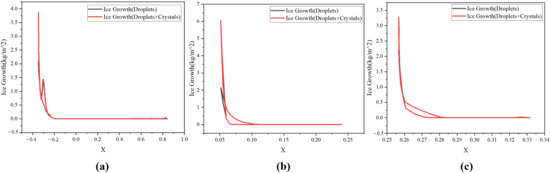
Figure 11.
Ice growth with or without ice crystals: (a) Section 1, (b) Section 2, and (c) Section 3.
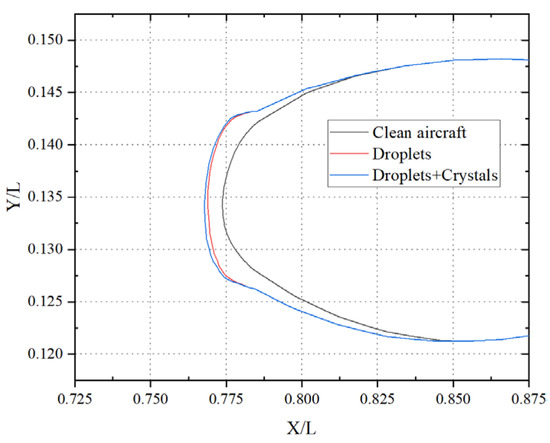
Figure 12.
Ice pattern of airfoil at Section 3.
4.2. The Influence of MVD-Crystals
The size of ice crystals is an important parameter affecting Ice Growth. As particle size varies, so does the mobility of the liquid film, thereby influencing the entire ice accretion process. To investigate this effect, numerical simulations were performed for four different ice crystal diameters (50, 100, 150, and 200 µm). These simulations provided a detailed analysis of the mechanism by which crystal size affects film mobility and Ice Growth, revealing the critical role of particle size variation in the icing process. To ensure simulation accuracy, all variables except MVD-Crystals were strictly controlled, ensuring that the resulting Ice Growth accurately reflects the influence of ice crystal diameter on ice shape. Simulation parameters are listed in Table 4.
Table 4.
Environmental parameters for numerical simulation of icing at different ice crystal sizes.
As illustrated in Figure 13, the diameter of ice crystals influences not only the thickness of accumulated ice but also its spatial distribution on the surface. Smaller crystals tend to be transported downstream by airflow and liquid film motion after impact, resulting in thinner ice deposition at the leading edge. In contrast, larger crystals are less affected by post-impact airflow and maintain greater contact with the liquid film, promoting stronger adhesion at the leading edge. Therefore, variations in crystal size have a direct impact on ice morphology, enhancing ice accumulation in this critical region. In this region, when the ice crystal diameters are 100 μm, 150 μm, and 200 μm, the ice growth values increase by approximately 25%, 50%, and 75%, respectively, compared with those at 50 μm. Using Section 3 as a case study, the variations in ice morphology corresponding to different crystal sizes are presented in Figure 14.
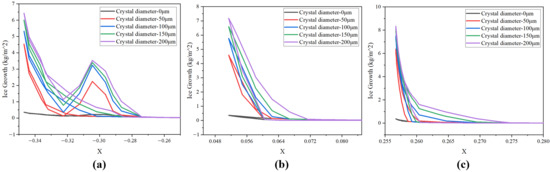
Figure 13.
Ice growth at different crystal diameter: (a) Section 1, (b) Section 2, and (c) Section 3.
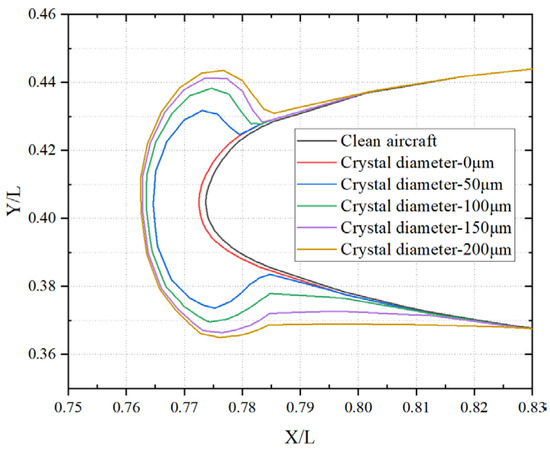
Figure 14.
Ice shape at different ice crystal diameters.
4.3. The Influence of Crystal Aspect Ratio
The aspect ratio (length-to-width ratio) of ice crystals strongly influences their adhesion to the liquid film, thereby affecting the resulting ice morphology on aircraft surfaces. To examine the effect of varying crystal aspect ratios on the icing process, numerical simulations were conducted for crystals with aspect ratios of 0.05, 0.1, 0.5, and 1. The simulation parameters are summarized in Table 4, with the crystal diameter fixed at 100 μm. Ice growth results for the different aspect ratios are presented in Figure 15, taking Section 3 as a reference, while the corresponding ice shapes are shown in Figure 16.
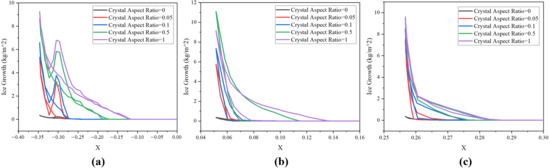
Figure 15.
Ice growth at different crystal aspect ratio: (a) Section 1, (b) Section 2, and (c) Section 3.
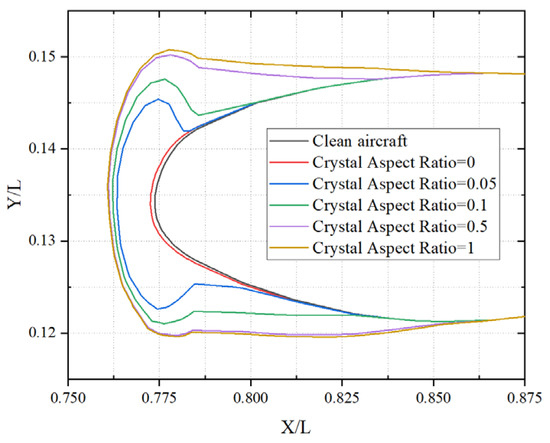
Figure 16.
Ice shape at different ice crystal aspect ratio.
As illustrated in Figure 15 and Figure 16, variations in crystal shape influence both collision behavior and the formation and distribution of ice structures. At an aspect ratio of 0.05, crystals are elongated and more easily displaced by airflow, which decreases their contact area with the surface and leads to more dispersed ice accumulation. As the aspect ratio increases, crystals become flatter, improving their adhesion to the liquid film and restricting its movement across the aircraft surface. Consequently, the liquid film, encapsulating the crystals, gradually freezes along the leading edge, forming a more uniform ice layer.
The results demonstrate that the crystal aspect ratio has a significant impact on the ice shape. Flatter ice crystals lead to thicker ice layers, directly influencing the distribution and overall morphology of the accreted ice on the aircraft surface. In the extended region behind the leading edge, when the ice crystal aspect ratios are 0.1, 0.5, and 1, the ice growth values increase by approximately 20%, 60%, and 75%, respectively, compared with those at an aspect ratio of 0.05.
4.4. The Influence of Ice Crystal Concentration
Ice crystal concentration influences both the frequency of crystal impacts on the aircraft surface and the spatial distribution of crystals within the surrounding airflow, thereby affecting ice morphology. To investigate this effect, simulations were performed for four concentrations: 0.25, 0.5, 1, and 2 g/m3. The resulting ice shapes under these different conditions were then analyzed. The experimental parameters are provided in Table 4, with an ice crystal diameter of 100 μm and an aspect ratio of 0.05. The ice growth results for different crystal concentrations are shown in Figure 17, and the corresponding ice shapes are presented in Figure 18.
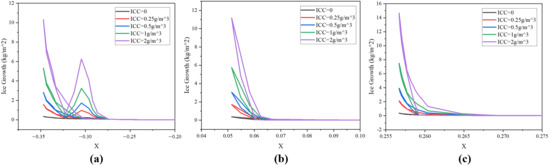
Figure 17.
Ice growth at different ICC: (a) Section 1, (b) Section 2, and (c) Section 3.
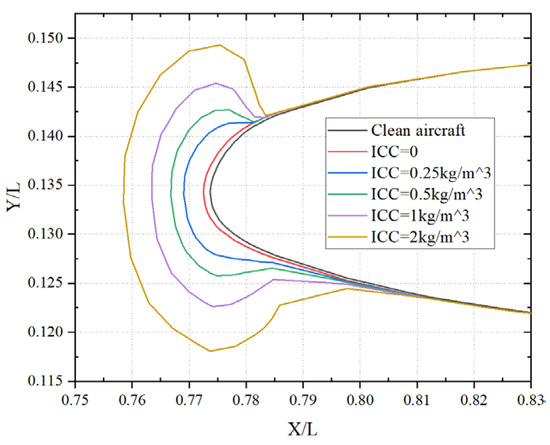
Figure 18.
Ice shape at different ICC.
As shown in Figure 17 and Figure 18, increasing ice crystal concentration leads to a marked rise in adhesion on the leading edge, causing significant changes in both ice shape and thickness. At a concentration of 2 g/m3, ice thickness on the blade surface reaches its maximum. At lower concentrations, ice tends to spread laterally along the leading edge, producing shapes similar to those formed by droplet impingement alone. However, as concentration continues to rise, the accumulation of ice crystals at the leading edge becomes more pronounced. More crystals adhere to the liquid film, resulting in reduced ice accumulation on either side of the leading edge but a substantial increase in ice thickness in the central leading-edge region. In this region, when the ice crystal concentrations are 0.5 kg/m3, 1 kg/m3, and 2 kg/m3, the ice growth values increase by approximately 50%, 200%, and 450%, respectively, compared with those at a concentration of 0.25 kg/m3.
5. Conclusions
In this study, the FENSAP-ICE simulation tool was used to examine ice accretion under glaze icing conditions involving both ice crystals and supercooled droplets. The influence of key ice crystal parameters on ice morphology and accumulated mass was systematically analyzed.
The results indicate that ice shapes formed under the combined effect of ice crystals and supercooled droplets differ significantly from those produced by droplets alone. In the droplet-only case, the resulting ice structures exhibit distinct ice horns and elevated surface roughness. In contrast, when ice crystals are present, the accreted ice appears smoother, more uniform, and substantially thicker. At peak ice growth locations, the accretion increases by approximately 75% compared with the droplet-only condition. Furthermore, increases in crystal concentration, particle size, and aspect ratio all contribute to greater ice thickness while reducing the prominence of ice horns.
The findings confirm that ice crystals in natural environments typically form as flake-like structures which readily adhere to the liquid film. Their adhesion markedly reduces film mobility, leading to higher film concentration at the leading edge. This promotes progressive ice accumulation, the development of layered structures, and a significant increase in ice thickness. Specifically, when crystal diameters are 100 μm, 150 μm, and 200 μm, ice growth increases by approximately 25%, 50%, and 75%, respectively, compared with 50 μm. In the extended region behind the leading edge, aspect ratios of 0.1, 0.5, and 1 result in ice growth increases of about 20%, 60%, and 75%, respectively, compared with an aspect ratio of 0.05. Similarly, when ice crystal concentrations are 0.5 kg/m3, 1 kg/m3, and 2 kg/m3, ice growth rises by about 50%, 200%, and 450%, respectively, relative to 0.25 kg/m3.
In summary, this research highlights the critical role of ice crystals in the aircraft icing process and clarifies the mechanisms of ice accretion under complex meteorological conditions. These insights provide an essential theoretical basis for advancing efficient anti-icing and de-icing technologies in aviation.
The results also point to important implications for aircraft safety and design. When ice crystal diameters exceed 150 μm, aspect ratios go beyond 0.5, or concentrations rise above 1 kg/m3, ice growth increases sharply. These conditions may represent severe icing environments. Recognizing such thresholds can help improve anti-icing and de-icing systems by defining operating ranges where traditional droplet-based models underestimate ice buildup. In addition, the finding that ice crystals reduce horn formation but create smoother and thicker ice layers has aerodynamic importance. It suggests a shift in risk from localized flow separation to higher drag and potential lift loss. Overall, these insights can guide updates to certification standards, provide recommendations for operating in mixed-phase icing, and support safer and more efficient aircraft designs.
It should be emphasized that the present study is based solely on numerical simulations, without direct comparison to wind tunnel or flight test data under mixed-phase conditions. As such, the quantitative results reported here should be interpreted as model predictions rather than experimentally validated outcomes. Future work will focus on (i) conducting controlled experimental studies of mixed-phase icing to provide validation datasets, (ii) incorporating erosion effects into the simulations to assess their influence on final ice shapes, and (iii) extending the numerical framework to explore three-dimensional geometries and transient meteorological conditions. These efforts will help further refine the predictive accuracy and practical relevance of the current modeling approach.
Author Contributions
Conceptualization, A.J.; Formal analysis, H.L. and M.L.; Funding acquisition, A.J. and B.Y.; Investigation, A.J.; Methodology, H.L. and B.Y.; Software, H.L. and M.L.; Supervision, A.J.; Validation, H.L. and S.Z.; Writing—original draft, H.L.; Writing—review and editing, A.J. All authors will be updated at each stage of manuscript processing, including submission, revision, and revision reminder, via emails from our system or the assigned Assistant Editor. All authors have read and agreed to the published version of the manuscript.
Funding
The work reported above was supported by the Natural Science Foundation of China (12362033), Research on local sand and dust motion simulation method based on multiphase flow (CIRP202415001X), Xinjiang Uygur Autonomous Region ‘Two Regions’ Science and Technology Development Programme of China (2023LQ01001), and Xinjiang University Outstanding Doctoral Student Innovation Project of China (XJU2024BS105).
Institutional Review Board Statement
Not applicable.
Informed Consent Statement
Not applicable.
Data Availability Statement
The original contributions presented in this study are included in the article. Further inquiries can be directed to the corresponding author.
Conflicts of Interest
The authors declare that this study was carried out without any commercial or financial relationships that could be perceived as potential conflicts of interest.
Nomenclature
| L | fuselage length, m |
| Alpha | angle of attack, deg |
| LWC | Liquid Water Content, g/m3 |
| MVD | Mean Volume Diameter, μm |
| ICC | Ice Crystal Content, g/m3 |
| Lift | lift force |
| CRM-NLF | Common Research Model with Natural Laminar Flow |
| X | horizontal coordinates of the cross-section profile |
| DROP3D | Discrete Roughness Optimization Program in 3D |
| FENSAP | Finite Element Navier–Stokes Analysis Program |
| ICE3D | Ice accretion simulation in 3D |
| Ice Growth | mass of ice per unit surface area |
| lift coefficient | |
| drag coefficient | |
| pitching moment coefficient | |
| free-stream dynamic pressure, PSF | |
| Reynolds number | |
| TSP | temperature-sensitive paint |
References
- Cao, Y.; Tan, W.; Wu, Z. Aircraft icing: An ongoing threat to aviation safety. Aerosp. Sci. Technol. 2018, 75, 353–385. [Google Scholar] [CrossRef]
- Dai, Y.; Xie, F.; Li, B.; Wang, C.; Shi, K. Effect of blade tips ice on vibration performance of wind turbines. Energy Rep. 2023, 9, 421–433. [Google Scholar] [CrossRef]
- Douvi, E.; Douvi, D. Aerodynamic characteristics of wind turbines operating under hazardous environmental conditions: A review. Energies 2023, 16, 7681. [Google Scholar] [CrossRef]
- Ibrahim, G.M.; Pope, K.; Naterer, G.F. Extended scaling approach for droplet flow and glaze ice accretion on a rotating wind turbine blade. J. Wind. Eng. Ind. Aerodyn. 2023, 233, 105296. [Google Scholar] [CrossRef]
- Wang, Q.; Yi, X.; Liu, Y.; Ren, J.; Yang, J.; Chen, N. Numerical investigation of dynamic icing of wind turbine blades under wind shear conditions. Renew. Energy 2024, 227, 120495. [Google Scholar] [CrossRef]
- Virk, M.S.; Homola, M.C.; Nicklasson, P.J.; Sundsbø, P.A. Effect of rime ice accretion on aerodynamic characteristics of wind turbine blade profiles. Wind. Eng. 2010, 34, 207–218. [Google Scholar] [CrossRef]
- Pouryoussefi, S.G.; Mirzaei, M.; Nazemi, M.M. Experimental study of ice accretion effects on aerodynamic performance of NACA-23012 airfoil. Chin. J. Aeronaut. 2016, 29, 585–595. [Google Scholar] [CrossRef]
- Merizalde, Y.; Hernández-Callejo, L.; Duque-Perez, O.; Alonso-Gómez, V. Maintenance models applied to wind turbines: A comprehensive overview. Energies 2019, 12, 225. [Google Scholar] [CrossRef]
- Kind, R.J.; Potapczuk, M.G.; Feo, A.; Golia, C.; Shah, A.D. Experimental and computational simulation of in-flight icing phenomena. Prog. Aerosp. Sci. 1998, 34, 257–345. [Google Scholar] [CrossRef]
- Morelli, M.; Bellosta, T.; Guardone, A. Efficient radial basis function mesh deformation methods for aircraft icing. J. Comput. Appl. Math. 2021, 392, 113492. [Google Scholar] [CrossRef]
- Brun, R.J.; Mergler, H.W. Impingement of water droplets on a cylinder in an incompressible flow field and evaluation of rotating multicylinder method for measurement of droplet-size distribution, median droplet-size, and liquid-water content in clouds. SEG Tech. Program Expand. Abstr. 1953, 14, 1566. [Google Scholar]
- Durst, F.; Miloievic, D.; Schnung, B. Eulerian and Lagrangian predictions of particulate two-phase flows: A numerical study. Appl. Math. Model. 1984, 8, 101–115. [Google Scholar] [CrossRef]
- Cao, Y.; Huang, J.; Yin, J. Numerical simulation of three-dimensional ice accretion on an aircraft wing. Int. J. Heat Mass Transf. 2016, 92, 123–136. [Google Scholar] [CrossRef]
- Potapczuk, M.G.; Berkowitz, B.M. An experimental investigation of multi-element airfoil ice accretion and resulting performance degradation. AIAA J. 1989, AIAA-89-0752. [Google Scholar]
- Marongiu, C.; Vitagliano, P.L.; Zanazzi, G.; Narducci, R. Aerodynamic analysis of an iced airfoil at medium/high Reynolds number. AIAA J. 2008, 46, 2469–2478. [Google Scholar] [CrossRef]
- Raj, L.P.; Lee, J.W.; Myong, R.S. Ice accretion and aerodynamic effects on a multi-element airfoil under SLD icing conditions. Aerosp. Sci. Technol. 2019, 85, 320–333. [Google Scholar] [CrossRef]
- Ignatyev, D.I.; Khrabrov, A.N.; Kortukova, A.I.; Alieva, D.A.; Sidoryuk, M.E.; Bazhenov, S.G. Interplay of unsteady aerodynamics and flight dynamics of transport aircraft in icing conditions. Aerosp. Sci. Technol. 2020, 104, 105914. [Google Scholar] [CrossRef]
- Yang, B.; Jin, A.; Cheng, J.; Zhou, S.; Jiang, B. Numerical simulation of ice crystal accretion and aerodynamic impacts on wind turbine blades in cold climates. Coatings 2025, 15, 126. [Google Scholar] [CrossRef]
- Hu, Y.; Pan, J.; Liu, Y.; Zhang, C.; Jiang, Y.; Zhu, J. Research on icing model and calculation methods. Phys. Fluids 2024, 36, 093334. [Google Scholar] [CrossRef]
- Xu, Z.; Zhang, T.; Li, X.; Li, Y. Effects of ambient temperature and wind speed on icing characteristics and anti-icing energy demand of a blade airfoil for wind turbine. Renew. Energy 2023, 217, 119135. [Google Scholar] [CrossRef]
- Chen, J.; Zhang, Y.; Fu, S. Roughness implementation and convective heat transfer coefficient computation toward ice accretion simulation. Phys. Fluids 2023, 35, 114102. [Google Scholar] [CrossRef]
- ANSYS Inc. ANSYS FENSAP-ICE User Manual; ANSYS Inc.: Canonsburg, PA, USA, 2017. [Google Scholar]
- Shukla, V.; Kaviti, A.K. Performance evaluation of profile modifications on straight-bladed vertical axis wind turbine by energy and Spalart-Allmaras models. Energy 2017, 126, 766–795. [Google Scholar] [CrossRef]
- Gordillo, J.M.; Riboux, G.; Quintero, E.S. A theory on the spreading of impacting droplets. J. Fluid Mech. 2019, 866, 298–315. [Google Scholar] [CrossRef]
- Zhong, Y.; Lin, H.; Jin, Z.; Yang, Z. The impact, freezing, and melting processes of a supercooled water droplet onto a cold slippery liquid-infused porous surface. Int. J. Heat Mass Transf. 2024, 224, 125306. [Google Scholar] [CrossRef]
- Ebrahimiazar, M.; Ashgriz, N. Ultrasound jetting and atomization of sessile and impacting droplets. Phys. Fluids 2024, 36, 037113. [Google Scholar] [CrossRef]
- Yang, X.; Wang, K.; Liu, J.; Kang, P.; Liu, X. Experimental study on freezing characteristics of droplet impact on cold cylindrical surfaces. Int. Commun. Heat Mass Transf. 2024, 157, 107769. [Google Scholar] [CrossRef]
- Liang, G.; Zhang, T.; Yu, H.; Chen, H.; Shen, S. Simultaneous impact of multiple droplets on liquid film. J. Ind. Eng. Chem. 2018, 65, 123–130. [Google Scholar] [CrossRef]
- Lin, M.; Vo, Q.; Mitra, S.; Tran, T. Viscous droplet impingement on soft substrates. Soft Matter 2022, 18, 5474–5482. [Google Scholar] [CrossRef]
- Meng, Z.; Zhang, P. Dynamic propagation of ice-water phase front in a supercooled water droplet. Int. J. Heat Mass Transf. 2020, 152, 119468. [Google Scholar] [CrossRef]
- Akhtar, S.; Xu, M.; Mohit, M. A comprehensive review of modeling water solidification for droplet freezing applications. Renew. Sustain. Energy Rev. 2023, 188, 113768. [Google Scholar] [CrossRef]
- Honsek, R.; Habashi, W.G. FENSAP-ICE: Eulerian modeling of droplet impingement in the SLD regime of aircraft icing. In Proceedings of the 44th AIAA Aerospace Sciences Meeting and Exhibit, Reno, NV, USA, 9–12 January 2006. [Google Scholar]
- Komaragiri, G.P.; Ahmed, A.; Waghmare, P.R. Freezing of a spreading droplet. J. Colloid Interface Sci. 2025, 698, 137983. [Google Scholar] [CrossRef]
- Barma, M.C.; Peng, Z.; Moghtaderi, B.; Doroodchi, E. Effects of drop size and salt concentration on the freezing temperature of supercooled drops of salt solutions. Sep. Purif. Technol. 2021, 274, 118925. [Google Scholar] [CrossRef]
Disclaimer/Publisher’s Note: The statements, opinions and data contained in all publications are solely those of the individual author(s) and contributor(s) and not of MDPI and/or the editor(s). MDPI and/or the editor(s) disclaim responsibility for any injury to people or property resulting from any ideas, methods, instructions or products referred to in the content. |
© 2025 by the authors. Licensee MDPI, Basel, Switzerland. This article is an open access article distributed under the terms and conditions of the Creative Commons Attribution (CC BY) license (https://creativecommons.org/licenses/by/4.0/).