1. Introduction
Due to the excellent symmetry of HTAAL, the processing direction of the coaxial combined heat source is flexible, and spatial accessibility is high. HTAAL has a wider application range than the paraxial combined heat source in areas such as welding in confined spaces, in situ repair, and remanufacturing [
1,
2,
3,
4]. Frostevarg pointed out that the laser-arc paraxial hybrid welding source is prone to cause unilateral undercut in titanium alloy welds due to the misalignment of two heat sources [
5]. The symmetry and flexibility of HTAAL are expected to be comparable to Plasma Arc Welding (PAW), but compared with PAW, HTAAL also has the 1 + 1 > 2 effect of laser and arc heat sources [
6]. The control of discharge stability in the heat source has been considered essential for achieving coaxial composite processing. The stability and melting capacity of the coaxial combined heat source using low-power lasers and plasma arcs were studied by Rose et al. in Germany [
7]. The findings showed that a 0.2 mm distance between the laser and the arc was optimal, and the spatially matched coupling heat source, with the laser positioned in front, exhibited better stability. Additionally, the higher the thermal conductivity of the workpiece material, the smaller the effect of heat source position matching. The degree of ionization and current density in the plasma arc column area could be influenced by the laser. An increase in metal vapor reduced arc stability. By optimizing the defocus amount, the impact of plasma on metal vapor ejection from the keyhole could be minimized, improving heat source stability. However, the mechanism by which plasma affects heat source stability has not been studied, and plasma quantity is closely related to laser parameters such as power. Despite this, the influence of laser power on plasma has also not been investigated.
The research by Dio et al. [
8] indicated that welding speed was the key factor influencing heat source stability in the coaxial combination of a high-power YAG laser with a hollow tungsten electrode arc. When the welding speed was 250 mm/min, the combined effect of the two heat sources was significant, with a laser power of 4000 W and a welding current of 500 A. When the speed exceeded 450 mm/min, the central axes of the laser, arc, and molten pool did not coincide, preventing the formation of an inward convection effect inside the keyhole. This misalignment led to a significant reduction in melting depth. The findings suggested that aligning the symmetric heat source with the keyhole melt pool axis was beneficial for improving the coupling effect of the heat source. The coaxial combined heat source exhibited a higher degree of axial coincidence compared to the paraxial combined heat source, providing greater potential for enhancing the coupling effect. This point was confirmed by the research findings of Chen [
9], which showed that the melting capacity of the coaxial combined heat source was significantly higher than that of the paraxial combined heat source under the same conditions. In the coaxial combined heat source, where the laser passes through the axial line of the HTA, the loss of laser energy due to plasma refraction and absorption was lower than in the paraxial combined heat source. This resulted in higher laser energy utilization and stronger melting capacity. However, energy matching between lasers and arcs remained a critical issue. The critical current value for a 1000 W laser was 150 A. When this threshold was exceeded, laser combustion waves occurred, hindering laser energy transmission, reducing the coupling effect, and potentially destabilizing the heat source. The author’s previous research findings also indicated the presence of a dual critical value phenomenon in the coaxial combined heat source, with an upper critical value for laser power [
10].
Jiang et al. [
11] studied the effect of plasma on laser energy transmission when a CO
2 laser with a longer wavelength was combined coaxially with a plasma arc. The findings indicated that reducing the temperature of plasma at the axial position using central airflow improved laser energy transmission. This demonstrated that controlling the temperature of coaxial combined plasma was critical. Cho et al. [
12] established and simulated a numerical model of a traditional solid TIG arc coaxially assisted by a YAG laser. The results showed that when laser power increased to 400 W, the flow of arc plasma formed eddies, which influenced the surface shear force of the molten pool. As laser power increased, the shear force decreased. Laser-plasma coaxial composite heat sources had been applied in titanium alloy welding by Cai [
13,
14]. By optimizing the spatial energy distribution of the heat source to improve molten pool flow, this method suppressed the formation of underburn defects in titanium alloy welds effectively, resulting in wide and smooth weld seams. It resolved the issue of stress concentration caused by adding spacers in traditional titanium alloy welding methods. Moreover, this welding technique achieved a welding speed of 2.4 m per minute, comparable to single laser welding. Liu designed a double-layer coaxial hybrid welding arc with an annular arc on the outer layer of the traditional TIG arc to expand the thermal characteristics of the arc so that the thermal state of the welding pool can be adjusted [
15,
16]. Wang obtained a stable welding pool by adding the adsorption effect of longitudinal magnetic field on the hollow tungsten central negative pressure arc [
17,
18].
In conclusion, a large number of scholars are trying new methods to optimize the thermal and force state of welding arc, so as to optimize the thermodynamic state of welding pool and achieve stable welding. It is well known that keyhole stability has always been the key to laser welding and laser arc hybrid welding. In order to ensure keyhole stability and thermodynamic control of the molten pool, a stable heat source is the basis. Due to the structural complexity and thermal capacity limitations of the hollow electrode, as well as the challenges in processing and integrating laser and hollow electrode coaxial composite torches, the discharge process of HTAAL has not been systematically studied, and the issue of discharge stability remains unresolved. At present, the research on laser arc coaxial composite heat source at home and abroad mainly focuses on the application of heat source, and it has been found that welding speed and heat source spacing have an important impact on the stability of heat source, but the influence mechanism of stability has not been deeply studied.
In this study, a fiber laser and hollow tungsten electrode coaxial composite processing platform was developed. Through physical experiments and numerical simulations, the discharge process of HTAAL was systematically analyzed. The relationship between the coaxial composite effect of the laser and the hollow tungsten electrode arc was identified. The factors influencing the discharge stability of HTAAL were determined, and the mechanism of several HTAAL discharge modes was clarified.
3. Results and Discussion
3.1. Arc Discharge Static and Dynamic Behavior
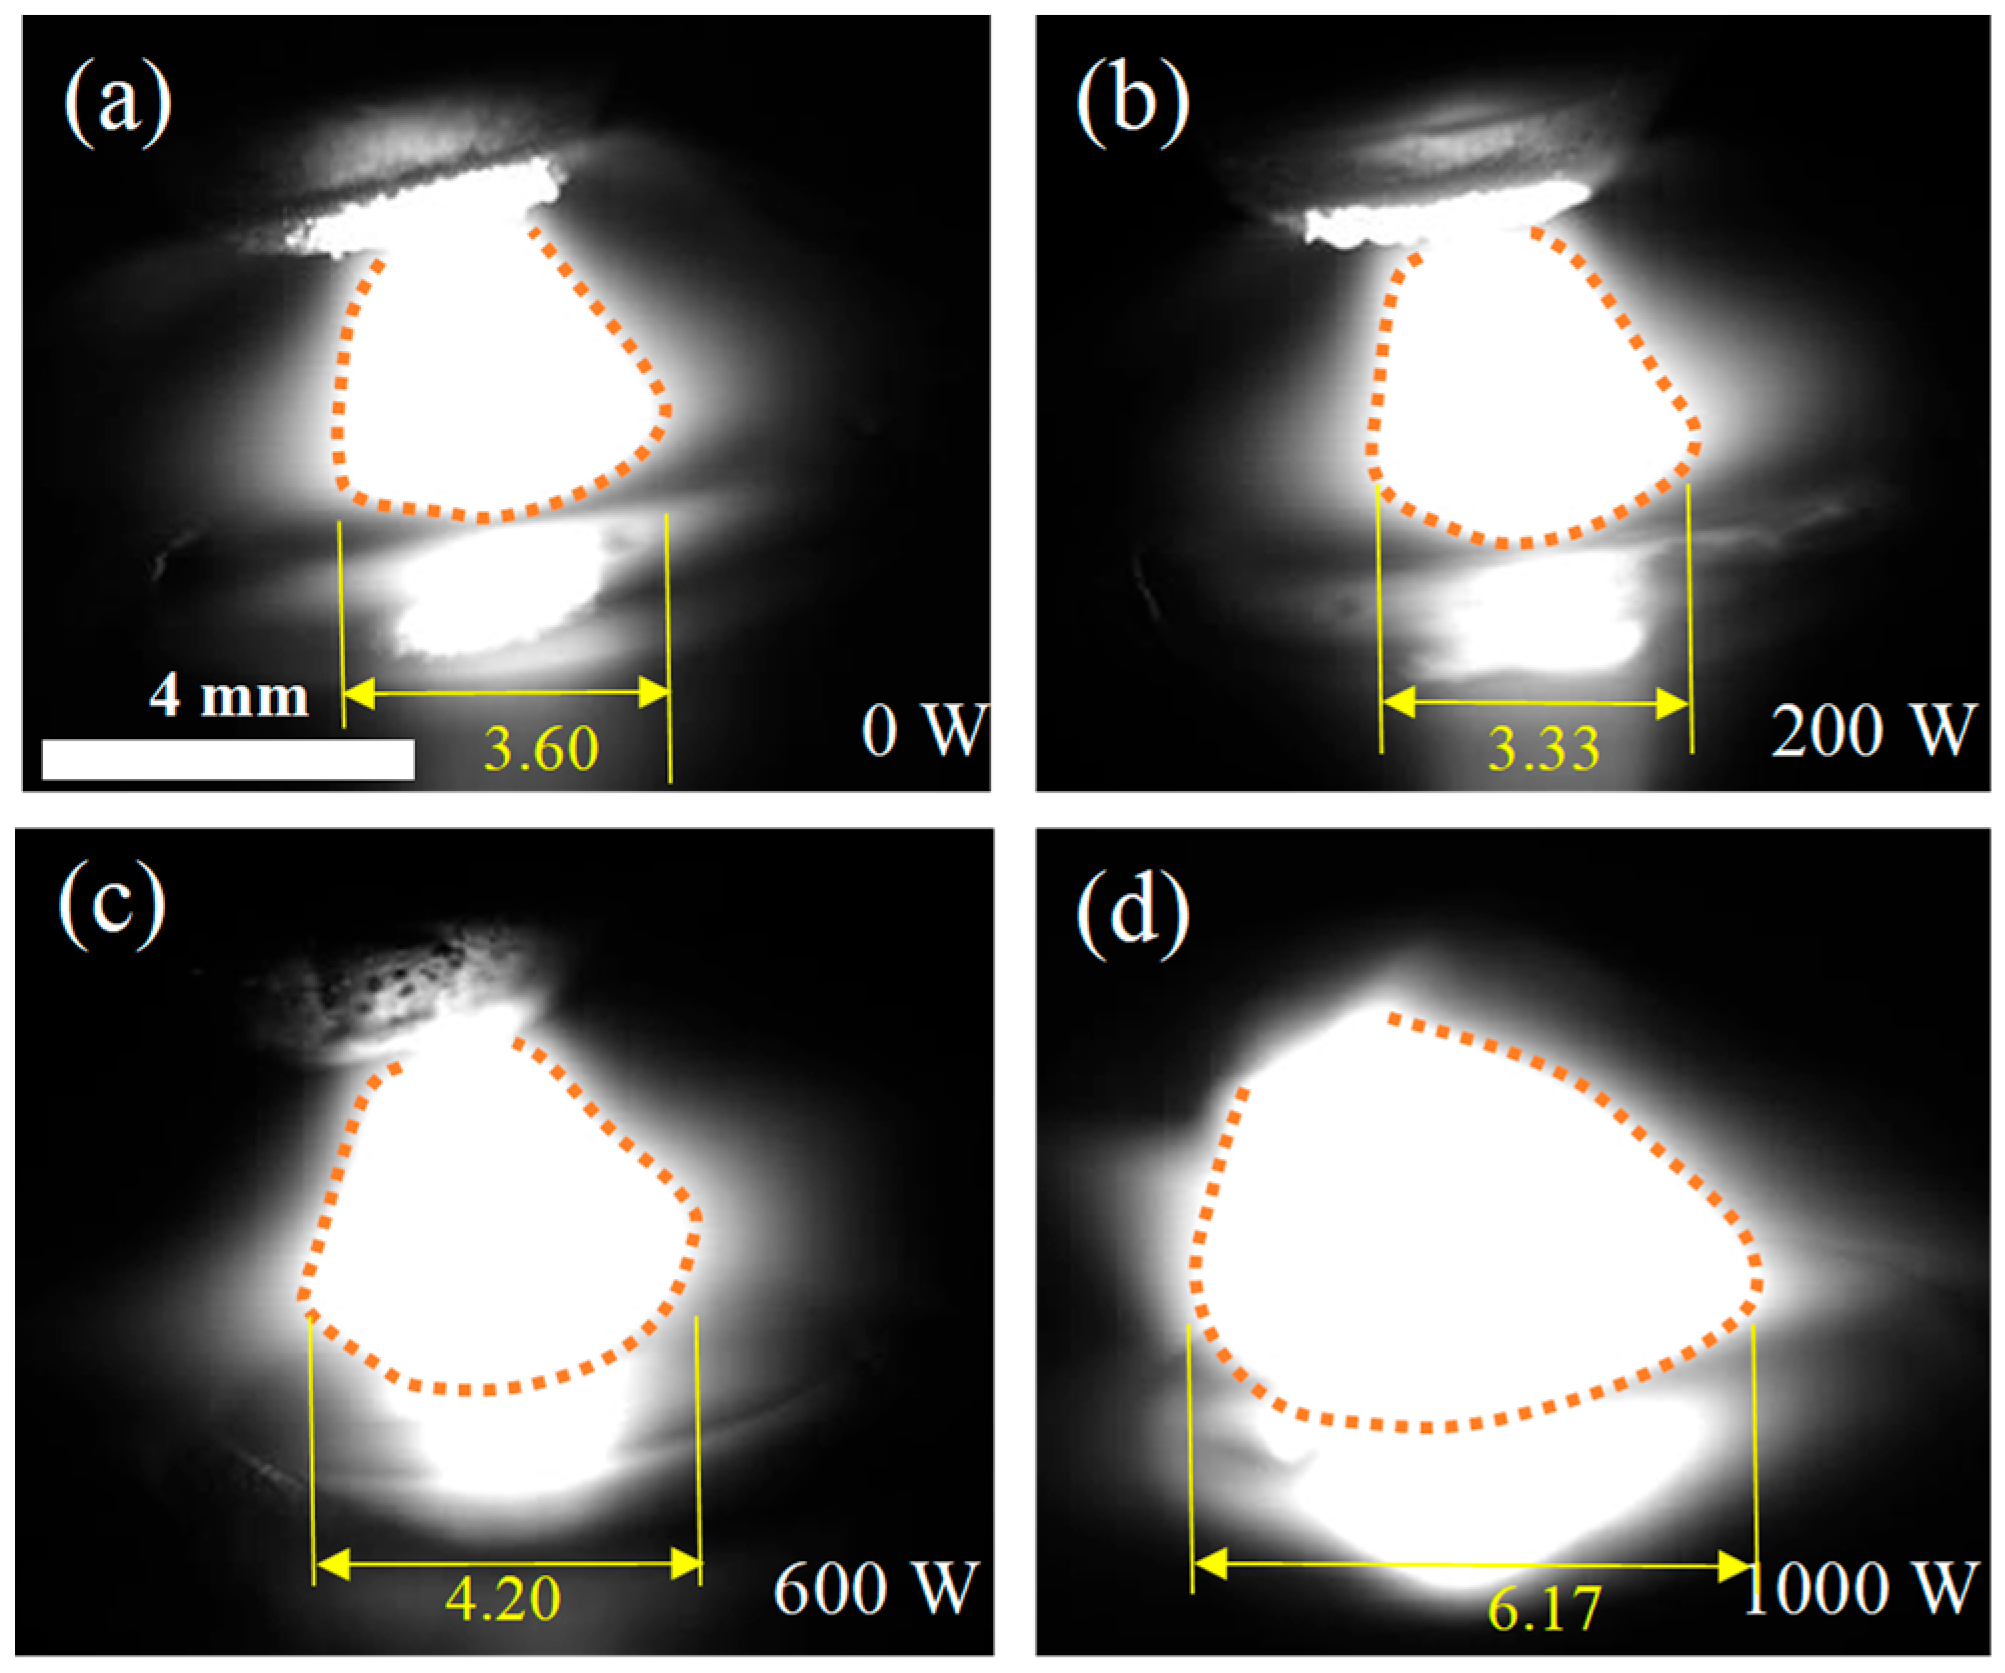
The morphology of HTAAL at the stable discharge stage under different laser powers is shown in
Figure 2. The differences in arc shapes are highly noticeable. By comparing
Figure 2a,b, it can be observed that the width of 200 W HTAAL is reduced by 0.27 mm compared with HTA, indicating that the arc volume has contracted to a certain extent. This suggests that the 200 W laser exerts a volume compression effect on the HTA. However, when the laser power increases to 600 W, the coupled thermal source width increased to 4.2 mm, an increase of 0.87 mm compared with the 200 W HTAAL while maintaining good symmetry and stability. Under 1000 W laser power, HTAAL undergoes significant expansion, resulting in an increase in width to 6.17 mm, almost twice that of 200 W HTAAL, and also resulted in an asymmetrical heat source.
The discharge process of the heat source under different laser power conditions was tracked and recorded, and the results are shown in
Figure 3. When the laser power was 200 W, the HTAAL morphology remained consistent throughout the entire process, and the discharge was stable. When the laser power increased to 400 W, the HTA began to bulge slightly outward due to the attraction of the laser, while the arc discharge remained stable throughout the welding process. At time t
0, a slight bulge appeared at the bottom of the arc due to laser attraction, which persisted until time t
0 + 4t
1. At time t
0 + 6t
1, a slight expansion in the arc volume was observed, but by time t
0 + 7t
1, the heat source quickly returned to its state at t
0. These observations indicate that as laser power increased from 200 W to 400 W, the laser exerted a noticeable attractive and compressive effect on the arc, displaying periodic characteristics. Under the influence of the laser, the HTA exhibited a periodic volume change, where compression was followed by restoration, with a period of 1.4 ms. Additionally, the sequence of arc volume change progressed from bottom protrusion to middle expansion.
When the laser power increased to 500 W, the height of the arc bottom protrusion significantly increased throughout the welding process. From time t0 to t0 + 4t1 and t0 + 7t1, the height of the outward protrusion gradually increased. By t0 + 8t1, the height of the protrusion began to decrease, and the arc volume started to recover. By t0 + 10t1, the arc returned to its initial state at t0. Compared to the 400 W laser, the 500 W laser exhibited a stronger attraction effect on the arc, and the action period became longer. The growth time of the photo-induced plasma increased to 1.95 ms, while the recovery period from growth to restoration extended to 2.78 ms.
When the laser power increased to 1000 W, the volume of HTA throughout the welding process experienced significant changes. The upper and lower parts of the arc protruded violently outward, and the arc was no longer able to maintain a stable discharge. However, under these power conditions, HTAAL exhibited a cyclical variation process. The arc expanded outward above and below the material, followed by volume rebound reduction, and then expanded again. According to previous research results [
8], as laser power increased, the gas temperature and electron emission of the tungsten electrode also increased, leading to an intensified HTA discharge.
3.2. Numerical Simulation of Physical Fields
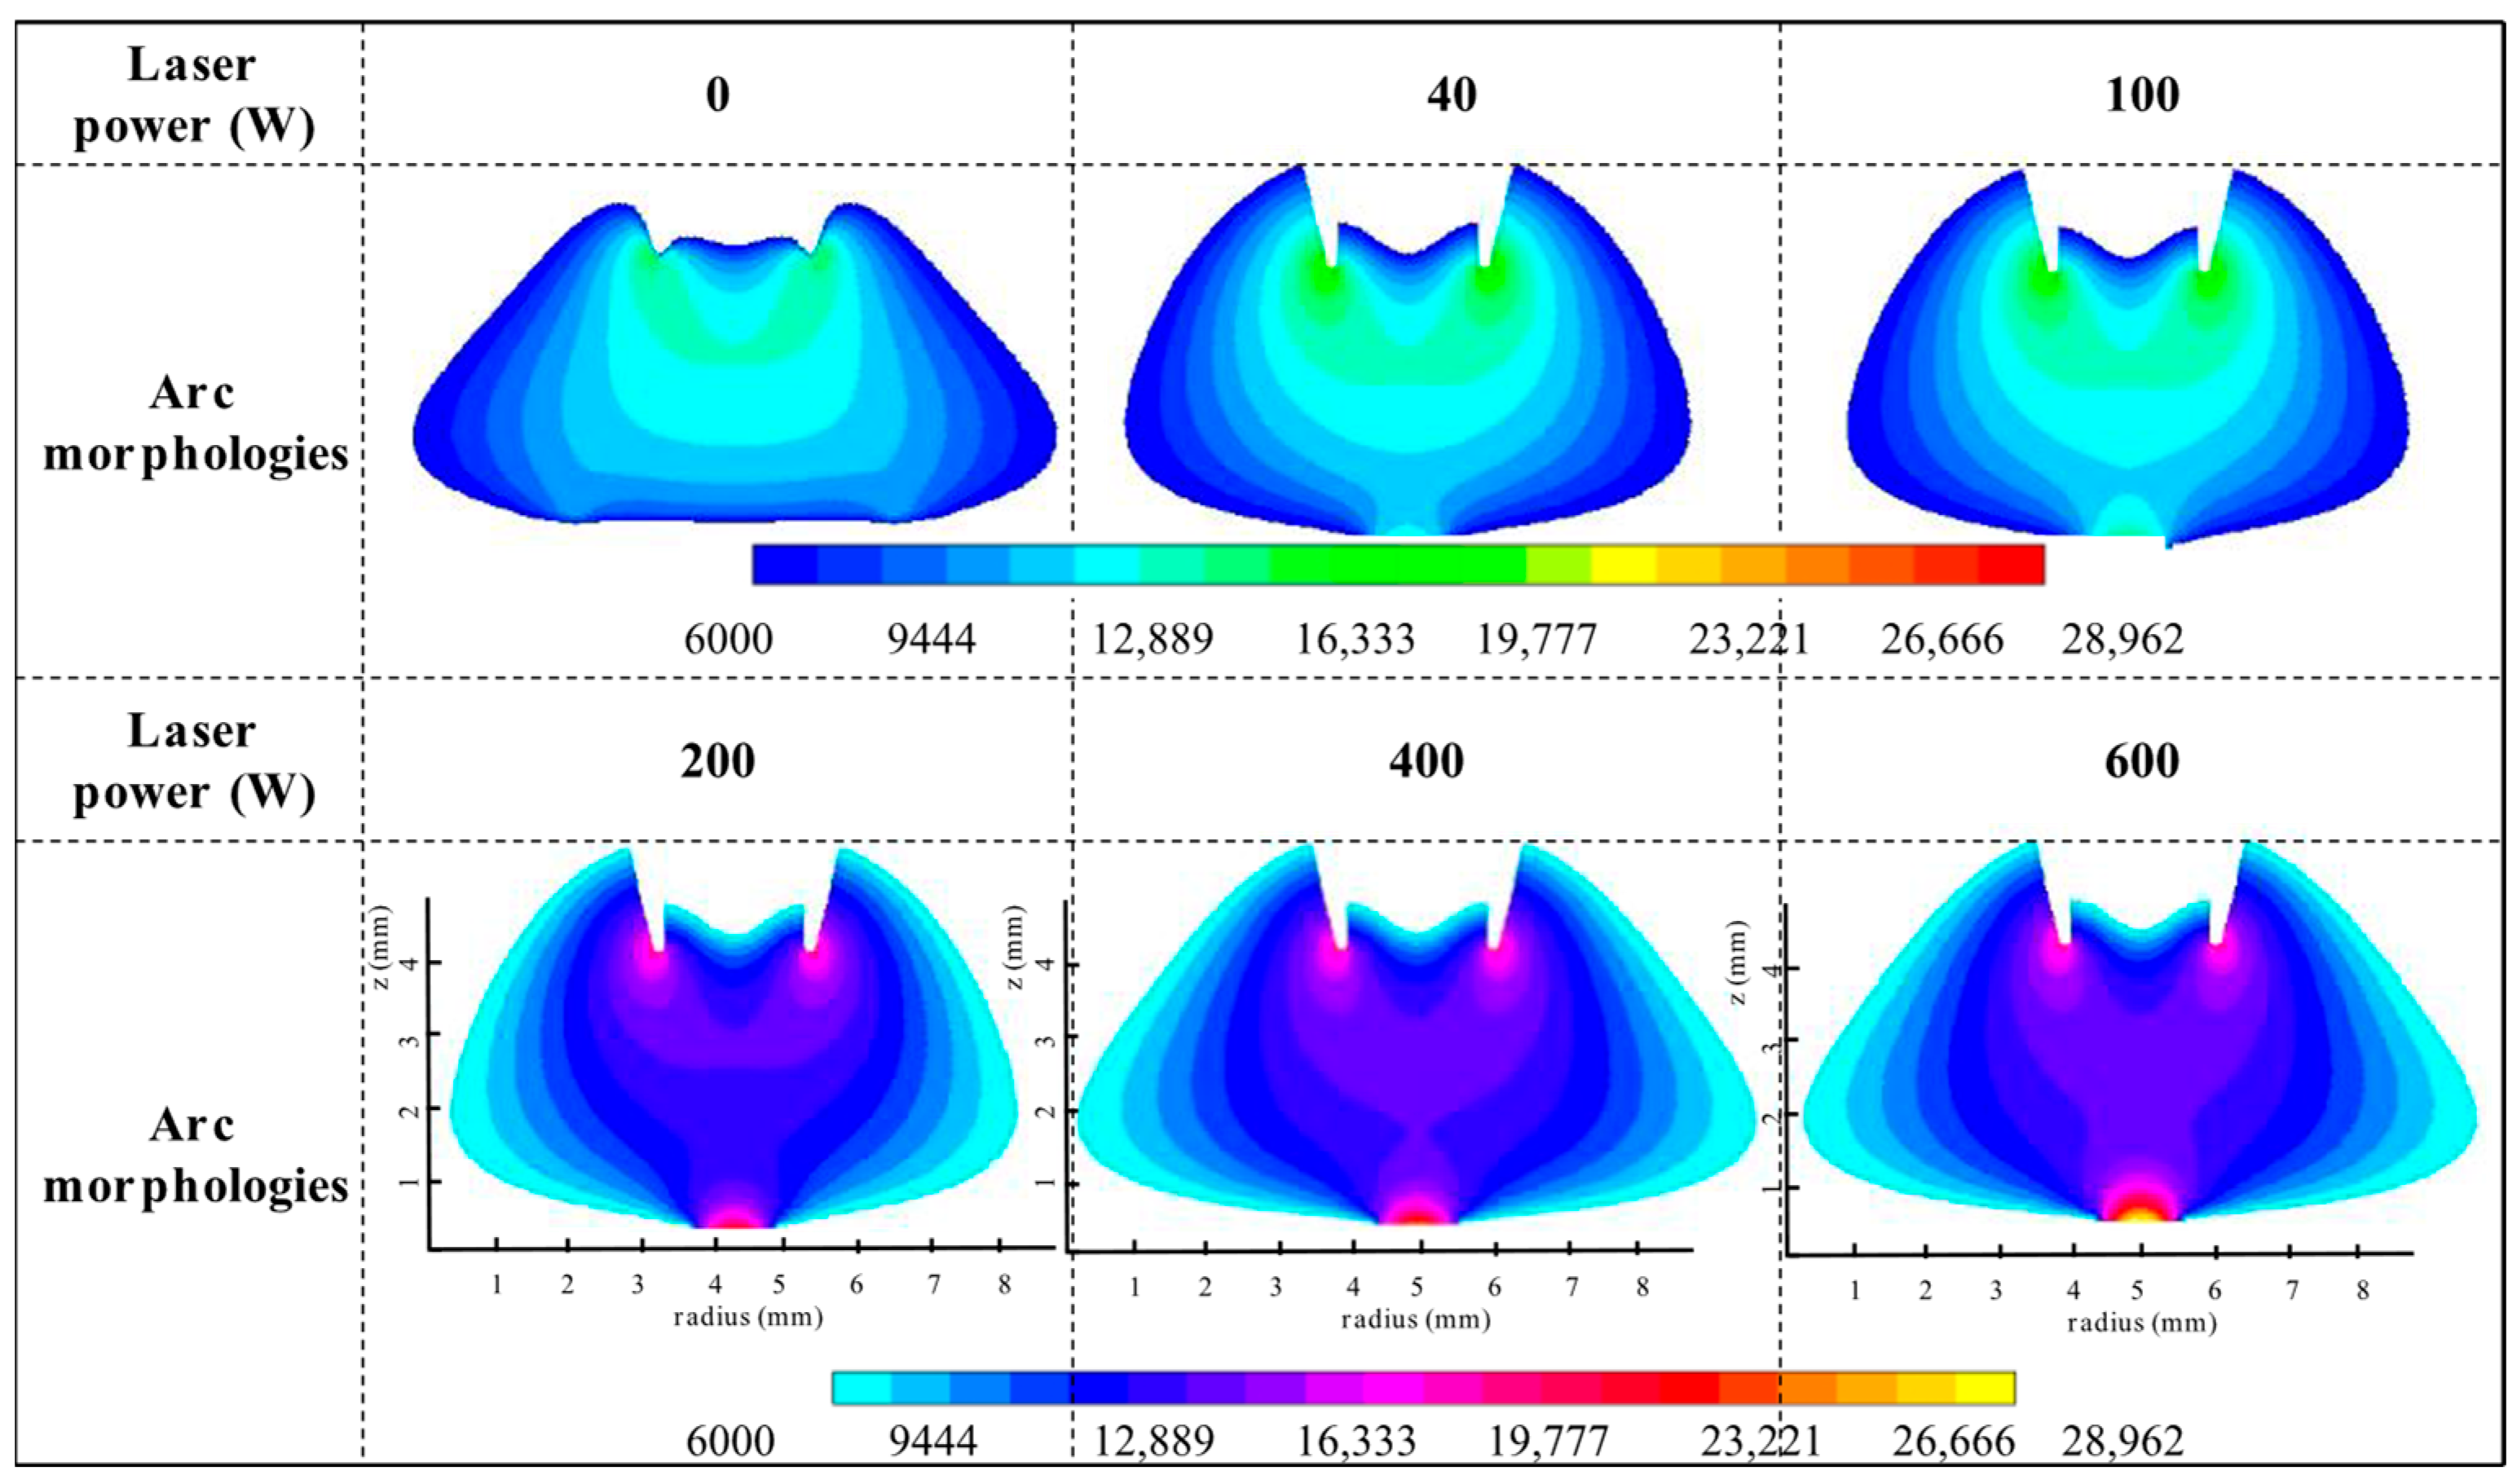
To analyze the discharge process of HTAAL, numerical simulation was performed, and the results are shown in
Figure 4 with a current of 100 A. As the laser power gradually increased to 600 W, the volume of HTAAL first decreased and then increased, which was consistent with the experimental results. After the laser was applied to the HTA, the shape of the high-temperature zone in the arc core changed significantly, and the temperature field distribution on the anode surface was altered. The high-temperature zone in the arc core transformed from a cylindrical shape to a heart-like shape. The arc temperature distribution on the anode surface shifted from being high at both ends and low in the middle for HTA to being high in the center and low at both ends for HTAAL.
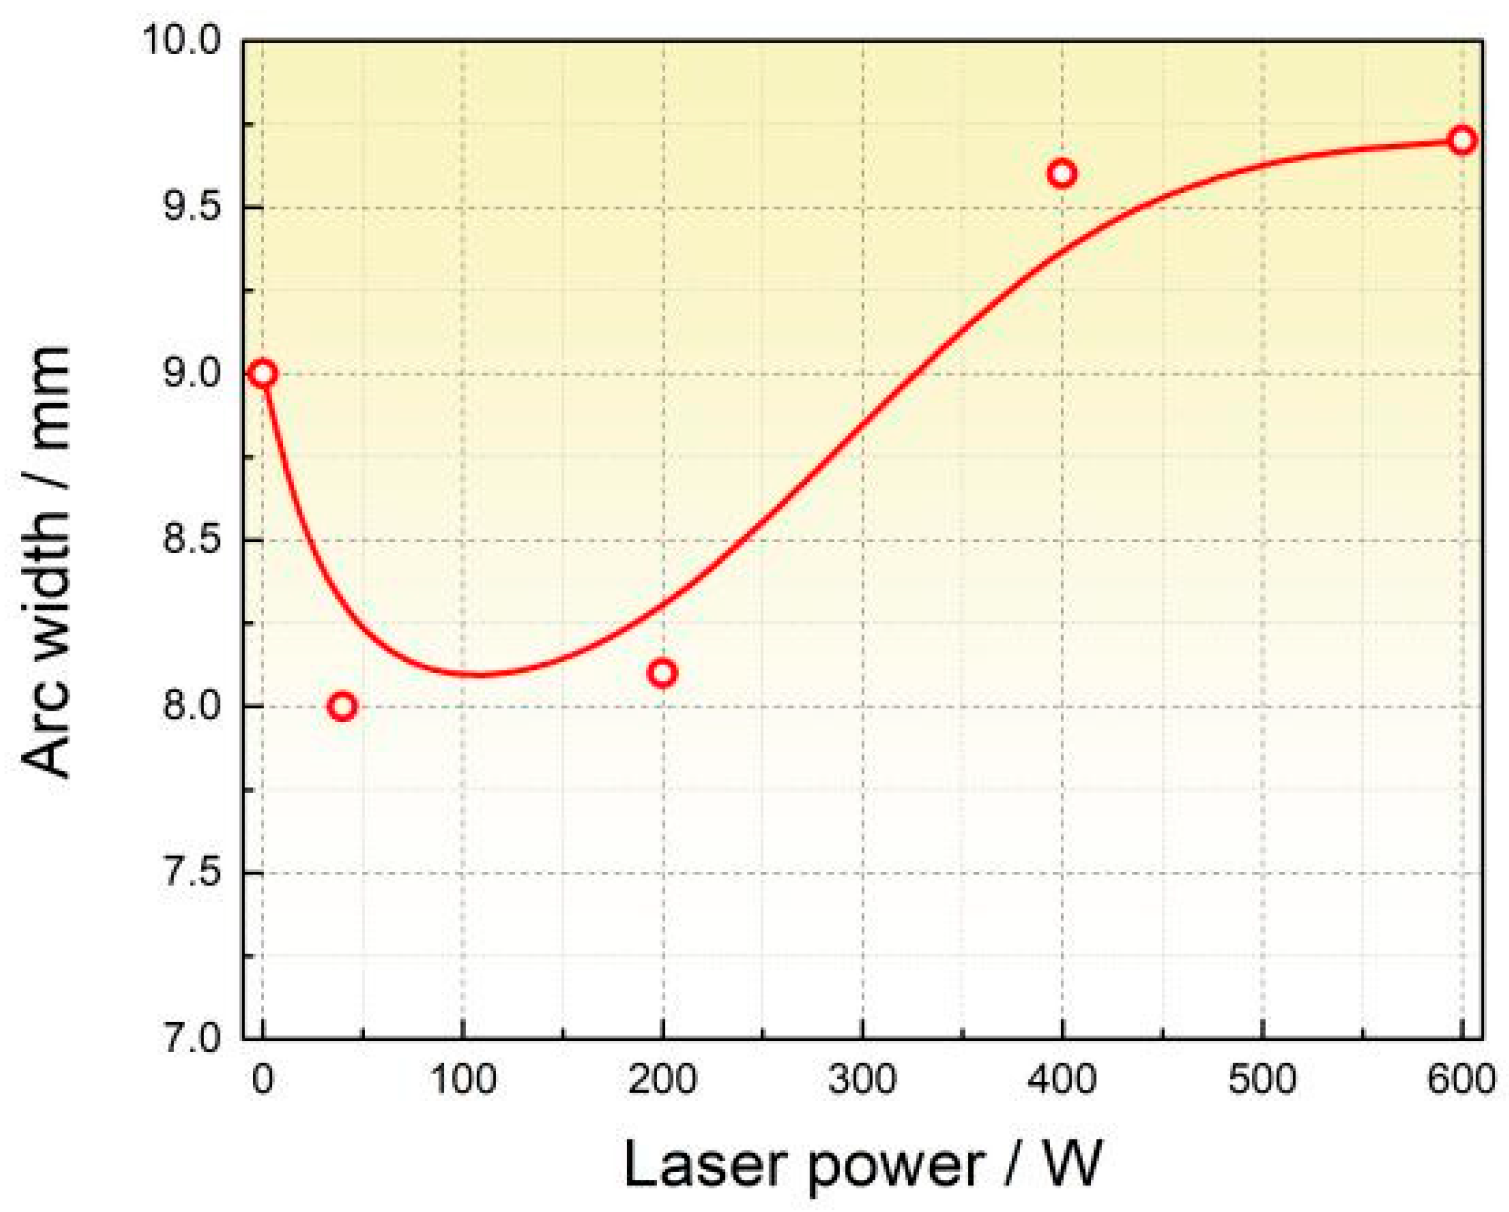
When the laser power is greater than 40 W and less than 200 W, the HTA volume contracts and decreases. However, when the laser power increases to 400 W, the HTA volume expands. After a 40 W fiber laser is applied to the hollow tungsten electrode arc, the width of the lower middle part of the heat source decreases significantly, while the width of the upper part increases slightly. The width of the lower part of the heat source, where the temperature exceeds 6000 K, contracts from 9 mm to 8.2 mm, a reduction of 0.8 mm, while the upper width increases by 0.6 mm. As the laser power increases from 40 W to 200 W, the HTA volume remains constant, while the core temperature gradually rises, and the shape of the high-temperature zone changes. When the laser power gradually increases from 200 W to 600 W, the arc width expands from 8.2 mm to 9.6 mm. The statistical results are shown in
Figure 5. In the coaxial composite processing of HTAAL, the laser has a significant volume compression effect on the HTA, which helps optimize the energy density of the heat source and reduce the width of the heat-affected zone in thermal processing.
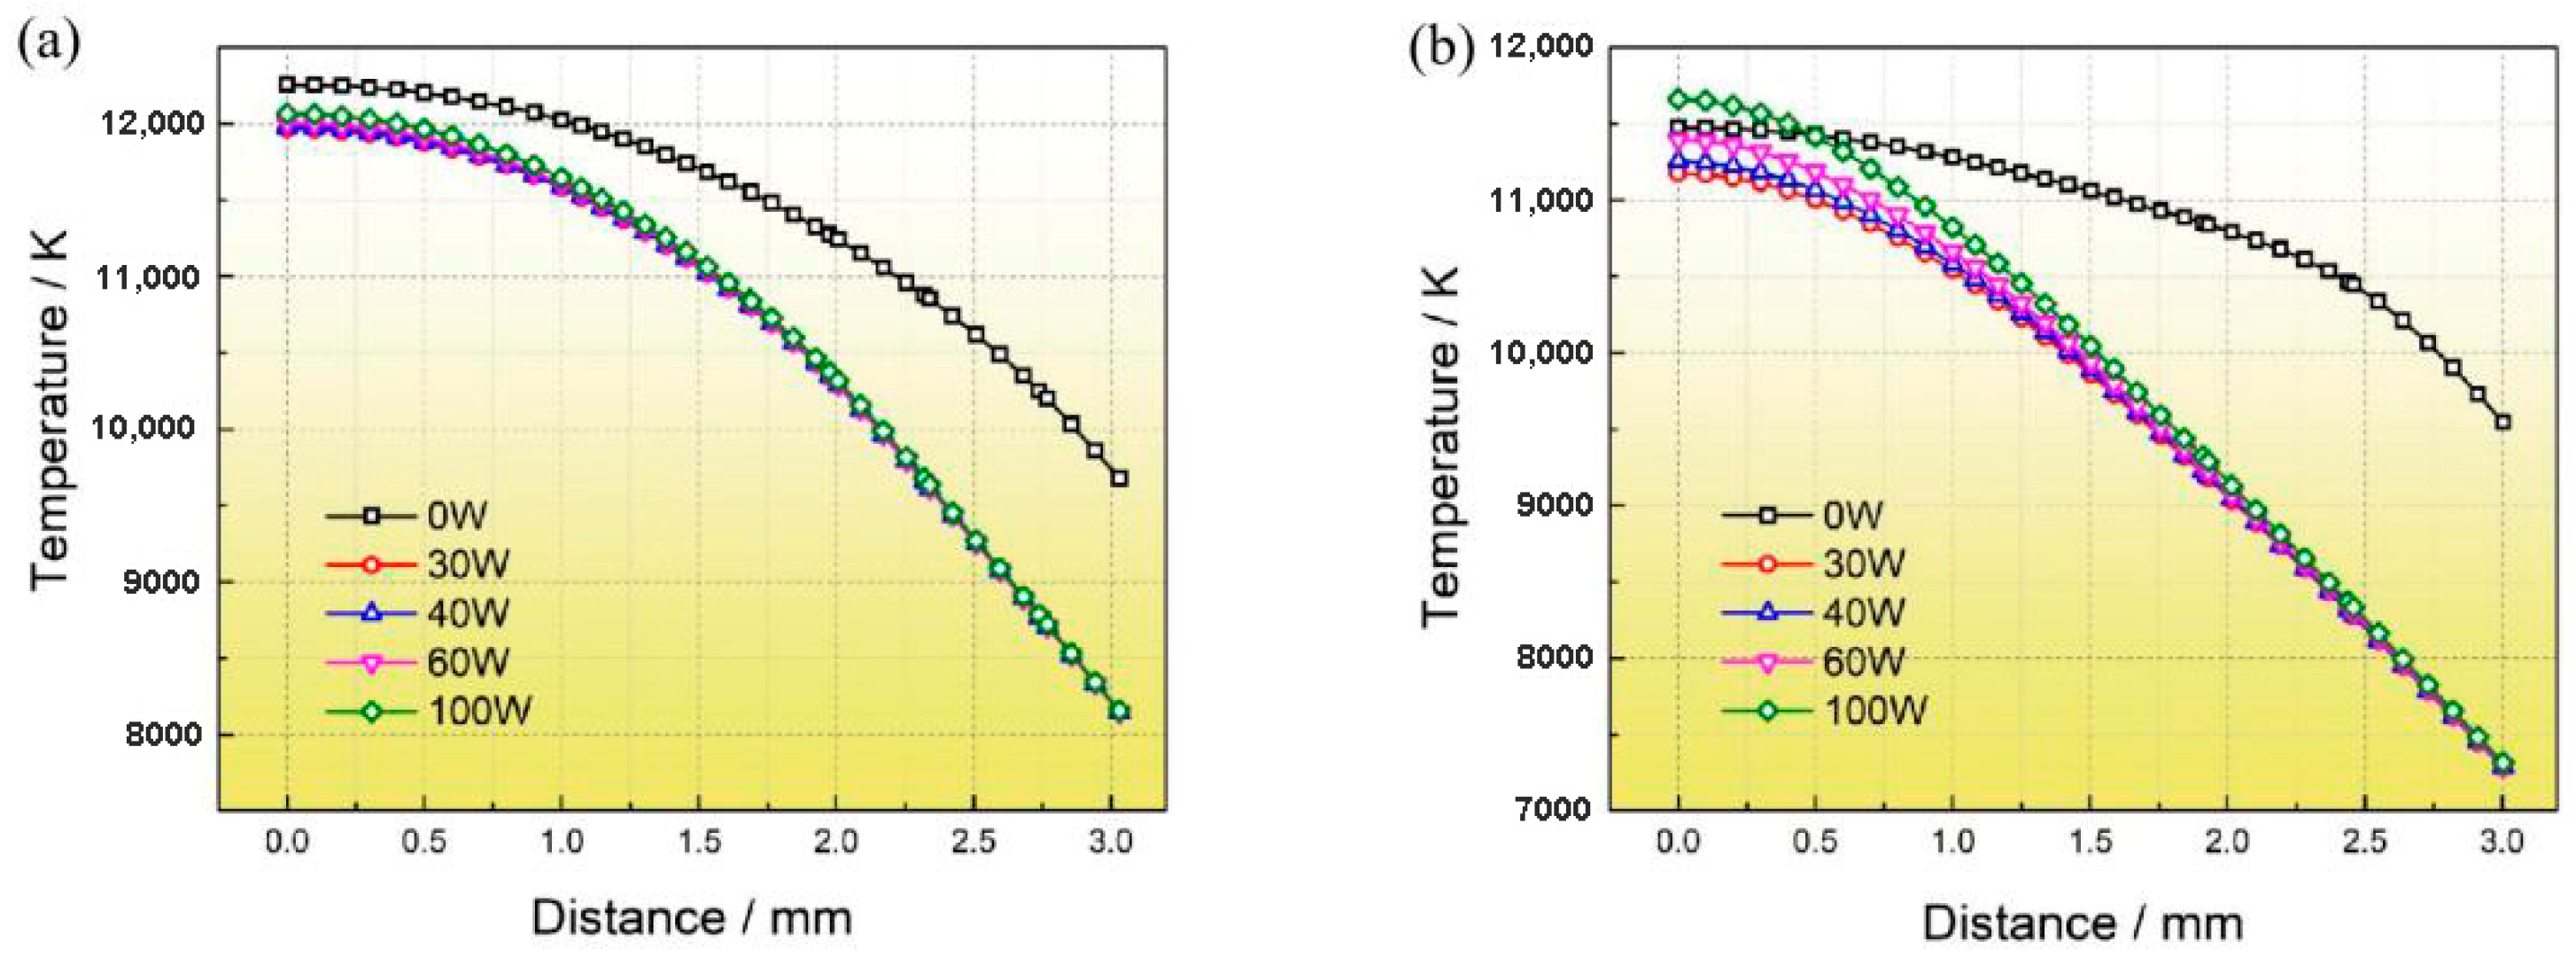
The statistical results of the effect of laser power on the bottom temperature field of the coupled heat source are shown in
Figure 6. The temperature distribution of HTAAL from the center outward at positions 1 mm and 1.5 mm above the workpiece surface has been calculated by numerical simulation. When the tip of the tungsten electrode is 4 mm away from the surface of the workpiece, the temperature at the center of the coupled heat source with a laser power increased from 30 W to 100 W at 1.5 mm above the workpiece are lower than that of HTA under the same welding current conditions. However, from the radial temperature comparison curve of the heat source at 1 mm above the workpiece, it can be observed that the temperature of the coupled heat source with a laser power below 60 W is lower than that of the HTA. When the laser power increases to 100 W, the temperature becomes higher than that of HTA. This differs from the temperature distribution between the 1.5 mm position and the 1 mm position, indicating that the effect of laser on the axial spatial temperature of HTAAL is related to the position and that the closer to the workpiece surface, the greater the influence of the laser on the coupled heat source temperature. The redistribution of the arc central temperature and the temperature in the middle and lower parts of the anode surface may be the fundamental reason for arc volume contraction.
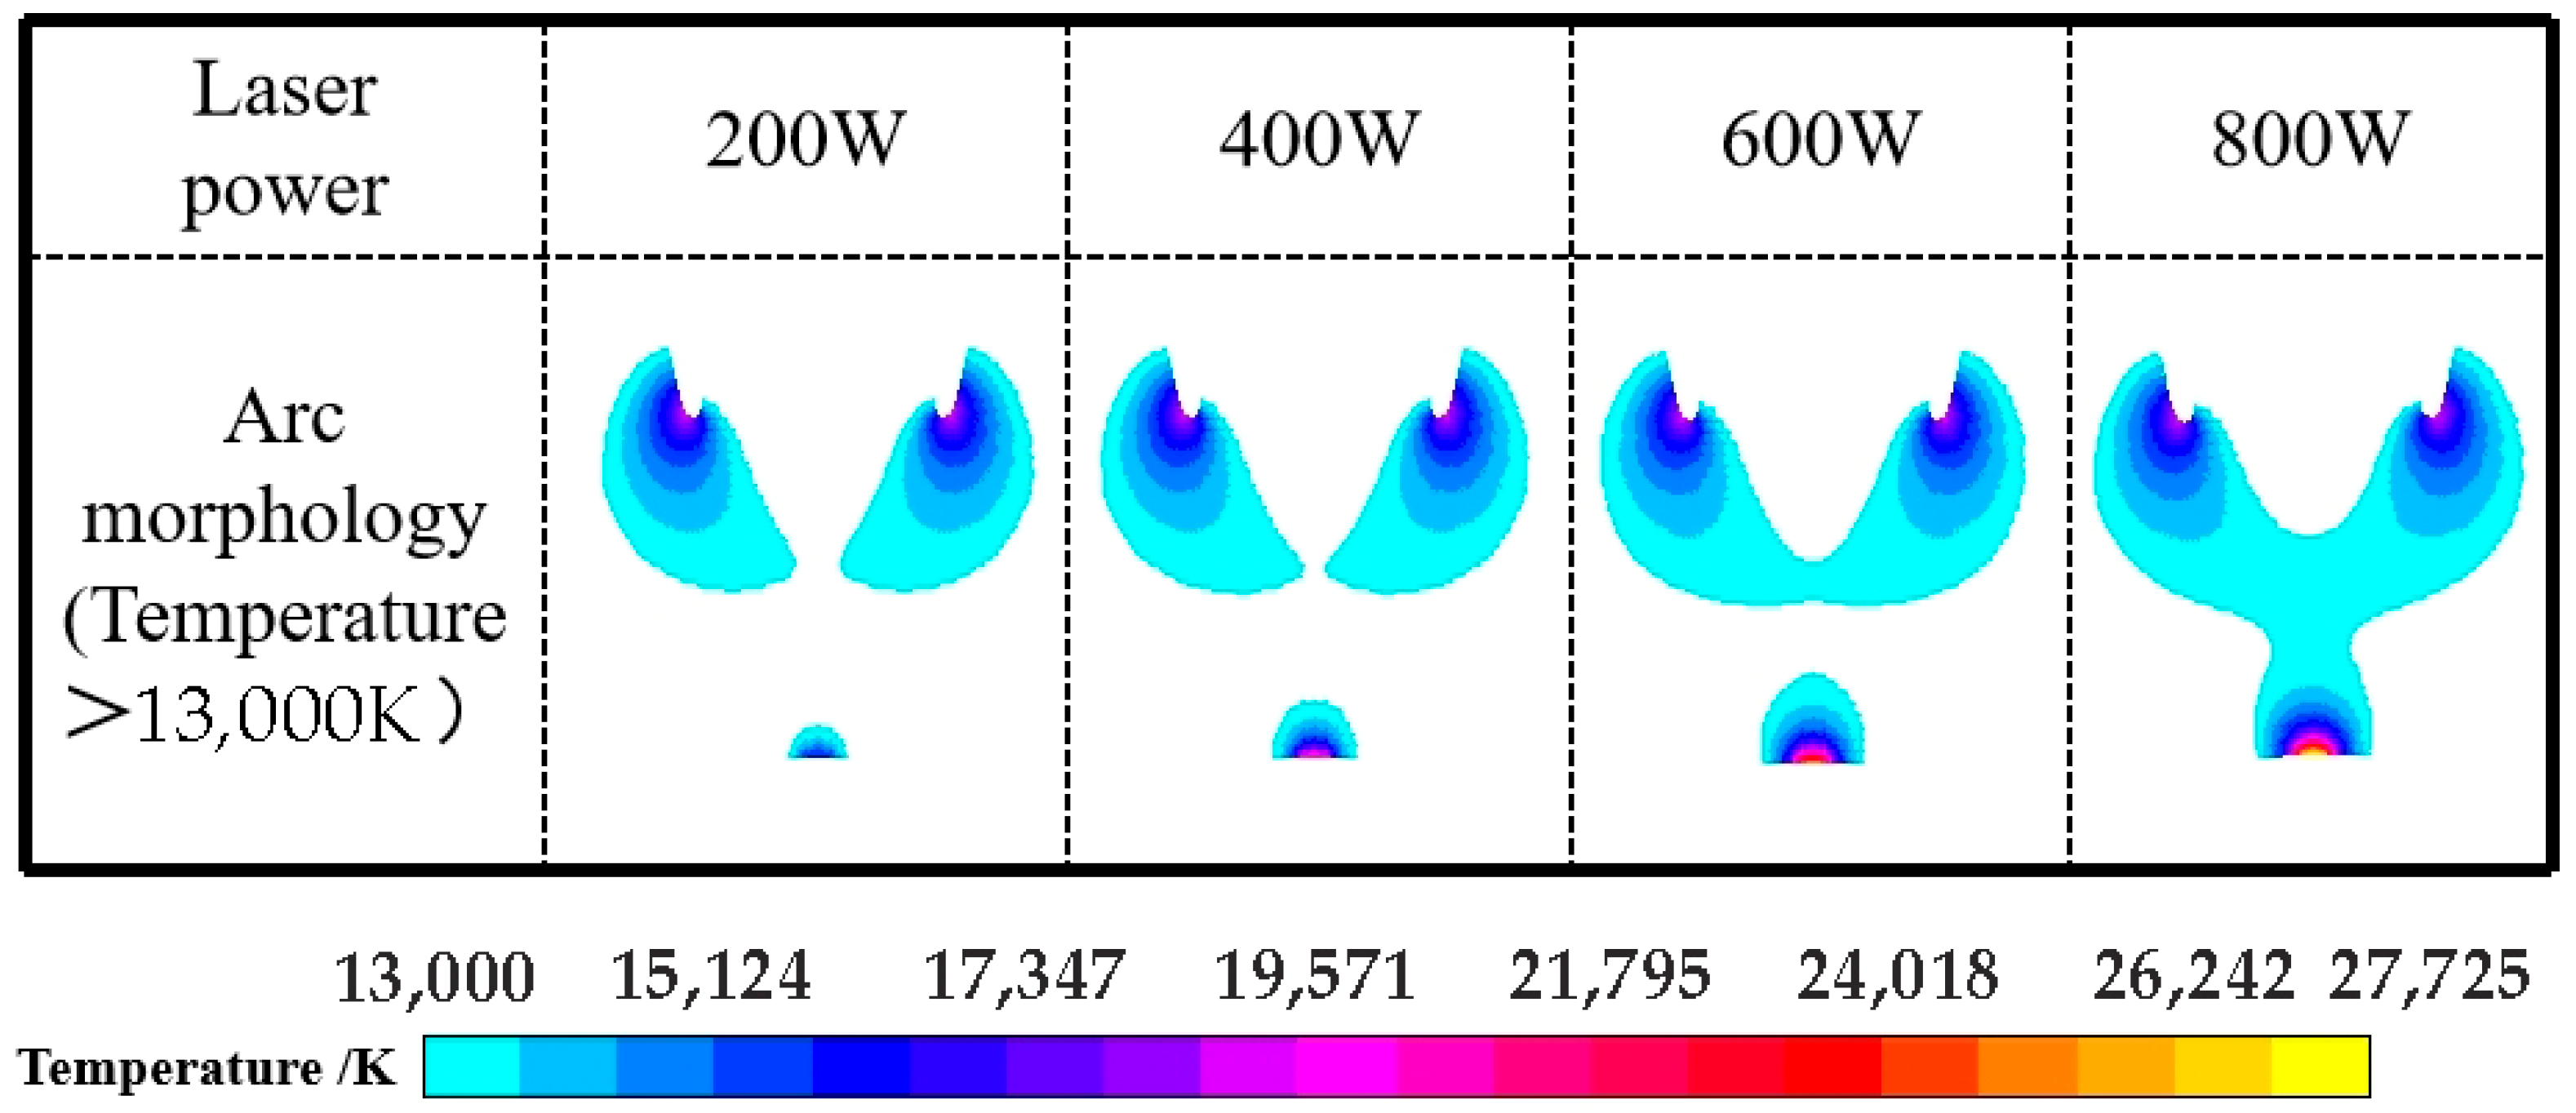
Next, the variation in the high-temperature zone (T > 13,000 K) of HTAAL with laser power is analyzed. The width of the high-temperature zone in HTA is 3.5 mm, while the widths of HTAAL under laser power conditions of 30 W, 40 W, 60 W, and 100 W are 2.46 mm, 2.469 mm, 2.47 mm, and 2.634 mm, respectively. The HTAAL volume shows a significant contraction in comparison. However, as laser power increases, the width of the high-temperature zone gradually increases.
As laser power increases from 200 W to 800 W, the high-temperature core region of the coupled heat source exhibits two characteristics. First, as shown in
Figure 7, the height of the high-temperature region along the axis increases significantly. Second, the temperature peak at the laser action point rises considerably. The increase in the height of the high-temperature zone is influenced by two factors. One factor is the significant increase in the height of the high-temperature plasma zone above the laser focal point with increasing laser power. The other factor is the expansion in both the area and height of the temperature zone at the central position of the heat source.
When the laser power is less than 400 W, the arc temperature along the laser transmission path remains below 13,000 K. According to the research findings of Jiang [
9], the high-temperature area of the arc can hinder laser energy transmission. However, at this stage, the arc remains nearly transparent to laser energy transmission, maintaining good stability throughout the process. When the laser power increases to 600 W, the high-temperature plasma below the tungsten electrode becomes continuous, with a height of about 0.5 mm. Additionally, the high-temperature plasma area above the laser impact point reaches a height of 1 mm. At this stage, the high-temperature arc region begins to affect laser energy transmission. When the laser power increases to 800 W, the arc temperature along the laser transmission path exceeds 13,000 K, completely obstructing laser energy transmission. This leads to a rapid increase in the temperature of the coupled heat source, a significant expansion in volume, and a sharp decline in stability.
3.3. Photo-Induced-Plasma-Induced Arc Discharge Process
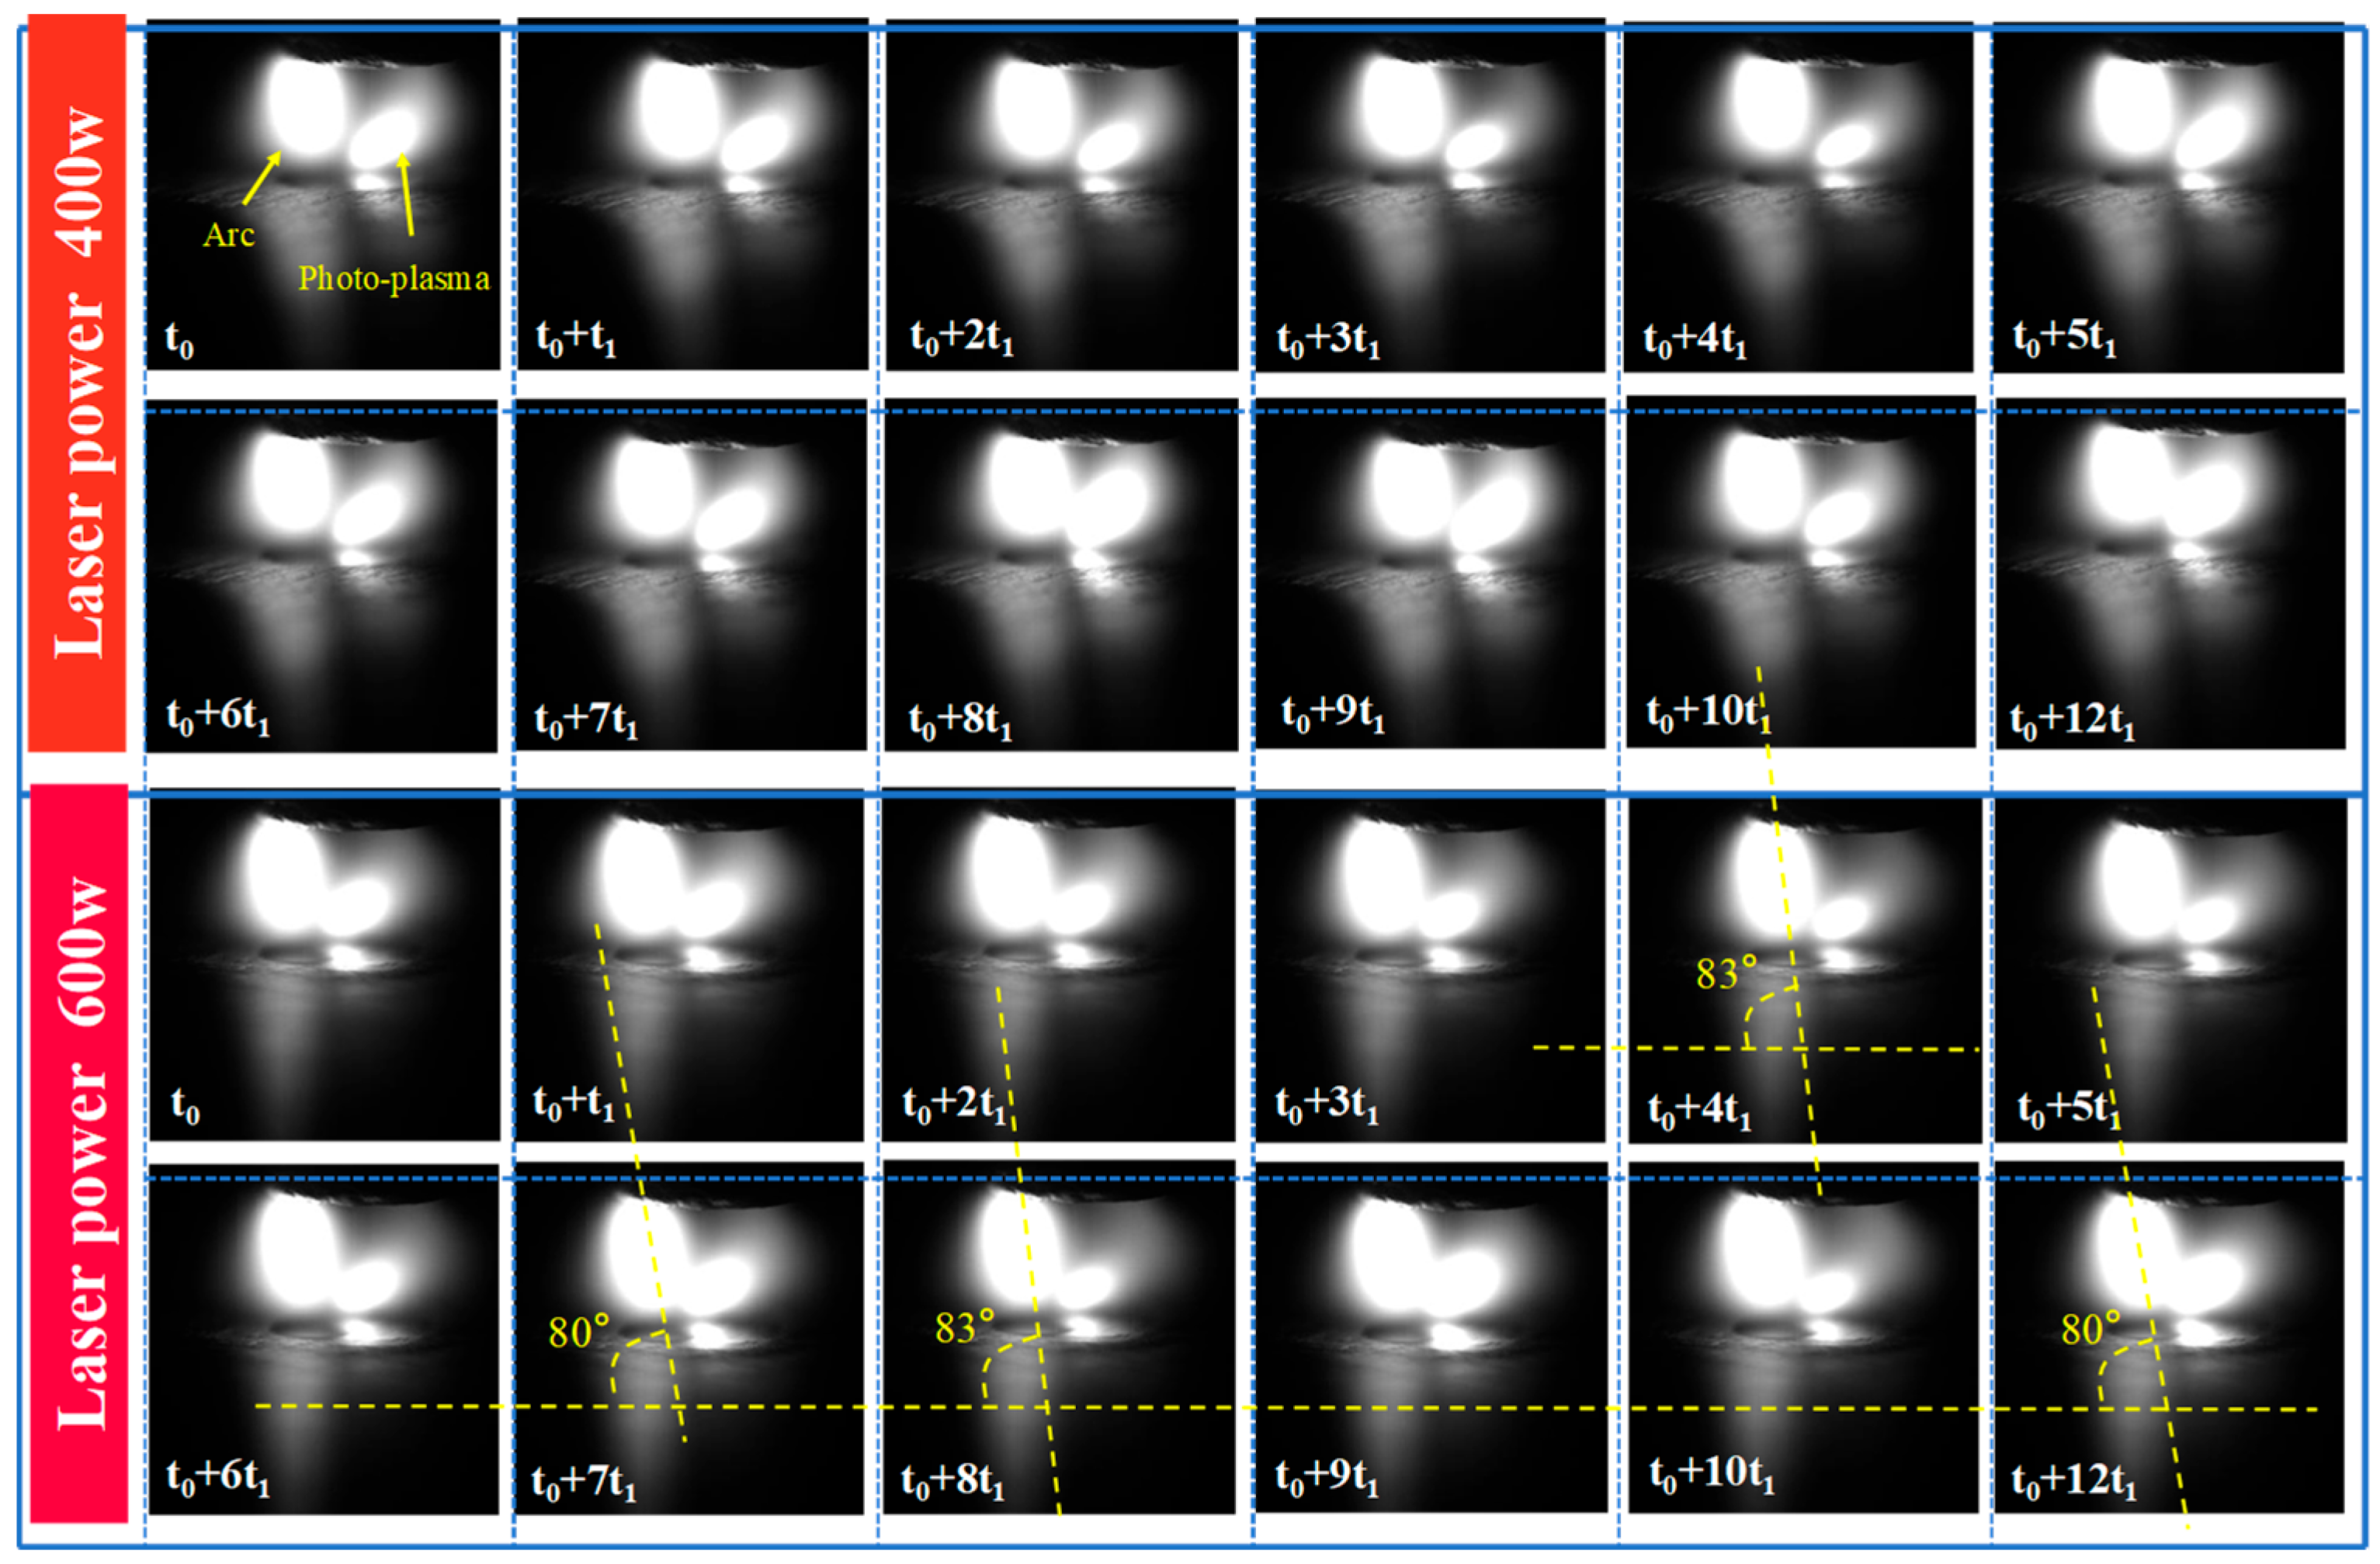
As seen in
Figure 8, the attractive compression effect of the laser on HTA is primarily due to the interaction between the plasma generated by the laser and the arc plasma. Two distinct bright regions can be observed in the coupled heat source: one is the arc plasma, and the other is the plasma cluster formed by laser irradiation. During the welding process under different laser power conditions, the photo-induced plasma undergoes continuous growth and recovery over time due to the following reasons: although the laser power remains constant, the plasma blocks the transmission of laser energy, so the laser power reaching the surface of the workpiece is in periodic fluctuation. In laser welding, the laser passes through the plasma region. And when the volume of the plasma is smaller, the path of the laser through the plasma is shorter, the energy reaching the surface of the workpiece is higher, the amount of metal vapor produced is higher, the amount of plasma generated by the vaporization and ionization of metal vapor is higher, and the plasma will expand in volume. Volume expansion means that the path of the laser through the plasma region is longer, the loss of laser energy is greater, the energy reaching the surface of the workpiece is reduced, the metal vapor produced is reduced, and the number of plasma decreases, and the volume of the plasma group stops increasing. When the metal vapor decreases, the plasma generated by ionization cannot be replenished in time, and the volume of the plasma group begins to decrease. The volume of the plasma group is reduced, the path through which the laser passes is shorter, the loss of laser energy is less, and the production of metal vapor is increased. Therefore, in laser welding, although the laser output power is constant, the actual energy reaching the surface of the workpiece changes periodically, so the volume of the laser plasma also changes periodically.
However, the size of the laser plasma and the period of its growth and recovery vary with different laser power levels, resulting in differences in the strength of the laser plasma’s attraction to the arc. When the laser power is 400 W, the arc and the photo-induced plasma cloud remain mostly separated for the majority of the time. From time t0 to t0 + 4t1, the photo-induced plasma cloud gradually decreases in size, with a 75% reduction in volume. From t0 + 4t1 to t0 + 5t1, the plasma cloud expands rapidly, reaching its maximum size at t0 + 8t1, after which it begins to decrease again. The photo-induced plasma cloud follows a cyclic pattern of expansion and contraction, with a complete cycle duration of 2.22 ms.
The difference between a 600 W laser and a 400 W laser is that the arc plasma and the photo-induced plasma remain connected throughout the entire welding process, indicating a stronger attraction of the laser to the arc. As shown in
Figure 6, at time t
0 + 7t
1, the volume of the laser-induced plasma is larger than at t
0 + 4t
1, and the deviation caused by the arc being attracted by the laser is also greater. The angle between the arc axis and the horizontal plane decreases from 83 degrees to 80 degrees. As the volume of photo-generated plasma increases, its attraction to the arc becomes stronger, reducing the sag of the arc by 3 degrees. The volume of photo-generated plasma decreases gradually from its maximum at time t
0 to the minimum at t
0 + 4t
1, then begins to grow again, reaching its maximum at t
0 + 7t
1. The total duration of this volume fluctuation is 1.95 ms, which is 25% faster than the growth rate of plasma under a 400 W laser. The period of volume change is shortened by 0.278 ms. For a 600 W laser, both the minimum and maximum volumes of the laser-induced plasma plume are smaller compared to a 400 W laser. The variation in the volume of photo-generated plasma and the increase in temperature at the laser irradiation point contribute to the higher frequency of interaction between the laser and the arc as laser power increases. As laser power increases, the maximum volume of the photo-induced plasma decreases, while the frequency of periodic volume variation accelerates.
3.4. Discharge Mode Transition
Figure 9 illustrates the effect of laser power on the current density in the HTAAL space and on the workpiece surface during discharge. The discharge method of HTAAL undergoes a fundamental change compared to HTA. Due to the ring-shaped structure of the hollow tungsten electrode tip, the discharge on the workpiece surface also forms a ring shape. As a result, the current density distribution in the HTA space is cylindrical. The width of the cylindrical region where the current density exceeds 1 × 10
7 A/m
2 is about 6 mm, and the ring diameter is about 4 mm. After the laser is applied to the HTA, the high temperature at the laser irradiation point enhances thermal electron emission, shifting the discharge position from the original ring-shaped region to the laser irradiation point. Consequently, the ring discharge mode of HTA transforms into the central spot discharge mode of HTAAL. As laser power increases, the electron emission capability at the laser irradiation point strengthens, and the current density continues to rise. As shown in
Figure 10, when the laser power increases from 100 W to 600 W, the peak current density increases from 8 × 10
6 A/m
2 to 1.95 × 10
7 A/m
2. However, the current density does not increase indefinitely. When laser power reaches 600 W, the current density approaches its peak. As the laser power continues to increase, the current density begins to decline. When the laser power increases to 1000 W, the peak current density decreases from 1.95 × 10
7 A/m
2 at 600 W to 1.4 × 10
7 A/m
2. With the increase in laser power, the current density of HTAAL discharge first increases and then decreases.
Concentrated discharge increases the current density above the laser irradiation point on the workpiece while reducing the current density further from the spot. The spatial current density of HTAAL is redistributed, transforming from the original cylindrical shape of HTA to an inverted gourd shape. The upper width of the gourd is about 2 mm, while the lower width is about 1.2 mm. As laser power increases, the spatial current density distribution of HTAAL consistently maintains this inverted gourd shape. As shown in
Figure 9, when the laser power reaches 60 W, the discharge mode changes, and the spatial current density of HTAAL is redistributed. This change corresponds to the reduction in HTAAL volume observed in
Figure 4. Therefore, the shift in discharge mode is a key factor in the reduction in HTAAL arc volume under low-power laser conditions.
Referring to
Figure 2, as laser power increases from 200 W to 800 W, the volume of HTAAL discharge first increases and then expands. The inflection point of the volume change corresponds to the inflection point of the current density at the laser irradiation point. When the current density at the laser irradiation point increases, the discharge volume also expands. However, when the volume expansion becomes unstable, the current density at the laser irradiation point decreases.
The irradiation effect of the laser enhances the ability of the anode to emit electrons and increases the volume of the arc. However, when the discharge arc expands beyond a certain limit, it becomes unstable, preventing the laser from penetrating the arc and reaching the workpiece. As a result, the laser energy reaching the workpiece decreases, the electron emission at the laser irradiation point decreases, and the current density decreases.
3.5. Electrical Conductivity
The voltage change during HTAAL discharge is shown in
Figure 11a, with a welding current of 200 A. The voltage variation from arc ignition to arc extinction can be divided into three stages: the arc ignition stage, the stable stage, and the slow decrease stage. A voltage drop occurs from arc ignition to stabilization, which takes about 1 s. This is followed by the stable burning stage, where the voltage remains relatively constant for about 6 s. According to the research findings of Wu [
20], in laser-arc hybrid welding, the generation of metal vapor under laser action increases, leading to a rise in the number of electrons produced by metal vapor ionization. As a result, electron density and electron temperature increase, improving arc conductivity and gradually reducing resistance. Consequently, the arc voltage decreases slowly over time.
Combined with the previous study of current voltage variation curve of HTAAL and HTA [
8], under the same current conditions, the curve positions of the coupled heat sources in all three stages are lower than those of HTA, indicating improved electrical conductivity. During the descending phase of the curve, the voltage reduction rate of HTAAL is greater than that of HTA. The position of the 400 W curve is higher than that of the 200 W curve. In the small current stage, where the arc is compressed, the arc temperature remains low. Higher laser power enhances the compression effect on the arc, resulting in slower expansion of the arc volume, reduced conductivity, and higher voltage. During the flat characteristic stage, the voltages for HTA and HTAAL at 200 W and 400 W are maintained at 13.2 V, 12 V, and 12 V, respectively. However, the current ranges where the voltage remains constant differ, with values of 100 to 200 A for HTA, 80 to 120 A for HTAAL at 200 W, and 120 to 150 A for HTAAL at 400 W. The current widths during the flat characteristic phase for hollow tungsten TIG welding, the 200 W laser-arc coaxial combined heat source, and the 400 W laser-arc coaxial combined heat source are 100 A, 40 A, and 30 A, respectively. Compared to HTA, the flat characteristic stage of the coaxial combined heat source is shorter. As laser power increases, the duration of the flat characteristic stage becomes shorter. At the initial stage of the curve climb, as the welding current increases from 120 A to 180 A, the voltage of the 400 W HTAAL is lower than that of the 200 W HTAAL, indicating that higher laser power enhances arc conductivity. As the current continues to increase, the voltages of both become equal, suggesting that the effect of the laser at this stage is not significant, and the thermal effect of the welding current begins to dominate conductivity. The intersection of the two HTAAL curves marks the turning point where the arc volume transitions from compression to expansion.
Equation (1) is used to calculate arc conductivity.
In the equation,
Te,
me,
e, and
λ, represent the electron temperature, electron mass, charge, and mean free path of electrons, respectively. The calculation results are shown in
Figure 12b, where the conductivity of the 60 W HTAAL is found to be 3% higher than that of HTA. As laser power increases from 40 W to 400 W, conductivity increases linearly. When laser power exceeds 400 W, conductivity rises rapidly, and at 600 W, HTAAL conductivity is 89% higher than that of HTA. The conductivity of HTAAL follows a trend of an initial slow increase, followed by a rapid increase, and then a decrease as laser power continues to rise.
In summary, the effect of laser power on the conductivity of HTAAL is related to the welding current and can be divided into three stages. In the low-current stage, higher laser power results in lower conductivity. In the high-current stage, conductivity remains unchanged as laser power increases. Between these two stages, higher laser power leads to higher conductivity.
3.6. Penetration Effect
Figure 12 shows the penetration depth under stable discharge of HTAAL at different laser powers, with a welding current of 150 A and a welding speed of 60 mm/min. As laser power increases, the melting depth increases slowly. When the laser power reaches 400 W, the melting depth increases significantly and becomes twice that of HTAAL. The melting depth variation curve under welding current conditions of 100 A and 150 A is analyzed statistically, and the results are shown in
Figure 12. With the increase in laser power, the melting depth first increases and then decreases. The rapid increase in penetration depth is related to the transition of HTAAL to a central spot discharge and the increase in current density. The decrease in penetration depth is caused by excessive laser power, which leads to a large height of the HTAAL high-temperature zone. This obstructs laser energy transmission, causes arc expansion, reduces the laser energy reaching the workpiece surface, and decreases current density.

