1. Introduction
The pipeline anticorrosion coating repair spraying process lies between sandblasting rust removal and the installation of heat-shrink sleeves in the anticorrosion repair procedure. It bridges the treatment of the sandblasted surface and enhances the adhesion of heat-shrink sleeves to the pipe wall, making it a critical step in pipeline construction and maintenance. In practice, the geometric complexity of weld seams and the variations in coating thickness create significant challenges. If the spraying is uneven, weak points, bubbles, or wrinkles may occur, quickly becoming sites of corrosion initiation and significantly shortening the pipeline’s service life. Therefore, the technical level of this process directly determines the overall performance and long-term reliability of the anticorrosion system. According to reports from NACE and related studies [
1,
2,
3,
4], the global direct economic loss caused annually by pipeline corrosion—including failures associated with inadequate field-joint coating—amounts to more than one hundred billion USD. Pipeline transportation serves as the lifeline of energy supply, and anticorrosion coatings are essential for ensuring its long-term safe operation. Thus, how to achieve rapid and precise implementation of pipeline anticorrosion repair spraying, as well as how to extend the service life of anticorrosion repair processes, have become focal issues in the pipeline maintenance and emergency repair industry [
5,
6,
7,
8,
9,
10].
At present, manual repair spraying is inefficient, with coating thickness fluctuations reaching ±50 μm, making it difficult to meet modern industrial demands for high precision and high efficiency. With the rapid development of industrial automation technology, automated spraying systems are gradually becoming mainstream. Automated spraying technology can achieve high repeatability through program control, reducing human interference and significantly improving the stability of coating quality. Graco [
11] launched the XM70 multi-component high-pressure airless spraying system, which uses PLC control to realize closed-loop monitoring of spraying ratio, temperature, pressure, and coating thickness. In typical applications, it can complete internal and external pipe segment coating within 30 min while maintaining approximately 500 μm thickness consistency. Bonatti [
12] developed the “MCL Machine” for weld seam coating repair scenarios, achieving uniformity and high repeatability of coating thickness through precise control of spraying speed and mixing ratio. In addition, CRC Evans [
13] provides automated equipment packages such as SABRE, IMPP, MCL, and FFJ, capable of performing automatic weld seam sandblasting, preheating, and precise overlay of powder/liquid coatings, widely applied in both onshore and subsea pipeline coating operations. VR Coatings [
14] offers an automated external wall spraying system that employs high-pressure airless spray guns and automated travel mechanisms, improving efficiency, stability, and coating uniformity in repair applications. The background of this study is based on the field of pipeline joint coating, which exhibits a considerable degree of process specificity. The joint-coating procedure exerts a certain influence on both the properties of the coating material and the spraying method.
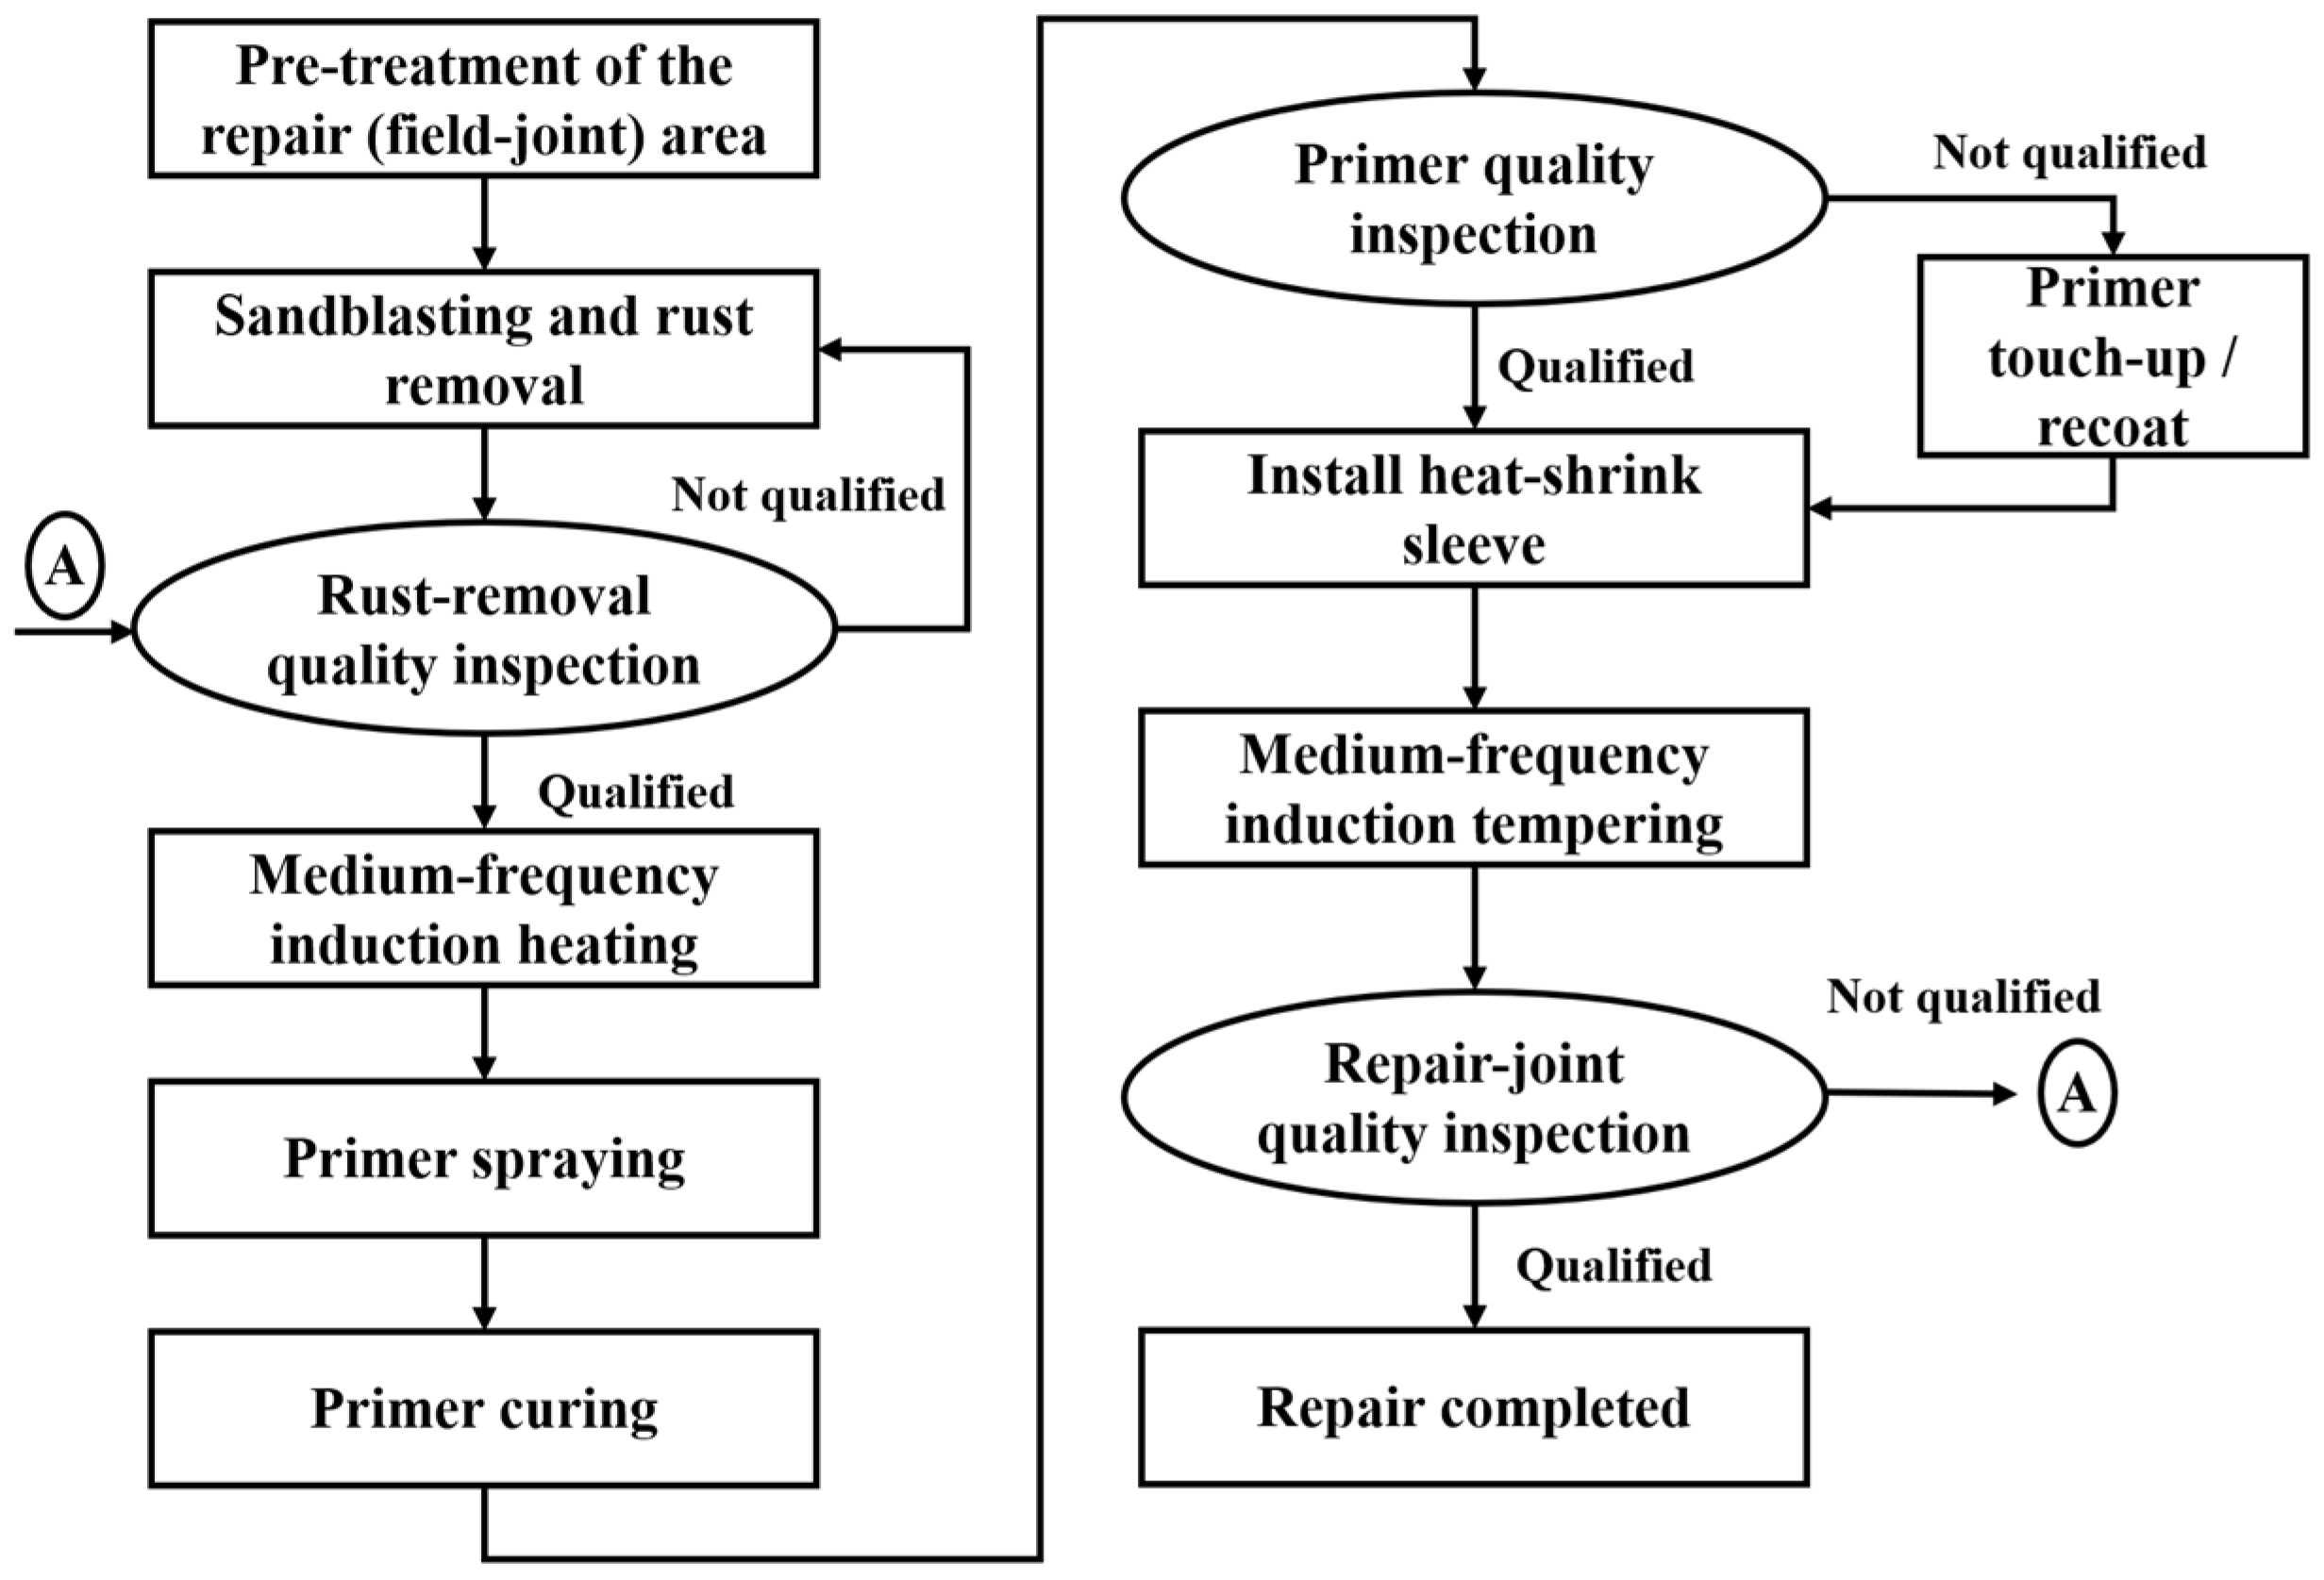
The repair and anticorrosion procedure for field joints is a crucial step in ensuring the continuity and sealing integrity of the anticorrosion layer on buried steel pipelines. As illustrated in
Figure 1, the primary workflow comprises the following: cleaning of the weld and surrounding areas; abrasive blasting for rust removal; preheating of the pipe surface; application of an epoxy primer with a thickness not less than 200 µm and natural curing followed by installation of a heat-shrink sleeve. During sleeve installation, the primer and overlapping region must be reheated to specified temperatures. A thermally activated adhesive-type polyethylene heat-shrink sleeve is applied to encapsulate the joint. Controlled flame and/or induction heating are used to achieve uniform shrinkage and tempering, resulting in an anticorrosion structure with an overlap width of at least 100 mm, free of bubbles and wrinkles. The entire process must be conducted under environmental conditions—temperature, humidity, and wind speed—that comply with relevant standards, and quality control must be ensured through temperature monitoring, coating thickness measurement, holiday detection (spark testing), and adhesion peel testing, thereby guaranteeing the long-term corrosion resistance of the welded joint. If the final quality inspection of the joint coating does not meet the quality requirements, the joint coating process needs to be rechecked, as shown at node A in
Figure 1.
Conducting numerical simulation to study the paint application process offers advantages including precise boundary condition control, lower experimental costs, shorter operational cycles, and the ability to perform repeatable simulations under identical conditions, which significantly improves design optimization feasibility. Consequently, numerical modeling, particularly CFD, holds substantial value in investigating spray coating mechanisms. With the advancement of CFD technology, the simulation of film formation under diverse conditions can ideally be elucidated through integration with experimental data.
For instance, Yu Kun et al. [
15] utilized CFD to analyze how variations in spray pressure and atomization gas pressure in an atomizing spray gun affect the characteristics of the spray flow field and coating stability, thereby identifying optimal spray parameter ranges. Conner et al. [
16] and Zhao et al. [
17] developed mathematical models for film thickness distribution in electrostatic rotary cup spraying based on planar analyses of the influence of cup rotation speed; however, the applicability of these models is restricted to electrostatic rotary cups and becomes invalid if replaced by air spray guns. J. Liu et al. [
18] established a Euler–Euler CFD model for static cylindrical surface spraying, investigating the effects of spray-gun height and inclination angle on liquid film thickness and uniformity, with numerical prediction achieved via Gaussian fitting—offering guidance for spray path design. Li et al. [
19] employed a more refined CFD−DEM coupled simulation considering droplet collisions and wall adherence behaviors, performing statistical analysis on air-spray coating thickness within a channel cross-section to reveal the effects of rotation speed and turbulence models on coating uniformity. Xie and Wang et al. [
20] focused on multi-nozzle interference effects; through Euler–Lagrange CFD simulations, they demonstrated that a triple-nozzle configuration improves coating width and thickness uniformity compared to single or dual nozzles, and proposed optimization suggestions for nozzle geometry parameters. Although previous studies using CFD have revealed the effects of spray-gun height, angle, and geometry on coating thickness, most of these works are restricted to static conditions and lack dynamic modeling of the “spray-gun trajectory–geometric surface coupling” scenario. They do not simultaneously capture the instantaneous kinematic characteristics of the nozzle along its path and the temporal evolution of the spray imprint on the curved surface (under the assumption of steady motion).
Therefore, the present study combines theoretical modeling with numerical simulation to propose an improved cylindrical coating deposition model. Using CFD software (ANSYS Fluent, version 2024R1) in conjunction with response surface experimental design, the effects of parameters such as spray distance and traverse speed on coating uniformity are elucidated. The research outcomes are expected to provide theoretical support and technical reference for the intelligent control of automated spray coating processes.
2. Materials and Methods
2.1. Planar Coating Deposition Model
In spray operations, the spray gun is rigidly fixed relative to the workpiece, with its axis maintained perpendicular to the target surface. The spatial distribution of the coating is influenced by various factors—including spray gun design, air pressure, nozzle geometry, and more. Any change in one of these parameters alters the characteristics of the deposition.
To simplify the model, the following assumptions are applied: the system operates under moderate working pressure, and the spray cone angle is confined within a small range to ensure atomization quality. These assumptions are based on the actual operating parameters of common industrial spraying equipment and are feasible in engineering applications. However, these assumptions neglect possible droplet breakup under high-pressure conditions and atomization non-uniformity under large spray-cone angles. Therefore, their applicability is mainly limited to spraying environments with medium pressure and small cone angles. Under these conditions, when the nozzle operates within a range of
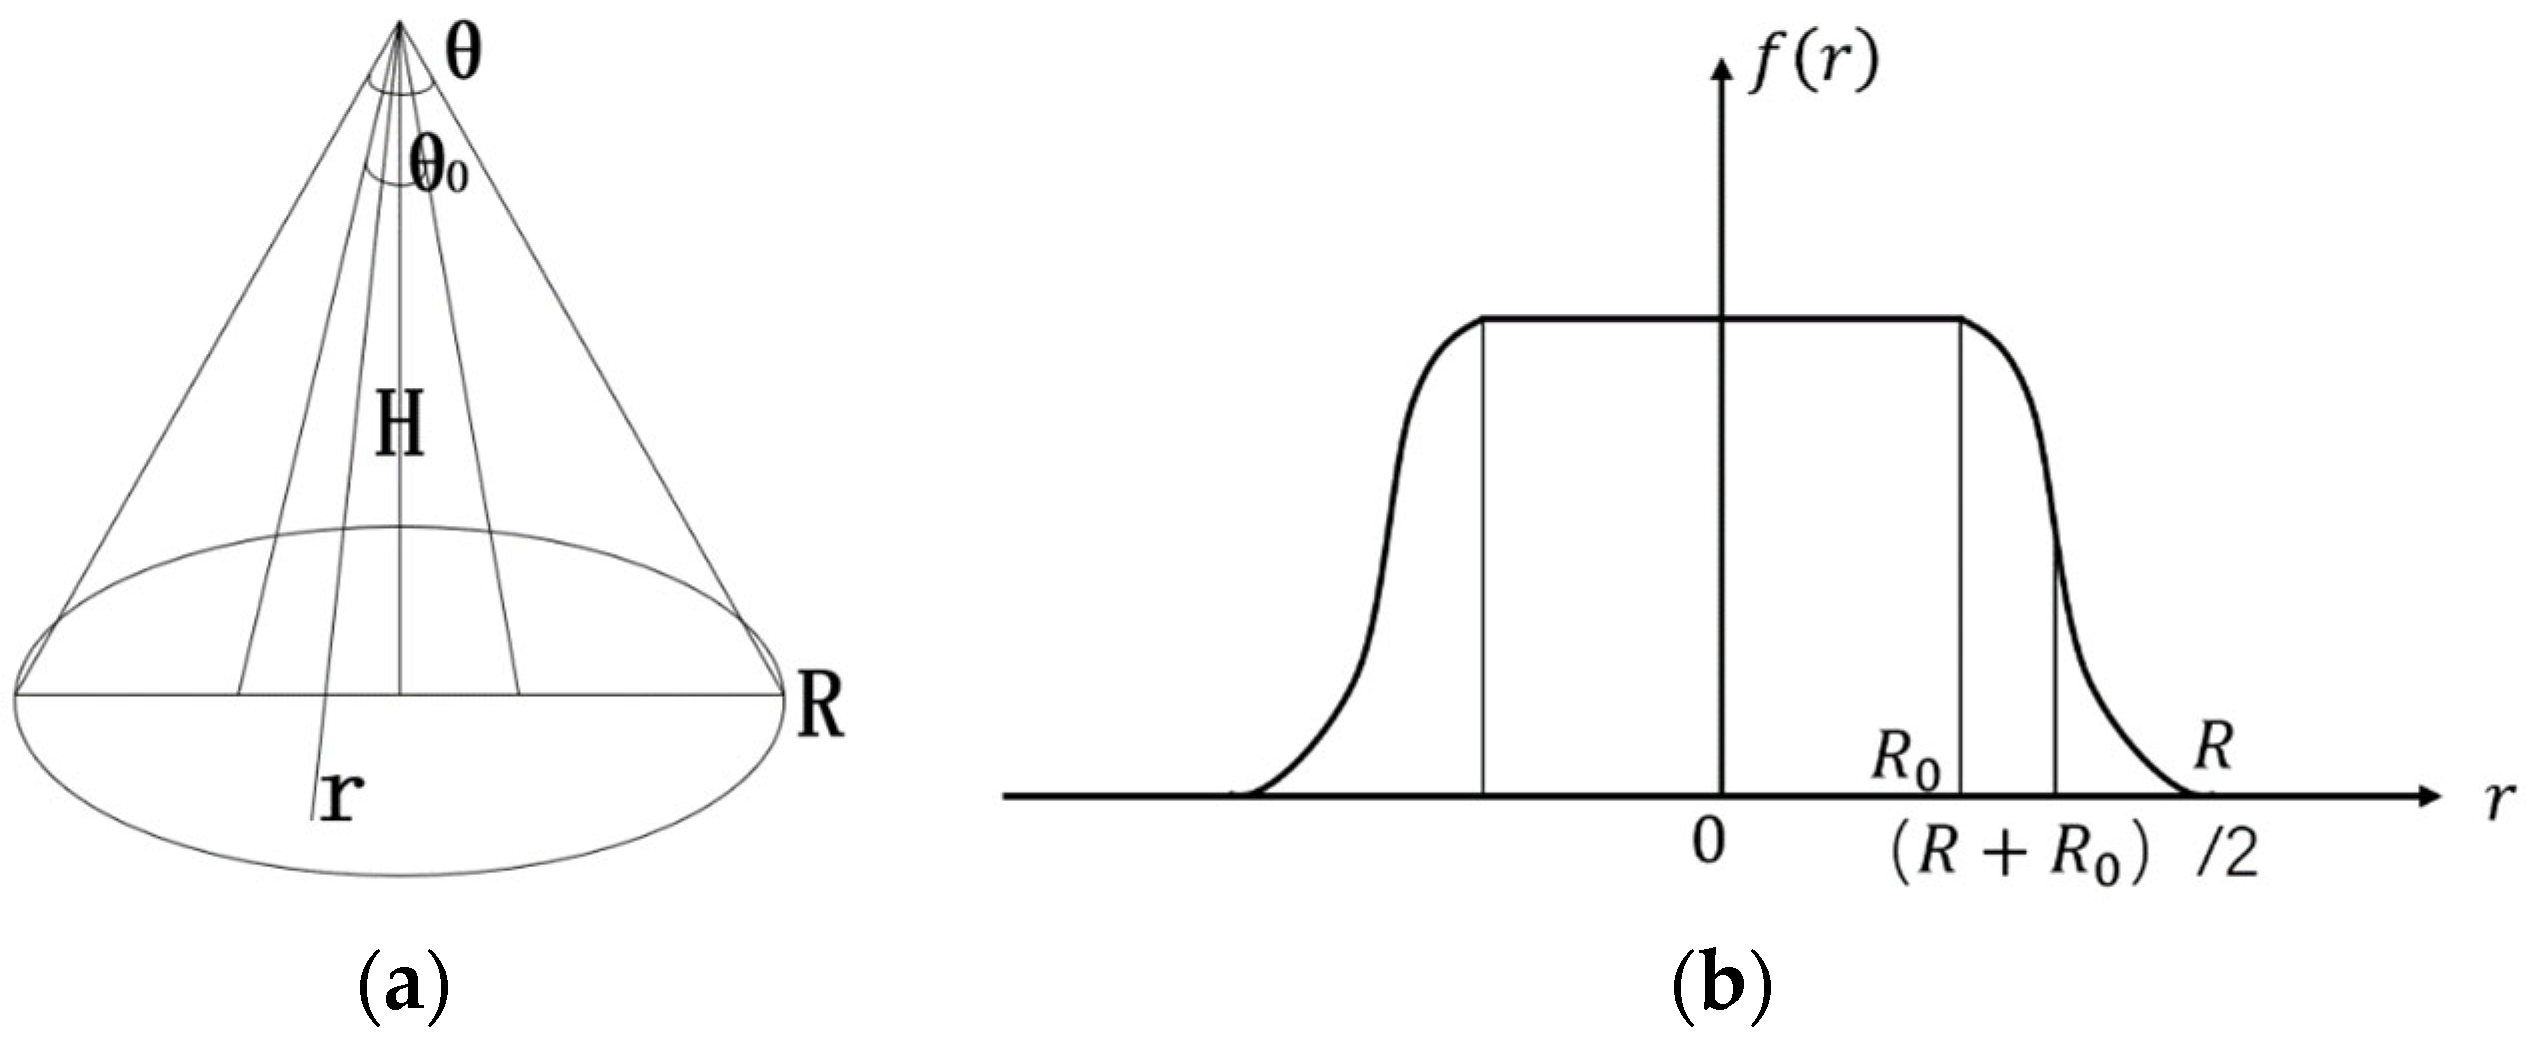
, a uniform coating thickness distribution is achieved. The spray region on the workpiece is approximately treated as circular [
21], as shown in
Figure 2a. Additionally, the deposition process is modeled using a quadratic Bézier curve, with the growth-rate function depicted in
Figure 2b.
It is essential to rigidly fix the spray gun relative to the workpiece and ensure that the gun axis remains perpendicular to the target surface. The spatial distribution model of the coating is influenced by multiple factors, including spray-gun architecture, air pressure, and nozzle geometry. Any change in these parameters will alter the characteristic profile of the deposited coating. In the model, let D denote the coating thickness (mm) deposited over the interval per unit time; represent the radius (mm) within which the coating distribution remains uniform; and R denote the overall radius (mm) of the spray coverage.
To ensure that the piecewise deposition distribution function
is consistent with the actual spray pattern, this study calibrates the coverage radius R and the central uniform radius
based on spray-gun parameters. First, according to the atomization cone angle
and spray distance
provided in the nozzle datasheet, the initial value of the coverage radius is obtained geometrically as
Without altering the spray pressure or nozzle structure (in this study, the spray pressure was 0.7 MPa, and the nozzle diameter was 1 mm),
is taken as the initial value of the spray footprint boundary. Second, the radial profile of the near-wall coating deposition flux obtained from ANSYS Fluent is used to perform a fitting of the central “plateau region” width, which is defined as
where
is determined from the ratio of the plateau width to the outer radius, obtained either from the nozzle flow-rate distribution curve or from CFD profiles. Third, a calibration experiment was conducted by spraying onto a steel plate for 1 s (under the same material and environmental conditions as in
Section 3.3). Thickness–radius curves were measured with a film-thickness gauge, and
and
were adjusted via least-squares fitting so that the quadratic Bézier approximation
simultaneously matched the measured plateau width and edge decay region. The final
values were confirmed once both the mean-square error and plateau-region deviation were below the prescribed thresholds.
In practical spray operations, what is needed is a mathematical expression for the coating thickness on the sprayed surface, which offers clarity and directness in analysis [
22]. The total flow rate over the entire cross-section, denoted as
, is given by:
The formula for calculating the thickness of the coating is written as follows:
In the dynamic spraying process, the coating thickness at any arbitrary point on the workpiece surface is expressed as the integral of the deposition contributions along the spray path over time [
12]. Under the assumption of uniform deposition rate—i.e., the incremental thickness at any location within the sprayed region varies linearly with time—a mathematical model for coating growth per unit time is established. In this context, the growth-rate function aligns with that previously defined in Equation (1).
When the nozzle moves at a constant speed v while remaining perpendicular to the workpiece surface, the coating thickness at any point S within the spray footprint is described as:
In this formulation,
;
;
;
;
Here,
x represents the distance (in mm) from point S within the spray radius to the spray path. The times
, and
denote half of the spray exposure durations at point S when the nozzle travels along paths with different characteristic radii, measured in seconds (t). The variable
denotes the instantaneous distance (in mm) from point S to the projection of the nozzle center on the spray path [
23].
2.2. Cylindrical Surface Coating Deposition Model
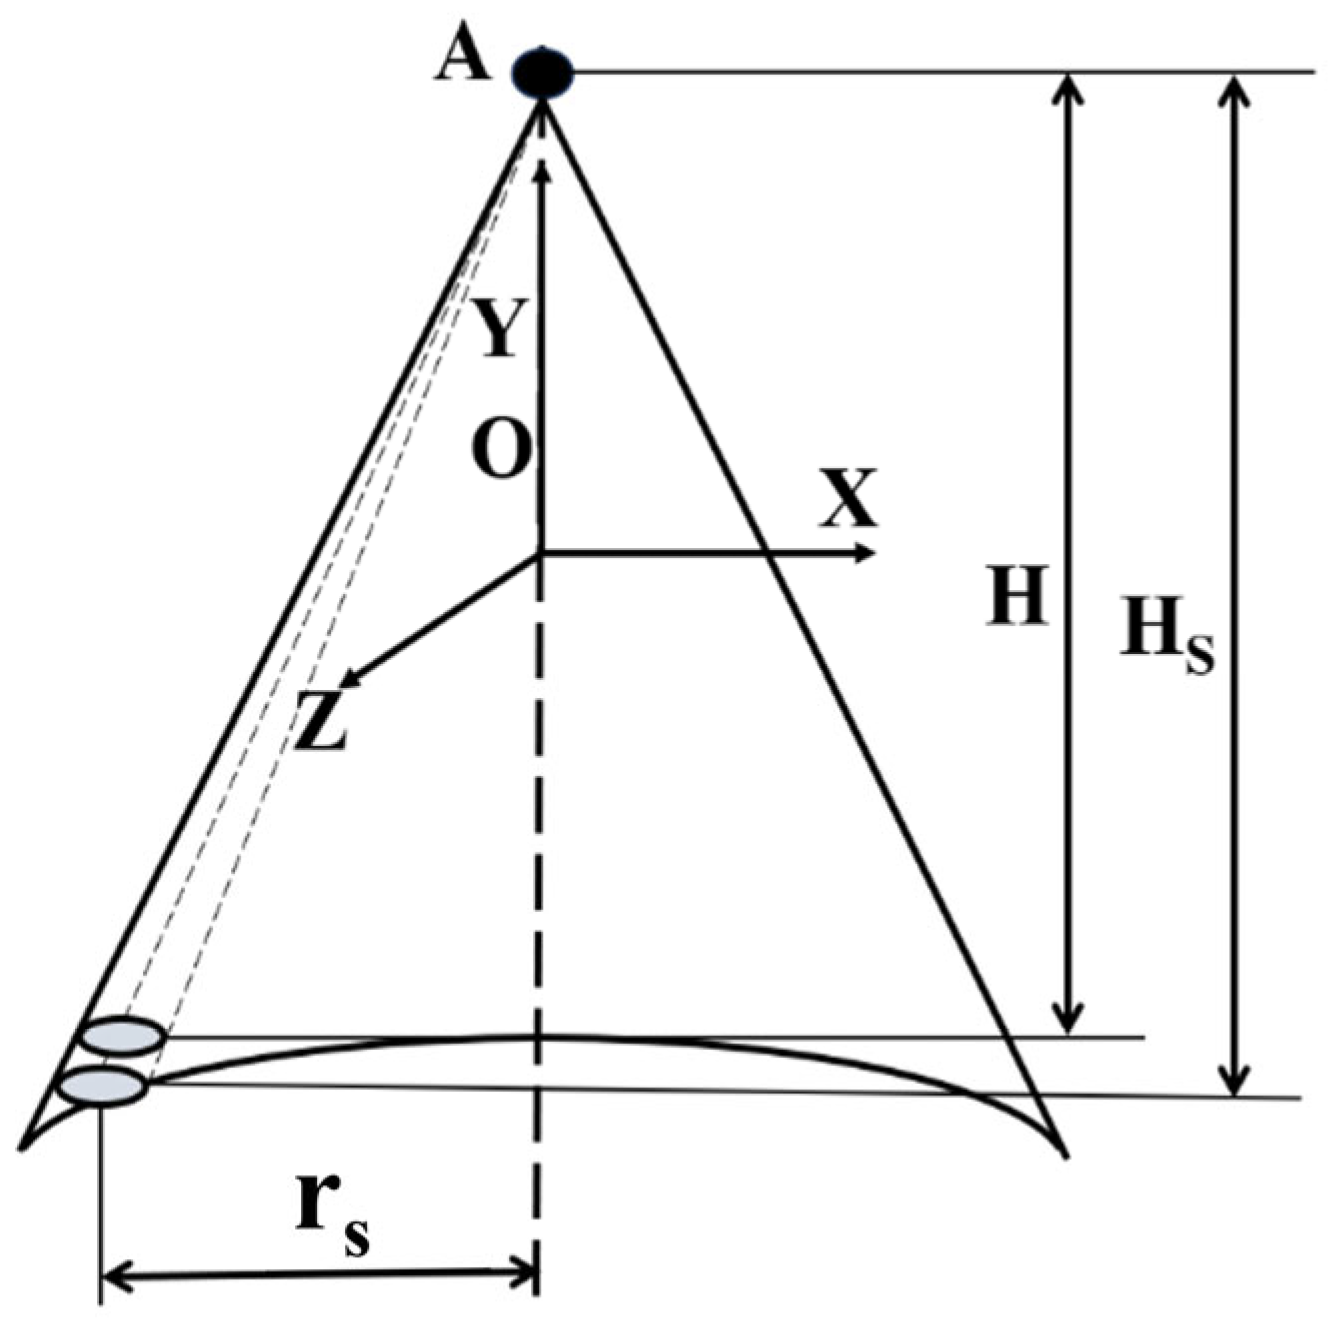
In this study, the following assumptions are made regarding the spray coating process: The repair (field joint) region remains static and undergoes no deformation during spraying; The surface of the repair area is a regular cylindrical curved surface, as depicted in
Figure 3. A Cartesian coordinate system is established with the spray center as the origin. The target surface to be coated is represented by the implicit equation:
, where
, and both functions are defined over the entire real number domain
[
24].
The general expression for cylindrical surfaces is written as follows:
For calculating the projected area of a spraying model on a circular arc surface, there is
In the formula, Sc1 denotes the planar spray area (in mm2); Sc2 represents the horizontal projection area of the spray on the curved arc surface (in mm2); Hs is the distance (in mm) from the spray gun to the projection plane; H is the actual normal distance (in mm) from the spray gun to the cylindrical (arc) surface.
The thickness variation of the vertically sprayed surface in the projection area is
In the formula, T1 denotes the coating thickness (in mm) deposited on the projection plane, and T2 denotes the coating thickness (in mm) deposited on the actual curved (arc-shaped) surface within the corresponding projected region.
To determine the coating thickness distribution over a tangential infinitesimal surface element of the curved surface, a dual-coordinate transformation based on the same spray angle must be employed. This method leverages the spatial geometric relationships among circular regions at different cross-sections under conical spraying conditions. Consequently, the cumulative deposition rate on the surface at radius
can be expressed as:
In the actual spraying process, when the deposited thickness grows beyond approximately 1 mm, gravitational forces along the circumferential direction of the cylindrical wall drive the wet film to flow, leading to a redistribution of thickness between the upper and lower surfaces of the pipeline. To capture this effect, we treat the macroscopic deposition rate term
(see Equation (11)) as the source term input for the thin-film model. The film thickness
and the average velocity
in the wall-surface coordinates satisfy the following equations:
By coupling the geometric deposition distribution Equation (11) with the thin-film dynamics model (10), the corrected film-thickness evolution equation can be obtained as follows:
Here, and denote the density and dynamic viscosity of the coating material; is the gravitational acceleration; and is the circumferential angle of the pipeline (with the top at and the bottom at ). When the film is thin (e.g., ), viscous resistance dominates and gravity-driven flow is negligible; in this case, can be approximated as the final deposited thickness. When the film is thicker (e.g., ), gravity drives the liquid film to flow from the upper to the lower surface, leading to increased thickness at the bottom and thinning at the top, thereby introducing thickness asymmetry. This model thus couples the macroscopic deposition distribution with the temporal evolution of the liquid film, providing an explanation for the occurrence of “thicker bottom and thinner top” or other asymmetric distributions during spraying on curved surfaces.
In this section, we focus on the circumferential motion during the dynamic coating process on a cylindrical surface. Under a constant movement speed, the coating thickness at any location on the cylinder can be obtained by superimposing the contributions from the deposition model along the spray path cross-sections. By unfolding the cylindrical surface into a two-dimensional plane, the spray region can be approximately represented as an ellipse.
Let aa and bb denote the semi-major and semi-minor axes of the ellipse, respectively. Point S′ is the projection of point S onto the first spray trajectory. The spray gun moves at a uniform speed v, and the distance between two adjacent trajectories is
. The distance from point S to the first trajectory is x. The model for the spray trajectory on the cylindrical surface can be expressed as follows [
25]:
of which,
2.3. Theoretical Model of the Thin Liquid Film on the Wall Surface
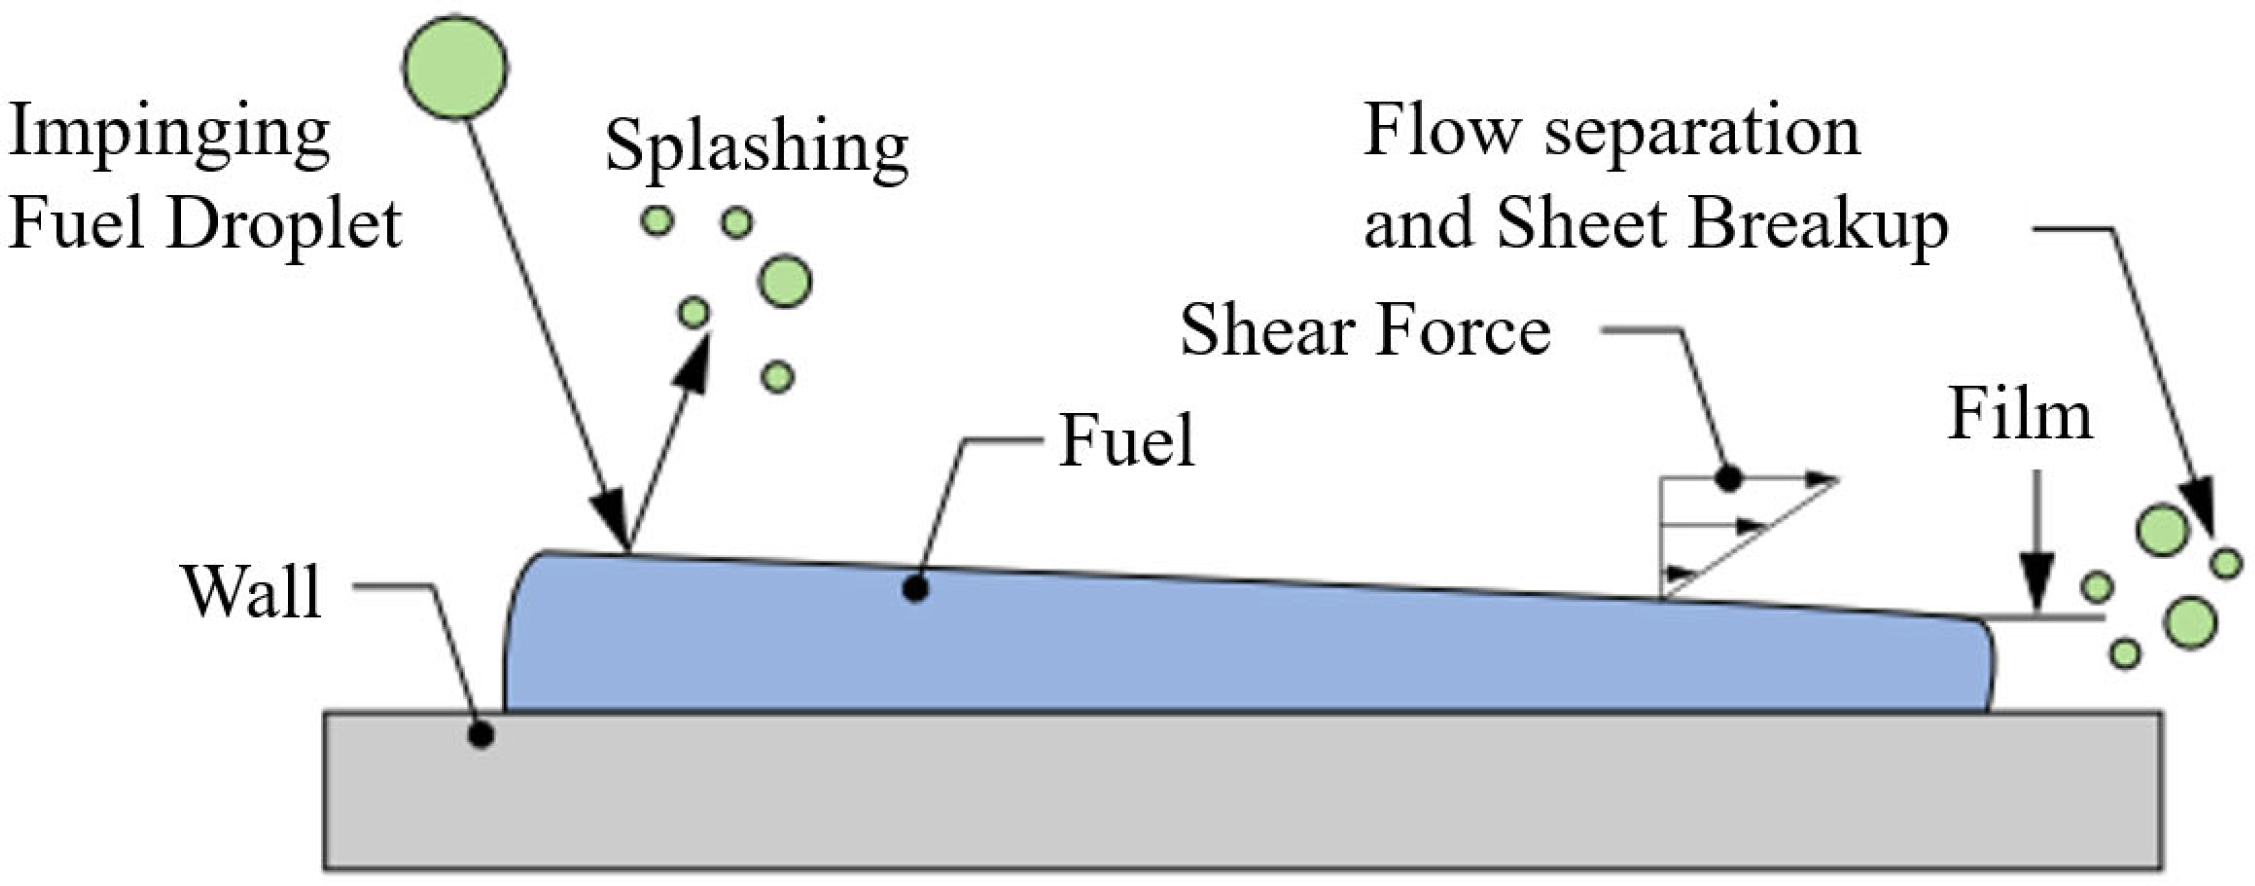
In the context of microscopic-scale interactions between droplets and solid surfaces, phenomena such as liquid film formation, shear-induced dissipation, rupture, and secondary splashing must be described using subgrid-scale methods—also known as “subgrid processes” [
26]. The wall thin-film model, as depicted in
Figure 4, employs a subgrid-scale framework to capture the entire sequence of droplet impact and film evolution: upon high-energy impact, droplets form thin films on the surface, which then spread under shear until reaching a critical limit where flow separation and film rupture produce secondary splashing droplets. These subgrid processes effectively dissipate and redistribute the droplet’s initial kinetic energy and mass—translating into film formation, shear dissipation, and ejected mass and momentum. Under varying impact energies, four canonical response regimes emerge: adhesion under low energy, featuring near-spherical static contact; elastic rebound, retaining part of the kinetic energy; film spreading at moderate energy; droplet fragmentation and splashing under high-energy impact.
Within a Euler–Lagrangian coupling framework, the thin-film model is based on three core assumptions:
- (1)
The characteristic film thickness is much smaller than the substrate’s curvature radius, allowing thickness-direction gradients to be neglected.
- (2)
The inherently three-dimensional flow can be approximated as a two-dimensional planar problem.
- (3)
A quadratic function sufficiently describes the velocity profile within the film. These theoretical simplifications maintain computational accuracy while significantly enhancing simulation efficiency, serving as a reliable basis for interface-capturing models in multiphase CFD [
27].
The mass conservation equation for a two-dimensional thin film in a three-dimensional domain is written as follows:
The conservation of momentum for liquid films is expressed as follows:
In the above expressions, is the liquid density; h is the liquid-film thickness; is the surface gradient operator; is the area-averaged velocity of the film; and denotes the mass source per unit wall area arising from droplet collection, film separation, film stripping, and phase-change processes.
The conservation of energy for the wall film is expressed as follows:
In the formulation presented, denotes the average temperature of the thin film; the vector represents the differential advection term calculated using the quadratic velocity and temperature profiles within the film; and represent the temperatures of the film surface and the wall (substrate), respectively; is the temperature at mid-depth of the film—these temperature values are computed from the spatial distribution model for TT, considering the thermal boundary conditions at the gas–film and film–wall interfaces; is the source term associated with the liquid impinging from the bulk flow onto the wall—introducing additional thermal energy; is the mass rate of evaporation or condensation per unit area; L is the latent heat associated with the phase change.
2.4. Model Introduction
2.4.1. Development of the Spraying Scenario Model
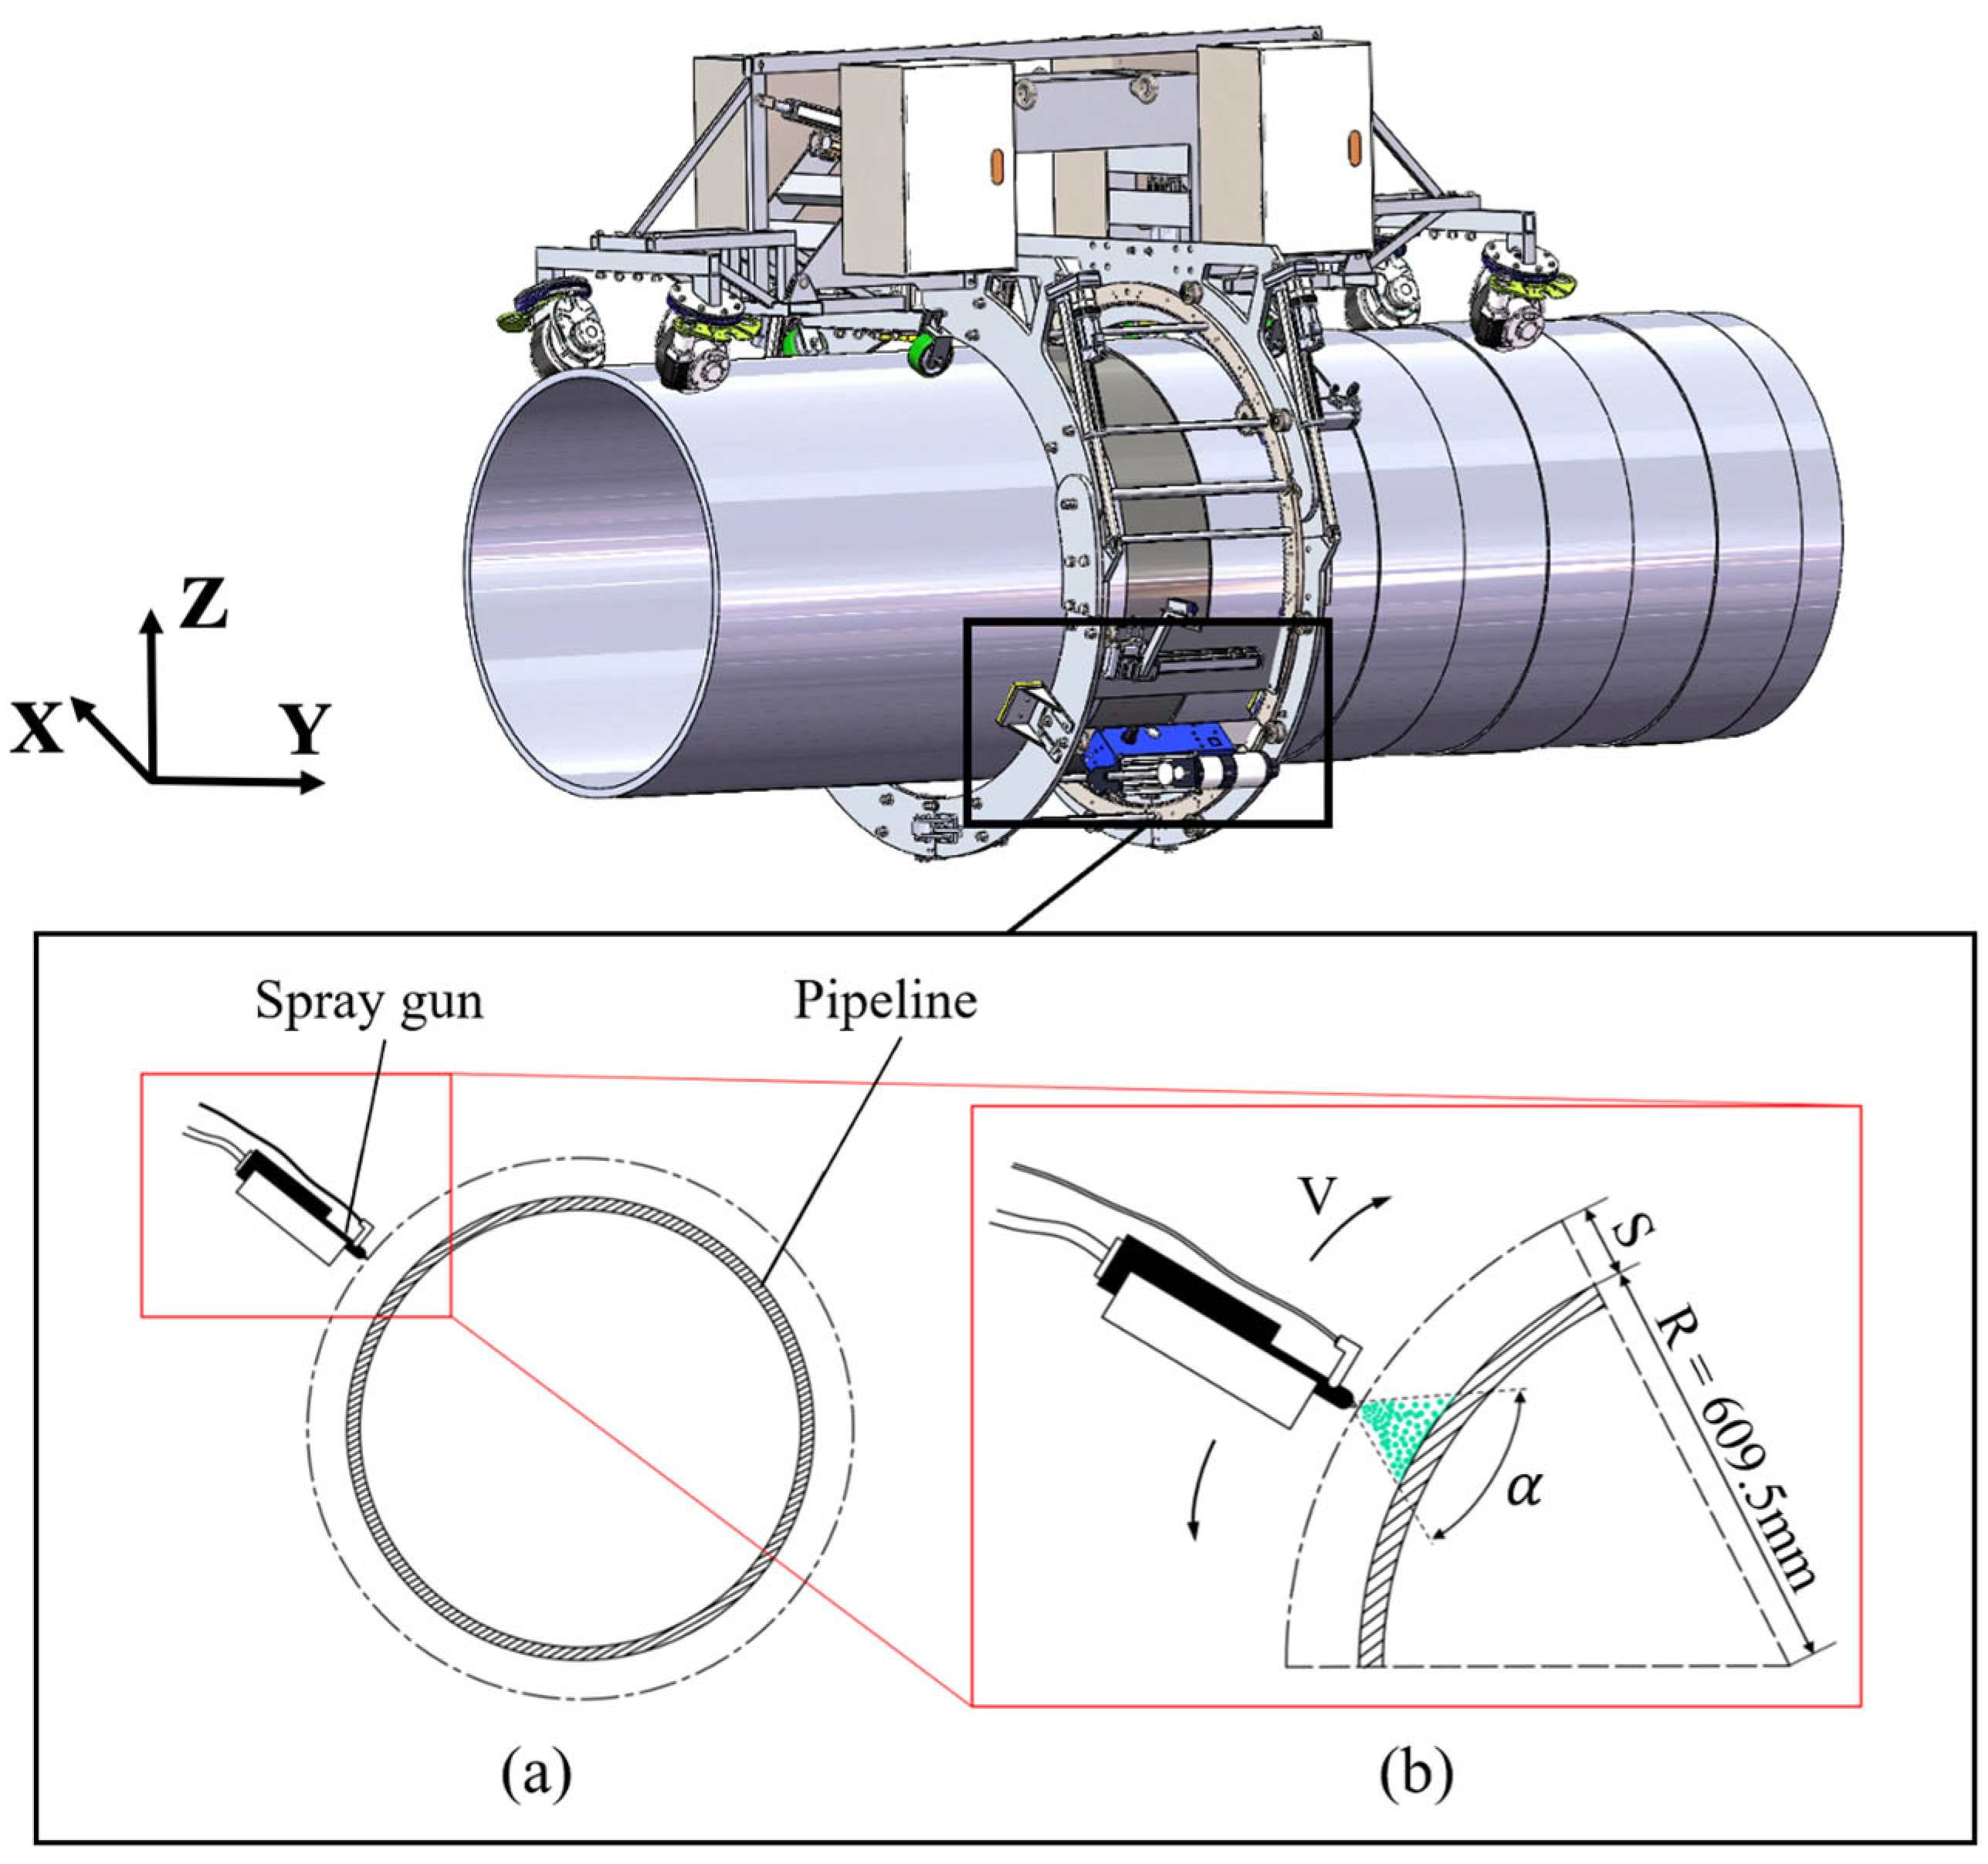
As illustrated in
Figure 5, the spray gun performs coating operations on the pipeline surface. We introduce the following definitions: the direction of equipment motion (i.e., the axis of the pipeline) is defined as the
Y-axis; when the equipment is at rest and placed on the pipeline, its gravitational direction (i.e., the direction opposite to gravity) is defined as the
Z-axis. The diameter of the pipeline is D = 1219 mm; the spray gun nozzle is positioned at a height S above the surface; and the paint dispersion angle from the nozzle is
. During installation, the nozzle’s extension line passes through the pipe’s center, and the gun sweeps circumferentially around the pipe’s center, facilitating continuous spray application at a linear speed V. All geometric parameters—such as pipe diameter, nozzle diameter, paint viscosity, and spray pressure—remain constant. The study investigates spraying efficiency by varying operational factors like the nozzle-to-pipe distance and the nozzle’s traversal speed. According to Section 8.4 “Joint Coating Quality Inspection” of the national standard GB/T 51241-2017 [
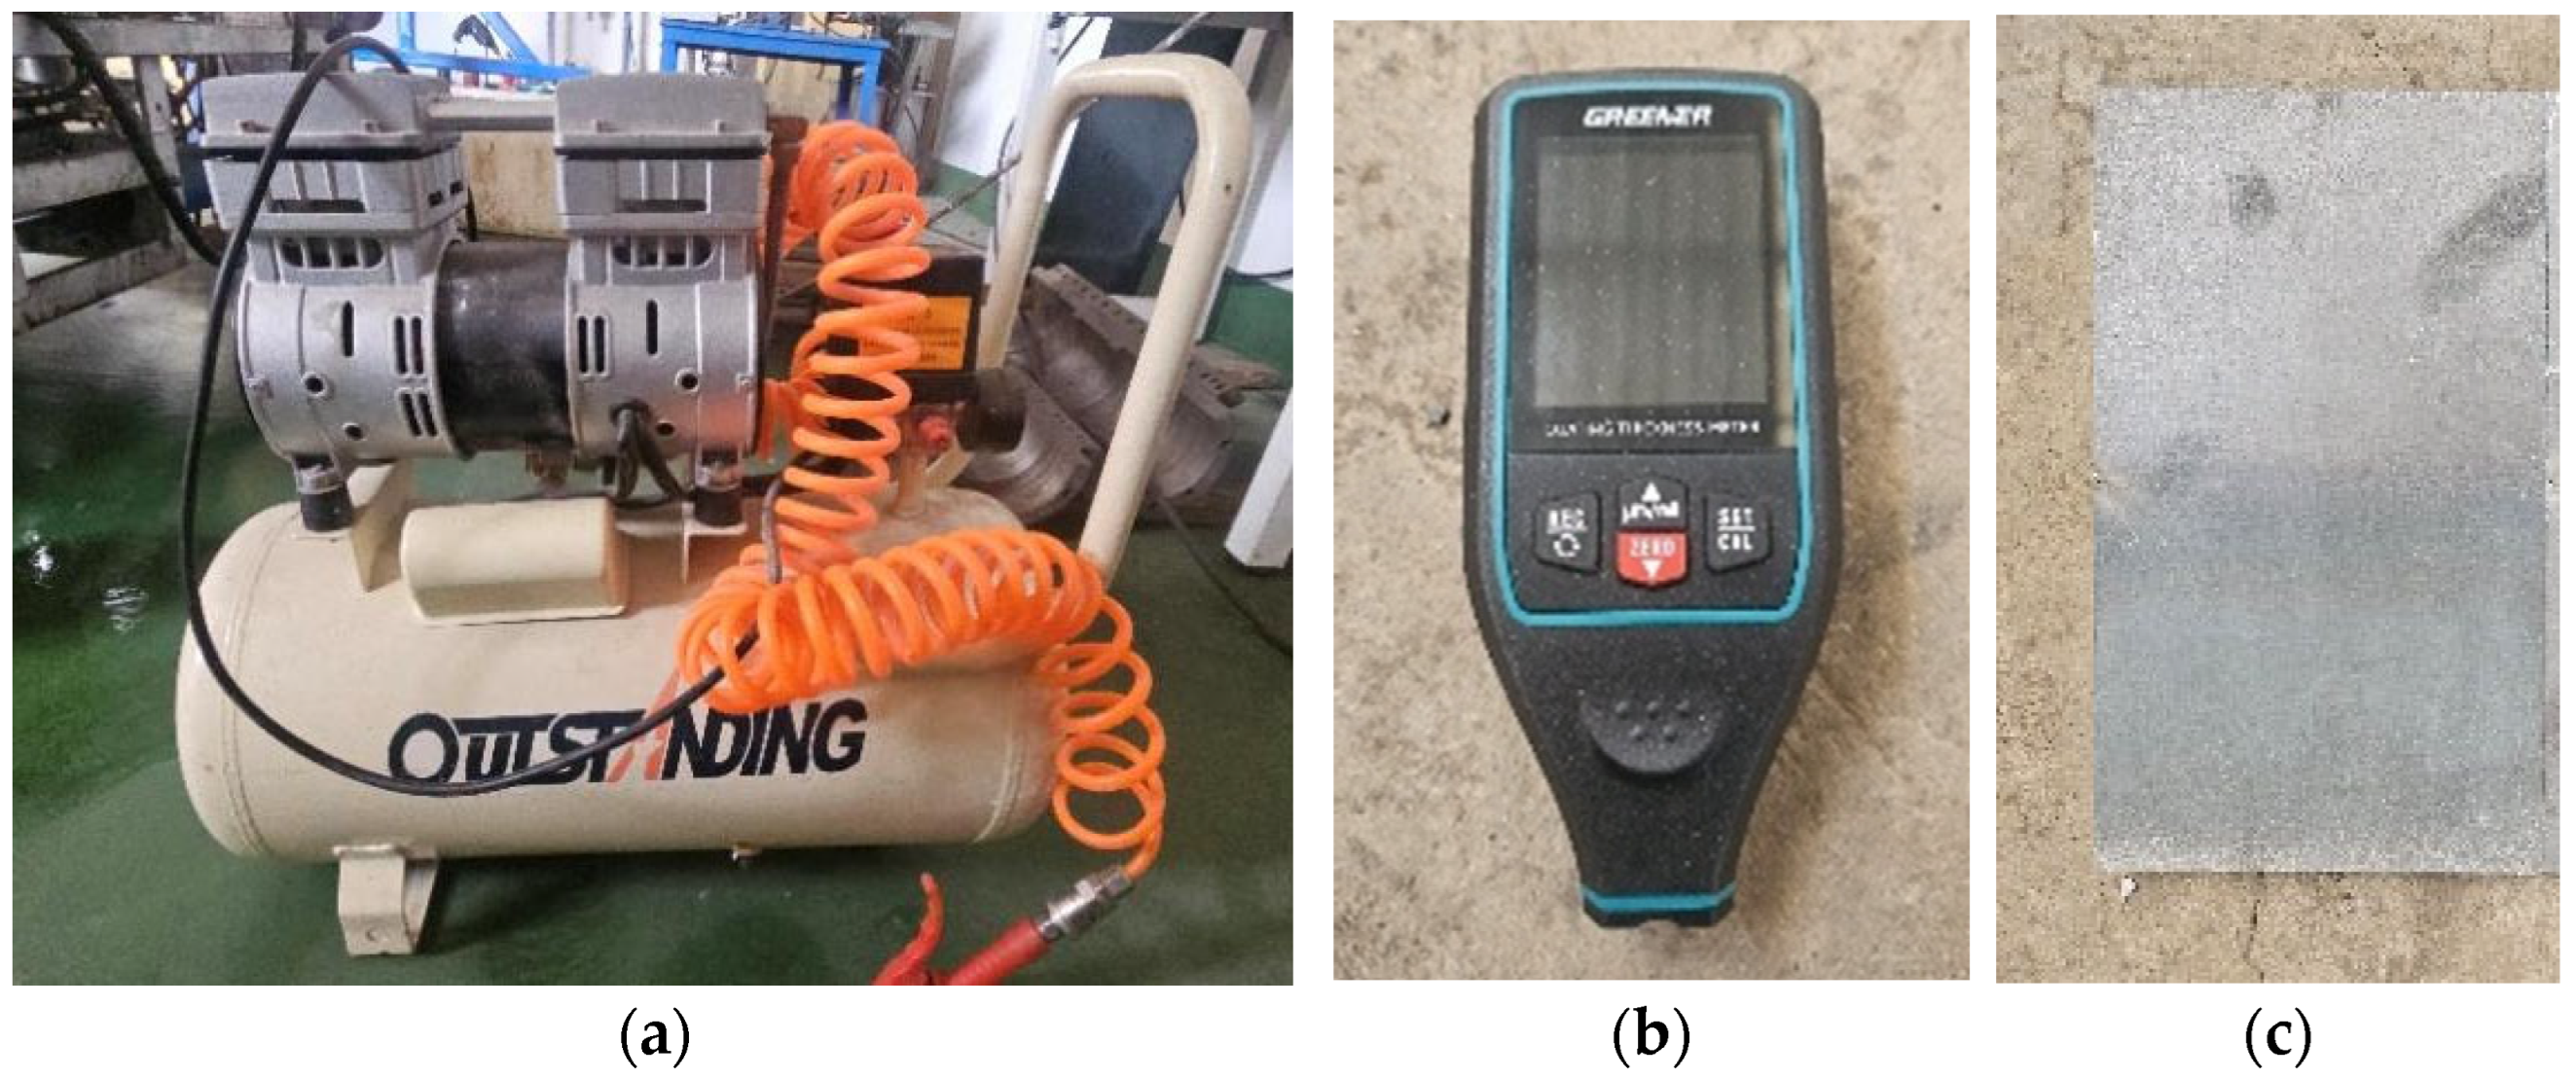
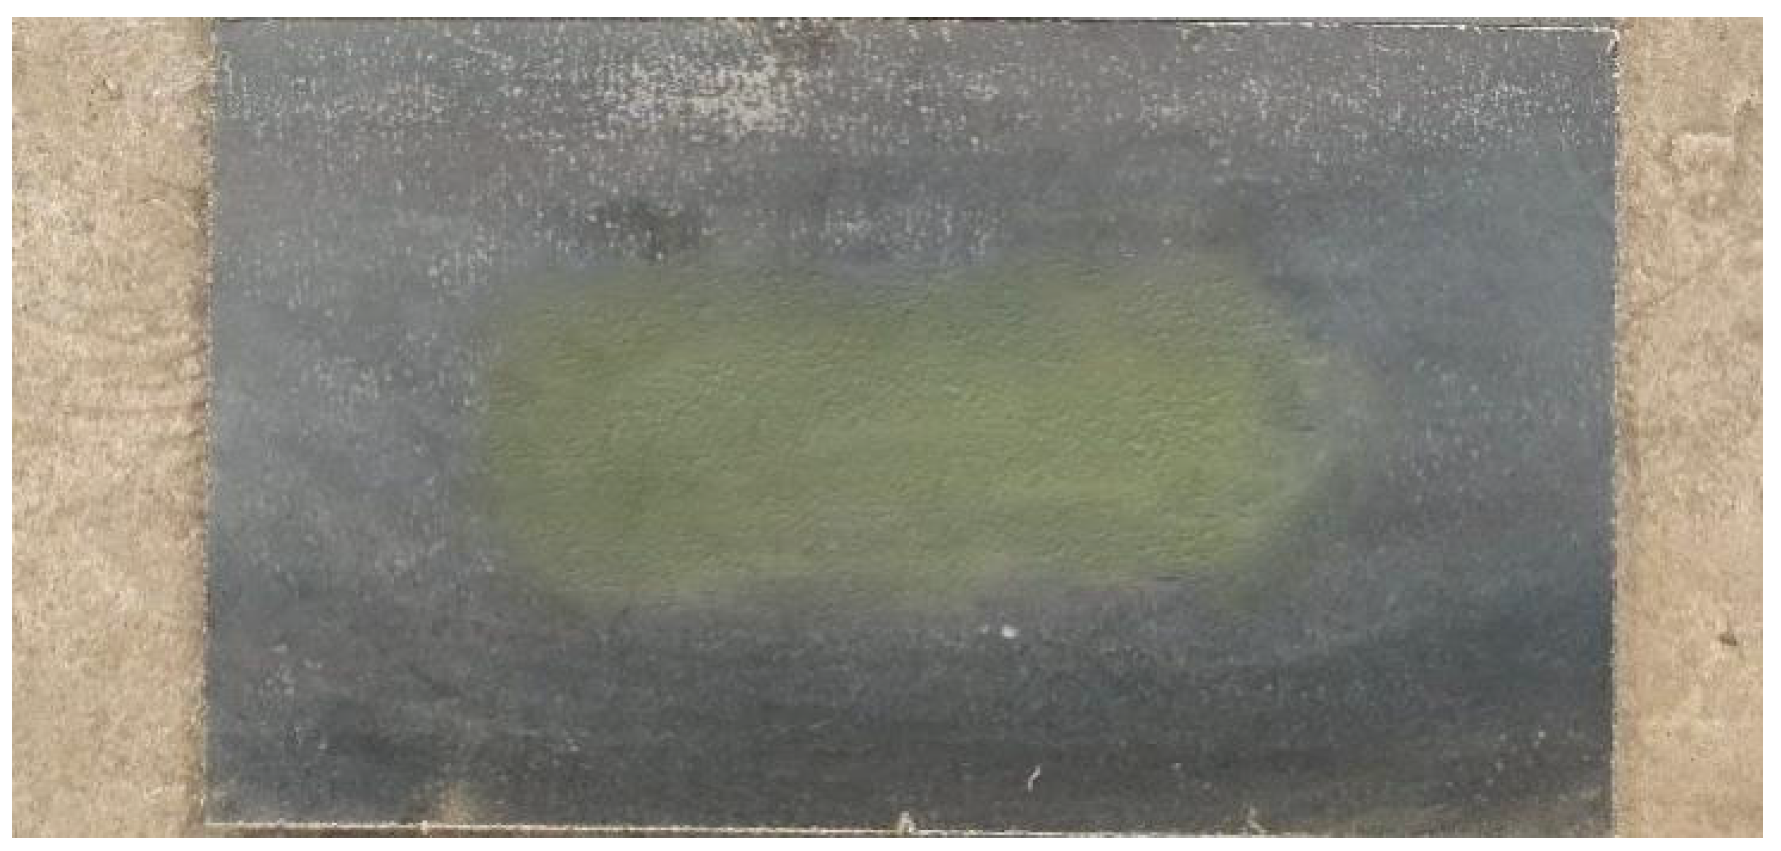
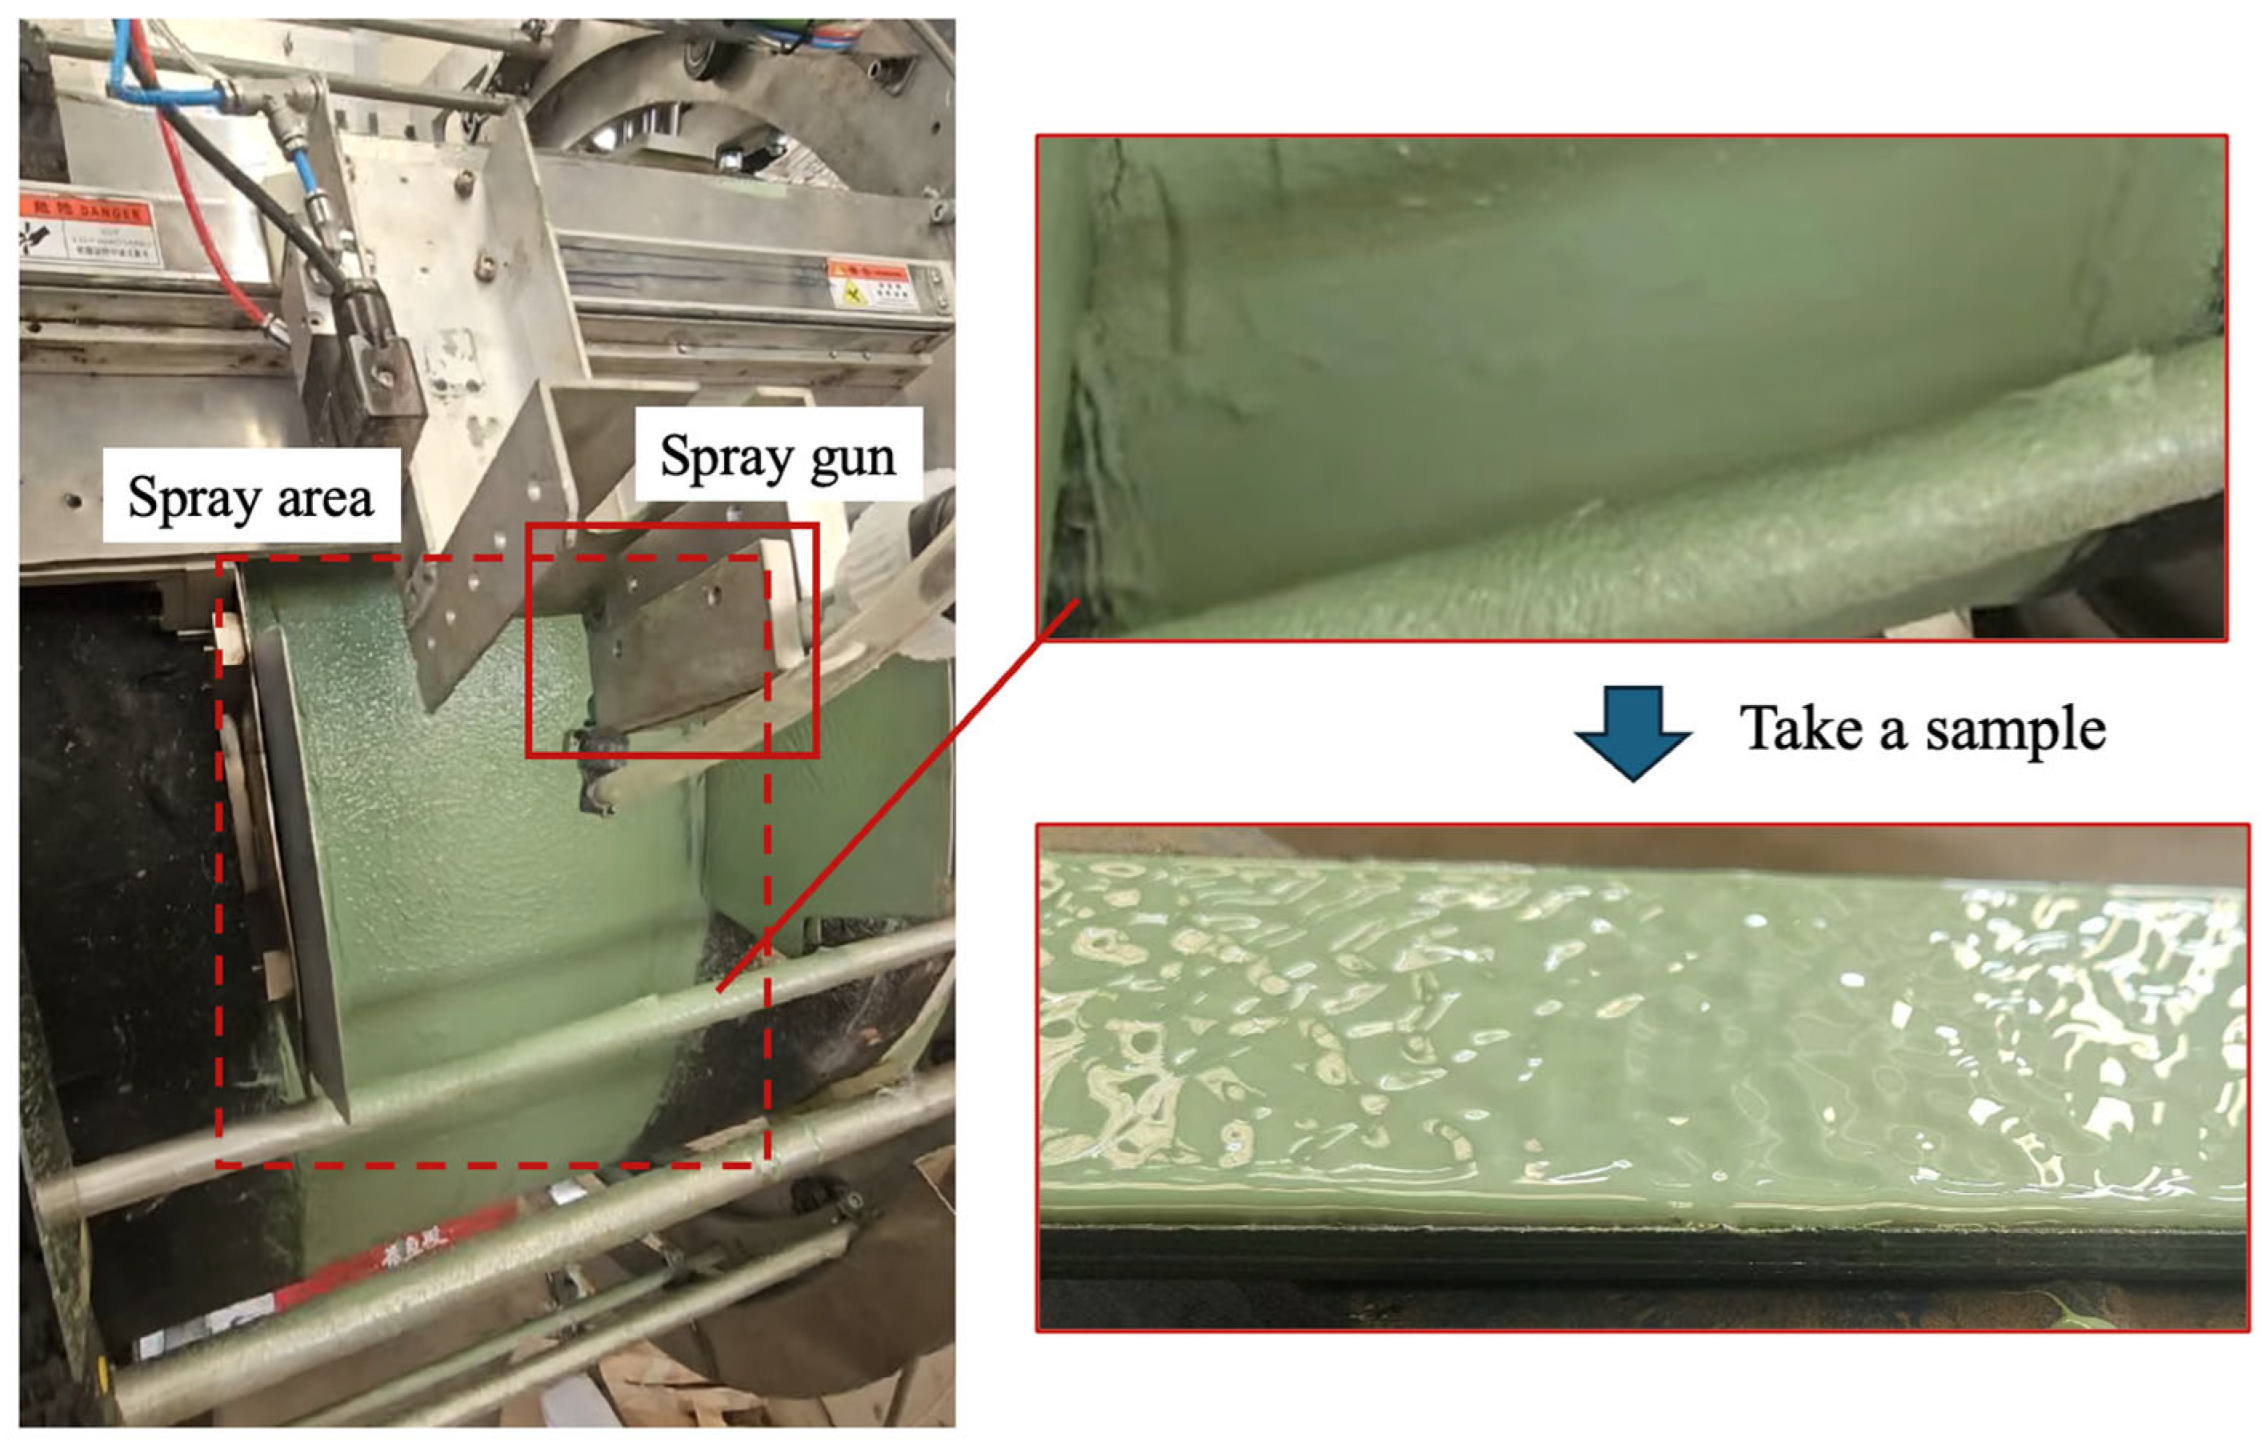
28]: Technical Code for Field Joint Coatings of Pipeline, this study selected “minimum coating thickness” as one of the quality evaluation criteria. The standard specifies that for liquid coating joints, the minimum thickness must not be less than the design value or the standard requirement (with the exact minimum depending on project specifications), and the thickness distribution must be uniform without severe local thinning. Accordingly, in the experimental stage, we employed spark testing to measure the local coating thickness of the joint and compared these values with the simulation results for validation. The spray application model was constructed using ANSYS SpaceClaim (version 2024R1).
2.4.2. Mesh Generation
Upon completion of preprocessing, the model is imported into FLUENT Meshing for mesh generation. The entire spray scenario constitutes the computational domain, which is entirely filled with air. The injection source is located within this domain, and the paint droplets are discharged and adhere to the pipe surface, forming the coating layer. A polyhedral cell is employed to populate the domain, chosen for its superior convergence behavior at lower cell counts compared to tetrahedral and hexahedral cells. Surface mesh resolutions range from 20 mm (minimum) to 100 mm (maximum). The polyhedral cell uses a maximum cell size of 37 mm with a growth rate of 1.2. Additionally, three boundary-layer prism layers are applied near the wall to enhance the accuracy of particle adhesion predictions on the pipe surface.
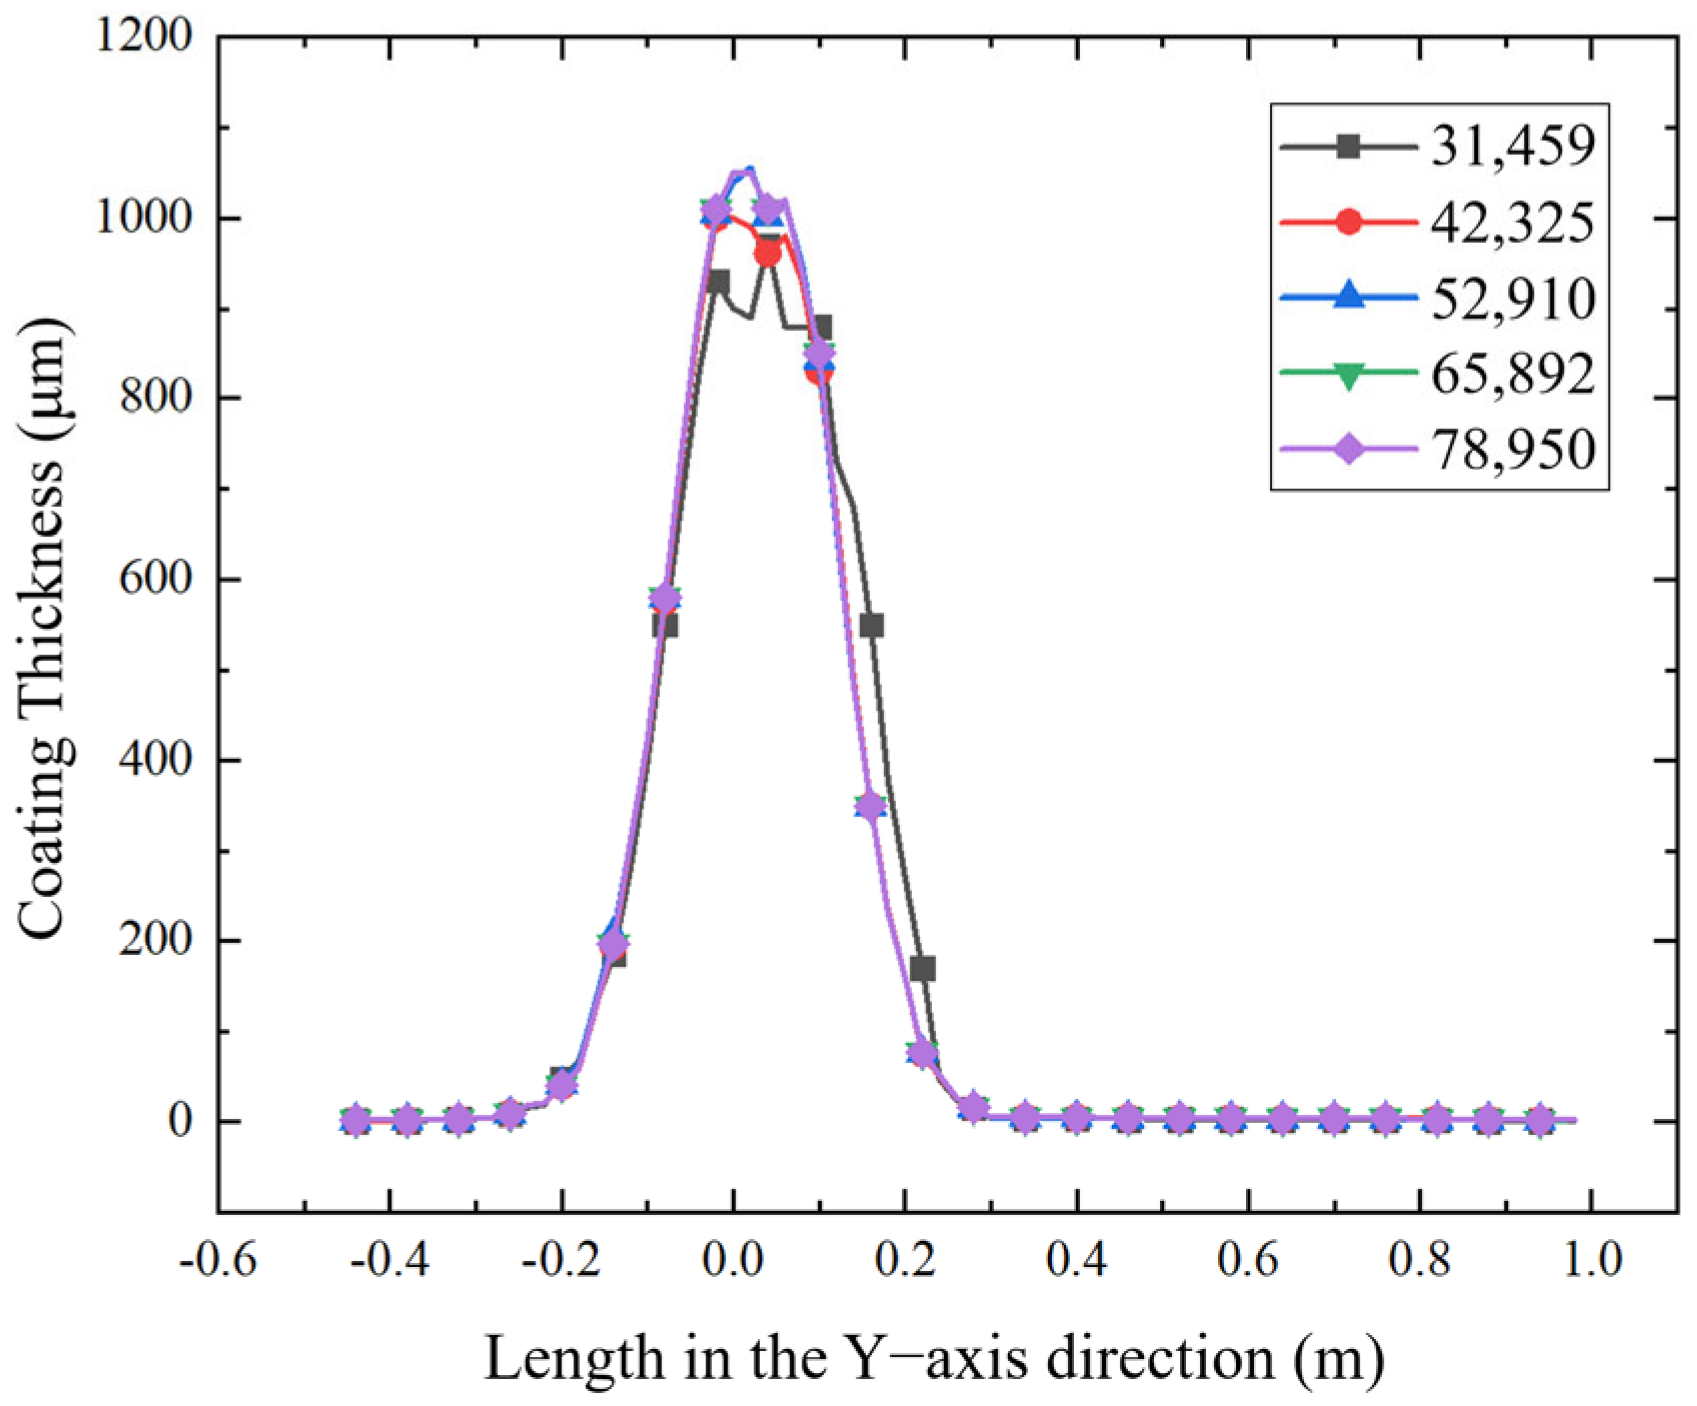
Figure 6 presents the paint film thickness along the
Y-axis across different mesh densities (31,459; 42,325; 52,910; 65,892; 78,950 cells). The results show that as mesh density increases, the thickness distribution curves converge, with negligible variation beyond 52,910 cells—indicating mesh independence. Thus, the simulations have passed the mesh-independence test, and meshes containing more than 52,910 cells are deemed sufficient to ensure accuracy while maintaining computational efficiency. The final meshes are illustrated in
Figure 7 (static spray scenario: 268,033 nodes and 52,910 cells; moving spray scenario: 575,753 nodes and 113,654 cells).
In the present simulation, paint was treated as discrete particles, and the process was modeled using the Discrete Phase Model (DPM) in ANSYS Fluent, in conjunction with the Wall Film (WF) model to capture deposition and adhesion of particles onto the pipeline surface [
29].
During dynamic spraying, the Sliding Mesh technique was employed to simulate the motion of the pipe: the pipe surface is specified as a mesh moving region, while the remaining computational domain remains stationary. The Realizable k-ε turbulence model was selected to resolve turbulent flow and transient calculations were performed. The paint injection was modeled as a conical inlet based on the spray gun’s parameters, the spray gun parameters are shown in
Table 1.
The spray pressure was set to 0.7 MPa. The flow velocity and volumetric flow at the nozzle were calculated using the Shevilev formula as follows:
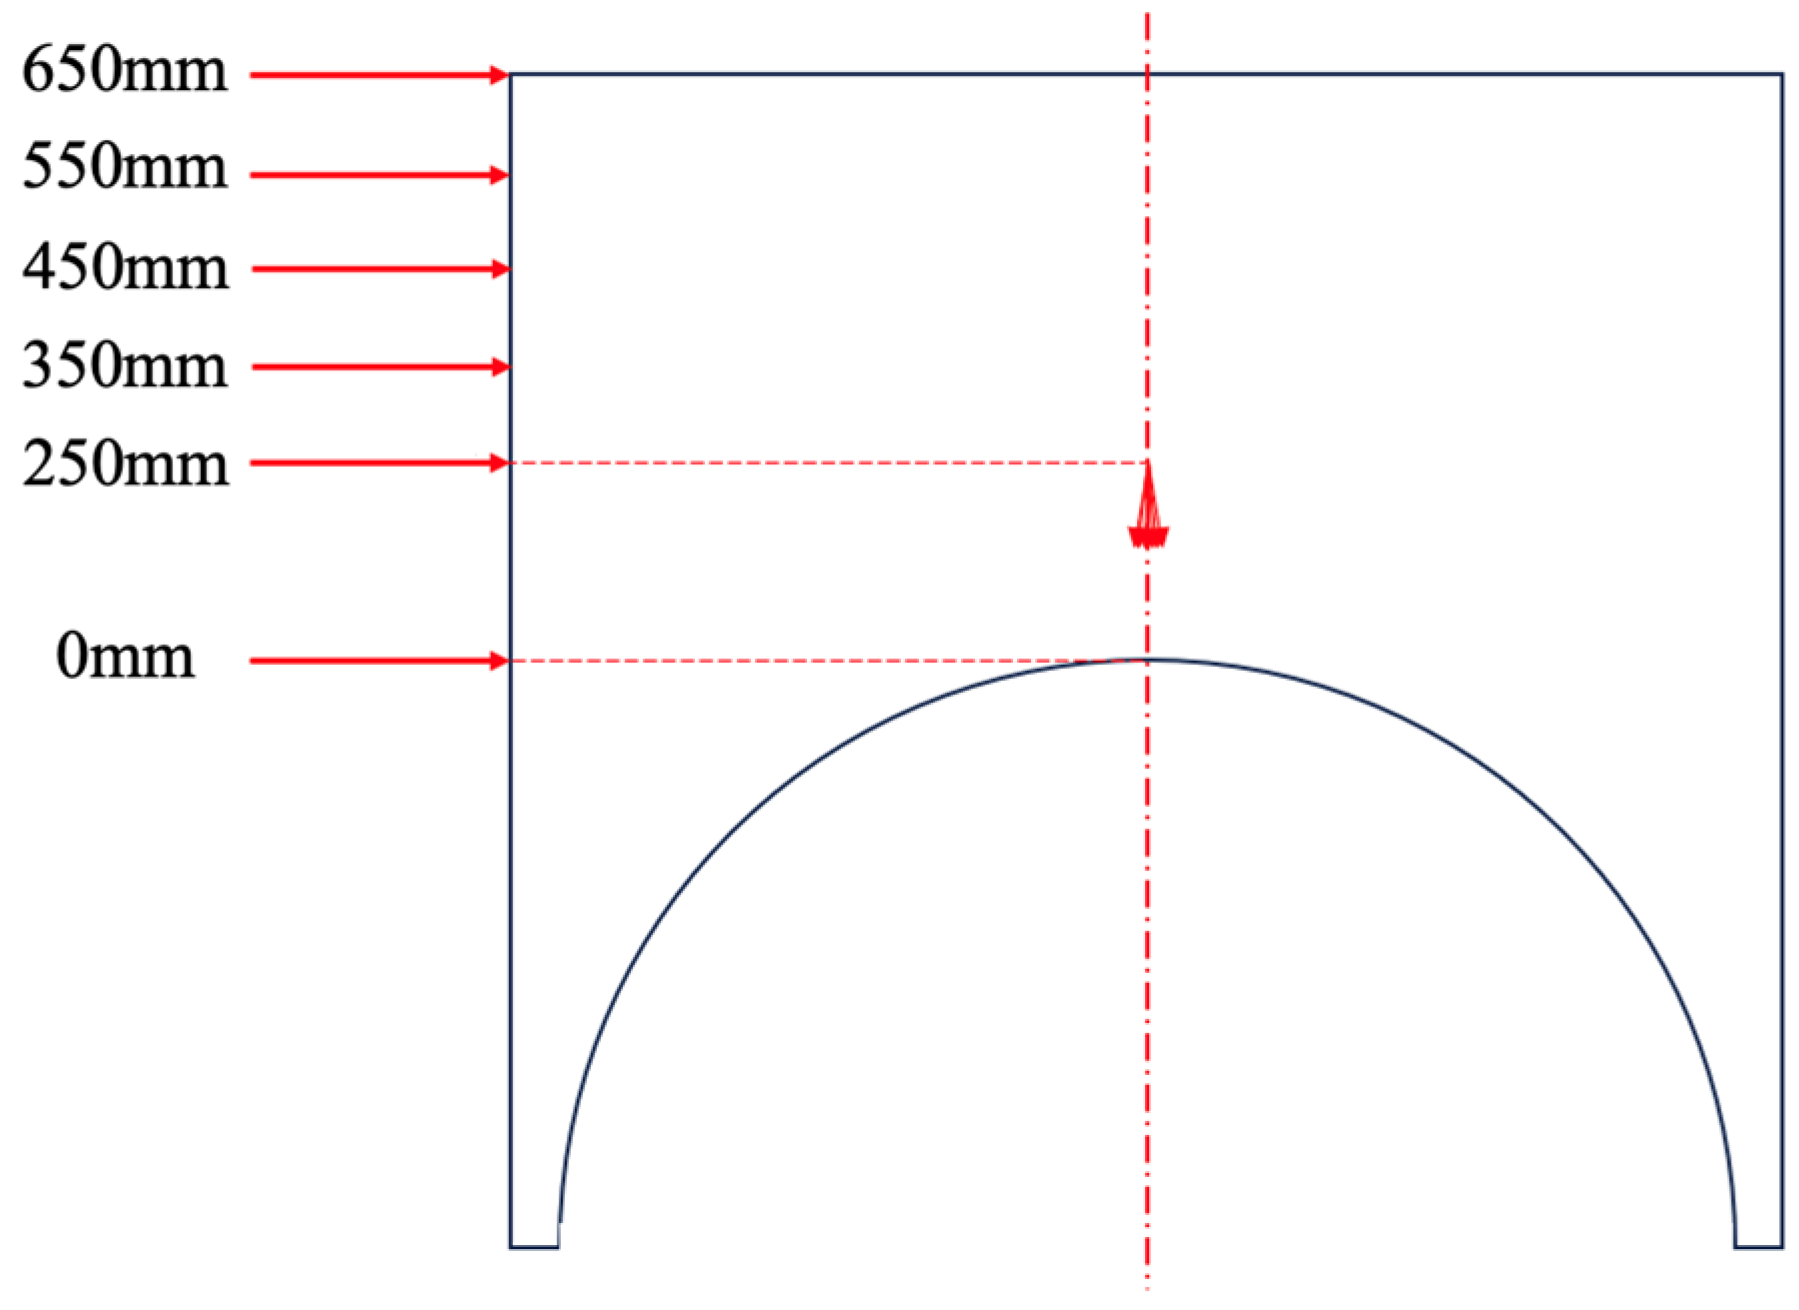
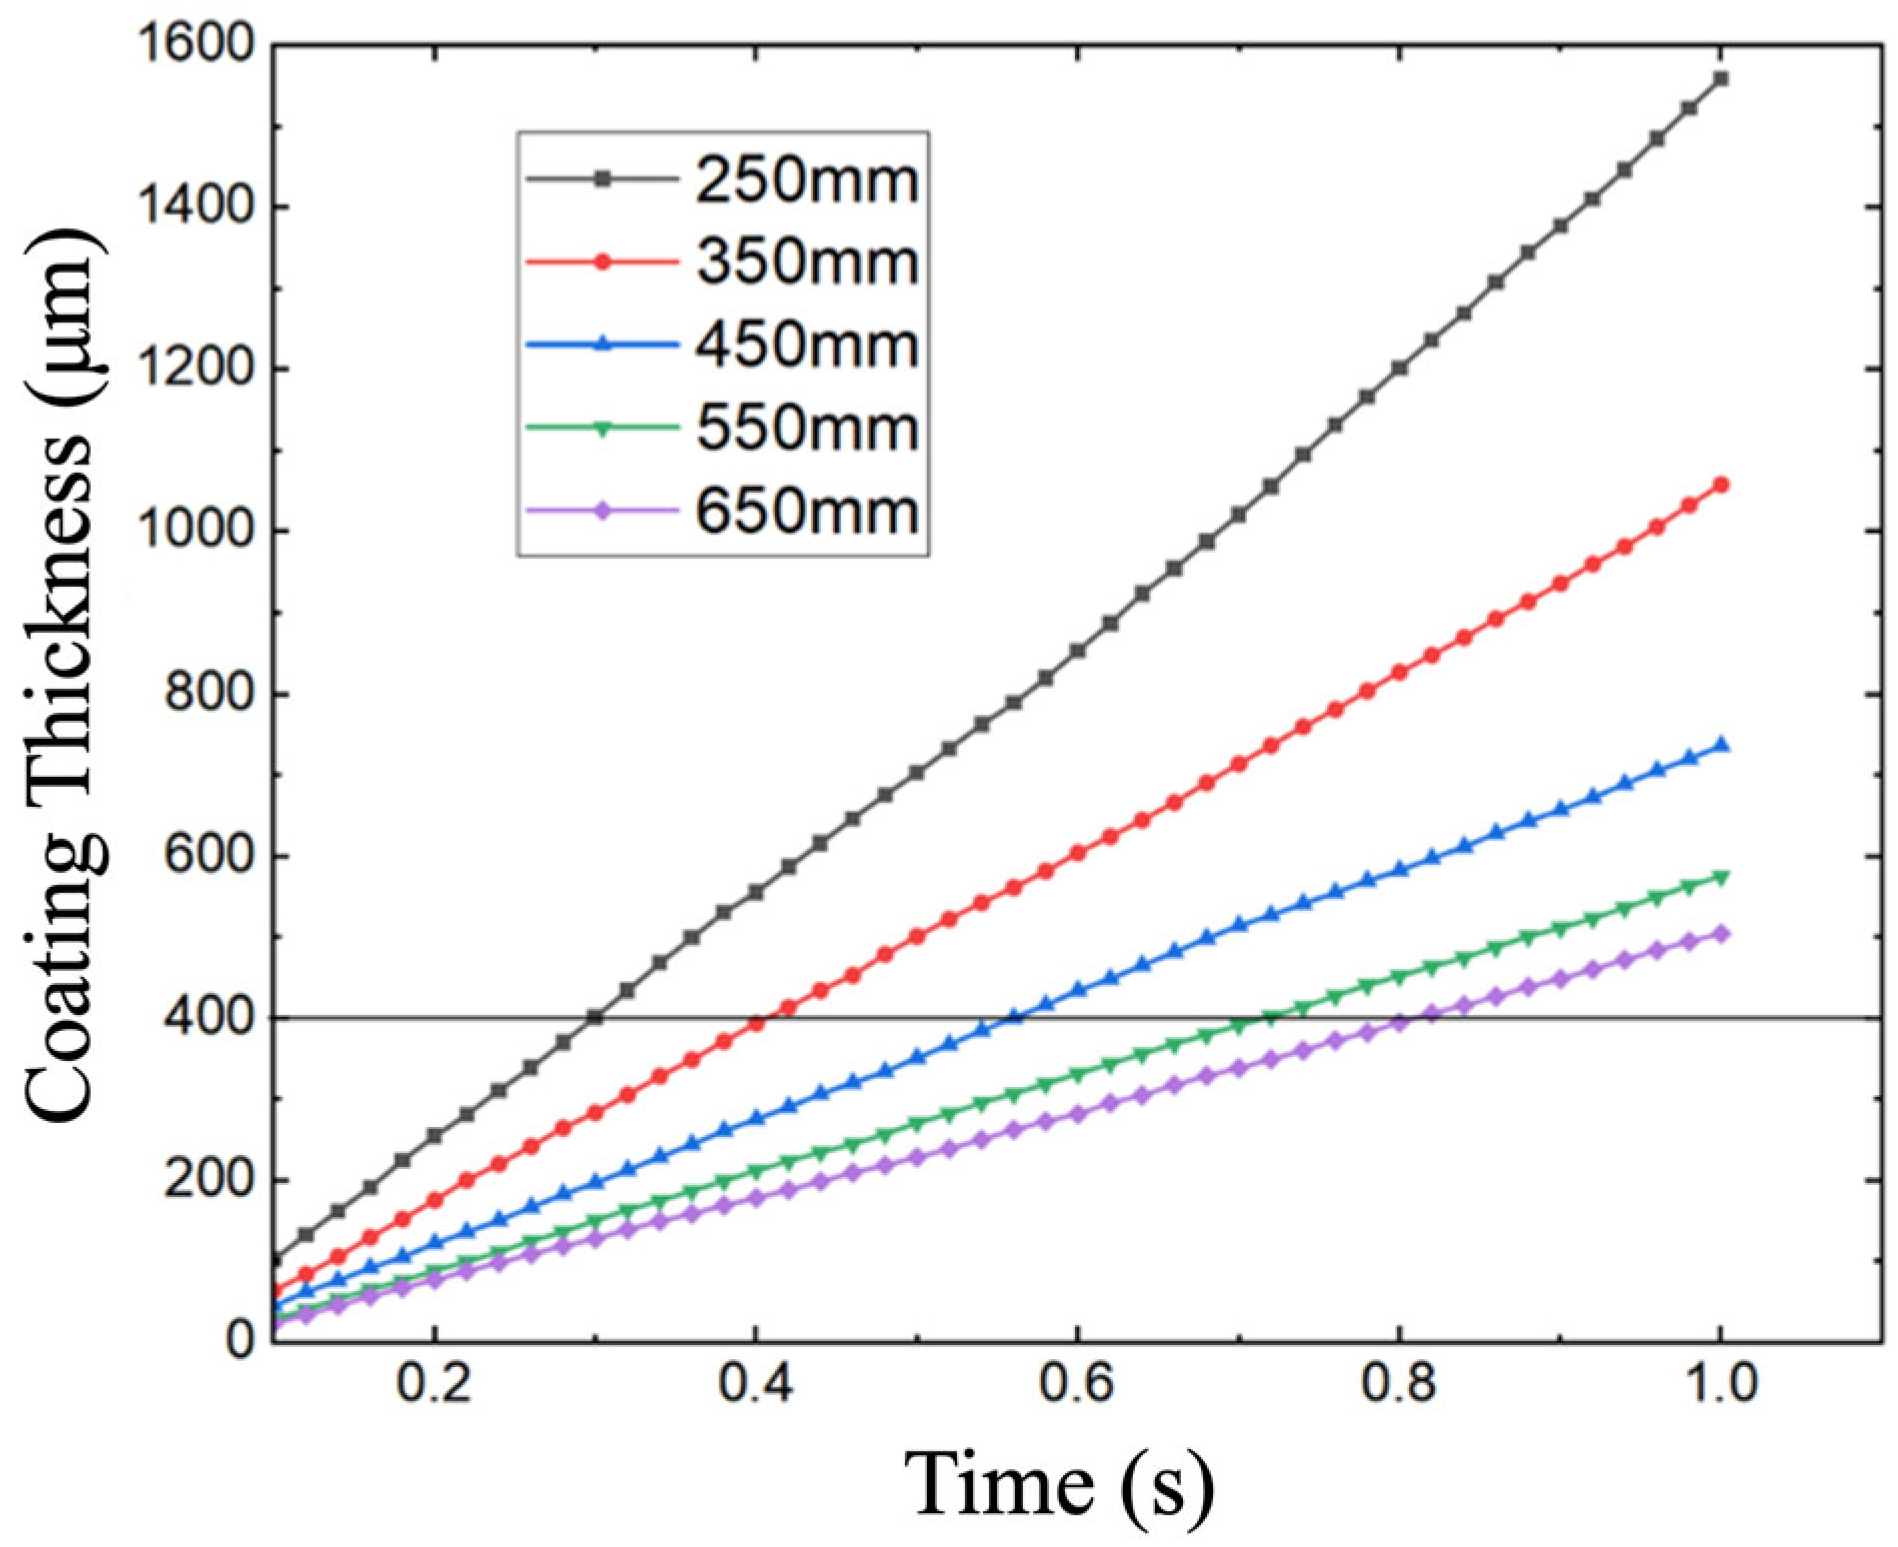
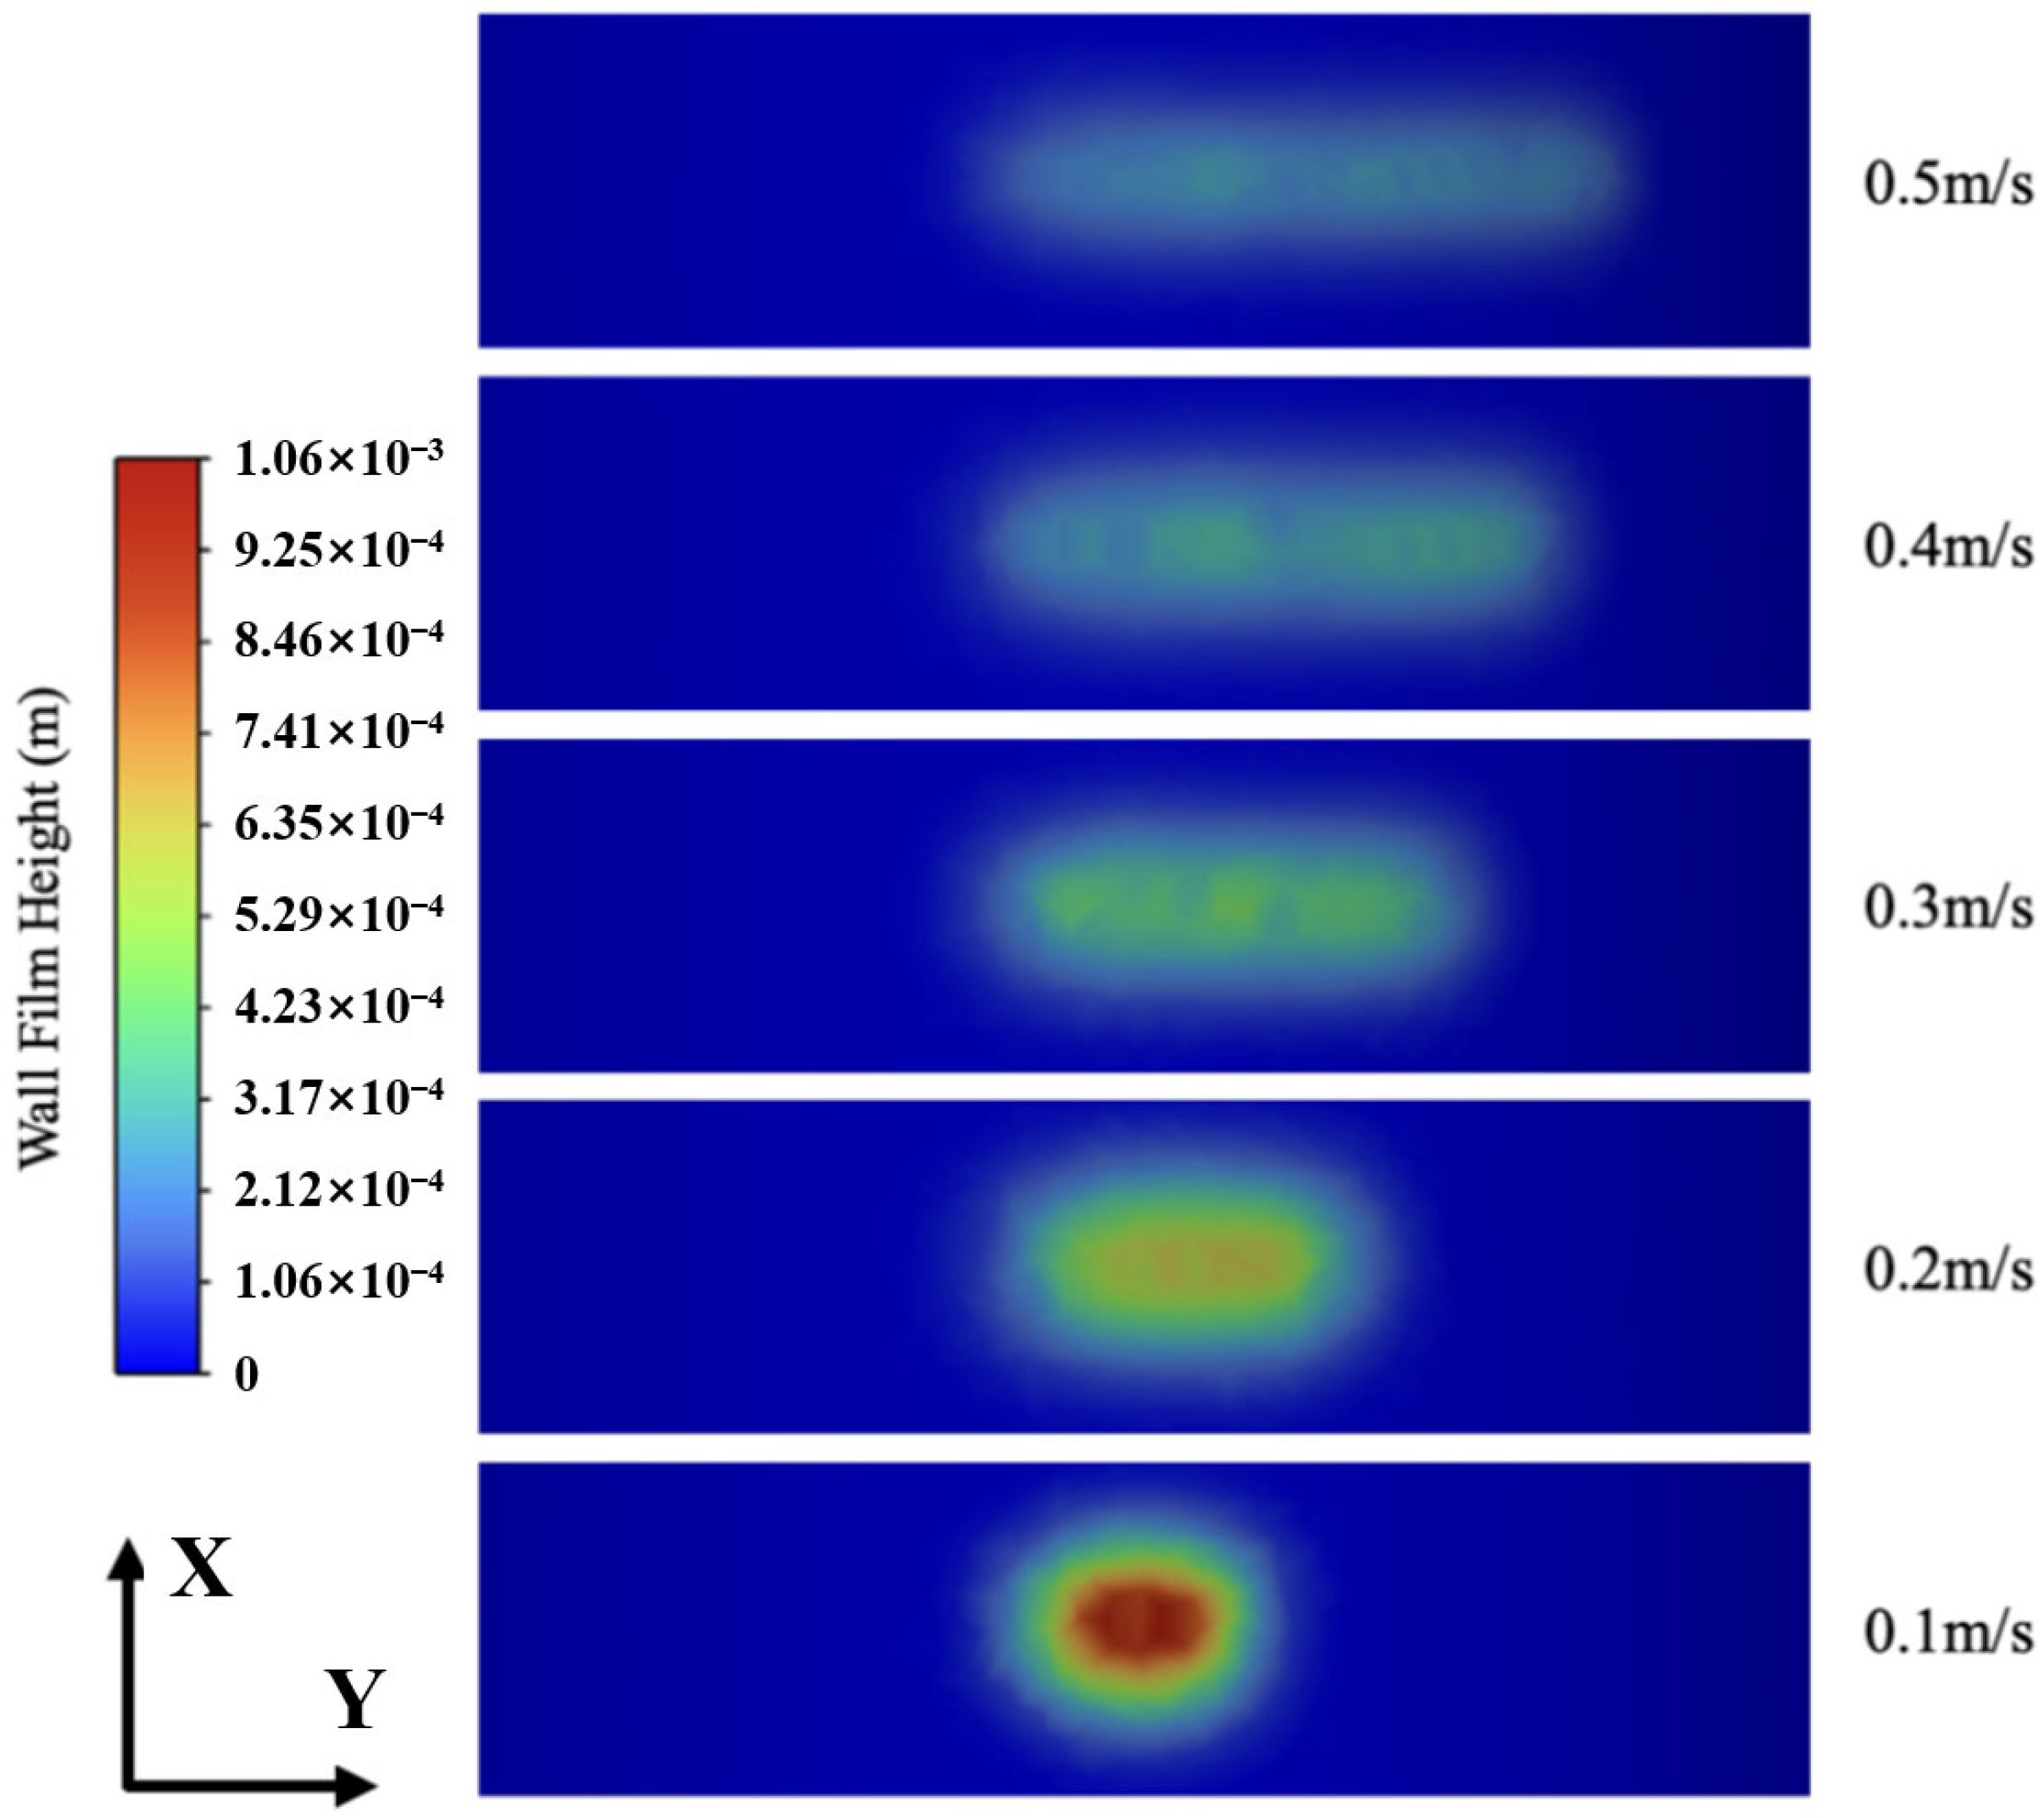
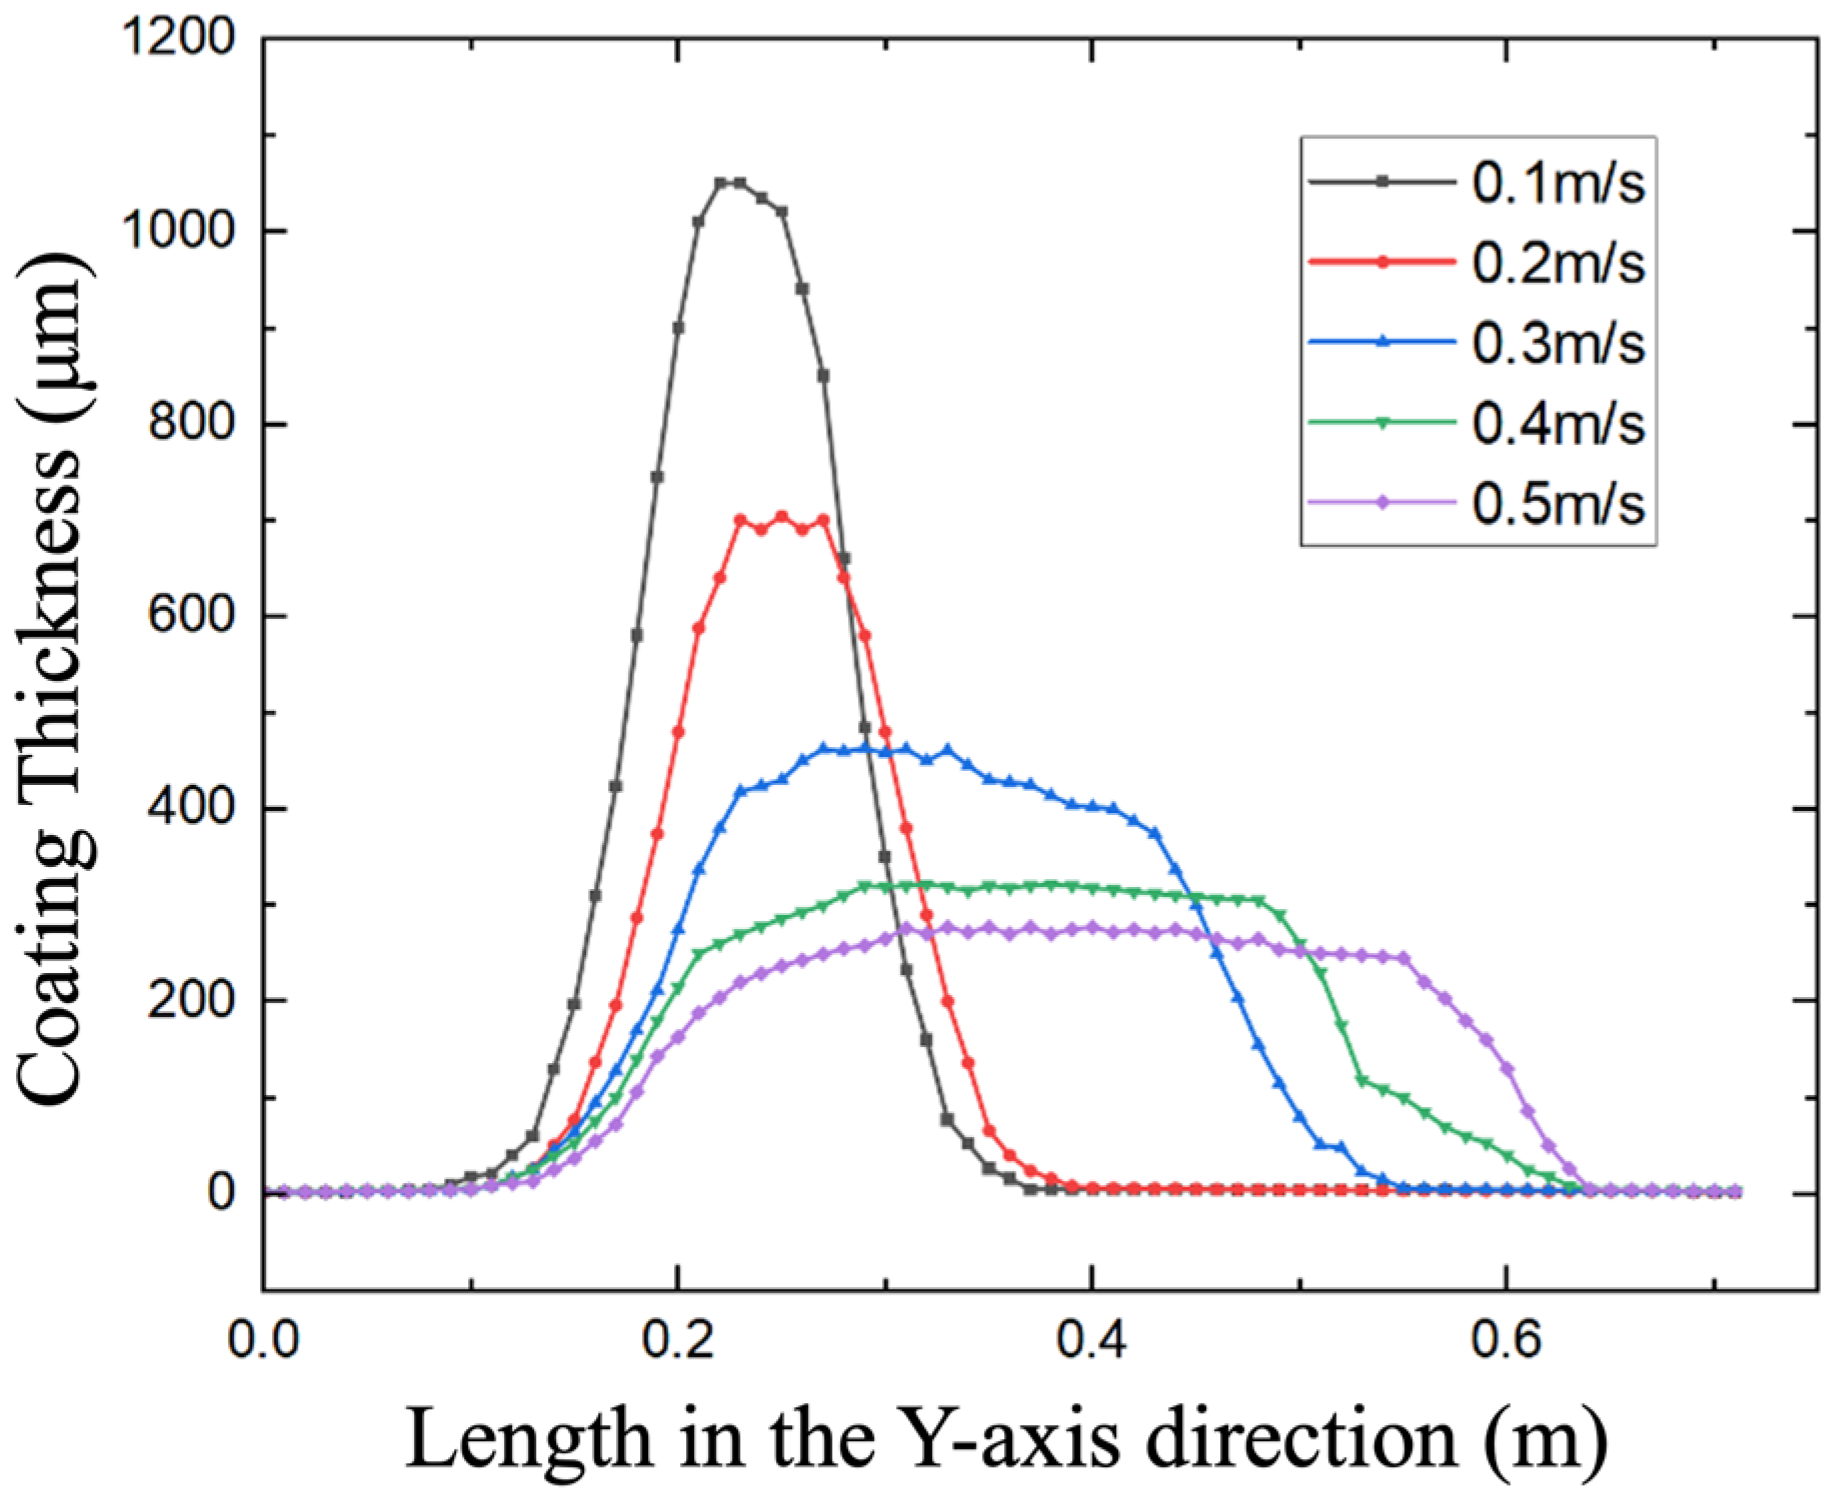
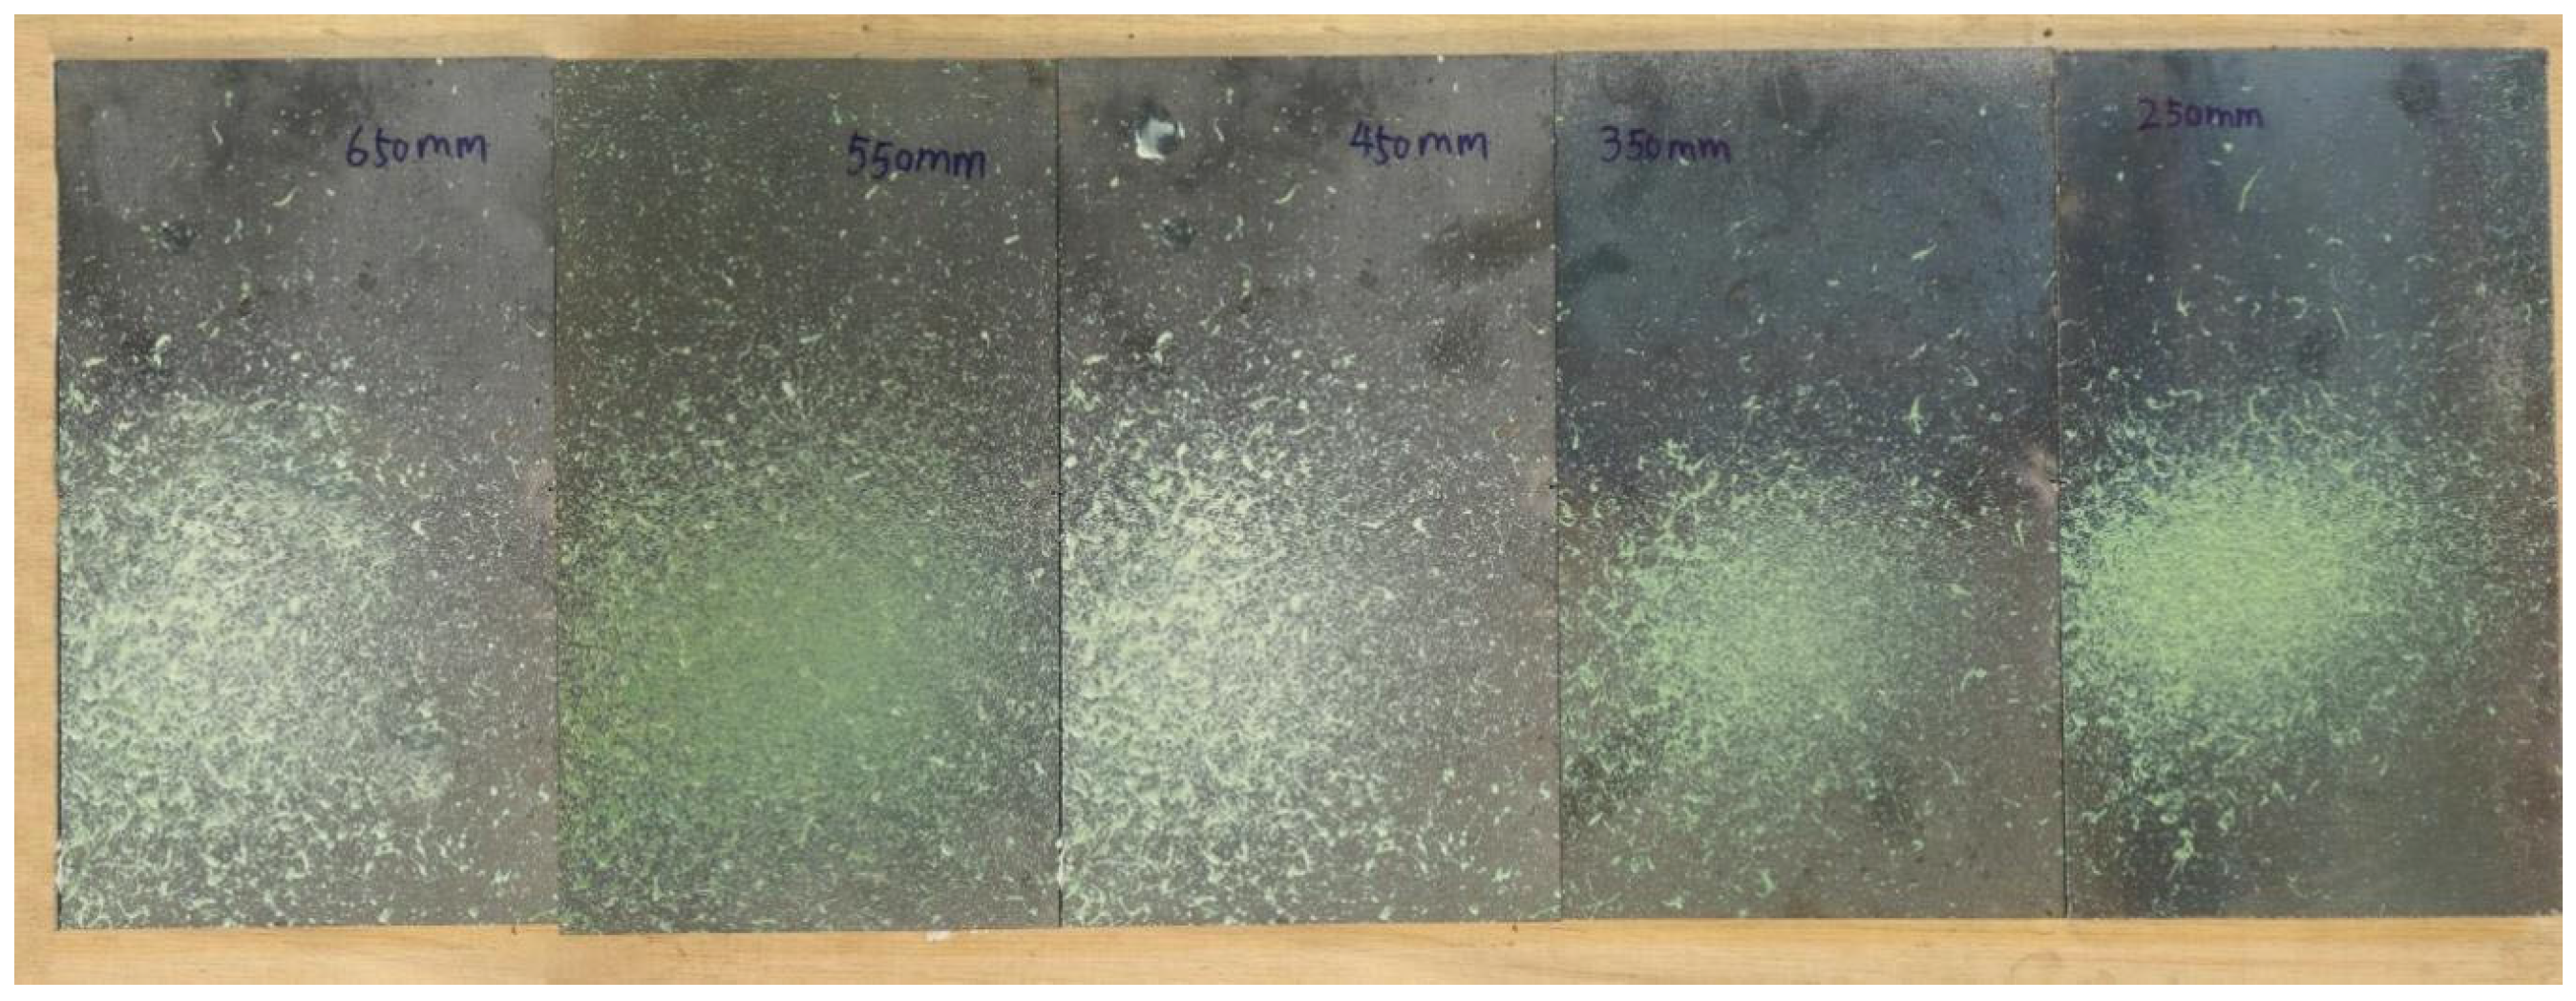
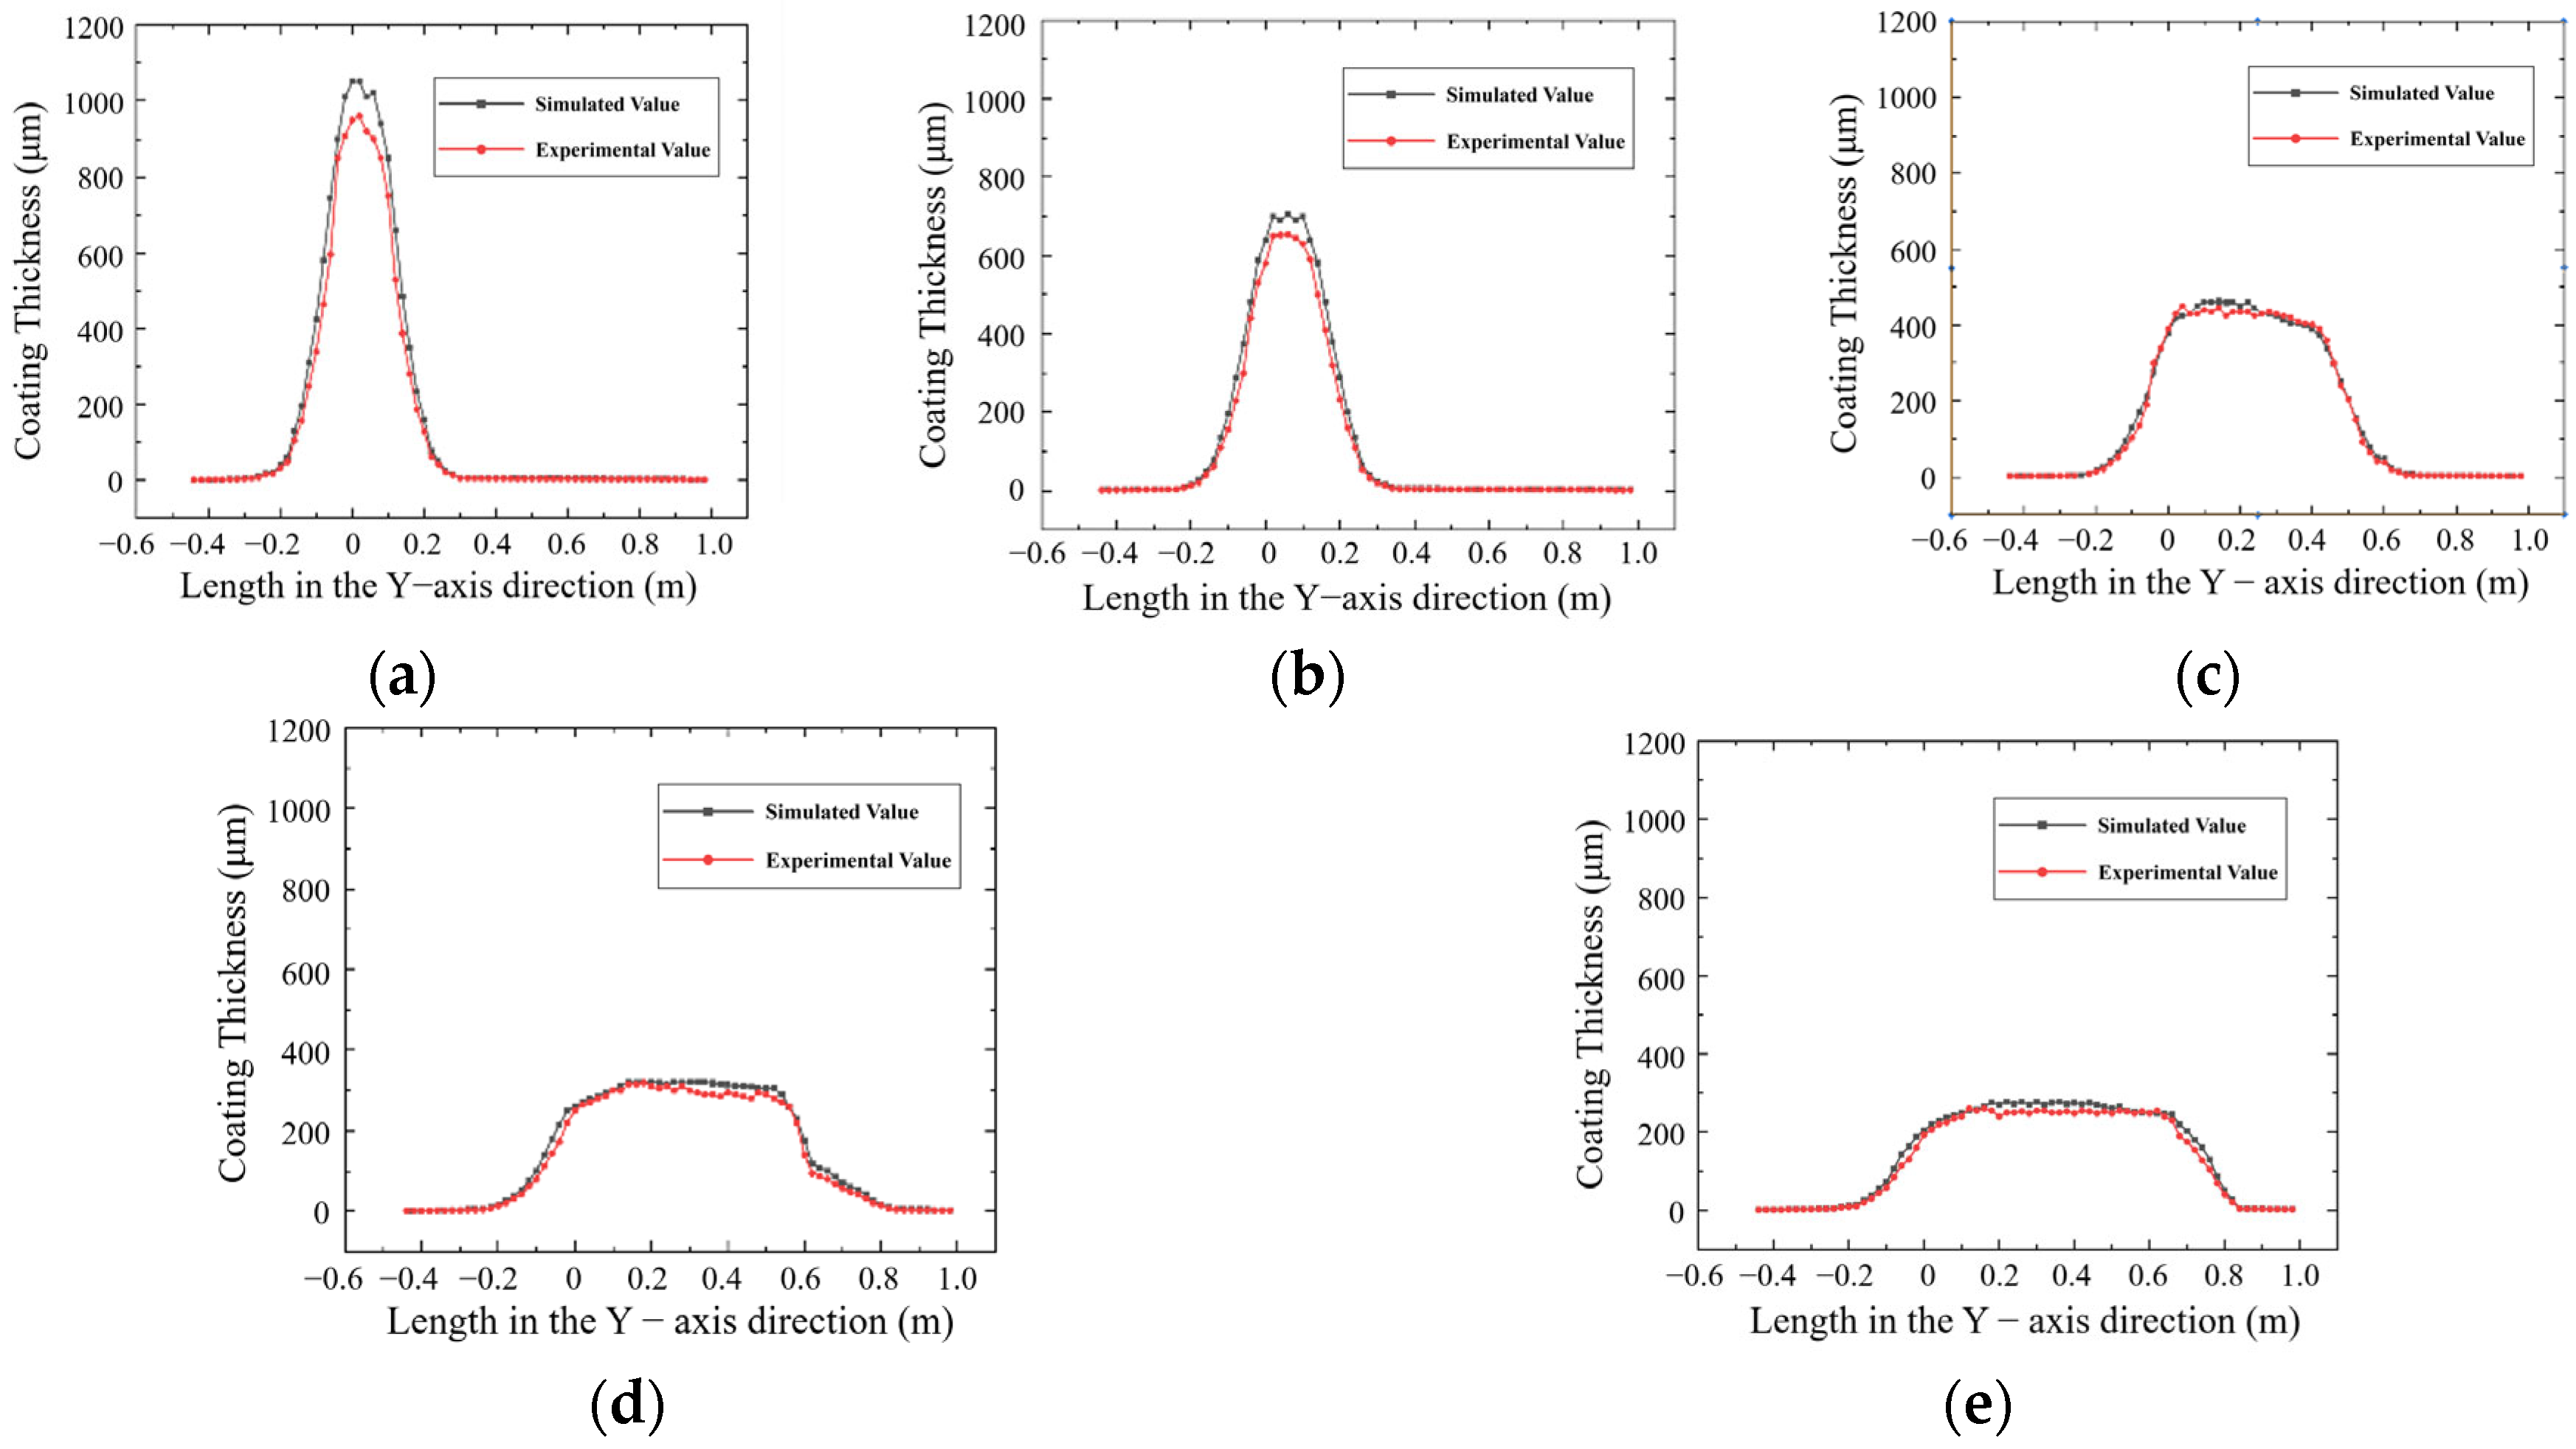
Figure 8 illustrates the paint deposition characteristics under different preset nozzle heights, ranging from 650 mm to 450 mm with a step size of 10 mm. Five sets of simulation experiments were conducted.
To further characterize the physical mechanisms of the spraying conditions, we defined the following dimensionless parameters together with their typical value ranges. These enabled the spray-droplet conditions in this study to be compared with adhesion, spreading, and splashing regimes reported in the existing spray-coating literature.
where
is density of the coating material;
is dynamic viscosity of the coating (in droplet state);
surface tension of the liquid;
is the characteristic droplet diameter;
is the droplet impact velocity (or the velocity near the substrate surface).
Under the spraying conditions of this study (, , N/m, , and ), the typical dimensionless parameters were obtained as follows: , , and . The results indicate that due to the high viscosity, the Reynolds number is extremely low, and the flow is in a strongly viscosity-dominated regime; meanwhile, the Weber number is very large, suggesting that inertia is sufficient to overcome surface tension, but droplet splashing is suppressed by the high Ohnesorge number. This combination positions the spraying condition in the “high-We, high-Oh, low-Re” regime, where inertial effects are pronounced, yet droplets on the wall tend to adhere and spread rather than undergo secondary splashing.
5. Conclusions
This paper focuses on the problem of coating uniformity in the automatic spraying process of pipeline joint repair. A systematic theoretical model and numerical simulation model were established and validated through experiments. The work provides theoretical support for coating uniformity studies and offers clear and feasible process parameters and control strategies for engineering applications. The main conclusions are as follows:
- (1)
A numerical simulation strategy based on the coupling of the Discrete Phase Model (DPM) and the Wall Film (WF) model was adopted, which realistically simulated the entire deposition process of sprayed particles—from their movement through the nozzle, impact on the wall surface, spreading on the wall, and eventually forming a continuous thin film. This provides theoretical support for the study of coating uniformity.
- (2)
Simulation analysis shows that spraying distance and spray gun travel speed have significant effects on coating thickness and uniformity. Under the conditions of a spraying distance of 250 mm and a spray-gun speed of 0.1 m/s, a coating with a maximum thickness of 1058 μm can be obtained, although exhibiting low spraying efficiency. When the speed increases to 0.5 m/s, although spraying efficiency improves, the coating thickness decreases to 318 μm, and large fluctuations in thickness distribution appear.
- (3)
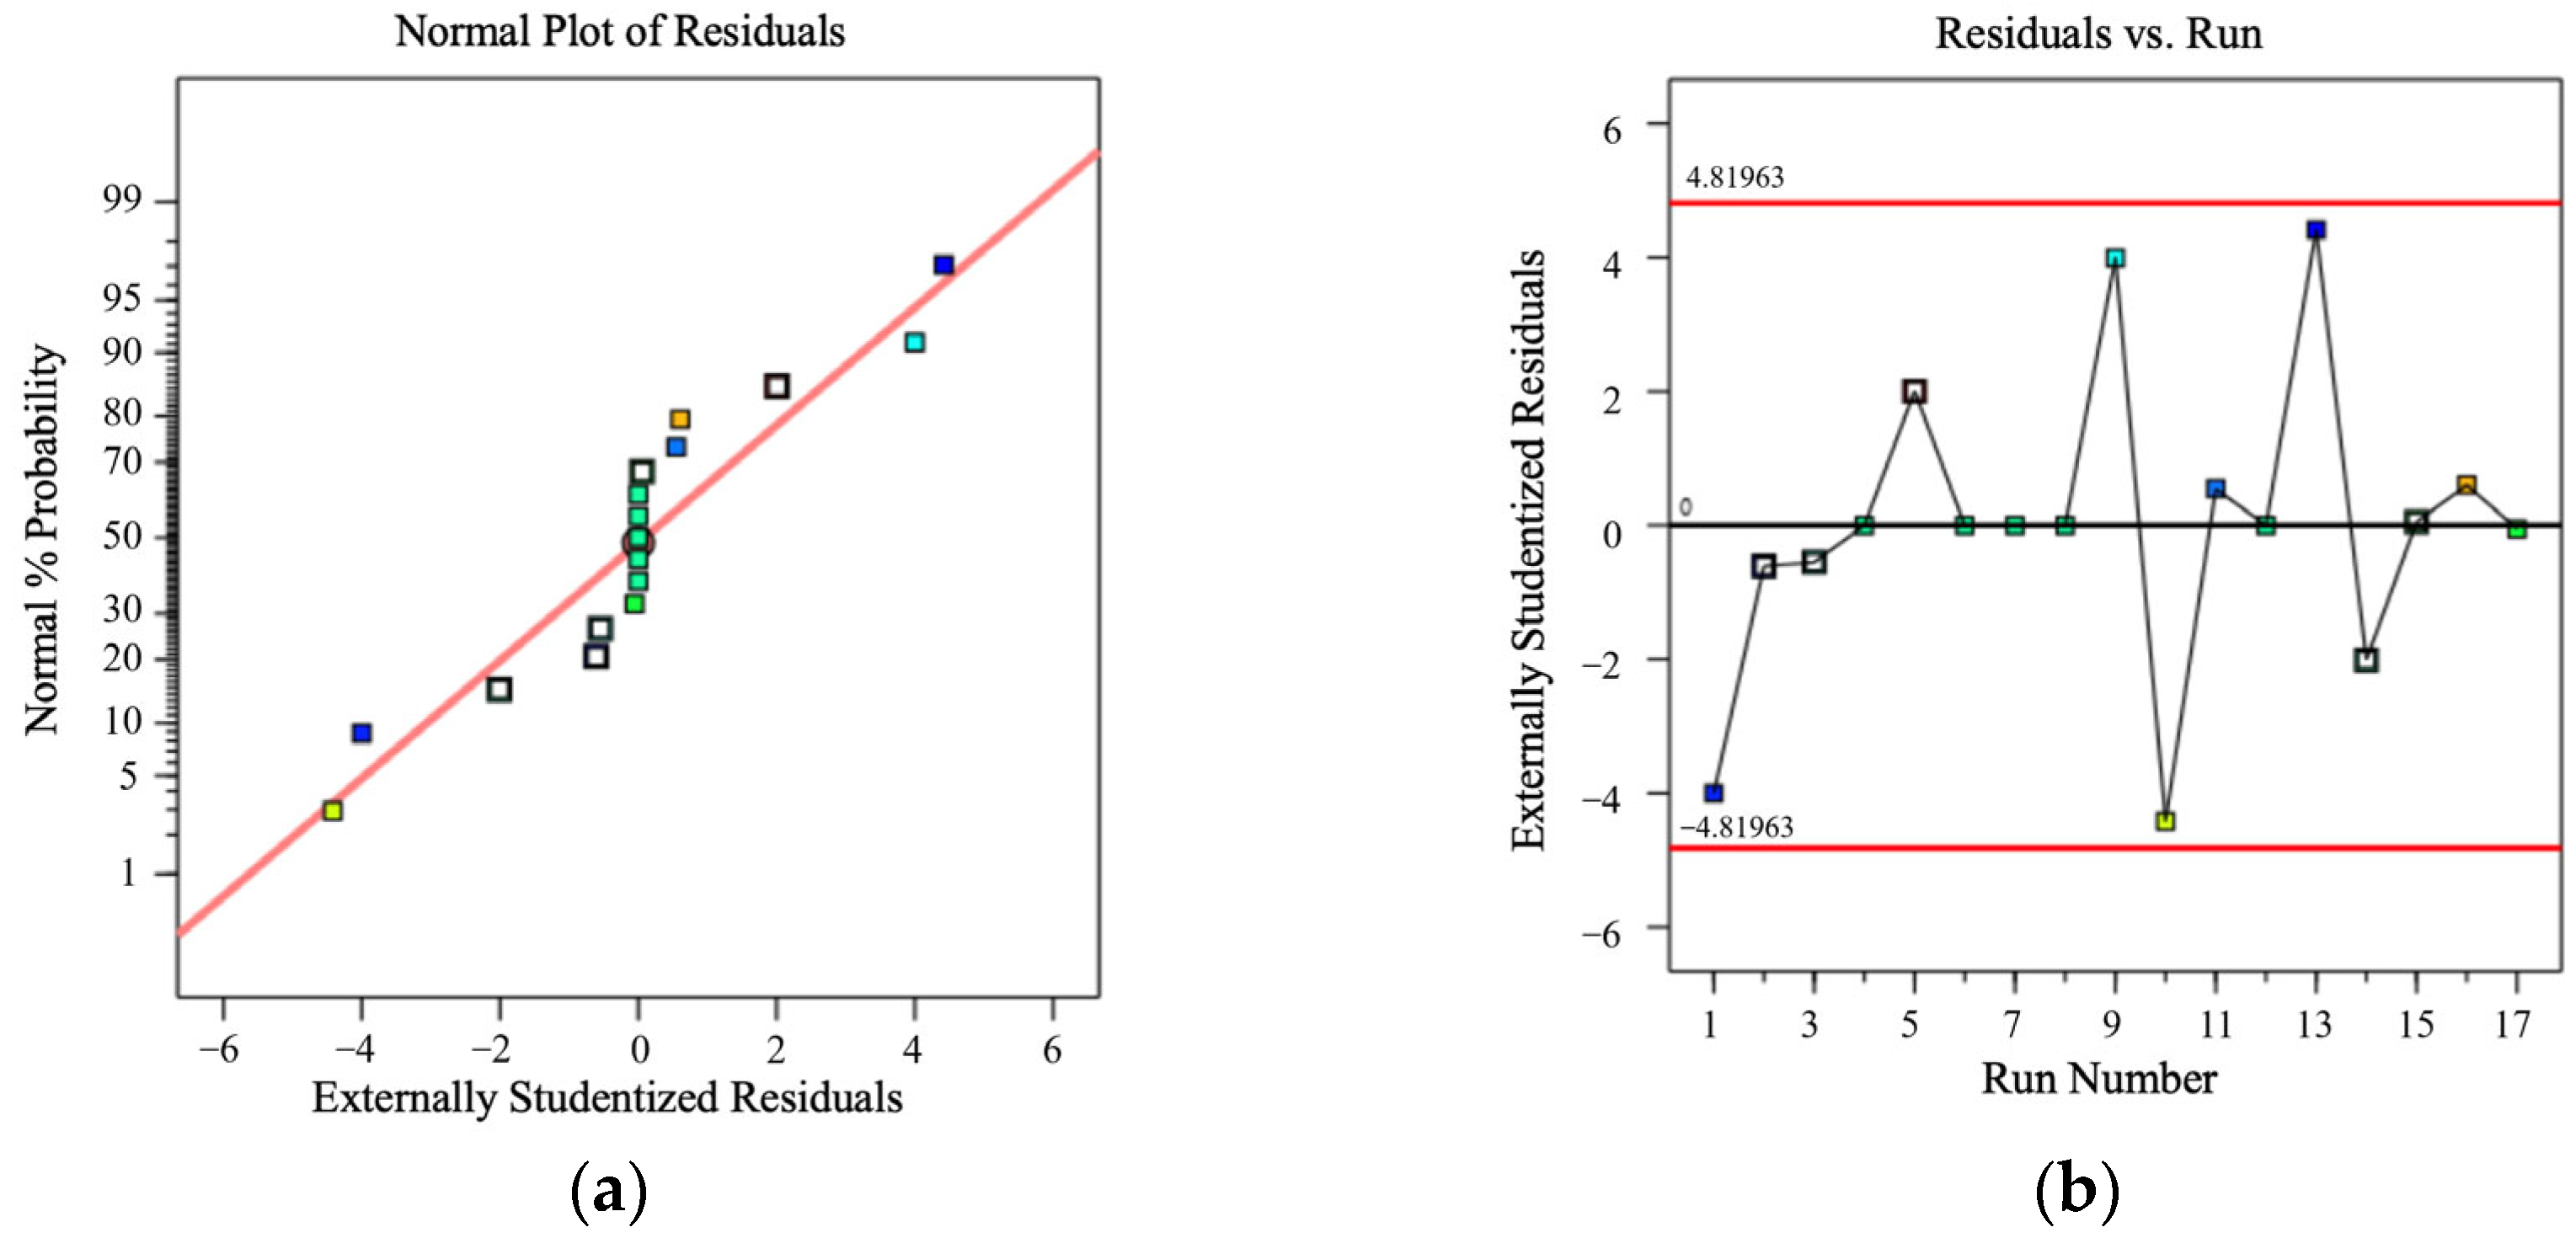
A multi-factor, multi-level experimental design was constructed based on response surface methodology (RSM) to arrange tests for spraying distance, workpiece travel speed, and powder flow rate. Analysis of variance (ANOVA) was applied to evaluate the significance of each factor. The optimal spraying parameters were obtained: the spray-gun travel speed should be controlled at no more than 0.3 m/s, and the spraying distance should be less than 450 mm, to balance spraying efficiency and coating quality. The deviation between field test data and simulation data was less than 13.5%, indicating high consistency between the two. In spraying experiments, the deviation of coating thickness obtained with the optimal parameters from the standard thickness was less than 12.25%.
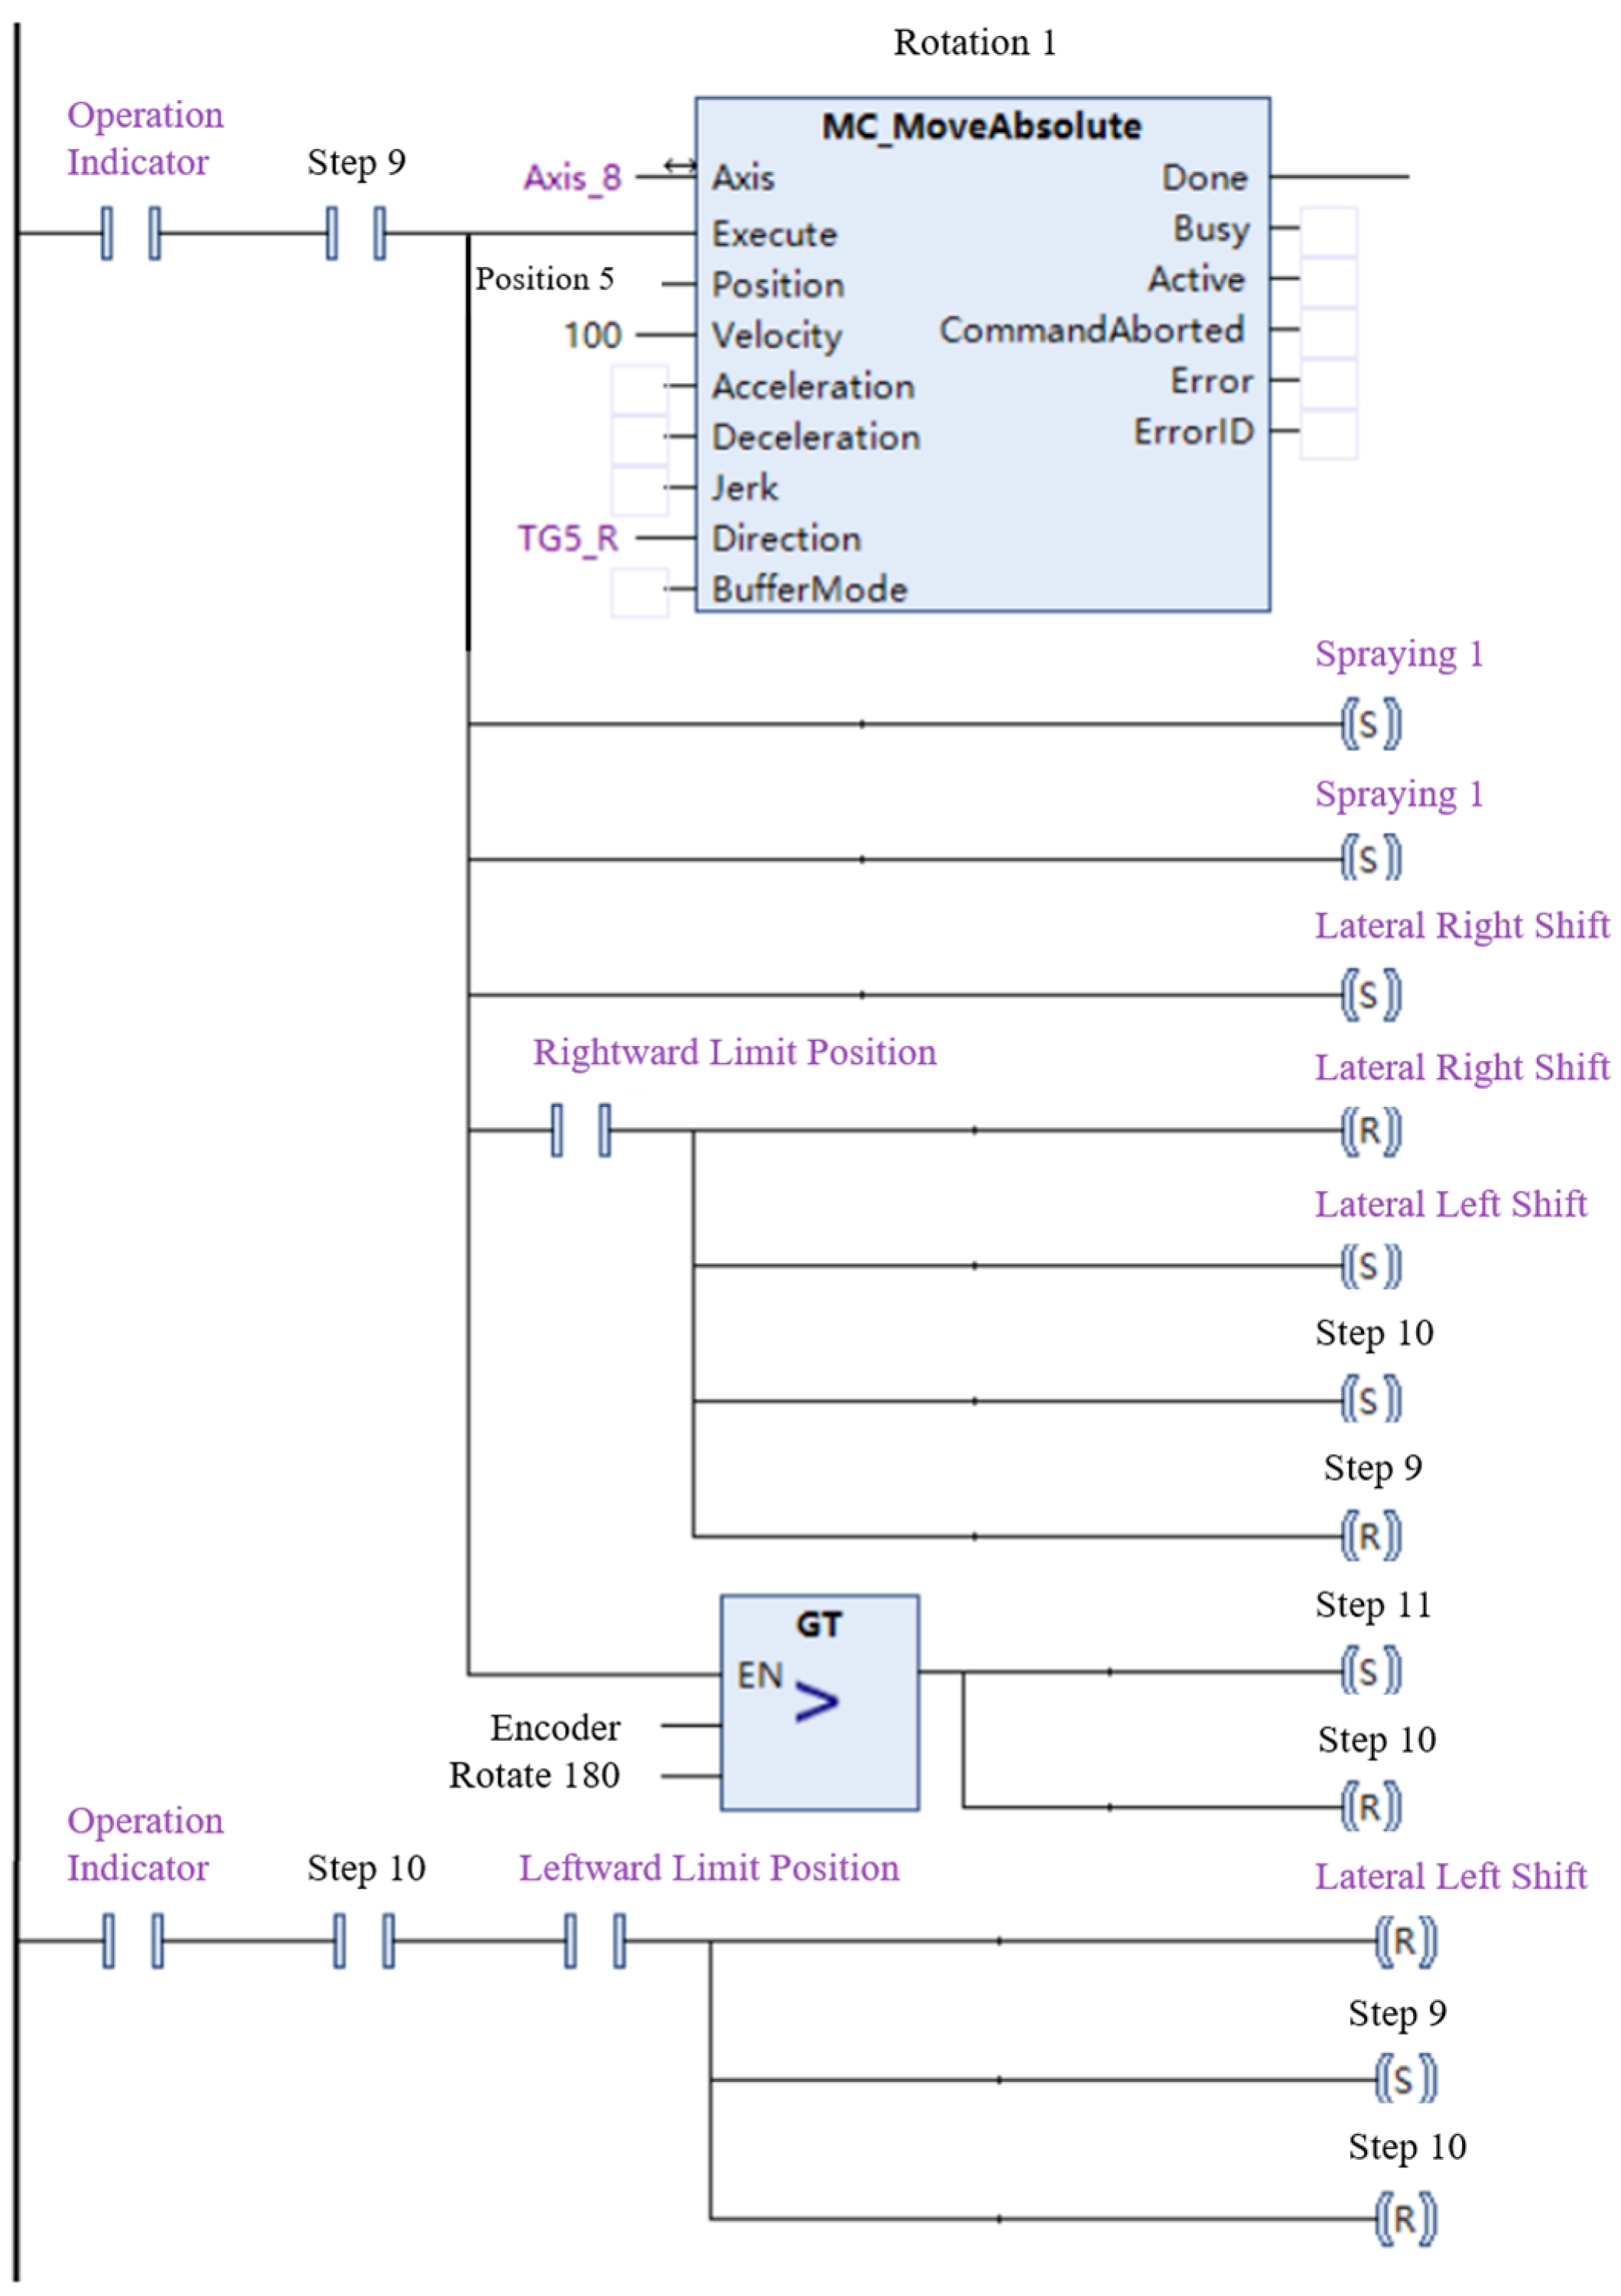
This study focuses on the pipeline field-joint region, characterized by geometric discontinuities, abrupt curvature changes, and pronounced boundary effects. A combined numerical–experimental spraying model was established, and optimized strategies for spray distance and traverse speed were proposed, demonstrating strong engineering relevance and innovation. It should be noted that several reasonable simplifications were adopted in the modeling process, such as assuming medium-pressure operation with a small spray cone angle, simplifying the PLC stepwise trajectory to uniform linear motion, and not fully accounting for environmental factors or the temperature dependence of coating properties. The number of experimental validations was also constrained by material and practical limitations. These aspects may introduce localized deviations but do not affect the validity of the main conclusions. Future work will extend in three directions: (i) conducting experiments and simulations across a wider range of spray distances, angles, and pressures to enhance extrapolation capability; (ii) incorporating temperature-dependent viscosity and edge-thinning gradients ( into the model to enable full sensitivity analysis and multi-objective optimization; and (iii) integrating PLC-based stepwise trajectory kinematics with online monitoring and feedback control to further improve coating uniformity and adaptive process regulation. Although the present method is mainly applied to field-joint repair, the proposed framework and approach hold promising potential for extension to automated spraying optimization of other complex geometries.
