Article

Frost Resistance and Damage Mechanism of Recycled Aggregate Concrete

1
Department of Civil Engineering, School of Civil Engineering and Geomatics, Shandong University of Technology, Zibo 255000, China
2
Department of Landscape Architecture, School of Civil Engineering and Architecture, Hebei University of Engineering Science, Shijiazhuang 050011, China
3
Department of Engineering and Management, International College, Krirk University, No. 3 Soi Ramintra 1, Ramintra Road, Anusaowaree, Bangkhen, Bangkok 10220, Thailand
4
Department of Architectural Engineering, School of Civil Engineering, Inner Mongolia University of Science and Technology, 7 Alding Street, Baotou 014010, China
*
Authors to whom correspondence should be addressed.
Coatings 2025, 15(10), 1169; https://doi.org/10.3390/coatings15101169
Submission received: 8 September 2025 / Revised: 28 September 2025 / Accepted: 4 October 2025 / Published: 6 October 2025

Abstract

This study systematically evaluates the influence of the recycled coarse aggregate (RCA) replacement rate and the number of freeze–thaw cycles (FTCs) on the frost damage of recycled aggregate concrete (RAC) through rapid freeze–thaw tests, and delves into the underlying damage mechanisms. The findings demonstrate that the incorporation of recycled aggregates deteriorates the frost resistance of concrete to a certain extent, primarily manifested by increased apparent damage with rising FTC numbers and RCA content. Specimens with an RCA replacement rate exceeding 50% exhibited extensive mortar spalling and aggregate exposure after 50 FTCs. The mass loss rate initially decreased in the early freezing-thawing stage, then began to increase after approximately 20 cycles, reaching a maximum of 5.09%. The relative dynamic elasticity modulus (RDEM) decreased with an increase in both FTCs and RCA content, dropping to a minimum of 71.99%. Furthermore, based on the relative dynamic elastic modulus, this study developed a GM(1, 1) freeze–thaw damage prediction model applicable to a full replacement range of 0%–100% RCA with a precision level of Grade I. Microstructural analysis revealed that microcracks and pores within the interfacial transition zones (ITZs) and the surrounding matrix of both NCA and RCA are critical for the initiation and propagation of freeze–thaw damage, thereby elucidating the damage mechanism in RAC.

1. Introduction

The global acceleration of urbanization has led to a massive generation of construction and demolition waste, a significant portion of which is waste concrete, polluting the environment and occupying land, and has increased sharply [1]. Moreover, the large amount of concrete consumed leads to the depletion of natural sand and gravel resources, causing severe damage to the ecological environment [2]. RAC uses crushed and screened waste concrete to replace natural aggregate, which can avoid excessive mining of sand and gravel resources, achieve resource utilization of construction waste, reduce carbon emissions, and have both environmental protection and economic value [3]. Nevertheless, due to the adherence of RCA to residual mortar and the presence of internal microcracks, RCA exhibits increased porosity, elevated water absorption, and reduced mechanical strength relative to natural coarse aggregate (NCA) [4,5]. These limitations hinder the extensive utilization of recycled concrete in construction applications. In addition, after the concrete is subjected to freezing, the internal microcracks further propagate, causing a certain degree of damage to the structure. When subjected to freezing and thawing, progressive detachment occurred between the aggregate and the mortar matrix; the structure gradually becomes loose, and the bearing capacity decreases significantly, thereby reducing its safety and stability [6]. Concrete structure buildings that have reached the freeze–thaw limit are extremely difficult and expensive to repair. Therefore, ensuring excellent mechanical performance and durability, particularly under the freeze–thaw (F-T) conditions, is paramount for the widespread adoption of RAC.
The mechanical properties of RAC are influenced by multiple factors, including the RCA replacement ratio, water-to-cement ratio, and sand ratio. Through orthogonal experiments, Zhang et al. [7] reported that among the many factors affecting RAC, the RCA substitution ratio has the greatest effect on its mechanical properties. At present, it is generally believed that when the replacement ratio of RCAs does not exceed 30%, their effect on the mechanical strength of concrete is insignificant [8]. Omidinasab et al. [9] reported a 4.4% reduction in cubic compressive strength at a 25% RCA replacement rate, escalating to a 20% decrease at 100% replacement. When RAC was subjected to bending loading, a replacement ratio of up to 50% had a relatively insignificant effect on its flexural strength. Ahmed et al. [10] observed a 3.53% decrease in flexural strength at 50% replacement, which surged to 26.67% at full replacement. RAC is a brittle material, and its tensile strength is far lower than its compressive strength, causing the RCA substitution ratio to have a more significant effect on the tensile strength of concrete. Xue et al. [11] noted tensile strength reductions of 31.39% and 34.14% at 40% and 100% replacement rates, respectively. This behavior is often attributed to the expansion of the defect zone (encompassing microcracks and the ITZ) with higher RCA content, promoting stress concentration during loading and leading to premature failure [12,13].
The distinct pore structure and higher porosity of RAC compared to natural aggregate concrete (NAC) result in inferior frost resistance [14]. Numerous studies confirm that the F-T durability of RAC deteriorates as the RCA replacement rate increases [15,16]. Niu et al. [17] documented compressive strength losses of 10.39%, 14.59%, and 21.09% after 100 F-T cycles for RAC with 0%, 50%, and 100% RCA, respectively. Accurately predicting F-T damage is thus essential. Deng et al. [18] and Liu et al. [19] proposed gray system theory in connection with uncertainty systems with incomplete small data and poor information. Liu et al. [20], Feng et al. [21] and Gao et al. [22] used the GM model to predict the freeze–thaw damage of concrete, which highlights the versatility of the GM model in the analysis process.
For conventional concrete, the F-T damage mechanism has been relatively well explained based on the hydrostatic pressure and osmotic pressure theories proposed by Powers [23,24]. However, the inherent and more complex microscopic defects and weak areas within RCA prevent the direct application of these classical theories to the RAC system. Many scholars have conducted extensive research on the theory that the durability of concrete continuously decreases during FTCs [25,26]. With the development of RAC technology, Kong et al. [27], Qiu et al. [28], and Bai et al. [29] proposed F-T damage mechanisms for RAC based on classical freeze–thaw damage theories. However, the micro-mechanisms underpinning these theoretical frameworks remain inadequately elucidated, and existing studies have not sufficiently addressed the interactive effects of RCA replacement rates and the frequency of FTCs. Moreover, there is a notable absence of predictive models capable of accurately forecasting the F-T durability of concrete across the entire spectrum of RCA replacement ratios (0%–100%). Consequently, it is imperative to further investigate the intrinsic F-T damage mechanisms in RAC. This research systematically examines the combined influence of the full range of RCA replacement rates (0%–100%) and the number of FTCs to develop a high-precision GM model for predicting F-T damage, and provides an in-depth analysis and clarification of the F-T damage mechanism of RAC through microscopic tests.
Although existing studies have explored the frost resistance of RAC, research on high-precision service life prediction based on the Grey Model (GM) remains scarce. Specifically, there is an absence of F-T damage models for concrete incorporating RCA at replacement levels spanning from 0% to 100%. Furthermore, the internal mechanisms underlying F-T damage in RAC have not been systematically or comprehensively elucidated. Based on this, the present study investigates the influence of the RCA replacement rate and the number of FTCs on the frost resistance of RAC through rapid freeze–thaw tests. A highly accurate GM(1, 1) predictive model for F-T damage in RAC, encompassing replacement rates ranging from 0% to 100%, has been developed. This model is founded on the variations observed in the RDEM of RAC subjected to F-T conditions. Furthermore, the internal F-T damage mechanism of RAC is systematically elucidated through microstructural analysis.

2. Test Materials and Methods

2.1. Test Materials

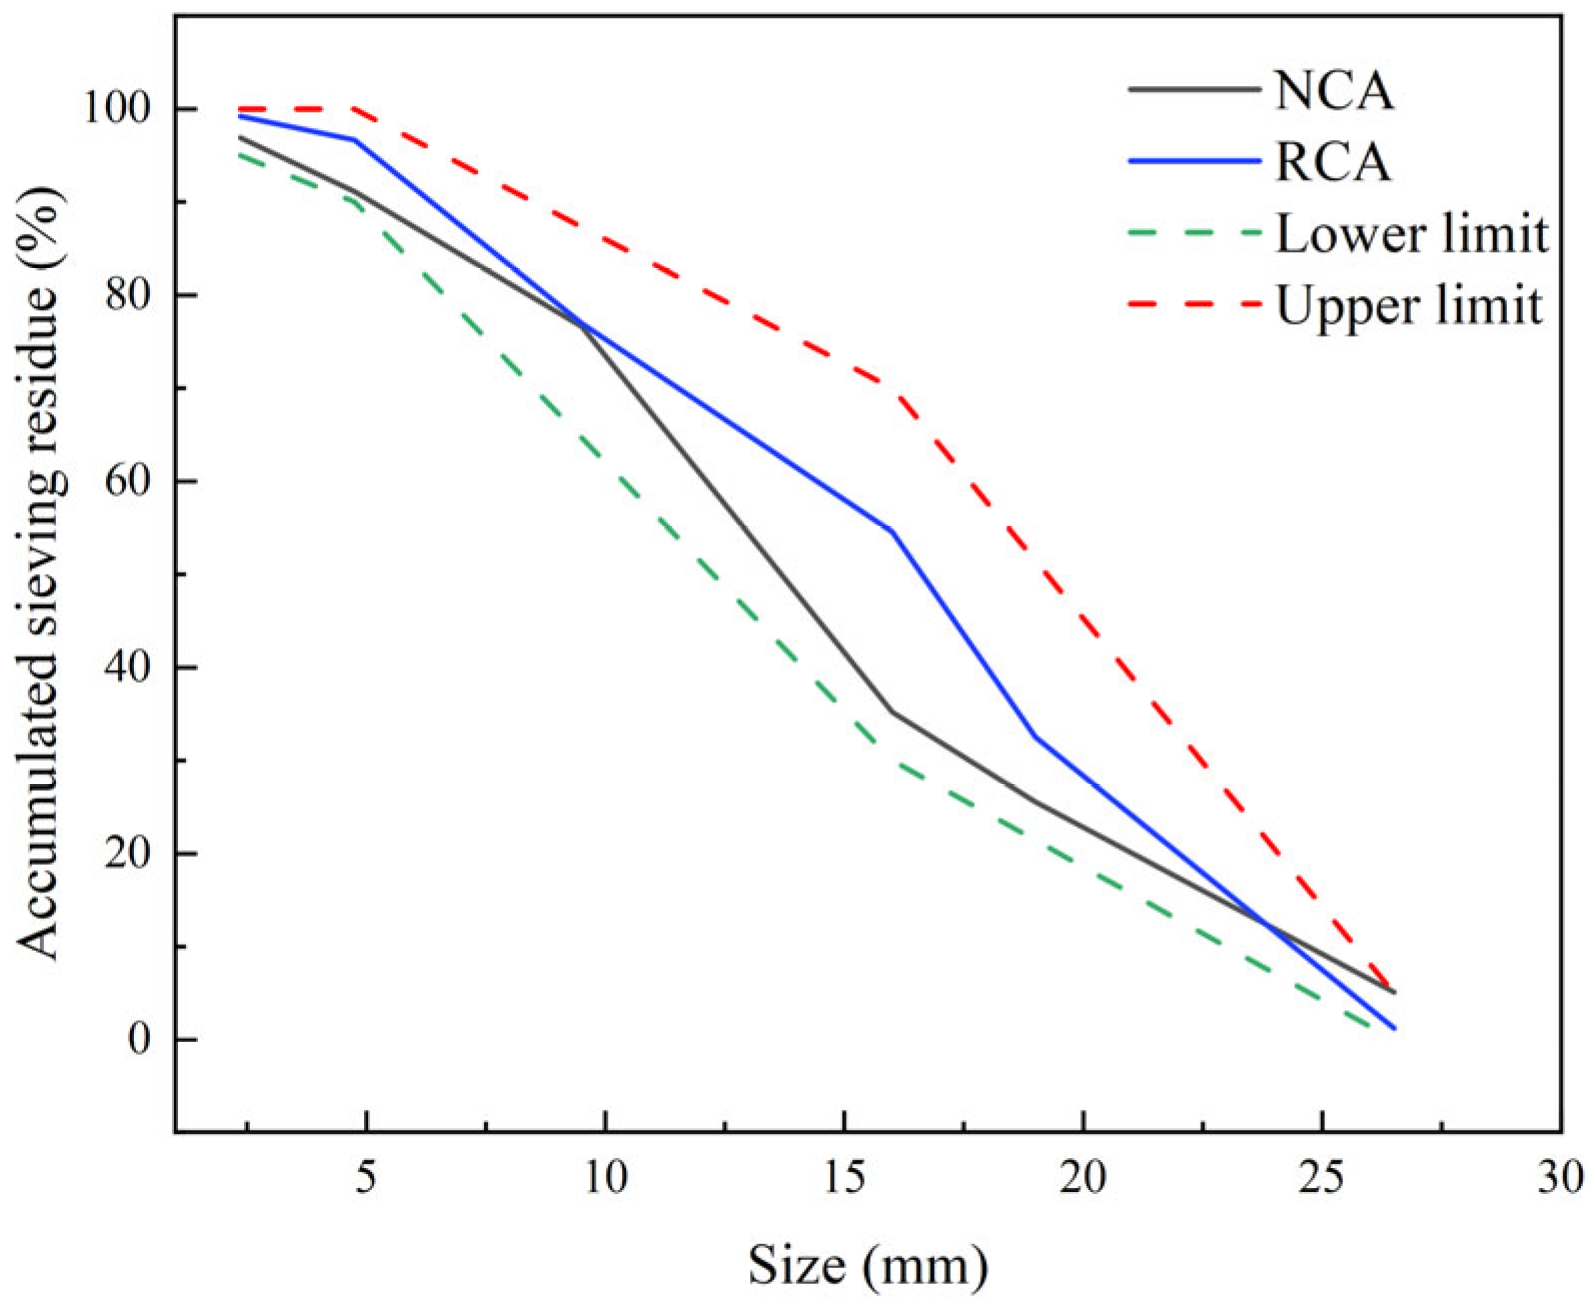
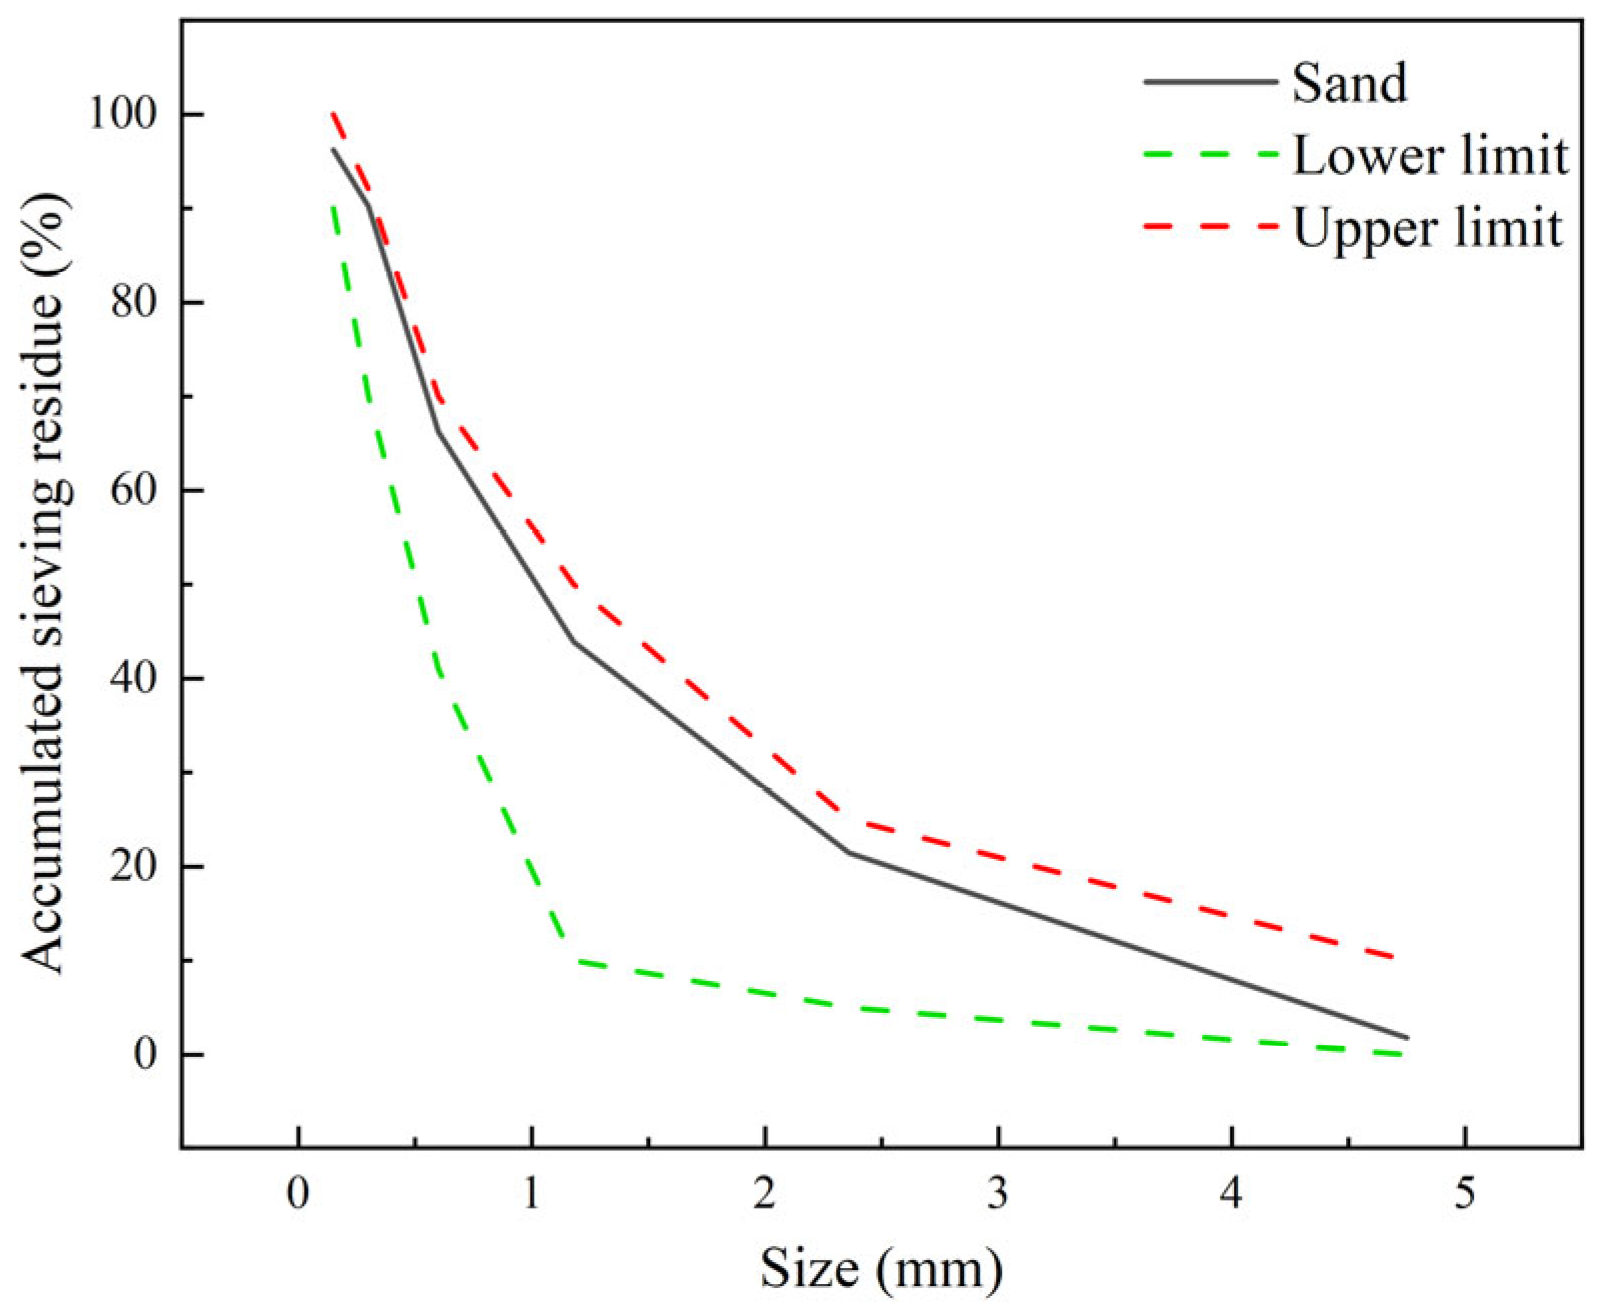
P.O 42.5 ordinary Portland cement, conforming to Chinese standard GB/T 39698-2020 [30], was used. Its physical properties and chemical composition are detailed in Table 1 and Table 2, respectively. Both NCA and RCA were sourced from Xintiansheng Concrete Co., Ltd. (Zibo, China), meeting the specifications of JGJ 52-2006 [31]. Their physical properties and particle size distribution are presented in Table 3 and Figure 1. Natural river sand, employed as fine aggregate following JGJ 52-2006 [31], had a grading curve shown in Figure 2.

2.2. Mix Ratio

In accordance with JGJ 55-2019 [34], the concrete mix design was carried out in this test, as shown in Table 4. The number of ordinary concretes prepared with natural aggregate is “NC”, and the number of recycled concretes prepared with recycled aggregate is “R + recycled Coarse aggregate volume fraction”. Five mix proportions were designed in this study, with a constant water–cement ratio of 0.45. Prior to concrete casting, the aggregates were pre-wetted and maintained in a saturated surface-dry condition during casting to eliminate the influence of aggregate absorption on the effective water–cement ratio [32,33]. In accordance with established research practices [35,36], the equal volume replacement method was used to replace NCA with RCA to ensure that the compactness of the concrete was not affected by the volume change in the aggregate.

2.3. Test Methods

2.3.1. Freeze Resistance Test

In accordance with GB/T 50082-2009 [37], the rapid freeze–thaw test was conducted to evaluate the frost resistance of RAC. A TDR-9 rapid freeze–thaw testing machine and a DT-10W dynamic modulus tester (Tianjin Luda Construction Instrument Co., Ltd., Tianjin, China) were employed (Figure 3). To simulate the damage induced by alternating positive and negative temperatures in water-saturated concrete under natural conditions [37,38,39,40], this experiment stipulates that each FTC shall not exceed 4 h, and the thawing time shall not exceed one-quarter of the total cycle duration. The temperature regime was set as follows: maximum temperature +5 ± 2 °C, minimum temperature −18 ± 2 °C, and transition time ≤10 min. After every 10 FTCs, specimens were removed, surface-dried, and measured for lateral fundamental frequency and mass. Every five cycles, specimens were repositioned to ensure uniform exposure. The test was terminated when the RDEM fell below 60% or the mass loss exceeded 5%.
In this study, three specimens were prepared for each mix proportion, and the final result was taken as the average of the test results from these three specimens. The mass loss rate and RDEM of the concrete specimens after FTCs were calculated using the following equations, respectively:
Δ W n i = W 0 i W n i W 0 i × 100 Δ W n i = i = 1 3 Δ W n i 3
where ∆Wni is the mass loss rate (%) of sample i after n FTCs, W0i is the mass loss of test piece i without an FTC (mm), Wni is the mass loss rate of sample i after n FTCs (mm), and ΔWn denotes the average mass loss rate (%) of specimens with the same mix proportion after n FTCs.
P i = f 0 i f n i f 0 i × 100 P n = i = 1 3 P i 3
where Pi is the RDEM of sample i after n FTCs (%), f0i is the lateral fundamental frequency of sample i without FTCs (Hz), fni is the freeze–thaw cycle frequency of sample i and the horizontal fundamental frequency after n FTCs (Hz), and Pn denotes the average RDEM (%) of specimens with the same mix proportion after n FTCs.

2.3.2. Microscopic Tests

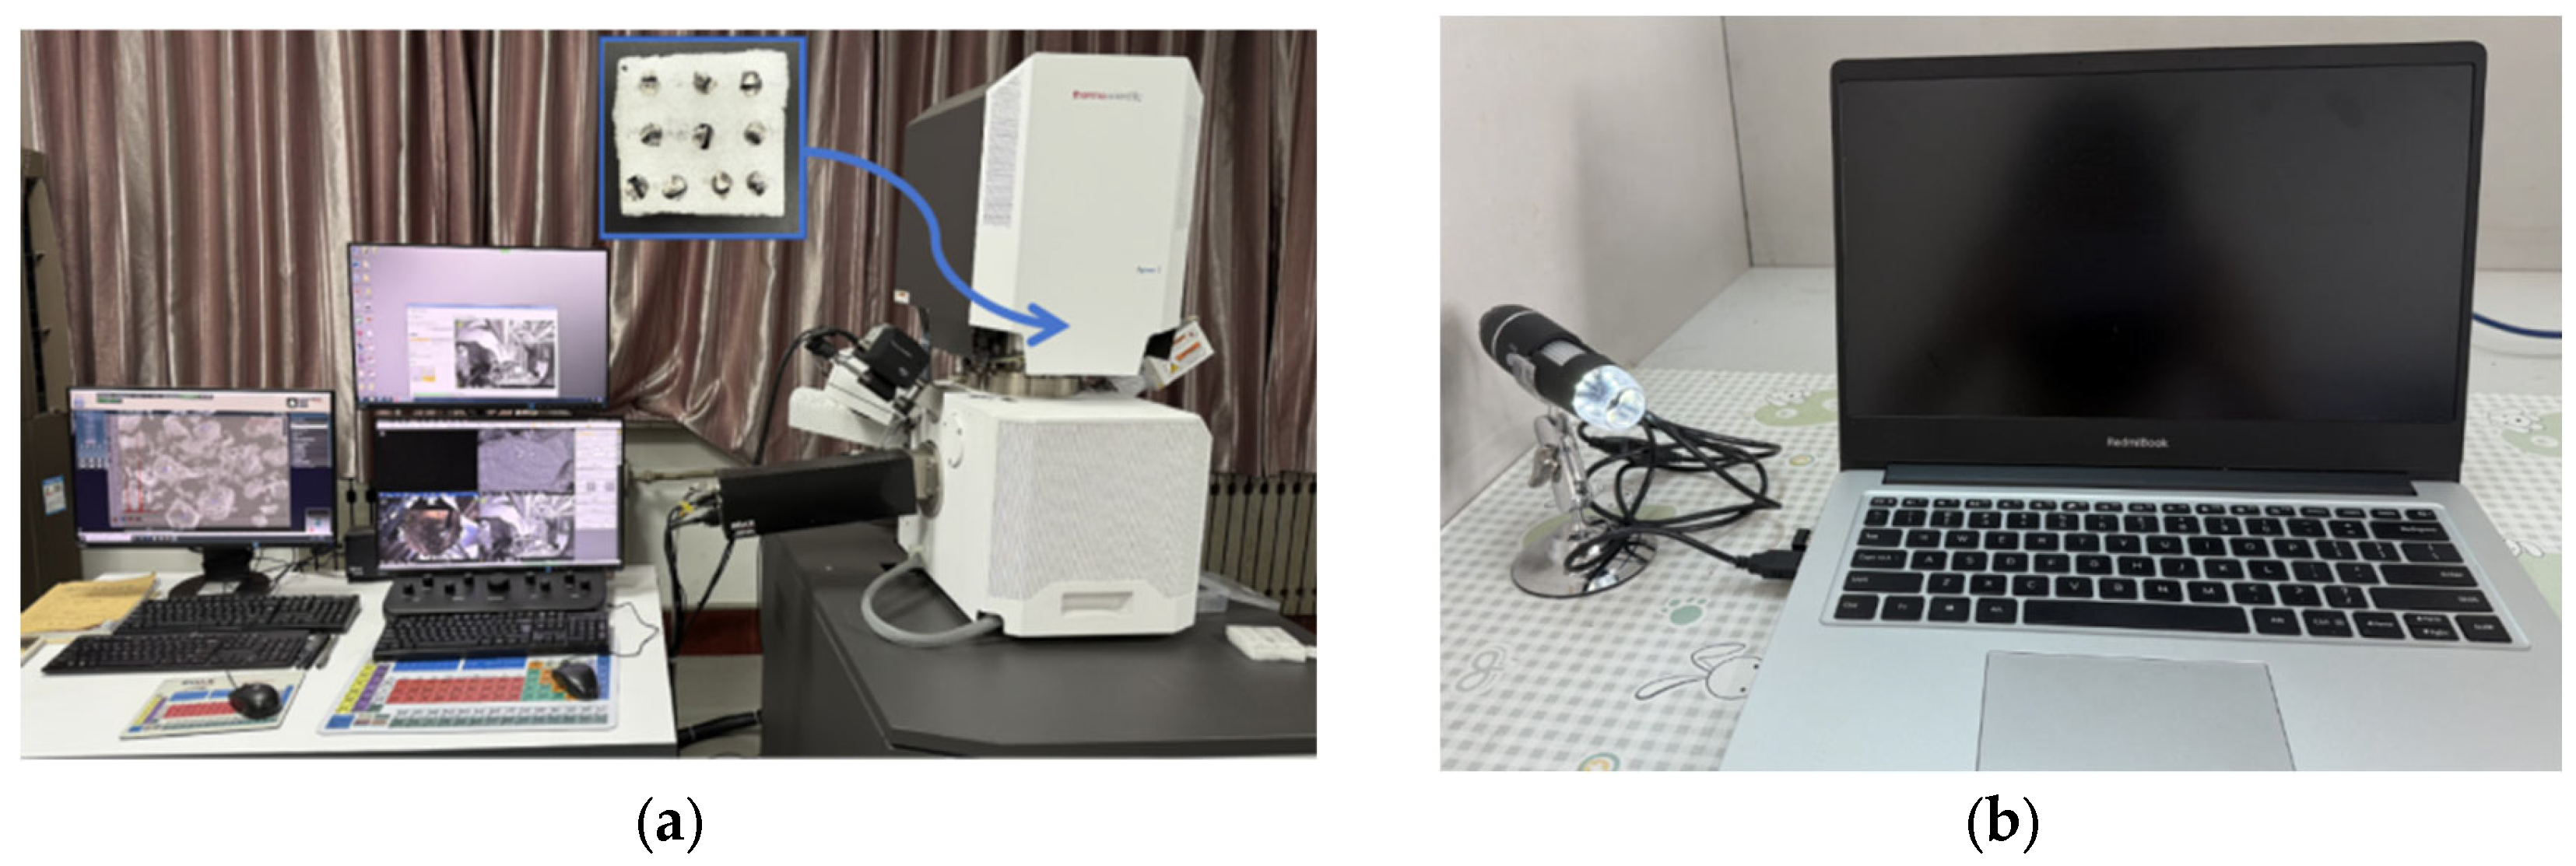
The morphological characteristics of the cement stone samples at the microscopic level were observed via field emission environmental scanning electron microscopy (SEM) (Thermo Scientific, Waltham, MA, USA) and USB digital microscopy (DMD) (Yusen, Suzhou, China), as shown in Figure 4. Prior to SEM observation, the samples were oven-dried, fractured to expose fresh surfaces, and sputter-coated with a thin layer of gold to enhance conductivity. Observations were conducted under high vacuum conditions at an accelerating voltage of 10 kV. The DMD examination was performed on the samples’ as-cast surfaces to document macroscopic features without any pre-treatment.

3. Results and Discussion

3.1. Frost Resistance Performance

3.1.1. Appearance

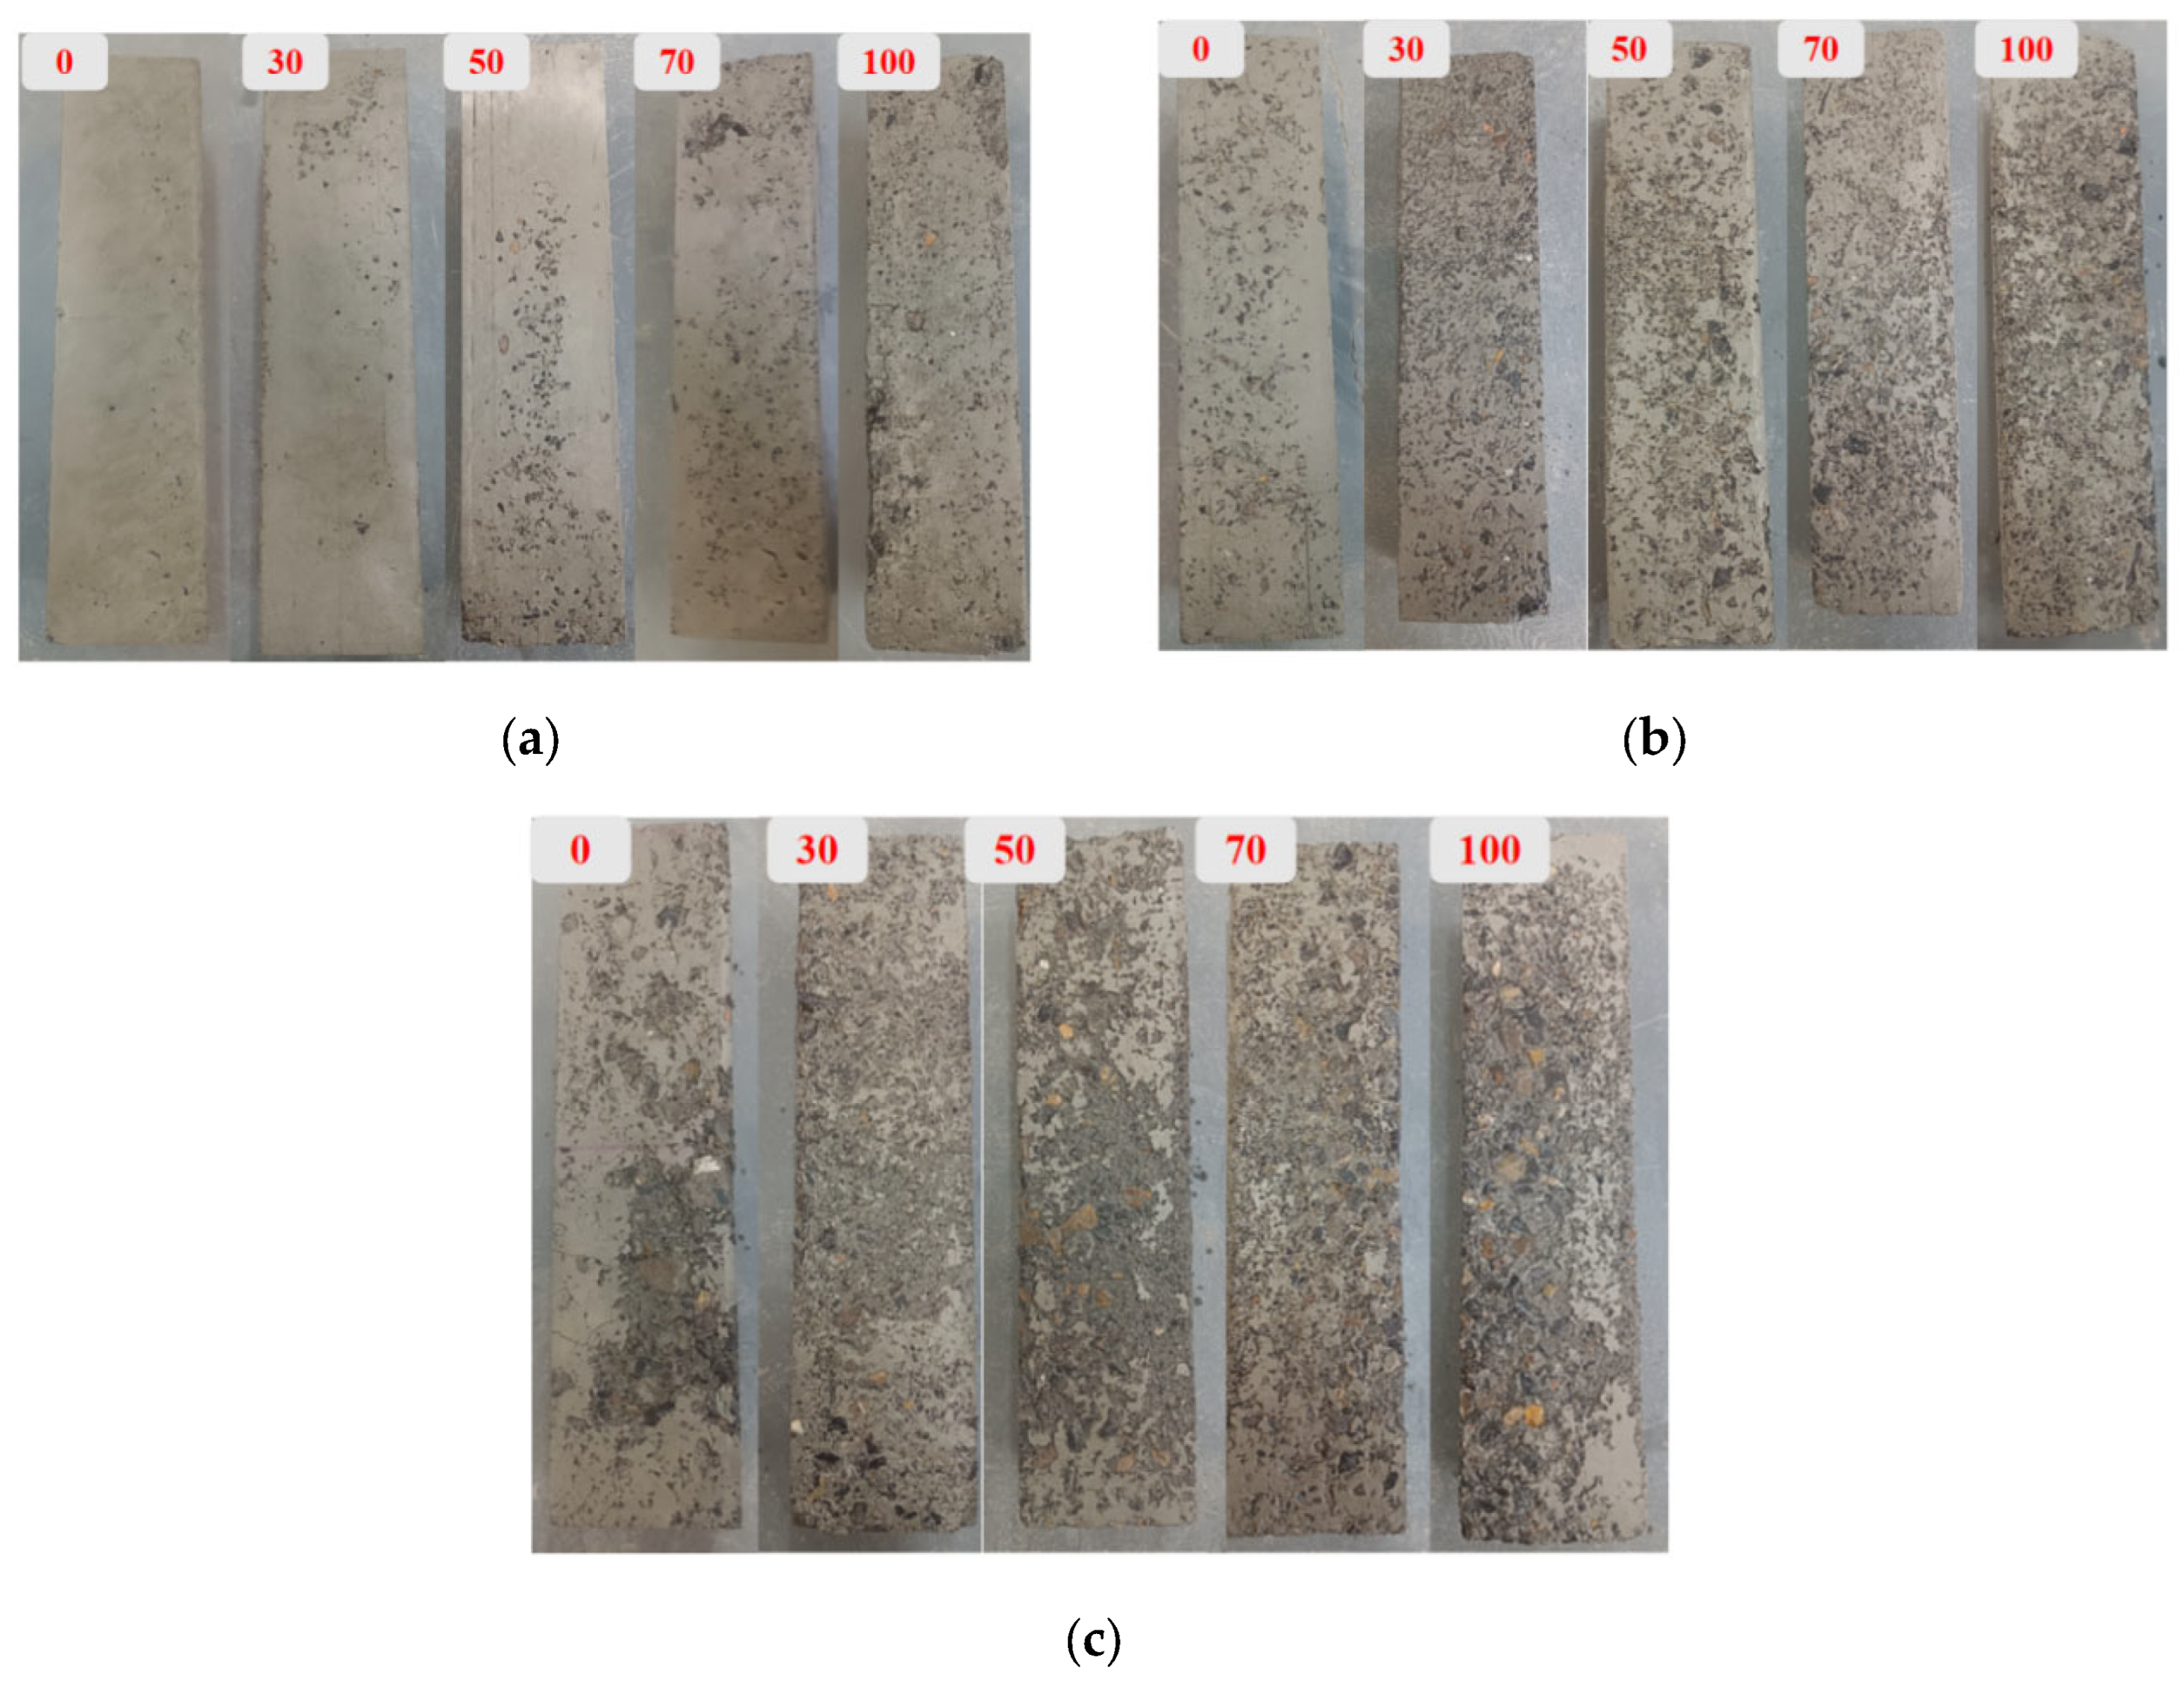
The surface characteristics of RAC following FTCs are illustrated in Figure 5. After 10 FTCs, the surfaces displayed pitting and minor erosion, with the severity of surface deterioration increasing in proportion to the RCA replacement ratio (Figure 5a). Upon completion of 30 FTCs, micro-pores merged to form larger cavities, resulting in a markedly rougher surface texture; notably, corner spalling of coarse aggregates was observed, especially in mixtures with elevated RCA content (Figure 5b). After 50 FTCs, extensive spalling of the surface mortar occurred, exposing certain coarse aggregates (Figure 5c). In the advanced stages of freeze–thaw exposure, the extent of exposed and spalled coarse aggregate areas on the specimen surface progressively increased with higher RCA replacement rates [41,42]. In summary, throughout the FTC process, the RCA substitution rate exerted a significant influence on the degree of visible damage to the specimens, with higher RCA proportions correlating with increased levels of surface deterioration [43].

3.1.2. Mass Loss

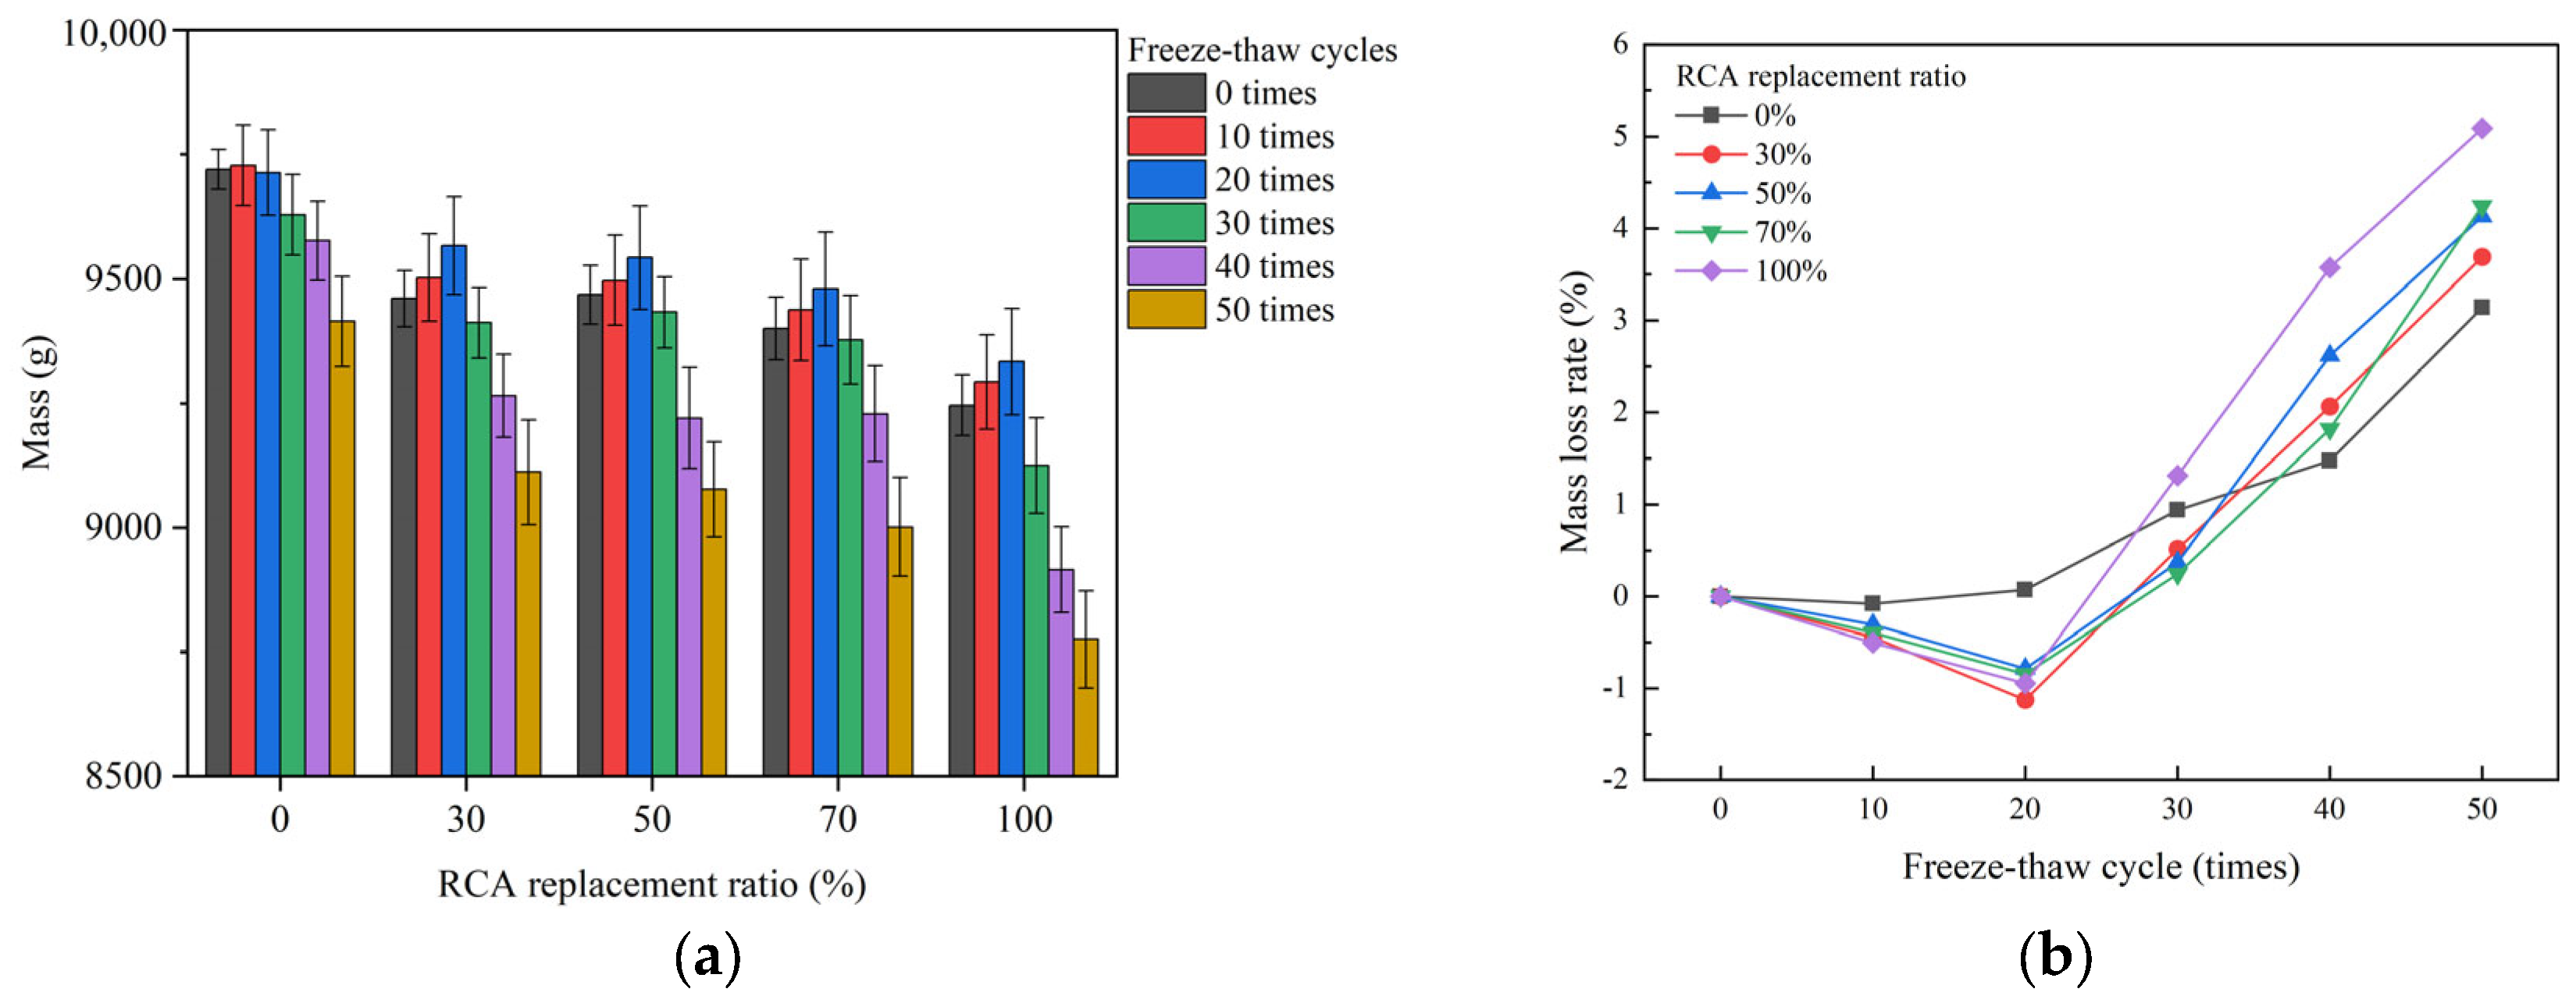
The variation in mass of RAC during F-T cycling is plotted in Figure 6. With the increase in the number of FTCs, the mass of the RAC test piece initially increased but then decreased. The increasing stage of test sample quality was mainly concentrated in the 10–20 FTCs, and the decreasing stage of test sample quality was mainly concentrated in the 20–50 FTCs. These findings indicate that cracks in RAC develop rapidly during the early and middle-term FTCs and that bone–pulp separation is most severe during the middle and late stages of the FTC. There are two reasons for the quality change of the test piece [44,45]. First, the mortar undergoes frost heave and F-T splitting under the action of FTCs, causing cracks to form inside the mortar, which reduces the mass of the test sample; second, the mortar undergoes FTCs. After the thawing cycle, the cracks developed inside the concrete, and the independent closed pores that were connected with each other under the action of the FTC opened up spaces for the infiltration of water, resulting in an increase in the mass of the test piece.
With an increasing number of FTCs, the mass of the concrete specimen, measured in its water-saturated state, initially exhibits an increase followed by a subsequent decrease. Concurrently, the rate of mass loss demonstrates an initial decline before rising. A negative mass loss rate signifies a net mass gain attributable to water absorption, whereas a positive mass loss rate reflects material degradation resulting from surface scaling.
Compared to the initial mass, during the early stages of FTCs (10–20 times), the mass of the NAC specimens and the average mass of the RAC specimens increased by 7.8 g and 86.8 g, respectively (corresponding to the nadir of the mass loss rate for NAC and the average mass loss rate for RAC, reaching −0.08% and −0.92%, respectively). In the later stages (50 times), the mass of the NAC specimens and the average mass of the RAC specimens decreased by 305.2 g and 402.4 g, respectively (corresponding to the peak mass loss rate for NAC and the average mass loss rate for RAC, reaching 3.14% and 4.29%, respectively). The significant difference in these data arises because, compared to NCA, RCA possesses more internal pores, which provide greater space for water ingress during the initial FTCs. Consequently, the mass gain of RAC specimens is more pronounced initially. This also establishes the necessary conditions for more severe water ingress and mass loss in the later stages. The macroscopic scaling (i.e., the actual mass loss) observed on the concrete specimen surfaces in the later stages is the ultimate result of the cumulative internal damage process.
The fitting models of the number of FTCs (n), RCA replacement rate (r) and mass loss rate (ΔWni) of the RAC are shown in Figure 7, and the fitting models are as follows:
Δ W n i = Z 0 + a n + b n + c r 2 + d r 2
Table 5 shows the fitting parameters of n, r, and ΔWni The fitting correlation coefficient R2 was 0.9253, indicating that the fitted model could better predict the mass loss rate of RAC after FTCs.

3.1.3. Relative Dynamic Elastic Modulus

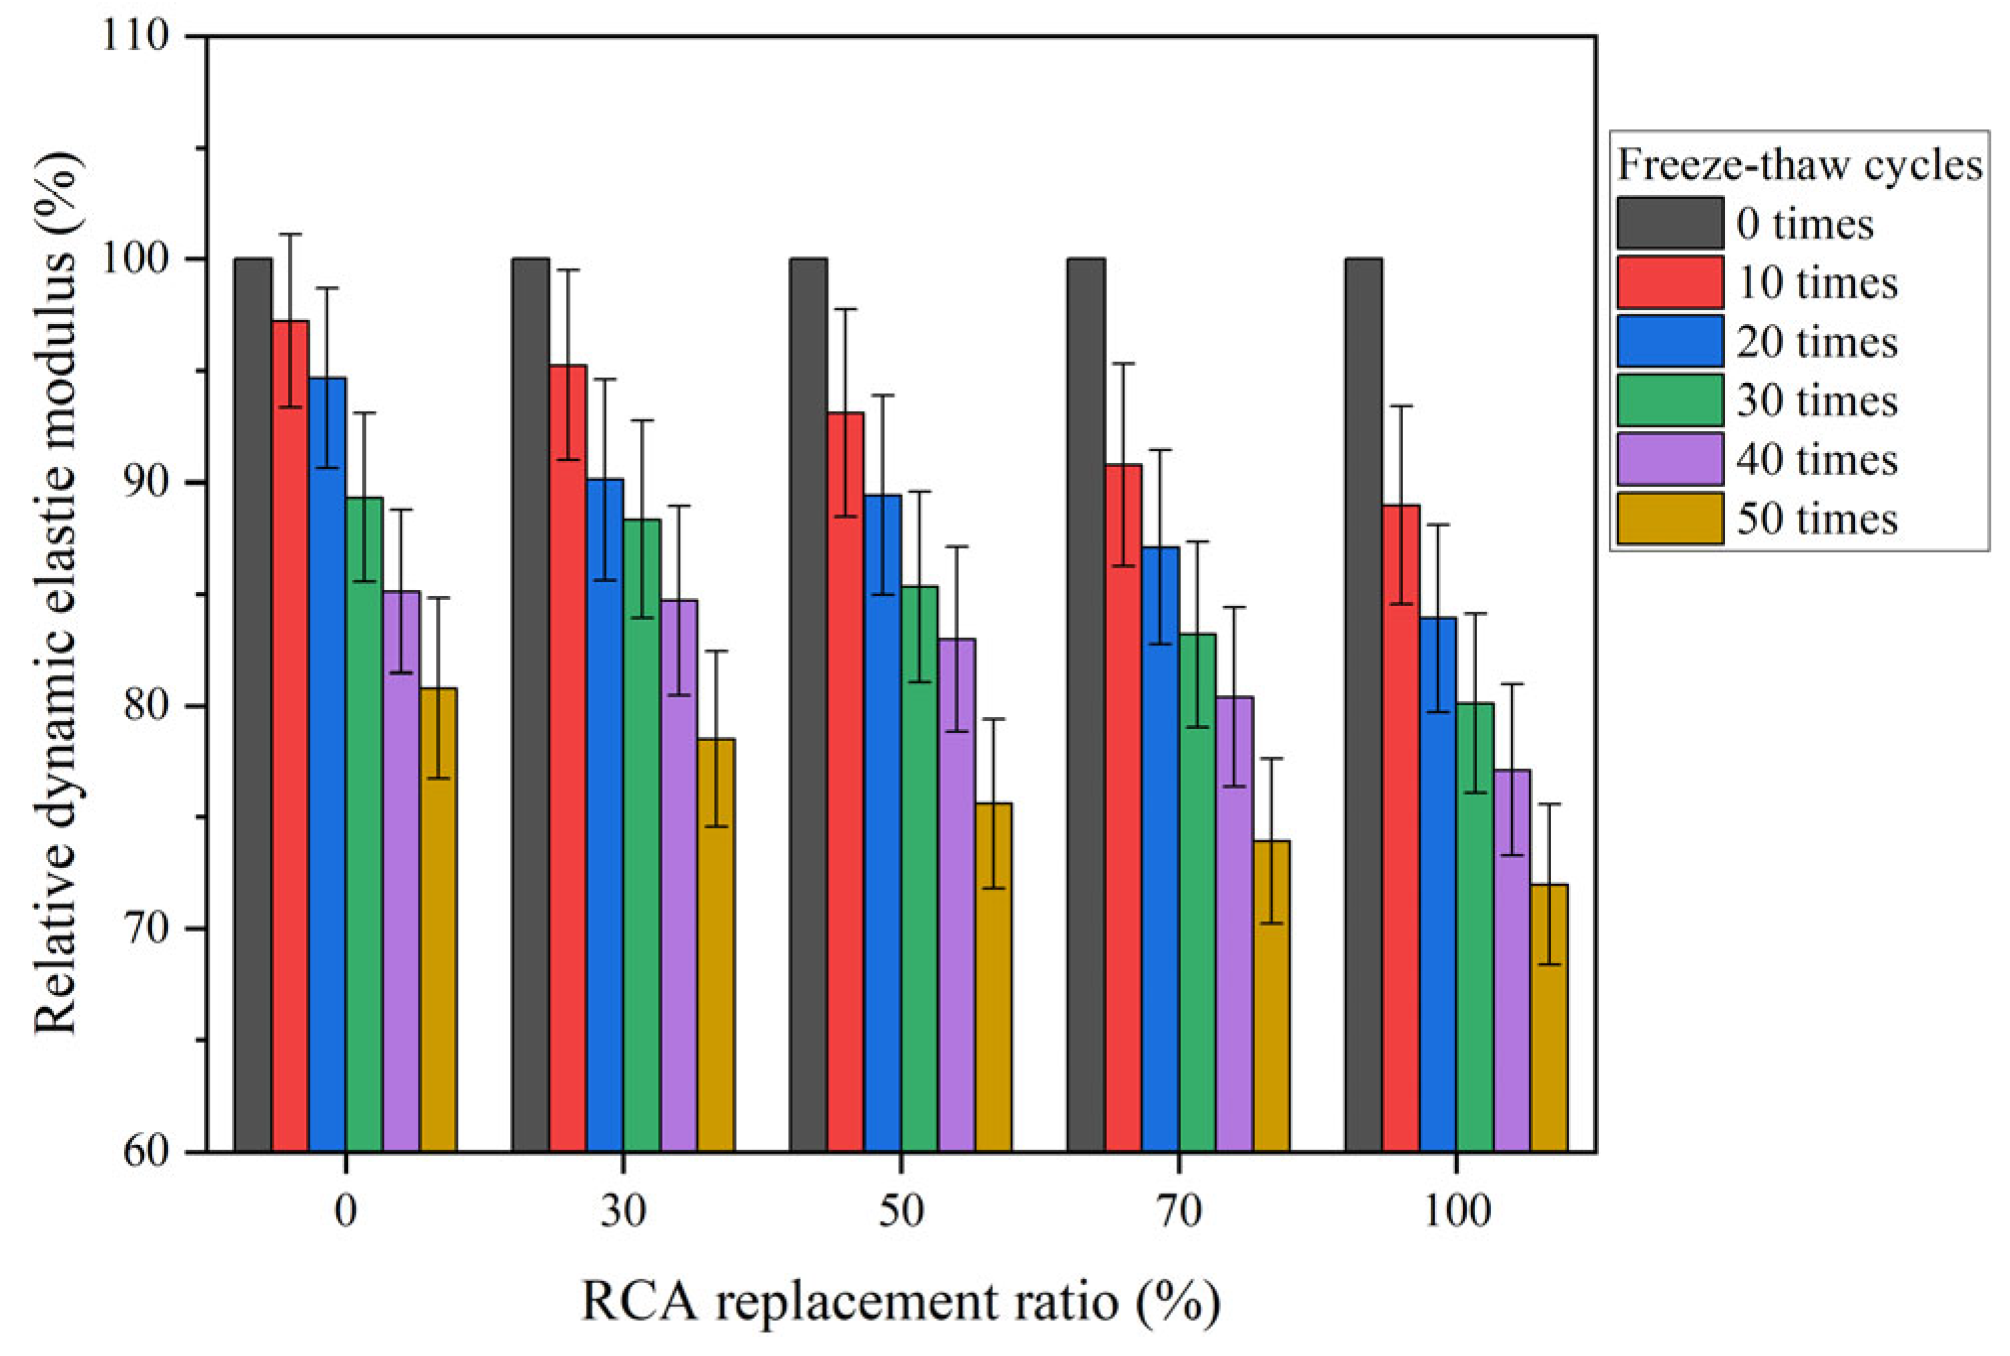
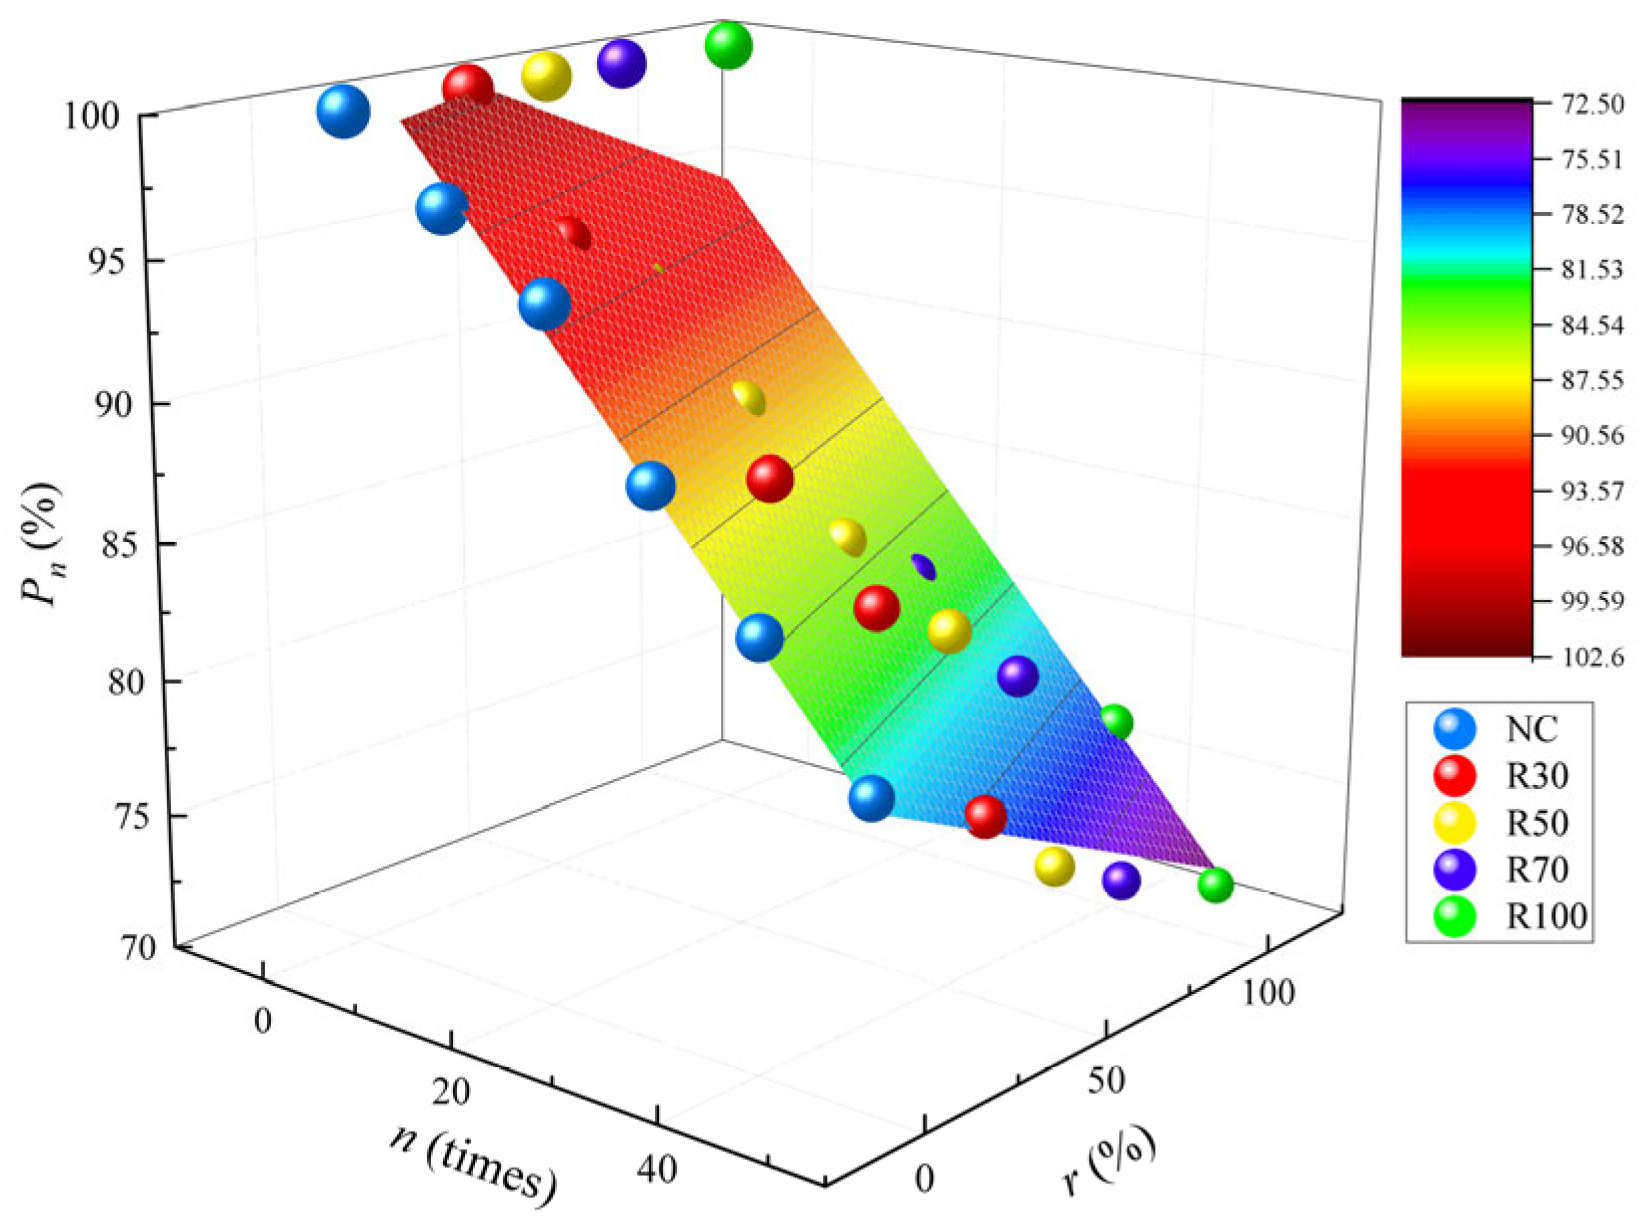
The changes in the RDEM (Pn) of the RAC in the freeze–thaw environment are shown in Figure 8. In general, the resonant frequency of an object is related to its density. During the FTC, the resonance frequency of the test piece is measured via dynamic ballast to accurately determine the development status of fractures [46]. With an increasing number of FTCs, the RDEM of the concrete samples with different RCA substitution ratios tended to decrease. After 50 FTCs, the RDEM of the RAC decreased to 71.99%–80.78%. In addition, under different numbers of FTCs, the RDEM of the concrete with an RCA replacement rate of 100% was the lowest, and the RDEM of the RAC decreased with increasing RCA replacement rate.
The fitting models of RAC n, r, and Pn are shown in Figure 9. The fitted models are as follows:
P n = 102.59688 0.44581 n 0.7709 r
The fitted correlation coefficient R2 of 0.9621 indicates that the model provides a highly accurate prediction of the RDEM of RAC after FTCs.

3.2. Freeze–Thaw Damage Model

Owing to the changes in positive and negative temperatures, the aqueous solution alternates back and forth between the liquid phase and the solid phase; as a result, cracks inside the concrete are gradually generated and developed, and the performance of the concrete is gradually reduced. The degree of damage is a variable that represents the internal damage state of the material and can be used to describe the damage evolution process of concrete during the FTC [22,47]. On the basis of damage mechanics theory, concrete before FTCs is considered a nondestructive material composed of countless microelements, and the degree of damage is defined as the ratio of the number of microelements damaged after FTCs to the number of microelements damaged before FTCs [48]. In this study, the RDEM of the concrete was used to represent the change in the number of microelements in the concrete before and after freeze–thawing [26,49]. On the basis of the strain equivalence assumption proposed by Lematire [50], the degree of damage DN is defined as follows:
D N = 1 E N E 0
where DN represents the freeze–thaw damage value of the concrete sample, EN represents the dynamic elastic modulus of the concrete sample after N cycles of freeze–thaw, E0 represents the dynamic modulus of elasticity of the concrete sample without freeze–thaw, and N represents the number of FTCs of the test sample.

3.2.1. Construction of GM(1, 1) Model

Various prediction models for freeze–thaw damage in RAC have been developed by researchers, including models based on the Weibull distribution [51], the GM method [20,21], models developed from the Aas-Jakobsen fatigue theory [52], and classical damage evolution models such as the Chaboche model [53]. Among these, the Weibull distribution model effectively captures performance variability caused by the uneven distribution of internal defects in concrete; however, its prediction accuracy is highly sensitive to the number of test samples [54]. Freeze–thaw damage is inherently a complex process involving coupled physical and chemical interactions, which differ significantly from the mechanical fatigue damage mechanisms observed in metallic materials. Consequently, directly applying the Aas-Jakobsen fatigue theory struggles to accurately capture specific damage mechanisms prevalent in freeze–thaw processes, such as salt crystallization and moisture migration [51,55]. Although the Chaboche damage evolution model can meticulously describe the nonlinear accumulation of damage, it involves numerous material parameters, making practical calibration challenging [51,55]. In contrast, the GM offers distinct advantages in handling data characterized by “small sample sizes and limited information.” It enables effective prediction of long-term material durability based on limited initial experimental data, providing an efficient and economical approach for rapidly assessing the frost resistance of RAC. Therefore, the GM was selected in this study to establish the freeze–thaw damage prediction model for RAC.
The first-order, one-variable grey model, GM(1, 1), is effective for modeling systems with limited data [56]. It processes original, non-negative, discrete data sequences through accumulation to reveal underlying patterns [57]. GM(1, 1) is more accurate at modeling monotonic data, can retain the characteristics of the original system, and better reflects the real situation of the system [58]. Therefore, in this experiment, GM(1, 1) is used to establish a prediction model for the degree of damage DN. For the detailed modeling steps, see the literature [33,59].
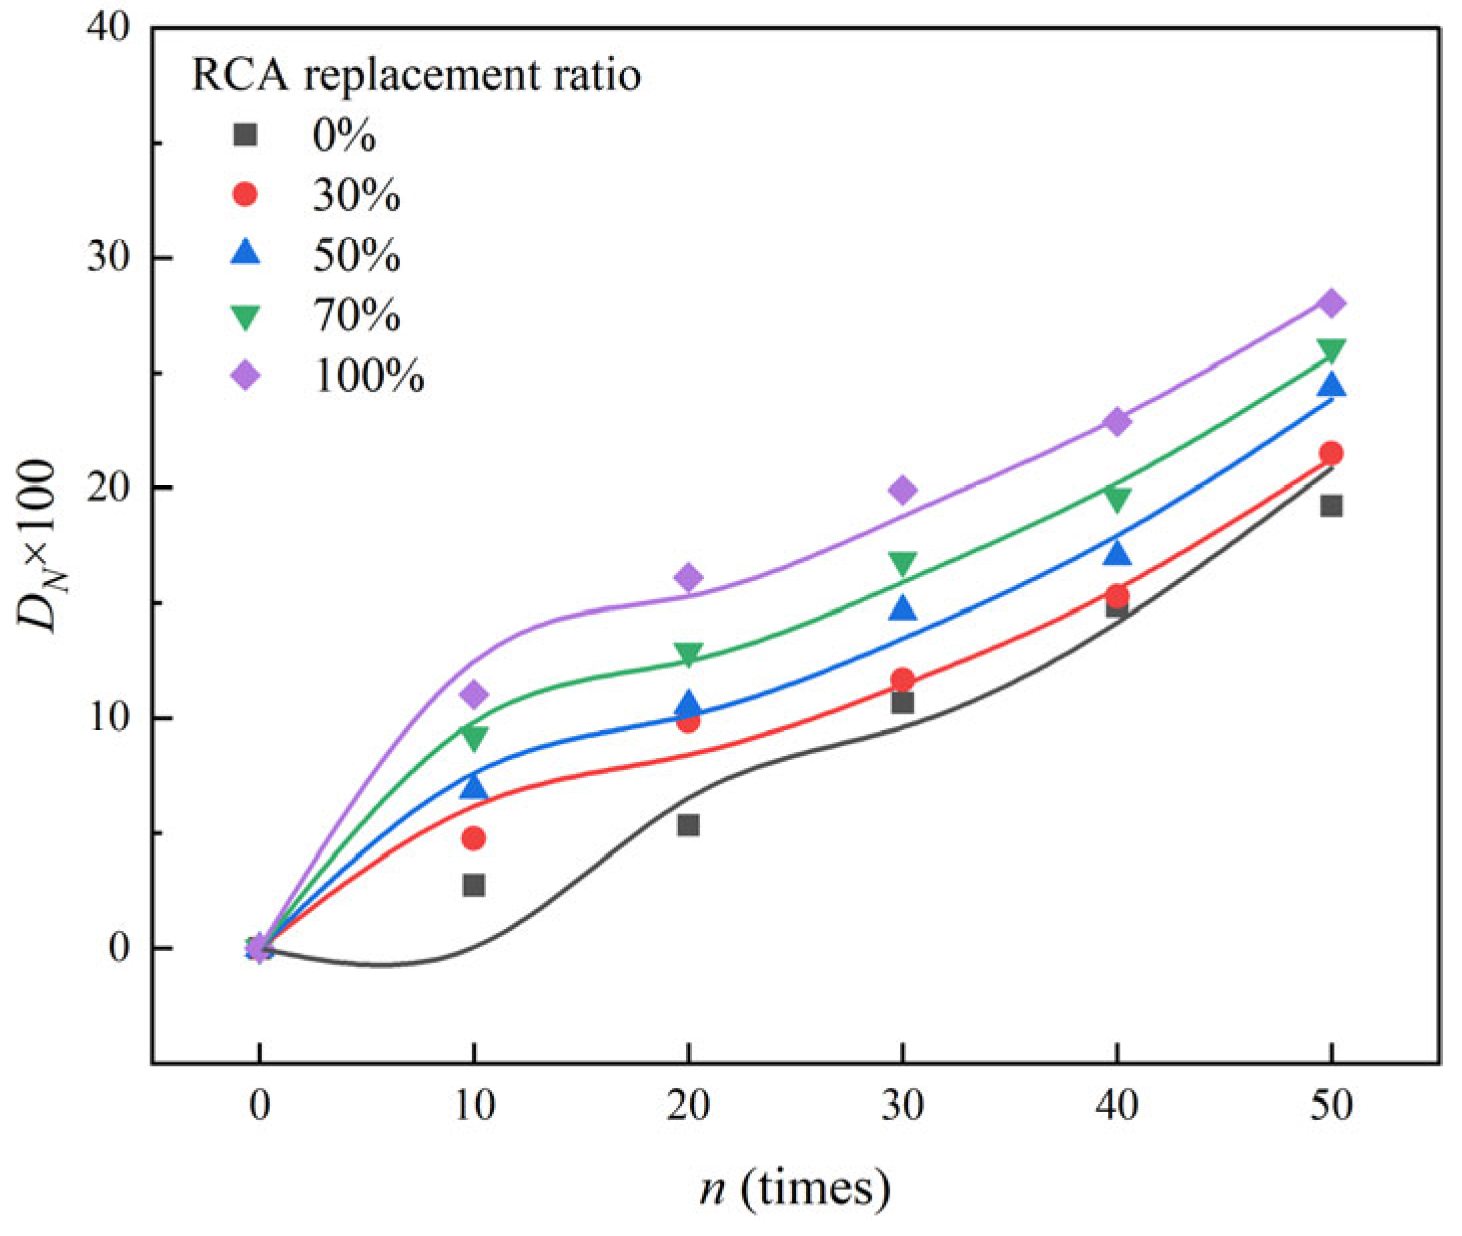
The freeze–thaw damage data of the RAC are shown in Table 6. The freeze–thaw damage data of the RAC were brought into the GM (1, 1), where n (n = 10 k) represents the number of FTCs and X(0) represents the freeze–thaw damage value of the RAC.

3.2.2. Validation and Analysis of GM(1, 1) Model

The accuracy of the GM(1, 1) model was further tested on the calculation results via the posterior difference test method [18]. The specific formula is as follows:
ε ¯ = 1 m k = 1 m ε k
where ε ¯ represents the mean of the residuals, εk denotes the residual of the k-th sample, and m indicates the total number of samples.
S 1 2 = 1 m k = 1 m ε k ε ¯ 2
where S12 represents the variance of the residuals, ε ¯ represents the mean of the residuals, εk denotes the residual of the k-th sample, and m indicates the total number of samples.
X ¯ = 1 m k = 1 m X ( 0 ) k
where X ¯ represents the mean of the original sequence, X(0)k denotes the k-th sample in the original sequence, and m indicates the total number of samples.
S 2 2 = 1 m k = 1 m ( X k ( 0 ) X ¯ ) 2
where S22 represents the variance of the original sequence, X ¯ represents the mean of the original sequence, Xk(0) denotes the k-th sample in the original sequence, and m indicates the total number of samples.
c = S 1 S 2
where c denotes the posteriori error ratio, S1 represents the standard deviation of the residuals, and S2 signifies the standard deviation of the original sequence.
p = P ( ( ε k ε ¯ ) < 0.6745 S 2 ) u = ( ε k ε ¯ ) < 0.6745 S 2 P = u m
In the equation, both u and P denote probability values, where p signifies the small error probability, ε ¯ represents the mean of the residuals, εk denotes the residual of the k-th sample, m indicates the total number of samples, and S2 signifies the standard deviation of the original sequence.
The accuracy test results and accuracy level comparison tables for the G(1, 1) model are shown in Table 7 and Table 8, respectively. Both the posteriori error ratio (c) and the small error probability (p) attained Grade I, indicating that the GM(1, 1) model exhibits high accuracy and provides reliable predictions for the freeze–thaw damage of RAC.
The damage data of the RAC before 50 FTCs were brought into the GM(1, 1) model for fitting, and the fitting results are shown in Table 9. When R2 > 0.92, the fitting accuracy of the GM(1, 1) model is high.
The freeze–thaw damage value DN of the RAC is shown in Figure 10. According to GB/T 50082-2009 [37], DN = 40% is the critical value for the freeze–thaw damage of a test sample. After 50 RAC FTCs, the DN ranged from 20.84% to 28.26%. Through the R2 and posterior difference tests, the G(1, 1) prediction model had higher accuracy and could better predict the RAC frost resistance.

3.3. Freeze–Thaw Damage Mechanism

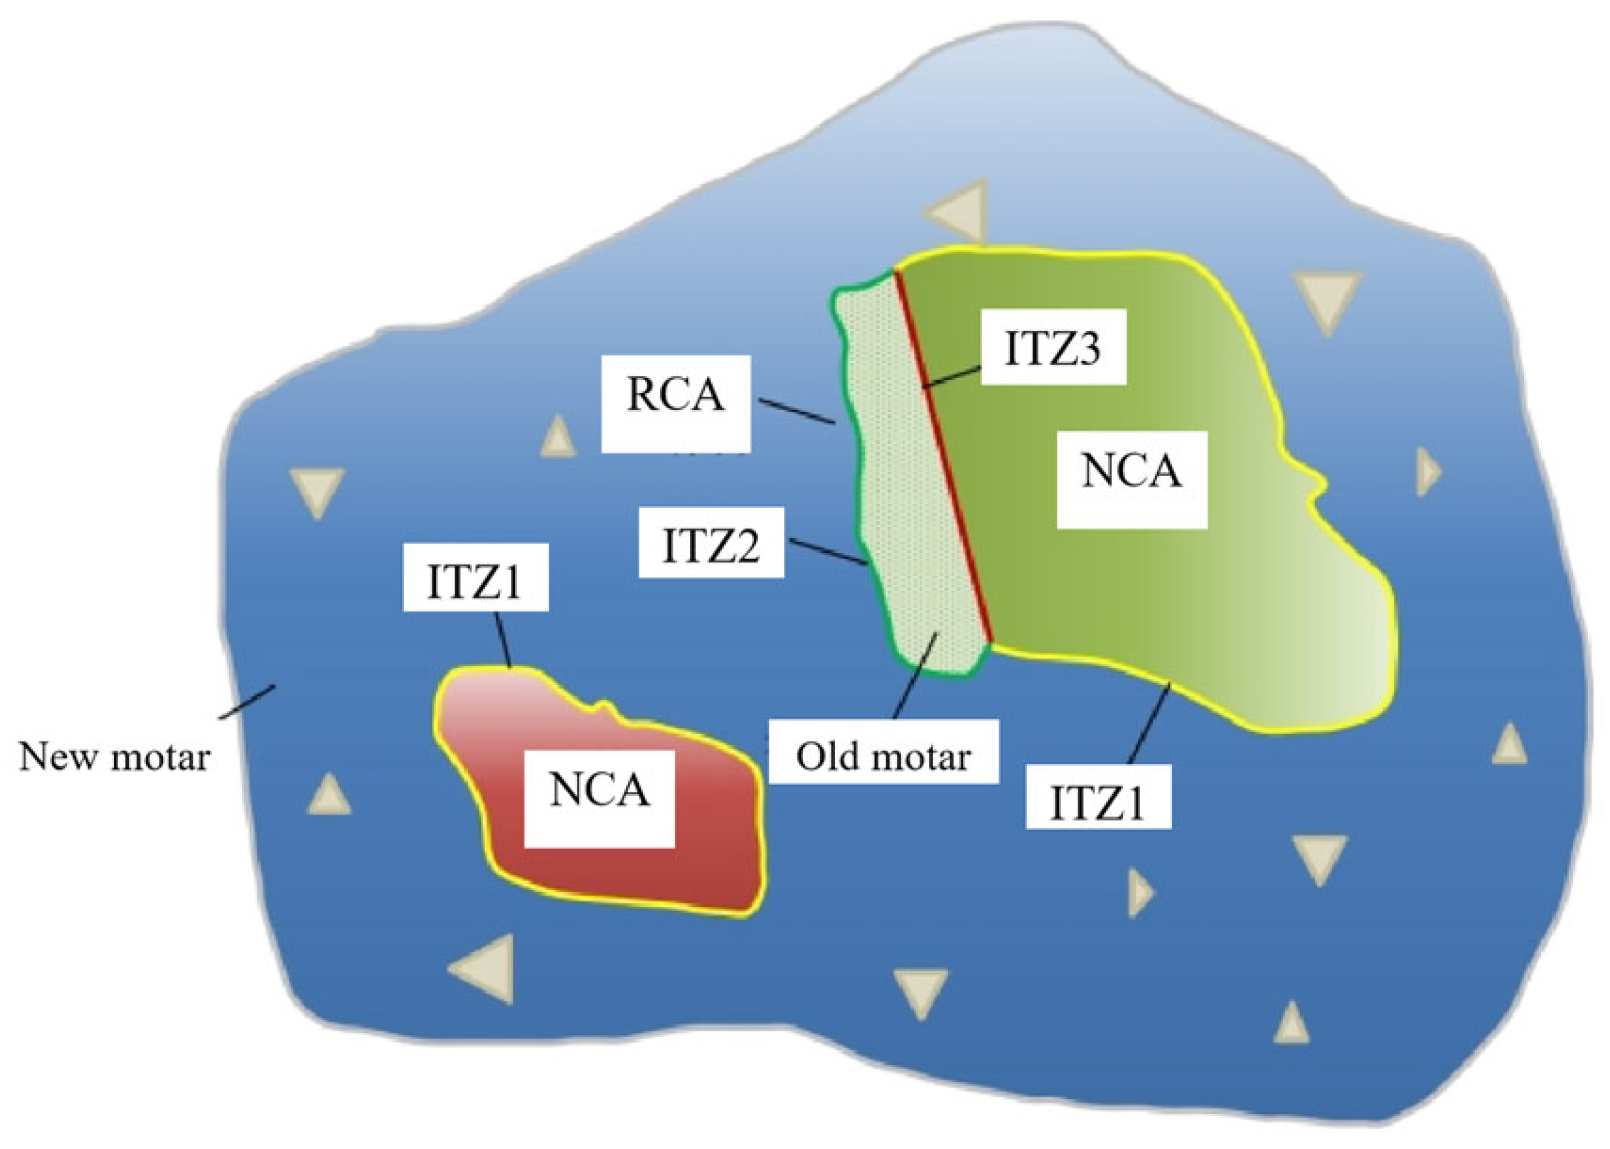
To thoroughly elucidate the freeze–thaw damage mechanism of RAC in depth, a systematic analysis of the ITZ structures of NCA and RCA is necessary. A schematic diagram comparing the ITZ structures of NCA and RCA is presented in Figure 11. It can be observed that the ITZ structure of RCA is relatively simple, consisting only of the transition zone formed between the NCA and the new mortar (ITZ1). In contrast, the ITZ structure of RAC is more complex. In addition to ITZ1, it includes the transition zone between the new mortar and the old adhered mortar (ITZ2), as well as the transition zone between the original aggregate (within the RCA) and the old adhered mortar (ITZ3). This multi-layered ITZ system in RAC contributes to its higher susceptibility to freeze–thaw damage.
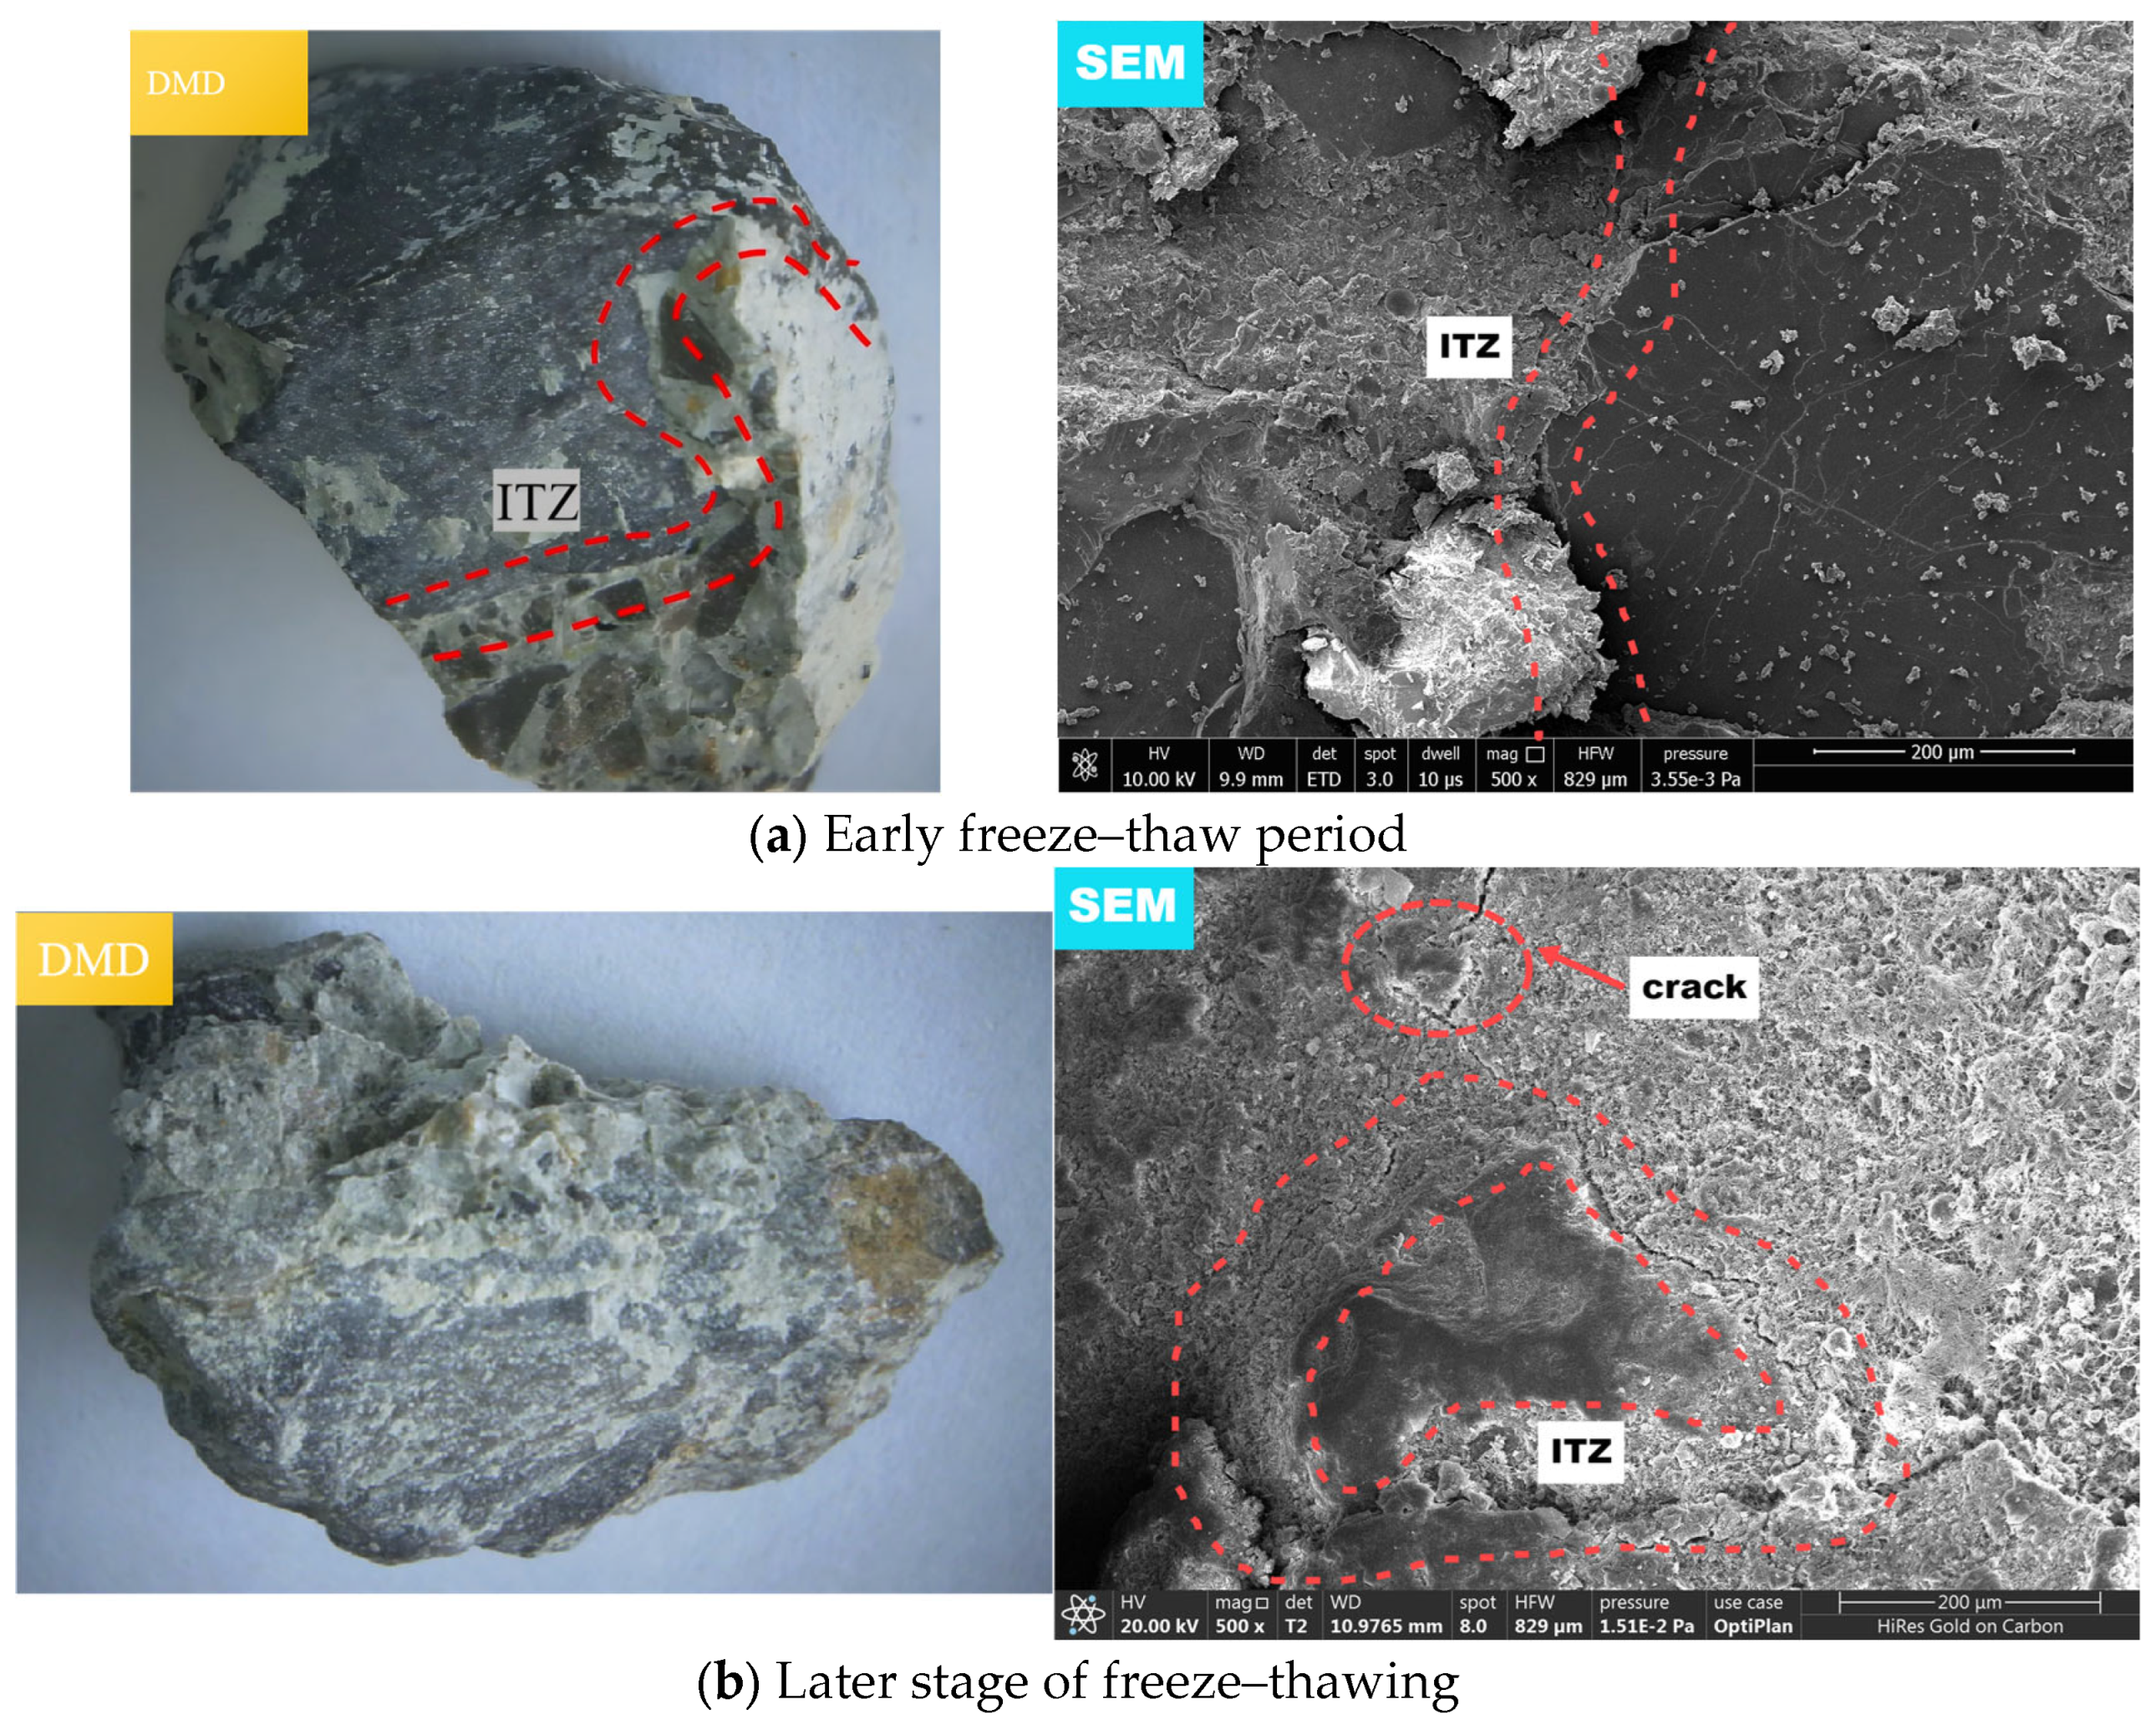
The DMD and SEM images of the NCA before and after freeze–thaw cycling are shown in Figure 12. As shown in Figure 12a, in the early stage of FTCs (after 10 FTCs), the NCA cement stone had no cracks, and the main cracks appeared in the mortar and ITZ [60]. The interior of the NCA is very dense with almost no cracks; therefore, its deformation (contraction and expansion) during the freeze–thaw process is relatively small. When the NCA cement mortar region freezes, the aqueous solution in the gel pores is absorbed by the capillary pores and air bubbles, and the volume decreases; the gel pores absorb the aqueous solution from the outside when melting, and the volume expands. During the freeze–thaw process, the mortar region experienced large deformation, which caused the cracks in the ITZ region to propagate continuously. In addition, owing to the high water–cement ratio in the ITZ region during the condensation and hardening process, the NCA concrete has more pores in the ITZ region, and its strength is lower; thus, the ITZ region of the test piece is the most prone to stress concentration.
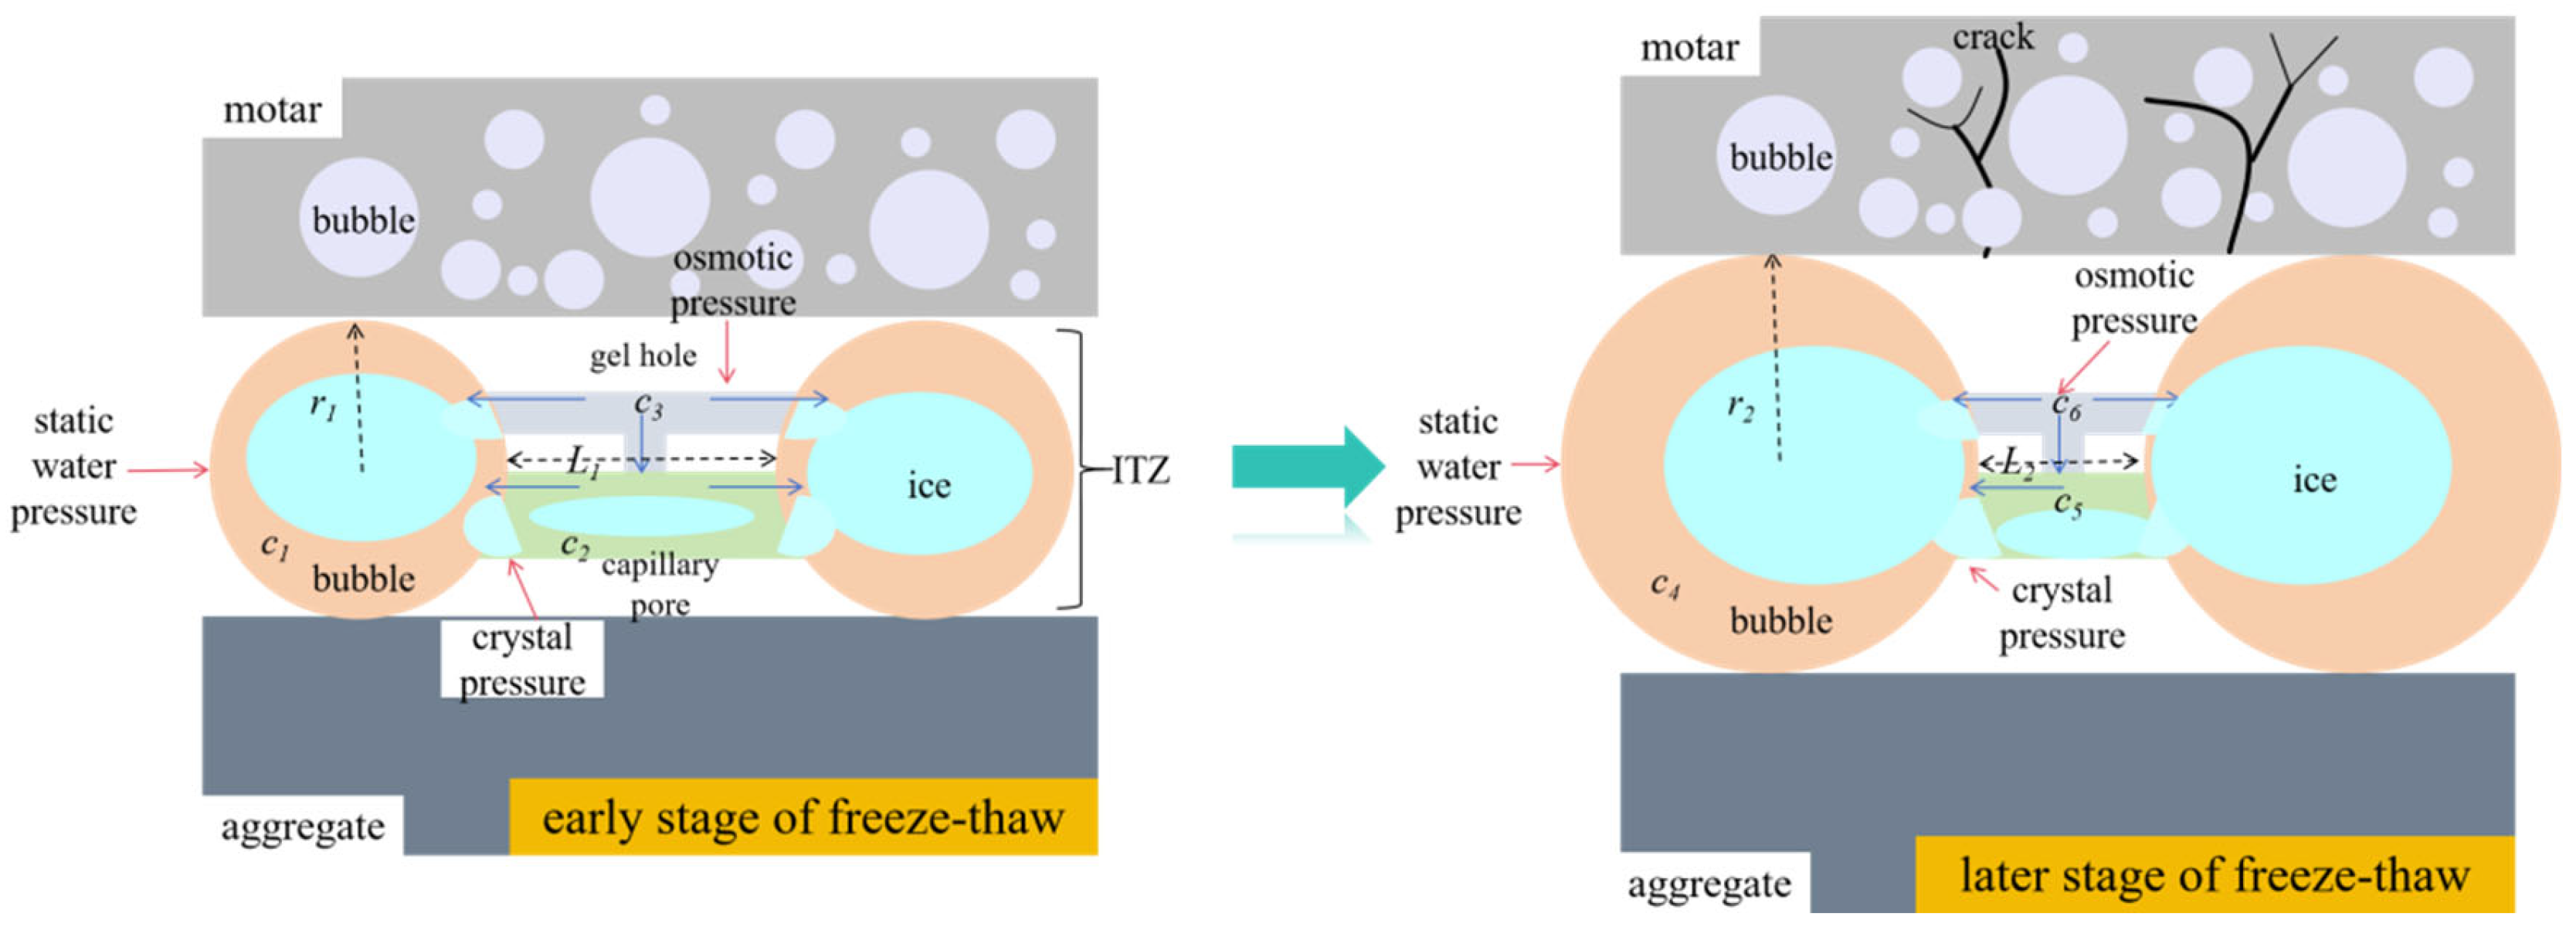
As shown in Figure 12b, at the later stage of the FTC (after 50 FTCs), the ITZ of the NCA cement was severely damaged. As the number of FTCs increases, the cracks in the ITZ continue to develop, the diameter of the bubbles increases, the number of fractures in the ITZ increases, and the pore spacing decreases, as shown in Figure 13. Scherer et al. [61] and Powers et al. [62] reported that the diameter r2 of the bubbles in the ITZ at the later stage of freeze–thawing is greater than the diameter r1 of the early stage of freeze–thawing, and the spacing L2 of the air bubbles in the ITZ is smaller than the number of bubbles L1 at the early stage of freeze–thawing; therefore, in the NCA, the hydrostatic pressure and crystallization pressure in the cement ITZ decrease as the cracks on the pore wall propagate. On the other hand, in the early stage of freeze–thawing, c1 (the concentration of the aqueous solution in the air bubbles in the early stage of freeze–thawing) > c2 (the concentration of the aqueous solution in the capillary pores in the early stage of freeze–thawing) > c3 (the concentration of the aqueous solution in the gel pores in the early stage of freeze–thawing); therefore, in terms of the difference in concentration, the aqueous solution in the gel pores continuously flows to the capillary pores and air bubbles, and during this process, osmotic pressure is generated on the pore walls. During the later stage of freeze–thawing, the diameters of the air bubbles and capillary pores in the ITZ expand, and the volume of the ice crystals increases; as a result, the concentrations of c4 (the concentration of the aqueous solution in the bubbles during the later stage of freeze–thawing) and c5 (the concentration of the aqueous solution in the capillary pores during the later stage of freeze–thawing) increase, c5, c4 and c6 (the concentration of the aqueous solution in the gel pores during the later stage of freeze–thawing) further increase, resulting in an increase in the osmotic pressure in the ITZ region.
During the initial stage of freeze–thawing, the crystallization pressure and hydrostatic pressure inside the bubbles increased. As the number of FTCs increases, the bubbles experience fatigue failure, the pore wall is damaged, the size expands, and the internal pressure (hydrostatic pressure and crystallization pressure) of the bubbles decreases, whereas the pressure (osmotic pressure) on the capillary pores and gel pores increases, which is referred to as the “pressure shift down” phenomenon. As the number of FTCs increases, the pressure of the larger air bubbles shifts to smaller capillary pores and gel pores. Therefore, as the number of FTCs increased, the internal stress of the test sample tended to increase overall. In addition, when the test piece melts, the air bubbles and ice in the capillary pores melt, the aqueous solution flows back into the gel pores, and the tensile stress in the test piece decreases. As the number of FTCs increases, the pores will suffer fatigue breakage. When the pore size reaches a certain stage, the test piece will suffer from global failure.
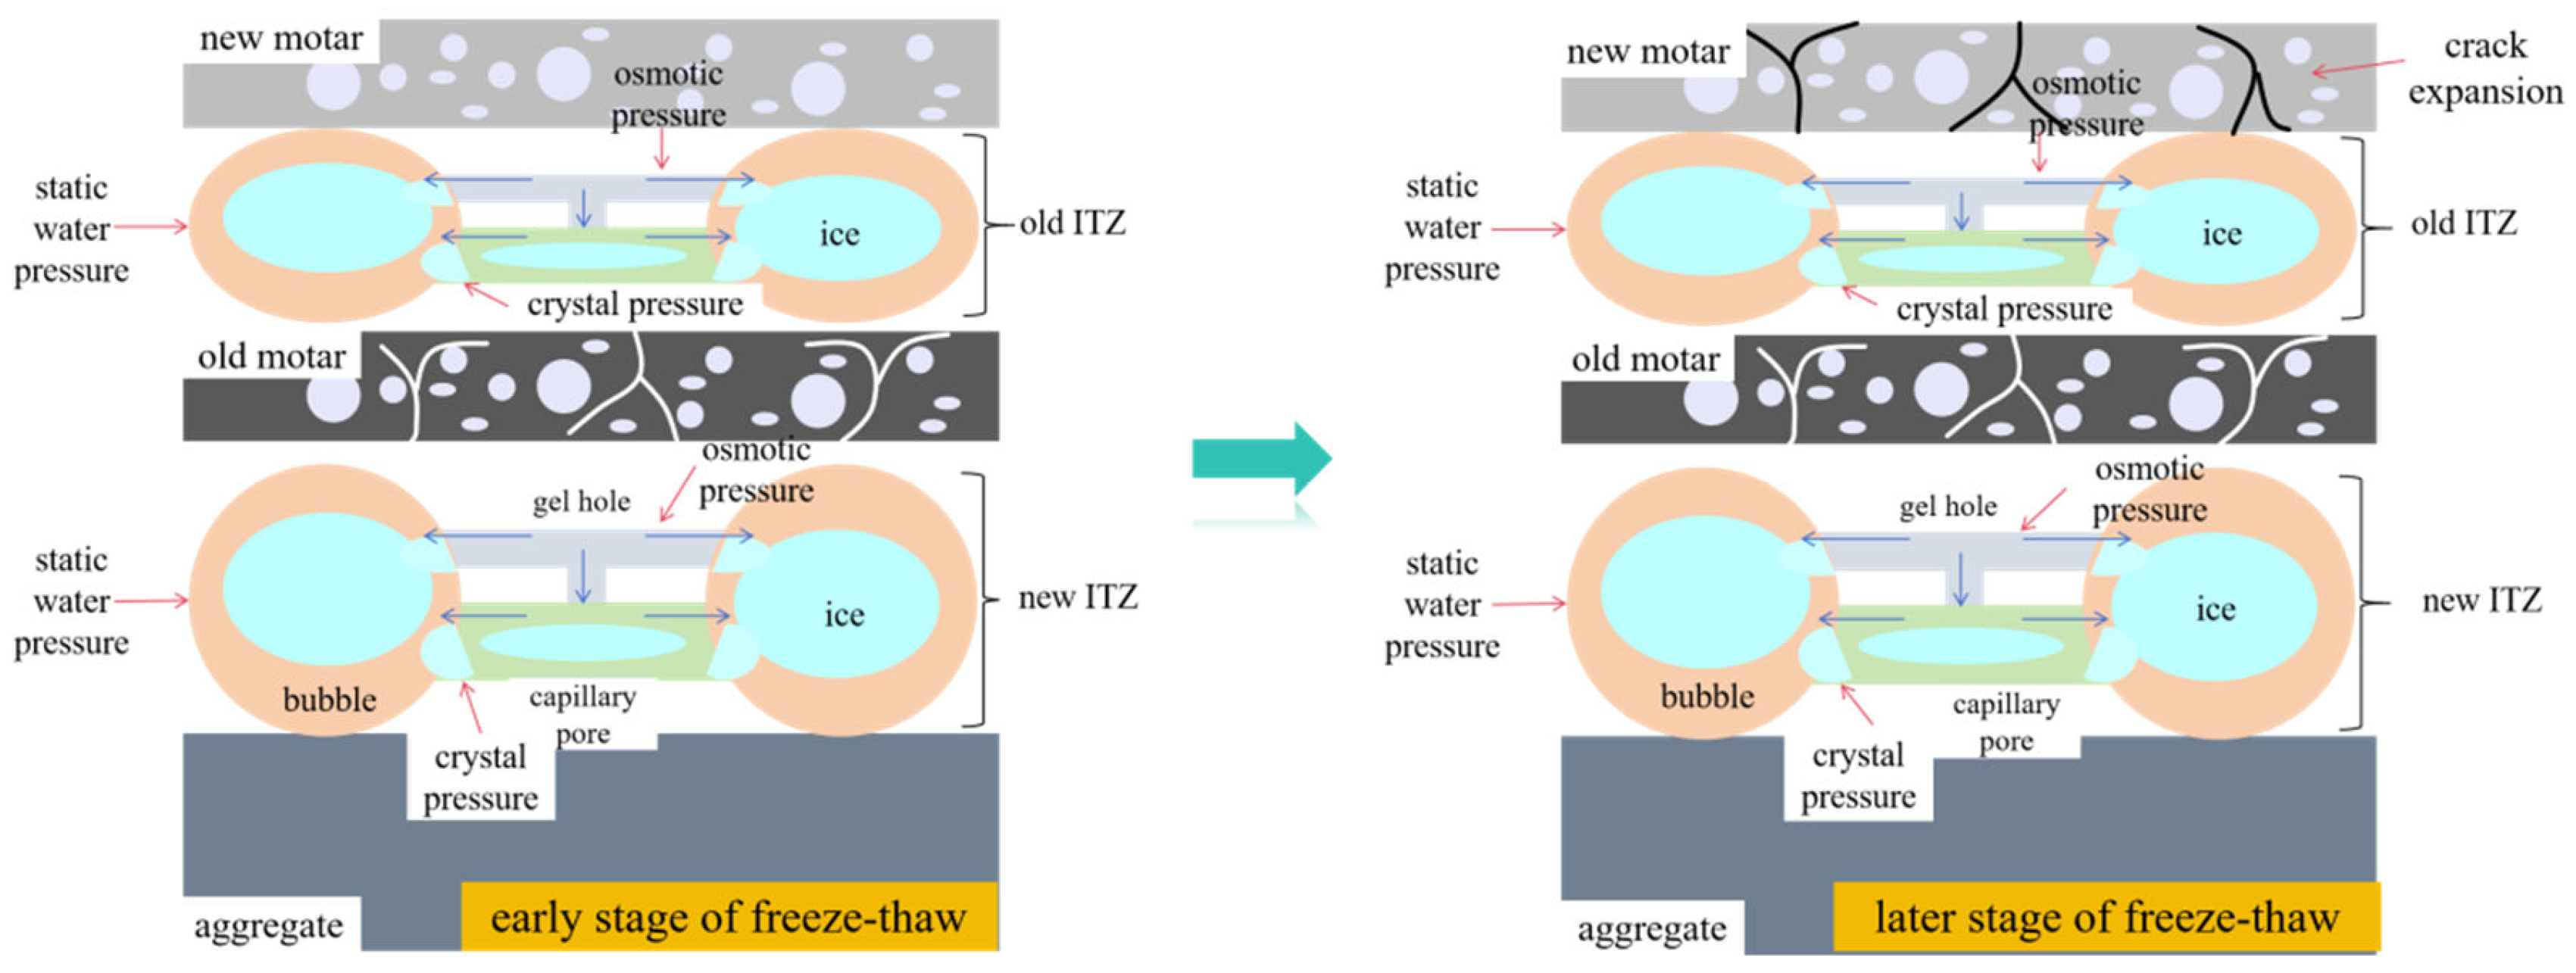
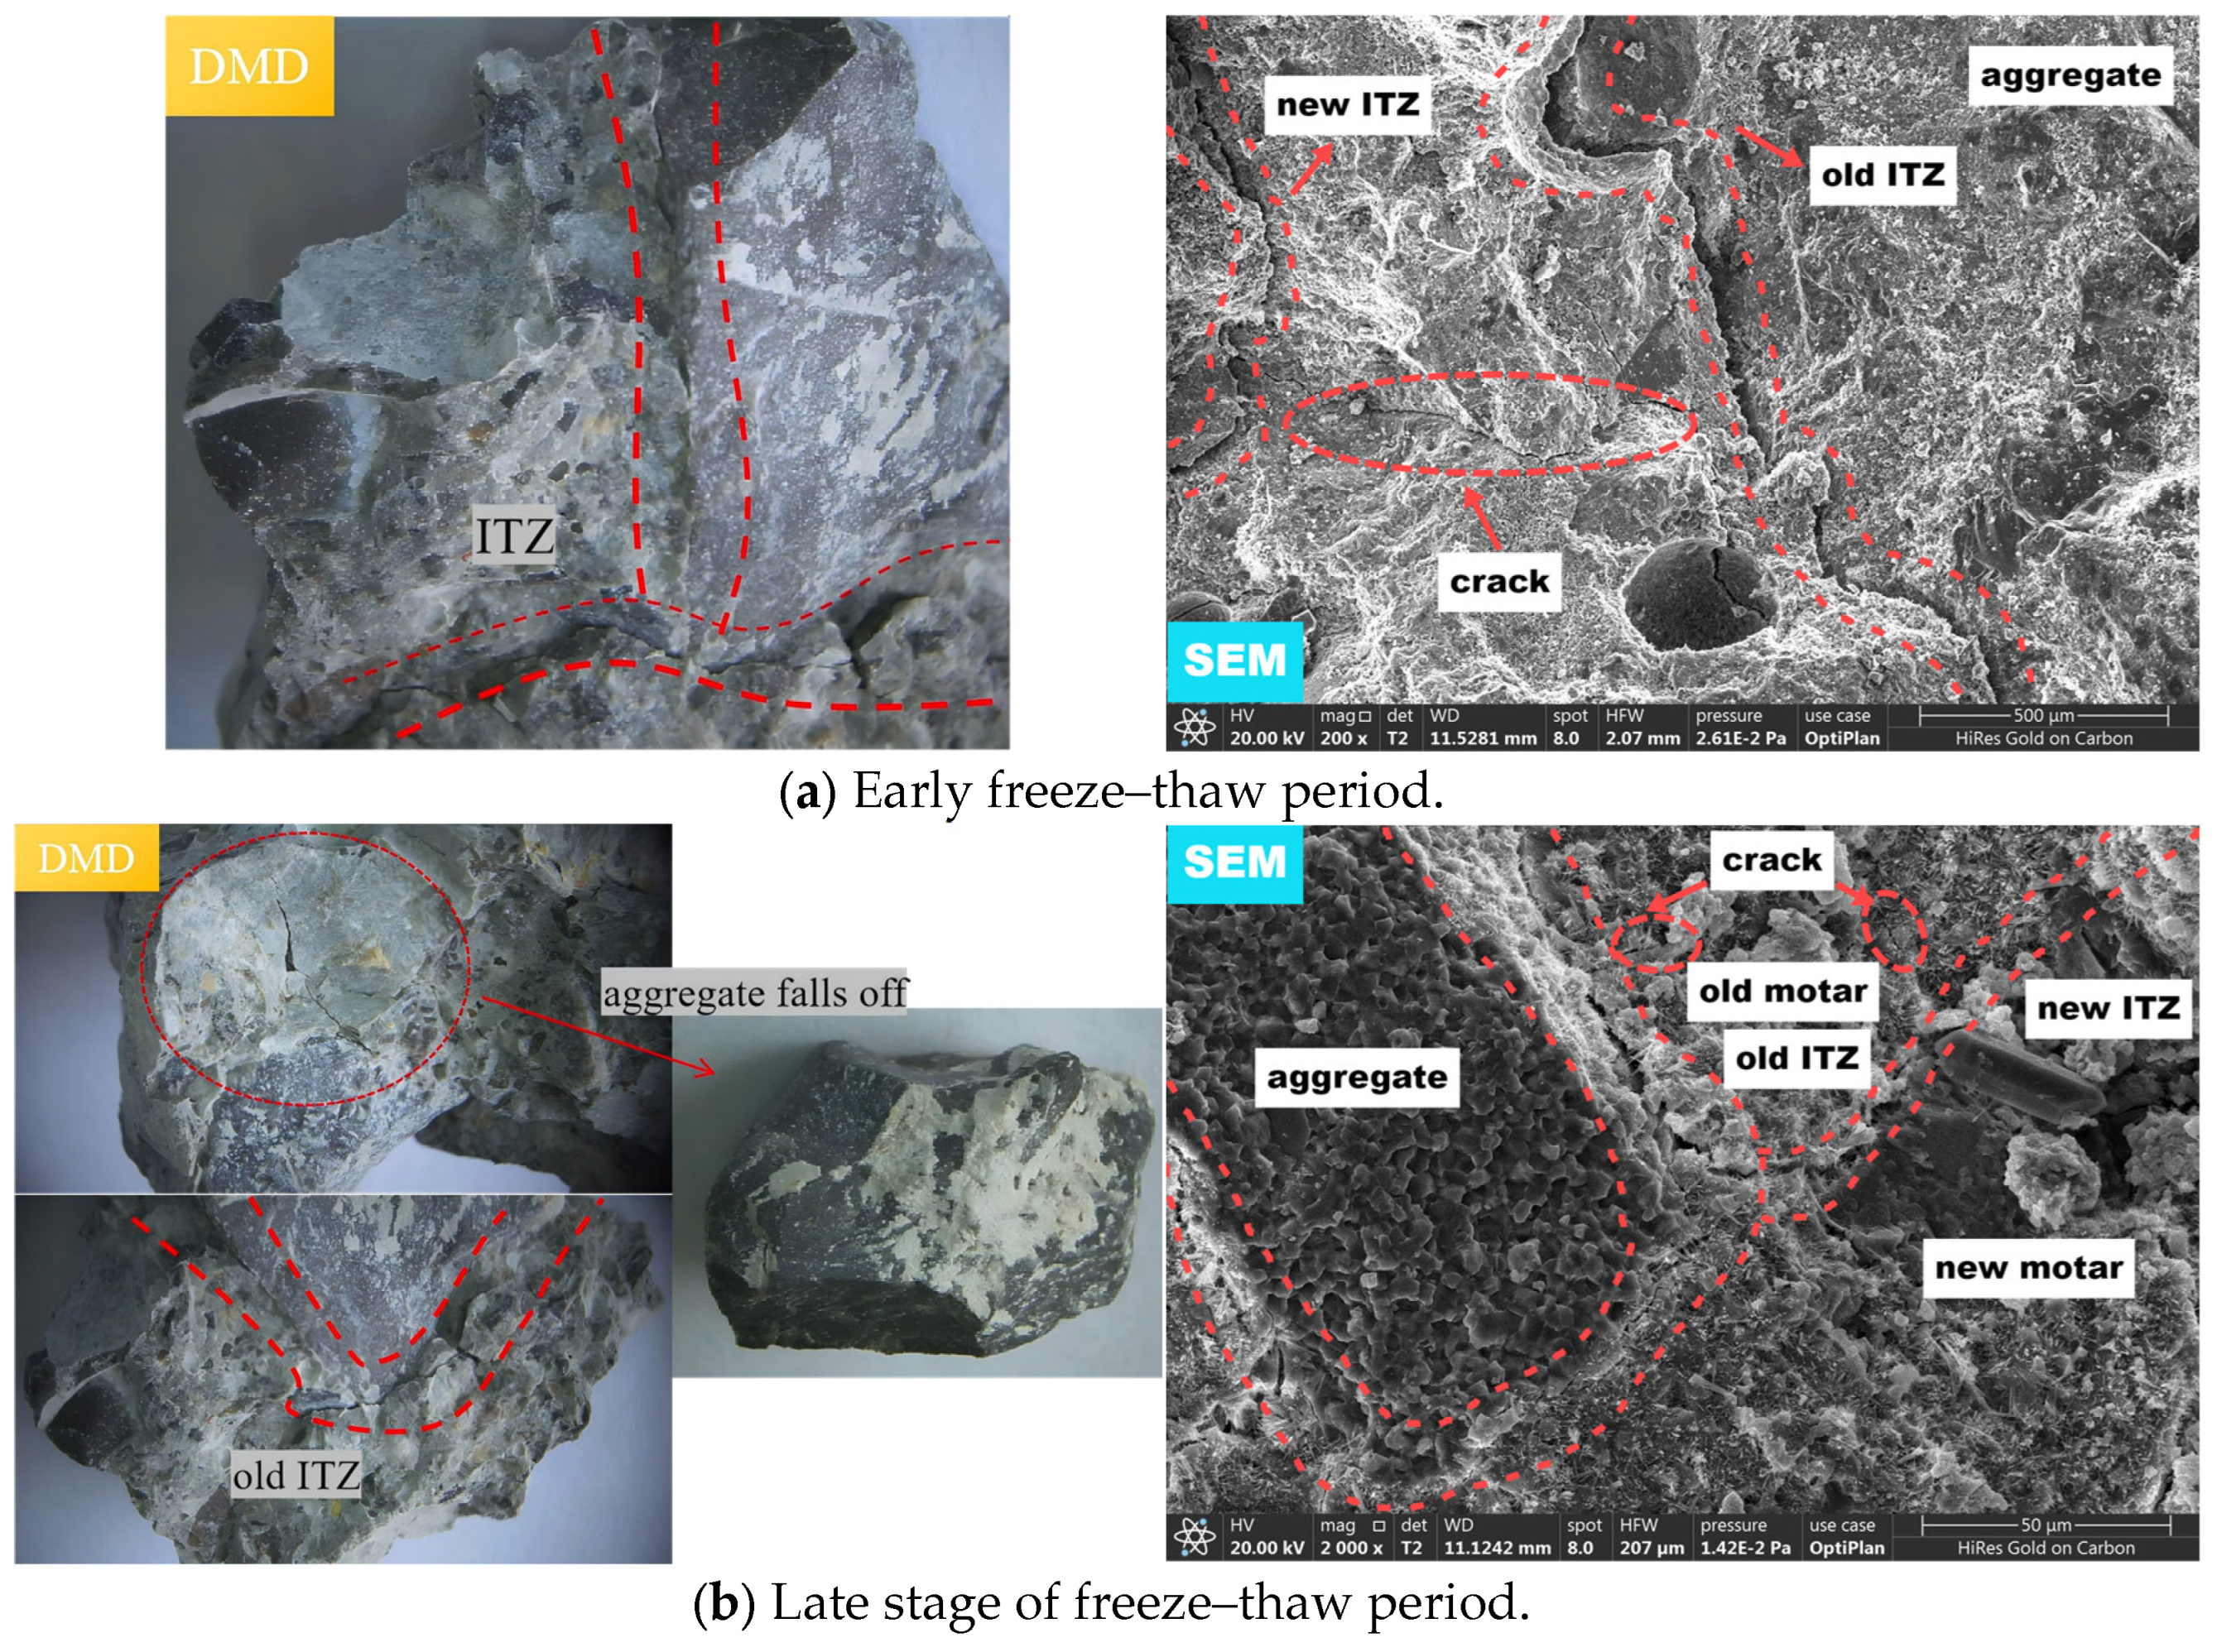
The DMD and SEM images of RCA before and after freeze–thaw cycles are shown in Figure 14. Figure 14a reveals that during the initial freeze–thaw stages, the aggregate particles within the RCA cement paste remain relatively dense and suffer minor damage, whereas the old mortar, along with the old and new ITZs, exhibits a porous and microcracked structure, becoming the primary zones of damage concentration [63,64]. The propagation and interconnection of these microcracks manifest macroscopically as initial surface roughening and localized minor spalling, leading to the observed mass loss in the concrete specimens. Furthermore, the differential thermal expansion coefficients between the aggregate and the mortar result in more initial microcracks within the old ITZ, exacerbating its freeze–thaw damage [65]. Consequently, damage in RAC typically initiates at the internal old mortar interfaces and is more severe than in conventional concrete, macroscopically evidenced by greater mass loss and a more significant reduction in the RDEM for RAC. Figure 14b demonstrates that in the later freeze–thaw stages, the old ITZ experiences the most severe damage, culminating in paste-aggregate separation and ultimately leading to specimen failure. This key microstructural failure directly corresponds to the macroscopic phenomena of extensive mortar and aggregate spalling and a sharp decline in mass.
As freeze–thaw cycling progresses, a “stress shift” phenomenon also occurs within the RCA cement paste. However, due to the pre-existing abundance of microcracks and larger defect zones in RCA, cracks within the ITZ propagate rapidly, as illustrated in Figure 15. This allows water and ice crystallization pressures to penetrate deeper into the material. Macroscopically, this is reflected by damage progression not being limited to the surface but extending inwards, leading to a continuous decline in the RDEM with increasing FTCs. Moreover, under the same number of cycles, RCA cement paste suffers greater damage than NCA cement paste [66], specifically manifested as a much larger reduction in the relative dynamic modulus for RAC. This is attributed to the higher number of microcracks in RCA, which severely impair the material’s ability to transmit elastic waves, indicating a rapid loss of load-bearing stiffness. Additionally, the significant difference in the thermal expansion coefficients between the aggregate and the mortar causes the old and new ITZs to endure the most severe damage, leading to paste-aggregate separation [67]. In summary, the macroscopic spalling, mass loss, and deterioration of the dynamic modulus of elasticity in RAC are the direct external manifestations of the initiation, propagation, and ultimate failure of its internal weak interfaces under freeze–thaw action.
4. Conclusions

  • The degree of freeze–thaw damage in concrete intensifies with increasing RCA replacement ratios and number of FTCs. When the RCA replacement ratio exceeds 50%, specimens exhibit extensive mortar spalling and aggregate exposure after only 50 cycles, indicating a significant acceleration of apparent damage. It is therefore recommended to strictly limit the RCA replacement ratio to below 50% in critical structures located in severe cold regions to ensure adequate frost durability.
  • The minimum mass loss rate of RAC (averaging −0.92%) is considerably lower than that of conventional concrete (−0.08%), attributable to a more pronounced initial “weight gain” effect due to the continued hydration of the adhered old mortar. The mass loss rate of RAC demonstrates an initial decrease followed by an increase with progressing FTCs, with this transition typically occurring around 20 cycles. This threshold can serve as a criterion for assessing the stage of freeze–thaw damage development in RAC.
  • A GM(1, 1) prediction model for freeze–thaw damage was established based on the RDEM of RAC. Evaluation via the R2 value and the posteriori error test method confirmed that the GM(1, 1) model achieves a high precision level (Grade I), providing a highly reliable theoretical basis for predicting the freeze–thaw service life of RAC.
  • This study elucidates the origin and evolution of freeze–thaw damage in RAC from a microstructural perspective, offering a mechanistic explanation for its performance degradation. Microstructural testing unequivocally confirmed that the old ITZ between the adhered old mortar and the original aggregate within the RCA is the primary site and the weakest link for damage initiation. The propagation of microcracks from this zone is identified as the fundamental cause of the observed macroscopic performance deterioration.

Author Contributions

M.L.: Writing—original draft, data curation, and investigation. H.L. and S.G.: Methodology and writing—review and editing. C.X.: Data curation, writing—review and editing. B.L.: Data curation and funding acquisition. X.M.: Writing—review and editing. S.X.: Writing—review and editing, and funding acquisition. T.S.: Writing—review and editing, Writing—original draft, supervision, investigation, and funding acquisition. All authors have read and agreed to the published version of the manuscript.

Funding

This work was supported by the National Natural Science Foundation of China (52309137 (Bangxiang Li)), the Natural Science Foundation of Shandong Province (ZR2025MS802 (Tian Su); ZR2024QE218 (Bangxiang Li)), and the Natural Science Foundation of Inner Mongolia Autonomous Region (2025MS05007 (Xuefeng Mei); 2025FX037 (Sheng Xu)).

Institutional Review Board Statement

Not applicable.

Informed Consent Statement

Not applicable.

Data Availability Statement

The data presented in this study are available on request from the corresponding author.

Conflicts of Interest

The authors declare that they have no known competing financial interests or personal relationships that could have appeared to influence the work reported in this paper.

References

  1. Bai, G.; Zhu, C.; Liu, C.; Liu, B. An evaluation of the recycled aggregate characteristics and the recycled aggregate concrete mechanical properties. Constr. Build. Mater. 2020, 240, 117978. [Google Scholar] [CrossRef]
  2. Wang, B.; Yan, L.; Fu, Q.; Kasal, B. A comprehensive review on recycled aggregate and recycled aggregate concrete. Resour. Conserv. Recycl. 2021, 171, 105565. [Google Scholar] [CrossRef]
  3. Zhang, L.; Ding, D.; Zhao, J.; Zhou, G.; Wang, Z. Mixture Design and Mechanical Properties of Recycled Mortar and Fully Recycled Aggregate Concrete Incorporated with Fly Ash. Materials 2022, 15, 8143. [Google Scholar] [CrossRef] [PubMed]
  4. Yuan, H.; Zhu, L.; Wang, X.; Yang, H. Effect of microstructure on the mechanical properties of steel fiber-reinforced recycled concretes. Materials 2022, 15, 4018. [Google Scholar] [CrossRef]
  5. Yan, H.; Liu, Q.; Han, F.; Liu, S.; Han, T.; He, B. Frost Durability of Self-Compacting Concrete Prepared with Aeolian Sand and Recycled Coarse Aggregate. Materials 2023, 16, 6393. [Google Scholar] [CrossRef]
  6. Zhu, P.; Chen, X.; Liu, H.; Wang, Z.; Chen, C.; Li, H. Recycling of waste recycled aggregate concrete in freeze-thaw environment and emergy analysis of concrete recycling system. J. Build. Eng. 2024, 96, 110377. [Google Scholar] [CrossRef]
  7. Zhang, M. Research on Mechanics and Durability Performance of Recycled Concrete; Hefei University: Hefei, China, 2024. (In Chinese) [Google Scholar]
  8. Song, Y.; Zhou, W.; Zhang, C.; Yang, C. Frost Resistance and Microscopic Properties of Recycled Coarse Aggregate Concrete Containing Chemical Admixtures. Materials 2024, 17, 4687. [Google Scholar] [CrossRef]
  9. Omidinasab, F.; Moazami Goodarzi, S.; Sahraei Moghadam, A. Characterization and optimization of mechanical and impact properties of steel fiber reinforced recycled concrete. Int. J. Civ. Eng. 2022, 20, 41–55. [Google Scholar] [CrossRef]
  10. Ahmed, T.W.; Ali, A.A.M.; Zidan, R.S. Properties of high strength polypropylene fiber concrete containing recycled aggregate. Constr. Build. Mater. 2020, 241, 118010. [Google Scholar] [CrossRef]
  11. Xue, G. Investigation on Influence of Strengthening of Coarse Aggregate on Performance of Recycled Concrete; Xi’an University of Science and Technology: Xian, China, 2022. (In Chinese) [Google Scholar]
  12. Su, T.; Wang, T.; Zhang, Z.; Sun, X.; Gong, S.; Mei, X.; Tan, Z.; Cui, S. Mechanical properties and frost resistance of recycled brick aggregate concrete modified by nano-SiO2. Nanotechnol. Rev. 2023, 12, 20230576. [Google Scholar] [CrossRef]
  13. Ji, Y.; Zhang, H. Frost resistance investigation of fiber reinforced recycled brick aggregate cementitious materials. Sci. Rep. 2022, 12, 15311. [Google Scholar] [CrossRef]
  14. Fu, K.; Sang, Y.; Chen, C.; Liu, K. Frost resistance of recycled aggregate concrete subjected to coupling sustained compressive load and freeze–thaw cycles. Constr. Build. Mater. 2024, 448, 138219. [Google Scholar] [CrossRef]
  15. Yu, Z.; Zhang, H.; Bao, J.; Zhang, P.; Ding, Y.; Chen, X.; Qin, L.; Sun, J.; Song, Q. Coupled effects of the freeze–thaw cycles and salt erosion on the performance of recycled aggregate concrete. J. Build. Eng. 2024, 95, 110212. [Google Scholar] [CrossRef]
  16. Xiao, Q.; Wu, Z.; Qiu, J.; Dong, Z.; Shi, S. Capillary water absorption performance and damage constitutive model of recycled concrete under freeze–thaw action. Constr. Build. Mater. 2022, 353, 129120. [Google Scholar] [CrossRef]
  17. Niu, H.; Fan, Y.; Zhang, X.; Ying, X. Experimental study on frost resistance of recycled concrete with different replacement ratios. J. Mater. Sci. Eng. 2018, 36, 615–620. (In Chinese) [Google Scholar]
  18. Deng, J. Grey System Theory Tutorial; Huazhong University of Science and Technology Press: Wuhan, China, 1990. (In Chinese) [Google Scholar]
  19. Liu, S. Grey System Theory and Its Applications; Science Press: Beijing, China, 2017. (In Chinese) [Google Scholar]
  20. Liu, Q.; Shen, X.; Wei, L.; Dong, R.; Xue, H. Gray model research based on the pore structure fractal and strength of NMR Aeolian sand lightweight aggregate concrete. JOM 2019, 72, 536–543. [Google Scholar] [CrossRef]
  21. Feng, Z.; Chen, S.; Xu, H.; Yao, X. Durability evaluation of concrete in alpine salt marsh area based on gray system theory. J. Traffic Transp. Eng. 2018, 18, 18–26. [Google Scholar]
  22. Gao, C.; Kong, Z.; Shen, X. Freeze-thaw Resistance Evaluation of Lightweight Aggregate Concrete with Stress Damage Based on GM(1,1). Adv. Eng. Sci. 2021, 53, 184–190. (In Chinese) [Google Scholar]
  23. Powers, T.C. A working hypothesis for further studies of frost resistance of concrete. J. Proc. 1945, 41, 245–272. [Google Scholar]
  24. Powers, T.C.; Helmuth, R.A. Theory of volume changes in hardened portland-cement paste during freezing. Highw. Res. Board Proc. 1953, 32, 285–297. [Google Scholar]
  25. Zhang, S.; Tian, B.; Chen, B.; Lu, X.; Xiong, B.; Shuang, N. The influence of freeze–thaw cycles and corrosion on reinforced concrete and the relationship between the evolutions of the microstructure and mechanical properties. Materials 2022, 15, 6215. [Google Scholar] [CrossRef] [PubMed]
  26. Zhou, J.; Wang, G.; Xu, J. Experimental evaluation of the concrete damage and pore characteristics under salt-freezing cycles. Materials 2022, 15, 4454. [Google Scholar] [CrossRef] [PubMed]
  27. Kong, L.; Meng, Y.; Gu, Y.; Wang, W. Study on freeze-thaw resistance of granite waste recycled concrete pavement bricks. Bull. Chin. Ceram. Soc. 2021, 40, 1545–1553+1563. (In Chinese) [Google Scholar]
  28. Qiu, J.; Li, L.; Li, L.; Luan, X.; Guan, X.; Niu, G. Study on the deterioration characteristics and mechanisms of recycled brick-concrete aggregate concrete under load-freeze–thaw coupling. Constr. Build. Mater. 2024, 413, 134817. [Google Scholar] [CrossRef]
  29. Bai, W.; Wang, X.; Yuan, C.; Guan, J.; Cao, K.; Xie, C. Study on dynamic mechanical properties and meso-damage mechanism of carbon fibers recycled aggregate concrete under freeze–thaw environment. J. Build. Eng. 2023, 79, 107768. [Google Scholar] [CrossRef]
  30. GB/T 39698-2020; Confirmation Methods for Delivering Common Portland Cement. State Market Regulatory Administration: Beijing, China, 2020. (In Chinese)
  31. JGJ 52-2006; Standard for Technical Requirements and Test Method of Sand and Crushed Stone for Ordinary Concrete. China Academy of Building Research: Beijing, China, 2006. (In Chinese)
  32. Gong, S.; Wang, T.; Hasan, M.M.; Mei, X.; Tan, Z.; Su, T.; Cao, F. Effect of polypropylene fiber and nano-silica on the compressive strength and frost resistance of recycled brick aggregate concrete. Nanotechnol. Rev. 2023, 12, 20230174. [Google Scholar] [CrossRef]
  33. Tan, G.; Gong, S.; Wang, T.; Li, M.; Li, J.; Ren, X.; Zhang, W.; Wang, C.; Cao, F.; Su, T. Mechanical Damage and Freeze–Thaw Damage of Concrete with Recycled Brick Coarse Aggregate. Sustainability 2024, 16, 5643. [Google Scholar] [CrossRef]
  34. JGJ 55-2019; Specification for Mix Proportion Design of Ordinary Concrete. Ministry of Housing and Urban-Rural Development of the People’s Republic of China: Beijing, China, 2019. (In Chinese)
  35. Yu, Z.; Hou, Y.; Zhu, J.; Tian, Y. Frost resistance and service life prediction of recycled aggregate concrete (RAC) under flexural fatigue damage. Constr. Build. Mater. 2025, 458, 139787. [Google Scholar] [CrossRef]
  36. Wang, C.; Zhang, M.; Pei, W.; Lai, Y.; Zhang, R.; Sun, J.; Zhao, T. Deterioration process and damage constitutive model of concrete under freeze-thaw circumstance of severely cold regions. Cold Reg. Sci. Technol. 2024, 226, 104290. [Google Scholar] [CrossRef]
  37. GB/T 50082-2009; Standard for Test Methods of Long-Term Performance and Durability of Ordinary Concrete. China Architecture & Building Press: Beijing, China, 2009. (In Chinese)
  38. Hu, A.; Chen, X.; Du, X.; Wang, F. Dynamic Compressive Damage Constitutive Correction of Concrete Under Freeze-Thaw Cycle. Materials 2025, 18, 1238. [Google Scholar] [CrossRef]
  39. Chen, M.; Yang, S.; Wang, S.; Zhou, Y. Experimental study on pore structure and dynamic mechanical properties of modified rubber concrete after freeze-thaw cycle. Sci. Rep. 2025, 15, 5384. [Google Scholar] [CrossRef] [PubMed]
  40. Qian, J.; Zhou, L.; Wang, X.; Yang, J. Degradation of Mechanical Properties of Graphene Oxide Concrete under Sulfate Attack and Freeze–Thaw Cycle Environment. Materials 2023, 16, 6949. [Google Scholar] [CrossRef] [PubMed]
  41. Guo, L. Application of Nano-Silica in Polypropylene Fiber Reinforced Concrete; Heilongjiang University: Haerbin, China, 2021. (In Chinese) [Google Scholar]
  42. Wei, P. Experimental Study on Properties of Basalt Fiber and Nano-SiO2 Mixed Concrete; Xi’an University of Technology: Xian, China, 2022. (In Chinese) [Google Scholar]
  43. Wei, S. Research on Influence of Mineral Admixture on Chloride Corrosion Resistance and Frost Resistance of Recycled Concrete; China University of Mining and Technology: Xuzhou, China, 2020. (In Chinese) [Google Scholar]
  44. Luan, H.; Wu, J.; Pan, J. Freeze-thaw durability of recycled aggregate concrete: An overview. J. Wuhan Univ. Technol. (Mater. Sci. Ed.) 2021, 36, 58–69. [Google Scholar] [CrossRef]
  45. Gong, J.; Zhang, W. The effects of pozzolanic powder on foam concrete pore structure and frost resistance. Constr. Build. Mater. 2019, 208, 135–143. [Google Scholar] [CrossRef]
  46. Lin, H.; Takasu, K.; Suyama, H.; Koyamada, H.; Liu, S. A study on properties, static and dynamic elastic modulus of recycled concrete under the influence of modified fly ash. Constr. Build. Mater. 2022, 347, 128585. [Google Scholar] [CrossRef]
  47. Fu, H.; Tian, J.; Chin, C.L.; Liu, H.; Yuan, J.; Tang, S.; Mai, R.; Wu, X. Axial compression behavior of GFRP-steel composite tube confinedseawater sea-sand concrete intermediate long columns. Eng. Struct. 2025, 333, 120157. [Google Scholar] [CrossRef]
  48. He, Z.; Shen, A.; Wu, H.; Wang, W.; Wang, L.; Guo, Y. Properties and mechanisms of brick-concrete recycled aggregate strengthened by compound modification treatment. Constr. Build. Mater. 2022, 315, 125678. [Google Scholar] [CrossRef]
  49. Zhu, C.; Zhao, W.; Yu, W. Basic Mechanical Properties and Constitutive Model of Recycled Brick-Concrete Aggregate Concrete. Acta Mater. Compos. Sin. 2024, 41, 898–910. (In Chinese) [Google Scholar]
  50. Tam, V.W.Y.; Le, K.N.; Evangelista, A.C.J.; Butera, A.; Tran, C.N.; Teara, A. Effect of fly ash and slag on concrete: Properties and emission analyses. J. Hazard. Mater. 2019, 6, 395–405. [Google Scholar] [CrossRef]
  51. Cheng, Y.; Sun, L.; Li, Y.; Liu, M.; He, R.; Jin, X.; Jin, H. Damage model of steel fiber-reinforced coal gangue concrete under freeze–thaw cycles based on Weibull distribution. Materials 2023, 16, 6775. [Google Scholar] [CrossRef]
  52. Zhao, N.; Meng, J.; Jia, J.; Bai, Y.; Du, X. Freeze-thaw damage and life prediction model of seawater and sea sand concrete (SWSSC). Constr. Build. Mater. 2025, 475, 141157. [Google Scholar] [CrossRef]
  53. Zhang, F.; Li, X.; Wang, L.; Xue, Z.; Guo, Z. Effects of freeze-thaw cycles on fatigue performance of asphalt mixture and a fatigue-freeze-thaw damage evolution model. Constr. Build. Mater. 2024, 449, 138427. [Google Scholar] [CrossRef]
  54. Zhou, D.; Chen, D.; Yang, F.; Mei, J.; Yao, Y.; Deng, Y. Freeze–thaw damage analysis and life prediction of modified pervious concrete based on Weibull distribution. Case Stud. Constr. Mater. 2024, 20, e03305. [Google Scholar] [CrossRef]
  55. Fu, H.; Tian, J.; Chen, S.; Chin, C.L.; Ma, C.K. Axial compressive performance of CFRP-steel composite tubeconfined seawater sea-sand concrete intermediate slender columns. Constr. Build. Mater. 2024, 441, 137399. [Google Scholar] [CrossRef]
  56. Tien, T.L. A research on the gray prediction model GM (1, n). Appl. Math. Comput. 2012, 218, 4903–4916. [Google Scholar]
  57. Yu, J.; Qiao, H.; Zhu, F.; Wang, X.K. Research on damage and deterioration of fiber concrete under acid rain environment based on GM (1, 1)-Markov. Materials 2021, 14, 6326. [Google Scholar] [CrossRef]
  58. Qin, Y.; Guan, K.; Kou, J.; Ma, Y.; Zhou, H.; Zhang, X. Durability evaluation and life prediction of fiber concrete with fly ash based on entropy weight method and gray theory. Constr. Build. Mater. 2022, 327, 126918. [Google Scholar] [CrossRef]
  59. Fu, H.; Zhao, H.; Pan, Z.; Wu, Z.; Chin, C.L.; Ma, C.K. Behaviour of corroded circular steel tube strengthened with externalFRP tube grouting under eccentric loading: Numerical study. Structures 2023, 56, 104810. [Google Scholar] [CrossRef]
  60. Lu, B.; Shi, C.; Cao, Z.; Guo, M.; Zheng, J. Effect of carbonated coarse recycled concrete aggregate on the properties and microstructure of recycled concrete. J. Clean. Prod. 2019, 233, 421–428. [Google Scholar] [CrossRef]
  61. Scherer, G.W. Crystallization in pores. Cem. Concr. Res. 1999, 29, 1347–1358. [Google Scholar] [CrossRef]
  62. Powers, T.C.; Willis, T.F. The air requirement of frost-resistant concrete. Proc. Highway Res. Board. 1949, 6, 184–211. [Google Scholar]
  63. Yang, W.; Huang, Y.; Li, C.; Tang, Z.; Quan, W.; Xiong, X.; Jia, H.; Wu, W. Damage prediction and long-term cost performance analysis of glass fiber recycled concrete under freeze-thaw cycles. Case Stud. Constr. Mater. 2024, 21, e03795. [Google Scholar] [CrossRef]
  64. Guan, T.; Zhang, L.; Zheng, Y.; Guan, J.; Zhang, Y.; Zhang, Y. Frost resistance and damage evolution model of basalt fiber-reinforced recycled concrete based on recycled coarse aggregate strengthening and vibration mixing processes. J. Build. Eng. 2024, 91, 109627. [Google Scholar] [CrossRef]
  65. Li, H.; Liang, K.; Chen, H.; Su, R. The effect of carbonated recycled coarse aggregate on the fracture properties of concrete. Constr. Build. Mater. 2024, 442, 137562. [Google Scholar] [CrossRef]
  66. Abuowda, E.; El-Hassan, H.; El-Maaddawy, T. Synergistic impact of geopolymer binder and recycled coarse aggregates on the performance of concrete masonry units. Cleaner Mater. 2024, 14, 100272. [Google Scholar] [CrossRef]
  67. Zhang, W.; Duan, Z.; Liu, H.; Yao, Y.; Zhang, Z.; Liu, C. Salt freezing-thawing damage evolution model based on the time-dependent hydration reaction incorporating rice husk ash and recycled coarse aggregate. Constr. Build. Mater. 2024, 440, 137179. [Google Scholar] [CrossRef]
Figure 1. Grading curves of NCA and RCA.
Coatings 15 01169 g001
Figure 2. Grading curve of sand.
Coatings 15 01169 g002
Figure 3. Frost resistance test apparatus: (a) Rapid freeze–thaw testing machine; and (b) RDEM instrument.
Coatings 15 01169 g003
Figure 4. Microscopic test set: (a) SEM; and (b) DMD.
Coatings 15 01169 g004
Figure 5. Appearances of the RCA concrete after FTCs: (a) 10 times; (b) 30 times; and (c) 50 times [32]. (Note: The numbers (0, 30, 50, 70, 100) in the figure denote the RCA replacement ratios).
Coatings 15 01169 g005
Figure 6. Mass change of RCA concrete: (a) Mass; (b) Mass loss rate.
Coatings 15 01169 g006
Figure 7. Fitting model of the number of FTCs, RCA replacement ratio and mass loss rate.
Coatings 15 01169 g007
Figure 8. RDEM of the RCA concrete.
Coatings 15 01169 g008
Figure 9. Fitting model of the number of FTCs, RCA replacement ratio, and RDEM.
Coatings 15 01169 g009
Figure 10. Predicted freeze–thaw damage value DN.
Coatings 15 01169 g010
Figure 11. Schematic diagram comparing the ITZ structures of NCA and RCA.
Coatings 15 01169 g011
Figure 12. DMD and SEM images of NCA cement stones. (Note: 3.55E-3 represents 3.55 × 10⁻³, 1.51E-2 represents 1.51 × 10⁻²).
Coatings 15 01169 g012
Figure 13. Diagram of the freeze–thaw mechanism of NCA cement.
Coatings 15 01169 g013
Figure 14. DMD and SEM images of RCA cement stones. (Note: 2.61E-2 represents 2.61 × 10⁻², 1.42E-2 represents 1.42 × 10⁻²).
Coatings 15 01169 g014
Figure 15. Diagram of the freeze–thaw mechanism of the RCA cement stone.
Coatings 15 01169 g015
Table 1. Physical properties of cement.
Initial Setting/minFinal Setting/minCompressive Strength (MPa)Flexural Strength (MPa)Stability
3 d28 d3 d28 d
P.O.42.517924722.247.24.87.9qualified
Table 2. Chemical composition of the cement.
Chemical CompositionCaOSiO2Al2O3Fe2O3MgONa2OK2O
Content61.9121.655.323.222.510.210.16
Table 3. Physical properties of the NCA and RCA samples.
Physical PropertyNCARCA
Water absorption (%)1.13.2
Apparent density (kg/m3)26352541
Crushing index (%)7.516
Flaky and particle content (%)7.78.6
Mud content (%)0.51.5
Maximum particle size (mm)26.526.5
Note: When the mud content was equivalent, the performance of NCA remained superior to that of RCA, suggesting that the influence of aggregate mud content on the experimental results was negligible [32,33].
Table 4. Concrete mix proportions.
TypeNCA (%)RCA (%)Sand (kg/m3)Water (kg/m3)Cement (kg/m3)
NC1000580.66205455.56
R307030580.66205455.56
R505050580.66205455.56
R703070580.66205455.56
R1000100580.66205455.56
Table 5. Fitting parameters between n, r and ΔWni.
ΔWniz0abcdR2
RAC−0.08272−0.08065−0.007630.003311.21316 × 10−40.9253
Table 6. Raw data of DN after FTCs (%).
FTC (Times)X(0) × 100
NCR30R50R70R100
102.764.766.889.2311.02
205.349.8910.5712.9116.09
3010.6711.6614.6716.8219.9
4014.8815.2917.0319.6122.89
5019.2221.5124.426.0828.01
Table 7. Accuracy test results of the GM(1, 1) model.
TypecpAccuracy Class
NC0.162631Grade I
R300.12308
R500.09466
R700.06736
R1000.09152
Table 8. Comparison of accuracy grades.
Accuracy Classcp
Grade I (Good)0–0.350.95–1
Grade II (eligible)0.35–0.50.8–0.95
Grade III (badly qualified)0.5–0.650.7–0.8
Grade IV (Failed)0.65–10–0.7
Table 9. Results of the fitting and prediction of freeze–thaw damage.
nX(0) × 100
NCR30R50R70R100
000000
100.05036.1727.60349.82612.4634
206.53018.409910.120212.498515.2942
309.614711.459213.469915.89818.7679
4014.156415.614117.928520.221923.0307
5020.843321.275623.862825.72228.2616
R20.967970.985060.991250.995560.99168
Disclaimer/Publisher’s Note: The statements, opinions and data contained in all publications are solely those of the individual author(s) and contributor(s) and not of MDPI and/or the editor(s). MDPI and/or the editor(s) disclaim responsibility for any injury to people or property resulting from any ideas, methods, instructions or products referred to in the content.