Article

Enhanced Piezoelectric and Ferroelectric Properties in the Lead-Free [(BiFeO3)m/(SrTiO3)n]p Multilayers by Varying the Thickness Ratio r = n/m and Periodicity p

by
Jonathan Vera Montes
1,
Francisco J. Flores-Ruiz
2,
Carlos A. Hernández-Gutiérrez
3,
Enrique Camps
4,
Enrique Campos-González
4,
Gonzalo Viramontes Gamboa
1,
Fernando Ramírez-Zavaleta
1 and
Dagoberto Cardona Ramírez
1,*
1
Facultad de Ciencias Físico-Matemáticas, Universidad Michoacana de San Nicolás de Hidalgo, Morelia 58060, Mexico
2
CONACYT-Instituto de Física Luis Rivera Terrazas, Benemérita Universidad Autónoma de Puebla, Edificio IF-1, Ciudad Universitaria, Puebla 72570, Mexico
3
Centro de Investigación y de Estudios Avanzados del Instituto Politécnico Nacional, Departamento de Ingeniería Eléctrica, SEES, Av. Instituto Politécnico Nacional 2508, Ciudad de México 07360, Mexico
4
Departamento de Física, Instituto Nacional de Investigaciones Nucleares, P.O. Box 18-1027, Ocoyoacac 11801, Mexico
*
Author to whom correspondence should be addressed.
Coatings 2025, 15(10), 1170; https://doi.org/10.3390/coatings15101170
Submission received: 25 July 2025 / Revised: 3 September 2025 / Accepted: 27 September 2025 / Published: 6 October 2025
(This article belongs to the Special Issue Thin Films and Nanostructures Deposition Techniques)

Abstract

Multilayer heterostructures of [(BiFeO3)m/(SrTiO3)n]p were synthesized on ITO-coated quartz substrates via pulsed laser deposition, with varying thickness ratios (r = n/m) and periodicities (p = 1–3). Structural, electrical, and piezoelectric properties were systematically investigated using X-ray diffraction, AFM, and PFM. The BiFeO3 layers crystallized in a distorted rhombohedral phase (R3c), free of secondary phases. Compared to single-layer BiFeO3 films, the multilayers exhibited markedly lower leakage current densities and enhanced piezoelectric response. Electrical conduction transitioned from space-charge-limited current at low fields (E < 100 kV/cm) to Fowler–Nordheim tunneling at high fields (E > 100 kV/cm). Optimal performance was achieved for r = 0.30, p = 1, with minimal leakage (J = 8.64 A/cm2 at E = 400 kV/cm) and a peak piezoelectric coefficient (d33 = 55.55 pm/V). The lowest coercive field (Ec = 238 kV/cm) occurred in the configuration r = 0.45, p = 3. Saturated hysteresis loops confirmed stable ferroelectric domains. These findings demonstrate that manipulating layer geometry in [(BiFeO3)m/(SrTiO3)n]p stacks significantly enhances functional properties, offering a viable path toward efficient, lead-free piezoelectric nanodevices.

Graphical Abstract

1. Introduction

Multiferroic materials represent a novel category of functional substances that exhibit both ferroelectric and magnetic characteristics simultaneously [1,2,3,4]. Over the past decades, these materials have garnered significant interest because of their distinctive physical traits and promising uses in devices such as capacitors, data storage systems, sensors, spintronic technologies, energy harvesting mechanisms, and more [5]. Among these, bismuth ferrite (BiFeO3), commonly referred to as BFO, stands out due to its distorted rhombohedral crystalline structure, which belongs to the space group R3c [6]. Remarkably, BFO stands out as the sole material known to display multiferroic properties in a single phase at room temperature [7,8], with a magnetic Neel temperature of 643 K and a high ferroelectric transition temperature of 1103 K [8]. Compared to other perovskite-structured materials, BFO exhibits a high spontaneous polarization, theoretically calculated to be 103.3 μC/cm2 using density functional theory (DFT), and demonstrates a strong piezoelectric response of 70 pm/V. These exceptional properties make BFO particularly attractive for energy harvesting applications [9,10]. So, due to these properties, BiFeO3 is one of the most promising materials for the next generation of lead-free harvesters, the next generation of magnetoelectric random-access memories, enabling information to be stored electrically and read magnetically. Other potential applications include the electrical recording of very small magnetic fields, such as those characteristic of brain activity [11], as well as use in microelectronics, micromechanics, and integrated optics [12,13]. However, the application of BiFeO3 (BFO) is hindered by several critical challenges: (i) BFO thin films are prone to developing oxygen vacancies due to the evaporation of Bismuth during the synthesis [14]; (ii) additionally, they often suffer from elevated electrical leakage currents [15,16,17,18,19], mainly caused by the reduction of Fe3+ cations to Fe2+ [14,20]; and (iii) the formation of impurity phases, like Bi2O3 and Bi2Fe4O9, as well as non-intrinsic defects like porosity, further exacerbates the leakage current [14]. These issues complicate accurate polarization loop measurements and pose a risk of short-circuiting in ferroelectric storage devices. As a result, considerable research efforts have been dedicated to minimizing leakage currents in BFO films [16,17,18]. Nevertheless, the persistent problems of high leakage currents and large coercive electric fields continue to restrict the industrial application of BFO thin films.
To overcome these obstacles, several strategies have been explored to reduce leakage currents and for better understanding of their underlying mechanisms [15,21,22,23]: (i) the addition of excess elemental Bi during solution preparation helps compensate for the stoichiometric imbalance caused by Bi volatilization, thereby minimizing the formation of impurity phases and oxygen vacancies [24], and (ii) heterovalent and homovalent substitutions at the A- and B-site cations have been employed to regulate anion vacancy concentrations [22,25,26,27,28,29]; for example, La3+ substitutions on the A site enhance the polarization and reduce the leakage behavior of BiFeO3 [22,29]; similarly, the substitution of cations such as Sc3+, Nb5+, Cr3+, Mn3+, Ti4+, and Ni3+ on the B site improved the electrical properties [22,26,27,28,29,30,31]. (iii) Modifying the electrode-BiFeO3 interface [22,31] and (iv) incorporating an insulating layer at the top of the bottom electrode interface have been suggested as alternative approaches to block charged carrier pathways, reducing the leakage current and increasing the ferroelectricity and piezoelectricity of BFO films [32,33,34]. A superlattice structure with BiFeO3 and SrTiO3 layers has recently been shown to effectively suppress leakage currents by introducing a transition layer that blocks charge transfer at the film–electrode interface and inhibits oxygen vacancy migration [14,15,24]. Building on this strategy, BiFeO3/SrTiO3/BiFeO3 nanolaminates (BSB-NLs) further reduce leakage current density by two orders of magnitude (from 10−5 to 10−7 A/cm2) [34] and enhance the piezoelectric response nearly fivefold, reaching ~331 pm/V with a ~12 nm STO spacer. These improvements stem from the strained BFO layers and the chemical/crystallographic state of the BFO/STO interfaces, which generate an internal field opposing carrier motion. Consequently, BSB-NLs combine low leakage and large electromechanical responses, making them promising candidates for nonvolatile ferroelectric memories, MEMS/NEMS actuators, photovoltaic cells, and biomedical devices. Moreover, the PFM (piezoresponse force microscopy) technique has been extensively employed to explore the ferroelectric behavior, domain configurations, domain wall formation, and hysteresis-switching characteristics of these materials [35,36]. Specifically, research on BiFeO3 using PFM has focused on detecting domains with various variants and examining how domain structures evolve in response to changes in temperature and applied electric fields. Therefore, in the present study, we optimized the pulsed laser deposition (PLD) of [(BiFeO3)m/(SrTiO3)n]p multilayer thin films, where m ranges from 37 to 73 nm, n ranges from 0 to 51 nm, and p takes integer values from 1 to 3, by systematically varying the thickness ratio r from 0 to 1.16. This comprehensive mapping revealed previously unreported performance optima and enabled the establishment of quantitative structure–property relationships through correlations among tetragonality (c/a), grain size, and the effective piezoelectric coefficient d33. We also elucidated the dominant conduction mechanisms responsible for leakage currents and employed piezoresponse force microscopy (PFM) to characterize local domain configurations and polarization-switching dynamics. Collectively, these findings establish clear design rules for fabricating high-performance ferroelectric multilayers.

2. Materials and Methods

2.1. Sample Preparation

Bismuth ferrite and strontium titanate targets, each with a diameter of 1 inch, were used as raw materials for thin film preparation. To minimize contamination, the vacuum chamber was initially evacuated to a base pressure of 4 × 10⁻⁴ Pa. During deposition, the chamber pressure was stabilized at 1 Pa using a purified oxygen and argon gas mixture in an 80/20 ratio. The thin films were deposited via pulsed laser deposition (PLD) using a Quantel Nd: YAG laser model (Q-smart 450 model) (Quantel laser, 2 bis avenue du, Paris, France), operating at the second harmonic ( λ = 532 nm), with a repetition rate of 10 Hz, and a pulse duration of 5 ns. The films were deposited onto 2 × 2 cm quartz pieces. The substrate temperature was maintained at 200 °C during the deposition. Deposition rates were determined by varying laser fluence; film thicknesses were measured with a profilometer after defined ablation intervals, while Langmuir probe diagnostics provided ion current density and electron temperature. Thickness profiles at multiple ablation durations confirmed reproducible growth ratios and consistent film quality.

2.1.1. Indium Tin Oxide Bottom Electrode

The quartz substrates were coated with a 100 nm polycrystalline indium tin oxide (ITO) layer deposited via the pulsed laser deposition method to serve as a transparent bottom contact. The polycrystalline ITO exhibits a cubic lattice constant of approximately 10.12 Å, providing an intermediate template that bridges the lattice mismatch with perovskite BiFeO3. This lattice bridging reduces misfit dislocations and promotes high-quality film crystallinity. The resistivity of the ITO layer was measured to be 3.0 × 10⁻⁶ Ω·m by the four-point probe technique. Such high conductivity ensures a uniform electric field across the BiFeO3 during polarization cycling, enhancing device performance.

2.1.2. Preparation of Multilayer Systems

To prepare the B i F e O 3 m / S r T i O 3 n p multilayer system with variable thickness ratios (r = n/m, where n and m represent the thicknesses of the SrTiO3 and BiFeO3 layers, respectively) and periodicities p = 1, 2, and 3, the ratio r was systematically varied from 0 to 1.16, with n ranging from (0 to 51 nm ± 2.59 nm) and m from (37 to 73 nm ± 2.59 nm). During deposition, the indium tin oxide-coated quartz substrate was maintained at a constant temperature of 200 °C, and the distance between the target and the substrate was consistently maintained at 5.5 cm. The multilayer systems were deposited using two targets positioned simultaneously within the chamber. The STO layer was initially deposited on the ITO film, followed by the BFO film. For a second period, the STO layer was deposited at the top of the BFO layer from the first period, followed by the deposition of another BFO layer; this process was repeated for additional periods. The deposition rate was approximately 0.7 nm/min. Following deposition, the as-deposited thin films were annealed in an oven at 600 °C for 1 h in an air atmosphere to promote the crystallization of the deposited materials. For electrical characterization, gold top electrodes with a thickness of 50 nm and a diameter of 0.3 mm were sputtered onto the film surfaces at room temperature. A schematic diagram illustrating the film deposition process is shown in Figure 1.

2.2. Characterization of Structure, Composition, and Ferroelectric Response

The thickness of the thin films was measured using a step profiler (KLA Tencor, D-120, Three Technology Drive, Milpitas, CA, USA). The crystal structure and phase composition were analyzed using X-ray diffraction (XRD) with a Panallytical Empyrean diffractometer (DMAX2550) 2400 Computer Drive, Suite 2100, Westborough, MA, USA, which utilizes Cu Kα radiation (λ = 1.5405 Å), over a 2θ range from 20° to 60°, using a step size of 0.02°, to assess the film’s crystal structure and phase composition. Raman spectra were recorded at room temperature with a LabRAM HR 800 spectrometer (HORIBA Jobin Yvon Brand, Unit 102, 5555 North Service Road, Burlington, ON, Canada), utilizing a D0.3 filter, an X50 objective, and a He-Ne laser with a wavelength of 632.8 nm. To enhance the signal-to-noise ratio, 20 scans were averaged, each with a 5 s exposure time. Surface morphology and piezoelectric domain analyses were performed using a Bruker Dimension Edge atomic force microscope (AFM) (Bruker Scientific LLC 40 Manning Road, Manning Park, Billerica, MA, USA) equipped with a conductive probe (SCM-PIC, 0.2 Nm−1 force constant). The inherent distribution of ferroelectric domains within the films was investigated using piezoresponse force microscopy (PFM), while switching PFM (SPFM) was employed to obtain ferroelectric hysteresis loops [35]. These analyses were carried out using an atomic force microscope (AFM) equipped with a Budget Sensor ElectricTap150-G conductive probe (force constant: 5 N/m). Electrical excitation signals were generated by a Keysight Trueform Series 33500B waveform generator. To enhance signal clarity and accurately interpret the piezoelectric response, the AFM system was integrated with a Zurich Instruments HF2LI lock-in amplifier. During SPFM measurements [36], a direct current voltage (Vdc) applied to the probe tip produced an electric field (E), which modified the ferroelectric polarization and caused film elongation via the converse piezoelectric effect. This electric field could also trigger electrostriction due to ion displacement within the crystal lattice, which follows a quadratic relationship with E. To minimize electrostatic interference, the electric field was applied in pulses, periodically switching Vdc on and off [37]. The leakage current–voltage (I–V) behavior of the samples was measured at room temperature using a Keithley 2400 electrometer (Tektronix, Inc. 13725 SW Karl Braun Drive P.O. Box 500 Beaverton, OR, USA).

3. Results and Discussion

3.1. Microstructure

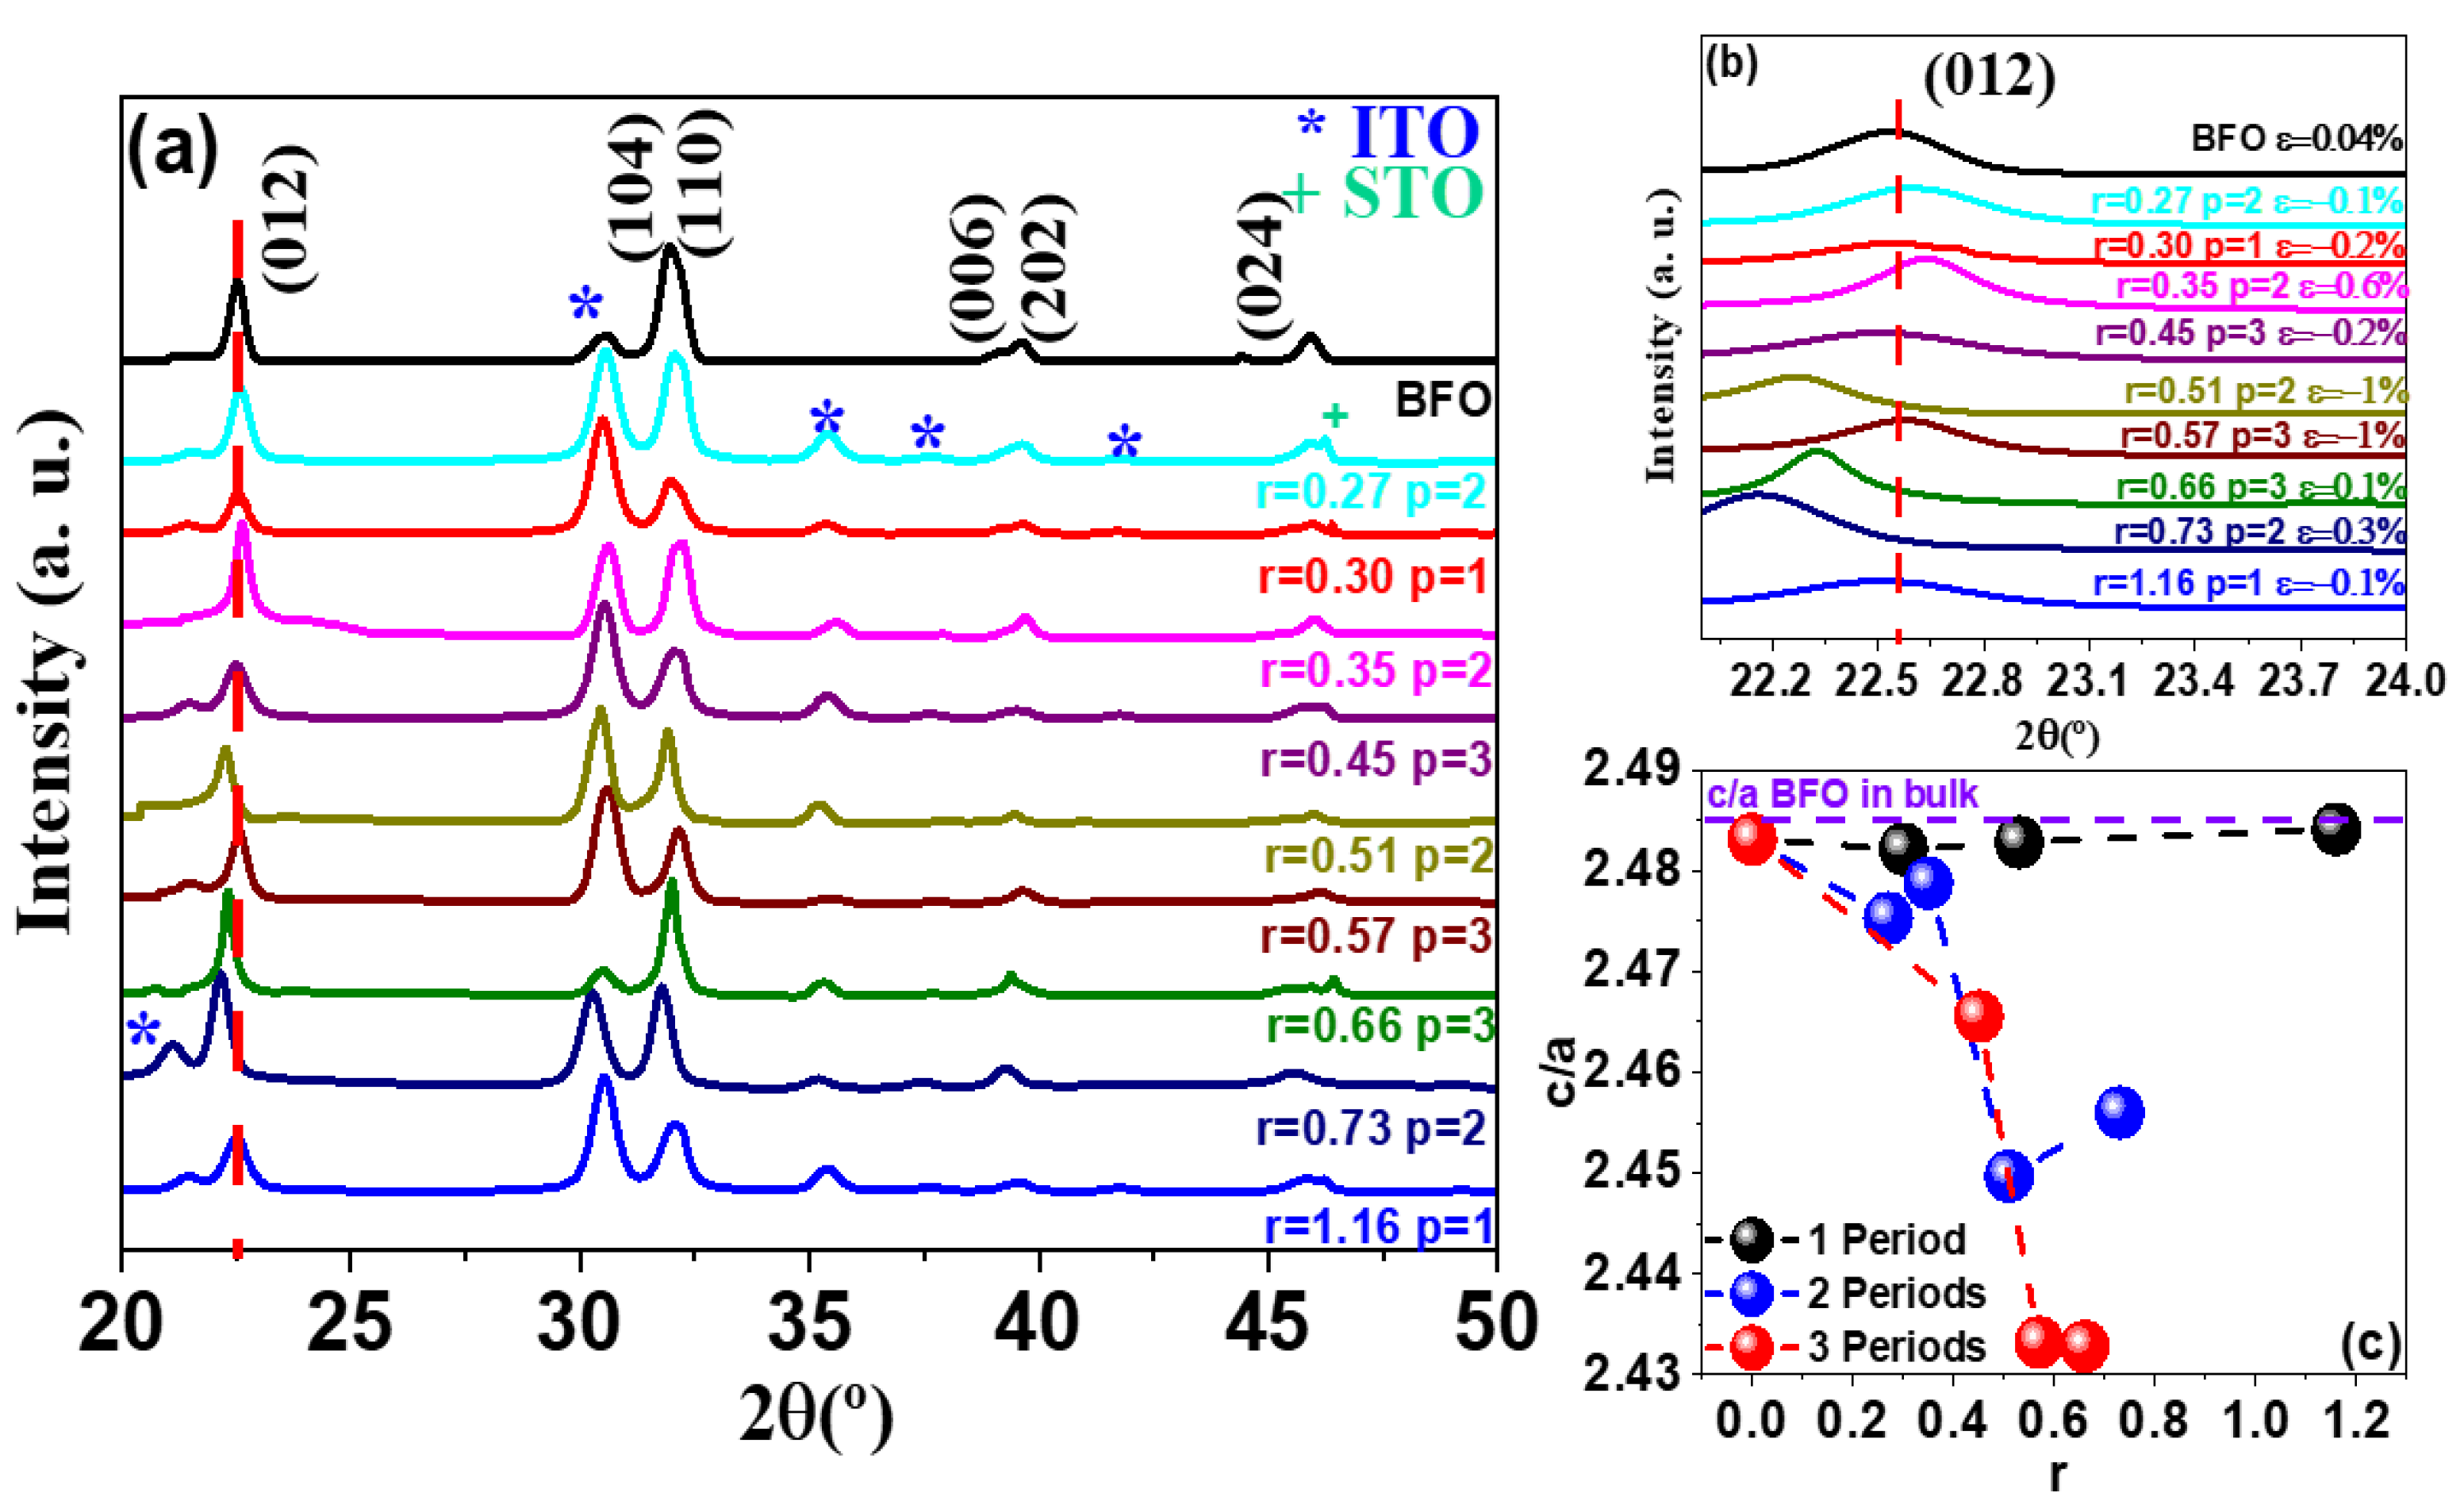
The X-ray diffraction patterns (θ–2θ scan) shown in Figure 2a were used to determine the lattice parameters and degree of tetragonality for each B i F e O 3 m / S r T i O 3 n p multilayer film after the annealing process in air. For comparison, the XRD pattern of the BFO is also included in Figure 2a. All observed patterns display the characteristic diffraction planes of the rhombohedral structure of the BFO, corresponding to the space group R3c, in agreement with the standard PDF card no. 98-018-0128. All films displayed a polycrystalline structure. The diffraction planes indicated with asterisks and crosses are associated with ITO and STO, respectively. No undesired phases were detected. In addition, as shown in Figure 2b, the (012) diffraction plane exhibited a shift toward higher 2θ angles with an increasing thickness ratio (r), changing from 2θ = 22.52° for the BFO single layer to 2θ = 22.64° for r = 0.35 with two periods. This shift can be attributed to (i) the lattice mismatch between the SrTiO3 (STO) and BiFeO3 (BFO) layers and (ii) the stress generated at the interface between the two layers within the multilayer structure [14,37]. Finally, the lattice distortion c/a was calculated for all the samples and is shown as a function of the thickness ratio r in Figure 2c. As the period (p) increases, the lattice parameters also increase.

3.1.1. Rietveld Refinement

The lattice parameters of the samples were estimated using Rietveld refinement analysis. Table 1 summarizes various structural parameters of the multilayer films, including the lattice constants (a and c), unit cell volume, c/a ratio, and crystallite size. The average crystallite size was calculated from the prominent (110) XRD peak using the Debye–Scherrer formula, D = 0.9 λ/β cosθ, where D is the mean crystallite diameter, λ = 1.5444 Å (Cu Kα2 X-ray radiation), and β represents the full width at half maximum (FWHM) of the diffraction peak at the angle 2θ [38,39]. The calculated average crystallite sizes for the samples ranged from 26.16 to 53.78 nm.
In Table 1, the c lattice parameter of BFO in multilayer films is smaller than that of BFO without the STO layer, indicating that the BFO lattice is compressed due to the presence of the STO layer.

3.1.2. Grain Size Measurements

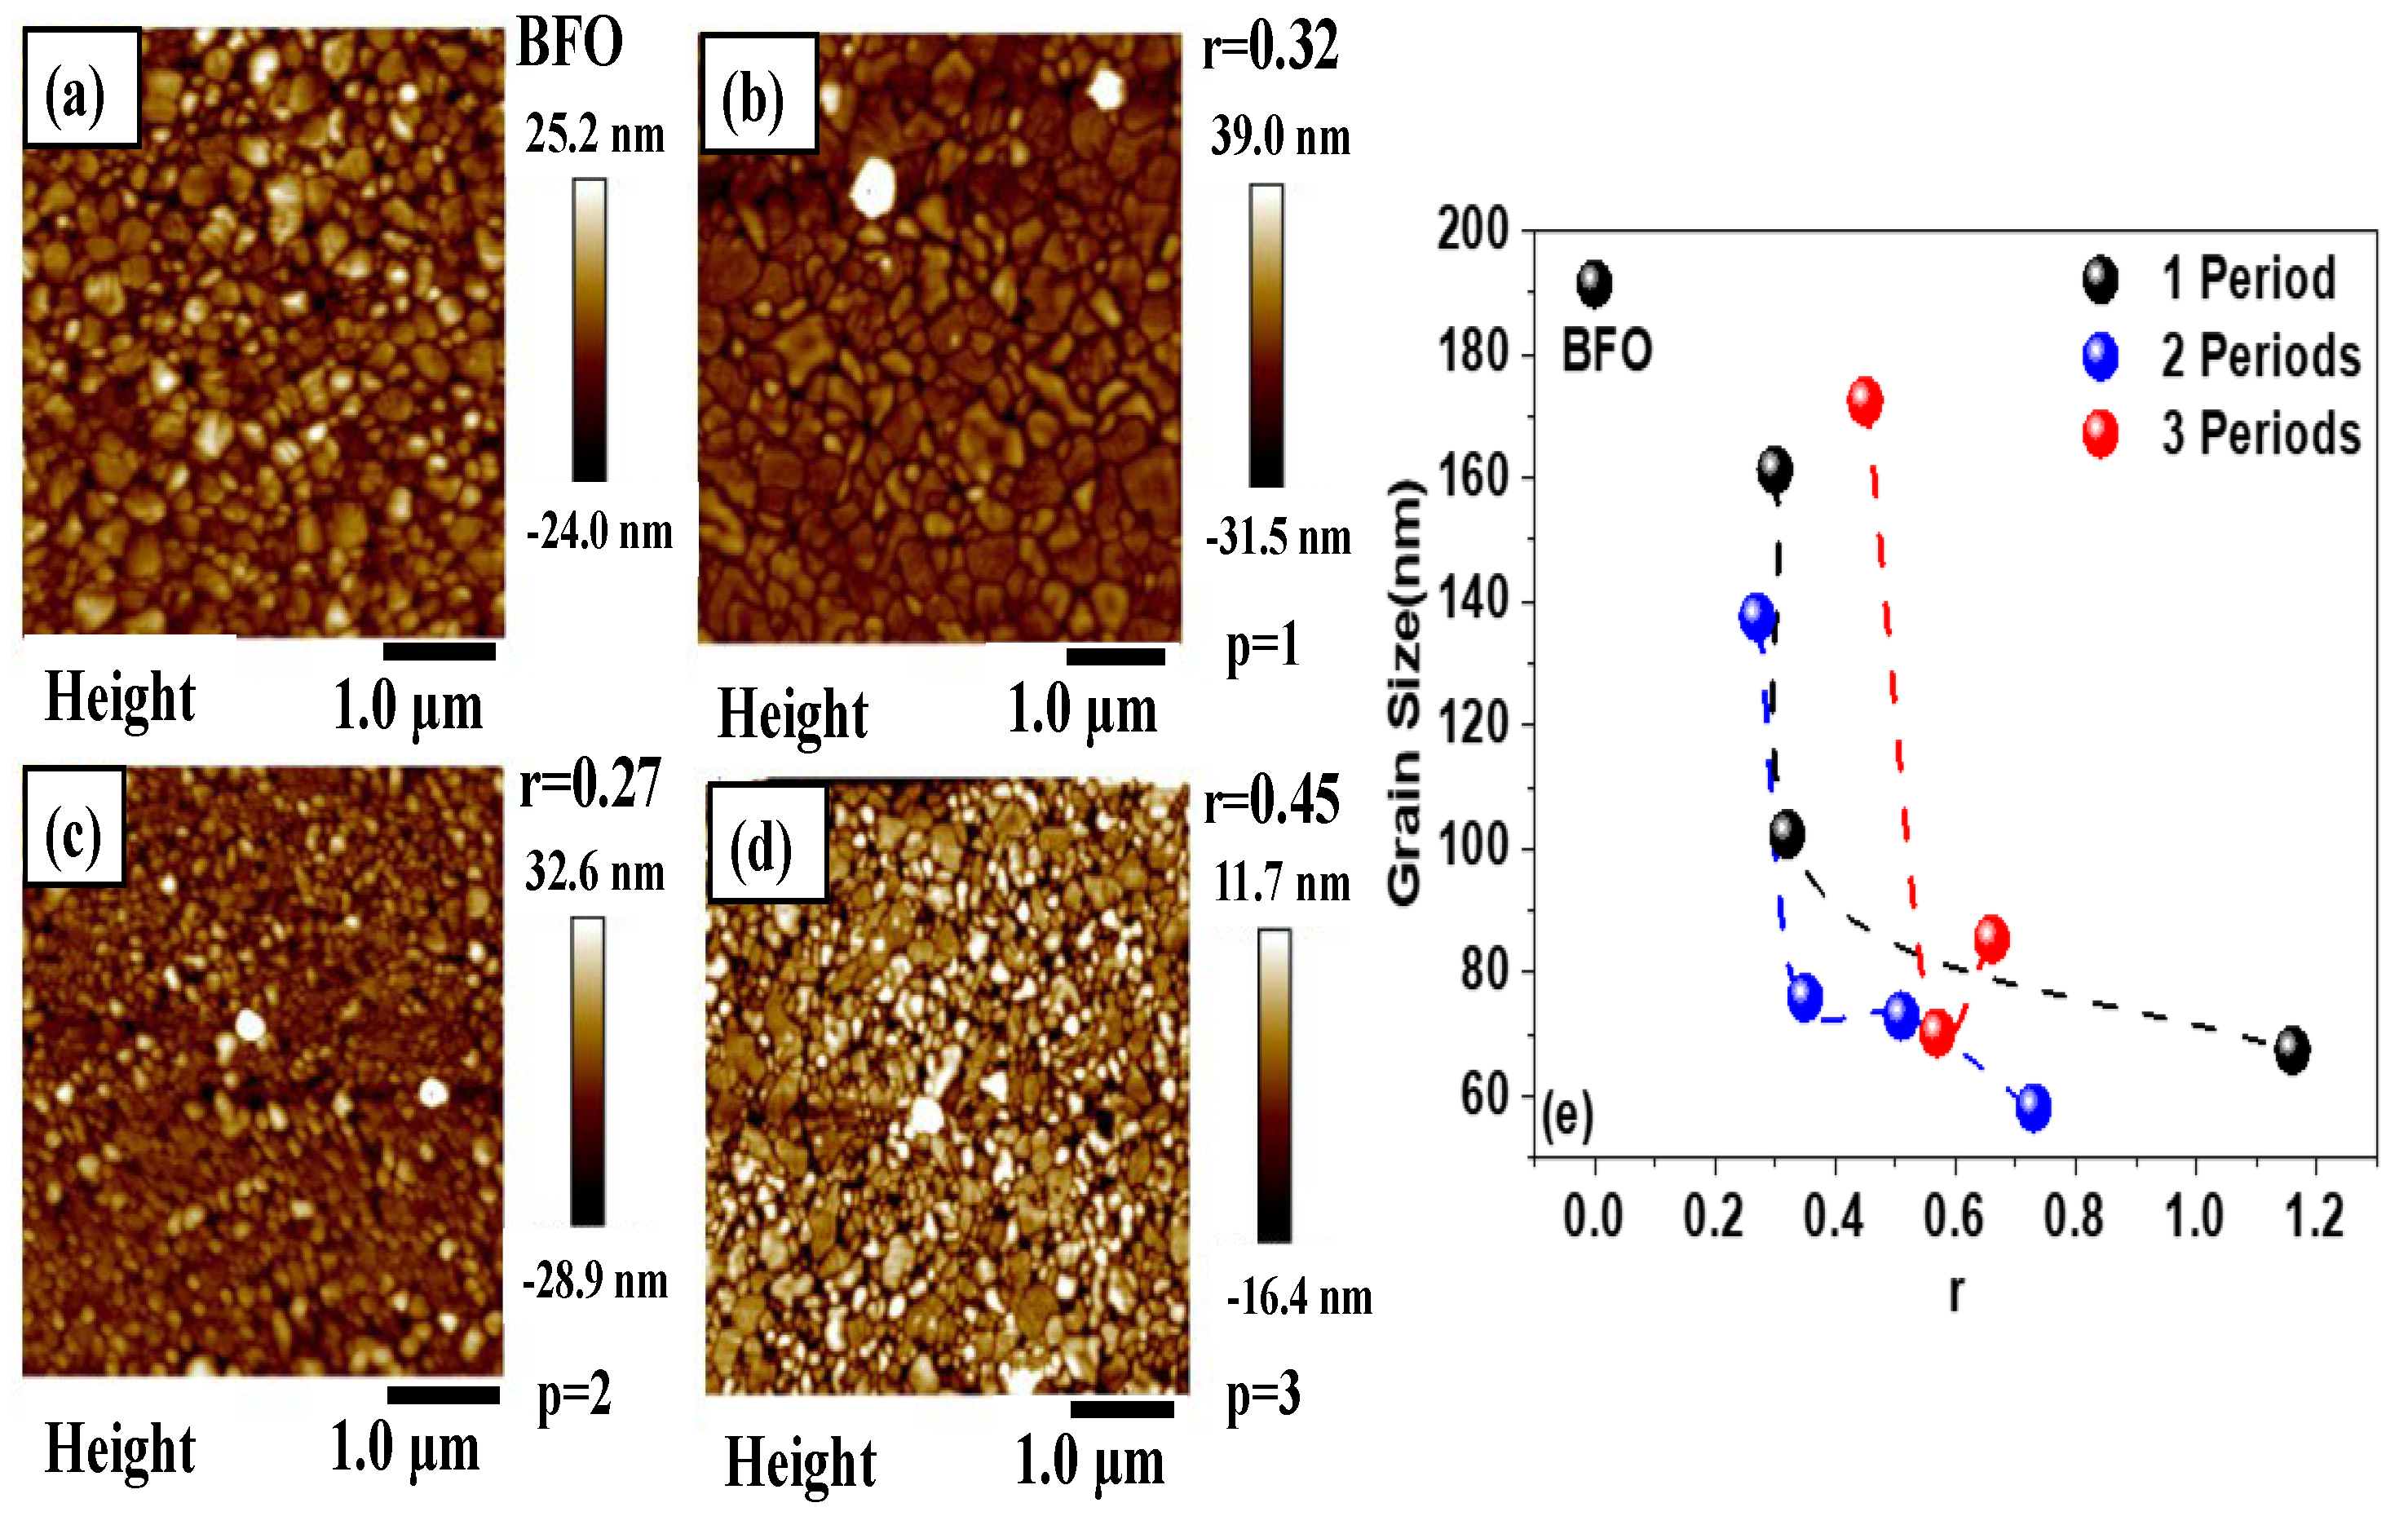
Figure 3a–d display the two-dimensional AFM images of multilayer thin films. All samples revealed a compact, crack-free microstructure with uniformly shaped grains. The estimated average grain sizes ranged from 58.21 to 191.40 nm, while the average surface roughness was less than 7.3 nm. Detailed values of grain sizes and surface roughness are summarized in Table 2. The trend in average grain size aligns with the average crystallite size estimated from the XRD data, although the grain sizes are significantly larger. This difference may be due to internal stress within the BFO thin films, which is not accounted for in the Scherrer equation [5]. Figure 3e illustrates the noticeable variation in grain size as a function of the thickness ratio (r). This change in grain size may be linked to the suppression of oxygen vacancies, which influences grain growth dynamics by modifying the diffusion flux of oxygen vacancy species [5,40,41]. A microstructure with larger grains reduces the total grain boundary area, and since grain boundaries often serve as pathways for leakage, increasing the average grain size can help minimize leakage currents [42,43]. To achieve a large grain size, the PLD layer thickness was optimized, and the STO layer produced nucleation sites, promoting the heterogeneous nucleation and serving as a template to modify the microstructure of the BFO films, resulting in enhanced large grain size [42]. Additionally, the grain size of the films without the STO layer was found to be approximately 2.8 times larger than that of those containing the thickest STO layer, indicating the presence of a critical thickness threshold, n* (0 nm < n* < 51 nm), beyond which the beneficial templating effect of the buffer layer on increasing the grain size of the overgrown film is diminished [42,44]. As a result, the ability of the buffer layer to modify or enhance the microstructure of the overgrown film is lost, and the overgrown film no longer replicates the microstructure of the underlying buffer layer.

3.2. Leakage Current Density Analysis

Leakage current serves as an indicator of film quality, as it contributes to power loss and can potentially lead to battery drain. Therefore, minimizing leakage current is essential for reducing power consumption and optimizing device efficiency. Leakage current behavior is influenced by several factors, including the properties of the film–electrode interface, the composition and structure of the electrodes, conditions during deposition and annealing, the presence of defects, and the microstructure and chemical makeup of the films.
To evaluate the impact of the thickness ratio r on the B i F e O 3 m / S r T i O 3 n p films, the leakage current density versus electric field performance (J-E) for different ratios r, as well as for one, two, and three periods, is shown in Figure 4a–c, respectively. The symmetric nature of the current–electric field (J-E) curve under reversed bias conditions, despite the asymmetric structural setup, suggests that the observed leakage behavior is not primarily governed by the electrode–film interface [20] Additionally, it was also observed that the thickness of the buffer layer played a significant role in the leakage current. A minimum leakage current density of 8.64 A/cm2 at −400 kV/cm was obtained for the heterostructure with a thickness ratio of 0.30 and one period. This value is lower than that of pure BFO thin films, as listed in Table 2. The phenomenon can be attributed to the differing work functions of BFO and STO leading to a potential barrier at their interface that blocks carrier conduction, reducing the leakage current density of the multilayer films [14,45]. Figure 4a–c illustrate the changes in leakage current density as a function of thickness ratio under an applied electric field of –400 kV/cm. The observed reduction in leakage current density, compared to pure BFO thin films [39], can be attributed to the smaller grain size, lower surface roughness, and denser microstructure of the multilayers. In single-period systems, the lowest leakage current density was achieved at a thickness ratio of 0.30; however, further increases in the ratio led to a rise in leakage current. In contrast, for samples with two and three periods, leakage current density continued to decline as the thickness ratio increased.

3.3. Conduction Mechanisms

The understanding of the leakage mechanism is relevant to reducing it, and it is mainly divided into volume- and interface-limited conductivities. Volume-limited conduction mechanisms typically include ohmic conduction, space-charge-limited conduction (SCLC), and Pool–Frenkel (P-F) emission. In contrast, interface-limited conduction is mainly governed by Schottky emission and the Fowler–Nordheim (F-N) tunneling effects. By analyzing the log(J) versus log(E) plots shown in Figure 5a–c, the leakage current mechanisms of the multilayer films were identified based on the different slopes, which correspond to distinct conduction mechanisms. For all the multilayer film samples across the entire electric field range, the leakage current mechanism was found to be a combination of ohmic conduction (with a slope α 1) [26]. This behavior may be attributed to thermal electron emission [26,33], the presence of free charge carriers, and the space-charge-limited conduction (SCLC) mechanism, characterized by an exponent ( α   ~ 2) [26,34,35,46,47]. The SCLC is primarily influenced by the number of carriers injected into the traps. When a sufficient number of carriers are introduced, the conductivity of the films increases, indicating the dominance of the SCLC leakage mechanism.
The ohmic conduction can be expressed as:
J = σ E = n q μ E
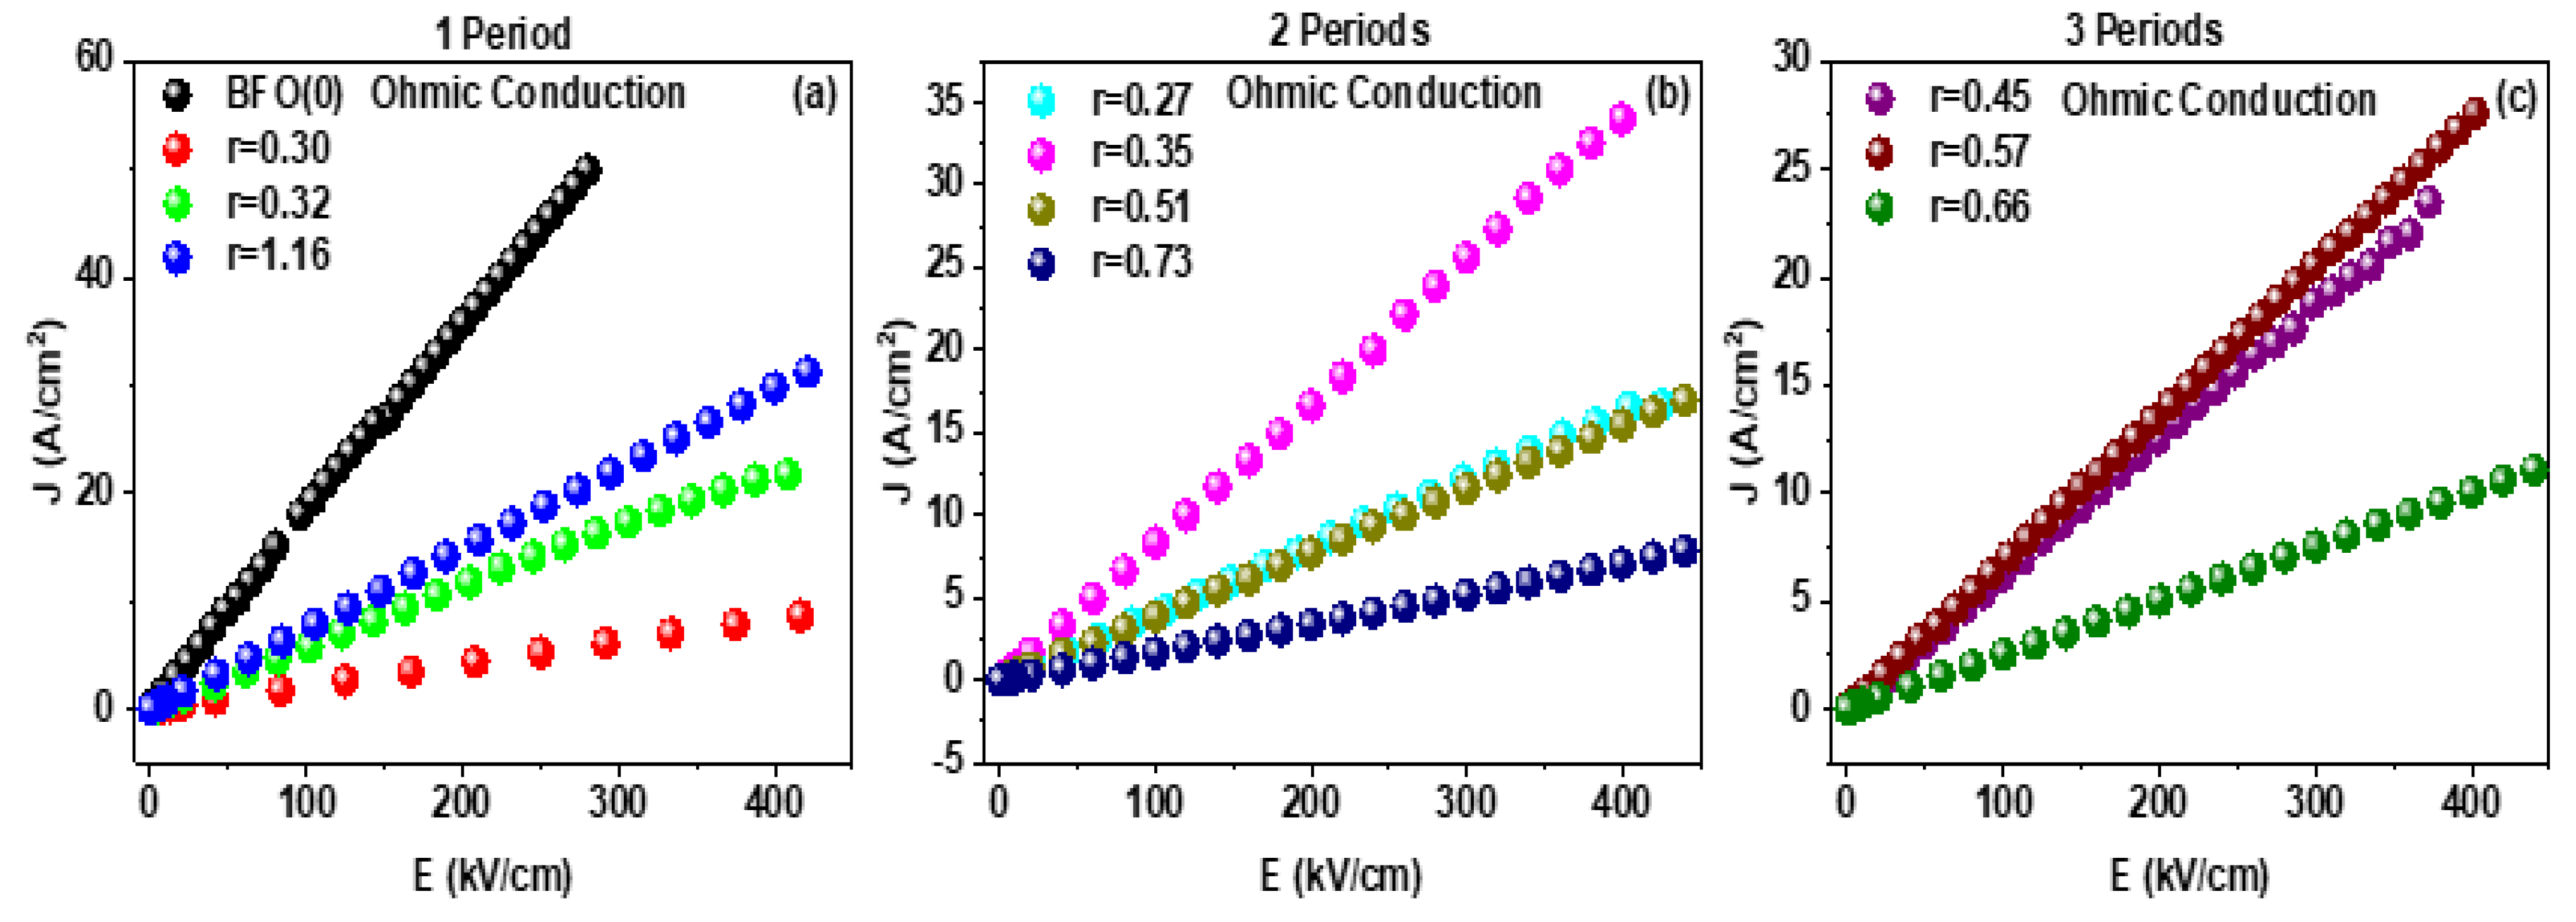
where σ is the conductivity, n is the number of carriers charged, q is the electron charge, and μ is carrier mobility. According to Equation (1), ohmic conduction can be examined by plotting the leakage data as J versus E, as shown in Figure 6a–c. If ohmic conduction is the dominant mechanism, the data should exhibit a linear relationship. The observed linear fit in Figure 6a–c, indicates that ohmic conduction governs the leakage current mechanism for these films within the measured voltage range.
In addition to the ohmic conduction mechanism, other potential mechanisms such as Poole–Frenkel (P-F) emission, thermionic field emission, and Fowler–Nordheim (F-N) tunneling effect may also contribute. The P-F emission mechanism involves thermal excitation, where trapped charge carriers in defect centers are excited into the conduction band under a strong external electric field. In the case of Schottky emission, the applied electric field lowers the Schottky barrier, allowing electrons to escape over the barrier. The ITO-STO-BFO-Au structure can be considered as a back-to-back configuration of two Schottky diodes. BFO behaves as a p-type semiconductor due to the bismuth deficiency, while the presence of oxygen vacancies introduces conduction electrons, resulting in n-type conductivity [11,48,49,50]. The Schottky equation can be expressed as: [39]
J s = A T 2 e x p e e E / 4 π ε 0 ε r Φ b k B T
where A is the Richardson constant, T is temperature, Φ b is the Schottky barrier height, k B is the Boltzmann constant, E is the applied electric field, e is electron charge, ε 0 is permittivity of free space, and ε r is the relative dielectric constant. The linear relation of log J and E1/2 is obtained as shown in Figure 7. The straight line enables the calculation of the slope and value of the Schottky barrier. The Poole–Frenkel equation can be expressed as: [39]
J P F = B E l e x p E l e 3 E / 4 π ε 0 ε r k B T
where B is a constant, and E l is the ionization energy of the traps in the film.
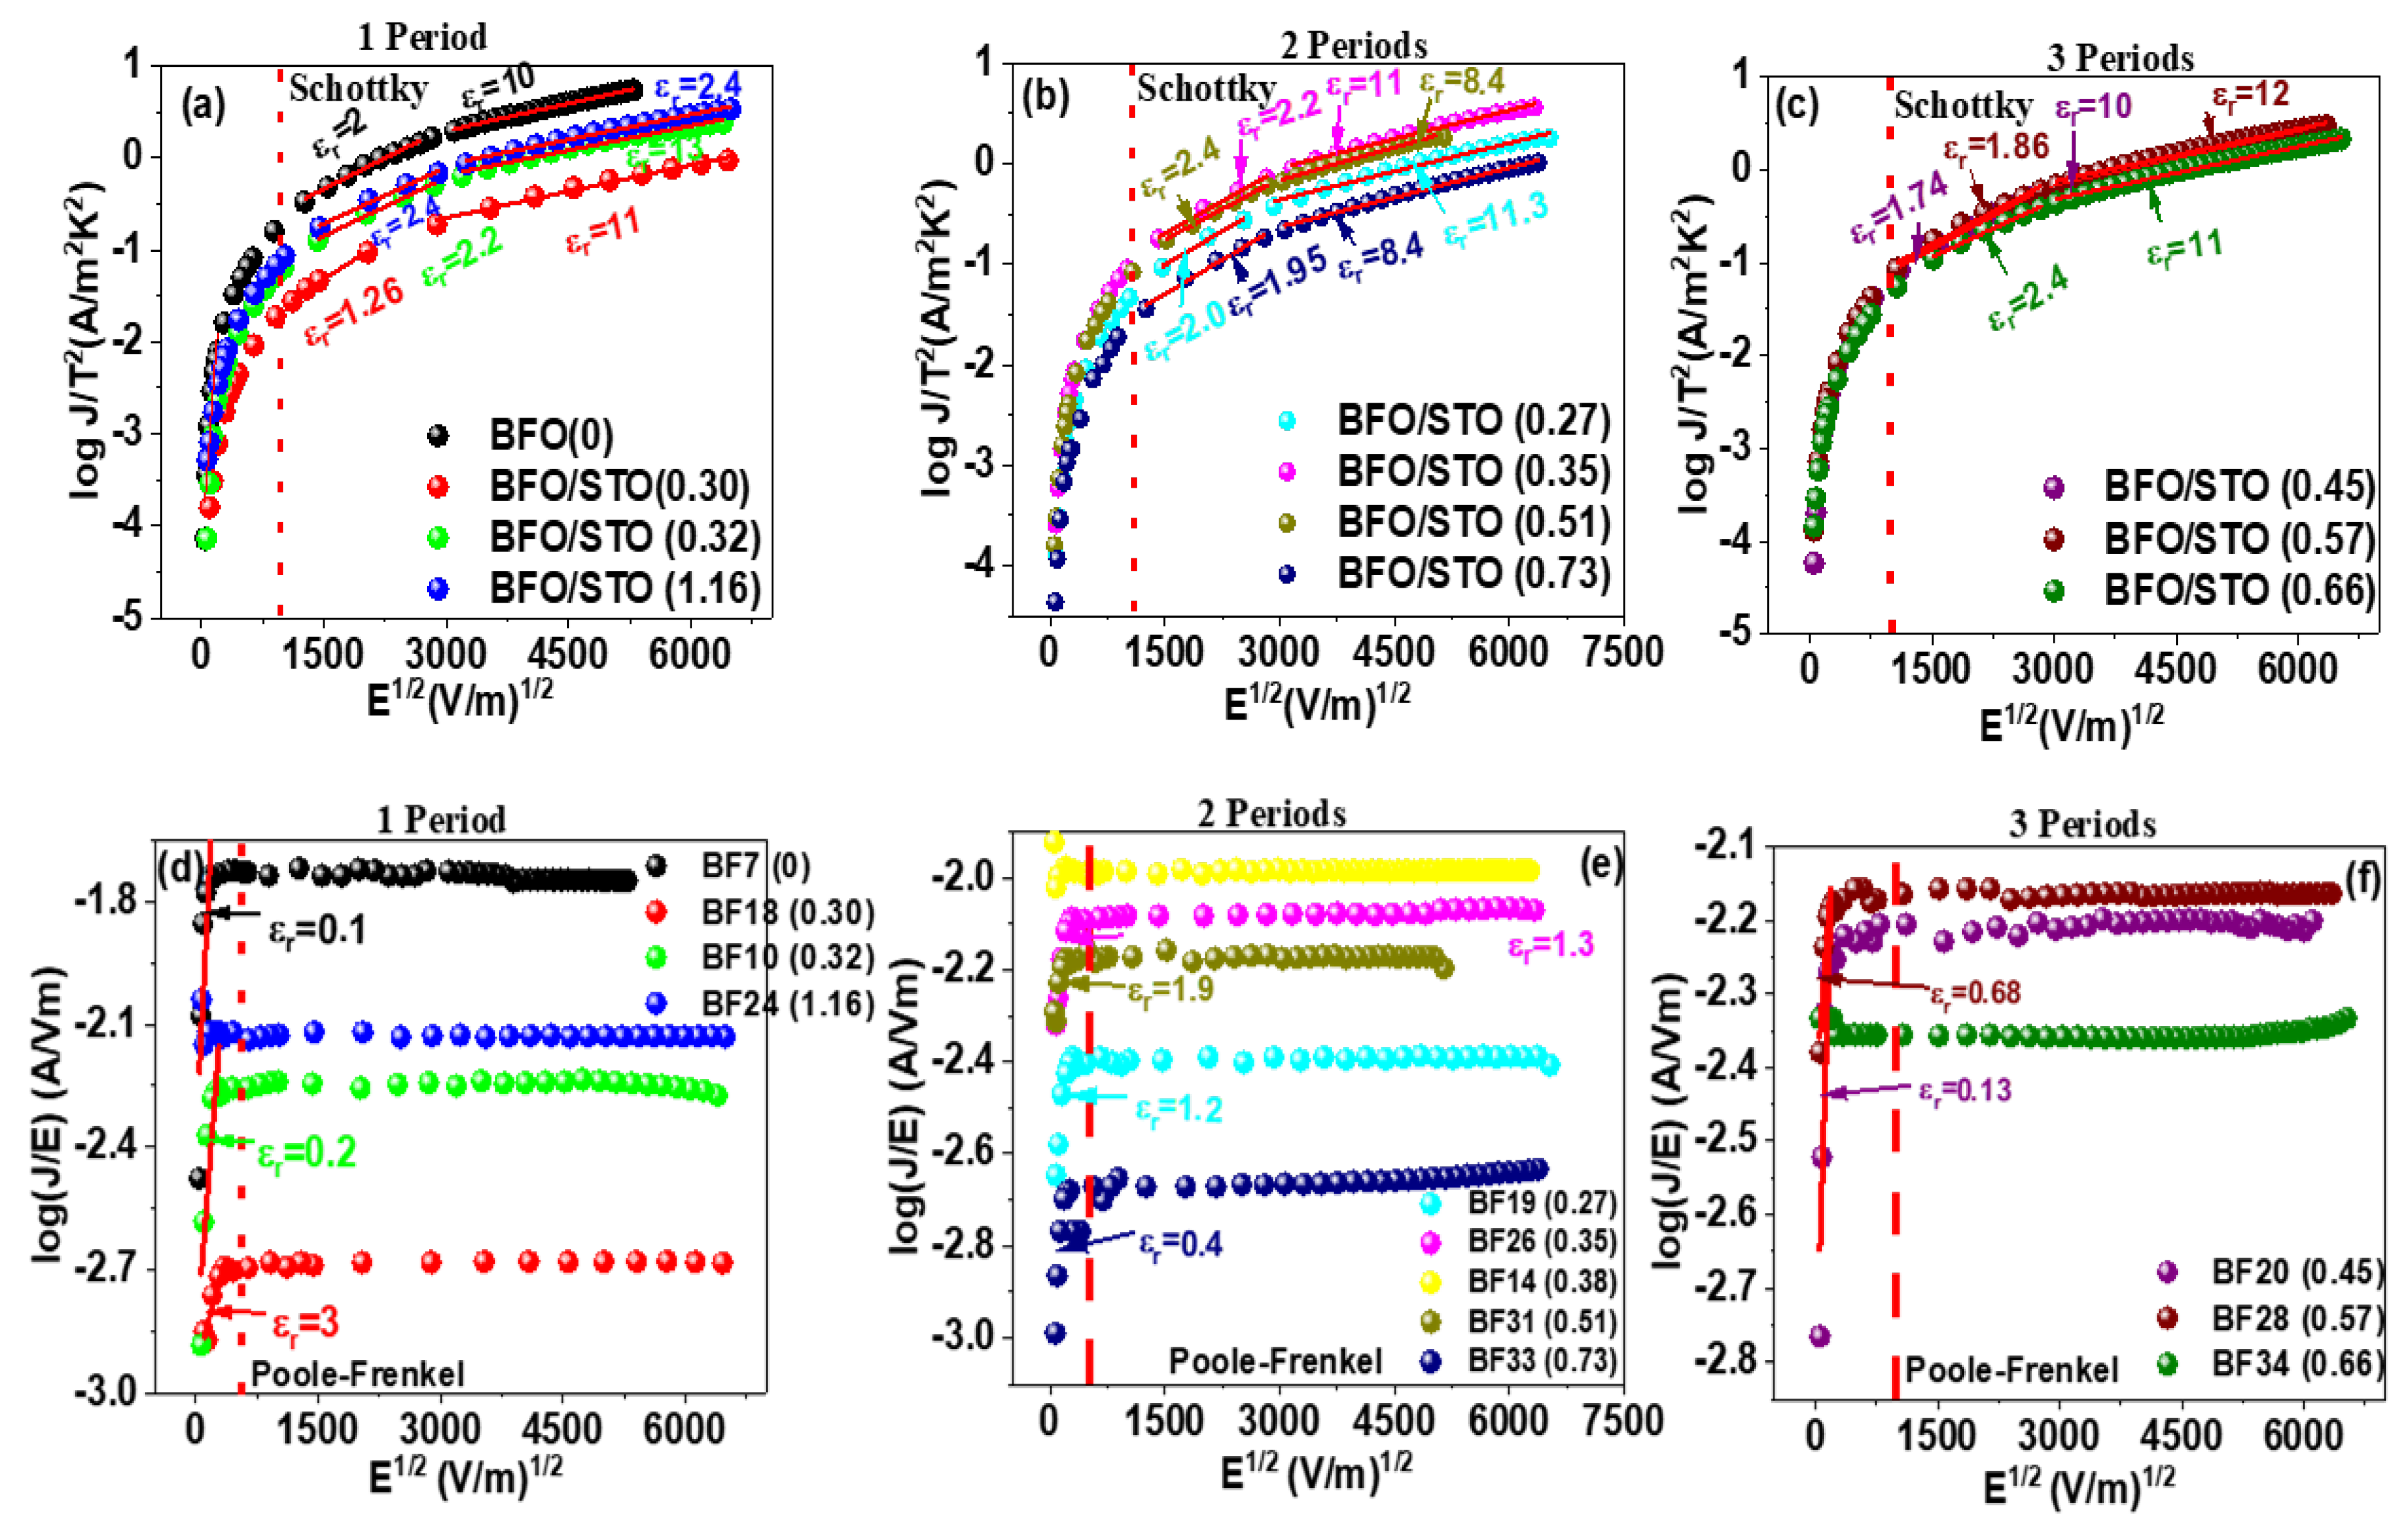
As shown in Figure 7a–f, the plots of log (J/AT2) versus E1/2 and log (J/E) versus E1/2 were generated based on Equations (2) and (3), respectively. These plots allow the calculation of the relative dielectric constant ( ε r ) from the slope of the curves. Considering the refractive index n = 2.5 for BFO, the theoretical value of ε r is 6.25 [26,51]. However, the ε r values obtained from the fitting in Figure 7 show slight deviations from the theoretical value, indicating that the leakage mechanism in the thin film samples under high electric fields does not match either the Poole–Frenkel emission or the thermionic field emission. Instead, under high electric fields, the leakage mechanism is better described by the Fowler–Nordheim (F-N) tunneling effect, which can be expressed by the following equation: [15]
J F N = C E 2 e x p D 2 ϕ i 3 E
where ϕ i and C represent the barrier height and a constant, respectively.
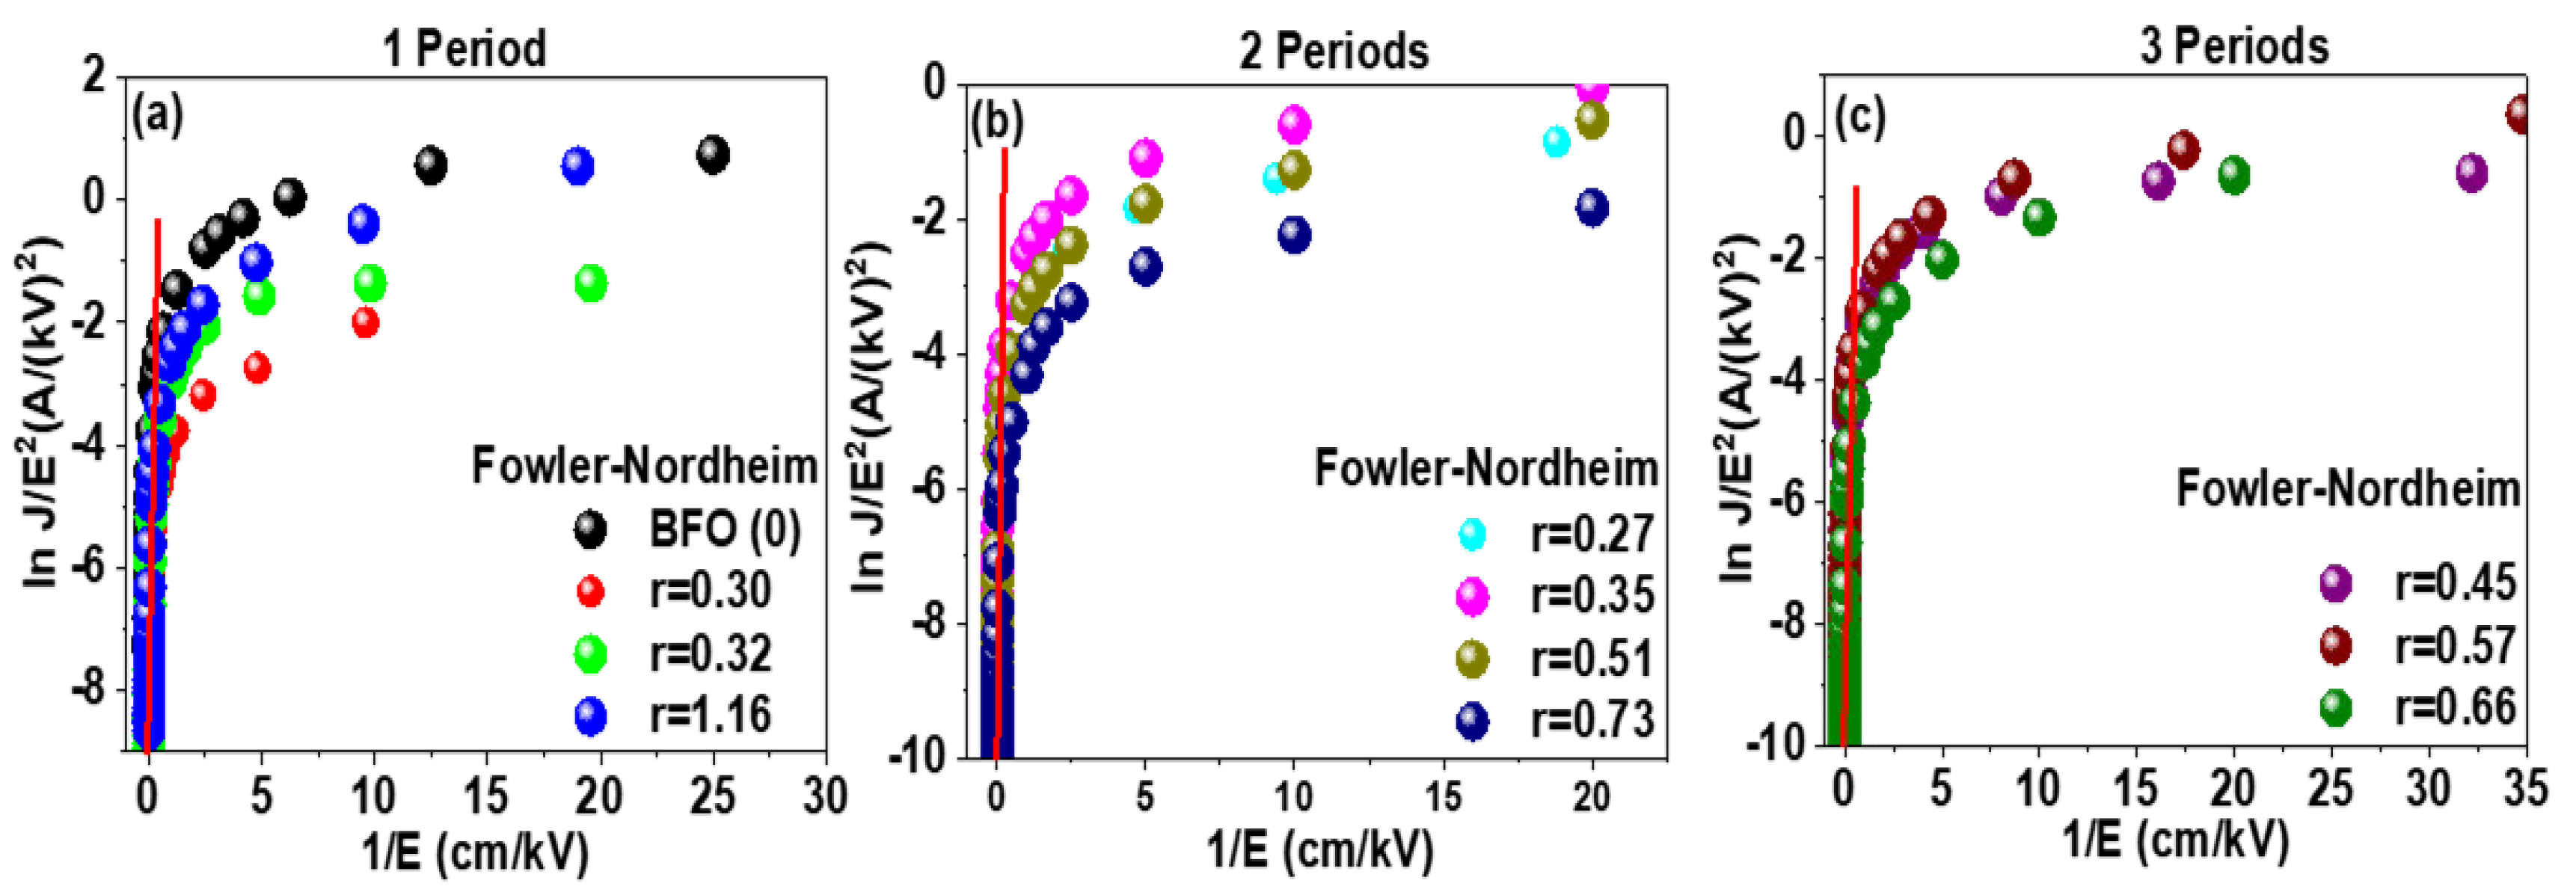
Figure 8a–c present the plots of log(J/E2) vs. 1/E, derived from the corresponding formula. To determine whether the leakage behavior is governed by the F-N tunneling effect, the linearity of these curves was analyzed. As observed in Figure 8a–c, the curves demonstrate a strong linear relationship, indicating that the F-N tunneling effect is the dominant leakage mechanism at high electric fields. Conversely, at lower electric fields, the BFO/STO thin films primarily display volume-limited conduction, while interface-limited conduction dominates under high electric fields.

3.4. Ferroelectric Properties

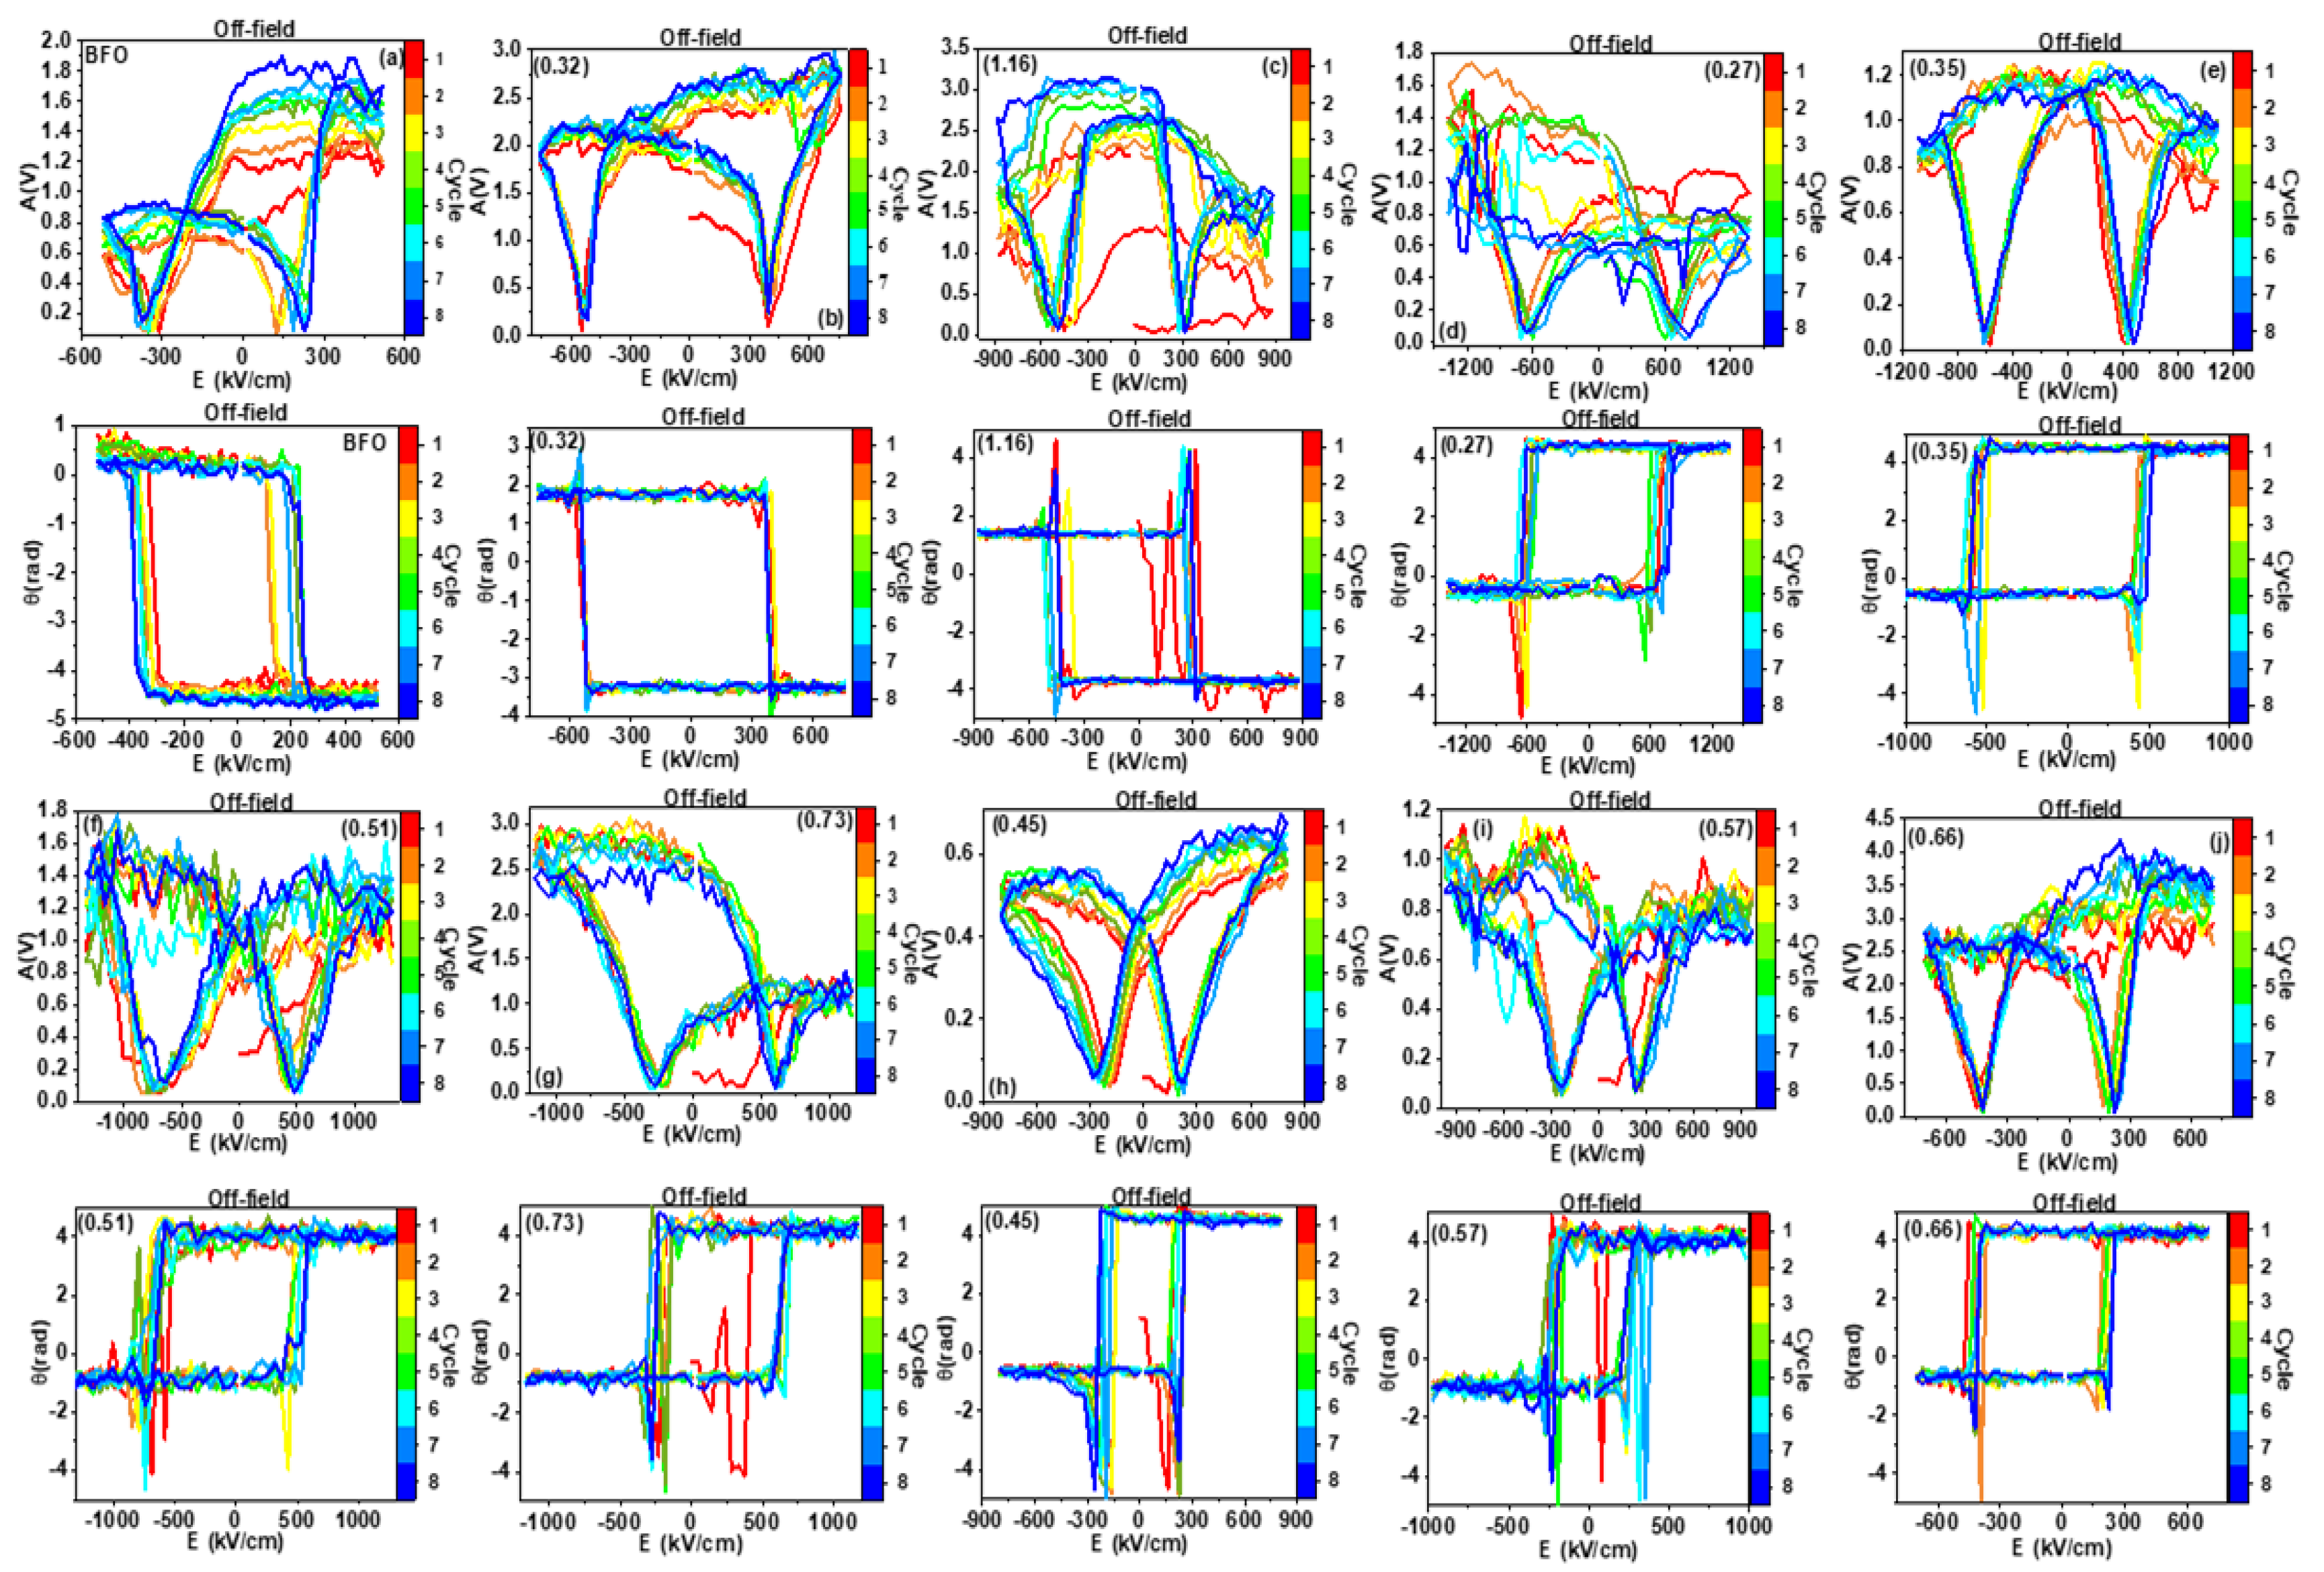
The ferroelectric behavior of the multilayer films was assessed using out-of-plane PFM, where surface topography, amplitude, and phase images were simultaneously captured. Additionally, piezoresponse amplitude butterfly curves and phase hysteresis were recorded by sweeping the tip bias from −20 V to +20 V using a computer-controlled lock-in amplifier. Figure 9a–j present the off-field amplitude and phase hysteresis loops. All films exhibited clear ferroelectric switching behavior, as evidenced by the phase loops, and electromechanical strain, as indicated by the amplitude loops. The amplitude hysteresis loops showed two asymmetric wings with a sharp switching valley and a leftward shift, indicative of enhanced remnant polarization. Moreover, an increase in the thickness ratio r was associated with a higher piezoresponse amplitude [36]. The observed asymmetric polarization switching may be attributed to a built-in electric field arising from differences in the properties of the top and bottom electrodes [49].
Figure 10a–c show the variation in room temperature Ec values as a function of the switching cycle for one, two, and three periods. The data reveals that both the number of periods and the thickness ratio affect the coercive field, with increasing number of periods reducing the coercive field until a minimum value of Ec = 238 kV/cm for p = 3 and r = 0.45. Given that ferroelectric ordering in BiFeO3 originates from rhombohedral distortion caused by the Bi3+ lone pair (6 s2) and the strong Bi-O hybridization [42], any weakening in the Bi-O bonds suggests a lower energy requirement to disrupt the ferroelectric state or alter the polarization. Hence, the reduction in Ec can be a direct consequence of the weakening of the Asite-O bonds.
Piezoresponse force microscopy (PFM) is a powerful technique for characterizing the ferroelectric properties of heterostructures, allowing the probing and switching of local ferroelectric polarization at the nanoscale. To evaluate ferroelectricity, box-in-box switched patterns were created by applying voltage through a conductive tip. First, a 5 × 5 µm2 region was scanned without a DC tip bias. Next, in situ poling was performed by applying a positive DC bias to a 3 × 3 µm2 square and a negative DC bias to an inner 1 × 1 µm2 square. Finally, the entire 5 × 5 µm2 region was rescanned without tip bias. The contrast difference observed in the poled regions after the box-in-box procedure indicates the presence of switchable ferroelectric properties [36]. The phase map shown in Figure 11a–k corresponds to the multilayer area where +20 V and −20 V were applied. The distribution of theta values confirms the reorientation of ferroelectric domains. The PFM phase images display distinct bright and dark contrast regions, representing upward and downward polarization, respectively. These observations confirm that the polarization of the multilayers is switchable, demonstrating their ferroelectric nature [52].
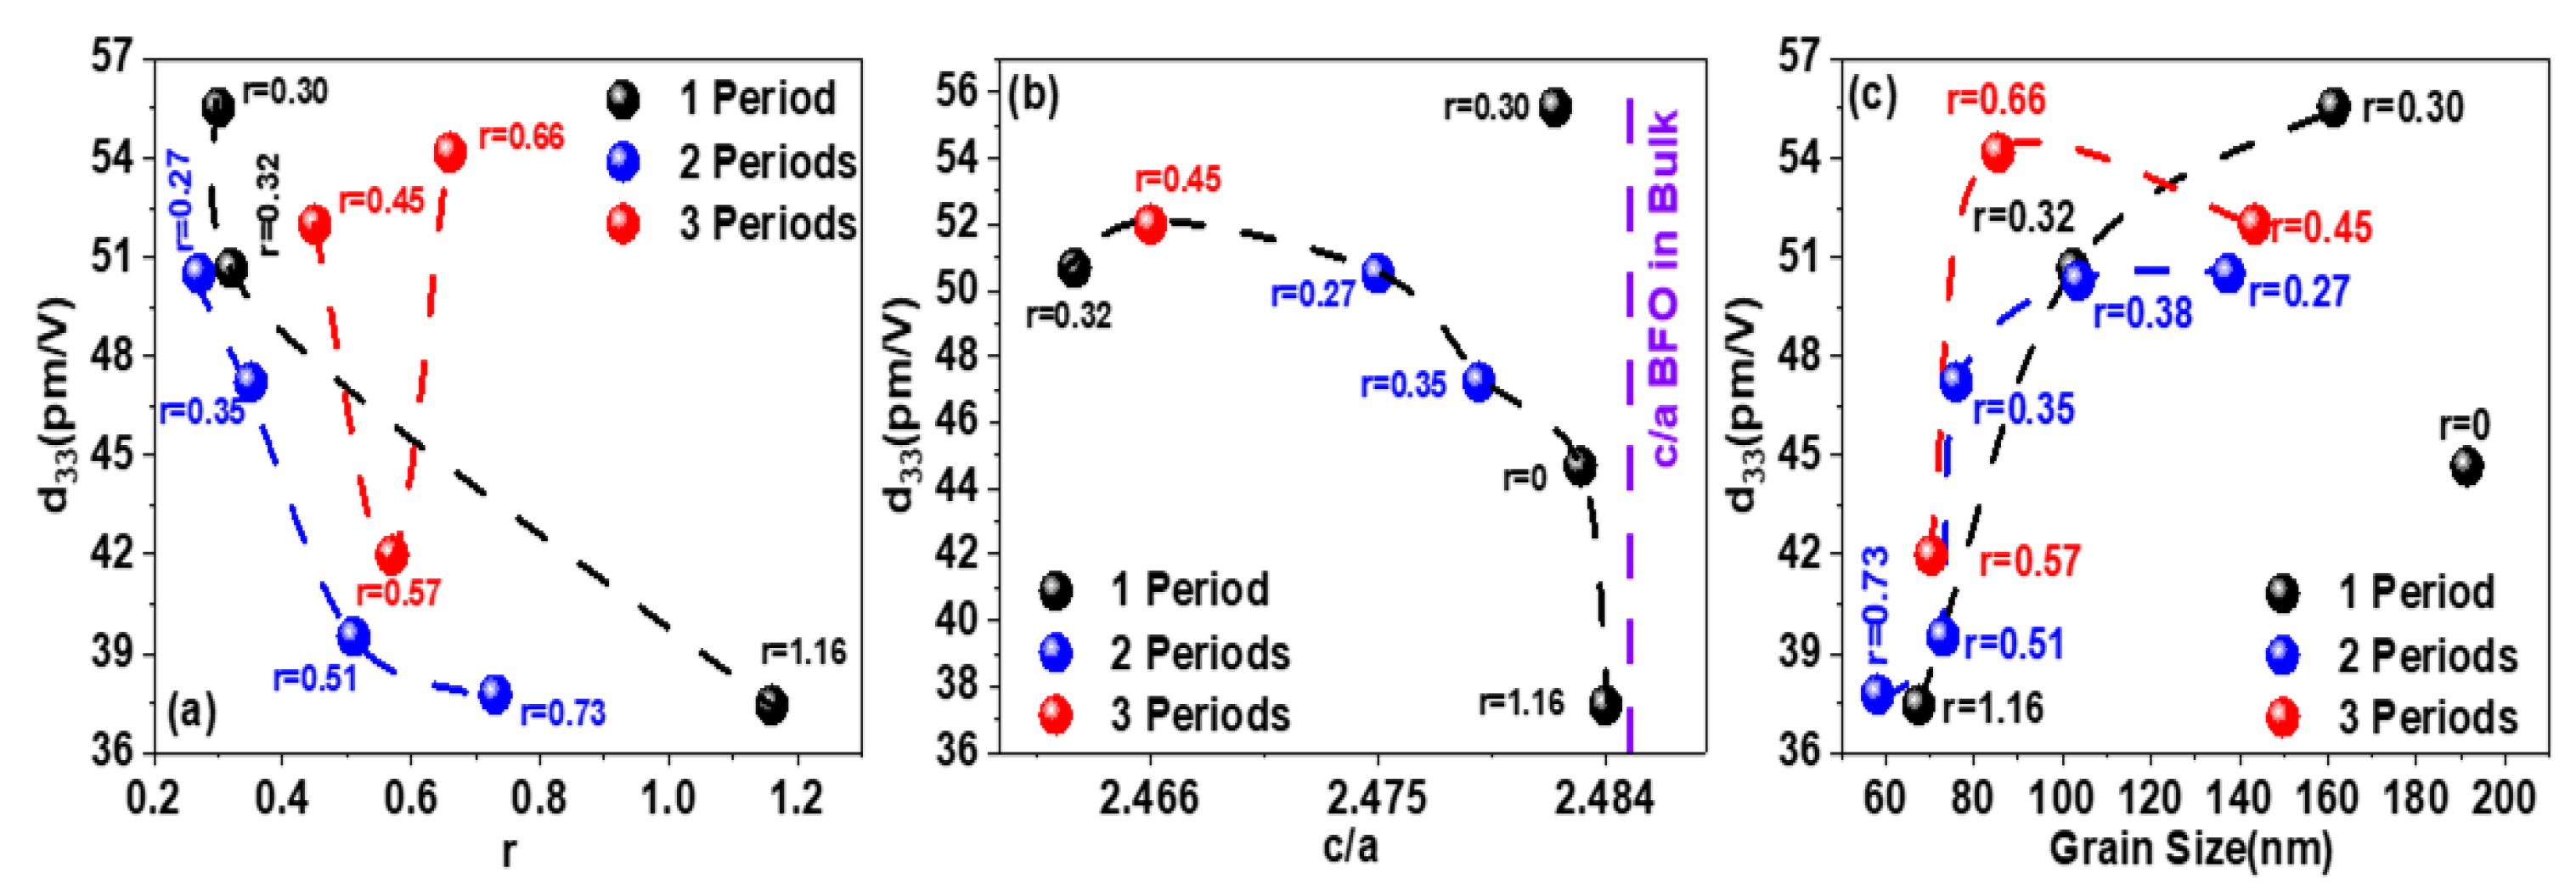
To verify the ferroelectric behavior of the BFO/STO multilayers with varying thickness ratios r, we estimated the piezoelectric properties of the films. The dependence of the piezoelectric coefficient, d33, on the thickness ratio r and the period p is shown in Figure 12a. For one period, increasing the thickness ratio r led to a systematic decrease in the piezoelectric coefficient from 55.55 pm/V at r = 0.30 to 37.45 pm/V for r = 1.16. For two periods, the piezoelectric coefficient d33 initially decreased from 50.51 pm/V at r = 0.27 to 31.62 pm/V at r = 0.35 and subsequently increased to 37.77 pm/V at r = 0.73. For three periods, the piezoelectric coefficient d33 decreased from 52.00 pm/V at r = 0.45 to 41.98 pm/V at r = 0.57 and then rose again to 54.18 pm/V at r = 0.66. These results confirm that the thickness ratio r affects the piezoelectric response of the BFO/STO multilayer system. In general, the piezoelectric constant is influenced by factors such as crystal structure, relative density, and grain size [43]. Figure 12b illustrates the variation in the piezoelectric coefficient d33 as a function of the c/a ratio for one, two, and three periods. The data show that d33 decreases as the c/a ratio increases until it reaches the value characteristic of bulk BFO. As shown in Figure 2c, the thickness ratio influences the c/a ratio, which serves as a measure of the tetragonality of the crystal structure in ferroelectric materials. A smaller c/a ratio indicates a transition from a tetragonal to a rhombohedral structure, suggesting that the BFO/STO films exhibit a greater tendency towards a rhombohedral structure, which is expected to enhance the piezoresponse [44,45]. The dependence of piezoelectric coefficient d33 on grain size is shown in Figure 12c. The piezoelectric constant increases from 37.45 pm/V for a grain size of 67.47 nm to 55.55 pm/V for a grain size of 161.30 nm (Table 2). However, in the three-period system, both the thickness ratio (r) and the grain size appear to have critical values at which a maximum piezoelectric coefficient is achieved.
The results of this study demonstrate that the [(BiFeO3)m/(SrTiO3)n]p multilayers exhibit piezoelectric coefficients d33 in the range of 30 to 56 pm/V, reaching a maximum value of 55.55 pm/V in the optimal configuration (r = 0.30, p = 1). This performance is comparable to that of stoichiometric BiFeO3 films reported in the literature, which show d33 values of approximately 70 pm/V or 68.9 pm/V [8]. While other studies have achieved significantly higher piezoelectric coefficients through the incorporation of dopants, such as Sm-doped BiFeO3 (~110 pm/V) [51], or in complex nanolaminates and heterojunctions such as BFO/STO/BFO nanolaminates (~331 pm/V) [34], BiFeO3/Na0.5Bi4.5Ti4O15 composite films (~285 pm/V) [52], or bulk BiFeO3–BaTiO3 ceramics (115 pm/V) [53] and BiFeO3–PbTiO3–SrTiO3 ceramics (up to 250 pm/V) [54], the relevance of our work lies in the ability to optimize piezoelectric properties through the geometric tuning and periodicity of the layers in the multilayers, without resorting to chemical doping or complex compositional engineering. This strategy not only allows a piezoelectric performance comparable to that of chemically modified systems but also achieves a simultaneous reduction in leakage current density (8.64 A/cm2 at –400 kV/cm in the optimal configuration) and a low coercive field (238 kV/cm). These advantages are fundamental for the integration of lead-free piezoelectric thin films in nanoelectronic devices, where nanoscale architecture control and leakage current minimization are of critical importance for device efficiency and reliability. To facilitate direct comparison, Table 3 summarizes the piezoelectric coefficient values reported in this work and in the literature.

4. Conclusions

The present study introduces several innovations in the design and understanding of B i F e O 3 m / S r T i O 3 n p thin film multilayers. First, we provide a comprehensive mapping of thickness ratios r, ranging from 0 to 1.16, and periodicities p, from 1 to 3, which reveals previously unreported performance optima. Second, we establish quantitative structure–property relationships by correlating tetragonality (c/a), grain size, and piezoelectric response (d33), thereby defining design rules for optimizing multilayer ferroelectrics. The results demonstrated that optimal multilayer properties were achieved at specific values of r. XRD analysis confirmed that all films crystallized in a rhombohedral structure, with no detectable impurity phases. AFM characterization of the surface morphology and ferroelectric properties showed that the grain size decreased as the thickness ratio r increased. Electrical characterization revealed that the multilayer thin films exhibited significantly lower leakage current densities compared to those of pure BFO films, with the best performance observed in multilayers with optimized STO thickness and a periodicity of three periods. The piezoelectric coefficient d33 was found to increase with grain size, c/a ratio, and thickness ratio r. Optimal ferroelectric properties achieved included a coercive field Ec = 238 kV/cm, piezoelectric coefficient d33 = 52 pm/V, and leakage current density J = 6.13 A/cm2 at −400 kV/cm. Leakage current mechanism analysis indicated that at low electric fields (E < 100 kV/cm), the dominant mechanism was ohmic conduction, whereas at high electric fields (E > 100 kV/cm), Fowler–Nordheim (F-N) tunneling became the prevailing conduction process. The multilayers exhibited robust ferroelectric behavior, as evidenced by well-defined butterfly loops in the piezoresponse measurements. The optimized structures demonstrated here hold significant potential for applications in MEMS actuators and sensors, where high piezoelectric response and reliable thin film performance are critical.

Author Contributions

Conceptualization, J.V.M., F.J.F.-R., E.C. and D.C.R.; methodology, J.V.M., E.C.-G., F.J.F.-R. and E.C.; software, F.J.F.-R. and E.C.; validation, C.A.H.-G., G.V.G. and F.R.-Z.; formal analysis, J.V.M., F.J.F.-R., E.C. and D.C.R.; investigation, J.V.M., F.J.F.-R., E.C., E.C.-G. and D.C.R.; resources, F.J.F.-R., E.C. and E.C.-G.; data curation, J.V.M., F.J.F.-R., E.C. and D.C.R.; writing—original draft preparation, J.V.M.; writing—review and editing, J.V.M. and D.C.R.; visualization, J.V.M., F.J.F.-R., E.C., E.C.-G., C.A.H.-G. and D.C.R.; supervision, J.V.M., F.J.F.-R., E.C., E.C.-G., C.A.H.-G. and D.C.R.; project administration, E.C. and D.C.R. All authors have read and agreed to the published version of the manuscript.

Funding

This research received no external funding.

Data Availability Statement

Data are contained within the article.

Acknowledgments

This work has been carried out at Universidad Michoacana de San Nicolás de Hidalgo, Instituto Nacional de Investigaciones Nucleares, and Benemérita Universidad Autónoma de Puebla.

Conflicts of Interest

The research was conducted in the absence of any commercial or financial relationships that could be construed as a potential conflict of interest.

References

  1. Liang, X.; Chen, H.; Sun, N. Magnetoelectric materials and devices. APL Mater. 2021, 9, 041114. [Google Scholar] [CrossRef]
  2. Khomskii, D.I. Multiferroics: Different ways to combine magnetism and ferroelectricity. J. Magn. Magn. Mater. 2006, 306, 1–8. [Google Scholar] [CrossRef]
  3. Fiebig, M. Revival of the magnetoelectric effect. J. Phys. D Appl. Phys. 2005, 38, R123–R152. [Google Scholar] [CrossRef]
  4. Bersuker, I.B. Origin of Perovskite Multiferroicity and Magnetoelectric-Multiferroic Effects—The Role of Electronic Spin in Spontaneous Polarization of Crystals. Magnetochemistry 2022, 8, 9. [Google Scholar] [CrossRef]
  5. Deng, X.; Zeng, Z.; Xu, R.; Qin, X.; Li, X.; Wang, Y.; Gao, R.; Wang, Z.; Chen, G.; Cai, W.; et al. Effect of annealing atmosphere on structural and multiferroic properties of BiFeO3 thin film prepared by RF magnetron sputtering. J. Mater. Sci. Mater. Electron. 2019, 30, 16502–16509. [Google Scholar] [CrossRef]
  6. Michel, C.; Moreau, J.M.; Achenbach, G.D.; Gerson, R.; James, W.J. The atomic structure of BiFeO3. Solid State Commun. 1969, 7, 701–704. [Google Scholar] [CrossRef]
  7. Nan, C.W.; Bichurin, M.I.; Dong, S.; Viehland, D.; Srinivasan, G. Multiferroic magnetoelectric composites: Historical perspective, status, and future directions. J. Appl. Phys. 2008, 103, 031101. [Google Scholar] [CrossRef]
  8. Wang, J.; Neaton, J.B.; Zheng, H.; Nagarajan, V.; Ogale, S.B.; Liu, B.; Viehland, D.; Vaithyanathan, V.; Schlom, D.G.; Waghmare, U.V.; et al. Epitaxial BiFeO3 multiferroic thin film heterostructures. Science 2008, 299, 1719–1722. [Google Scholar] [CrossRef]
  9. Lebeugle, D.; Colson, D.; Forget, A.; Viret, M. Very large spontaneous electric polarization in BiFeO3 single crystals at room temperature and its evolution under cycling fields. Appl. Phys. Lett. 2007, 91, 022907. [Google Scholar] [CrossRef]
  10. Liu, H.; Wang, X. Large electric polarization in BiFeO3 film prepared via a simple sol-gel process. J. Sol-Gel Sci. Technol. 2008, 47, 154–157. [Google Scholar] [CrossRef]
  11. Reddy, V.A.; Dabra, N.; Hundal, J.S.; Pathak, N.P.; Nath, R. Structural and multiferroic characteristics of nanocomposite Ba0.5Sr0.5TiO3-Bi0.9La0.1Fe0.9Mn0.1O3 thin film heterostructures. Sci. Adv. Mater. 2014, 6, 1043–1051. [Google Scholar] [CrossRef]
  12. Martin, L.W.; Crane, S.P.; Chu, Y.H.; Holcomb, M.B.; Gajek, M.; Huijben, M.; Yang, C.H.; Balke, N.; Ramesh, R. Multiferroics and magnetoelectrics: Thin films and nanostructures. J. Phys. Condens. Matter 2008, 20, 434220. [Google Scholar] [CrossRef]
  13. Catalan, G.; Scott, J.F. Physics and applications of bismuth ferrite. Adv. Mater. 2009, 21, 2463–2485. [Google Scholar] [CrossRef]
  14. Zhao, X.; Liu, H.Y.; Pan, X.; Wang, L.X.; Feng, Z.; Guo, X.; Shen, P.; Ma, Z.; Zhang, F.; Tian, Q.; et al. Effect of the thickness of Sr2Bi4Ti5O18 transition layer on the properties of BiFeO3/Sr2Bi4Ti5O18 bilayer composite thin films. Ceram. Int. 2020, 46, 10536–10544. [Google Scholar] [CrossRef]
  15. Qi, X.; Dho, J.; Tomov, R.; Blamire, M.G.; MacManus-Driscoll, J.L. Greatly reduced leakage current and conduction mechanism in aliovalent-ion-doped BiFeO3. Appl. Phys. Lett. 2005, 86, 062903. [Google Scholar] [CrossRef]
  16. Wang, Y.P.; Zhou, L.; Zhang, M.F.; Chen, X.Y.; Liu, J.M.; Liu, Z.G. Room-temperature saturated ferroelectric polarization in BiFeO3 ceramics synthesized by rapid liquid phase sintering. Appl. Phys. Lett. 2004, 84, 1731–1733. [Google Scholar] [CrossRef]
  17. Clark, S.J.; Robertson, J. Band gap and Schottky barrier heights of multiferroic BiFeO3. Appl. Phys. Lett. 2007, 90, 10–13. [Google Scholar] [CrossRef]
  18. Singh, S.K.; Ishiwara, H.; Maruyama, K. Room temperature ferroelectric properties of Mn-substituted BiFeO3 thin films deposited on Pt electrodes using chemical solution deposition. Appl. Phys. Lett. 2006, 88, 262908. [Google Scholar] [CrossRef]
  19. Yun, K.Y.; Ricinschi, D.; Kanashima, T.; Okuyama, M. Enhancement of electrical properties in polycrystalline BiFeO3 thin films. Appl. Phys. Lett. 2006, 89, 192902. [Google Scholar] [CrossRef]
  20. Ranjith, R.; Prellier, W.; Cheah, J.W.; Wang, J.; Wu, T. dc leakage behavior and conduction mechanism in (BiFeO3)m(SrTiO3)m superlattices. Appl. Phys. Lett. 2008, 92, 232905. [Google Scholar] [CrossRef]
  21. Khan, M.A.; Comyn, T.P.; Bell, A.J. Leakage mechanisms in bismuth ferrite-lead titanate thin films on PtSi substrates. Appl. Phys. Lett. 2008, 92, 072908. [Google Scholar] [CrossRef]
  22. Ranjith, R.; Kundys, B.; Prellier, W. Periodicity dependence of the ferroelectric properties in BiFeO3 SrTiO3 multiferroic superlattices. Appl. Phys. Lett. 2007, 91, 222904. [Google Scholar] [CrossRef]
  23. Zhou, N.; Zhao, K.; Liu, H.; Lu, H.B.; He, M.; Zhao, S.; Leng, W.; Wang, A.; Huang, Y.; Jin, K.J.; et al. Enhanced photovoltage in perovskite-type artificial superlattices on Si substrates. J. Phys. D Appl. Phys. 2008, 41, 155414. [Google Scholar] [CrossRef]
  24. Zheng, R.Y.; Gao, X.S.; Zhou, Z.H.; Wang, J. Multiferroic BiFeO3 thin films deposited on SrRuO3 buffer layer by rf sputtering. J. Appl. Phys. 2007, 101, 054104. [Google Scholar] [CrossRef]
  25. Chung, C.F.; Lin, J.P.; Wu, J.M. Influence of Mn and Nb dopants on electric properties of chemical-solution-deposited BiFeO3 films. Appl. Phys. Lett. 2006, 88, 242909. [Google Scholar] [CrossRef]
  26. Lee, Y.H.; Wu, J.M.; Lai, C.H. Influence of La doping in multiferroic properties of BiFeO3 thin films. Appl. Phys. Lett. 2006, 88, 042903. [Google Scholar] [CrossRef]
  27. Yasui, S.; Uchida, H.; Nakaki, H.; Nishida, K.; Funakubo, H.; Koda, S. Analysis for crystal structure of Bi(Fe,Sc)O3 thin films and their electrical properties. Appl. Phys. Lett. 2007, 91, 022906. [Google Scholar] [CrossRef]
  28. Palkar, V.R.; Kundaliya, D.C.; Malik, S.K. Effect of Mn substitution on magnetoelectric properties of bismuth ferrite system. J. Appl. Phys. 2003, 93, 4337–4339. [Google Scholar] [CrossRef]
  29. Kim, J.K.; Kim, S.S.; Kim, W.J.; Bhalla, A.S.; Guo, R. Enhanced ferroelectric properties of Cr-doped BiFeO3 thin films grown by chemical solution deposition. Appl. Phys. Lett. 2006, 88, 132901. [Google Scholar] [CrossRef]
  30. Pabst, G.W.; Martin, L.W.; Chu, Y.H.; Ramesh, R. Leakage mechanisms in BiFeO3 thin films. Appl. Phys. Lett. 2007, 90, 072902. [Google Scholar] [CrossRef]
  31. Shin, J.; Goyal, A.; Jesse, S.; Heatherly, L. Polarization manipulation via orientation control in polycrystalline BiFeO3 thin films on biaxially textured, flexible metallic tapes. Appl. Phys. Express 2011, 4, 021501. [Google Scholar] [CrossRef]
  32. Jiang, Q.; Lee, H.J.; Kim, G.H.; Hwang, C.S. The inlaid AI2O3 tunnel switch for ultrathin ferroelectric films. Adv. Mater. 2009, 21, 2870–2875. [Google Scholar] [CrossRef]
  33. Lee, H.J.; Park, M.H.; Kim, Y.J.; Hwang, C.S.; Kim, J.H.; Funakubo, H.; Ishiwara, H. Improved ferroelectric property of very thin Mn-doped BiFeO3 films by an inlaid Al2O3 tunnel switch. J. Appl. Phys. 2011, 110, 074111. [Google Scholar] [CrossRef]
  34. Lee, G.; Fuentes-Fernandez, E.M.A.; Lian, G.; Katiyar, R.S.; Auciello, O. Hetero-epitaxial BiFeO3/SrTiO3 nanolaminates with higher piezoresponse performance over stoichiometric BiFeO3 films. Appl. Phys. Lett. 2015, 106, 022905. [Google Scholar] [CrossRef]
  35. Garduño-Medina, A.; Flores-Ruiz, F.J.; Camps, E.; García-Zaldívar, O.; Pérez-Rodríguez, F. Coercive field modified via partial ion substitution, mechanical load and charge injection in (Ba, Ta, Cr) doped BiFeO3 films. Ceram. Int. 2023, 49, 31046–31056. [Google Scholar] [CrossRef]
  36. Tiron, V.; Jijie, R.; Dumitru, I.; Cimpoesu, N.; Burducea, I.; Iancu, D.; Borhan, A.; Gurlui, S.; Bulai, G. Piezo-ferroelectric response of bismuth ferrite based thin films and their related photo/piezocatalytic performance. Ceram. Int. 2023, 49, 20304–20314. [Google Scholar] [CrossRef]
  37. Dai, Y.Q.; Dai, J.M.; Tang, X.W.; Zhang, K.J.; Zhu, X.B.; Yang, J.; Sun, Y.P. Thickness effect on the properties of BaTiO3-CoFe2O4 multilayer thin films prepared by chemical solution deposition. J. Alloys Compd. 2014, 587, 681–687. [Google Scholar] [CrossRef]
  38. Arulraj, A. Enhanced photoconductive response of ZnO thin films with the impact of annealing temperatures on structural and optical properties. Sci. Rep. 2025, 15, 28851. [Google Scholar] [CrossRef]
  39. Gupta, S.; Tomar, M.; James, A.R.; Gupta, V. Ce-doped bismuth ferrite thin films with improved electrical and functional properties. J. Mater. Sci. 2014, 49, 5355–5364. [Google Scholar] [CrossRef]
  40. Singh, V.R.; Dixit, A.; Garg, A.; Agrawal, D.C. Effect of heat treatment on the structure and properties of chemical solution processed multiferroic BiFeO3 thin films. Appl. Phys. A Mater. Sci. Process. 2008, 90, 197–202. [Google Scholar] [CrossRef]
  41. Simões, A.Z.; Riccardi, C.S.; Santos, M.L.D.; Garcia, F.G.; Longo, E.; Varela, J.A. Effect of annealing atmosphere on phase formation and electrical characteristics of bismuth ferrite thin films. Mater. Res. Bull. 2009, 44, 1747–1752. [Google Scholar] [CrossRef]
  42. Cole, M.W.; Ngo, E.; Hubbard, C.; Hirsch, S.G.; Ivill, M.; Sarney, W.L.; Zhang, J.; Alpay, S.P. Enhanced dielectric properties from barium strontium titanate films with strontium titanate buffer layers. J. Appl. Phys. 2013, 114, 164107. [Google Scholar] [CrossRef]
  43. Bersuker, G.; Yum, J.; Vandelli, L.; Padovani, A.; Larcher, L.; Iglesias, V.; Porti, M.; Nafría, M.; McKenna, K.; Shluger, A.; et al. Grain boundary-driven leakage path formation in HfO2 dielectrics. Solid-State Electron. 2011, 65–66, 146–150. [Google Scholar] [CrossRef]
  44. Mudinepalli, V.R.; Feng, L.; Lin, W.C.; Murty, B.S. Effect of grain size on dielectric and ferroelectric properties of nanostructured Ba0.8Sr0.2TiO3 ceramics. J. Adv. Ceram. 2015, 4, 46–53. [Google Scholar] [CrossRef]
  45. Lee, S.Y.; Tseng, T.Y. Electrical and dielectric behavior of MgO doped Ba0.7Sr0.3TiO3 thin films on Al2O3 substrate. Appl. Phys. Lett. 2002, 80, 1797–1799. [Google Scholar] [CrossRef]
  46. Li, J.; Sha, N.; Zhao, Z. Effect of annealing atmosphere on the ferroelectric properties of inkjet printed BiFeO3 thin films. Appl. Surf. Sci. 2018, 454, 233–238. [Google Scholar] [CrossRef]
  47. Yousfi, S.; El Marssi, M.; Bouyanfif, H. Impedance spectroscopy and conduction mechanism of a BiFe0.95Mn0.05O3 thin film. Thin Solid Film. 2021, 724, 138616. [Google Scholar] [CrossRef]
  48. Tsurumaki, A.; Yamada, H.; Sawa, A. Impact of Bi deficiencies on ferroelectric resistive switching characteristics observed at p-type schottky-like Pt/Bi1-δFeO3 interfaces. Adv. Funct. Mater. 2012, 22, 1040–1047. [Google Scholar] [CrossRef]
  49. Qiao, H.; Kwon, O.; Kim, Y. Electrostatic effect on off-field ferroelectric hysteresis loop in piezoresponse force microscopy. Appl. Phys. Lett. 2020, 116, 172901. [Google Scholar] [CrossRef]
  50. Jiang, J.; Bitla, Y.; Huang, C.W.; Do, T.H.; Liu, H.J.; Hsieh, Y.H.; Ma, C.H.; Jang, C.Y.; Lai, Y.H.; Chiu, P.W.; et al. Flexible ferroelectric element based on van der Waals heteroepitaxy. Sci. Adv. 2017, 3, e1700121. [Google Scholar] [CrossRef]
  51. Fujino, S.; Murakami, M.; Anbusathaiah, V.; Lim, S.-H.; Nagarajan, V.; Fennie, C.J.; Wuttig, M.; Salamanca-Riba, L.; Takeuchi, I. Giant Ferroelectric Polarization and Piezoelectricity in Sm-Doped Epitaxial BiFeO3 Thin Films. Appl. Phys. Lett. 2008, 92, 202904. [Google Scholar] [CrossRef]
  52. Chen, J.; Tang, Z.; Zhao, S. Giant Magnetoelectric Coupling Effect in Lead-Free Perovskite BiFeO3/Na0.5Bi4.5Ti4O15 Composite Films. J. Alloys Compd. 2017, 712, 256–262. [Google Scholar] [CrossRef]
  53. Li, Y.; Yang, Z.; Chen, Y.; Zhang, Z.; Tang, Y.-L.; Smith, M.; Lindley, M.; Cao, X.; Hopkinson, D.G.; Bell, A.J.; et al. Bulk Ferroelectric Heterostructures for High Temperature Lead-Free Piezoelectrics. arXiv 2023, arXiv:2307.09673. [Google Scholar]
  54. Tuluk, A.; van der Zwaag, S. Exploring the BiFeO3-PbTiO3-SrTiO3 Ternary System to Obtain Good Piezoelectrical Properties at Low and High Temperatures. Materials 2023, 16, 6840. [Google Scholar] [CrossRef]
Figure 1. Schematic diagram of the Au/BFO/STO/ITO/quartz deposition process: (a) cleaned substrate surface, (b) deposition of the ITO bottom electrode, (c) deposition of the STO layer with variable thickness (n), (d) deposition of the BFO layer with variable thickness (m) over the STO layer, (e) subsequent STO layers with variable thickness (n) over the BFO layer, followed by (f) another BFO layer with variable thickness (m), repeating for additional periods (g), and (h) final deposition of top Au electrodes for electrical testing.
Coatings 15 01170 g001
Figure 2. XRD diffraction patterns of the BFO/STO multilayer thin films deposited on ITO-coated quartz substrates demonstrate phase identification, peak evolution with thickness ratio. Sharp reflections at (012), (104), (110), (006), (202), and (024) correspond to the rhombohedral BiFeO3 phase. Blue asterisks mark the ITO electrode layer peaks; green crossings mark the cubic SrTiO3 layers. (a) 2θ = 20°–60°, (b) XRD profile from 22.2° to 24°, and (c) lattice distortion c/a dependent on the thickness ratio r.
Coatings 15 01170 g002
Figure 3. Surface morphology and grain size evolution in [(BiFeO3)m/(SrTiO3)n]p multilayer films as a function of layer thickness ratio r and stacking period p. (ad): 5 µm × 5 µm atomic force microscopy topography maps for four representative thickness ratios: r = 0 (a), 0.32 (b), 0.27 (c) and 0.45 (d). Each height map is shown with its own z-scale. (e) Quantitative grain size analysis extracted from AFM images for films with 1 period (black circles), 2 periods (blue circles), and 3 periods (red circles). The average grain diameter is plotted versus r.
Coatings 15 01170 g003
Figure 4. Leakage–current analysis of BiFeO3/SrTiO3 multilayers showing the impact of layer thickness ratio r and stacking period p on electrical insulation. The subplots (ac) correspond to multilayers constructed with 1, 2, and 3 stacking periods, respectively. Within each plot, J-E curves for various thickness ratios are compared against a pure BiFeO3 reference film (r = 0). The insets highlight the leakage current density at a constant field of −400 kV/cm, revealing that an optimal thickness ratio exists for each stacking period that minimizes current leakage. Specifically, the lowest leakage current was achieved for r = 0.30, r = 0.73, and r = 0.66 for p = 1, 2, and 3, respectively, indicating a clear dependence of the insulating behavior on the multilayer architecture.
Coatings 15 01170 g004
Figure 5. Double-logarithmic plots of current density log (J) versus electric field log (E) for BiFeO3/SrTiO3 (BFO/STO) multilayer thin films with different periodicities: (a) one period, (b) two periods, and (c) three periods. The slopes (α) extracted from the linear regions indicate different conduction mechanisms. For α ≈ 1, ohmic conduction dominates, whereas higher values (α > 2) are associated with trap-filled space-charge-limited conduction (SCLC).
Coatings 15 01170 g005
Figure 6. J–E characteristics of BFO/STO multilayer films with (a) one, (b) two, and (c) three periods. All samples exhibit ohmic conduction, with current density decreasing as the STO layer thickness ratio (r) and the number of periods increase, demonstrating effective leakage suppression by the STO barriers.
Coatings 15 01170 g006
Figure 7. Plots of log (J/AT2) vs. E1/2 of the STO/BFO heterostructures per STO to BFO thickness ratio and period. (ac) show the Schottky plots of log(J/T2) versus E1/2 for samples with 1, 2, and 3 periods, respectively. The linear relationship observed in the high-field region of these plots is characteristic of thermionic emission over a Schottky barrier. The red dashed lines represent linear fits to the data, from which the optical dielectric constant ( ε r ) is extracted for each sample configuration. (df) present the Poole-Frenkel plots of log(J/E) versus E1/2 for the same sets of samples. A linear trend in these coordinates is indicative of Poole-Frenkel emission, a bulk-limited conduction mechanism involving field-assisted thermal excitation of trapped charge carriers.
Coatings 15 01170 g007
Figure 8. Plots of ln (J/E2) vs. 1/E of the STO/BFO heterostructures with different STO to BFO thickness ratios (r) and periods. (a) Pure BFO (0) and 1 Period r = 0.30 (red), r = 0.32 (green) and r = 1.16 (blue). Introducing STO layers reduces leakage, shifting curves downward; (b) 2 Periods r = 0.27 (cyan), r = 0.35 (magenta), r = 0.51 (dark yellow) and r = 0.73 (navy); (c) 3 Periods r = 0.45 (purple), r = 0.57 (wine) and r = 0.66 (olive).
Coatings 15 01170 g008
Figure 9. Off-field hysteretic loops for amplitude and phase on (a) BFO, (b,c) one, (dg) two, and (hj) three BFO/STO periods.
Coatings 15 01170 g009
Figure 10. Experimental Ec values obtained on (a) one, (b) two, and (c) three BFO/STO periods.
Coatings 15 01170 g010
Figure 11. PFM phase maps from regions in the BFO/STO film where a max volt of +20 V and a min of −20 V were applied. (a) Pure BFO film without STO insertion. Inner yellow dashed square written with −20 V and outer blue dashed square written with +40 V; (b) BFO/STO with ratio 0.30. Inner yellow dashed square written with −11 V and outer blue dashed square written with +11 V. Switching requires a lower voltage compared to pure BFO, suggesting easier polarization switching due to STO influence; (c) BFO/STO with ratio 0.32. Inner yellow dashed square written with −11 V and outer blue dashed square written with +11 V. Switching requires the same voltage compared to 0.30 system, but a better contrast is shown suggesting easier polarization switching; (d) BFO/STO with ratio 1.16. Inner yellow dashed square written with −13 V and outer blue dashed square written with +13 V. Switching requires a higher voltage compared to 0.32, suggesting less easier polarization switching; (e) BFO/STO with ratio 0.27. Inner yellow dashed square written with −14 V and outer blue dashed square written with +14 V. Switching requires a higher voltage compared to 0.32, suggesting less easier polarization switching; (f) BFO/STO with ratio 0.35. Inner yellow dashed square written with −13 V and outer blue dashed square written with +13 V; (g) BFO/STO with ratio 0.51. Inner yellow dashed square written with −20 V and outer blue dashed square written with +20 V; (h) BFO/STO with ratio 0.73. Inner yellow dashed square written with −20 V and outer blue dashed square written with +20 V; (i) BFO/STO with ratio 0.45. Inner yellow dashed square written with -18 V and outer blue dashed square written with +18 V; (j) BFO/STO with ratio 0.57. Inner yellow dashed square written with −17 V and outer blue dashed square written with +17 V; (k) BFO/STO with ratio 0.66. Inner yellow dashed square written with −20 V and outer blue dashed square written with +20 V.
Coatings 15 01170 g011
Figure 12. (a) Piezoelectric coefficient d33 as a function of the thickness ratio r for one, two, and three periods. (b) Piezoelectric coefficient d33 as a function of the c/a ratio for one, two, and three periods. (c) Piezoelectric coefficient d33 as a function of the grain size for one, two, and three periods.
Coatings 15 01170 g012
Table 1. The variations in structural parameters, including the lattice constants “a” and “c”, the c/a distortion ratio, unit cell volume, crystallite size, Bi-O bond length, and O-Fe-O bond angle for BFO/STO thin films as a function of the thickness ratio r and period.
1 Period
SampleTotal Thickness (nm) ± 2.59 nmIndividual (m/n) nm ± 2.59 nmCrystallite Size (nm) ± 0.02a = b (Å)c (Å)c/aV (A3)Bi-O Bond (Å)O-Fe-O Angle (°)Ec (kV/cm)
BFO (0)25025053.785.57313.8382.483369.861.00101.00295
BFO/STO (0.30)4837 nm/11 nm 5.55613.7912.482368.682.6388.29870
BFO/STO (0.32)9873 nm/25 nm44.115.56113.6992.463365.462.00138.00446
BFO/STO (1.16)9544 nm/51 nm 5.56913.8342.484371.462.2590.02405
2 Periods
SampleTotal thickness(nm) ± 2.59 nmIndividual (m/n) nm ± 2.59 nmCrystallite size (nm) ± 0.02a = b (Å)c (Å)c/aV (A3)Bi-O bond (Å)O-Fe-O angle (°)Ec (kV/cm)
BFO/STO (0.27)9437 nm/10 nm 5.58613.8272.475373.732.5489.44666
BFO/STO (0.35)10037 nm/13 nm 5.57513.8192.479371.962.2789.38458
3 Periods
SampleTotal thickness(nm) ± 2.59 nmIndividual (m/n) nm ± 2.59 nmCrystallite size (nm) ± 0.02a = b (Å)c (Å)c/aV (A3)Bi-O bond (Å)O-Fe-O angle (°)Ec (kV/cm)
BFO/STO (0.45)16137 nm/17 nm 5.57213.7382.466369.441.68118.50238
Table 2. Summary of leakage current, microstructure, and piezoelectric response in BiFeO3/SrTiO3 multilayer films as a function of layer thickness ratio r and stacking period p.
1 Period
rJ (A/cm2) (−100 kV/cm)J (A/cm2) (−400 kV/cm)Grain size (nm)Surface Roughness (nm)d33 (pm/V)
015.0758.27191.406.7
0.301.738.64161.302.755.55 ± 1.49
0.325.7321.74102.407.350.67 ± 0.86
1.167.8729.7467.475.737.45 ± 0.37
2 Periods
rJ (A/cm2) (−100 kV/cm)J (A/cm2) (−400 kV/cm)Grain size (nm)Surface Roughness (nm)d33 (pm/V)
0.274.2716.53137.506.450.51 ± 0.49
0.358.3334.0075.972.847.23 ± 0.57
0.3810.1340.67103.50 50.30 ± 0.39
0.514.6716.8076.584.139.52 ± 0.51
0.732.039.4458.21 45.29 ± 0.69
3 Periods
rJ (A/cm2) (−100 kV/cm)J (A/cm2) (−400 kV/cm)Grain size (nm)Surface Roughness (nm)d33 (pm/V)
0.456.1323.47143.45.452.00 ± 1.21
0.577.0727.6078.962.541.98 ± 0.47
0.664.5319.7485.422.854.18 ± 0.40
Table 3. Comparison of reported piezoelectric coefficients d33 in BiFeO3-based materials, including thin films, multilayers, nanolaminates, composite films, and bulk ceramics. The table highlights the range of measurement techniques used in the literature, distinguishing between local values obtained by piezoresponse force microscopy (PFM) in thin films and effective macroscopic values measured by the Berlincourt method in ceramics.
System/CompositionType of MaterialMeasurement MethodReported d33Reference
[(BiFeO3)m/(SrTiO3)n]p multilayers (this work)Multilayer thin filmPFM (local d33,eff)30–56 pm/V (max 55.55 pm/V)This study
Stoichiometric BiFeO3 filmsThin filmPFM (d33,eff)~70 pm/V; 68.9 pm/V[8]
Sm-doped BiFeO3 filmsEpitaxial thin filmPFM~110 pm/V[51]
BFO/STO/BFO nanolaminatesNanolaminate heterostructurePFM~331 pm/V[34]
BiFeO3/Na0.5Bi4.5Ti4O15 compositesComposite thin filmPFM~285 pm/V[52]
BiFeO3–BaTiO3 ceramicsBulk ceramicBerlincourt (macroscopic)~115 pm/V[53]
BiFeO3–PbTiO3–SrTiO3 ceramicsBulk ceramic (ternary system)Berlincourt (macroscopic)Up to 250 pm/V[54]
Disclaimer/Publisher’s Note: The statements, opinions and data contained in all publications are solely those of the individual author(s) and contributor(s) and not of MDPI and/or the editor(s). MDPI and/or the editor(s) disclaim responsibility for any injury to people or property resulting from any ideas, methods, instructions or products referred to in the content.