Article

Understanding the Correlations Between the Formation of Columnar Structures and Suspension Properties for Suspension Plasma-Sprayed Thermal Barrier Coatings

1
Department of Mechanical and Electrical Engineering, Ocean University of China, Qingdao 266404, China
2
Department of Materials, University of Manchester, Manchester M13 9PL, UK
3
School of Intelligent Manufacturing and Control Engineering, Shandong Institute of Petroleum and Chemical Technology, Dongying 257061, China
4
Qingdao Yongzhao New Material Science & Technology Co., Ltd., Qingdao 266061, China
*
Author to whom correspondence should be addressed.
Coatings 2025, 15(10), 1132; https://doi.org/10.3390/coatings15101132
Submission received: 11 August 2025 / Revised: 17 September 2025 / Accepted: 19 September 2025 / Published: 1 October 2025

Abstract

Columnar-structured thermal barrier coatings deposited via the suspension plasma spray process have attracted significant attention due to their long thermal cycling life and high cost-effectiveness. In this work, the effects of suspension properties, including solvent type, viscosity, and particle size, on the formation of different coating microstructures were investigated via a comparative study. Two different kinds of solvents (water and ethanol) and particles of different sizes (D50 = 0.45 μm and 1.2 μm) were used to prepare suspensions for coating deposition, respectively. When using suspensions containing small-sized particles as feedstock, coatings deposited from the ethanol-based suspension showed columnar microstructures with inter-column crevices, while the water-based suspension resulted in cracked–columnar microstructures, showing a mixture of columns and cracks. When the large-sized particles were used to prepare the suspension, both the ethanol-based suspension and the water-based suspension resulted in homogeneous coating microstructures. The formation mechanism of different microstructures was investigated by modelling the diverted plasma jet and the in-flight particle movement during the impingement period. Particles smaller than 2 μm were strongly affected by the diverted plasma gas, showing obvious oblique impinging trajectories, while particles larger than 3 μm kept their original trajectories and impinged on the substrate orthogonally. The formation mechanism of different microstructures was elaborated by analyzing the impinging trajectories of particles transitioning from different suspensions.

1. Introduction

Thermal barrier coatings (TBCs) serve as important protection layers on the hot section components of turbine engines at high temperatures. The TBCs generally consist of the ceramic topcoat, thermally grown oxide layer, and bond coat [1,2]. The working condition of ceramic topcoats is the most rigorous, which includes high temperature, thermal cycling, hot corrosion, and sand erosion, etc. The most commonly used material for the topcoat is 7–8 wt% yttria-stabilized zirconia (YSZ) due to its high melting point, low thermal conductivity, and high strength and stability to resist corrosion and erosion. Atmospheric plasma spray (APS) and electron beam physical vapor deposition (EB-PVD) are two industrialized techniques to deposit the YSZ coatings on hot section components [3]. The APS process shows advantages of high deposition rate and cost-effectiveness, and is capable of large area deposition. YSZ powders in the size of 20 to 120 μm are used as feedstock in the APS process, which are heated and accelerated in the plasma jet [4,5]. The molten or partially molten YSZ powders impinge on the substrate and accumulate, forming coatings with typical lamellar microstructures, inter-splat boundaries, pores, and cracks [6]. This kind of microstructure endows the coatings with high thermal insulation, while the thermal cycling resistance is low. The EB-PVD process is well known for depositing densely packed columnar microstructures with narrow inter-column gaps. The columnar microstructures provide high strain tolerance and thereby elevate the thermal cycling resistance of the topcoats. However, in contrast to the APS process, the EB-PVD process also faces many limitations, among which the high equipment cost, low deposition rate, and limited high-vacuum interior space are the most representative [7].
In contrast to the APS process, the suspension plasma spray (SPS) process is capable of depositing columnar-structured coatings. Furthermore, the process is more cost-effective and rapid than the EB-PVD process [8,9]. The suspension, which is generally prepared by mixing very fine particles, solvents, and dispersants, is used as feedstock in the SPS process. The suspension injected into the plasma jet, either in the form of a stream or atomized mist, experiences complex interactions with the plasma, which include aerodynamic breakup, solvent evaporation, particle agglomeration, sintering, and melting [10,11]. Fine particles in the size range of submicrons to several microns are thereby formed, which impinge on the substrate, forming finely structured coatings [12]. Different than the APS coatings built by the large-sized powder (20 to 120 μm), the SPS coatings are constructed by the very fine particles, providing a high feasibility to form unique microstructures by controlling the deposition behavior of the fine particles. Many researchers have reported the deposition of TBCs with unique microstructures via the SPS process, such as the vertically cracked coatings [13,14], columnar-structured coatings [15,16], multilayered coatings [17,18], and composite coatings [19].
The columnar-structured TBCs are representative of the successful application of the SPS process, which shows high thermal insulation and excellent thermal cycling resistance. The formation of columnar microstructures and the morphological characteristics of the columnar structures are dependent on many factors, which mainly include the suspension properties, spray parameters, and substrate roughness [20,21,22,23]. The spraying parameters, including torch power, plasma gas types, and flow rate, suspension injection angles, suspension feed rate, and standoff distance, have significant effects on the coating microstructures. As reported by A. Ganvir et al., a low torch power, small plasma gas flow rate, and large suspension feed rate resulted in highly porous coatings without apparent columnar structures [24]. In contrast, a high torch power, large plasma gas flow rate, and small suspension feed rate enhanced the aerodynamic breakup and heating of suspensions, resulting in feathery-like columns with narrow crevices [24]. R.C. Seshadri et al. systematically investigated the effect of torch power, plasma gas flow rate, standoff distance, suspension injection angle, raster speed, and substrate temperature on the coating microstructures. The results showed that different combinations of spraying parameters resulted in various kinds of microstructures, including dense columns, feathery columns, fan-like columns, and segmented lamellar microstructures [23]. B. Bernard et al. showed that the change in spraying parameters affected the growth directions (normal or parallel to the substrate) of microstructures in the SPS process. A large torch moving speed, low plasma enthalpy, or large suspension feed rate enhanced the lateral growth of the microstructures and resulted in compact columnar structures [25].
Compared to the change in multiple spraying parameters, tailoring the suspension properties to control the formation of columnar structures is a facile method. A. Ganvir et al. investigated the effects of solvent type on the coating microstructures. The results showed that the atomized suspension droplets of the water-based suspension and ethanol/water mixture-based suspension had much higher momentum than those of the ethanol-based suspension [26]. Columnar-structured coatings were formed using the ethanol-based suspension, while the water-based suspension and ethanol/water mixture-based suspension resulted in vertically cracked coatings [26]. P. Xu et al. prepared a new water-based suspension with low surface tension (25.44 mN/m) by adding surfactant. Coatings deposited using the new water-based suspension showed typical columnar microstructures with narrow inter-column crevices of 0.5–2 μm and a porosity of 15.6%, which were distinctly different than the homogeneous microstructures deposited using conventional water-based suspension [27]. N. Curry investigated the effects of original particle size, solvent type, and solid loading on the coating microstructures. The results showed that the change in suspension properties resulted in different coatings [28]. The suspension prepared using water and fine particles (size of 45 nm) resulted in coatings with vertical and horizontal cracks, which had a high thermal conductivity of 1.2 W·m−1·k−1 and a short thermal cycling life of 150 cycles. In contrast, the suspension prepared using ethanol and medium-sized particles (size of 500 nm) resulted in columnar-structured coatings, which had a low thermal conductivity of 1.05 W·m−1·k−1 and a long thermal cycling life of ~370 cycles [28].
As reported in the literature, suspensions with different compositions and properties injected into the plasma jet transitioned to different atomized droplets, depending on their interactions with the plasma. The atomized suspension droplets resulted in different in-flight particles, and the formation of different microstructures was closely related to the movement of particles during the impingement [29,30]. However, capturing the trajectories of particles is extremely difficult, especially during the impingement period. Modelling provides an easy way to investigate the movement of fine particles in the SPS process. M. Jadidi et al. established a plasma jet model with suspension injection. The particles with very small Stokes numbers (St = 0.1) decelerated dramatically and followed the gas streamlines, which impinged on the substrate at a large radial distance from the center [31]. J. Oberste-Berghaus et al. modelled the plasma gas flow and investigated the velocity change in particles with different sizes and densities. The modelling work indicated that the small and light particles readily followed the plasma gas flow [32]. G. Mauer developed models of plasma gas flow and particle trajectories, and proved that the rarefaction must be considered for the modelling of the SPS process. The corrected Stokes number of particles was calculated along particle trajectories, which provided a more accurate basis for the explanation of the formation of columnar structures [33].
In terms of tailoring suspension properties to obtain different microstructures, there is still a lack of quantitative investigation on the movement of particles transitioned from the suspensions and the correlations between the particle movement and coating microstructures. Therefore, the effects of suspension properties on coating microstructures were investigated by depositing coatings using suspensions with different solvents and particles in this work. Numerical models of plasma jet and in-flight particles were established to investigate particle movement during the impinging period. The coating formation mechanism was quantitatively elaborated by correlating with the movement of particles of different sizes.

2. Materials and Methods

2.1. Materials

The substrates used in the SPS process were sandblasted 304 stainless steel disks with a diameter of 20 mm and a thickness of 3 mm. Since this work mainly focused on the effects of suspension properties on the coating microstructures, the YSZ coatings were directly deposited on the stainless steel substrate without a bond coat. Two kinds of YSZ particles with different sizes were used to prepare the suspension, which were referred to as fine particles and coarse particles in the discussion below. The particle size was measured by a laser diffraction analyzer (BT-9300ST, Dandong Bettersize Instruments Ltd., Dandong, China), as shown in Figure 1a,c. The fine particles (VK-R50Y3, Xuancheng Jingrui New Materials Co., Xuancheng, China) had a median particle size (D50) of ~0.45 μm and a narrow particle size distribution ranging from ~0.3 μm to ~2 μm. In contrast, the coarse particles (PZ-201, Harbin Peize Materials Technology Corp., Harbin, China) showed a median size (D50) of ~1.2 μm and a much broader particle size distribution ranging from ~0.2 μm to ~10 μm. This indicated that the coarse particles contained particles in both small and large sizes. As shown in Figure 1b,d, most fine particles showed irregular morphologies and a very small size. Some fine particles were agglomerated together, forming relatively larger aggregates. The coarse particles showed quasi-spherical morphologies, and the particles were much larger than those of the fine particles.
Pure ethanol and distilled water were used as the solvents for the suspensions. The solid loading of suspensions was determined as 20 wt%, which was a commonly used value in the literature [12,13]. Polyethyleneimine (PEI) solution (E107078, molecular weight 1800, Aladdin Scientific Corp., Shanghai, China) was used as a dispersant to alleviate the agglomeration of particles and stabilize the suspensions. Different amounts of PEI with respect to the mass of particles were added to the suspension, followed by the measurement of suspension viscosity. The optimized PEI amount was determined when the suspension viscosity reached the minimum (reported in Section 3.1). In summary, the 20 wt% particles and 80 wt% solvent were first mixed thoroughly, and then the PEI dispersant was added to the particle/solvent mixture in the suspension preparation procedure. Four types of suspensions with the same solid loading of 20 wt% were prepared by using different particles and solvents. The designations of the four types of suspensions and the resultant coatings are summarized in Table 1. For instance, the F-E suspension was referred to as the suspension prepared using fine particles and ethanol solvent, and the coatings deposited using the F-E suspension were referred to as the F-E coating. The suspensions were continuously stirred before and during the SPS process by a magnetic stirrer to ensure stability and uniformity.

2.2. Coating Deposition Process

The SPS process was conducted in an open atmosphere using a plasma spray system (SX-60, Guangzhou Sanxin Metal S&T Corp., Guangzhou, China) equipped with an F4-MB torch. The torch nozzle (inner diameter of 7 mm) was a standard type with a tungsten insert and cooling fins. The plasma gases introduced to the torch were 50 L/min Ar and 10 L/min H2, and the current applied to the torch was 700 A, which resulted in a power of ~42 kW. The suspension was delivered by a peristaltic pump and radially introduced to the plasma jet in the form of a stream through an orifice with an inner diameter of 250 μm. The suspension feed rate was ~28 g/min. The substrates were assembled on a turntable holder, which kept rotating during the SPS process. The torch moved up and down in front of the substrates to deposit coatings on them. The transverse speed of the substrates relative to the torch was set as 1 m/s, and the step size (distance between adjacent deposition passes) was set as 5 mm by adjusting the rotation speed of the turntable and the moving speed of the torch. The substrates were not preheated before spraying. Forty layers of coatings were deposited on the substrates at a standoff distance of 40 mm in the SPS process. Compressed air injected from air knives was used to cool down the samples during the spraying process. The surface temperature of the coatings was measured immediately after deposition using a portable infrared pyrometer, which was about 500 °C to 600 °C.

2.3. Characterization of Suspensions and Coatings

The viscosity of suspensions with different PEI amounts was measured using a viscometer (NDJ-5S, Shanghai Lichen Instruments Technology Corp., Shanghai, China). For the viscosity measurement, a coaxial cylindrical spindle (named as Type 0 Spindle by the manufacturer) was used. The rotation speed of the spindle was 60 RPM, corresponding to a shear rate of about 100 s−1. The viscosity measurement was conducted at room temperature, and the suspension temperature measured by a probe thermometer was about 24 °C. The optimized PEI amount was determined when the suspension viscosity reached a minimum. Then, the surface tension of suspensions with the optimized PEI amount was measured via the pendant droplet method, which was reported in the literature [34,35]. In brief, the suspension was filled in a syringe, and the piston was pressed gently, forming a pendant droplet attached to the syringe needle. The images of the pendant droplet were captured by a camera, and the key geometric dimensions were obtained via image analysis, which were used to calculate the surface tension of the suspension (reported in detail in Section 3.1). The density of the optimized suspensions was measured using a density meter (LMH-3002, Shanghai Lichen Instruments Technology Corp., Shanghai, China). The zeta potential of the optimized suspensions was measured by a zeta potential analyzer (Zetasizer Nano ZS90, Malvern Instruments Ltd., Worcestershire, UK) using diluted (0.06 wt%) suspensions.
The crystalline phases of coatings deposited using different suspensions were analyzed by X-ray diffraction (XRD, D Max-2500, Rigaku Corp., Tokyo, Japan) combined with Rietveld refinement. The scanning speed of the XRD analysis was 1.5°/min, and the scan range was from 15° to 95°. The step size was 0.02°, corresponding to a counting time of 0.8 s. The microstructures of coatings were characterized using a scanning electron microscope (SEM, SU3800, Hitachi Corp., Tokyo, Japan) under an accelerating voltage of 20 kV. The top surface microstructures were directly characterized under the SEM without treatment. For the cross-sectional microstructures, the samples were cut by a sectioning machine and cold-mounted in epoxy. Then, the mounted samples were ground by #320, #600, and #1200 sandpaper consecutively, and were eventually polished using silica suspension with 0.06 µm nominal abrasive size, followed by characterization under the SEM. Based on micrographs, the thickness, porosity, column width, and gap/crevice width of different coatings were obtained via an image analysis method using the open-source software ImageJ (version 1.51). Specifically, for the porosity analysis, the inter-column gaps and the vertical cracks were not considered as pores. The width of columns was measured at half of the coating thickness.

2.4. Modelling of Particle Movement

The coatings deposited using different suspensions showed different microstructures (reported in Section 3.2), which were closely related to the movement of in-flight particles, especially during the impinging period. In order to elaborate on the formation mechanism of different microstructures, it was necessary to investigate the movement of particles. However, capturing the particle movement via experimental methods is extremely difficult due to the high brightness and temperature of the plasma jet, and the small size and high speed of in-flight particles. Therefore, modelling was used in this work. The numerical model consisted of two parts: the plasma jet model and the particle movement model. The plasma jet model was first established, which mainly simulated the impingement of the plasma jet on the substrate. A high-quality 2D quadrilateral structured grid mesh with ~1,600,000 grid cells was established for the plasma jet model. The RNG k-ε turbulent model was used to simulate the plasma jet. The thermophysical properties of plasma gases, including the viscosity, density, specific heat, and thermal conductivity, were acquired from the literature [36]. The key boundary conditions of the temperature and velocity distribution at the torch nozzle exit were obtained following the methods reported in the literature [31,37]. Several assumptions were made for the modelling of the plasma jet: (1) the plasma gas followed the ideal gas law and stayed in a local equilibrium state; (2) the radiation of the plasma jet was neglected; (3) the plasma jet was symmetric; and (4) the thermal conduction between the plasma jet and substrate was not considered. Then, the particle movement was modelled using the results of the plasma jet model as boundary conditions. The thermophysical transitions of the suspension stream in the plasma, including the aerodynamic breakup, solvent evaporation, and melting, were not considered in the model. Fine particles with different sizes were directly used in the model, and their movement under the effect of the plasma jet was simulated. The discrete phase model was used to simulate the particle movement.

3. Results and Discussion

3.1. Suspension Properties

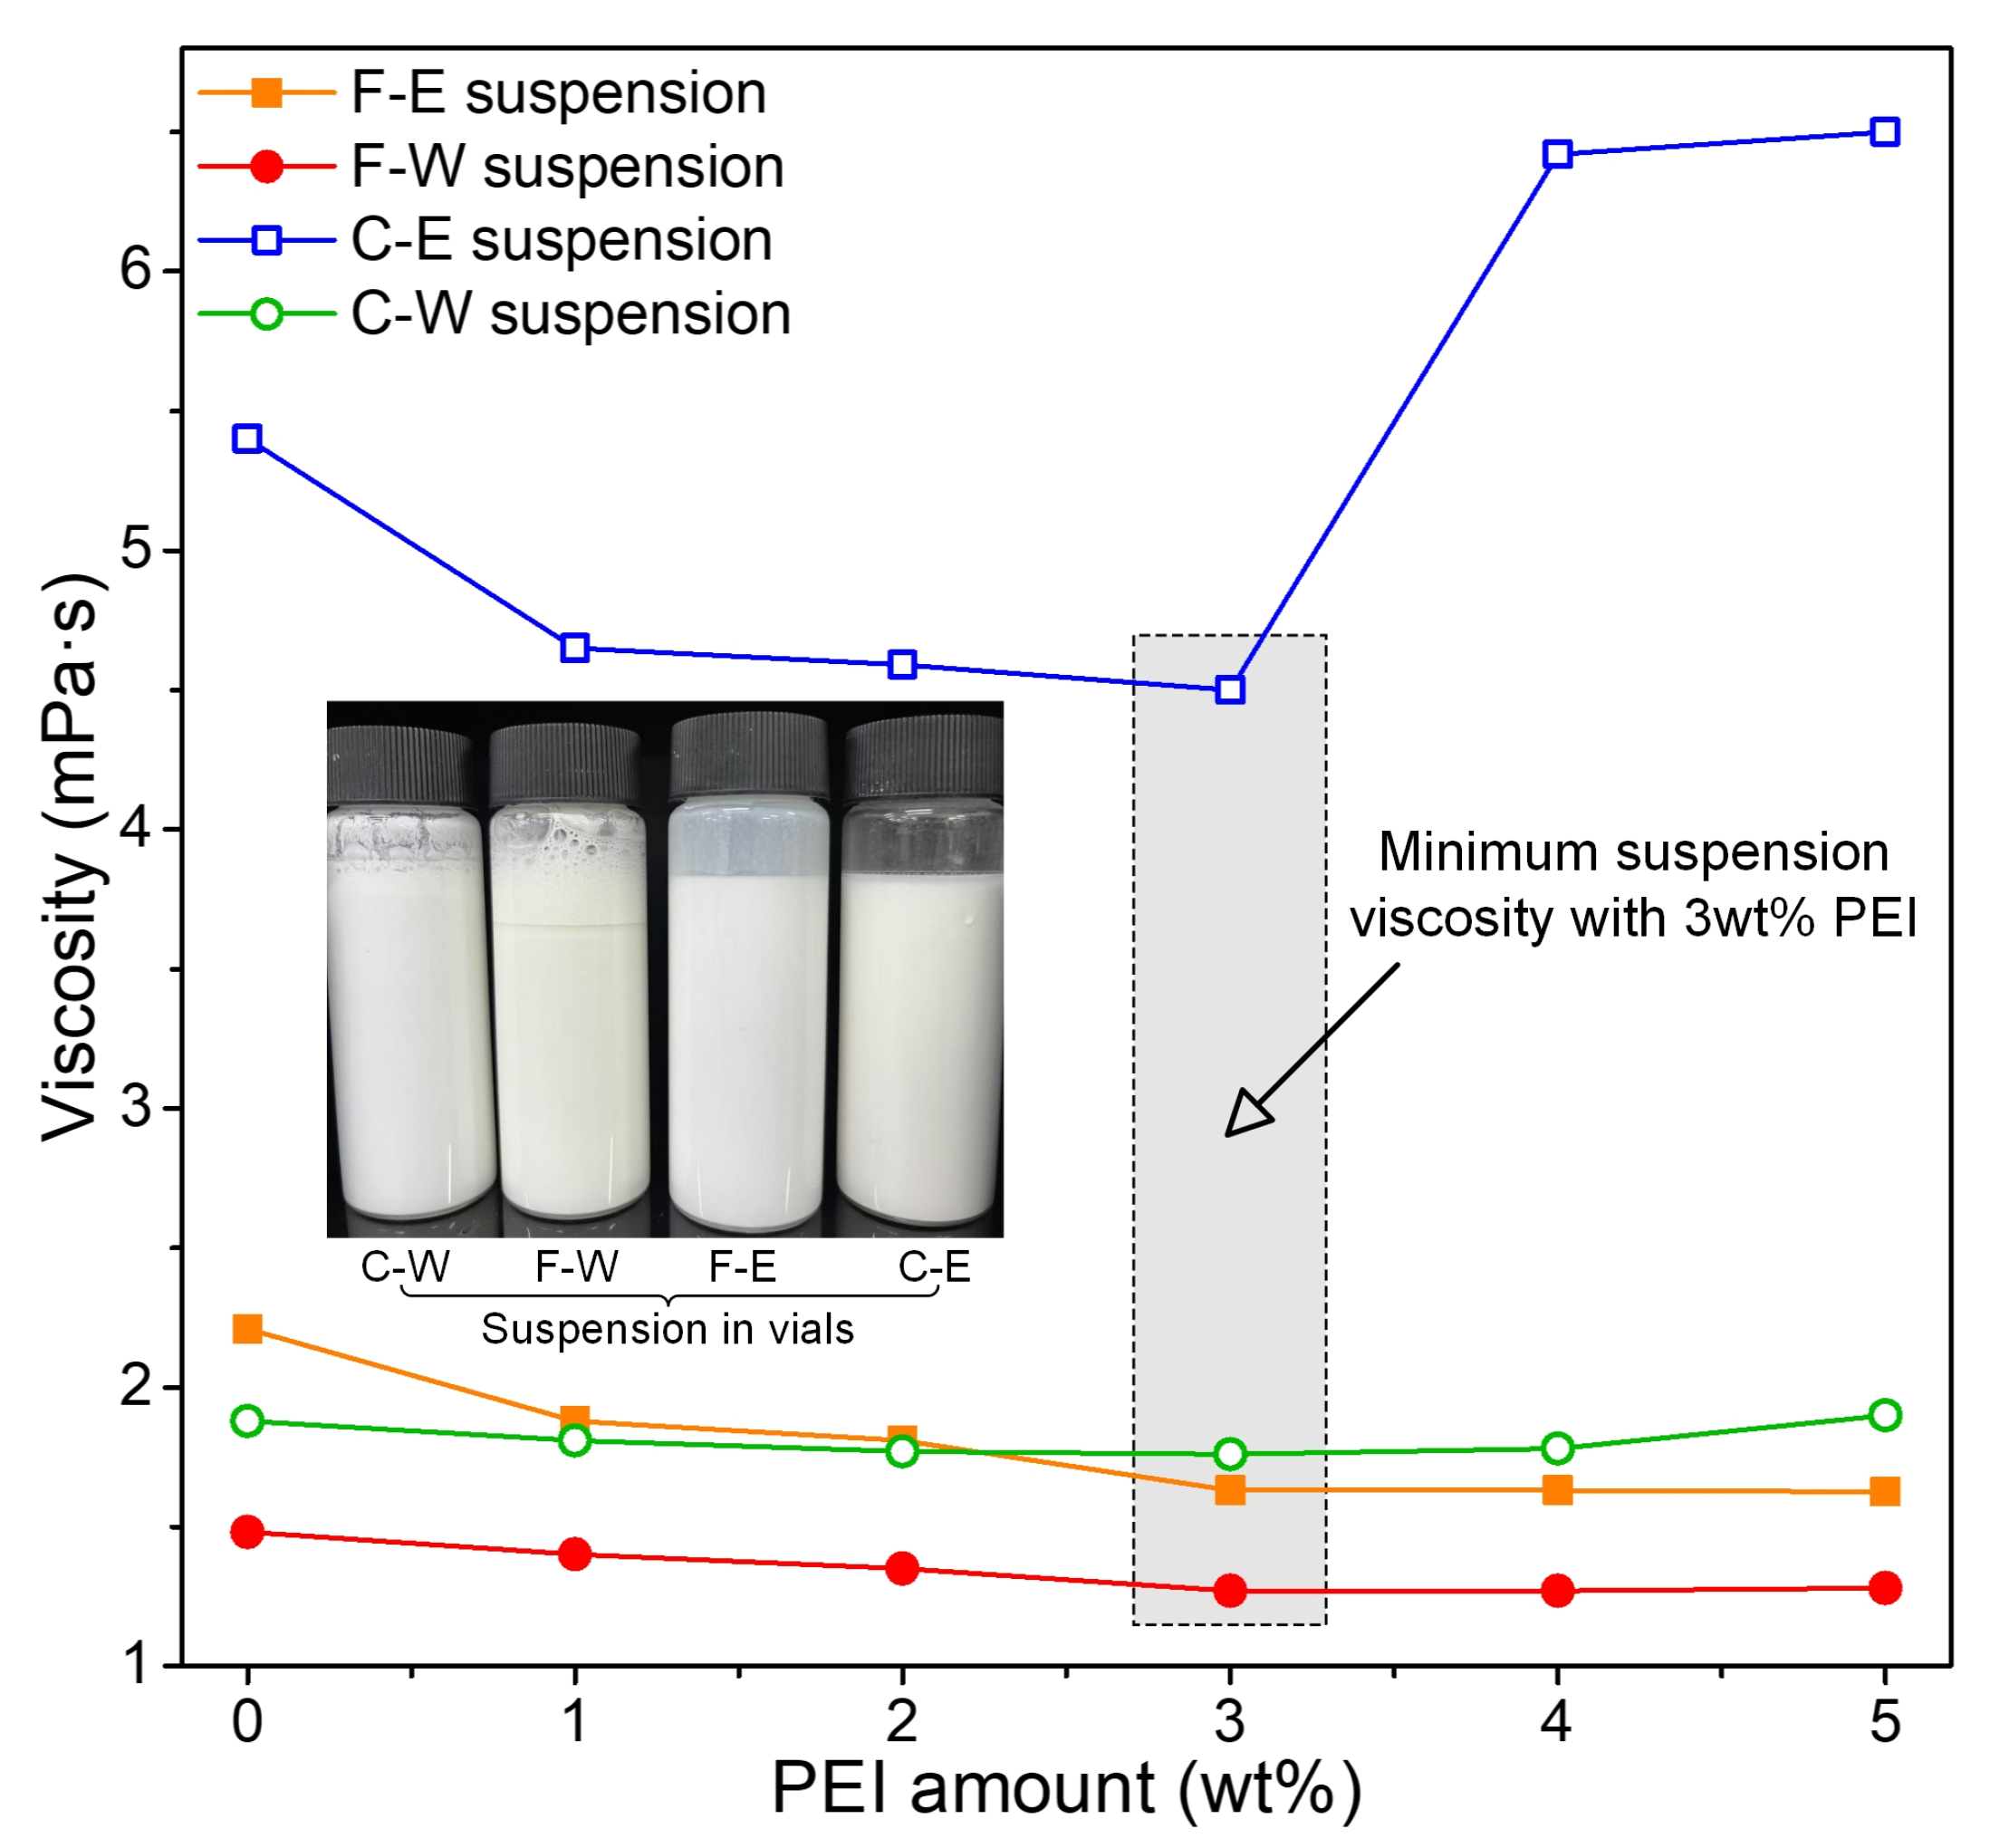
The variations in suspension viscosity with the change in PEI amount are shown in Figure 2. The viscosity was 2.21, 1.48, 5.41, and 1.88 mPa·s for the F-E suspension, F-W suspension, C-E suspension, and C-W suspension without PEI, respectively. With the addition of PEI, the viscosity of different suspensions all decreased and reached a minimum when the PEI amount was 3 wt% with respect to the particle mass. With further addition of PEI, the viscosity of the F-E, F-W, and C-W suspensions remained relatively consistent, while the viscosity of the C-E suspension increased significantly. As the viscosity hindered the aerodynamic breakup of suspension, a small suspension viscosity was preferred in the SPS process. Therefore, the amount of PEI added to the particle/solvent mixture was determined as 3 wt% with respect to the particle mass.
With the optimization of the PEI amount, the compositions of suspension were determined. The suspension was prepared by mixing 20 wt% YSZ particles and 80 wt% solvent first, and then 3 wt% PEI with respect to the particle mass was added to the particle/solvent mixture. The density of suspensions with the optimized PEI amount was 0.916 g/mL, 1.148 g/mL, 0.913 g/mL, and 1.156 g/mL for the F-E, F-W, C-E, and C-W suspensions, respectively. The zeta potential of suspensions with the optimized PEI amount was 36 mV, 25 mV, 10 mV, and 19 mV for the F-E, F-W, C-E, and C-W suspensions, respectively. The suspensions were continuously stirred before and during the SPS process. Additionally, the length of the tube through which the suspension flowed from the container to the plasma jet was only 2 m. Therefore, despite the small zeta potential, the stability and uniformity of the suspension injected into the plasma jet can be guaranteed.
The surface tension of different suspensions was measured and is shown in Figure 3. In the surface tension measurement, the key geometric dimensions, including D, d, and R, were obtained via the analysis of the profile of a pendant droplet, as shown in the inset of Figure 3. The shape factor (β) and surface tension (γ) were calculated using Equations (1) and (2), which are presented as follows:
β = 0.12836 0.7577 d D + 1.7713 d D 2 0.5426 d D 3
γ = ρ g R 2 β
where R is the radius of the curvature at the droplet apex, Δρ is the density difference between the suspension and air, and g is the gravitational acceleration [34,35].
As the surface tension of water was over three times higher than that of ethanol, the solvent had a significant effect on the surface tension of the suspensions. The surface tension of the F-W suspension (61.5 mN/m) and C-W suspension (57.2 mN/m) was significantly higher than that of the F-E suspension (31.0 mN/m) and C-E suspension (24.8 mN/m). In contrast, the effect of particle size on the surface tension was slight. Given the same solvent, suspensions prepared using coarse particles had a smaller surface tension.
The suspension stream injected into the plasma jet experienced aerodynamic breakup, forming a large number of small droplets. The degree of the aerodynamic breakup can be quantified by the Weber number (We), which is presented as follows:
W e = ρ g U 2 d s σ
where ρg is the density of plasma gas at the position where aerodynamic breakup occurs, ΔU is the velocity difference between the plasma gas and the droplets, and ds is the initial droplet size [38,39]. A large We number indicates a more intense aerodynamic breakup process, which results in smaller droplets. In terms of the surface tension of suspension, it acted as a major dampening force in the aerodynamic breakup process [38,39]. Therefore, suspensions with high surface tension would result in larger atomized droplets, while much smaller droplets could be produced by using the low surface tension suspensions. The suspension viscosity was another damping force of the aerodynamic breakup process, and its effect can be quantified by the Ohnesorge (Oh) number [40]. The Oh number is considered when the suspension viscosity is very high. In this work, the effect of viscosity was not considered, as the viscosity of the four suspensions was low.

3.2. Crystalline Phases and Microstructures of Coatings

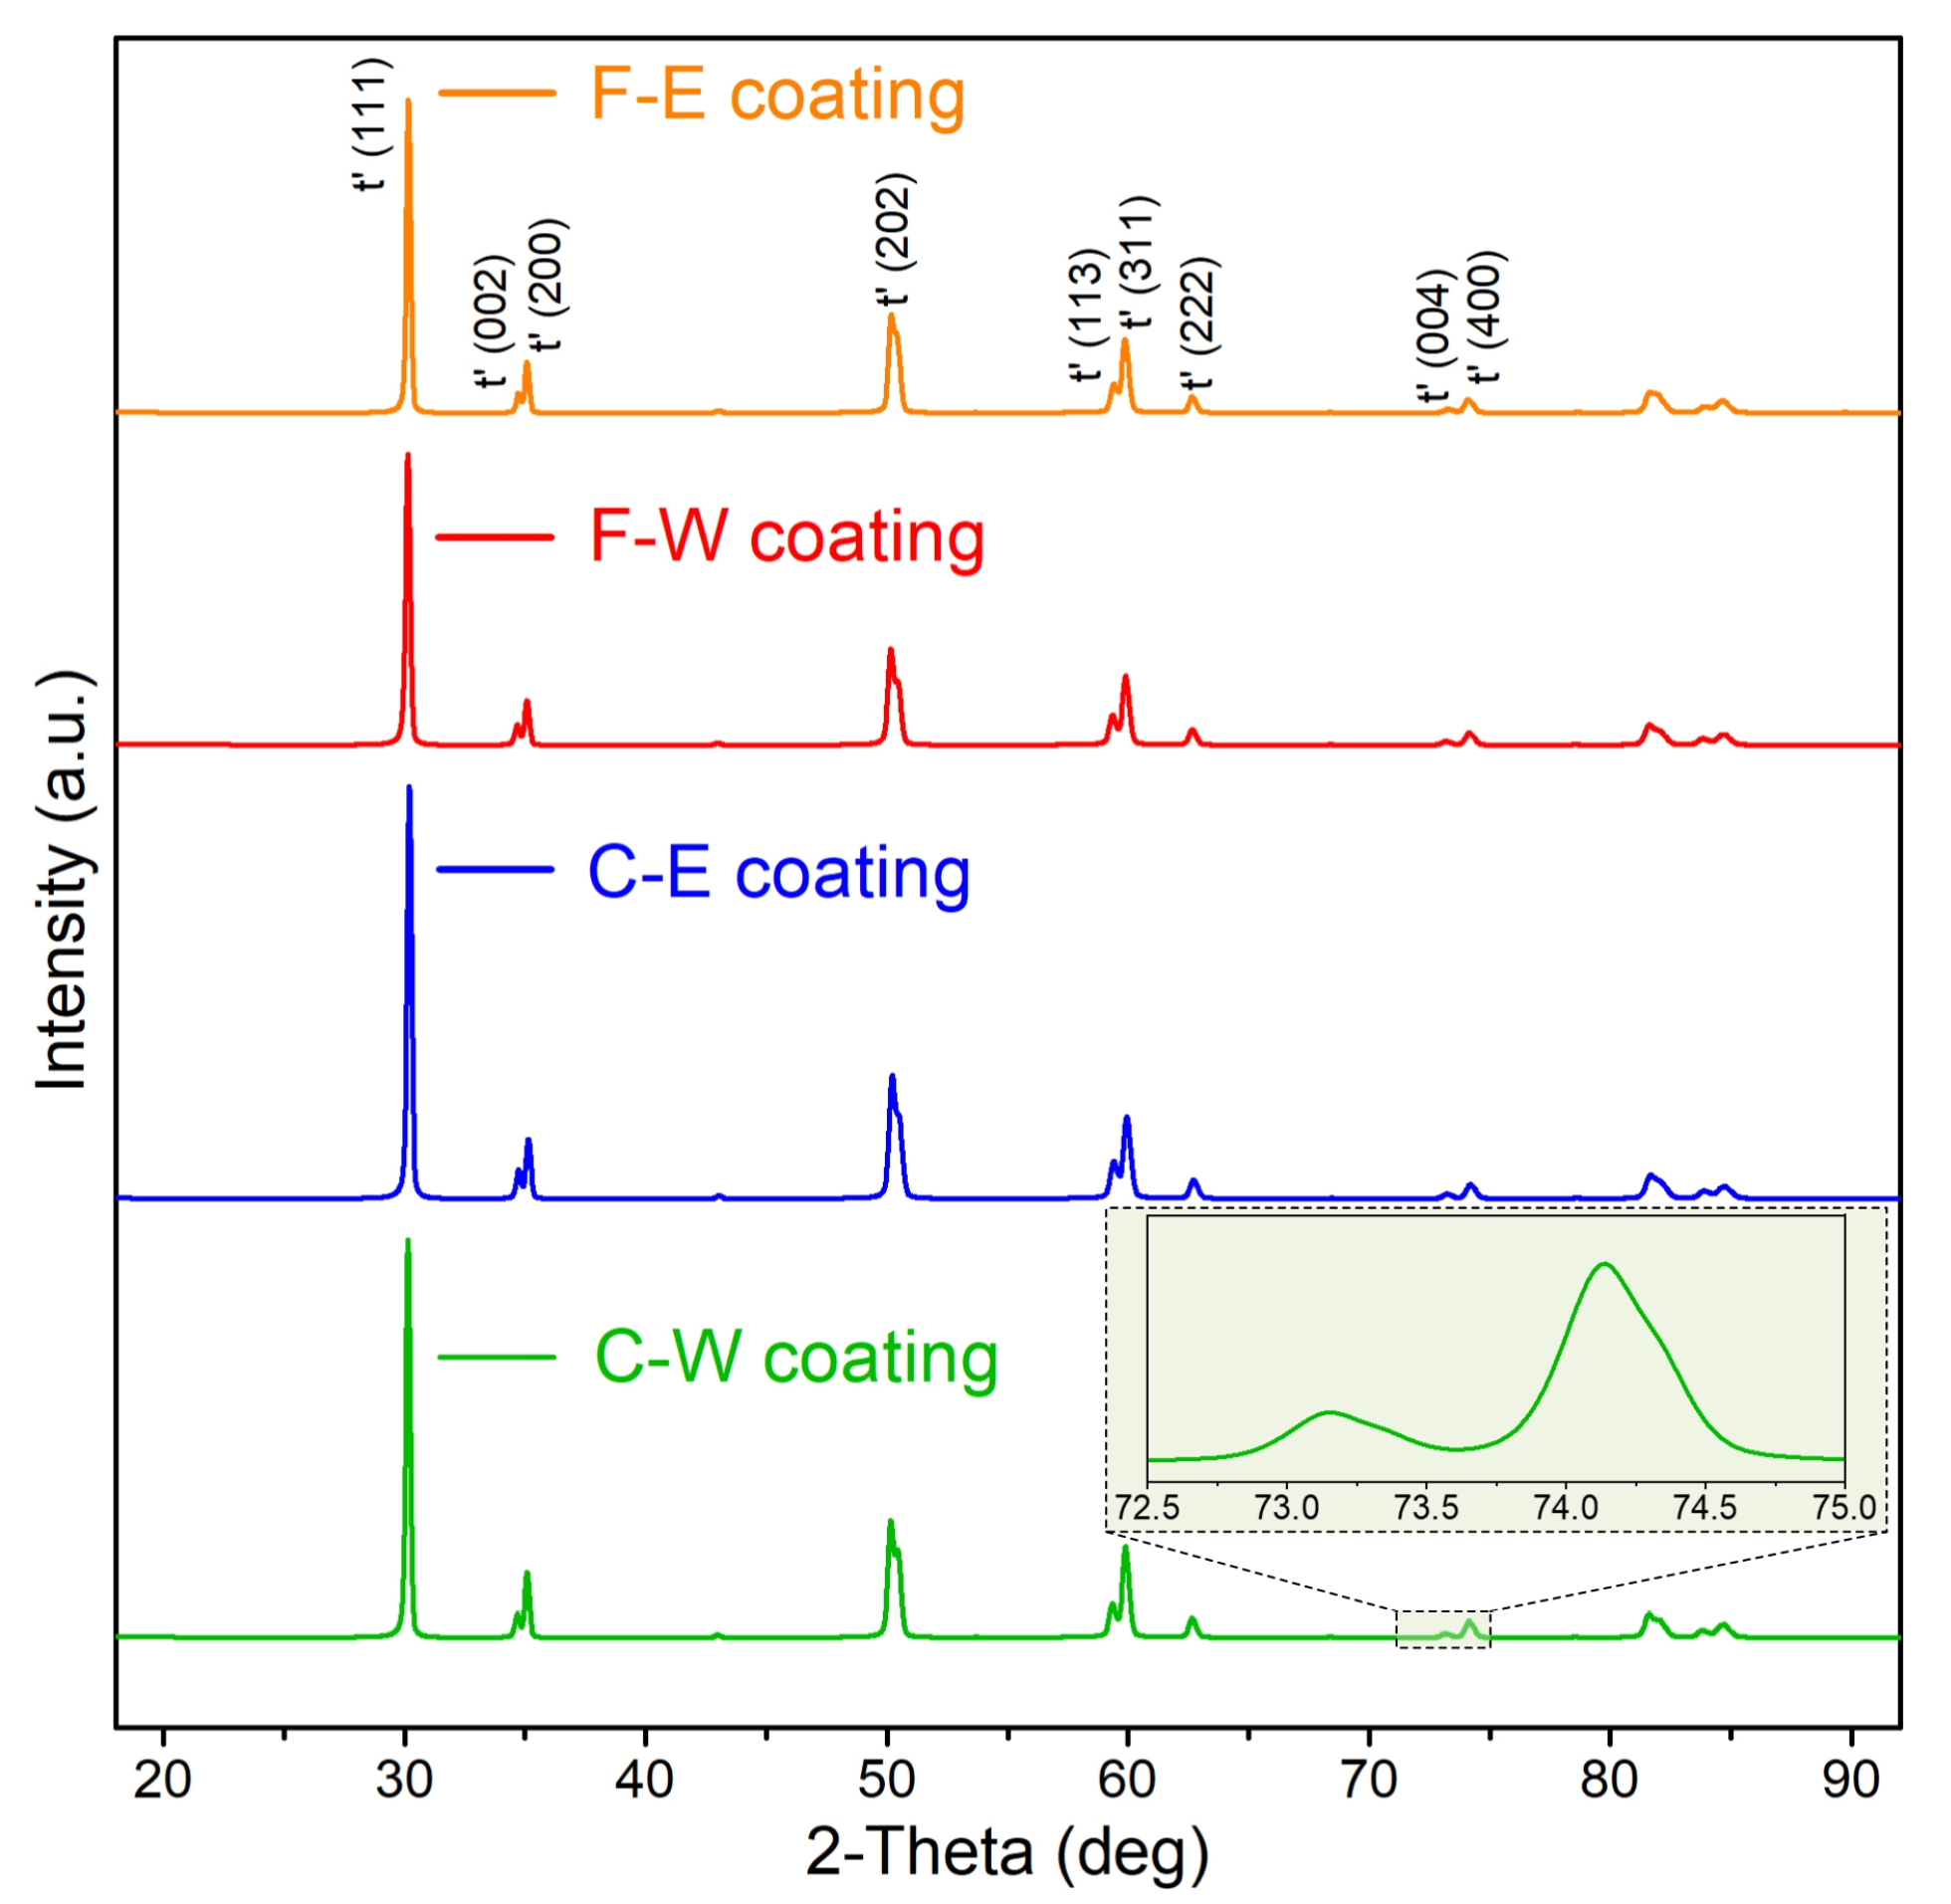
The XRD patterns of coatings deposited using different suspensions are shown in Figure 4. The zirconia of all coatings were all in the metastable tetragonal (t’) phase. This was due to the rapid cooling and solidification of splats and particles, which impinged on the substrate in the SPS process [41,42]. The t’ zirconia phase was preferred for the TBC performance, due to its high stability at high temperature without phase transformation to the monoclinic phase.
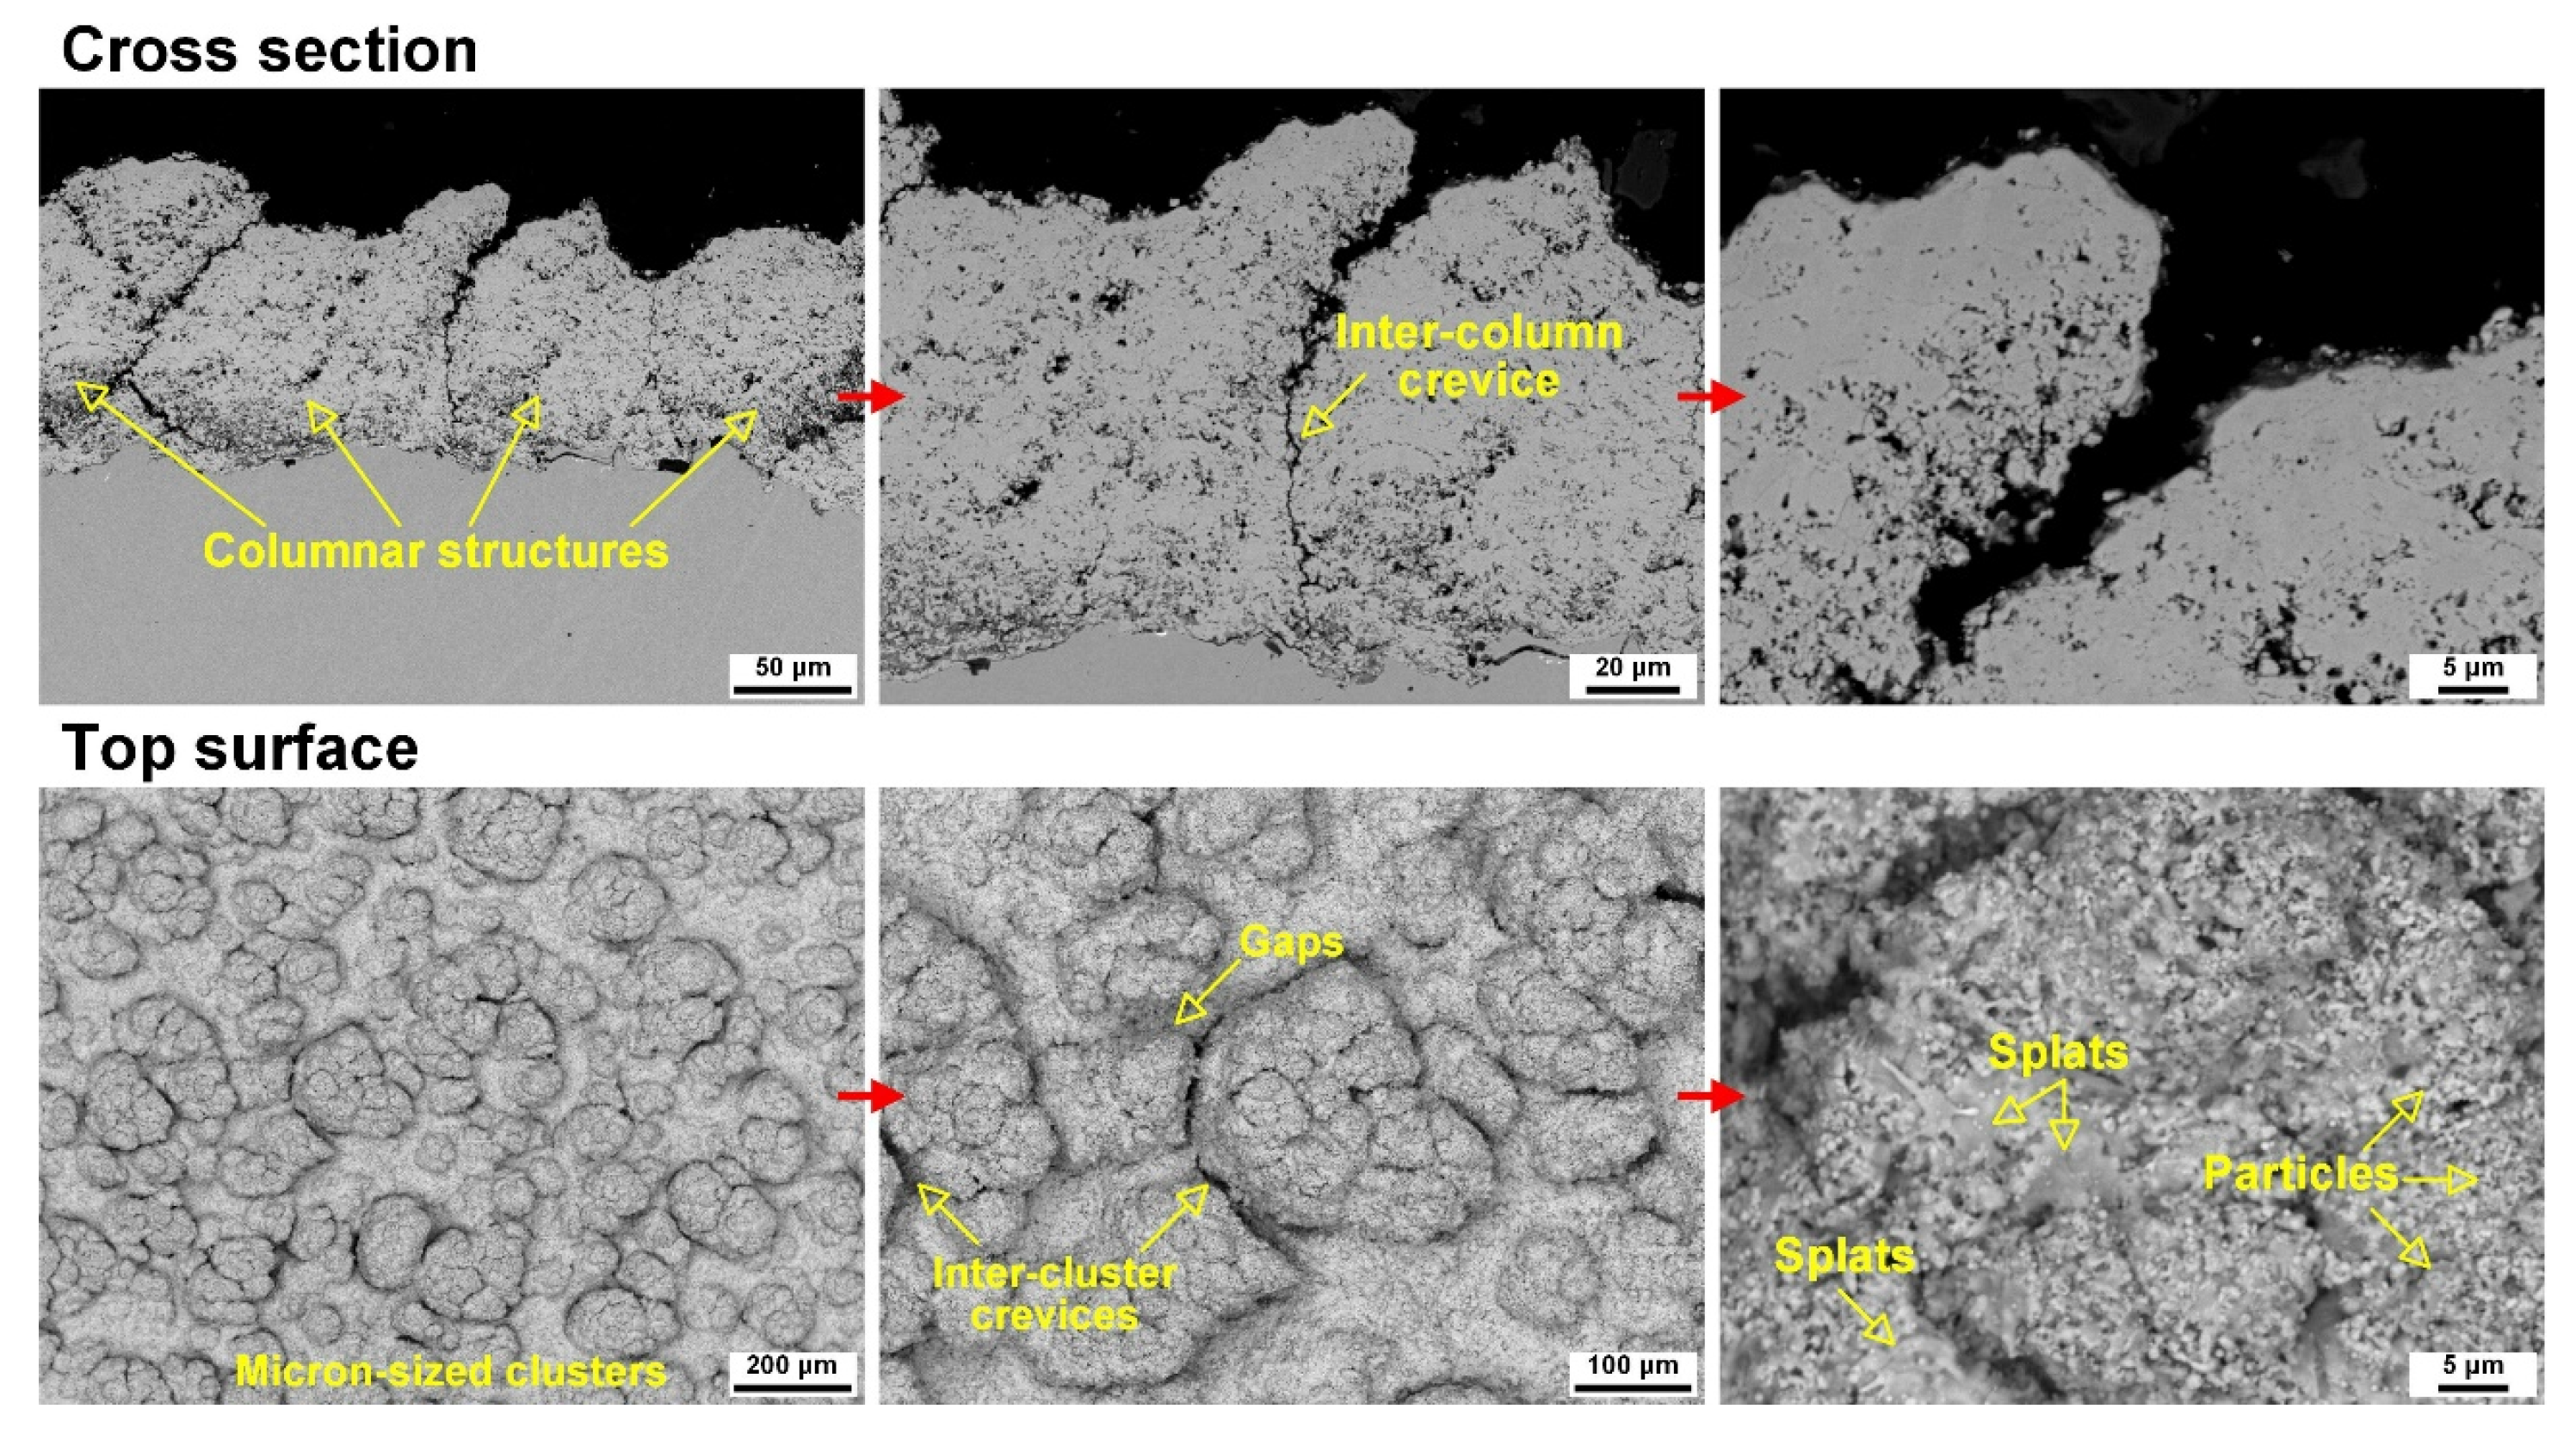
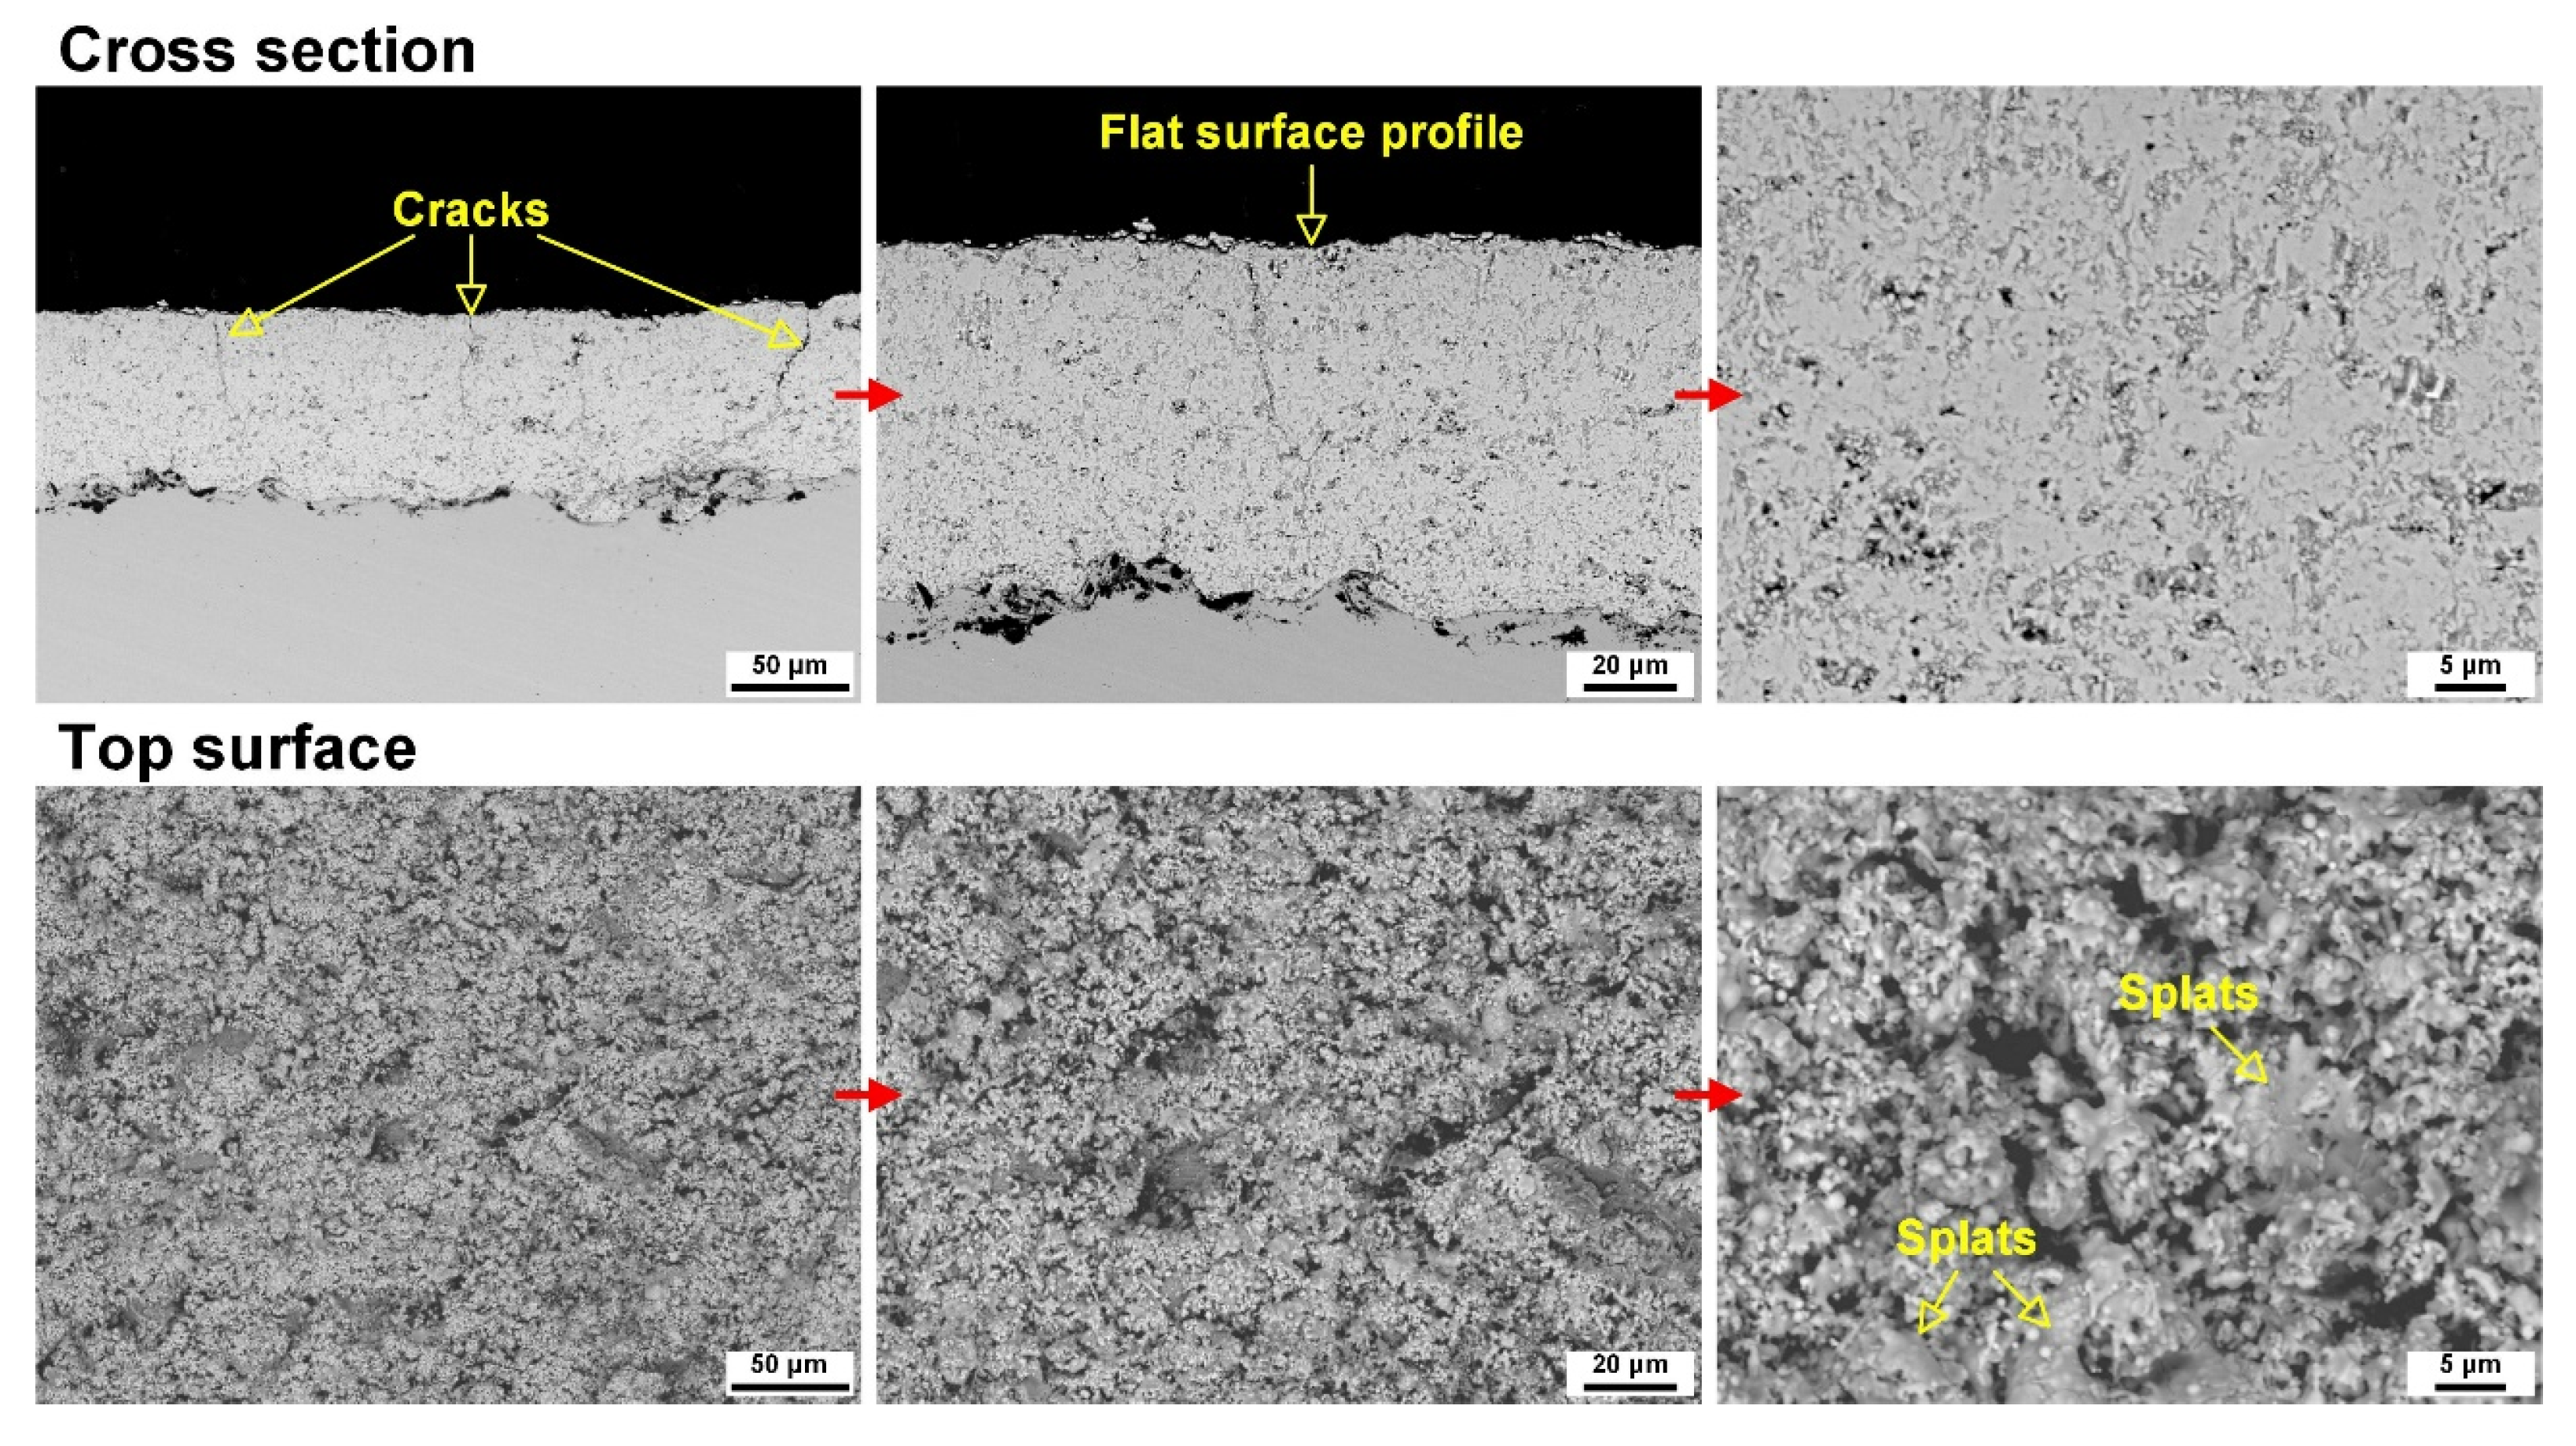
The cross section and top surface microstructures of the F-E coating are shown in Figure 5. Typical columnar structures with inter-column crevices (spacing between 0.8 and 4 μm) were formed, as shown in the cross-sectional micrographs. Due to the existence of columnar structures, the coating thickness differed at different locations, showing a thickness of 110 μm to 130 μm. Very fine pores were formed within the columnar structures and along the inter-column crevices, resulting in a porosity of ~14.65%. The microstructures of coatings deposited via the SPS process were distinctly different than those of the coatings deposited via the conventional APS process, which contained lamellar-shaped splats in sizes of several tens to hundreds of microns, inter-splat boundaries and cracks, and relatively large pores. The top surface of coatings showed spheroidal clusters of different sizes, which corresponded to the columnar structures shown in the cross-sectional micrographs. Obvious crevices and gaps were observed between the clusters. Very fine particles in submicron scales and splats in the size of several microns were formed on the top surface of a single cluster, indicating the finely structured microstructures.
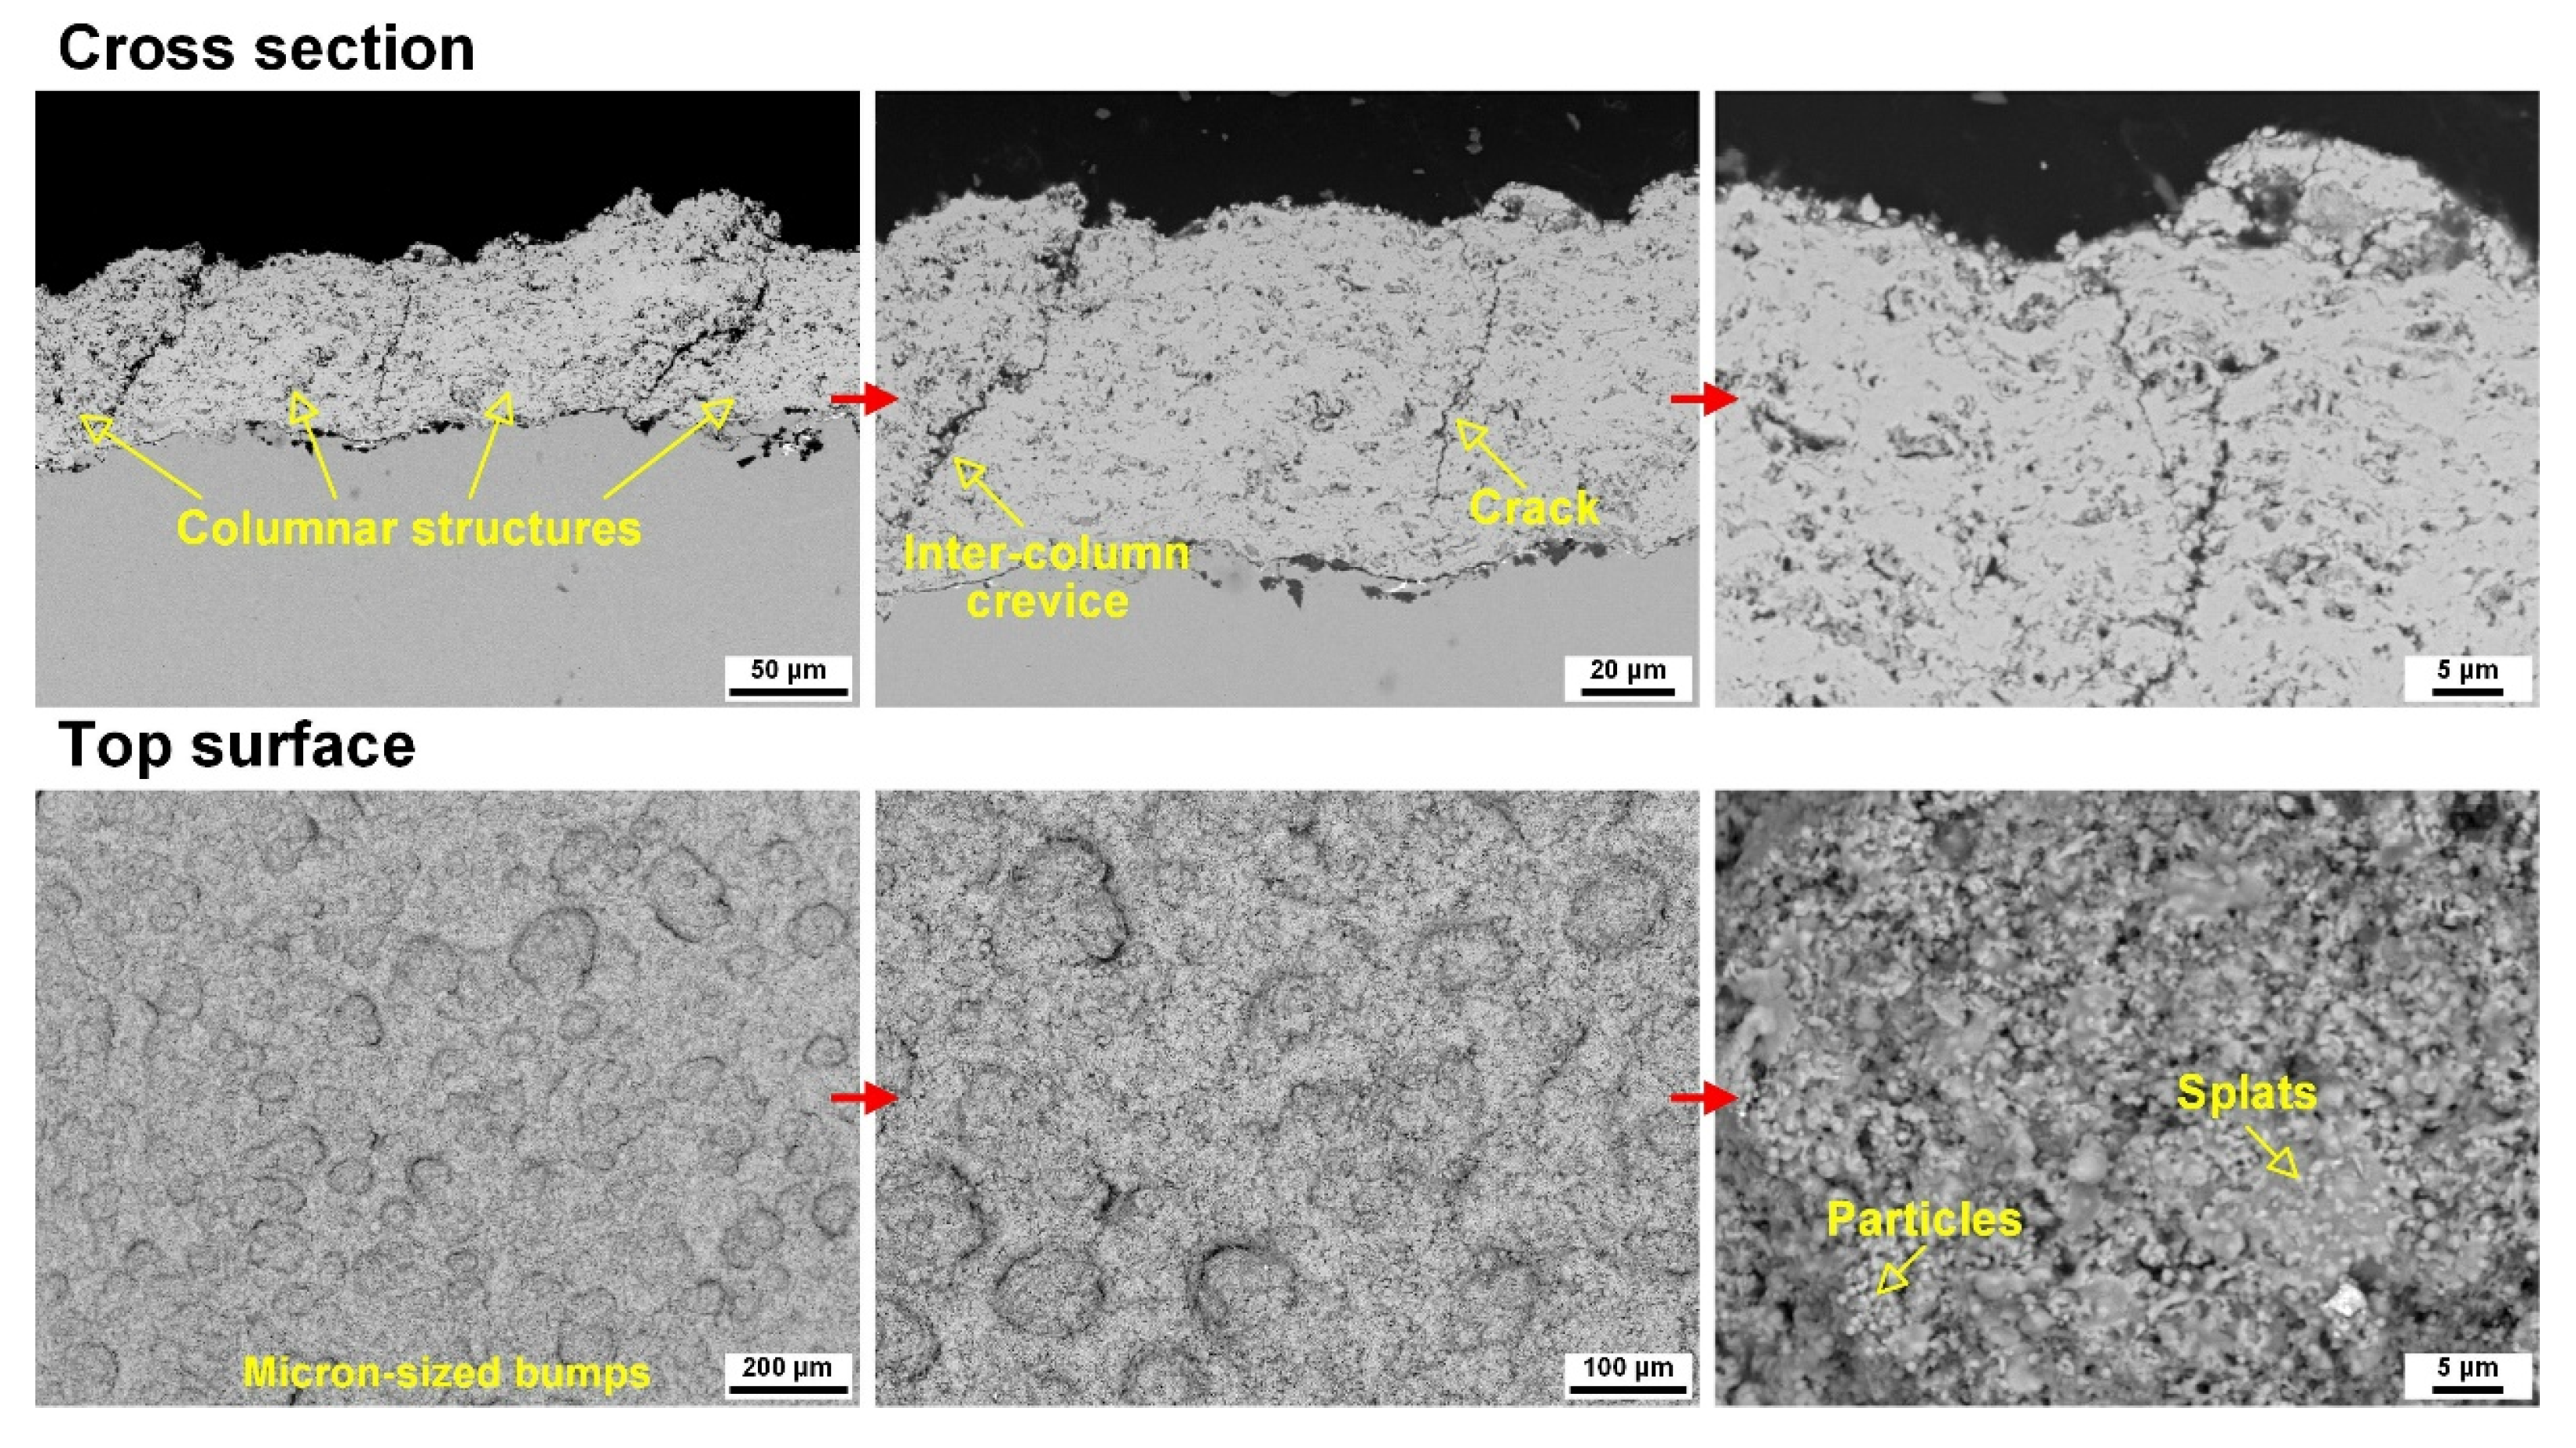
In contrast to the F-E coating, the microstructures of the F-W coating changed significantly when the solvent was changed from ethanol to water, as shown in Figure 6. The microstructures showed a mixture of columns and cracks, which were also referred to as cracked–columnar structures [28]. Despite the formation of columnar structures, they were not as apparent as those of the F-E coating. The coating thickness was reduced to 75 μm to 95 μm, and the coating porosity decreased to ~11.32%. The spacing between the columns was 0.2 μm to 3 μm. Small and inconspicuous bump structures were formed on the top surface of the F-W coating, which showed quite different morphologies compared to the cluster structures on the top surface of the F-E coating. Very fine particles and splats were also observed on the topmost layer of the coatings.
By using coarse particles to prepare the suspension, the microstructures of the resultant coatings changed significantly. As shown in Figure 7, the C-E coating showed vertically cracked microstructures, and no columnar structures were formed. The coating showed a thickness of ~80 μm and a porosity of ~6.72%. As observed from the cross-sectional micrographs, the profile of the coating was relatively flat, which was quite different from the corrugated profile of the F-E coating. The formation of cracks could be due to the high temperature of the coating during the spraying process [43,44]. When the particles impinged on the surface, forming splats, the rapid cooling of the splats resulted in intra-splat cracks due to the stress relief [23,45]. As reported by S Sampath et al., the real-time stress generated during the deposition, which was obtained via curvature measurements, could reach as high as 600 MPa to 800 MPa under certain process parameters (e.g., short standoff distance; small raster speed) [23]. The high stress could result in the initiation of microcracks. In another publication by S Sampath et al. [44], the curvature response of coatings firstly had a steep rise due to the significant stress generation, and was then suddenly flattened once cracks were formed. This is a clear sign that the stress relief resulted in the initiation of cracks.
Additionally, the temperature of the coating surface measured immediately after deposition was about 500 °C to 600 °C. It could be inferred that the coating temperature was above 500 °C to 600 °C during the SPS process. The high coating temperature improved the contact between adjacent splats. Therefore, with the progression of the spraying process, the intra-splat cracks of a splat could propagate readily to adjacent splats via bridging, which gradually formed the vertical cracks through the coating. It was inferred that the cracks in the F-W coating could be formed similarly. As for the F-E coating, apparent inter-column crevices were formed spontaneously during the spraying process, which released the stress significantly. Therefore, no vertical cracks were formed in the F-E coating. The top surface of the C-E coating showed quite homogeneous microstructures without any special surface structures. The high-magnification top surface micrograph showed that the majority of deposits were fine splats, and only a small number of particles were observed.
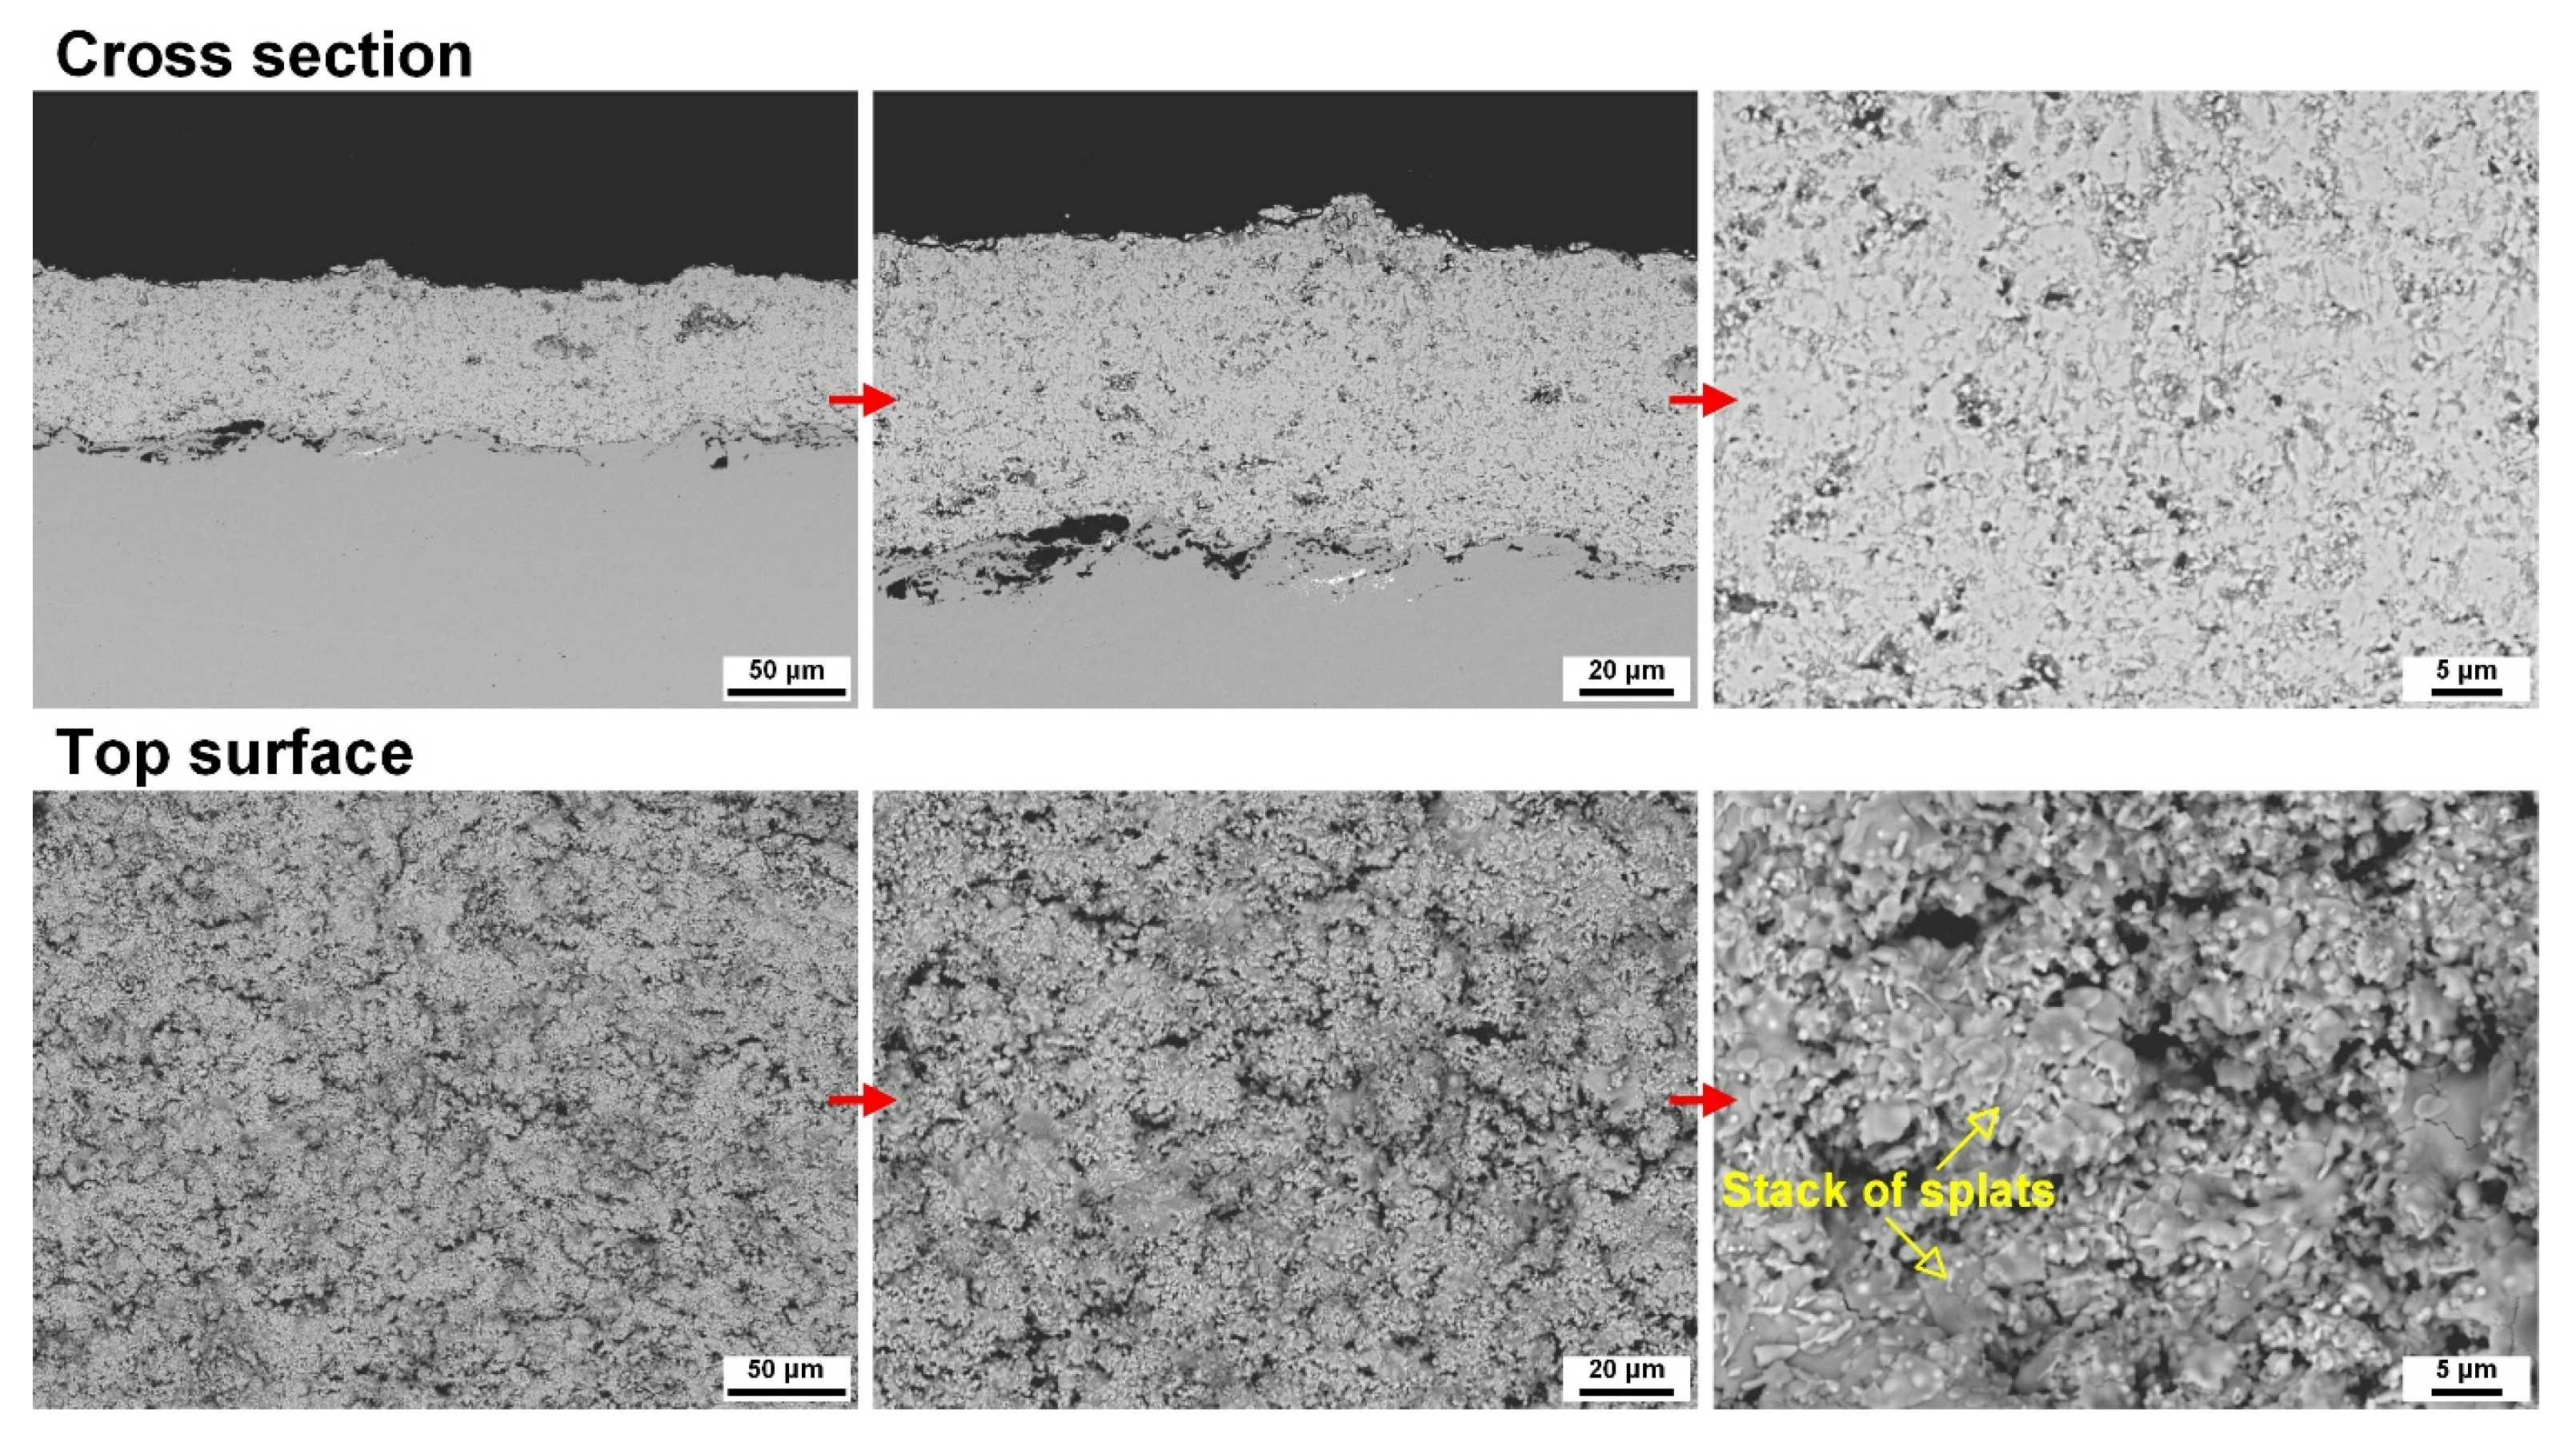
As shown in Figure 8, the C-W coating showed homogeneous microstructures without columns or cracks. The coating showed a thickness of ~65 μm and a porosity of ~9.61%. The top surface showed a relatively flat topography similar to the C-F coating without any special surface structures. Obvious stacks of well-flattened splats were observed on the topmost surface, while the fine particles in submicron scales were rarely found. By comparing the topmost microstructures of different coatings, the C-W coatings contained the largest number of splats and the smallest number of fine particles in submicron scales. This indicated that the in-flight particles transitioned from the C-W suspension were relatively large, which impinged on the surface with high momentum and fully spread, forming well-flattened splats.

3.3. Formation Mechanism of Different Microstructures

The formation of different coating microstructures was closely related to the movement of in-flight particles, especially during the impinging period. When the suspension stream was injected into the plasma jet, it was aerodynamically fragmented into numerous small suspension droplets due to the large velocity difference between the suspension stream and the high-velocity plasma jet. Under the intense heat of the plasma jet, the small suspension droplets transitioned to fine YSZ particles after solvent evaporation, agglomeration, sintering, and melting [10,11]. When the plasma jet carrying the fine YSZ particles impinged on the substrate, the plasma jet was diverted to become parallel to the substrate surface. The sudden deflection of the plasma jet in the vicinity of the substrate exerted lateral drag forces on the particles and changed their original movement trajectories, which were orthogonal to the substrate surface [46,47]. This could result in different impinging trajectories of particles depending on the balance between the inertia of in-flight particles and the drag force of the diverted plasma jet. The suspensions prepared using different solvents and particles presented different surface tension and viscosity, and had different interactions with the plasma jet. This resulted in particles of different sizes, which presented different impinging trajectories and formed different microstructures upon impingement.
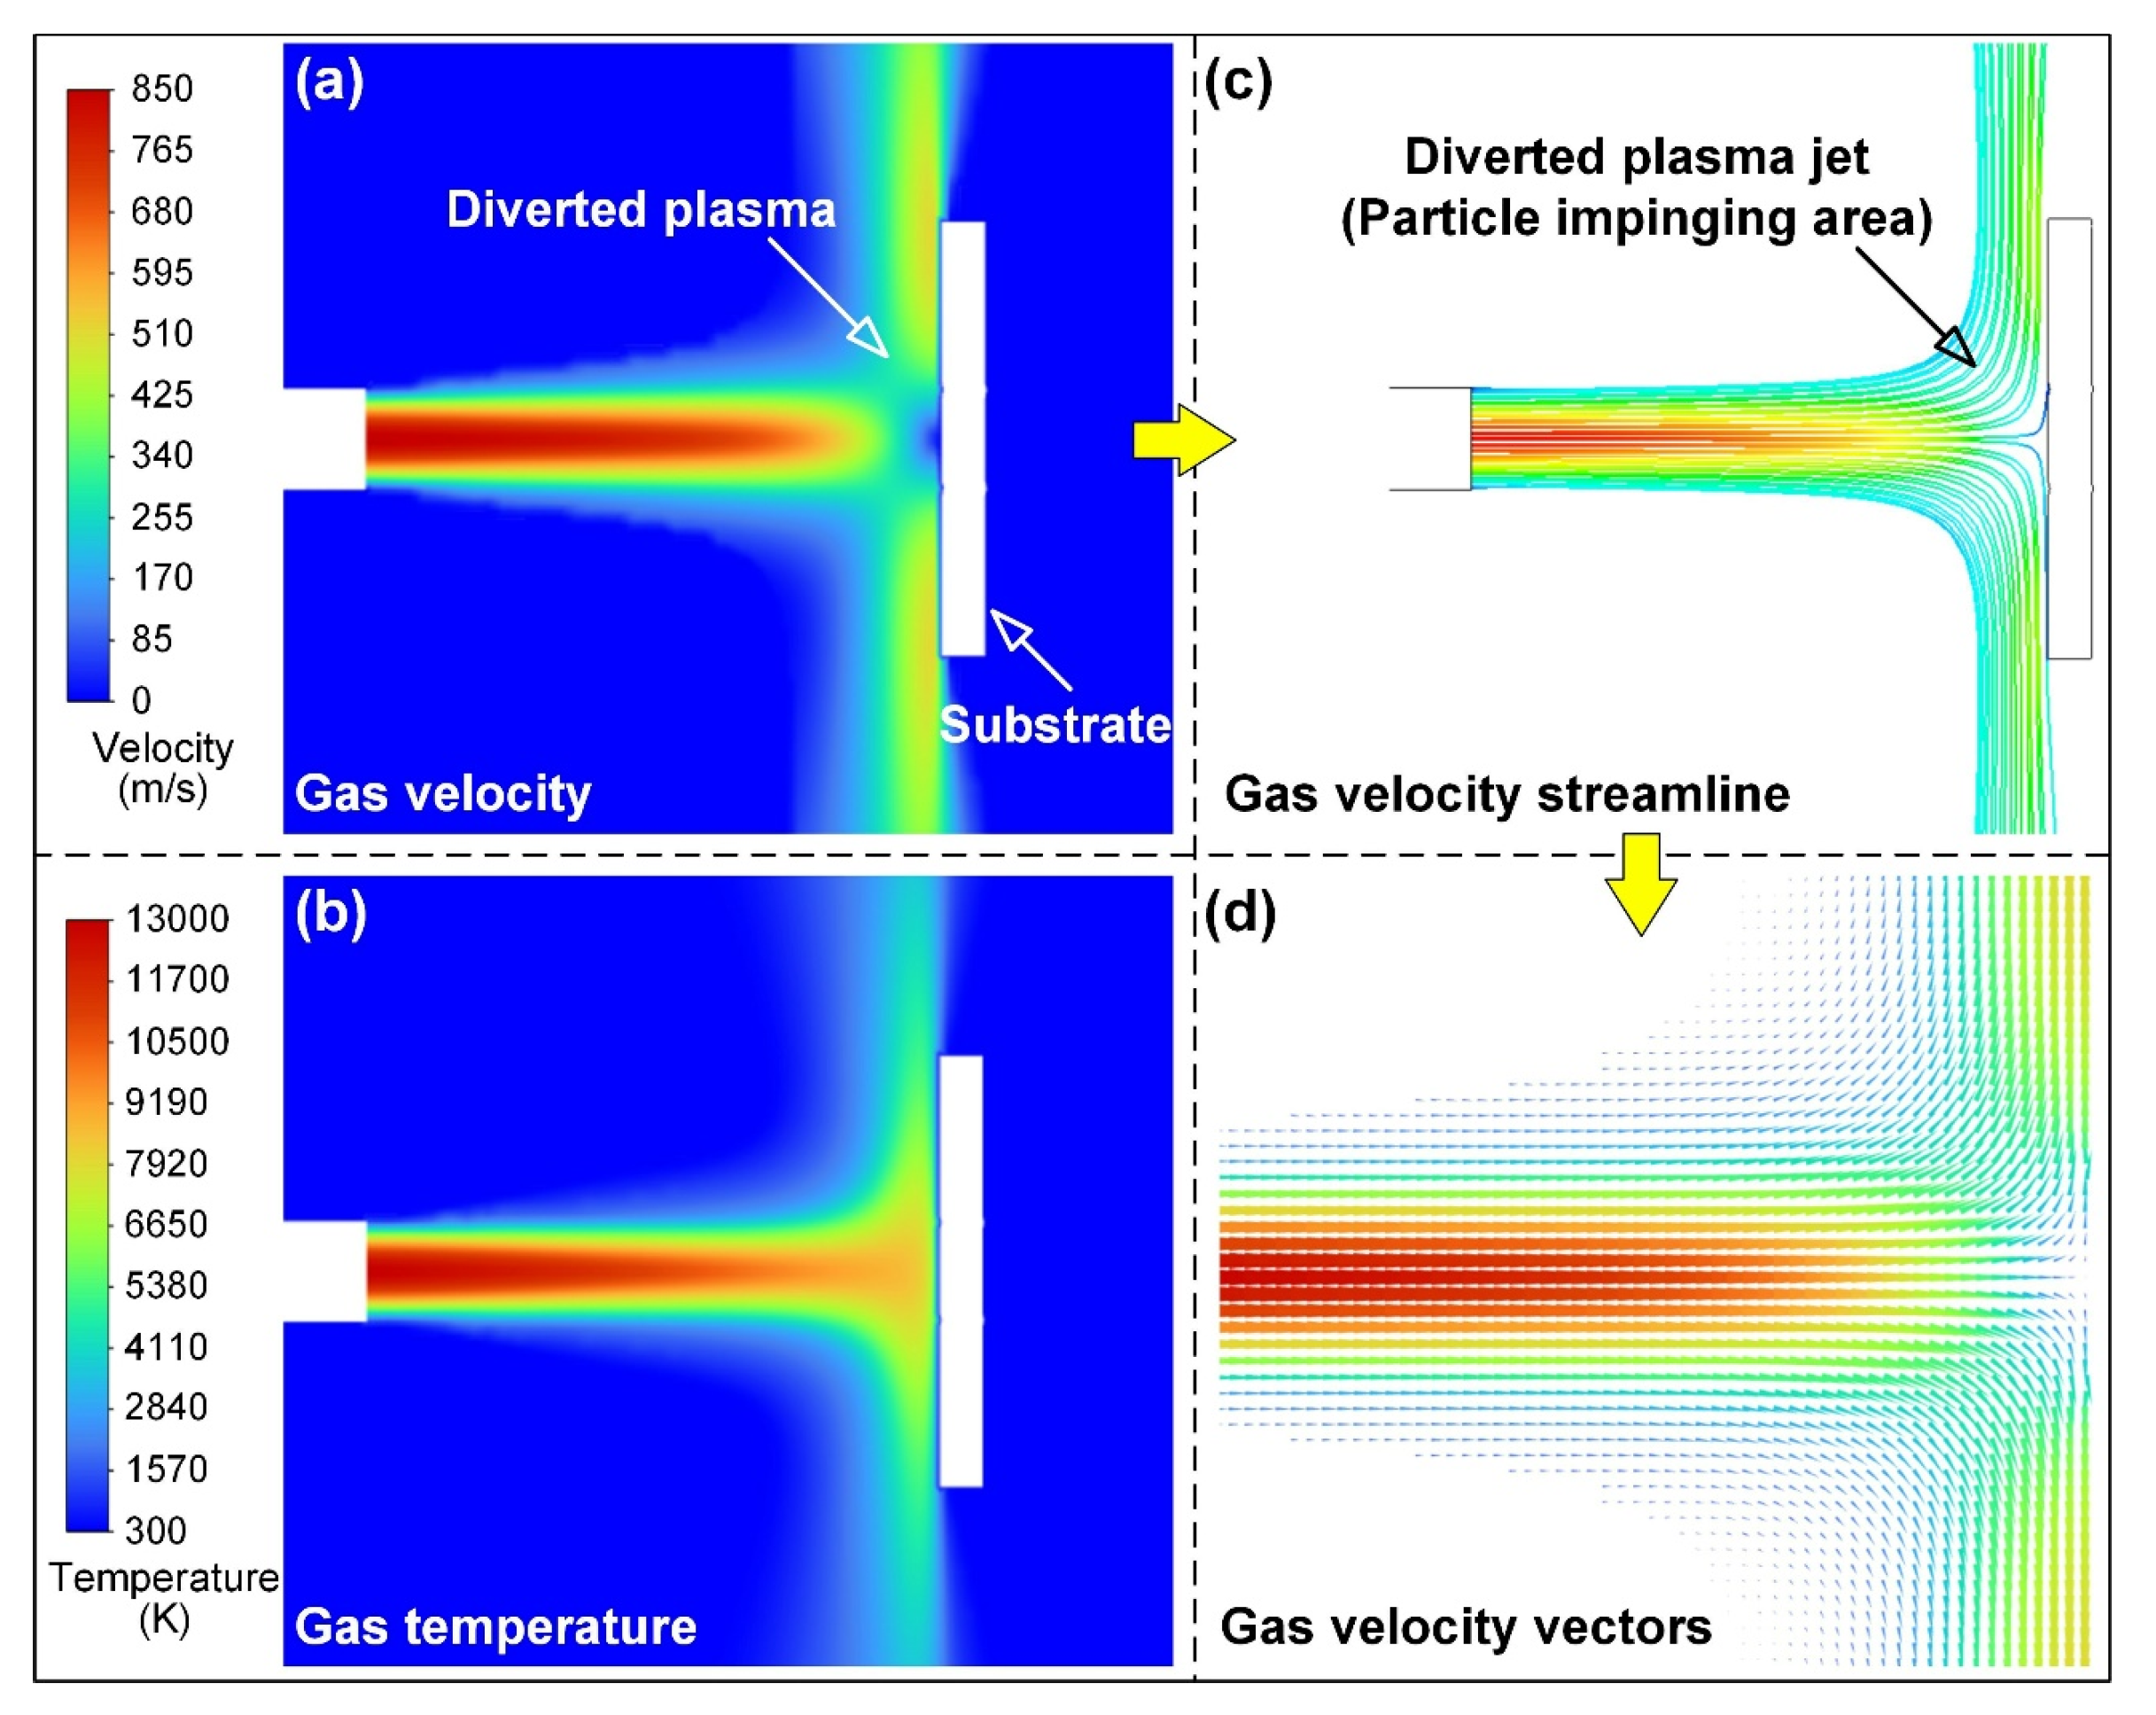
As reported in Section 2.4, numerical models were established to investigate the movement of particles. Firstly, the deflection of the plasma jet was modelled, as shown in Figure 9. The plasma jet showed the highest velocity of ~850 m/s and temperature of ~13,000 K at the torch nozzle exit. The gas velocity and temperature decreased gradually along the spray distance. When the plasma jet impinged on the substrate, a stagnation region was formed with a gas velocity of zero and a gas temperature of ~6800 K. Meanwhile, the plasma jet was diverted dramatically upon the impingement, forming a gas flow parallel to the substrate surface. After the diverted gas flow exited the stagnation zone, its velocity increased gradually to ~520 m/s. Compared to the plasma jet far away from the substrate, the temperature and velocity of the plasma gas flow changed significantly with the deflection, as shown in Figure 9a,b. The streamline and vectors of the gas velocity also clearly indicated the change in plasma gas flow (Figure 9c,d).
As the size of in-flight particles transitioned from a suspension that was very small, their movement in the vicinity of the substrate was affected by the diverted plasma jet. Using the diverted plasma jet as boundary conditions, the movement of particles of different sizes was modeled, as shown in Figure 10. When particles of different sizes were injected into the plasma jet, they all followed the streamline of the jet, showing movement directions orthogonal to the substrate. The particle size had little effect on the movement of particles at regions far away from the substrate. When the particles moved to the vicinity of the substrate, the plasma jet was diverted to be parallel to the substrate surface (Figure 9a). The diverted plasma gas flow changed the movement trajectories of particles to different extents, depending on their size. As shown in Figure 10a, particles of relatively larger size (e.g., 2 to 2.5 μm) showed slightly oblique impinging trajectories. This was because the inertia force of these particles was slightly smaller than the drag force of the diverted plasma jet. However, with the decrease in particle size, the finer particles (e.g., <2 μm) showed much larger oblique angles of impinging trajectories. For the very fine particles (e.g., <0.6 μm), the oblique angles were so large that the particles even missed the substrate without impingement. This was because the drag force of the diverted plasma jet far exceeded the inertia force of the particles, as the particle size was very small.
With further increase in particle size, the oblique impinging angles became smaller. As shown in Figure 10b, the impinging trajectories of particles in the size range of 2.5 to 3 μm showed very small oblique angles, while the larger particles (3 to 5 μm) kept their original movement trajectories, which impinged on the substrate orthogonally. The movement of particles with even larger particles (5 to 10 μm) is shown in Figure 10c,d. These large particles all maintained their original movement trajectories, as the particles of large size showed an inertia force much larger than the drag force of the diverted plasma jet. Therefore, their movement in the vicinity of the substrate was impervious to the diverted plasma jet.
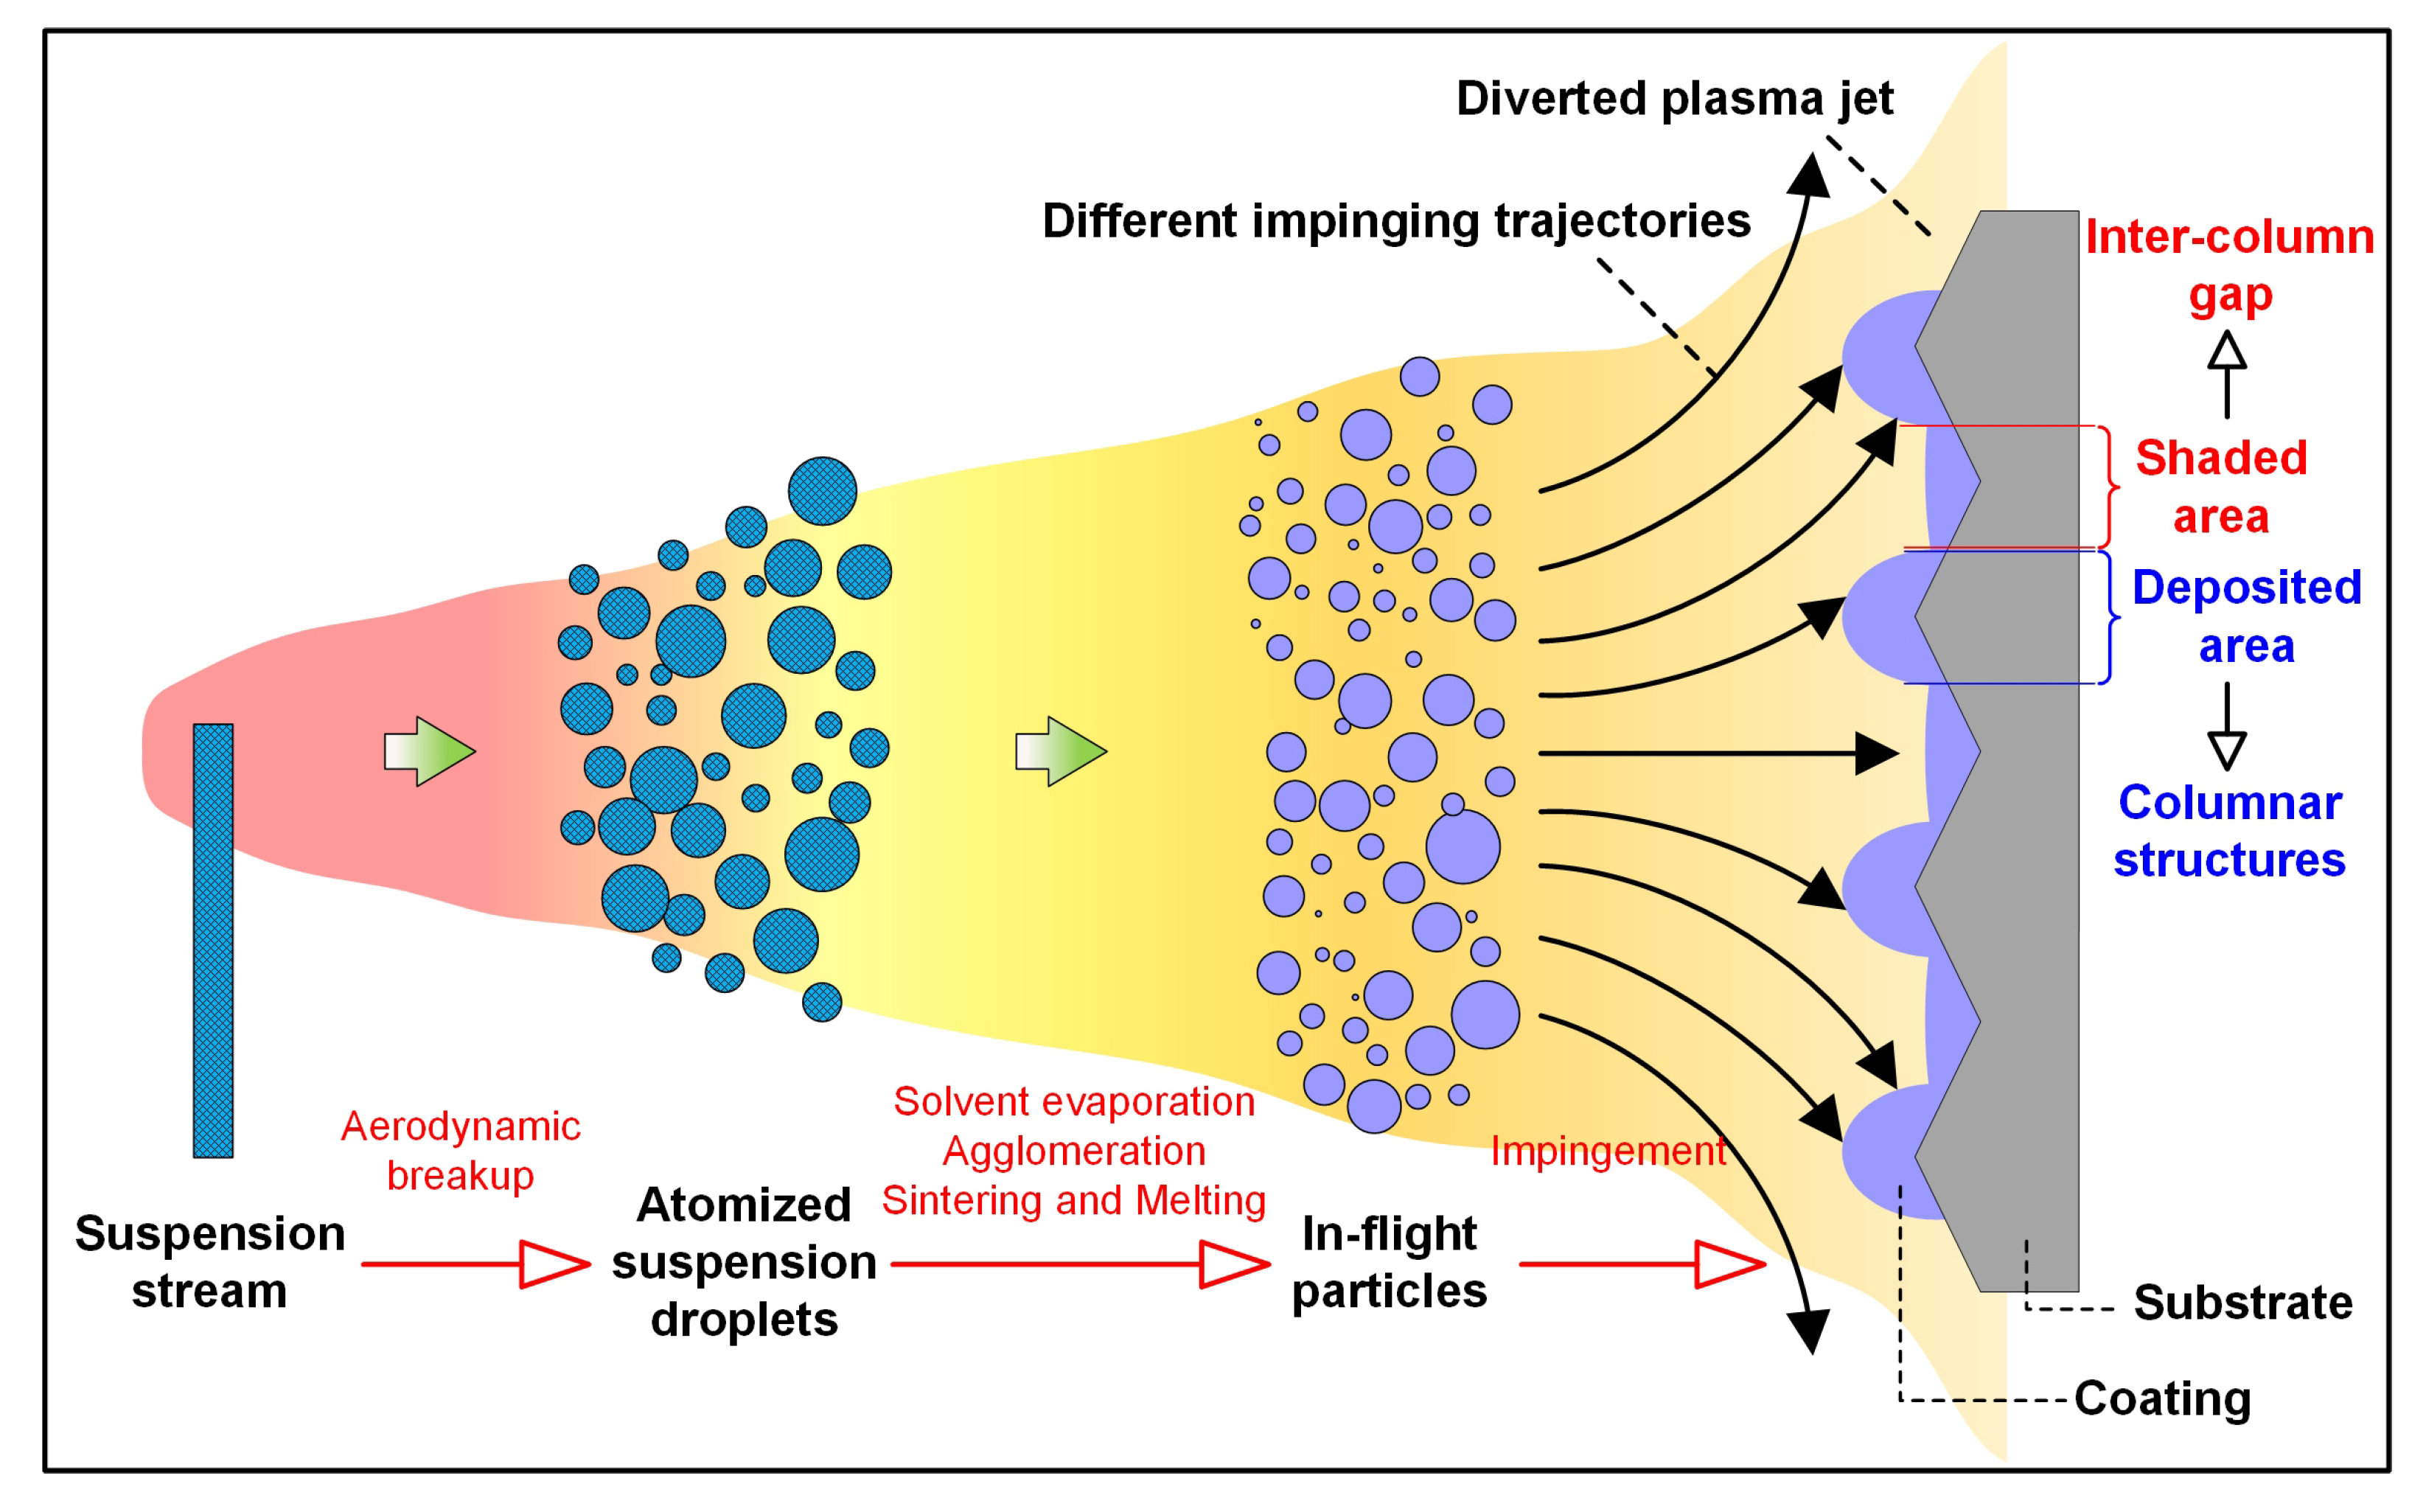
The different impinging trajectories of in-flight particles could result in different coating microstructures. As schematically shown in Figure 11, the YSZ suspension stream injected into the plasma jet underwent severe aerodynamic breakup, forming numerous atomized suspension droplets. The suspension droplets showed different sizes depending on the suspension properties. The suspension droplets further experienced solvent evaporation, interior particle agglomeration, sintering, and melting, which transitioned into in-flight YSZ particles of different sizes. The particles impinged on the substrate, forming coatings. During the impinging period, the particles presented different impinging trajectories under the effect of the diverted plasma jet. As shown in the particle movement model (Figure 10), particles with large sizes tended to impinge on the substrate orthogonally, while particles with small sizes tended to impinge at oblique angles. With the orthogonal and oblique impingement of particles, small protrusions appeared on the substrate and grew to a certain height gradually with the progression of the spraying process. As part of in-flight particles had oblique impinging trajectories, they could only impinge on one side of the protrusions, leaving the other side as a “shaded area” without coating deposition. In this way, the shaded area evolved into gaps or crevices, while the particle-deposited area became columns, which resulted in the columnar microstructures. On the contrary, if a large portion of in-flight particles had a large size, they tended to impinge on the substrate orthogonally, resulting in the formation of homogeneous microstructures.
In terms of the aforementioned discussion, the size of in-flight particles played a significant role in the formation of different microstructures. As the in-flight particles were transitioned from the suspension droplets, the size of the suspension droplets was thereby of vital importance. When the YSZ suspension stream was injected into the plasma, it was aerodynamically fragmented into numerous atomized suspension droplets. The size of atomized suspension droplets could be approximately estimated using Equation (4), which is given as follows:
D s = 136 μ s · δ s 1.5 · d s 0.5 ρ s 0.5 · ρ g 2 · U g 4 1 3
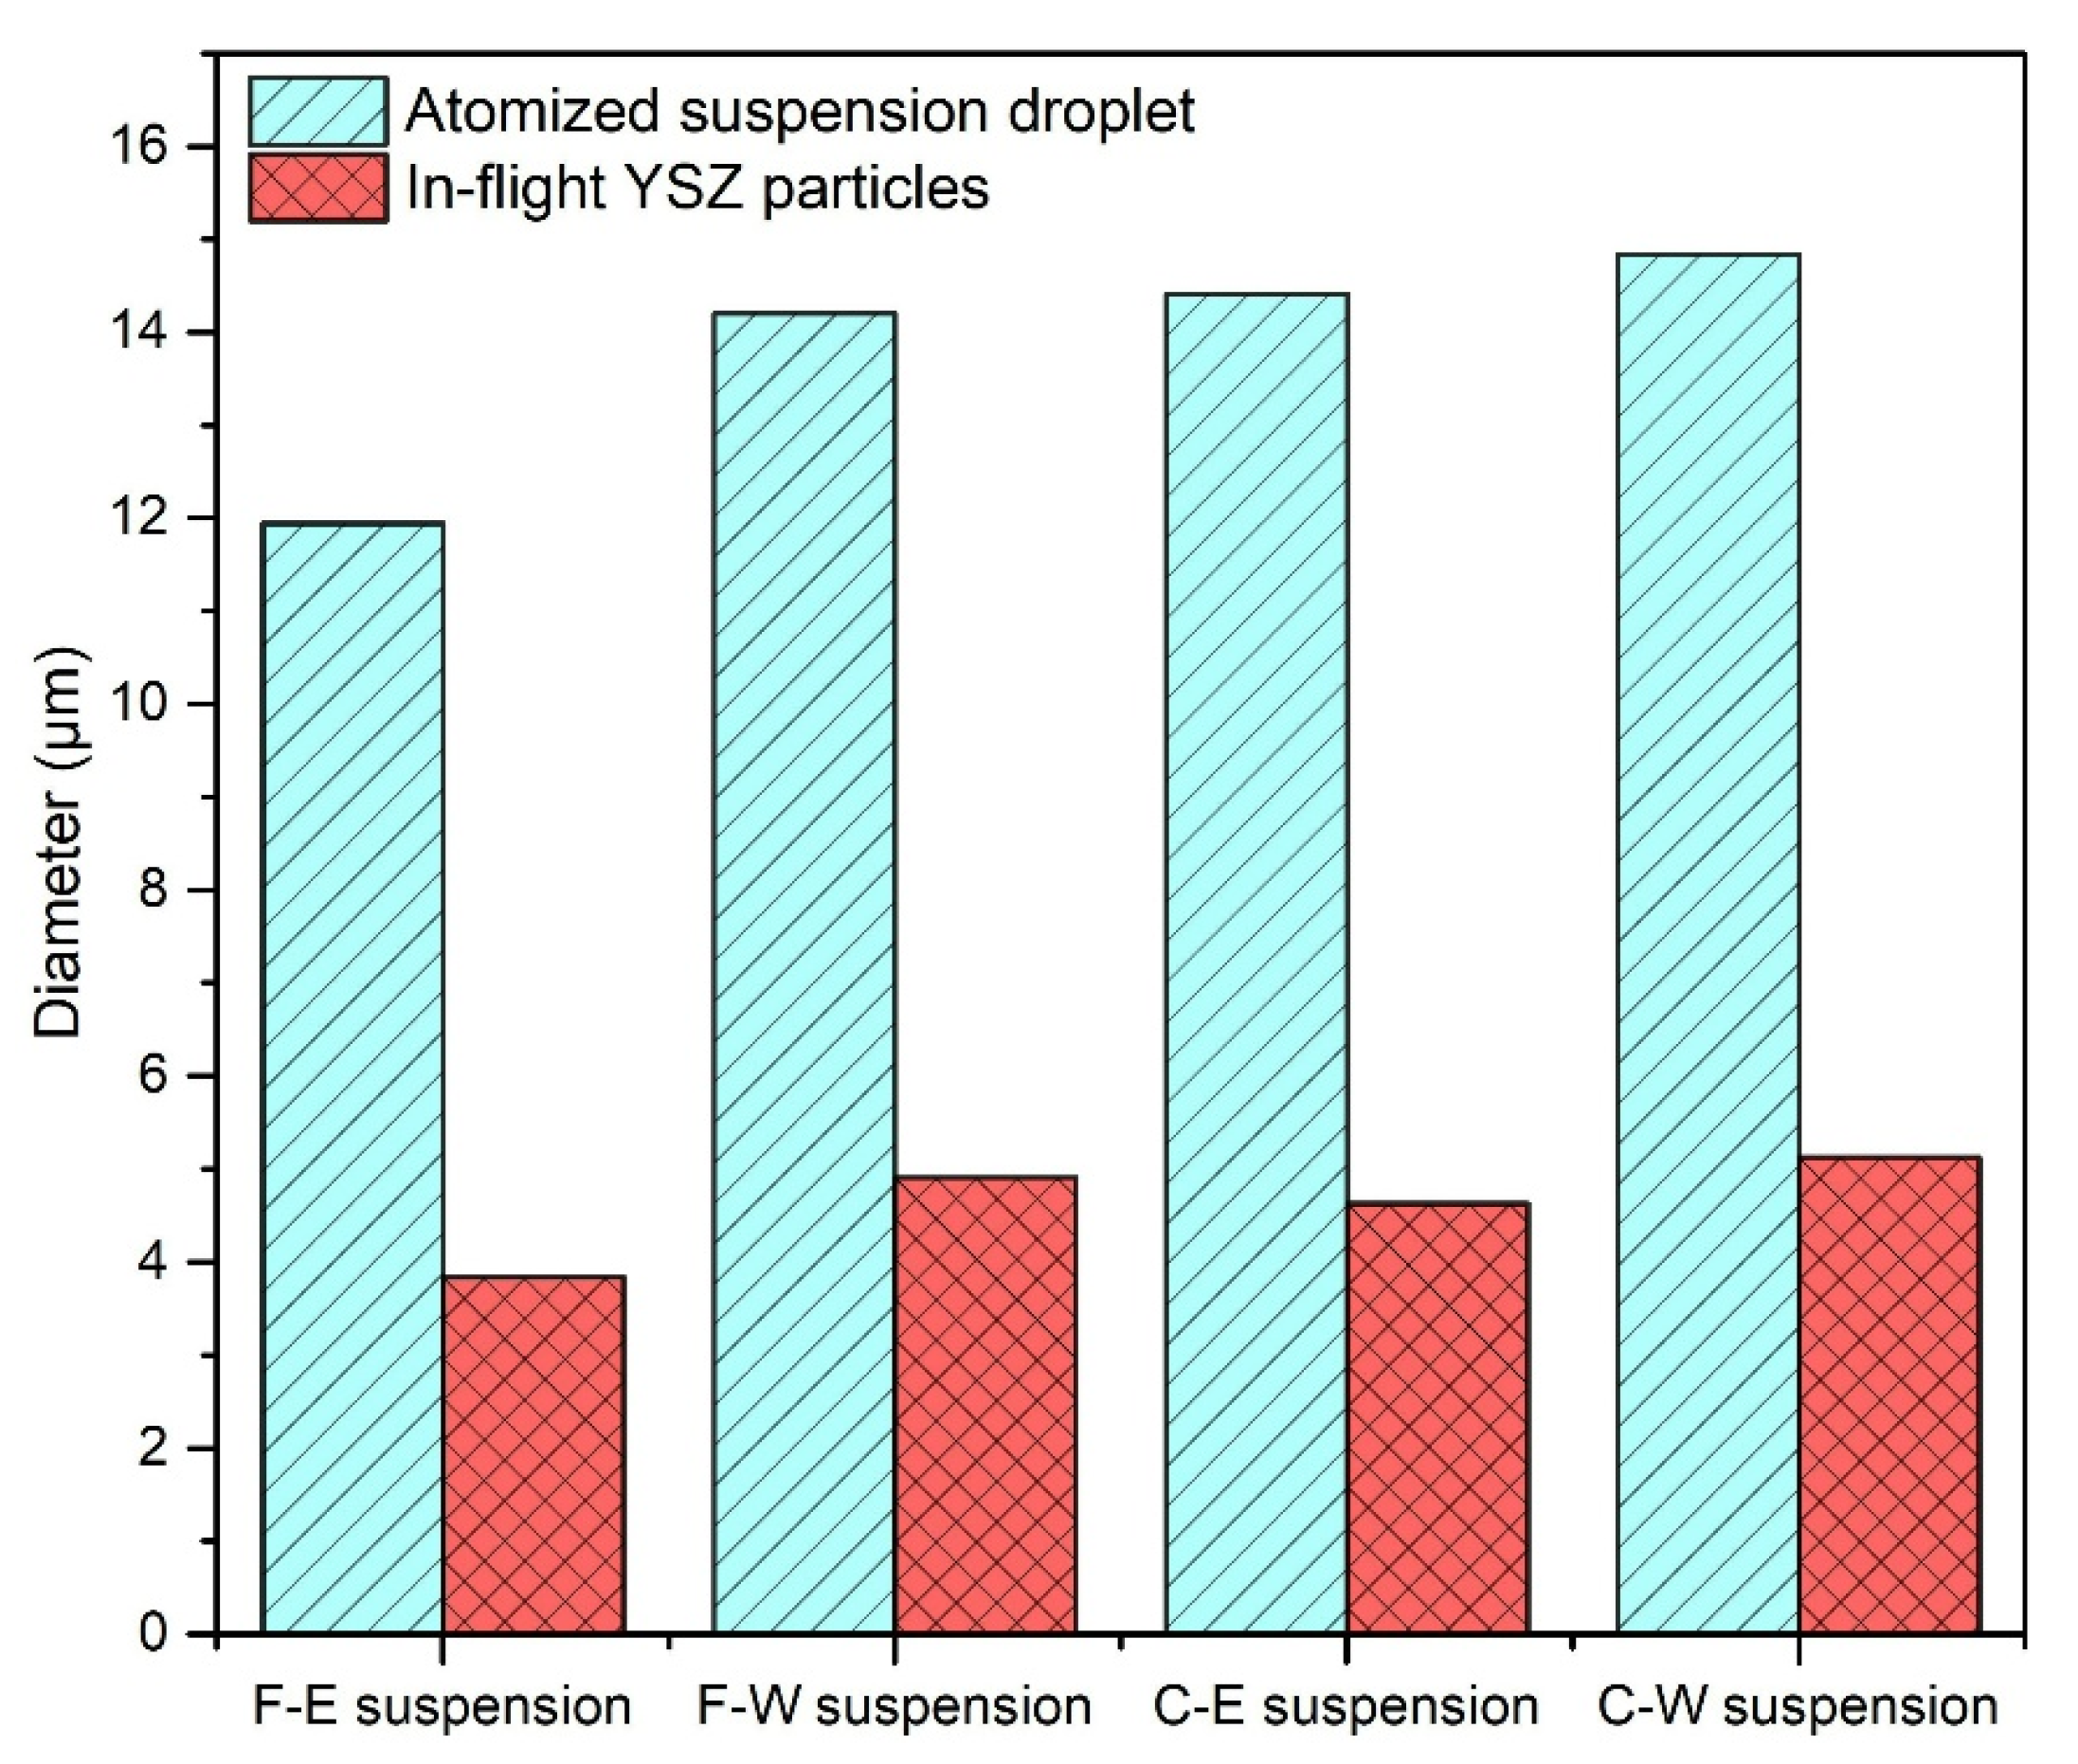
where Ds is the size of atomized droplets after the aerodynamic breakup of the suspension stream, μs is the viscosity of the suspension (shown in Figure 2), σs is the surface tension of the suspension (shown in Figure 3), ds is the initial droplet size that could be considered to be equaled to the diameter (250 μm) of the suspension stream, ρs is the density of the suspension, ρg is the density of the plasma gas at a certain temperature, and Ug is the velocity of the plasma gas at the region where the aerodynamic breakup occurs [28,46]. To simplify the calculation, a middle area close to the torch nozzle exit was selected as the region where the aerodynamic breakup occurred. The velocity and temperature of the plasma gas of the selected region were about 800 m/s and 10,000 K, respectively, in terms of the velocity and temperature contours (Figure 9). The density of the plasma gas under 10,000 K was about 3.44 × 10⁻² kg/m3 in terms of the literature [36]. Therefore, the size of atomized droplets after the aerodynamic breakup of the suspension stream was calculated using Equation (3). In addition, as the suspension density, solid loading of suspension, and YSZ density were known, the size of YSZ particles transitioned from the atomized suspension droplets could also be calculated, given that the solvent had completely evaporated.
The size of atomized droplets after the aerodynamic breakup of the suspension stream, and the YSZ particles transitioned from the atomized suspension droplets, is shown in Figure 12. The F-E suspension resulted in the smallest atomized droplets and YSZ particles, while the suspension droplets that transitioned from the other three types of suspensions were relatively larger. The small YSZ particles tended to follow the diverted plasma jet and impinged on the surface at oblique angles, which provided a significant opportunity for the formation of columnar structures. The comparison of different coating microstructures (Figure 5, Figure 6, Figure 7 and Figure 8) also confirmed and supported the aforementioned analysis and coating formation mechanism.
However, it should be noted that the effect of the size of the original particles, which were used to prepare the suspension, was not considered in Equation (4). For instance, it was known from the particle size distribution (Figure 1) that part of the coarse particles, which were used to prepare the C-E suspension and C-W suspension, were in the size range of 5 to 10 μm. Therefore, the in-flight particles transitioned from the C-E suspension or C-W suspension should at least contain particles in this size range. This was inconsistent with the results calculated by Equation (3). Additionally, the size of the atomized suspension droplets and in-flight particles was calculated assuming there was one round of the aerodynamic breakup process of the suspension stream. In the practical SPS process, the suspension droplets formed by the aerodynamic breakup of the suspension stream further underwent several rounds of subsequent aerodynamic breakup processes, forming much smaller suspension droplets. In spite of the limitations of Equation (3), it could still be used to estimate the effects of suspension viscosity and surface tension on the formation of different suspension droplets and in-flight particles.
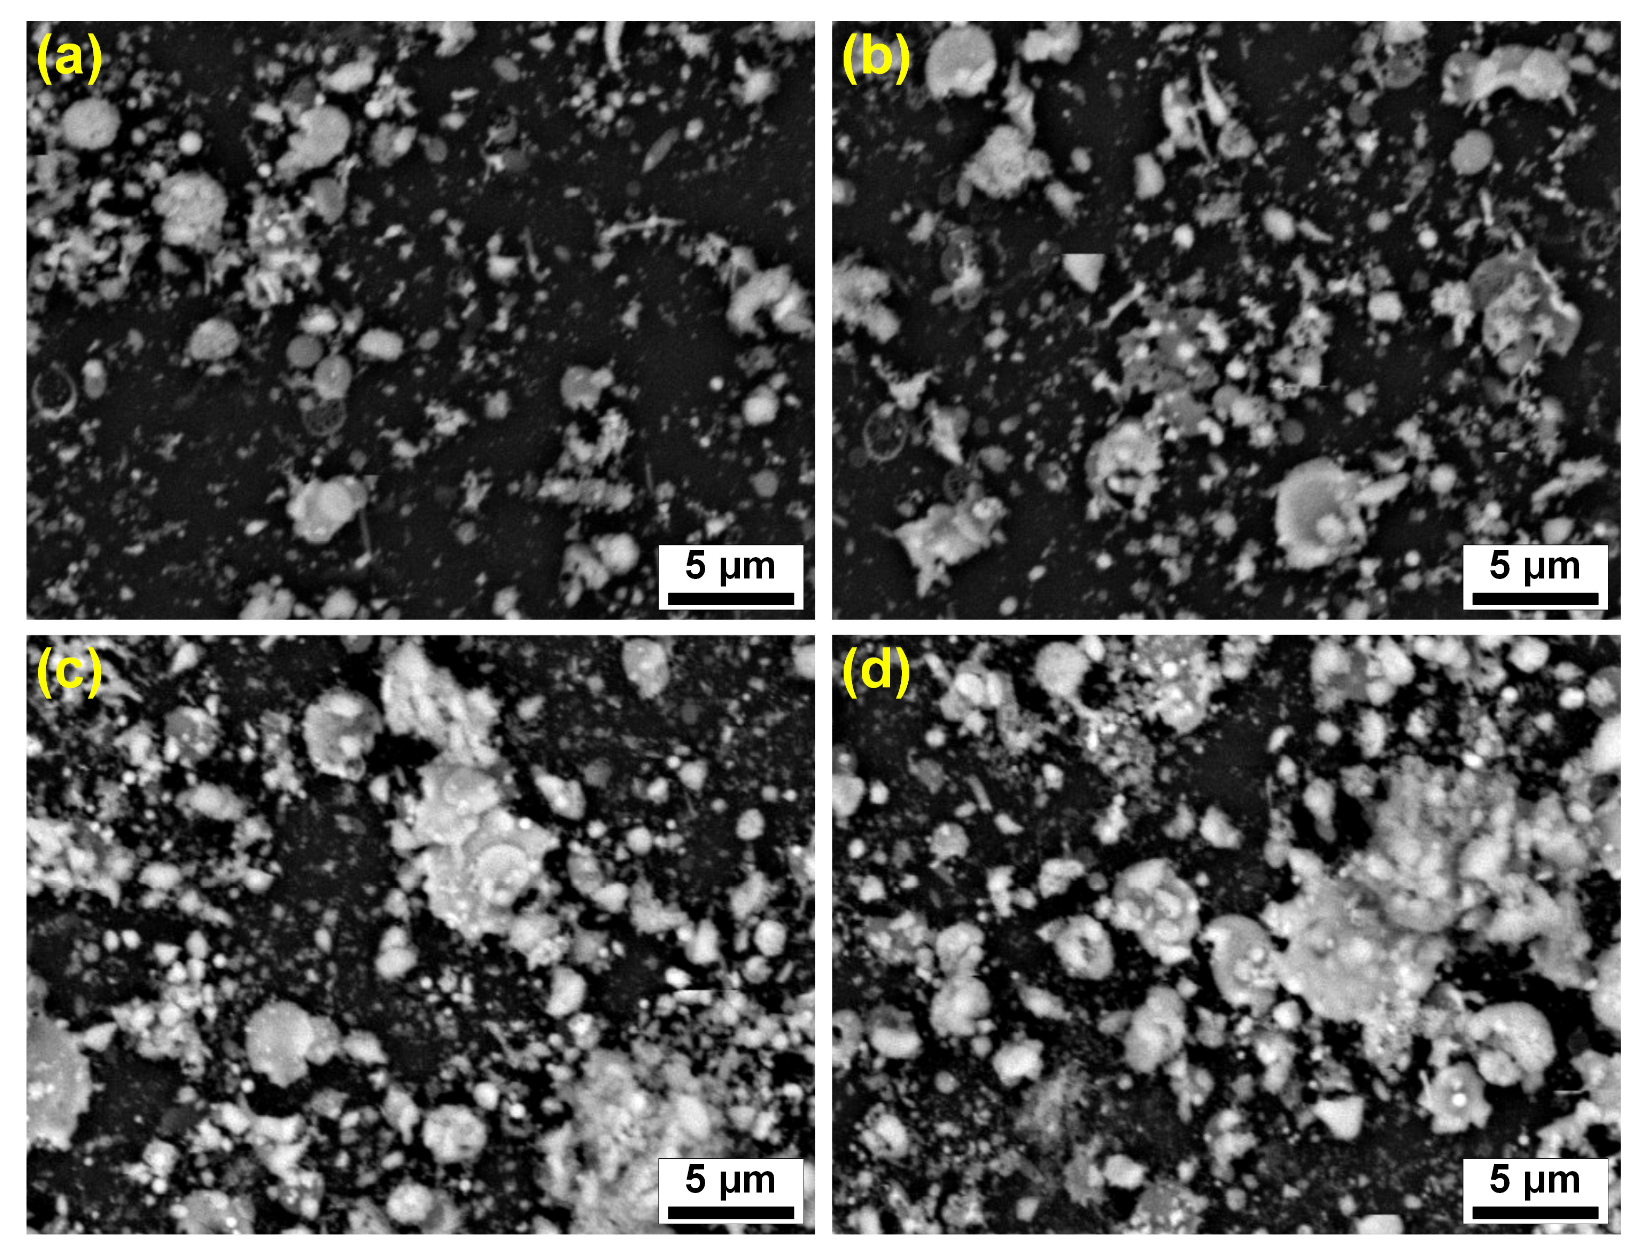
In order to verify the calculated results, a single-pass test was conducted by using a glass plate to scan the plasma jet rapidly at a distance of 40 mm during the SPS process. Various deposits were thereby collected on the glass plate, as shown in Figure 13. The single-pass deposits obtained from different suspensions all contained many submicron particles and large splats. The splats of deposits obtained from the F-E suspension were the smallest, showing a size of 2 μm to 3 μm. In contrast, the deposits obtained from the C-W suspension contained the largest splats with sizes ranging from 2 μm to 8 μm. It is reported that the flattening ratio of splats, which was defined as the ratio between the size of splats and that of in-flight particles, was about 1.3 to 2.8 in the SPS process [48,49]. It can thus be inferred using the reported flattening ratio that the size of the in-flight particles transitioned from the F-E suspension and C-W suspension was about 0.7–2.3 μm and 0.7–6.2 μm, respectively. This is consistent with the calculated results shown in Figure 12.

4. Conclusions

In this work, the effects of suspension properties on the coating microstructures in the SPS process were investigated. Four different types of suspensions were prepared by using particles of different sizes (fine particles with a D50 of 0.45 μm and coarse particles with a D50 of 1.2 μm) and different solvents (ethanol and water), followed by the measurements of suspension viscosity and surface tension. The optimized composition of suspensions was determined based on the viscosity measurement, which included 20 wt% particles and 80 wt% ethanol, and a subsequent addition of 3 wt% PEI with respect to the particle mass. The ethanol-based suspensions showed much smaller surface tension of 25–31 mN/m in contrast to that (57–61 mN/m) of the water-based suspensions. The different suspensions were used to deposit coatings via the SPS process for a comparative study. When using fine particles to prepare suspension, the ethanol solvent facilitated the formation of columnar-structured coatings (porosity of ~14.65%) with inter-column gaps (spacing of 0.8–4 μm), while the water solvent resulted in coatings with mixed microstructures of columns and cracks (porosity of ~11.32%). When using coarse particles to prepare suspension, the ethanol solvent and water solvent both resulted in homogeneously structured coatings (porosity of 6.72%–9.61%) without columns. Numerical models of plasma jet and particles quantitatively showed that the movement of fine particles smaller than 2 μm was readily affected by the diverted plasma jet in the vicinity of the substrate, resulting in oblique impinging trajectories. In contrast, the movement of large particles larger than 3 μm was impervious to the diverted plasma jet, showing orthogonal impinging trajectories. The oblique impinging trajectories of fine particles resulted in columnar microstructures more readily than the orthogonal impingement of large particles. Single-pass deposits of different suspensions were collected to verify the modelling work and the calculated particle size. This work indicated that tailoring the suspension properties is a facile way to modify the coating microstructures. Suspensions containing small-sized particles and ethanol solvent facilitated the formation of columnar structures.
This work also had many limitations that need to be addressed. These included (1) oversimplification of the model, which did not consider the suspension behaviors (aerodynamic breakup, solvent evaporation, heating and melting, etc.) in the plasma jet; (2) lack of quantitative correlations between the suspension properties (density, viscosity, surface tension, and particle size) and geometric features of columnar structures (column width, crevice/gap spacing, and column morphologies); and (3) lack of the properties and performance (microhardness, thermal conductivity, and thermal cycling life) of coatings with different microstructures. To promote the industrial applications, the reproducibility of the coating microstructure, the capability for continuous spraying, and the relatively higher deposition cost and lower deposition efficiency of the SPS process should be improved.

Author Contributions

Conceptualization, P.X.; methodology, Y.F. and W.J.; software, W.J. and X.S.; validation, G.L., X.Z. and C.F.; formal analysis, Y.F. and X.S.; investigation, Y.F., W.J. and M.L.; resources, P.X. and G.L.; data curation, Y.F. and W.J.; writing—original draft preparation, P.X.; writing—review and editing, P.X., G.L., X.Z. and C.F.; visualization, Y.F. and W.J.; supervision, P.X.; project administration, P.X.; funding acquisition, P.X., X.Z. and C.F. All authors have read and agreed to the published version of the manuscript.

Funding

This research was funded by the Shandong Provincial Natural Science Foundation (grant numbers ZR2022QE278, ZR2023QE139, and ZR2022QE186).

Institutional Review Board Statement

Not applicable.

Informed Consent Statement

Not applicable.

Data Availability Statement

The data presented in this study are available upon request from the corresponding author due to institutional policies.

Acknowledgments

The authors would like to acknowledge Delong Jia from Qingdao University for the helpful discussions.

Conflicts of Interest

Author Mingli Lv was employed by the company Qingdao Yongzhao New Material Science & Technology Co., Ltd. The remaining authors declare that the research was conducted in the absence of any commercial or financial relationships that could be construed as a potential conflict of interest.

References

  1. Song, J.B.; Wang, L.S.; Dong, H.; Yao, J.T. Long lifespan thermal barrier coatings overview: Materials, manufacturing, failure mechanisms, and multiscale structural design. Ceram. Int. 2023, 49, 1–23. [Google Scholar] [CrossRef]
  2. Mehta, A.; Vasudev, H.; Singh, S.; Prakash, C.; Saxena, K.K.; Linul, E.; Buddhi, D.; Xu, J. Processing and advancements in the development of thermal barrier coatings: A review. Coatings 2022, 12, 1318. [Google Scholar] [CrossRef]
  3. Lashmi, P.; Ananthapadmanabhan, P.; Unnikrishnan, G.; Aruna, S. Present status and future prospects of plasma sprayed multilayered thermal barrier coating systems. J. Eur. Ceram. Soc. 2020, 40, 2731–2745. [Google Scholar] [CrossRef]
  4. Sampath, S. Durability of plasma sprayed thermal barrier coatings with controlled properties part I: For planar disk substrates. Surf. Coat. Technol. 2021, 424, 127678. [Google Scholar]
  5. Mittal, G.; Paul, S. Suspension and solution precursor plasma and HVOF spray: A review. J. Therm. Spray Technol. 2022, 31, 1443–1475. [Google Scholar] [CrossRef]
  6. Li, C.J.; Zhang, Q.L.; Yao, S.W.; Yang, G.J.; Li, C.X. Plasma spraying of dense ceramic coating with fully bonded lamellae through materials design based on the critical bonding temperature concept. J. Therm. Spray Technol. 2019, 28, 53–62. [Google Scholar] [CrossRef]
  7. Mauer, G.; Vaßen, R. Coatings with columnar microstructures for thermal barrier applications. Adv. Eng. Mater. 2019, 22, 1900988. [Google Scholar] [CrossRef]
  8. Lima, R.S.; Guerreiro, B.M.; Aghasibeig, M. Microstructural Characterization and Room-Temperature Erosion Behavior of As-Deposited SPS, EB-PVD and APS YSZ-Based TBCs. J. Therm. Spray Technol. 2019, 28, 223–232. [Google Scholar] [CrossRef]
  9. Bernard, B.; Quet, A.; Bianchi, L.; Joulia, A.; Malié, A.; Schick, V.; Rémy, B. Thermal insulation properties of YSZ coatings: Suspension plasma spraying (SPS) versus electron beam physical vapor deposition (EB-PVD) and atmospheric plasma spraying (APS). Surf. Coat. Technol. 2017, 318, 122–128. [Google Scholar] [CrossRef]
  10. Dalir, E.; Dolatabadi, A.; Mostaghimi, J. Investigating the in-flight droplets’ atomization in suspension plasma-sprayed coating. Int. J. Heat Mass Transf. 2022, 182, 121969. [Google Scholar] [CrossRef]
  11. Gulyaev, I. Phenomenological model of the suspension droplets evaporation in a plasma flow considering different mass transfer mechanisms. Surf. Coat. Technol. 2020, 404, 126454. [Google Scholar] [CrossRef]
  12. Li, D.; Feng, J.; Zhao, H.; Liu, C.; Zhang, L.; Shao, F.; Zhao, Y.; Tao, S. Microstructure formed by suspension plasma spraying: From YSZ splat to coating. Ceram. Int. 2017, 43, 7488–7496. [Google Scholar] [CrossRef]
  13. Guignard, A.; Mauer, G.; Vaßen, R.; Stöver, D. Deposition and characteristics of submicrometer-structured thermal barrier coatings by suspension plasma spraying. J. Therm. Spray Technol. 2012, 21, 416–424. [Google Scholar] [CrossRef]
  14. Curry, N.; Mahade, S.; Venkat, A.; Joshi, S. Erosion performance of suspension plasma spray thermal barrier coatings-A comparison with state of art coatings. Surf. Coat. Technol. 2022, 437, 128311. [Google Scholar] [CrossRef]
  15. Lokachari, S.; Leng, K.; Rincon Romero, A.; Curry, N.; Brewster, G.; Norton, A.; Hussain, T. Processing-microstructure–properties of columns in thermal barrier coatings: A study of thermo-chemico-mechanical durability. ACS Appl. Mater. Interfaces 2024, 16, 10646–10660. [Google Scholar] [CrossRef] [PubMed]
  16. Joeris, J.; Scheld, W.S.; Uhlenbruck, S.; Sohn, Y.J.; Sebold, D.; Guillon, O.; Vaßen, R. Preparation of highly durable columnar suspension plasma spray (SPS) coatings by pre-oxidation of the conicraly bondcoat. Coatings 2023, 13, 1575. [Google Scholar] [CrossRef]
  17. Leng, K.; Romero, A.R.; Curry, N.; Hussain, T. Multilayer GZ/YSZ thermal barrier coating from suspension and solution precursor plasma spray. Ceram. Int. 2024, 50, 631–649. [Google Scholar] [CrossRef]
  18. Amer, M.; Curry, N.; Hayat, Q.; Sharma, R.; Janik, V.; Zhang, X.; Nottingham, J.; Bai, M. Cracking behavior of Gd2Zr2O7/YSZ multi-layered thermal barrier coatings deposited by suspension plasma spray. Coatings 2023, 13, 107. [Google Scholar] [CrossRef]
  19. Mahade, S.; Zhou, D.; Curry, N.; Markocsan, N.; Nylén, P.; Vaßen, R. Tailored microstructures of gadolinium zirconate/YSZ multi-layered thermal barrier coatings produced by suspension plasma spray: Durability and erosion testing. J. Mater. Process. Technol. 2019, 264, 283–294. [Google Scholar] [CrossRef]
  20. Ganvir, A.; Joshi, S.; Markocsan, N.; Vassen, R. Tailoring columnar microstructure of axial suspension plasma sprayed TBCs for superior thermal shock performance. Mater. Des. 2018, 144, 192–208. [Google Scholar] [CrossRef]
  21. Joeris, J.; Tiwari, A.; Brinckmann, S.; Kurze, F.; Guillon, O.; Vaßen, R. Evaluation of major factors influencing the TBC topcoat formation in axial suspension plasma spraying (SPS). Int. J. Appl. Ceram. Technol. 2023, 20, 884–895. [Google Scholar] [CrossRef]
  22. Kiełczawa, T.; Sokołowski, P.; Małachowska, A. The influence of substrate topography on the plasma jet flow in the substrate boundary layer under suspension plasma spray conditions: A numerical approach. J. Therm. Spray Technol. 2022, 31, 84–101. [Google Scholar] [CrossRef] [PubMed]
  23. Seshadri, R.C.; Dwivedi, G.; Viswanathan, V.; Sampath, S. Characterizing suspension plasma spray coating formation dynamics through curvature measurements. J. Therm. Spray Technol. 2016, 25, 1666–1683. [Google Scholar] [CrossRef]
  24. Ganvir, A.; Curry, N.; Björklund, S.; Markocsan, N.; Nylén, P. Characterization of microstructure and thermal properties of YSZ coatings obtained by axial suspension plasma spraying (ASPS). J. Therm. Spray Technol. 2015, 24, 1195–1204. [Google Scholar] [CrossRef]
  25. Bernard, B.; Bianchi, L.; Malie, A.; Joulia, A.; Remy, B. Columnar suspension plasma sprayed coating microstructural control for thermal barrier coating application. J. Eur. Ceram. Soc. 2016, 36, 1081–1089. [Google Scholar] [CrossRef]
  26. Ganvir, A.; Calinas, R.F.; Markocsan, N.; Curry, N.; Joshi, S. Experimental visualization of microstructure evolution during suspension plasma spraying of thermal barrier coatings. J. Eur. Ceram. Soc. 2019, 39, 470–481. [Google Scholar] [CrossRef]
  27. Xu, P.; Meng, G.; Liu, G.; Coyle, T.; Pershin, L.; Mostaghimi, J. Columnar-structured thermal barrier coatings deposited via the water-based suspension plasma spray process. J. Phys. D Appl. Phys. 2022, 55, 204001. [Google Scholar] [CrossRef]
  28. Curry, N.; VanEvery, K.; Snyder, T.; Susnjar, J.; Bjorklund, S. Performance testing of suspension plasma sprayed thermal barrier coatings produced with varied suspension parameters. Coatings 2015, 5, 338–356. [Google Scholar] [CrossRef]
  29. VanEvery, K.; Krane, M.J.; Trice, R.W.; Wang, H.; Porter, W.; Besser, M.; Sordelet, D.; Ilavsky, J.; Almer, J. Column formation in suspension plasma-sprayed coatings and resultant thermal properties. J. Therm. Spray Technol. 2011, 20, 817–828. [Google Scholar] [CrossRef]
  30. Chen, X.; Kuroda, S.; Ohnuki, T.; Araki, H.; Watanabe, M.; Sakka, Y. Effects of processing parameters on the deposition of yttria partially stabilized zirconia coating during suspension plasma spray. J. Am. Ceram. Soc. 2016, 99, 3546–3555. [Google Scholar] [CrossRef]
  31. Jadidi, M.; Mousavi, M.; Moghtadernejad, S.; Dolatabadi, A. A three-dimensional analysis of the suspension plasma spray impinging on a flat substrate. J. Therm. Spray Technol. 2015, 24, 11–23. [Google Scholar] [CrossRef]
  32. Berghaus, J.O.; Bouaricha, S.; Legoux, J.; Moreau, C. Injection Conditions and In-Flight Particle States in Suspension Plasma Spraying of Alumina and Zirconia Nano-Ceramics. In Proceedings of the International Thermal Spray Conference, Basel, Switzerland, 2–4 May 2005; ASM International: Basel, Switzerland, 2005; pp. 512–518. [Google Scholar]
  33. Mauer, G. Numerical study on particle-gas interaction close to the substrates in thermal spray processes with high-kinetic and low-pressure conditions. J. Therm. Spray Technol. 2019, 28, 27–39. [Google Scholar] [CrossRef]
  34. Hansen, F.; Rødsrud, G. Surface tension by pendant drop: I. A fast standard instrument using computer image analysis. J. Colloid Interface Sci. 1991, 141, 1–9. [Google Scholar] [CrossRef]
  35. Berry, J.D.; Neeson, M.J.; Dagastine, R.R.; Chan, D.Y.; Tabor, R.F. Measurement of surface and interfacial tension using pendant drop tensiometry. J. Colloid Interface Sci. 2015, 454, 226–237. [Google Scholar] [CrossRef]
  36. Boulos, M.I.; Fauchais, P.; Pfender, E. Thermal Plasmas: Fundamentals and Applications; Springer Science & Business Media: New York, NY, USA, 1994. [Google Scholar]
  37. Zhao, Y.; Grant, P.; Cantor, B. Modelling and experimental analysis of vacuum plasma spraying. Part I: Prediction of initial plasma properties at plasma gun exit. Modell. Simul. Mater. Sci. Eng. 2000, 8, 497. [Google Scholar] [CrossRef]
  38. Rat, V.; Chazelas, C.; Goutier, S.; Keromnes, A.; Mariaux, G.; Vardelle, A. In-flight mechanisms in suspension plasma spraying: Issues and perspectives. J. Therm. Spray Technol. 2022, 31, 699–715. [Google Scholar] [CrossRef]
  39. Jadidi, M.; Moghtadernejad, S.; Hanson, J. Numerical study of the effects of twin-fluid atomization on the suspension plasma spraying process. Fluids 2020, 5, 224. [Google Scholar] [CrossRef]
  40. Saha, A.; Seal, S.; Cetegen, B.; Jordan, E.; Ozturk, A.; Basu, S. Thermo-physical processes in cerium nitrate precursor droplets injected into high temperature plasma. Surf. Coat. Technol. 2009, 203, 2081–2091. [Google Scholar] [CrossRef]
  41. Kebriyaei, A.; Rahimipour, M.R.; Razavi, M. Solution medium suspension plasma spray (SMSPS): A microstructure and high-temperature properties analysis of YSZ thermal barrier coating. J. Therm. Spray Technol. 2024, 33, 2395–2407. [Google Scholar] [CrossRef]
  42. Mahade, S.; Curry, N.; Björklund, S.; Markocsan, N.; Nylén, P.; Vaßen, R. Erosion performance of gadolinium zirconate-based thermal barrier coatings processed by suspension plasma spray. J. Therm. Spray Technol. 2017, 26, 108–115. [Google Scholar] [CrossRef]
  43. Karger, M.; Vaßen, R.; Stöver, D. Atmospheric plasma sprayed thermal barrier coatings with high segmentation crack densities: Spraying process, microstructure and thermal cycling behavior. Surf. Coat. Technol. 2011, 206, 16–23. [Google Scholar] [CrossRef]
  44. Shinde, S.V.; Johnson, C.A.; Sampath, S. Segmentation crack formation dynamics during air plasma spraying of zirconia. Acta Mater. 2020, 183, 196–206. [Google Scholar] [CrossRef]
  45. Abubakar, A.A.; Arif, A.F.M.; Akhtar, S.S. Evolution of internal cracks and residual stress during deposition of TBC. Ceram. Int. 2020, 46, 26731–26753. [Google Scholar] [CrossRef]
  46. Xu, P.; Sui, X.; Wang, S.; Liu, G.; Ge, A.; Coyle, T.W.; Mostaghimi, J. Superhydrophobic ceramic coatings with lotus leaf-like hierarchical surface structures deposited via suspension plasma spray process. Surf. Interfaces 2023, 38, 102780. [Google Scholar] [CrossRef]
  47. Xu, P.; Coyle, T.W.; Pershin, L.; Mostaghimi, J. Superhydrophobic ceramic coating: Fabrication by solution precursor plasma spray and investigation of wetting behavior. J. Colloid Interface Sci. 2018, 523, 35–44. [Google Scholar] [CrossRef]
  48. Delbos, C.; Fazilleau, J.; Rat, V.; Coudert, J.-F.; Fauchais, P.; Pateyron, B. Phenomena involved in suspension plasma spraying part 2: Zirconia particle treatment and coating formation. Plasma Chem. Plasma Process. 2006, 26, 393–414. [Google Scholar] [CrossRef]
  49. Joulia, A.; Bolelli, G.; Gualtieri, E.; Lusvarghi, L.; Valeri, S.; Vardelle, M.; Rossignol, S.; Vardelle, A. Comparing the deposition mechanisms in suspension plasma spray (SPS) and solution precursor plasma spray (SPPS) deposition of yttria-stabilised zirconia (YSZ). J. Eur. Ceram. Soc. 2014, 34, 3925–3940. [Google Scholar] [CrossRef]
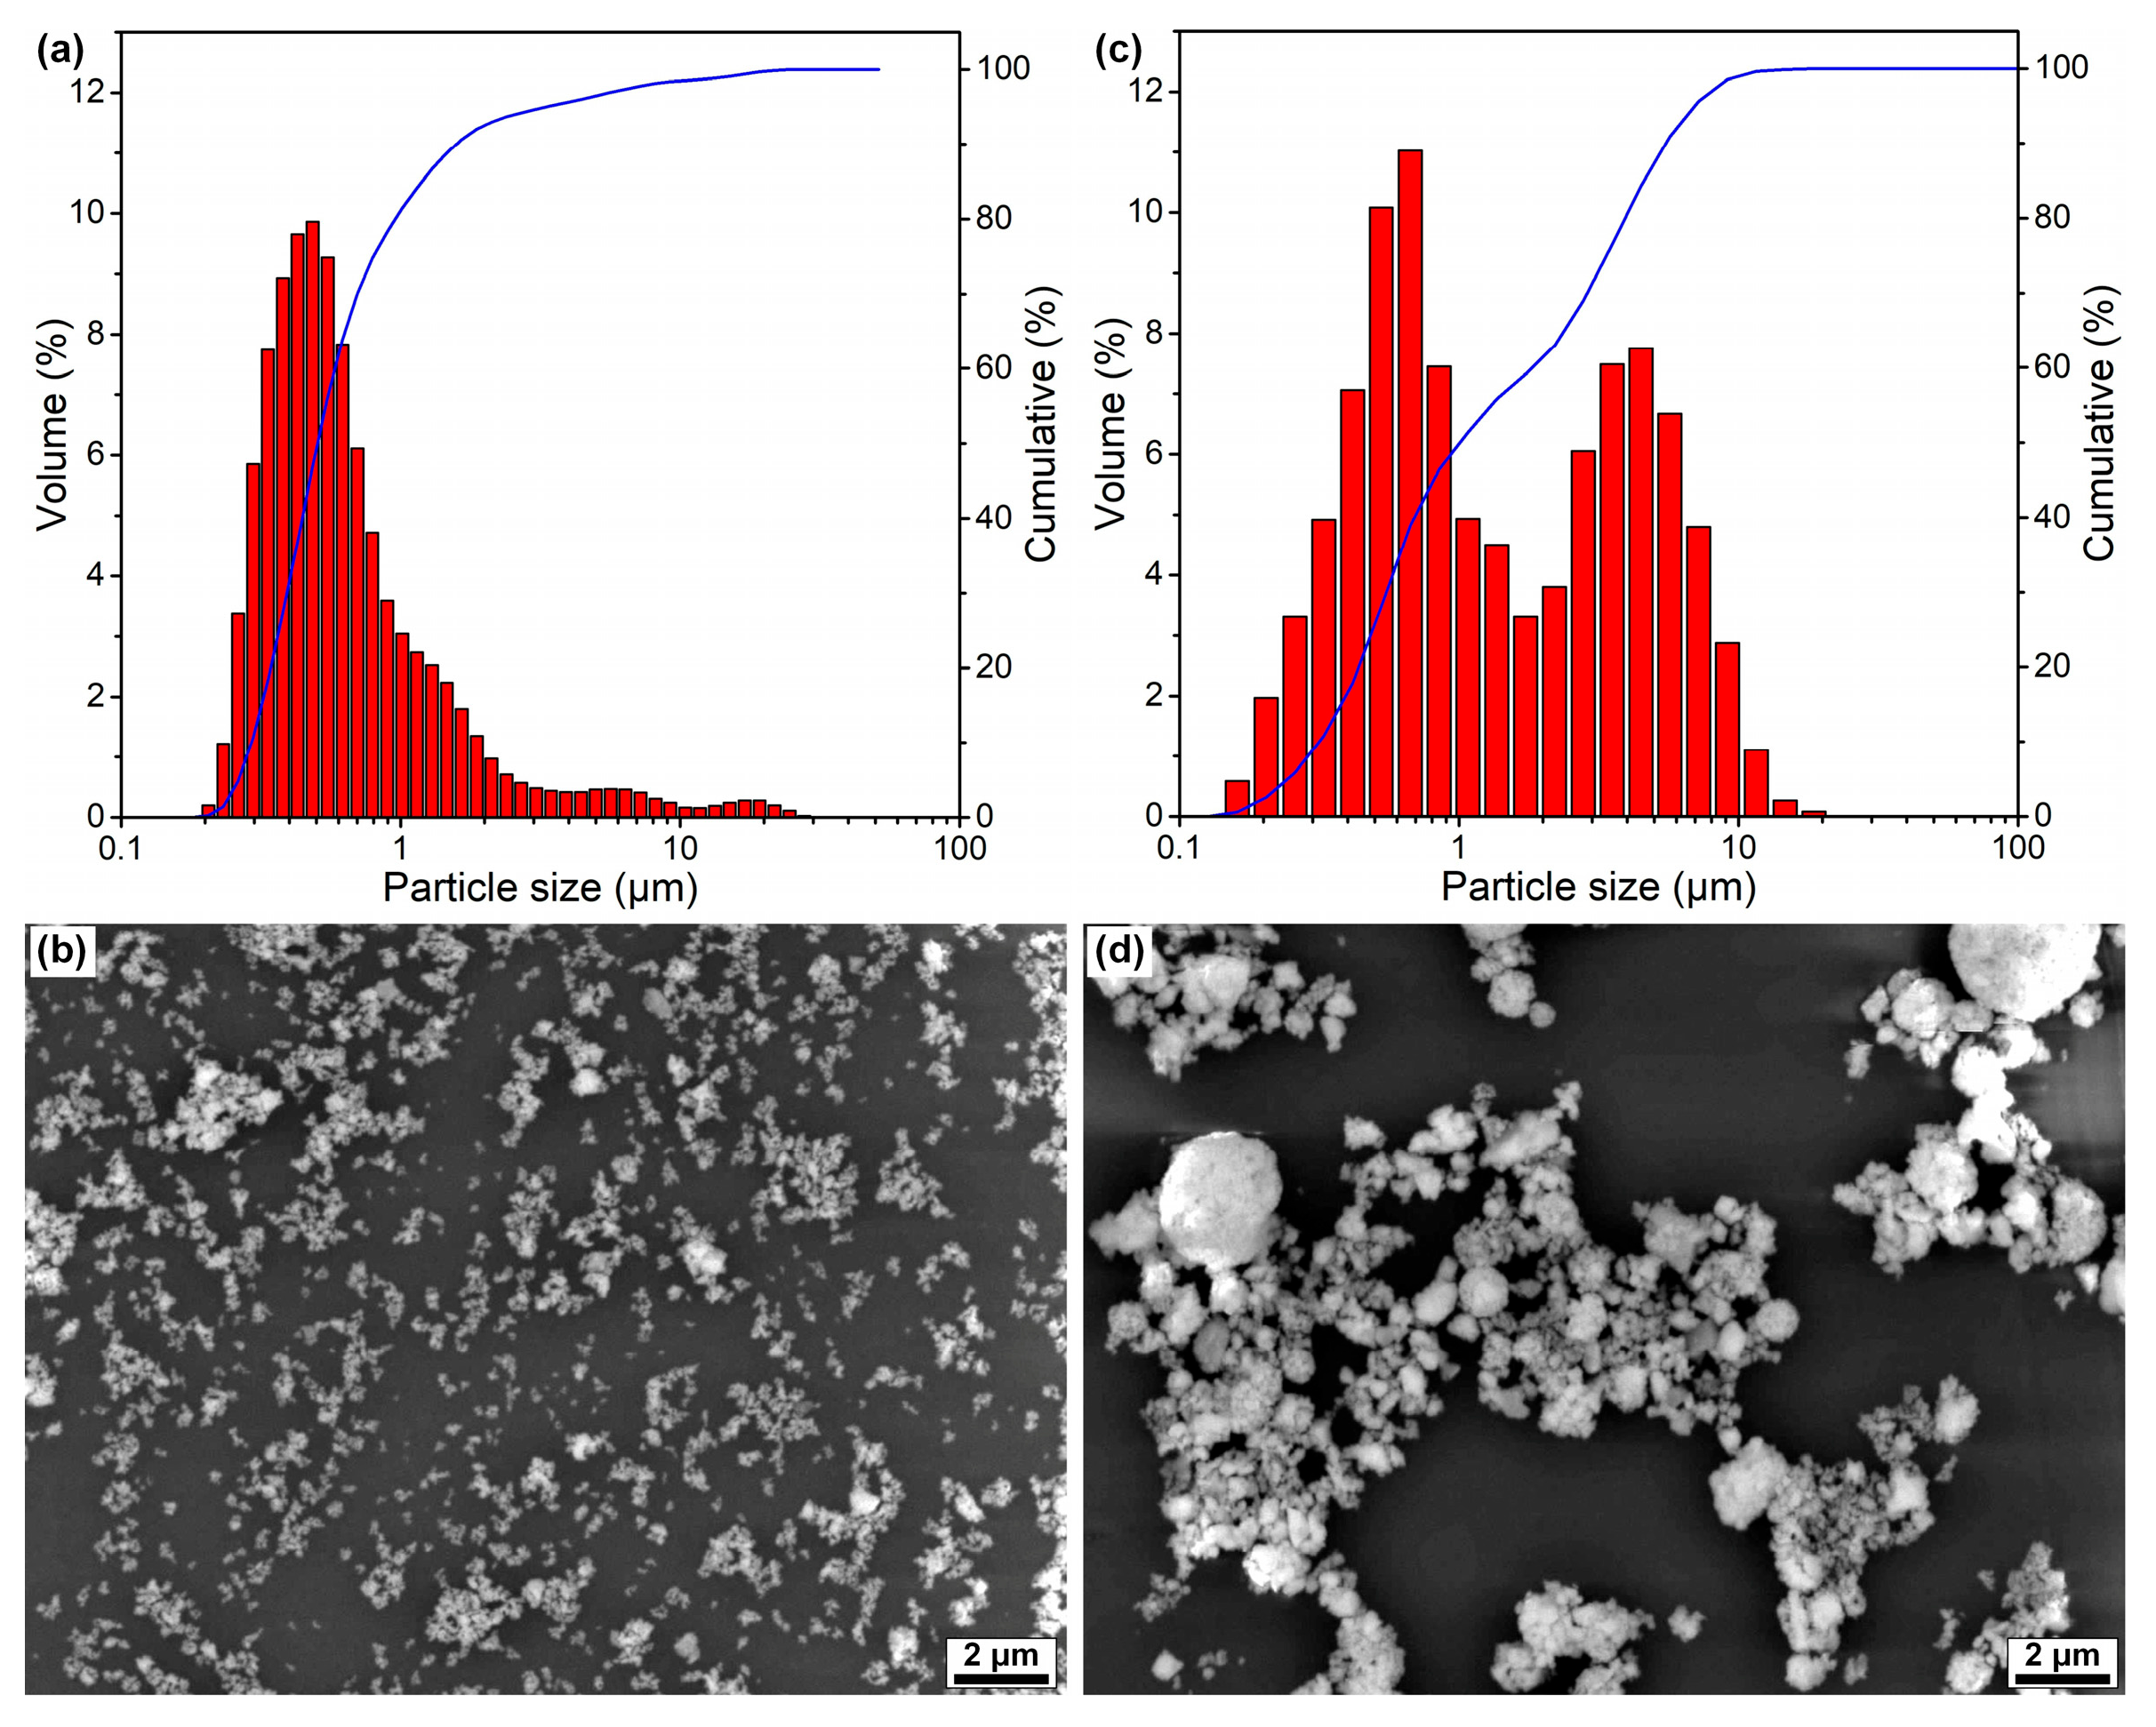
Figure 1. Size distribution and morphologies of the YSZ particles: (a,b) fine particles; (c,d) coarse particles.
Coatings 15 01132 g001
Figure 2. The variations in suspension viscosity with the change in PEI amount. The inset shows the optimized suspensions in vials.
Coatings 15 01132 g002
Figure 3. The surface tension of different suspensions. The inset shows the pendant droplet image and the geometric dimensions used to calculate the surface tension.
Coatings 15 01132 g003
Figure 4. The XRD patterns of coatings deposited using different suspensions.
Coatings 15 01132 g004
Figure 5. The cross-sectional and top surface microstructures of the F-E coatings.
Coatings 15 01132 g005
Figure 6. The cross-sectional and top surface microstructures of the F-W coatings.
Coatings 15 01132 g006
Figure 7. The cross-sectional and top surface microstructures of the C-E coatings.
Coatings 15 01132 g007
Figure 8. The cross-sectional and top surface microstructures of the C-W coatings.
Coatings 15 01132 g008
Figure 9. Modelling of the diverted plasma jet: (a) velocity contour; (b) temperature contour; (c) gas velocity streamline; and (d) gas velocity vectors.
Coatings 15 01132 g009
Figure 10. Modeling of the movement of particles of different sizes: (a) 0.1 to 2.5 μm; (b) 2.5 to 5 μm; (c) 5 to 7.5 μm; and (d) 7.5 to 10 μm. The insets show the high-magnification images of particle movement in the vicinity of the substrate.
Coatings 15 01132 g010
Figure 11. Schematic of the particle impingement and coating formation process.
Coatings 15 01132 g011
Figure 12. The size of the suspension droplets after the aerodynamic breakup of the suspension stream, and the YSZ particles transitioned from the atomized suspension droplets.
Coatings 15 01132 g012
Figure 13. The single-pass deposits obtained from different suspensions: (a) F-E suspension; (b) F-W suspension; (c) C-E suspension; and (d) C-W suspension.
Coatings 15 01132 g013
Table 1. The designation of suspensions and coatings.
ParticleSolventDispersantSuspensionCoatings
Fine particlesEthanolPEIF-E suspensionF-E coating
Fine particlesWaterPEIF-W suspensionF-W coating
Coarse particlesEthanolPEIC-E suspensionC-E coating
Coarse particlesWaterPEIC-W suspensionC-W coating
Disclaimer/Publisher’s Note: The statements, opinions and data contained in all publications are solely those of the individual author(s) and contributor(s) and not of MDPI and/or the editor(s). MDPI and/or the editor(s) disclaim responsibility for any injury to people or property resulting from any ideas, methods, instructions or products referred to in the content.