Article

Study on the Effects of Micro-Groove Tools on Surface Quality and Chip Characteristics When Machining AISI 201

1
School of Physics and Mechatronic Engineering, Guizhou Minzu University, Guiyang 550025, China
2
Guiyang Xianfeng Machine Tool Co., Ltd., Guiyang 550601, China
3
School of Mechanical Engineering, Guizhou University, Guiyang 550025, China
*
Author to whom correspondence should be addressed.
Coatings 2025, 15(10), 1124; https://doi.org/10.3390/coatings15101124 (registering DOI)
Submission received: 13 September 2025 / Revised: 22 September 2025 / Accepted: 25 September 2025 / Published: 28 September 2025
(This article belongs to the Special Issue Alloy/Metal/Steel Surface: Fabrication, Structure, and Corrosion)

Abstract

The excellent mechanical properties of AISI 201 make it well-suited for applications in industrial components, transportation, and household appliances. However, during machining, this material generates high cutting forces and temperatures, leading to rapid tool wear and high costs. To address this issue, micro-grooves were designed on the rake face in areas prone to thermal and mechanical stress concentration. Through machining experiments focusing on workpiece surface quality, it was found that micro-grooved tools produced superior surface quality, specifically manifested in lower surface roughness, reduced work hardening, and shallower hardened layer depth. Experiments demonstrate that under identical conditions, increasing the cutting speed with tool M reduces the workpiece surface roughness by 0.096 μm to 0.236 μm compared to tool O. Under identical conditions, increasing the feed rate with tool M reduces the workpiece surface roughness by 0.070 μm to 0.236 μm compared to tool O. As cutting speed varies, the absolute surface hardness of workpieces machined by tool M decreases by approximately 39.85 HV, representing a hardness reduction of 14.5%. As feed rate varies, the surface hardness of workpieces machined with tool M is suppressed to a level 10.2%–14.2% lower than that of tool O. As cutting depth varies, the surface hardness of workpieces machined with tool M is suppressed to a level 10.0%–14.7% lower than that of tool O. Additionally, micro-grooved tools demonstrated superior chip curling and breaking performance. This tool design approach, optimized for tool durability and workpiece surface quality, establishes a research foundation for tool design targeting difficult-to-machine materials.

1. Introduction

AISI 201 is designed as a chromium–manganese–nickel austenitic alloy. Its excellent plastic forming capability and good mechanical strength make it well-suited for applications in industrial components, transportation, and household appliances [1,2,3]. However, the material’s high strength [4,5], high elongation [6], and low thermal conductivity [7] during machining cause severe crescent-shaped pitting wear, adhesive wear, and plastic deformation on the rake face of conventional cemented carbide tools. This is accompanied by severe work hardening and high-temperature softening effects [8,9,10,11].
Current approaches to addressing stainless steel machining challenges primarily include coating technologies [12,13], tool material optimization [14,15], and cutting fluid improvements [16,17]. Research indicates that TiAlN coatings can extend tool life by 40–60%, though at approximately triple the cost [18]. In recent years, functional surface structure design has offered new approaches for efficient stainless steel machining. Among these, micro-groove structures on the rake face effectively reduce heat accumulation by altering chip flow characteristics [19,20,21]. Zhang et al. [22] analyzed the effective working area on milling cutter surfaces and designed microgrooves within this zone. Experiments demonstrated a 10%–30% reduction in cutting force, a 10%–20% decrease in cutting temperature, and an 8%–12% improvement in surface roughness. Systematic research on 201 stainless steel remains largely unexplored. Notably, existing research predominantly focuses on 304 stainless steel [23,24,25], with insufficient investigation into special alloy systems like 201 stainless steel, which contains higher manganese content (5.5–7.5%). This study selected AISI 201 steel as its subject, with significant importance stemming from this material’s role as an economical nickel-saving stainless steel. Its chemical composition design, which partially substitutes nickel with manganese and nitrogen, maintains excellent corrosion resistance and formability while significantly reducing costs. Compared to the extensively studied AISI 304, AISI 201’s unique chemical composition presents distinct processing challenges. It exhibits a higher work hardening rate and lower thermal conductivity, leading to increased cutting forces, accelerated tool wear, and severe heat accumulation during machining. More critically, its exceptional toughness readily forms continuous ribbon chips, posing a serious threat to machining quality and automated production safety. To address the aforementioned issues, this study designed a novel composite micro-groove structure on the rake face of cemented carbide tools and systematically investigated the influence of micro-groove parameters on cutting performance through single-factor cutting experiments.
Numerous scholars have investigated the impact of innovative structured tools on the cutting process by examining various combinations of cutting parameters [26,27,28]. Research indicates that micro-structured tools demonstrate improvements in both cutting force and cutting temperature, particularly under energy-saving cutting conditions: under dry cutting conditions, micro-structured tools can reduce the principal cutting force by approximately 10% and lower cutting temperature by about 12%. Simultaneously, these tools exhibit excellent chip breaking performance during machining. Jin et al. designed a novel micro-end mill for micro-groove array machining, finding that surfaces processed by this tool exhibit high uniformity and low surface roughness [29]. Deng et al. [30] developed a micro-groove-structured variable-pitch ball-nose end mill to overcome the effects of chatter and vibration patterns in machining, achieving a workpiece surface roughness below 2.32 µm. The innovation of this study lies in integrating micro-groove structures with the machining characteristics of 201 stainless steel, revealing quantitative relationships between micro-groove tools and cutting performance through experimental data. The findings not only provide a novel technical solution for efficient machining of 201 stainless steel but also offer theoretical foundations and practical references for functional tool design. Particularly in the energy equipment manufacturing sector, this technology enhances cutting efficiency, yielding significant economic benefits.

2. Experimental Principles and Methods

2.1. Design of Micro-Groove Cutting Tool

The tool design process is shown in Figure 1. Following cutting simulation, high-temperature zones serve as primary screening data points. A defined temperature range is selected for data extraction. Within the Deform operating platform, temperature and coordinate data for these points are exported. Through numerical operations in Matlab 2021 software, the spatial positions of data points are reconstructed to form a point cloud data file. A mesh surface is then constructed, which functions as the reference surface for Boolean operations. This surface is utilized to generate the initial micro-groove model within the original tool. The original tool and micro-groove tool are referred to as Tool O and Tool M, respectively.
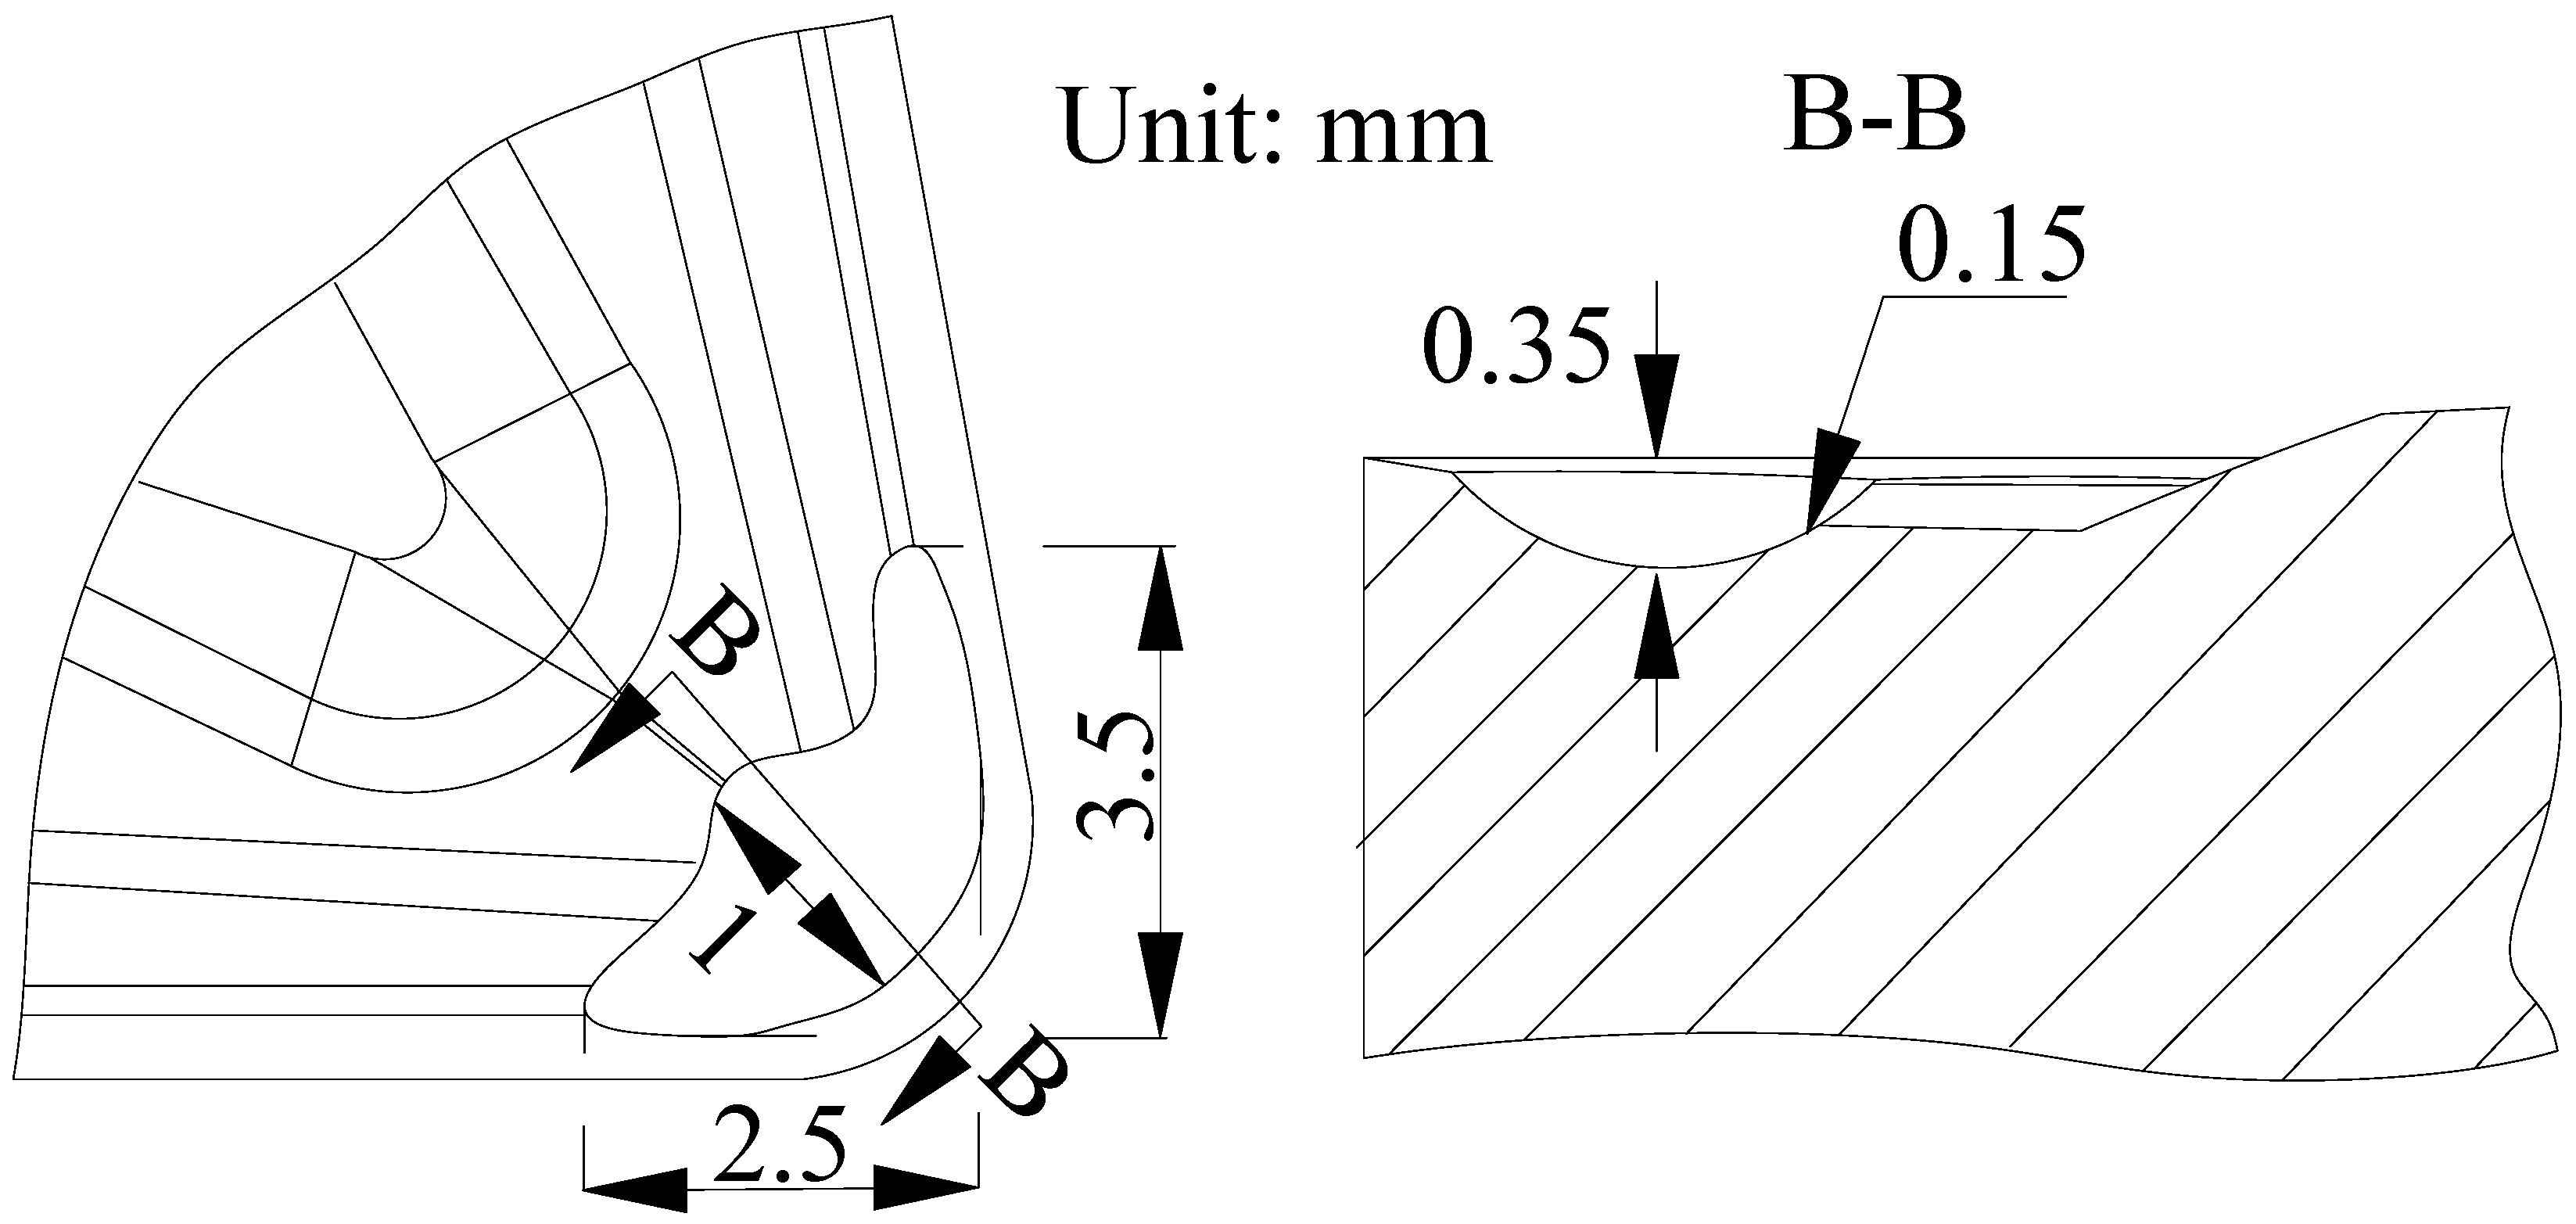
Micro-grooves are determined based on the high-temperature zone (exceeding 400 °C) simulated during tool cutting, which also represents the region of maximum tool-chip contact stress. Concurrently, tool strength is comprehensively considered, with dimensions established by setting boundaries 1.5 mm from both the primary and secondary cutting edges. The micro-groove dimensions are illustrated in Figure 2.

2.2. Research on Tool Cutting Experiments and Workpiece Surface Quality

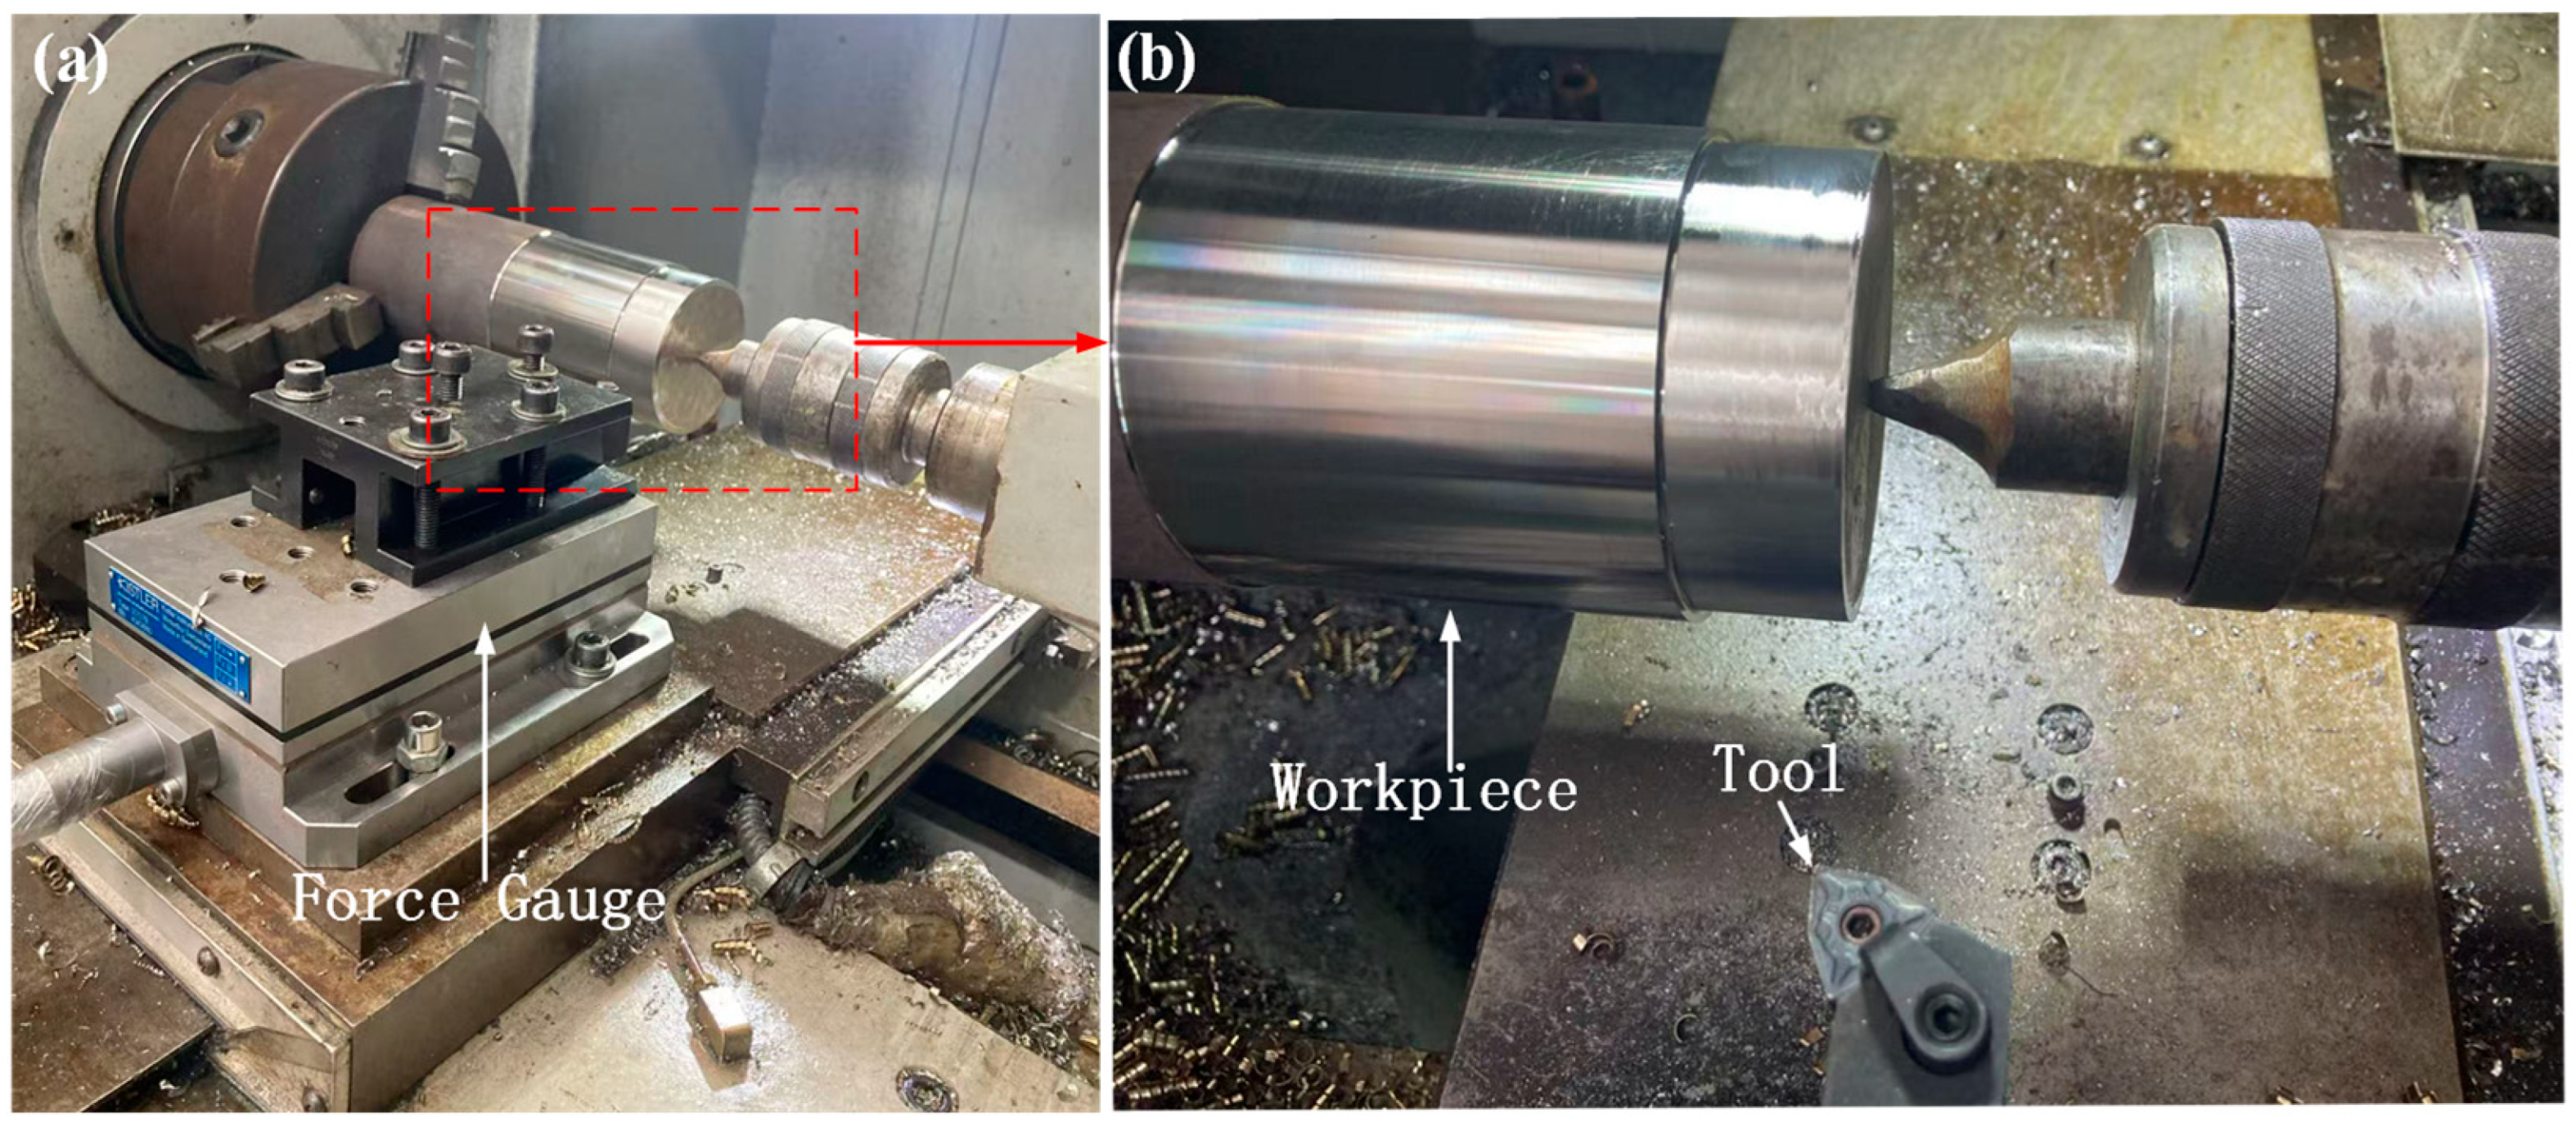
Cutting tests were conducted on the C2-6136HK CNC lathe using carbide tools (with a tungsten carbide substrate) featuring a TiAlN coating on their surfaces. As shown in Figure 3, the workpiece was an AISI 201 cylindrical bar with a diameter of 80 mm and a length of 200 mm.
Since micro-groove design is specifically intended to enhance tool durability and improve cutting performance, dry cutting was employed in this study to prevent interference from cutting fluids on experimental results.
Some scholars have discovered in cutting force experiments that increasing the cutting depth causes cutting forces to increase exponentially, placing higher demands on tool stability. Therefore, they recommend maintaining the cutting depth within a moderate range of 1–2 mm to avoid severe vibration and premature tool failure [31]. Other researchers have examined the effects of cutting speed and feed rate when turning hardened stainless steel with coated carbide tools. Studies indicate that a combination of low cutting speed and low feed rate represents the optimal cutting parameters for achieving long tool life, low surface roughness, and low cutting forces [32]. Consequently, the selection of cutting parameter ranges for this study is outlined below. Tool performance parameters are detailed in Table 1, tool angles in Table 2, and the cutting test plan in Table 3.
Under different cutting parameters (cutting speed, feed rate, cutting depth), the cutting force (Fc) obtained from cutting simulations exhibited systematic differences compared to actual measured values (simulation values were generally 25%–30% higher than measured values). Furthermore, the p-values for all experimental groups were less than 0.05, indicating that these differences were statistically significant. However, the response trends of simulated and measured data to parameter changes were highly consistent—cutting force increased significantly with rising feed rate and depth of cut, while showing a slight decrease with increasing cutting speed. This demonstrates that although the cutting force simulation model overestimates absolute values, it effectively reflects the variation patterns of actual cutting forces and possesses reliable engineering predictive value.
During the machining process, the microgeometric morphology of the workpiece’s machined surface is influenced by various factors, among which the tool geometry, built-up edges (BUEs) formed during machining, and burrs are particularly critical. These factors create a peak-and-valley structure with specific height differences on the workpiece surface. This microscopic contour height deviation, i.e., the height difference between adjacent peaks and valleys on the surface contour, is defined as surface roughness. It is one of the core indicators for evaluating the machining quality of the workpiece surface.

2.2.1. Comparison of Workpiece Surface Roughness

As a core element of machining, the tool has a decisive influence on the final surface roughness of the workpiece. To investigate the mechanism by which tool structure affects surface quality, this study focuses on micro-groove tools. By designing and conducting the aforementioned single-factor machining experiments, this study will compare and analyze the surface roughness performance of workpiece machined with the tool O and the tool M under identical machining conditions.
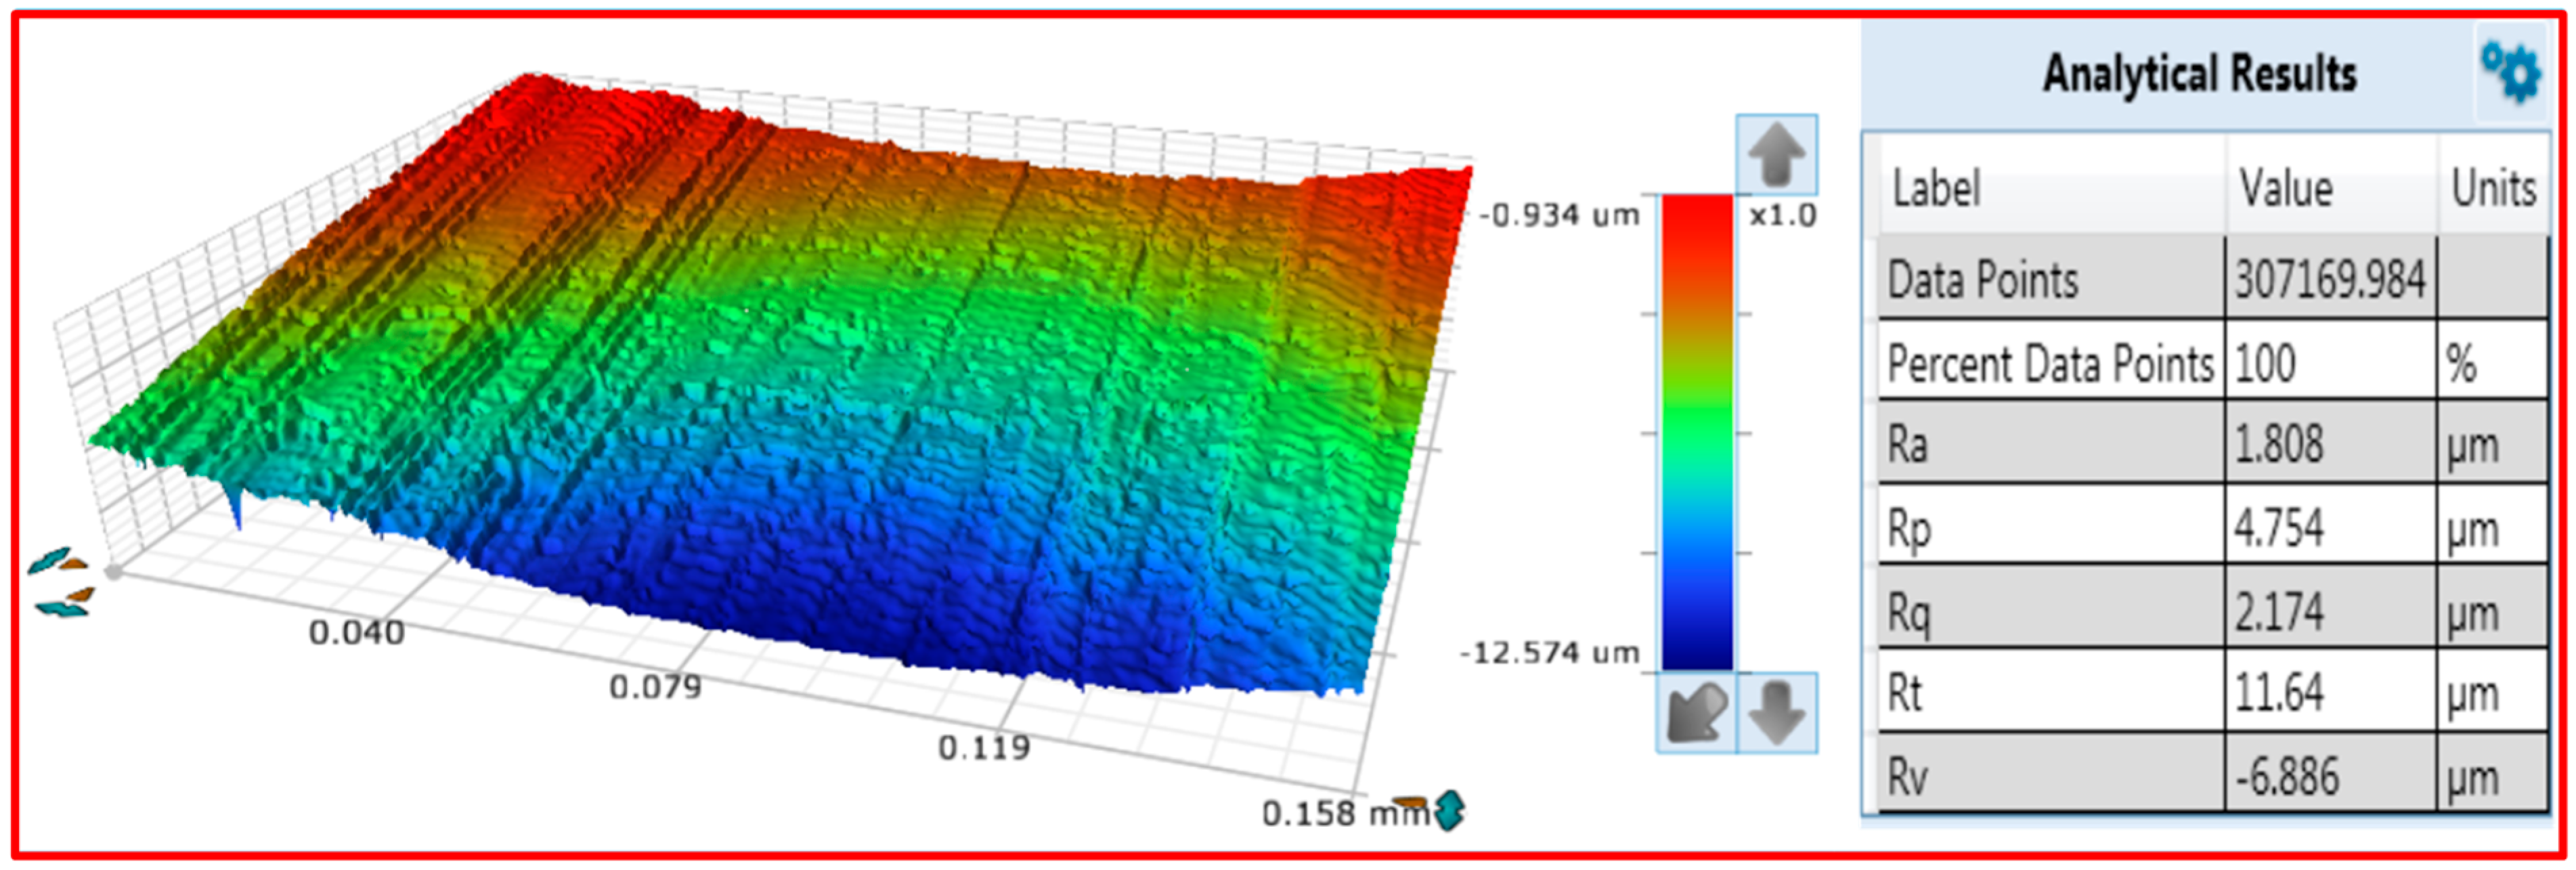
First, we measured the surface roughness of the workpiece using a Bruker optical pro filometer, obtaining the overall surface roughness of the workpiece, all roughness measurements are taken along the workpiece axis (perpendicular to the feed direction) to capture the most representative surface texture characteristics. The measurement data is shown in Figure 4. The three-dimensional topography map of the workpiece surface reveals distinct non-uniform texture features, with alternating peaks and valleys. Localized areas exhibit material buildup and scratch defects. Warm-coloured regions correspond to surface protrusions (peaks), while cool-coloured regions indicate deep valleys, reflecting the uneven surface topography resulting from tool-workpiece interaction during machining. Roughness parameter results indicate that the workpiece surface has an arithmetic mean roughness Ra = 1.808 μm, representing a moderate level, indicating the surface is not entirely smooth. The root mean square roughness Rq = 2.174 μm is slightly higher than Ra, suggesting the presence of relatively pronounced peak-and-valley undulations on the surface. The significant disparity between the maximum peak height Rp (4.754 μm) and the maximum valley depth Rv (−6.886 μm) reveals pronounced high peaks and deep valleys on the surface.
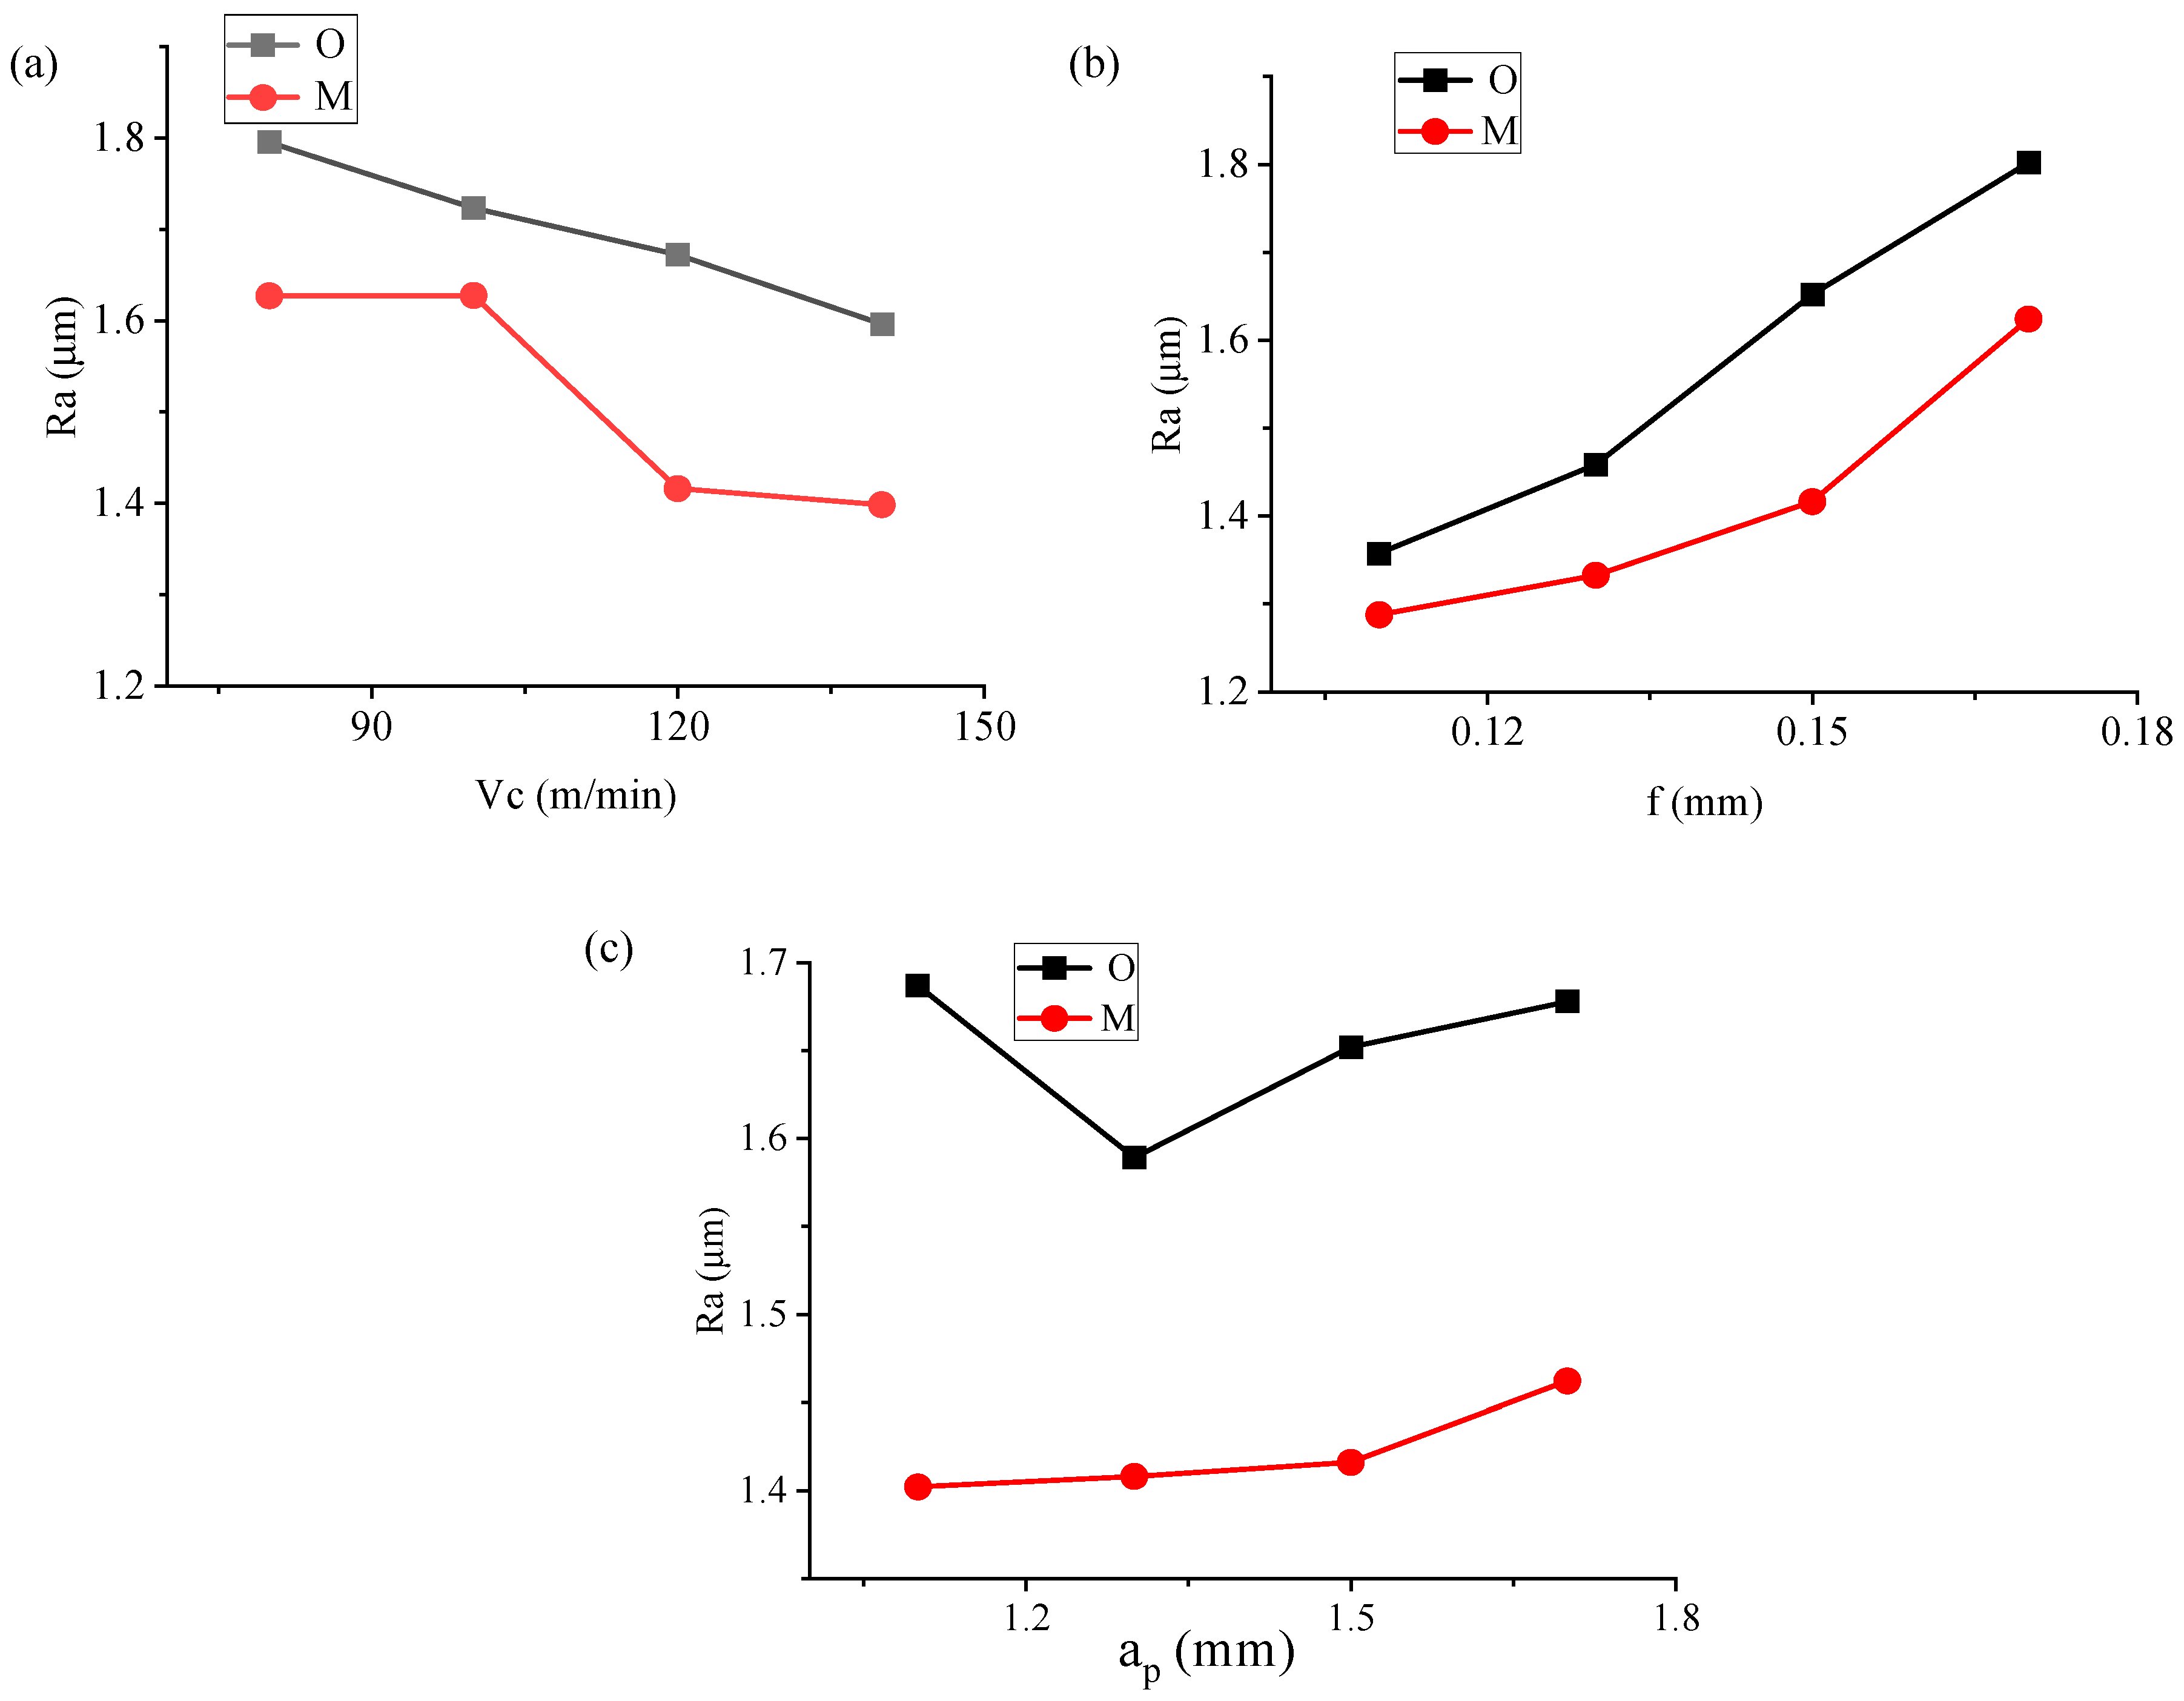
When conducting cutting experiments on micro-groove tools designed in-house, it is crucial to analyze the impact of cutting parameters on surface roughness, as these directly correlate to the engineering practicality and process adaptability of tool innovation designs. The effects of different cutting parameters on surface roughness during machining experiments are shown in Figure 5.
As shown in Figure 5a, under conditions where the feed rate and cutting depth remain constant, the surface roughness of the workpiece decreases as the cutting speed increases for both Tool O and Tool M. Tool O’s workpiece surface roughness decreases as cutting speed increases. Under the same conditions, compared to Tool O’s workpiece, Tool M’s workpiece surface roughness is smaller, with a reduction range of 0.096 μm to 0.236 μm. As shown in Figure 5b, under conditions where cutting speed and cutting depth remain constant, the surface roughness of workpieces processed by tools O and M increases with increasing feed rate. Under the same conditions, compared to the workpiece processed by tool O, the surface roughness of the workpiece processed by tool M is smaller, with a reduction range of 0.070 μm to 0.236 μm. As shown in Figure 5c, when the cutting depth increases from 1.1 mm to 1.3 mm, the surface roughness of the workpiece processed by tool O decreases with increasing cutting depth, while the surface roughness of the workpiece processed by tool M increases slightly. When the cutting depth continues to increase, the surface roughness of the workpieces processed by tools O and M both increase.
From the above analysis, it can be concluded that feed rate has the greatest impact on the surface roughness of the machined workpiece, followed by cutting speed, with cutting depth having the least impact. Tool M produces a smaller surface roughness value and a smoother surface. During the cutting process, due to the presence of micro-grooves, tool M experiences lower friction resistance with the workpiece surface and a better friction state, resulting in a lower surface roughness value.

2.2.2. Analysis of Surface Hardening of Workpieces

During metal cutting processes, the surface layer of the workpiece undergoes severe plastic deformation and thermo-mechanical coupling effects. When the tool compresses the material, the high stresses generated in the cutting zone cause the internal grains to elongate, fracture, and fibrillate along the shear direction, accompanied by a sharp increase in dislocation density. Simultaneously, the high cutting temperatures (locally reaching 60%–80% of the material’s recrystallisation temperature) trigger a competitive mechanism between dynamic recovery and dislocation rearrangement. The synergistic effect of these two phenomena results in the formation of a high-density defect structure on the material surface, manifesting macroscopically as work hardening—i.e., the surface microhardness is significantly higher than that of the base material. However, the hardened layer depth is typically limited to the submillimetre scale (typical values of 50–200 μm), with its distribution gradient constrained by both the penetration depth of cutting heat and the plastic strain field.
To quantitatively characterize the influence of the original tool and micro-groove tool on work hardening behaviour, this study subjected workpieces processed by the original tool and micro-groove tool to wire cutting, extracted workpiece samples, and measured their hardness. First, workpieces processed under single-factor conditions were subjected to wire cutting. Since each single-factor experiment involved a processing length of approximately 20 mm, and the specimen surface was approximately square with a side length of 5 mm, the specimen preparation process shown in Figure 5 was designed. Finally, the test surfaces of the specimens were ground, and hardness measurements were conducted using an HV-1000 hardness tester, As shown in Figure 6.
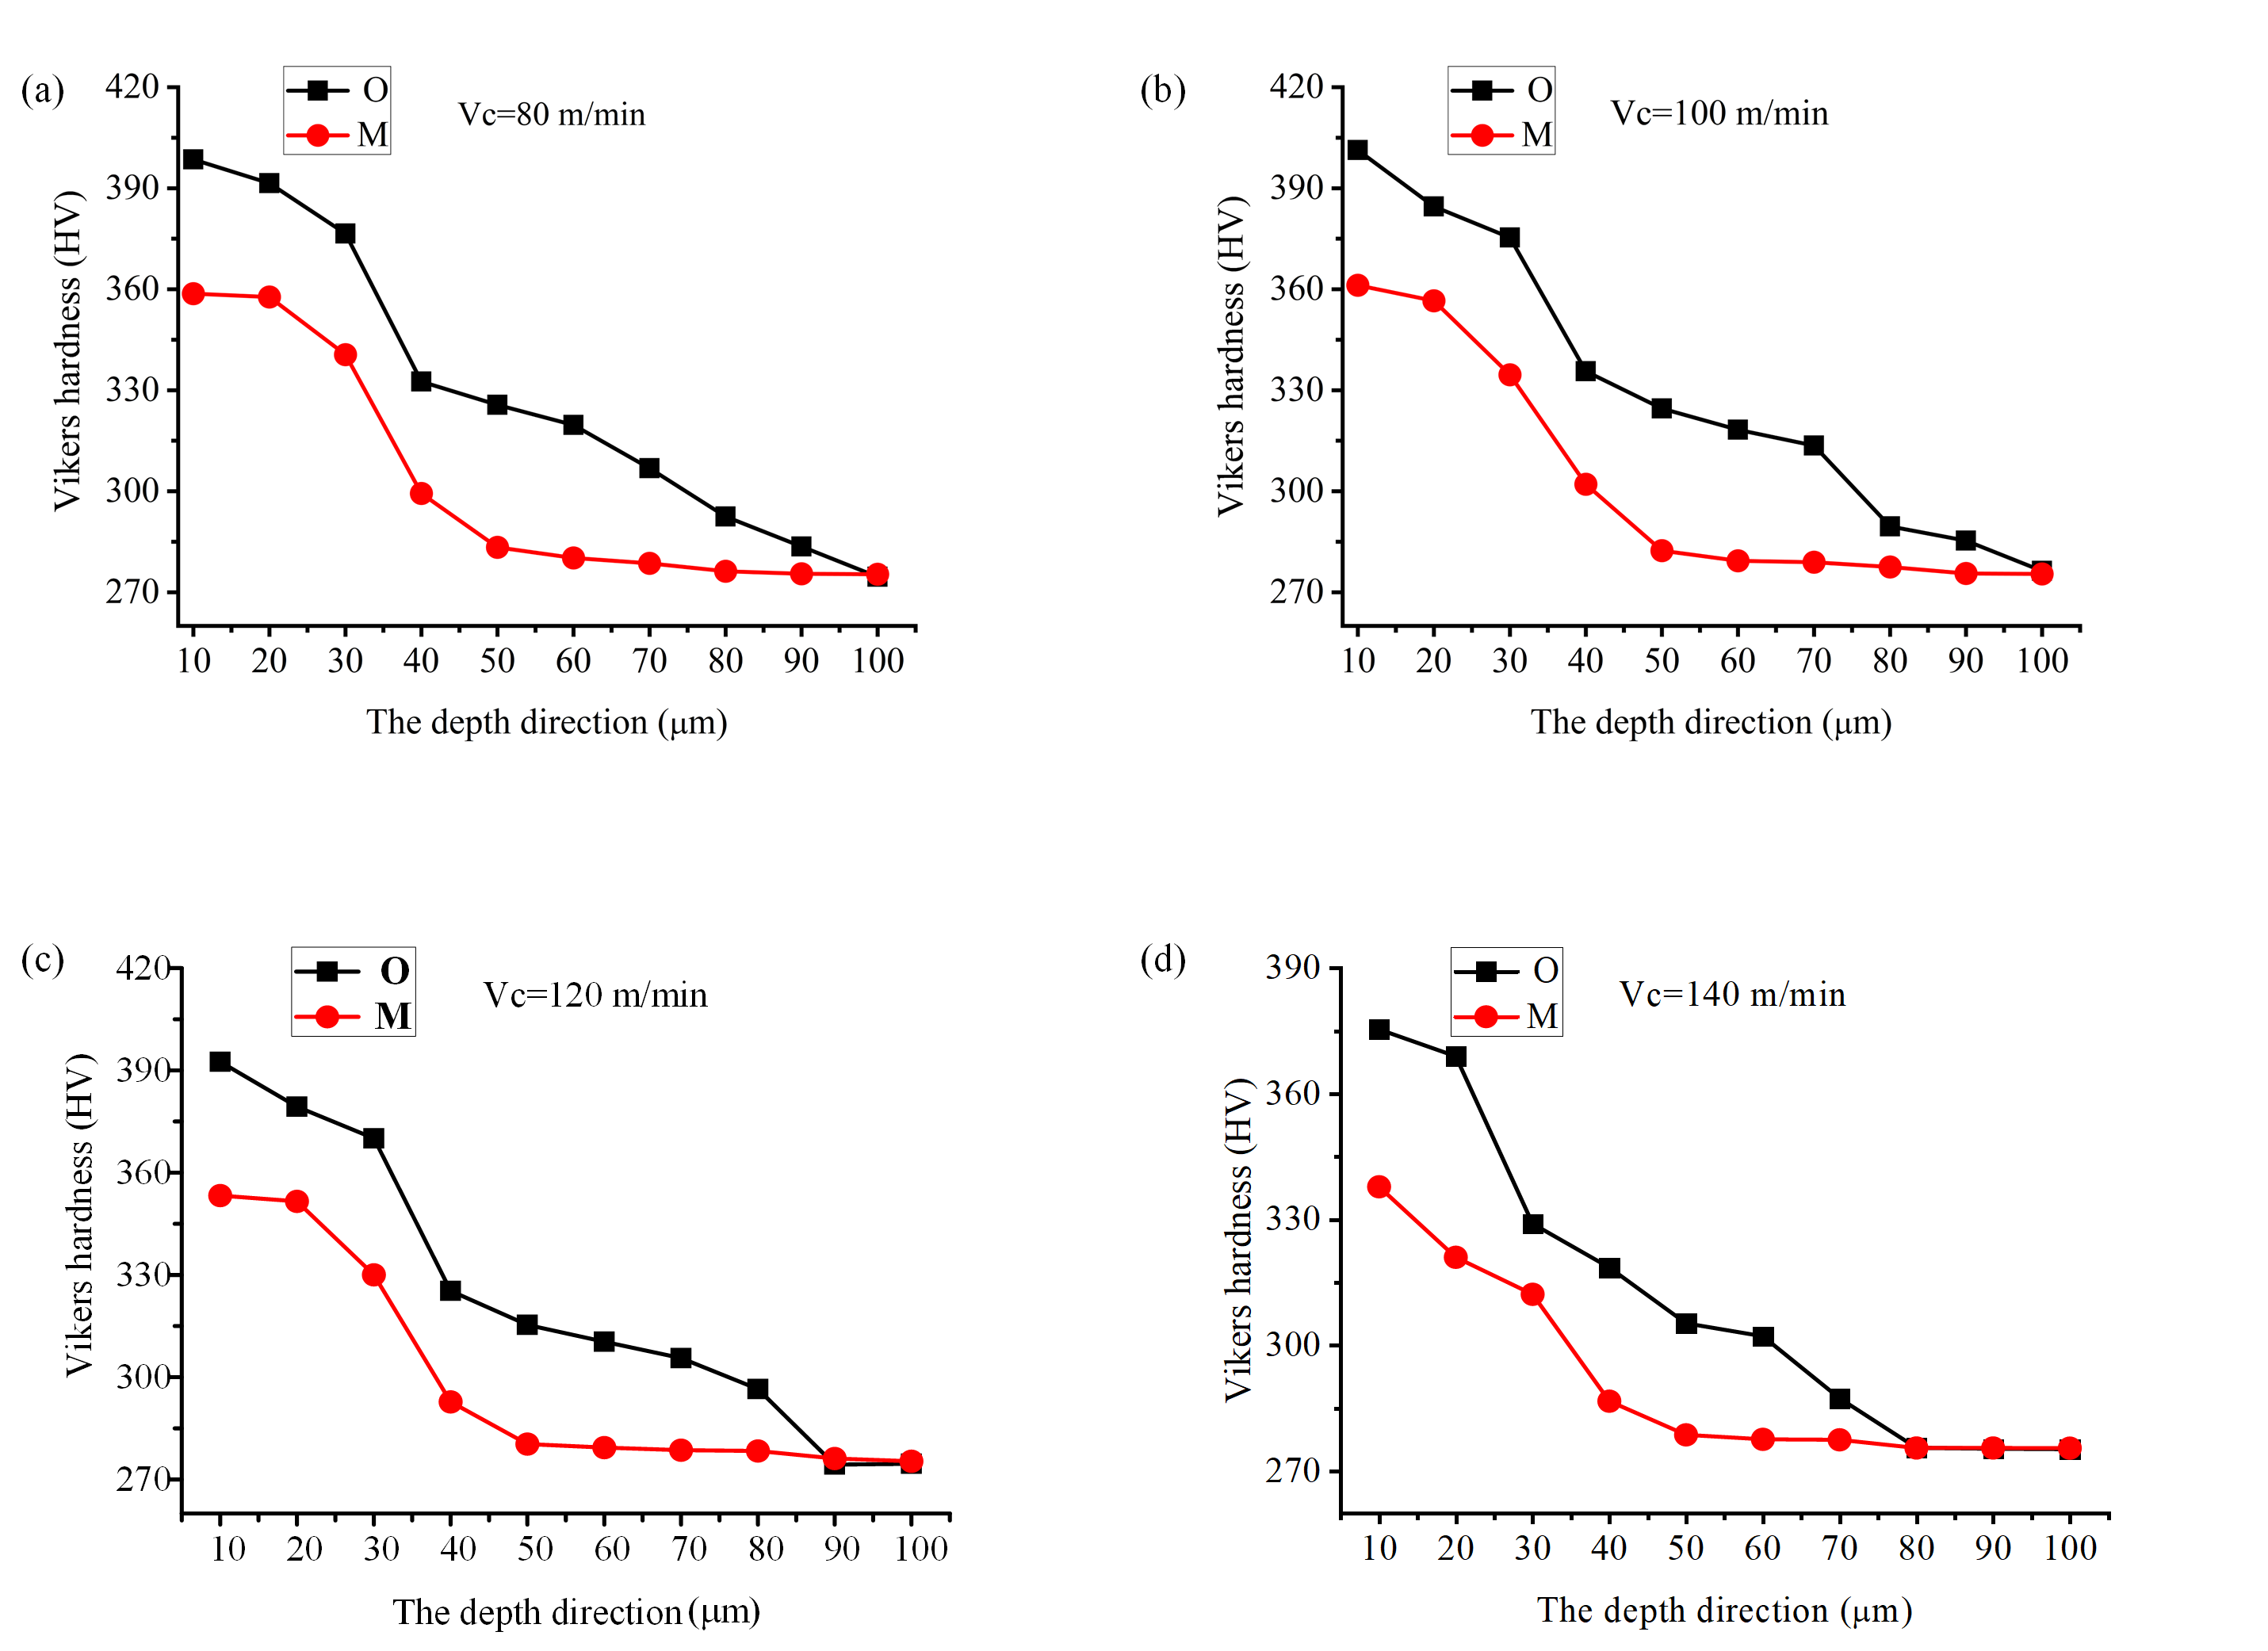
Based on the hardness gradient measurement results in Figure 7, when the feed rate and cutting depth are constant, the work hardening behaviour of AISI 201 stainless steel exhibits regular changes: after machining with the original tool (O), the hardness of the workpiece surface at a depth of 0.1 mm reaches 398.52–401.32 HV (hardening degree 145.15–146.17%). significantly higher than that of the micro-groove tool (M), which ranges from 358.67 to 358.67 HV (130.63–131.55%). As the cutting speed increased from 80 m/min to 140 m/min, the hardening degree of both tools decreased, but the decrease was more pronounced for the micro-groove tool (surface hardness decreased from 130.63% to 123.04%). In terms of hardened layer depth, the original tool’s hardened layer depth was consistently greater than that of the micro-groove tool (1.0→0.8 mm vs. 0.8→0.7 mm), with the most significant difference observed at 120 m/min (0.9 mm vs. 0.7 mm). Overall, this indicates that micro-groove tools effectively suppress plastic deformation intensity by optimizing the distribution of cutting heat and force loads, reducing surface hardening and hardened layer depth by 0.1–0.3 mm, thereby confirming their process advantages in mitigating work hardening damage.
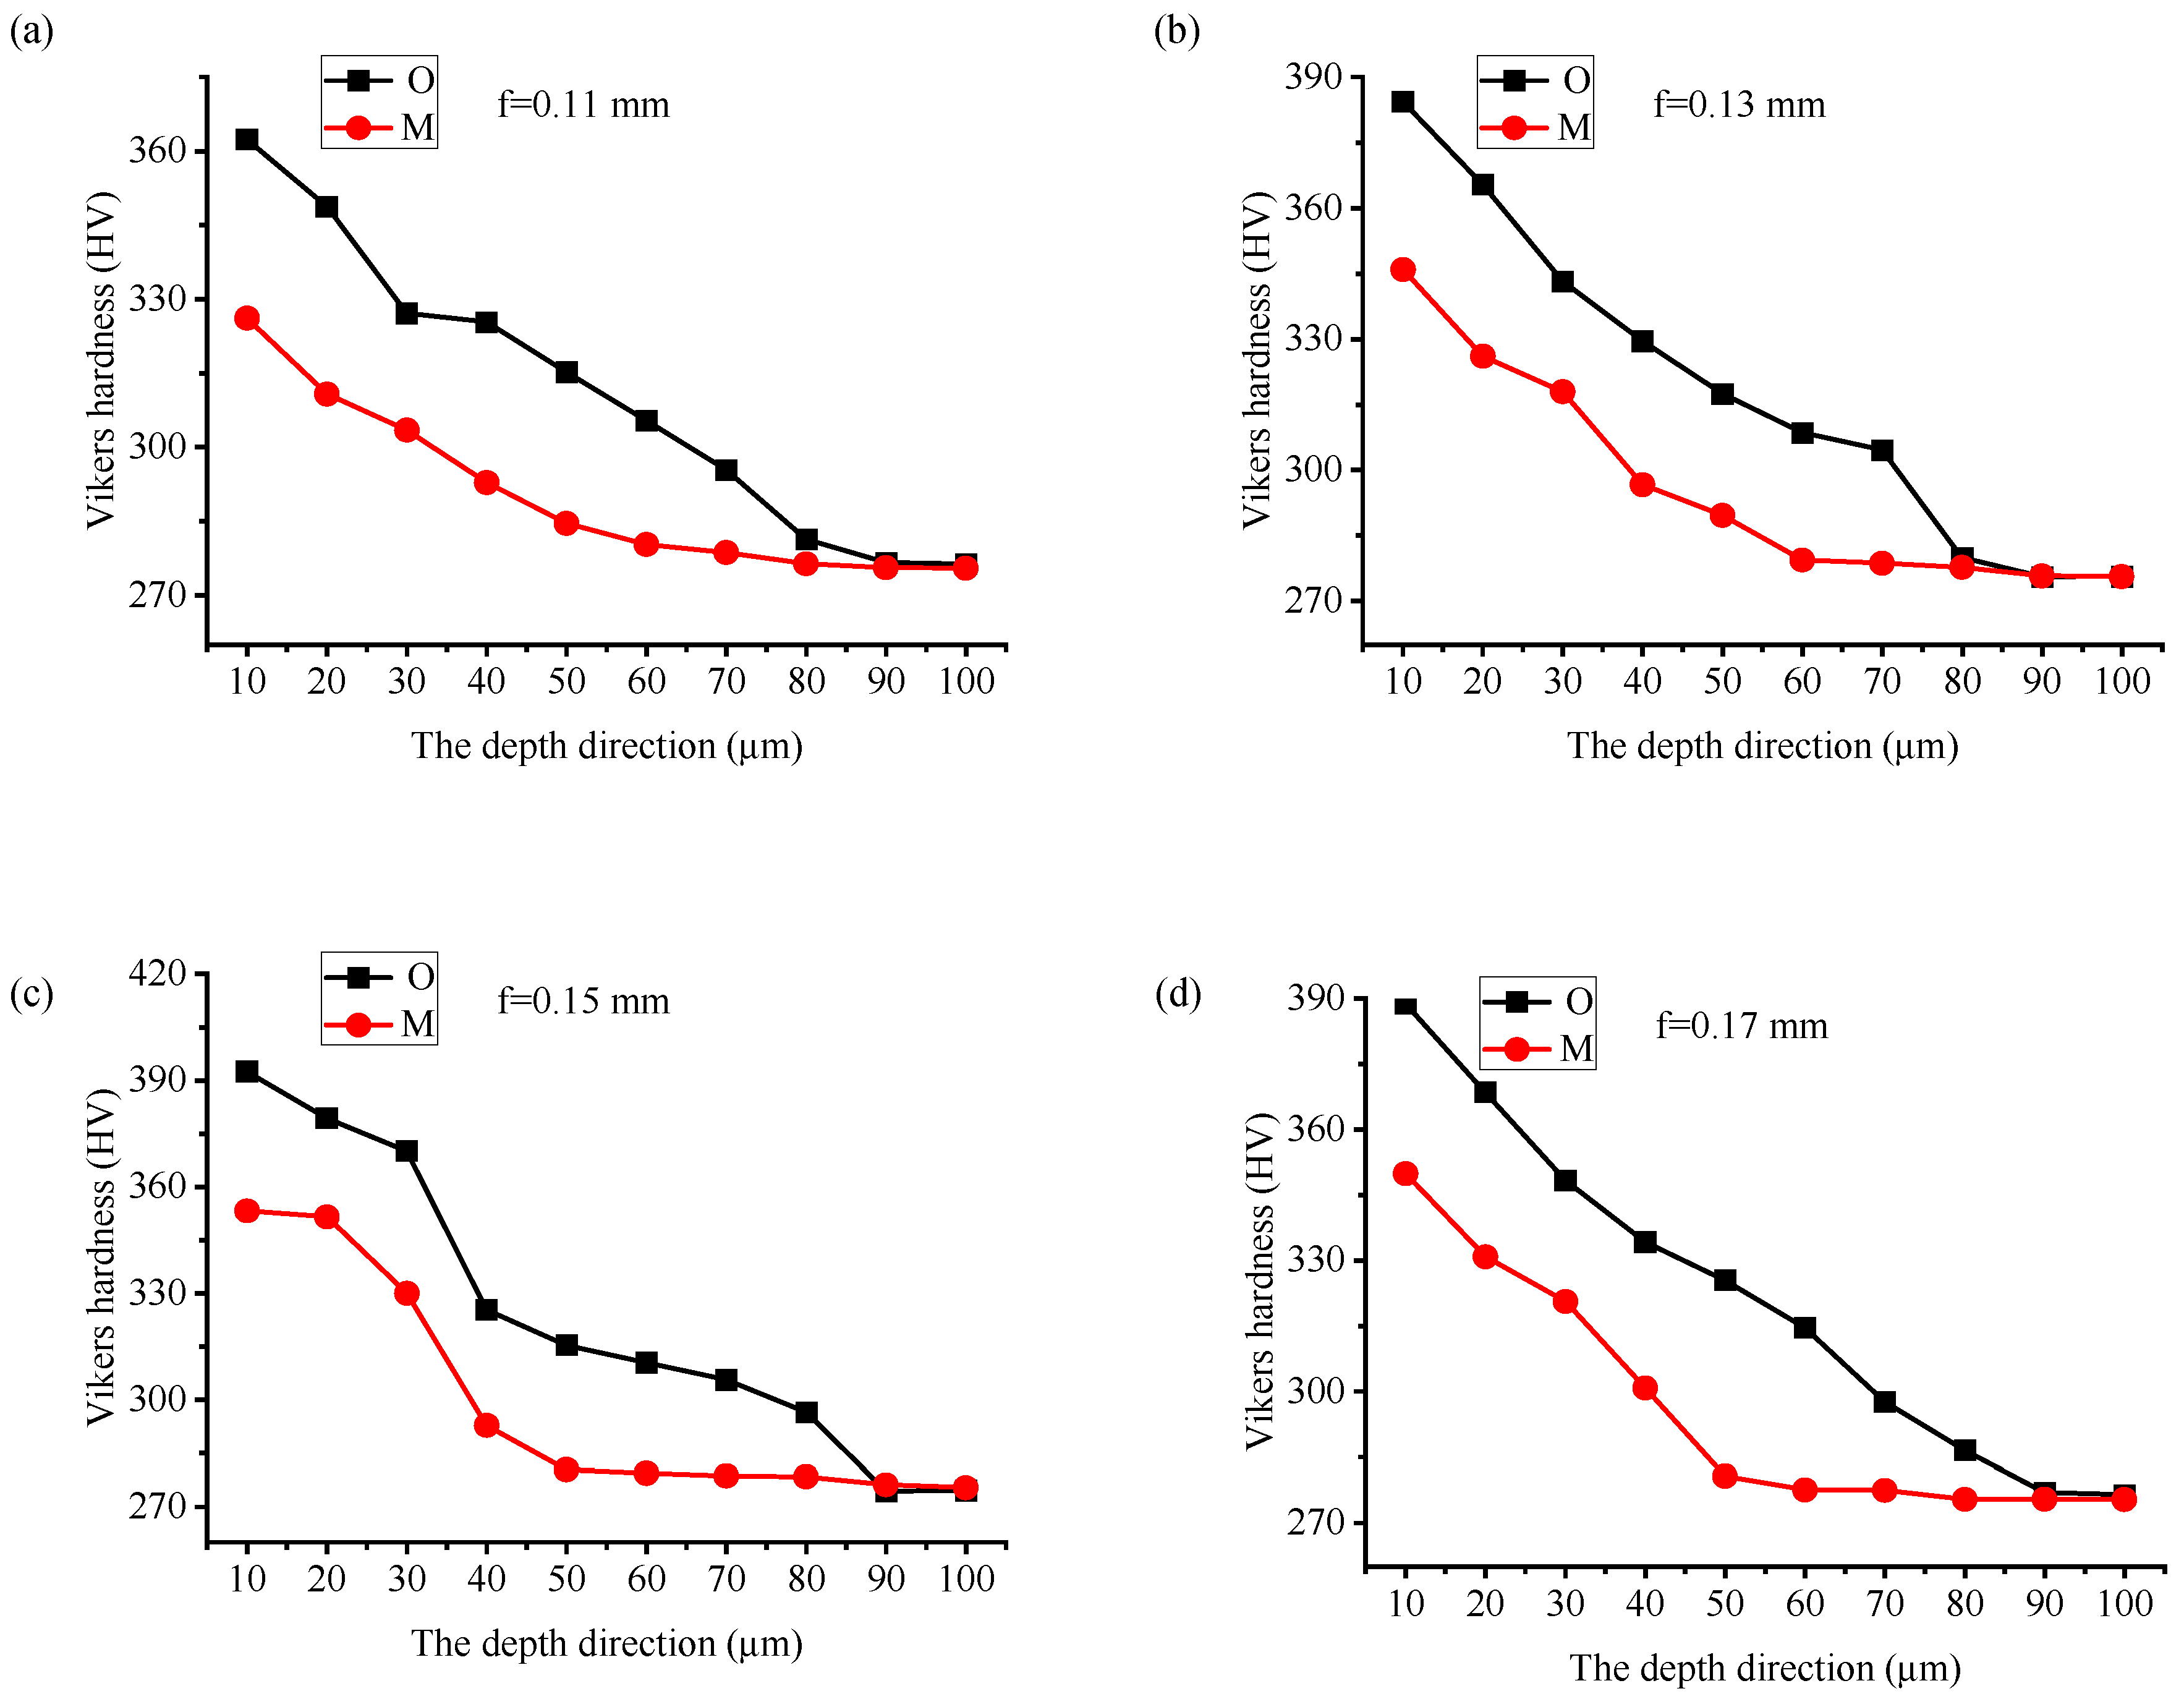
Based on the hardness gradient test results shown in Figure 8, under fixed cutting speed and cutting depth conditions, the influence of feed rate (f) on the work hardening behaviour of AISI 201 stainless steel is as follows: As the feed rate increases from 0.11 mm/r to 0.17 mm/r, the surface hardening degree (at a depth of 0.1 mm) of the workpiece processed by the tool O increases from 131.97% to 142.96%, with the hardening layer depth fluctuating between 0.8 and 0.9 mm; The tool M significantly reduced the hardening degree (118.78% → 128.67%) and hardening layer depth (0.8 → 0.6–0.8 mm). When f = 0.13 mm/r, the hardening layer depth of the micro-groove tool was reduced by 25% compared to the original tool (0.6 mm vs. 0.8 mm); when f increased to 0.15 mm/r, the surface hardening degree was reduced by 14.2% compared to the tool O (128.67% vs. 142.96%). The overall trend indicates: The tool M suppresses hardening to a level 10.2–14.2% lower than the tool O by optimizing the thermal-mechanical load distribution, while reducing the hardened layer depth by 0.1–0.3 mm. This effect is most pronounced at moderate feed rates (0.13–0.15 mm/r), confirming the synergistic benefits of its process advantage in reducing work hardening and its surface roughness control capability.
Based on the hardness gradient test results shown in Figure 9, under fixed cutting speed and feed rate conditions, the influence of cutting depth (ap) on the work hardening behaviour of AISI 201 stainless steel can be summarized as follows: As the cutting depth increases from 1.1 mm to 1.7 mm, the surface hardening degree (at a depth of 0.1 mm) of the workpiece processed by the tool O rises from 131.31% to 146.98%, with the hardening layer depth fluctuating between 0.9 and 1.0 mm; The tool M significantly reduced the hardening degree (118.18% → 132.28%) and hardening layer depth (0.8 mm → 0.6 mm). When ap = 1.7 mm, the tool M reduced the hardening layer depth by 33.3% compared to the tool O (0.6 mm vs. 0.9 mm), while the surface hardening degree decreased by 14.7% (132.28% vs. 146.98%). Overall, the tool M suppresses hardening to a level 10.0–14.7% lower than the original tool by dispersing cutting forces and inhibiting friction-induced temperature rise. As ap increases, the hardening layer depth reduction rate rises from 20% (ap = 1.1 mm) to 33.3% (ap = 1.7 mm). The micro-groove structure optimizes the thermal-mechanical load distribution at the tool-workpiece interface, effectively limiting the depth of dislocation proliferation within the plastic deformation zone.
During the cutting process, microgrooves alter the direction of chip flow, causing chips to extend along the microgrooves. Microgrooves increase the actual cutting rake angle γ0, making the tool sharper, reducing cutting force, lowering cutting temperature, decreasing workpiece plastic deformation, and improving surface roughness. Due to the reduction in cutting force, workpiece work hardening is improved, with a decrease in hardening severity. The combined effects of cutting force and cutting temperature result in a shallower hardened layer thickness when using micro-groove tools to machine workpieces.
It should be noted that in the surface hardening analysis of this study, although errors were controlled through standardized sample preparation and measurement procedures, potential sources of uncertainty must still be considered. These primarily include: thermal effects at the edges potentially caused by wire-cut sampling; surface deformation or edge rounding that may occur during sample preparation; inherent measurement errors of the hardness tester; subjective deviations in indentation positioning and reading; and numerical dispersion resulting from microstructural inhomogeneity in the material. These factors may introduce minor fluctuations in surface hardness values and hardened layer depth determinations. However, their impact is significantly smaller than the primary patterns observed in this study. Therefore, the core conclusion that micro-groove tools significantly suppress work hardening remains robust.

2.2.3. Analysis of Changes in the Macroscopic Morphology of Tool Chips

In metal cutting processes, the intense interaction between the tool and the workpiece causes plastic slippage of the material along the shear plane, accompanied by lattice distortion and a sharp increase in dislocation density. The deformed material undergoes complex multi-directional stress at the tool’s rake face, ultimately forming chips with specific morphological characteristics. The macroscopic morphology of chips and microscopic geometric parameters essentially serve as visualization carriers for the thermal-mechanical coupled loads in the cutting zone, directly revealing the plastic flow mechanisms and energy dissipation pathways of the material in the shear zone and the tool-chip contact zone.
In the field of metal cutting machining, comparing and analyzing the macro-morphology of chips produced by micro-groove tools and conventional tools is of great significance, as it essentially represents a visualization of the distribution of thermal and mechanical loads in the cutting zone and the efficiency of energy transfer. The curling configuration of chips directly reflects the uniformity of material plastic deformation, while fracture patterns reveal the degree of local stress concentration and the critical point of dynamic instability.
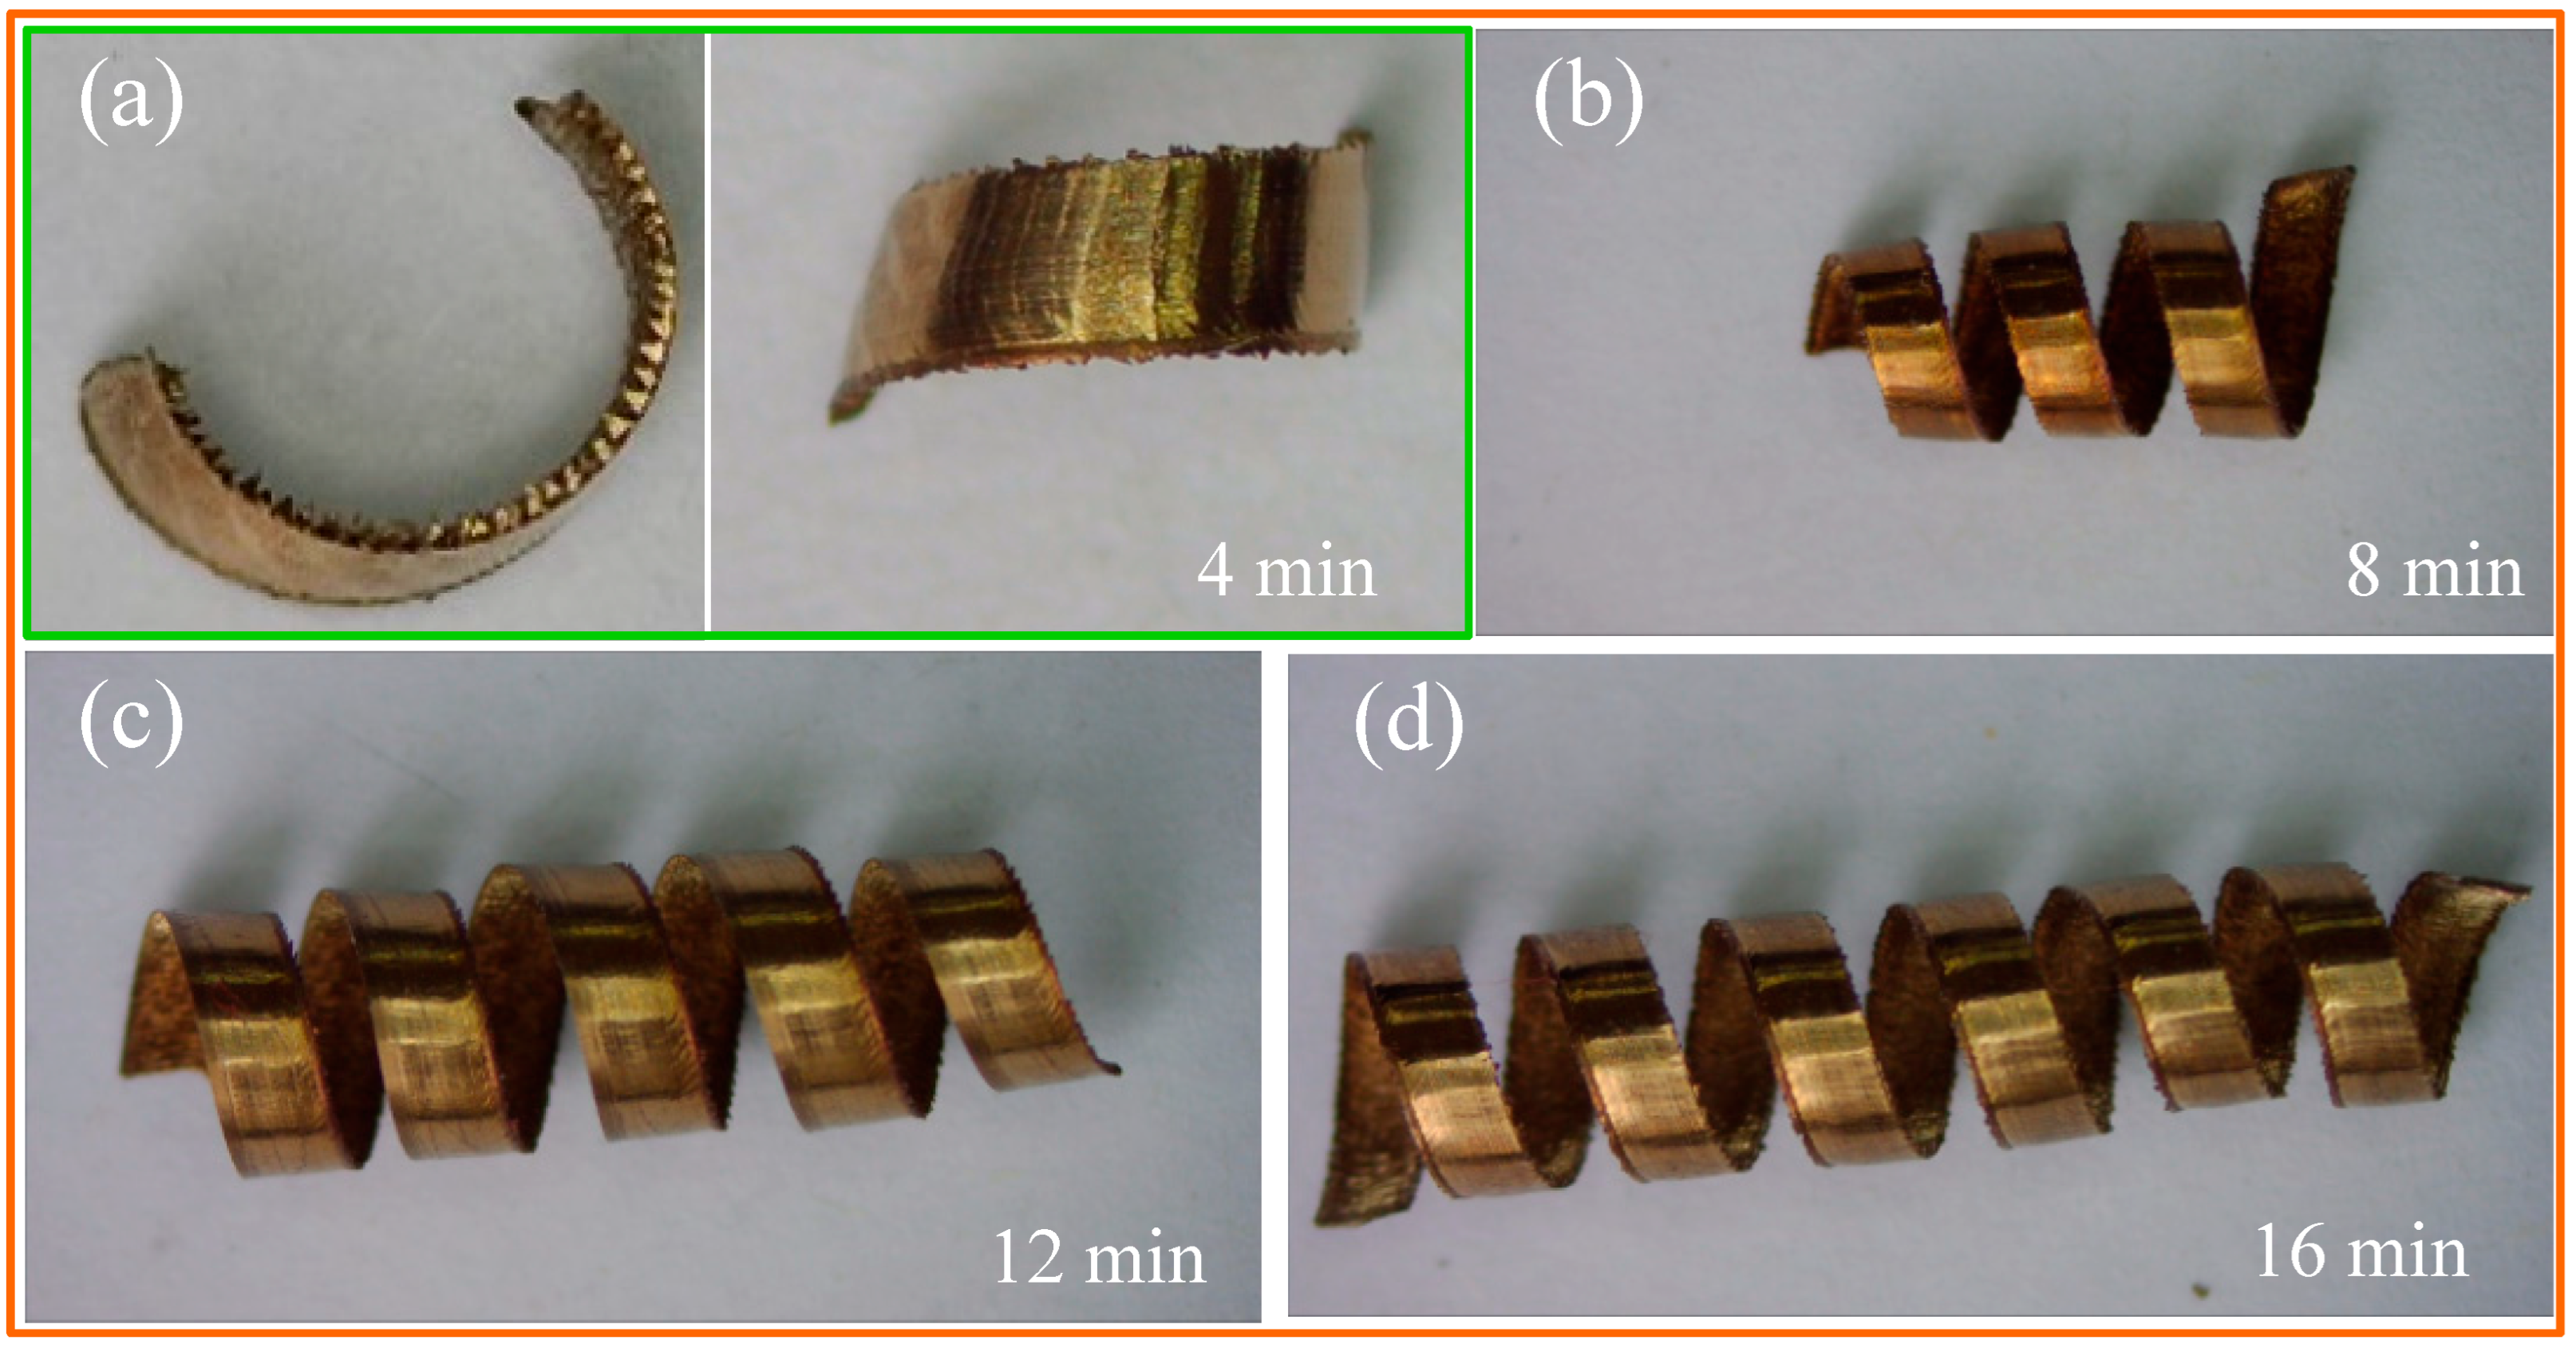
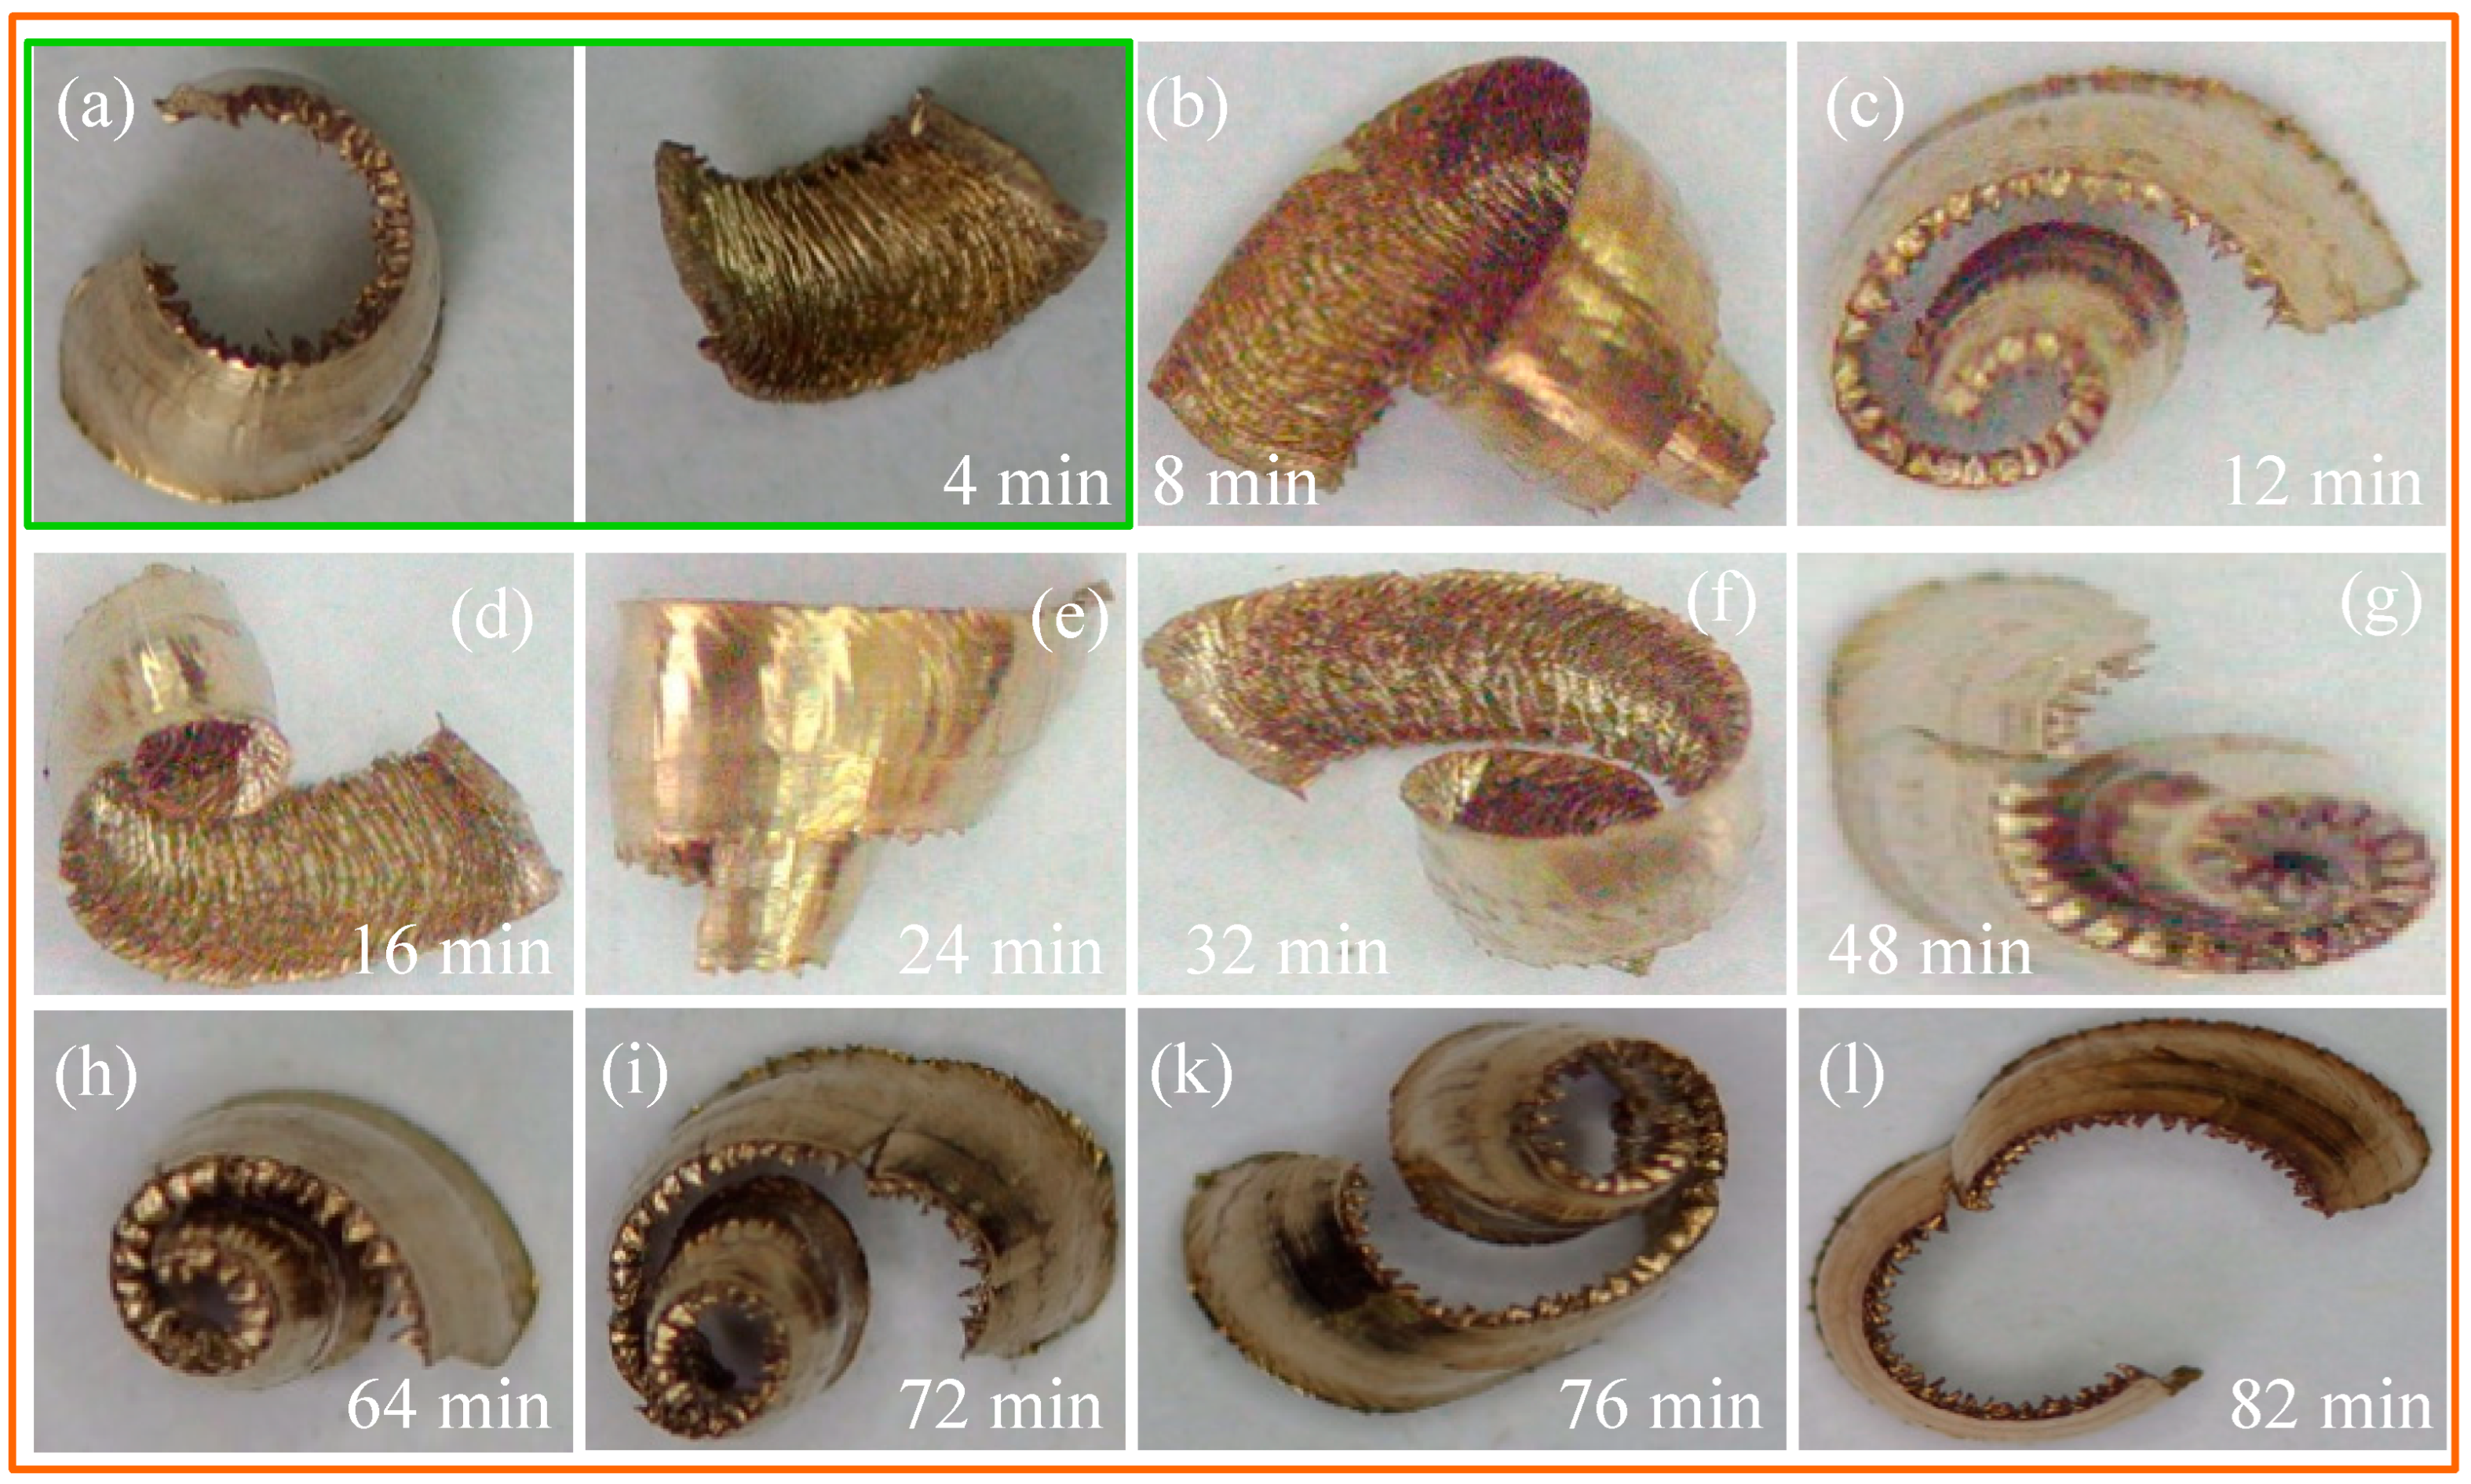
As shown in Figure 10 and Figure 11, the macro-morphological changes in chip formation for the two types of cutting tools indicate that Tool O produces typical spiral-shaped chips during the cutting process. At 5 min of cutting, the tool exhibits good chip breaking, with chips forming regular semi-circular fragments. By 8 min of cutting, the tool generates long spiral-shaped chips, and the colour changes to dark red, which is due to thermal damage caused by high cutting temperatures. When the cutting time exceeds 12 min, the chips become long spiral-shaped chips with a large number of segments, and the tool’s chip breaking ability decreases sharply. The high-temperature long spiral-shaped chips flowing out of the secondary cutting edge exacerbate tool wear. However, the chips from tool M remain almost consistently conical in shape, with the tool maintaining a high level of chip breaking effectiveness. The chips exhibit a very bright colour, indicating that the cutting temperature is maintained within an appropriate range, and the chips have not been burned. When the cutting time reaches 82 min, the chips form a semi-circular fragmented shape, with no long spiral-shaped chips observed.
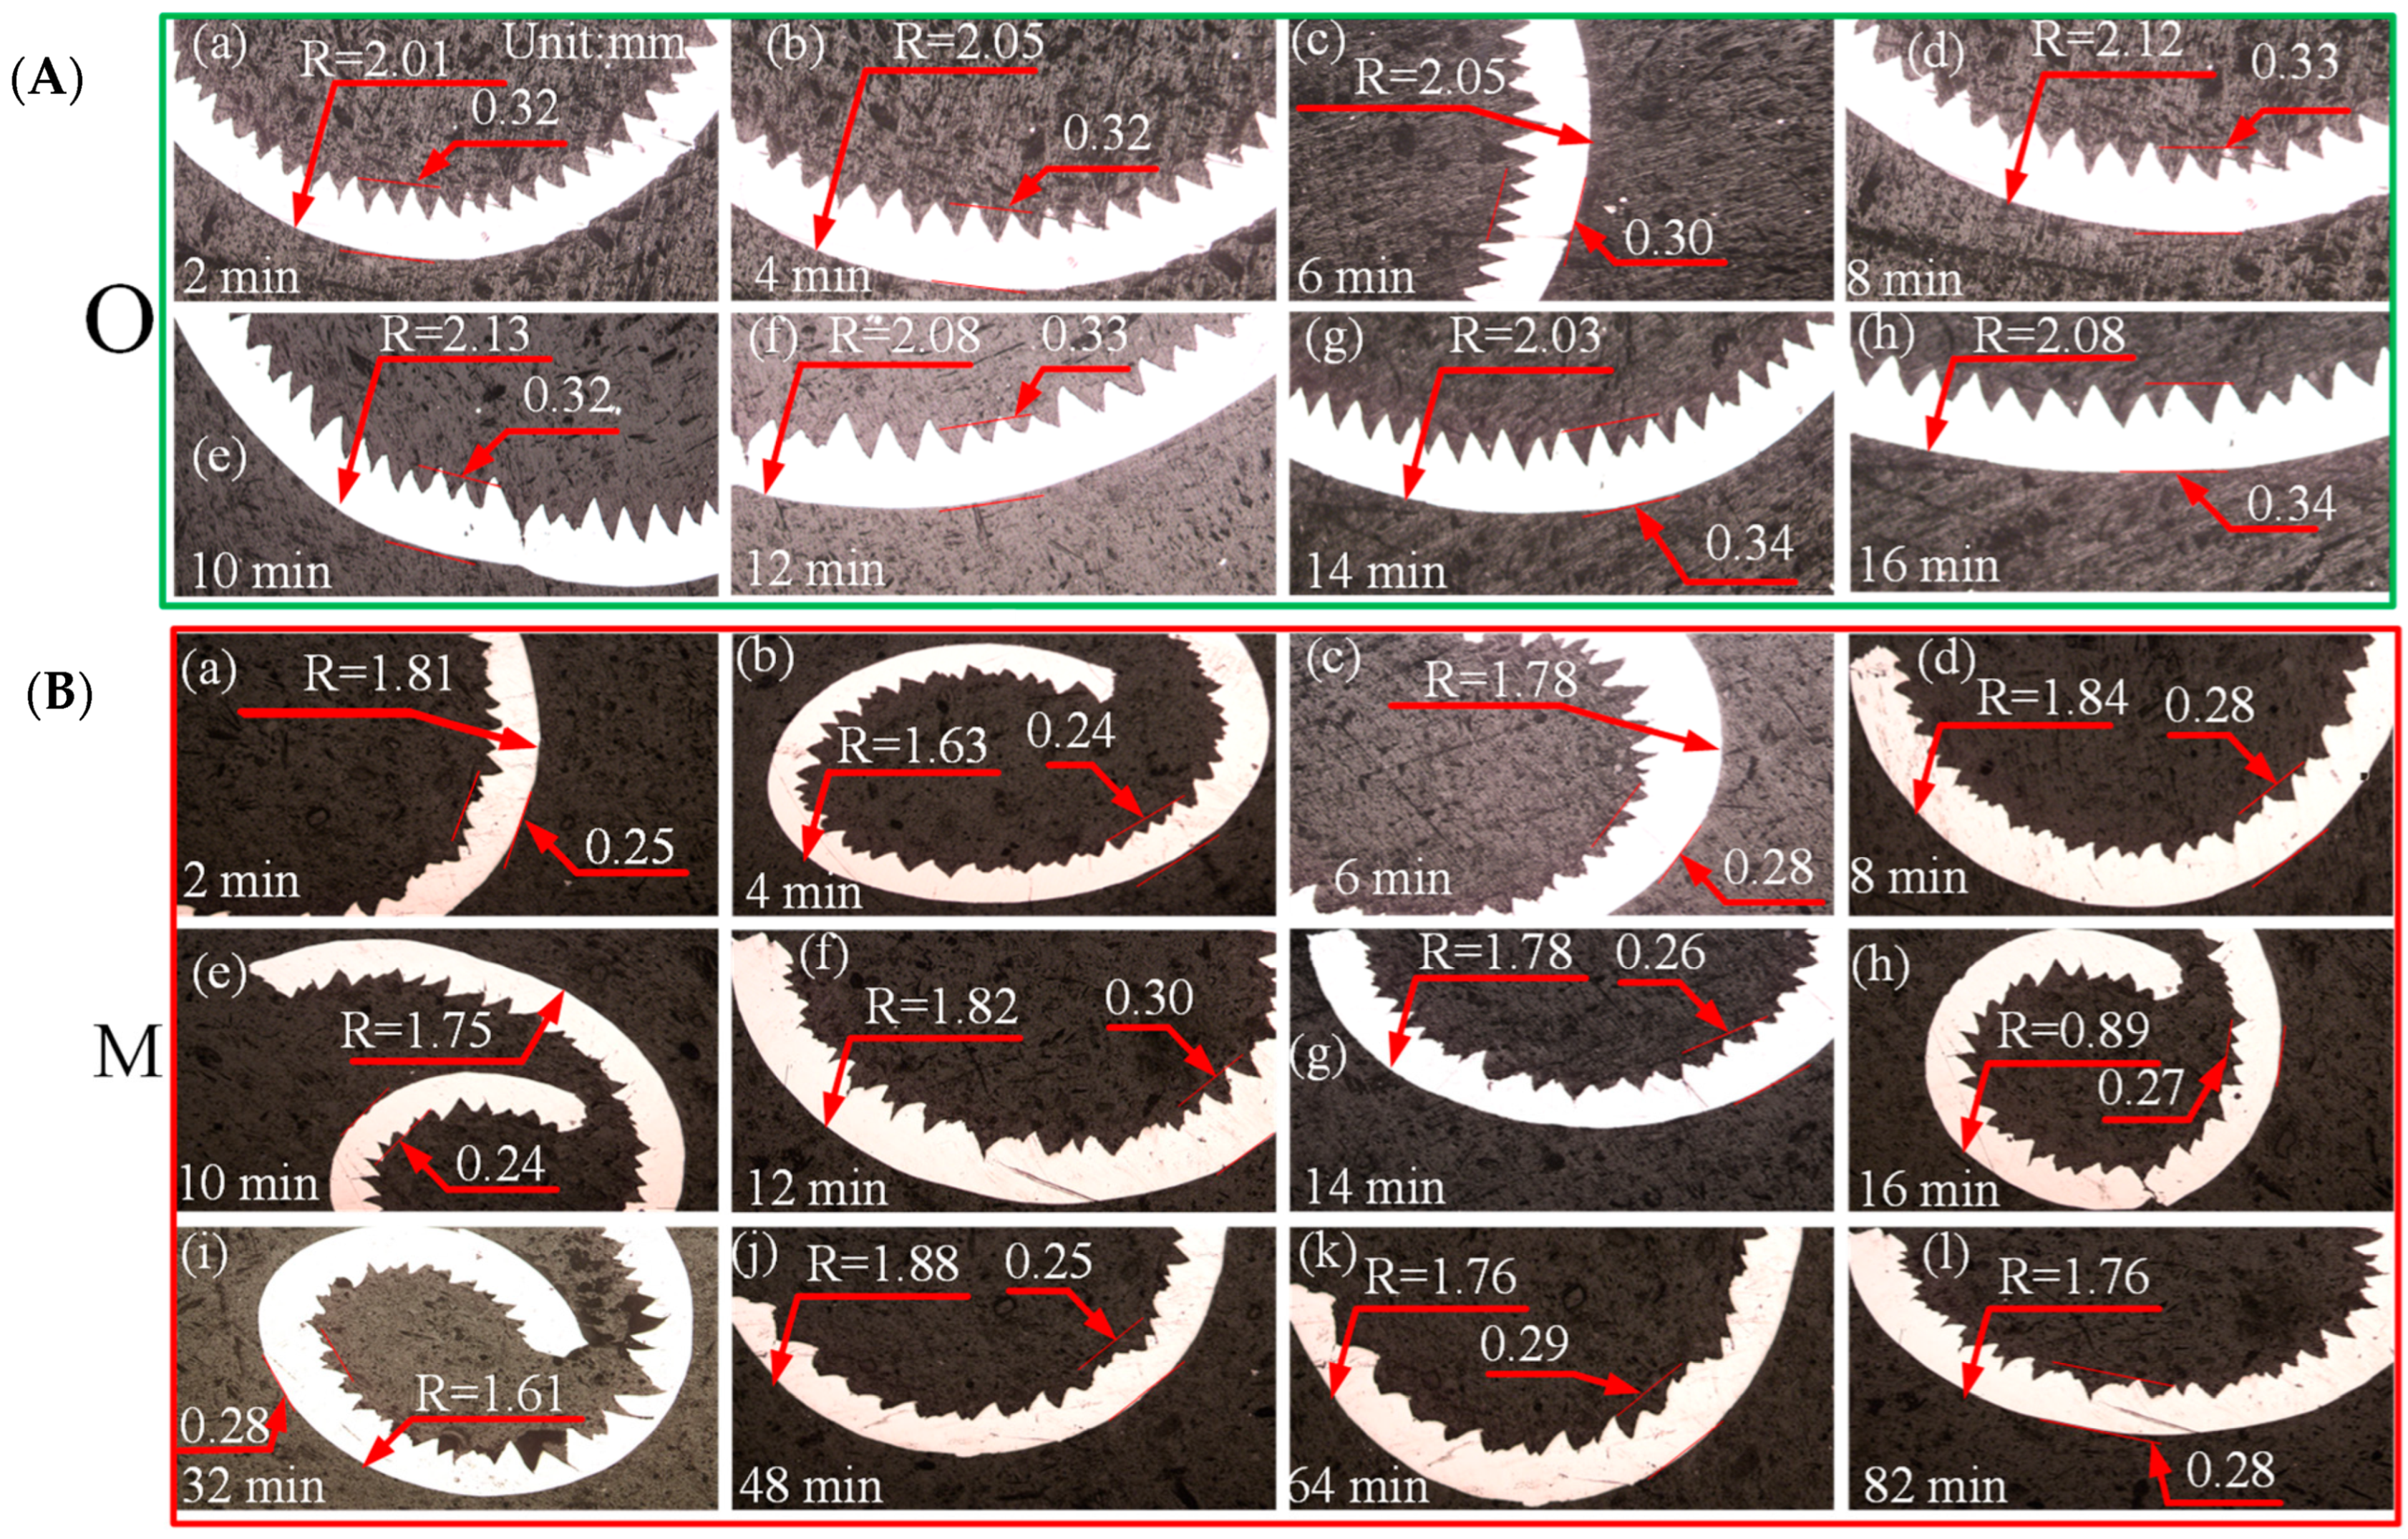
While the macroscopic morphology of chips can directly reflect the overall stability of the cutting process, it is fundamentally determined by the material deformation mechanisms at the microscopic scale. Quantitative analysis of the distribution range of chip curl radius and thickness fluctuations under a metallographic microscope is aimed at deconstructing the sub-surface physical essence behind the macroscopic phenomenon. Chips collected during the cutting processes of tools O and M were embedded, polished, and observed under a metallographic microscope. The changes in the microstructure of chips from tools O and M are shown in Figure 12 below.
The chip curl radius distribution range for tool O is 2.01 mm–2.12 mm, and the chip thickness range is 0.32 mm–0.34 mm. In contrast, the chip curl radius for the original tool is 1.61 mm–1.81 mm, and the chip thickness range is 0.24 mm–0.28 mm. Tool O’s chip curl radius and thickness are greater than those of Tool M, and the difference is more pronounced at the same time, indicating that Tool M has superior chip curling capability compared to Tool O. Since the same feed rate is used in the cutting process, resulting in equal cutting thickness, Tool O’s chip deformation is greater than that of Tool M. Tool M exhibits better chip curling performance and smaller chip deformation, indicating that the tool consumes less energy in chip deformation and thus has better performance.
This study also derived the chip thickness ratios ξO and ξM between tool O and tool M by measuring chip thickness. Subsequently, the shear angle between tool O and tool M was calculated using Formula (1). The results are shown in Table 4.
tan ϕ = cos γ 0 ξ sin γ 0
As shown in Table 4, the shear angle (φM) of the micro-groove tool M was consistently and significantly larger than that of the original tool O (φO) during the same cutting duration. For instance, after 2 min of cutting, φM (34.8°) was substantially greater than φO (26.7°). Moreover, the micro-groove tool M maintained a high and relatively stable shear angle (all above 29°) throughout the extended 82 min cutting process. This demonstrates that the micro-groove design effectively increases the shear angle, significantly optimizing the tool-chip contact state and reducing cutting deformation. This approach holds promise for improving the cutting process and extending tool life.
Compared to other studies, the novelty of this experiment lies in the following aspects: Zou et al. [33] investigated the influence of micro-groove structures on cutting performance and chip morphology during turning processes. However, their research only reported snapshot comparisons of chip geometry under different cutting parameters, rather than long-term, fine-grained time series. In contrast, this study continuously and periodically recorded and quantitatively reported the “continuous evolution of chip curl radius and thickness over cutting time,” while also conducting point-by-point comparisons between Tool M and Tool O under identical feed conditions. Chen et al. [34] only examined the relationship between chip colour and tool wear, without systematically analyzing the evolution of chip geometric parameters (such as curl radius or thickness) and macro chip breakage morphology over cutting time. This study combines macro chip breakage morphology (changes in long spiral and fragmented chips) with chip colour/brightness indicators to jointly reveal the superiority of micro-groove tools in maintaining chip breaking capability, reducing thermal damage, and preserving minimal geometric deformation during prolonged machining.

3. Results and Discussion

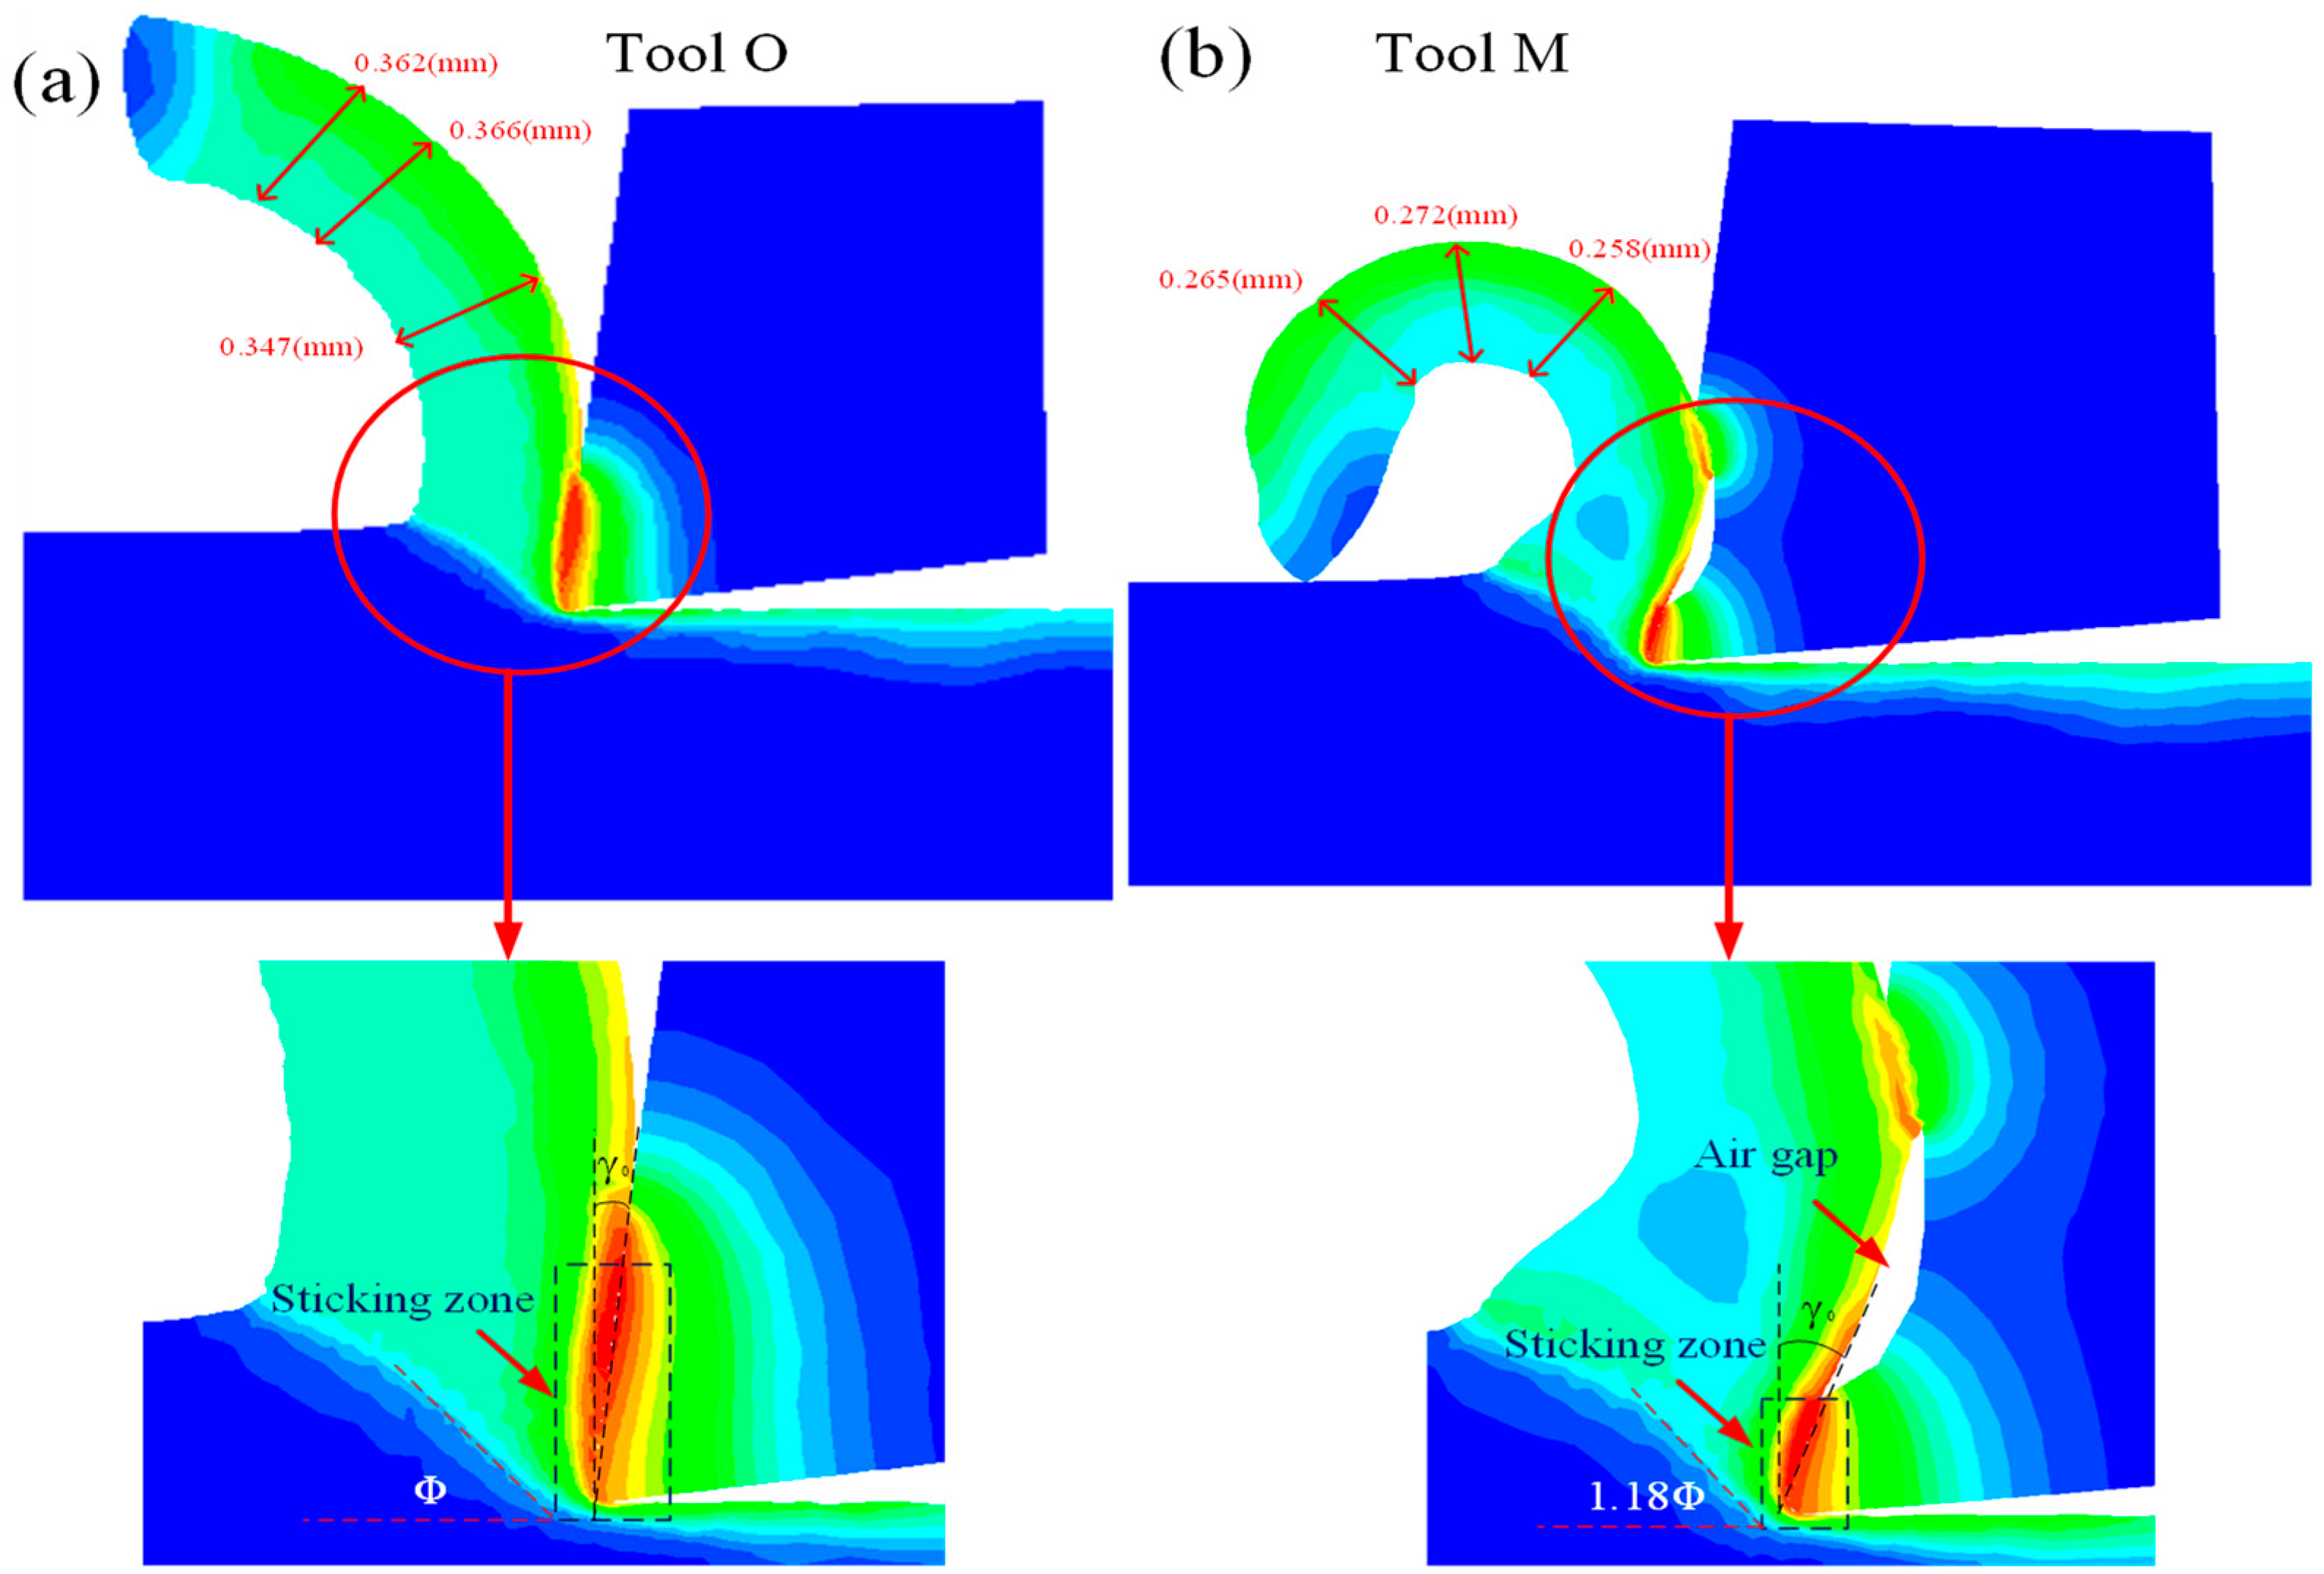
This paper conducts simulated cutting experiments on cutting tools using Third Wave Systems AdvantEdge 7.1 software. Its mesh system typically employs adaptive Lagrange–Euler (ALE) for automatic remeshing. Element sizes are controlled through user-defined maximum/minimum element dimensions (with minimum element edge lengths near the cutting edge set at the micrometre level), a mesh refinement factor, and a refinement zone radius (1.5 times the feed rate) to ensure high-precision capture of the cutting zone. For AISI 201 stainless steel workpieces, the built-in Johnson-Cook plasticity model is commonly selected as the material constitutive model. Its flow stress is expressed as a function of strain, strain rate, and temperature to couple mechanical loading with thermal softening effects. For TiAlN-coated WC carbide tools, corresponding parameters are selected from the material library. Boundary conditions are typically based on a dry-cutting model (no coolant), defining heat exchange between the tool/workpiece and environment via thermal conductivity coefficients, though the software supports custom coolant parameters. Contact friction employs the Coulomb model with a friction coefficient set to 0.4. The solver employs dynamic explicit integration, with convergence criteria relying on mesh adaptive adjustment and energy balance criteria, eliminating the need for manual convergence tolerance settings. It defaults to finite slip contact assumptions to balance computational efficiency and accuracy. The simulation results are shown in Figure 13.
From the cutting models of tool O and tool M, it can be observed that during the simulated cutting process, the micro-groove alters the chip-tooth contact pattern, increasing the actual rake angle γ0 and simultaneously enlarging the shear angle ϕ [35]. The increased rake angle sharpens the cutting edge, thereby reducing deformation of the cutting layer and tool-chip friction resistance [36]. This decreases heat generation during cutting, improves the friction state of the tool-chip, and lowers both contact stress and thermal stress on the surface. Consequently, the workpiece surface machined by tool M exhibits greater smoothness, lower roughness, and reduced surface hardening.
As shown in Figure 13a, when the chip passes over the rake face, it undergoes compression and friction from the rake face, resulting in full contact between the chip and the tool’s rake face. The tool-chip contact is tight, with high contact stress. In contrast, as shown in Figure 13b, due to the presence of micro-grooves, the contact length between the tool and chip is limited to a short segment near the tool tip and a low-stress contact segment along the rear edge of the micro-groove. This significantly reduces the tool-chip contact length, altering the friction state from full contact to partial contact. Consequently, friction resistance decreases, and cutting heat is reduced. Additionally, as the chip passes through the microgroove, it tends to extend into the groove, gaining more space for free expansion. This reduces the chip thickness and decreases the chip deformation energy.
This paper also conducted a quantitative comparative analysis of cutting forces between tool O and tool M through simulation and experimentation, along with a comparison of simulated cutting temperatures. The results are shown in Table 5.
Based on the comparative analysis of experimental data in the table above, the micro-slot tool M demonstrates significant performance advantages over the original tool O: Its simulated cutting force (887.5 N) and actual measured cutting force (657.3 N) were reduced by approximately 19.5% and 23.9%, respectively, compared to tool O (1102.4 N and 863.4 N). Simultaneously, the simulated temperature decreased from 674.5 °C to 534.3 °C, representing a reduction of 20.8%. This demonstrates that the micro-groove tool design not only effectively reduces cutting forces and temperatures but also shows consistent trends between simulation and actual measurements. Although simulation values remain systematically higher than actual measurements by approximately 30–35%, this fully validates the effectiveness of the micro-groove structure in improving cutting performance and the engineering predictive value of the simulation model.

4. Conclusions

The paper compared the surface quality of workpieces machined by tool O and tool M through cutting experiments, while also investigating chip morphology. The specific conclusions are as follows:
  • Measurements of surface roughness and workpiece surface hardness revealed that the workpieces machined with tool M exhibited lower surface roughness and reduced hardening compared to those machined with the original tool, with a shallower hardened layer depth.
  • During cutting, the micro-grooves increase the deformation space for chips on the rake face, causing chips to elongate along the micro-grooves. This effectively increases the actual cutting rake angle γ0, thereby enlarging the tool’s shear angle φ. Consequently, the tool becomes sharper, cutting forces decrease, cutting temperatures drop, chip thickness reduces, and chip deformation energy diminishes.
  • Establishing a correlation analysis method between cutting energy and workpiece surface quality reveals that achieving equivalent surface quality requires lower cutting energy with new tools compared to original ones. To attain superior surface quality, cutting parameters must be selected at lower cutting energy levels.
The micro-groove tool technology developed in this study offers an innovative solution for the efficient, high-quality machining of 201 stainless steel. Its core industrial value lies in significantly enhancing economic efficiency in critical manufacturing sectors such as energy equipment—directly reducing production costs by lowering cutting forces, machining temperatures, and energy consumption while extending tool life. This technology simultaneously optimizes workpiece surface roughness and hardness, thereby enhancing component fatigue strength and durability, ultimately extending equipment service life. Beyond providing a theoretical foundation for specialized functional tool design, its energy-saving and efficiency-enhancing characteristics align strongly with green manufacturing trends.
However, its widespread industrial adoption faces certain limitations. The primary concern lies in the potential increase in manufacturing costs associated with micro-groove tools and the uncertainty surrounding their long-term wear stability. Furthermore, the research conclusions are based on specific materials (201 stainless steel) and experimental conditions. The universality and effectiveness of this technology when machining other materials or under broader, more demanding cutting parameters require further validation. Its performance advantages are highly dependent on the optimized selection of cutting parameters, which also increases the complexity of process planning in actual production.

Author Contributions

Conceptualization, J.W. and Y.Z.; methodology, J.W. and W.H.; software, J.W. and C.W.; validation, J.W. and W.H.; formal analysis, J.W.; investigation, J.W. and Z.Y.; resources, J.W., W.H., C.W. and Z.Y.; data curation, W.H. and Y.Z.; writing—original draft preparation, J.W.; writing—review and editing, C.W. and Z.Y.; visualization, Y.Z. supervision, C.W. and Z.Y. project administration, J.W. funding acquisition, J.W., C.W. and Z.Y. All authors have read and agreed to the published version of the manuscript.

Funding

This study was supported by the Natural Science Foundation of Guizhou Minzu University (Grant No: GZMUZK [2022] YB01); Doctoral Student Training Fund Project of Guizhou Minzu University (Grant No: GZMUZK [2024] QD72); Guizhou Provincial Science and Technology Project (Grant No: KJZY [2025] 082); and Guizhou Provincial Science and Technology Project (Grant No: KJZY [2025] 080).

Data Availability Statement

The original contributions presented in the study are included in the article; further inquiries can be directed to the corresponding author.

Conflicts of Interest

Authors Jinxing Wu, Wenhao Hu, Yi Zhang, Changcheng Wu and Zuode Yang were employed by the company Guiyang Xianfeng Machine Tool Co., Ltd. The remaining authors declare that the research was conducted in the absence of any commercial or financial relationships that could be construed as a potential conflict of interest.

References

  1. Giudice, F.; Missori, S.; Scolaro, C.; Sili, A. A review on fusion welding of dissimilar ferritic/austenitic steels: Processing and weld zone metallurgy. J. Manuf. Mater. Process. 2024, 8, 96. [Google Scholar] [CrossRef]
  2. Fouad, R.A.; Habba, M.I.; Elshaghoul, Y.G.; El-Sayed Seleman, M.M.; Hafez, K.M.; El-Fahhar, H.H.; Barakat, W.S. Comparative analysis of filler metals on microstructure and mechanical performance of TIG-welded AISI 201 austenitic stainless steel joints. Sci. Technol. Weld. Join. 2024, 29, 356–367. [Google Scholar] [CrossRef]
  3. Kumar, N.; Choubey, V.K. Recent trends in coating processes on various AISI steel substrates: A review. J. Mater. Sci. 2024, 59, 395–422. [Google Scholar] [CrossRef]
  4. Sana, M.; Asad, M.; Farooq, M.U.; Anwar, S.; Talha, M. Machine learning for multi-dimensional performance optimization and predictive modelling of nanopowder-mixed electric discharge machining (EDM). Int. J. Adv. Manuf. Technol. 2024, 130, 5641–5664. [Google Scholar] [CrossRef]
  5. Masoumi, M.; de Oliveira, S.E.; Paredes, M. Influence of Cold Drawing on Phase Transformation and Tensile Properties of FeCrMn Austenitic Stainless Steel 201. Steel Res. Int. 2025, 96, 2400469. [Google Scholar] [CrossRef]
  6. Vetter, J.; Beneder, S.; Kandler, M.; Feyer, F.; Körner, C.; Schmidt, M. Impact of particle size distribution in the preform on thermal conductivity, Vickers hardness and tensile strength of copper-infiltrated AISI H11 tool steel. Materials 2023, 16, 2659. [Google Scholar] [CrossRef]
  7. Pelissari, G.H.; Braga, D.P.; Oliveira, P.H.F.; Magalhães, D.C.C.; Ferrante, M.; Rovere, C.A.D.; Sordi, V.L. Creep and Hot Tensile Behavior of AISI 201LN Austenitic Stainless Steel. Metall. Mater. Trans. A 2021, 52, 4413–4423. [Google Scholar] [CrossRef]
  8. Zeng, K.; Wu, X.; Jiang, F.; Shen, J.; Zhu, L.; Wen, Q.; Li, H. The non-traditional and multi-energy field hybrid machining processes of cemented carbide: A comprehensive review. Int. J. Adv. Manuf. Technol. 2024, 133, 2049–2082. [Google Scholar] [CrossRef]
  9. Zabon, A.H.; Abbas, T.F.; Bedan, A.S. Enhancing laser cutting quality of stainless steel 201 by controlling dross formation and surface roughness using multi-factor experimental design. Adv. Sci. Technol. Res. J. 2025, 19, 458–470. [Google Scholar] [CrossRef] [PubMed]
  10. Vornberger, A.; Picker, T.; Pötschke, J.; Herrmann, M.; Denkena, B.; Krödel, A.; Michaelis, A. Influence of cemented carbide composition on cutting temperatures and corresponding hot hardnesses. Materials 2020, 13, 4571. [Google Scholar] [CrossRef] [PubMed]
  11. Tang, X.; Wang, Z.; Huang, L.; Wang, X.; Chang, T.; Huang, P.; Zhu, Z. Preparation, properties and microstructure of high hardness WC-Co cemented carbide tool materials for ultra-precision machining. Int. J. Refract. Met. Hard Mater. 2023, 116, 106356. [Google Scholar] [CrossRef]
  12. You, Q.; Xiong, J.; Li, H.; Guo, Z.; Huo, Y. Study on the microstructure and high temperature friction and wear characteristics of three CVD coated cermets. Int. J. Refract. Met. Hard Mater. 2021, 96, 105495. [Google Scholar] [CrossRef]
  13. You, Q.; Xiong, J.; Guo, Z.; Huo, Y.; Liang, L.; Yang, L. Study on coating performance of CVD coated cermet tools for 4340 steel cutting. Int. J. Refract. Met. Hard Mater. 2021, 98, 105554. [Google Scholar] [CrossRef]
  14. Bhushan, R.K. Minimising tool wear by optimisation (ANOVA) of cutting parameters in machining of 7075Al Alloy SiC particle composite. Aust. J. Mech. Eng. 2023, 21, 499–517. [Google Scholar] [CrossRef]
  15. Abbed, K.; Kribes, N.; Yallese, M.A.; Chihaoui, S.; Boutabba, S. Effects of tool materials and cutting conditions in turning of Ti-6Al-4V alloy: Statistical analysis, modeling and optimization using CoCoSo, MABAC, ARAS and CODAS methods. Int. J. Adv. Manuf. Technol. 2023, 128, 1535–1557. [Google Scholar] [CrossRef]
  16. Pang, S.; Zhao, W.; Qiu, T.; Liu, W.; Yan, P.; Jiao, L.; Wang, X. Effect of cutting fluid on milled surface quality and tool life of aluminum alloy. Materials 2023, 16, 2198. [Google Scholar] [CrossRef]
  17. Saraf, G.; Nirala, C.K. Experimental investigation of micro-pillar textured WC inserts during turning of Ti6Al4V under various cutting fluid strategies. J. Manuf. Process. 2024, 113, 61–75. [Google Scholar] [CrossRef]
  18. Alves, U.C.; Ricci, V.P.; Mota, I.G.; Koga, G.Y.; Hassui, A.; Ventura, C.E. Mechanical and tribological characterization of TiAlN/TiN and TiSiN/AlTiN coating systems for cutting tools. J. Manuf. Process. 2025, 145, 522–535. [Google Scholar] [CrossRef]
  19. Bakar, H.A.; Ghani, J.A.; Haron, C.C.; Ghazali, M.J.; Kasim, M.S.; Al-Zubaidi, S.; Jouini, N. Wear mechanisms of solid carbide cutting tools in dry and cryogenic machining of AISI H13 steel with varying cutting-edge radius. Wear 2023, 523, 204758. [Google Scholar] [CrossRef]
  20. Chen, T.; Liu, J.; Liu, G.; Xiao, H.; Li, C.; Liu, X. Experimental study on titanium alloy cutting property and wear mechanism with circular-arc milling cutters. Chin. J. Mech. Eng. 2023, 36, 57. [Google Scholar] [CrossRef]
  21. Liu, C.; Ren, J.; Zhang, Y.; Shi, K. The effect of tool structure and milling parameters on the milling quality of CFRP based on 3D surface roughness. Int. J. Precis. Eng. Manuf. 2023, 24, 931–944. [Google Scholar] [CrossRef]
  22. Zhang, S.; Shi, H.; Wang, B.; Ma, C.; Li, Q. Research on the milling performance of micro-groove ball end mills for titanium alloys. Lubricants 2024, 12, 204. [Google Scholar] [CrossRef]
  23. Zou, Z.; He, L.; Jiang, H.; Zhan, G.; Wu, J. Development and analysis of a low-wear micro-groove tool for turning Inconel 718. Wear 2019, 420, 163–175. [Google Scholar] [CrossRef]
  24. Zou, P.; Zhou, L.; Yang, Z.; Ren, B.; Wang, X. Effect of texture location in tool-chip friction region on cutting performance in turning AISI 304. Int. J. Adv. Manuf. Technol. 2024, 132, 2787–2805. [Google Scholar] [CrossRef]
  25. Miao, X.; Zhang, X.; Liu, X.; Yu, Q.; Zhang, L. Numerical analysis of performance of different micro-grooved tools for cutting titanium alloy Ti-6Al-4V. Int. J. Adv. Manuf. Technol. 2020, 111, 1037–1054. [Google Scholar] [CrossRef]
  26. Yu, Z.; Chen, G.; Xuan, W.; Wei, H. Machining performance of micro-pit and micro-groove composite textured tools in tungsten alloy turning. Proc. Inst. Mecha. Eng. Part B J. Eng. Manuf. 2025, 239, 418–427. [Google Scholar] [CrossRef]
  27. Jiang, J.; Luo, T.; Zhang, G.; Dai, Y. Novel tool offset fly cutting straight-groove-type micro structure arrays. J. Mater. Process. Technol. 2021, 288, 116900. [Google Scholar] [CrossRef]
  28. Wang, X.; Popov, V.L.; Yu, Z.; Li, Y.; Xu, J.; Li, Q.; Yu, H. Evaluation of the cutting performance of micro-groove-textured PCD tool on SiCp/Al composites. Ceram. Int. 2022, 48, 32389–32398. [Google Scholar] [CrossRef]
  29. Jin, L.; Gong, Y.; Sun, Y.; Wen, Q.; Sun, J. Research on surface quality and tool wear of micro-groove array machined by a novel micro-milling cutter. Int. J. Adv. Manuf. Technol. 2022, 121, 2383–2397. [Google Scholar] [CrossRef]
  30. Deng, J.; Wang, F.; Lin, Y.; Sun, L. An unequal pitch ball-end milling cutter with micro-groove structure for suppressing CFRP milling chatter based on coordinated regulation of time delay effect and milling force. Int. J. Adv. Manuf. Technol. 2025, 137, 1437–1456. [Google Scholar] [CrossRef]
  31. Ahmed, T.; Mollick, N.; Mahmud, S.; Ahmad, T. Analysis of Effects of Machining Parameters on Cutting Force Components in Turning AISI 201 Stainless Steel Using Cemented Carbide Cutting Tool Insert. Mater. Today Proc. 2021, 44, 4151–4156. [Google Scholar] [CrossRef]
  32. Elmunafi, M.H.S.; Yusof, M.S.M. Effect of cutting speed and feed in turning hardened stainless steel using coated carbide tool under Minimum Quantity Lubrication. Adv. Mech. Eng. 2015, 7, 1–9. [Google Scholar] [CrossRef]
  33. Zou, Z.; He, L.; Jiang, H. Influence of microgroove structure on cutting performance and chip morphology during the turning of superalloy Inconel 718. Materials 2021, 14, 4142. [Google Scholar] [CrossRef]
  34. Chen, S.H.; Luo, Z.R. Study of using cutting chip color to the tool wear prediction. Int. J. Adv. Manuf. Technol. 2020, 109, 823–839. [Google Scholar] [CrossRef]
  35. Abdalrahman, R.M.; Rostam, S.; Deboucha, A. Effect of Cutting Tool Rake and Inclination Angles and Feeding Method on Cutting Force and Surface Quality in Single-point Threading. Kurd. J. Appl. Res. 2025, 10, 55–67. [Google Scholar] [CrossRef]
  36. Li, P.; Chang, Z. Accurate modeling of working normal rake angles and working inclination angles of active cutting edges and application in cutting force prediction. Micromachines 2021, 12, 1207. [Google Scholar] [CrossRef] [PubMed]
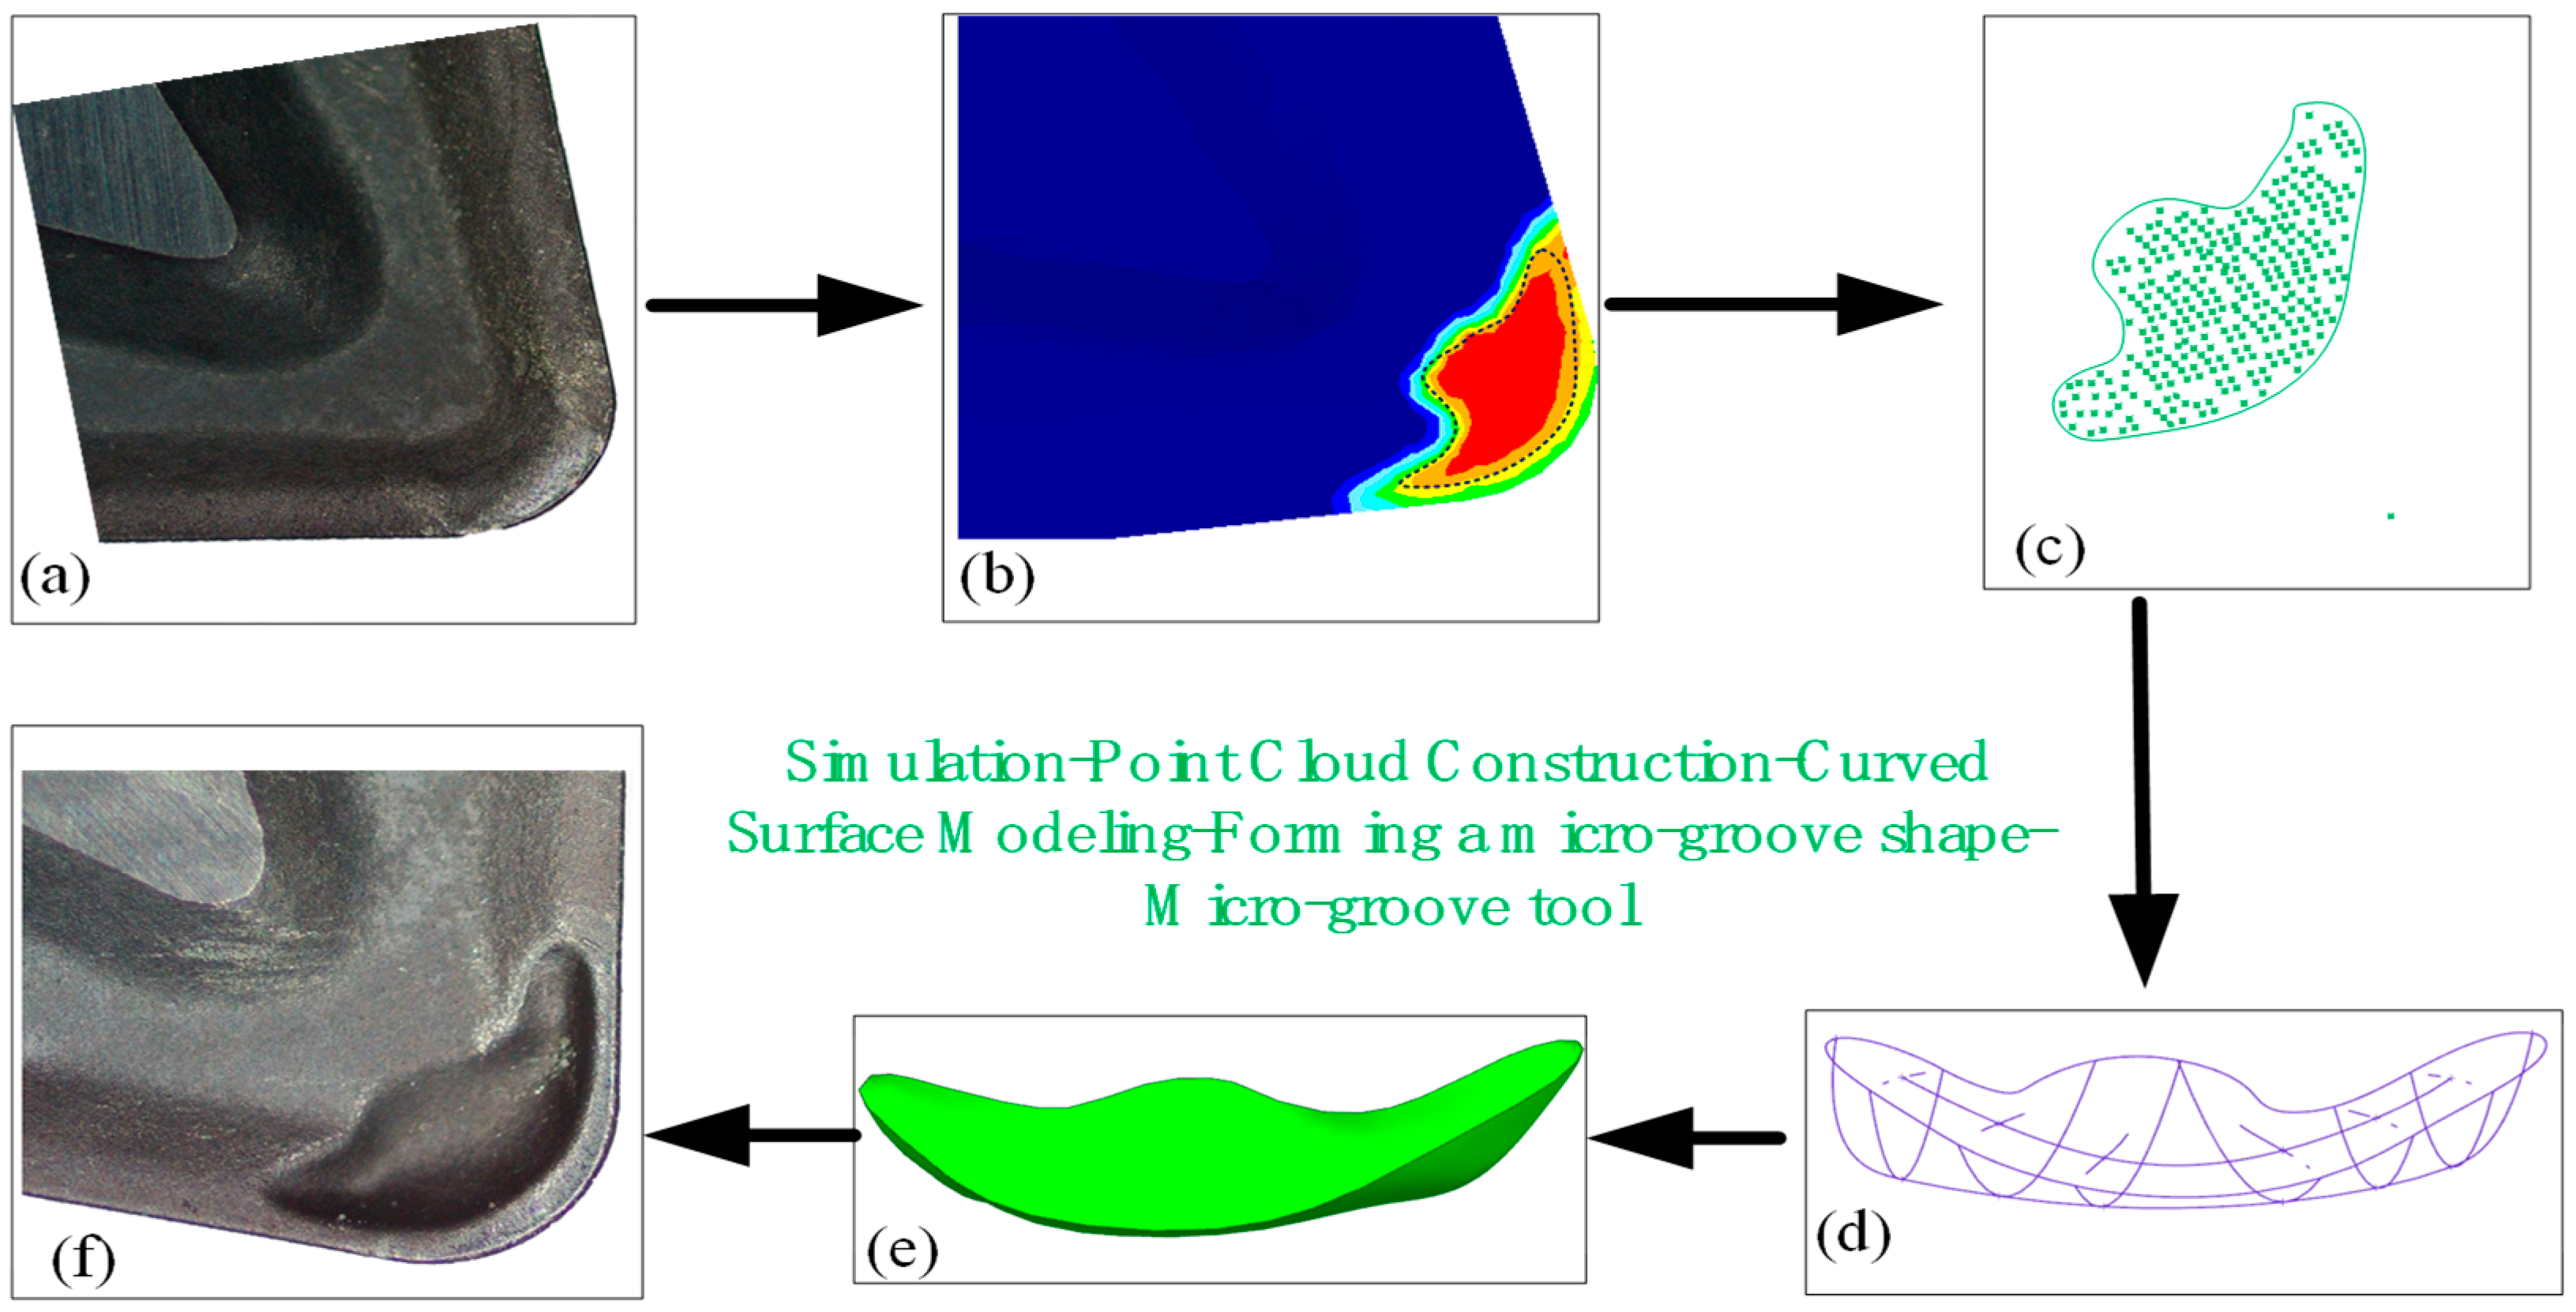
Figure 1. (a) Physical image of the cutting edge region of the original tool. (b) Temperature distribution map in the cutting simulation. (c) Point cloud data of the high-temperature region. (d) Surface modeling after point cloud conversion. (e)Three-dimensional surface model of the micro-groove. (f) Physical image of the micro-groove tool after forming .
Coatings 15 01124 g001
Figure 2. Microgroove dimensions.
Coatings 15 01124 g002
Figure 3. (a) Cutting experiment platform. (b) Enlarged View of the Work Area.
Coatings 15 01124 g003
Figure 4. Three-dimensional morphology and roughness values of workpiece surface.
Coatings 15 01124 g004
Figure 5. (a) Effect of cutting speed vc on workpiece surface roughness; (b) effect of feed rate f on workpiece surface roughness; (c) effect of cutting depth ap on workpiece surface roughness.
Coatings 15 01124 g005
Figure 6. Sample preparation and hardness measurement.
Coatings 15 01124 g006
Figure 7. Vickers hardness distribution along the depth direction at different cutting speeds: (a) Vc = 80 m/min; (b) Vc = 100 m/min; (c) Vc = 120 m/min; (d) Vc = 140 m/min
Coatings 15 01124 g007
Figure 8. Vickers hardness distribution along the depth direction at different feed rates: (a) f = 0.11 mm; (b) f = 0.13 mm; (c) f = 0.15 mm; (d) f = 0.17 mm
Coatings 15 01124 g008
Figure 9. Vickers hardness distribution along the depth direction at different cutting depths: (a) ap = 1.1 mm; (b) ap = 1.3 mm; (c) ap = 1.5 mm; (d) ap = 1.7 mm.
Coatings 15 01124 g009
Figure 10. Macro-morphological changes in chips produced by tool O.
Coatings 15 01124 g010
Figure 11. Macro-level changes in the shape of chips produced by tool M.
Coatings 15 01124 g011
Figure 12. Microstructural changes in chips produced by (A) tool O and (B) tool M.
Coatings 15 01124 g012
Figure 13. (a) Cutting model of tool O. (b) Cutting model of tool M.
Coatings 15 01124 g013
Table 1. Physical parameters of cutting tool.
Performance Parametersρ
(g/cm3)
Tensile StrengthBending Strength (GPa)HardnessPoisson’s
Ratio
Elastic Modulus (GPa)
Tool(M30)14.64.7Gpa1.491 HRA0.23630–640
Workpiece-AISI2017.93543Ma/274.56 HV0.249201
Table 2. Tool geometry angles.
Geometric
Angle
Tool
Angle
Rake
Angle
Clearance
Angle
Main Cutting Edge AngleEnd Cutting Edge AngleInclination
Angle
Value (°)808595−57
Table 3. Single-element experiment.
No.vc
(m/min)
f
(mm/r)
ap
(mm)
Number of TestsSimulation
Fc (N)
Actual
Fc (N)
p-Value
(Simulation)
p-Value
(Measured)
Significance
(α = 0.05)
A1800.151.531194.9919.20.00029<0.00001Significant
A21000.151.531098.6865.8
A31200.151.531102.4863.4
A41400.151.531085.9855.3
B11200.111.531020.8785.3<0.000010.000070Significant
B21200.131.531036.9843.8
B31200.151.531122.4863.4
B41200.171.531378.51060.4
C11200.151.131004.8772.90.0000220.000023Significant
C21200.151.331086.6835.8
C31200.151.531112.4863.4
C41200.151.731246.11066.3
Table 4. Analysis Results of Quantitative Indicators for Chip Thickness Ratio and Shear Angle of Tool O and Tool M.
Cutting Time (min)Chip Thickness Ratio ξOChip Thickness Ratio ξMFront Corner
γ0 (°)
Shear Angle
φO (°)
Shear Angle
φM (°)
22.131.67826.734.8
42.131.60826.736.9
62.001.87829.031.2
82.201.87825.331.2
102.131.60826.736.9
122.202.00825.329.0
142.271.73824.533.7
162.271.80824.532.3
32/1.878/31.2
48/1.678/34.8
64/1.938/30.2
82/1.878/31.2
Table 5. Simulation and Experimental Quantitative Comparison Analysis of Cutting Forces and Temperatures for Tool O and Tool M.
Number of
Experiments
Simulation
Fc (N)
Actual
Fc (N)
Cutting Simulation Temperature t (°C)
Tool O31102.4863.4674.5
Tool M3887.5657.3534.3
Disclaimer/Publisher’s Note: The statements, opinions and data contained in all publications are solely those of the individual author(s) and contributor(s) and not of MDPI and/or the editor(s). MDPI and/or the editor(s) disclaim responsibility for any injury to people or property resulting from any ideas, methods, instructions or products referred to in the content.