Article

Modelling on How Topcoat/Bond Coat Micro-Rough Interface and Nearby Voids Affect the Stress Distribution in Thermal Barrier Coating Systems in Quenching Process

1
School of Materials Science and Engineering, University of Science and Technology Beijing, Beijing 100083, China
2
BGRIMM Technology Group, Beijing 100160, China
3
BGRIMM Advanced Materials Science & Technology Co., Ltd., Beijing 102206, China
*
Author to whom correspondence should be addressed.
Coatings 2025, 15(1), 97; https://doi.org/10.3390/coatings15010097
Submission received: 5 November 2024 / Revised: 25 November 2024 / Accepted: 26 November 2024 / Published: 16 January 2025

Abstract

:
The distribution of voids in ceramic topcoats (TC) and the micro-roughness of metallic bond coat (BC) interfaces are important for the structure design and coating life of thermal barrier coating (TBC) systems. In this study, finite elemental (FE) models were built by considering those two structural factors to investigate their influence on the stress distribution in TBCs in quenching processes under thermal shock conditions. According to the simulation analyses, the function of the voids in TCs includes the dilution effect of the stress concentration at the macro-scale, the releasing effect of the tensile stress along the vertical direction above the TC peak, and the “stress trapping” effect bringing higher stress at the horizontal tips of the voids on the micro-scale. The micro-roughness of the TC/BC interface did not have much effect on the stress values in the TC, aside from at the TC peak, but had a significant influence on the stress value along the interface due to the “stress trapping” effect. The TBC samples that were experimentally tested under water-cooling thermal shock conditions were also analyzed in this paper to verify the modelling results.

1. Introduction

As the performance requirements of advanced air–space engines and gas turbines increase, thermal barrier coatings (TBCs) are being widely used in hot topic areas, such as combustion and turbines [1,2,3]. A TBC system is usually composed of a ceramic topcoat (TC), functioning heat insolation, and a metallic bond coat (BC), which functions through oxidation/hot-corrosion resistance and bonds the TC and a superalloy substrate. For a comprehensive consideration of economy and performance, the TCs in the TBC systems are generally made using the air plasma spray (APS) coating technique while the BCs are made using APS or high-velocity oxy-fuel (HVOF) technique in industrial applications [4,5,6,7]. The ability of TBCs to act against spallation in thermal cycling conditions, especially during quenching processes, is very important for their service lives, and their micro-structures play important roles.
A typical micro-structure of plasma-sprayed TCs comprises voids (pores and micro-cracks), which influence TBCs’ properties [8,9,10,11,12,13]. K.P. Jonnalagadda et al. used different feedstocks to achieve different porosities in TBCs, which critically affect the elastic modules and the stress tolerance of the ceramic coatings [12]. Porosity became more important in thick TBCs because thicker coatings generally sustained more stresses [13]. Finite element (FE) modelling is an important approach to investigate how stresses are distributed in TBCs. Many FE simulation studies have been carried out in which the TC was regarded as a homogeneous material [12,14,15,16]. The existence of the voids, especially those near the TC/BC interface, however, can change the distribution of the stresses and affect the cracking behaviour of the ceramic TC, which has not yet been studied in depth.
Besides the void distribution, the roughness of the TC/BC interface is also pivotal for the failure of TBCs [17,18,19,20]. A comprehensive study on how to define an optimal BC surface was undertaken by M.D. Weeks et al. [17]. Their results showed that the lifetime of APS TBCs can be increased with increased BC surface tortuosity, surface slope, and summit density. The FE modelling approach can be used to simulate the stress distribution in TBCs, with a semicircle or sinusoidal geometry usually used to simplify the morphology of the TB/BC interface [18,19,20]. Some studies have demonstrated the importance of the “Ra” roughness for the coating’s spallation resistance [21,22,23]. However, the “Ra” value does not reflect the micro-roughness produced by the small ridges formed at an APS-MCrAlY coating surface.
In this study, how the voids in the TC and the micro-roughness of the TC/BC interface affected the stress distribution in the TBCs during quenching processes was analyzed by the FE modelling approach. The obtained results can deepen our understanding of the failure of APS TBCs under thermal shock testing conditions.

2. Model Set-Up and Experiments

Figure 1a shows a typical cross-sectional micro-structure near the interface of the YSZ topcoat (TC) and the MCrAlY bond coat (BC) in an APS TBC. Figure 1b presents the contour of the rough interface between the TC and BC. At the interface (Figure 1c,d), one can observe a few small micro-ridges forming micro-roughness; these were mostly produced by the splashing, extrusion, and deformation of the BC splats during the plasma spray process. Besides the micro-roughness, there were some voids (pores and micro-cracks) in the TC section that played an important role in stress distribution in the TC. This paper mainly focuses on the influence of the micro-roughness and the near-interface voids on the stress distribution in the coatings in order to deepen our understanding of their function on TBCs’ thermal shock performance.
Finite element (FE) modelling was performed by using ABAQUS (v2015, Montreal, QC, Canada) codes. In the FE models, both BC (0.7 mm thick) and TC (0.3 mm thick) were set to be elastic and rigid. An almost cosine contour with wavelength/amplitude of 100/50 μm was used to describe the macro-convex and concave tortuosity of the TC/BC interface. When studying the influence of the micro-roughness, some micro-bumps and -dips were observed on the interface, as shown in Figure 2a. Figure 2b gives an example of a model showing both micro-roughness (ridges) and near-interface voids distributed from the TC peak to the TC valley.
As the ceramic TCs in the TBCs usually spall and fail in the quenching process during thermal shock testing, the simulation was performed under conditions that involved a large temperature decrease (ΔT = 1000 °C). The material constants employed in the FE analysis are given in Table 1. Figure 3 shows the FE models with different distributions of pores in TCs with smooth (S# series) or micro-rough (R# series) TC/BC interfaces. The model in this study did not take into account factors such as interface oxidation, real interface contours, and real pore sizes, so the simulation results cannot fully reflect the real results. In the future, we will continuously improve the model to achieve simulation results that are closer to the experimental results.
The TBC samples tested under water-cooling thermal shock conditions were analyzed in this paper in order to verify the modelling results. The experimental details of the sample testing can be found in our previous research [23].

3. Results and Analyses

Characterization of the Agglomerated YSZ Powders

Figure 4 shows the stress maps in the S# serial models with different distributions of voids. In those models, tensile stress occurred at the TC peaks and compression stress occurred in the TC valleys. When voids were present along the TC/BC interface (S#2~5), the stress distribution in the TC showed apparent differences from the stress distribution in cases without voids in TC (S#1). One can clearly see that the existence of voids can decrease the size of both compression zones in the TC valleys and tensile zones in the TC peaks. In other words, the voids can dilute the macro-stress concentration, no matter where the are voids located. The existence of the voids resulted in no differences in the stress distribution in the BC sections.
As the cracking of the TCs usually took place near the TC peaks, the stress maps were further analyzed there (Figure 5). The stresses in the TC along both vertical and horizontal directions changed due to the presence of the voids. Stress was particularly concentrated at the horizontal tips of the voids (Figure 5b,d). Figure 6 further shows the quantitative stress profiles along those two directions from point O (the TC peak point, as shown in Figure 5a). The stress decreased along both the vertical and horizontal directions in the S#1, S#3, and S#5 models (with no voids above the BC peak), whose stress profiles were very similar, and the peak point O had the highest tensile stress. In the S#2 and S#4 models (with voids above the TC peak), the stress along the vertical direction was lower than that in the S#1, S#3, and S#5 models, indicating that the voids above the TC peak were beneficial to the stress release along the vertical direction. Along the horizontal direction, the stress at a distance of ~10 μm was higher in the S#2 and S#4 models, which was due to a “stress trapping” effect at the horizontal tips of the voids. This “stress trapping” effect caused a high stress gradient in a narrow space, creating local higher tensile stresses, which may promote the propagation of cracks in the TC via the voids’ horizontal tips.
Obviously, the results show that the voids, especially the voids above the TC peak, played very important roles on the stress distribution in the TC, including the dilution effect of the stress concentration at the macro-scale, the releasing effect of the tensile stress along the vertical direction above the BC peak, and the “stress trapping” effect, resulting in higher stress at the horizontal tips of the voids at the micro-scale.
With a rough TC/BC interface, as shown in Figure 7, the stress dilution effect in the TC, caused by the existence of the voids can also be demonstrated. The main differences in the stress distribution in the S# series occurred at the rough TC/BC interface. The micro-roughness of the interface seemed to trap more stresses and make the stress distribution more complicated. As presented in Figure 8, the size of either the tensile or compression stress zone in TC centre became smaller, and a larger stress gradient occurred along the micro-rough interface. This indicated that the stresses were transferred from the TC to the interface.
The result in Figure 9 compares the difference in the stresses between the cases with and without voids and/or micro-roughness. The voids played a dilution role on the stress distribution in the TC part, while the micro-roughness of the interface trapped more stresses nearby (i.e., “stress trapping” effect). The stress map (Figure 10) and the stress profiles (Figure 11) near the TC peak again confirmed the other two functions of the voids in the TC sections: releasing the tensile stress along the vertical direction above the BC peak and trapping stress at the horizontal tips of the voids at the micro-scale. The micro-roughness of the TC/BC interface did not have much effect on the stress values in the TC away from the TC peak (comparing S#1 and R#1 and S#4 and R#4) but had a significant influence on the stress value at the interface (distance = 0) due to the “stress trapping” effect.
Figure 12 shows a typical water-cooling thermal-shock testing result of TBCs with different TC/BC interface Ra roughness. By using the same feedstock size, the APS-1 and HVOF-1 BCs had similar Ra roughness. APS-2 and HVOF-2 BCs used larger particles, so they had higher Ra values. The coatings with higher Ra roughness had longer lives, which was demonstrated and discussed in our previous work [23]. However, the longer cyclic life of the APS BCs than that of the HVOF BCs under the same Ra roughness conditions requires further understanding.
Figure 13 provides possible explanations. In the TBCs with HVOF BCs (Figure 13a,b), the coarse failure cracks were present in almost the whole TC, and when the TC/BC interface was relatively smooth, the stress status could be simulated by a smooth interface model (Figure 13c). In this case, the tensile stress of the TC was higher at the horizontal tip positions of the voids above the TC peak than in other zones. Thus, cracks propagated along the voids, and the cracking occurred only in the TC section, resulting in white failure. In the TBCs with APS BCs (Figure 13d,e), however, the coarse failure cracks were shorter than those observed in HVOF BC system, and black failure also occurred due to the strong interaction of cracks in TC with the BC/TC interface. Such interactions can be demonstrated by the rough-interface model, as shown in Figure 13f. In this model, the rougher the micro-rough interface, the more stresses were trapped, which increased the interactions between the TC cracks and the rough TC/BC interface. Besides the stress concentrations in the TC, high tensile stress also formed in the BC, especially at the valley positions of the small ridges. Such valley positions are usually located at the interfaces of the BC splats where some internal oxidation also took place. Due to the “stress trapping” effect of the rougher TC/BC interface, the TC cracks deflected, branched out, and extended to the BC interface or even into the BC; thus, the TC cracking propagation path was prolonged. In addition, the “stress trapping” effect also caused the cracking of BC, which released some stresses in the TC. Therefore, the thermal shock life of TBCs with APS-made micro-rougher BCs was higher than that with an HVOF-made smoother BC interface, even when their Ra roughness was the same.
In this study, finite element simulation inevitably produces deviations from the actual experimental results. This is because this model cannot fully consider all micro-structural factors in the coating, nor can it fully simulate the actual working environment of the coating. For example, humidity and differences in cooling temperature were not considered. Therefore, the simulation results may not fully conform to reality. However, the simulation results can still provide a certain theoretical basis for the failure analysis of coatings. The author will continue to conduct in-depth research in the future. The oxidation of alloy coatings plays an important role in the growth of cracks in the coatings. For example, during the growth process of oxide film, the interface stress of the alloy coating will change. In the future, we will establish more diverse models to better fit the actual situation.

4. Conclusions

In this paper, how the distribution of voids in TC and the micro-roughness of TC/BC interface affects the stress distribution in the TBCs under thermal shock testing conditions was analyzed by finite elemental modelling. The main conclusions can be summarized as follows:
1.
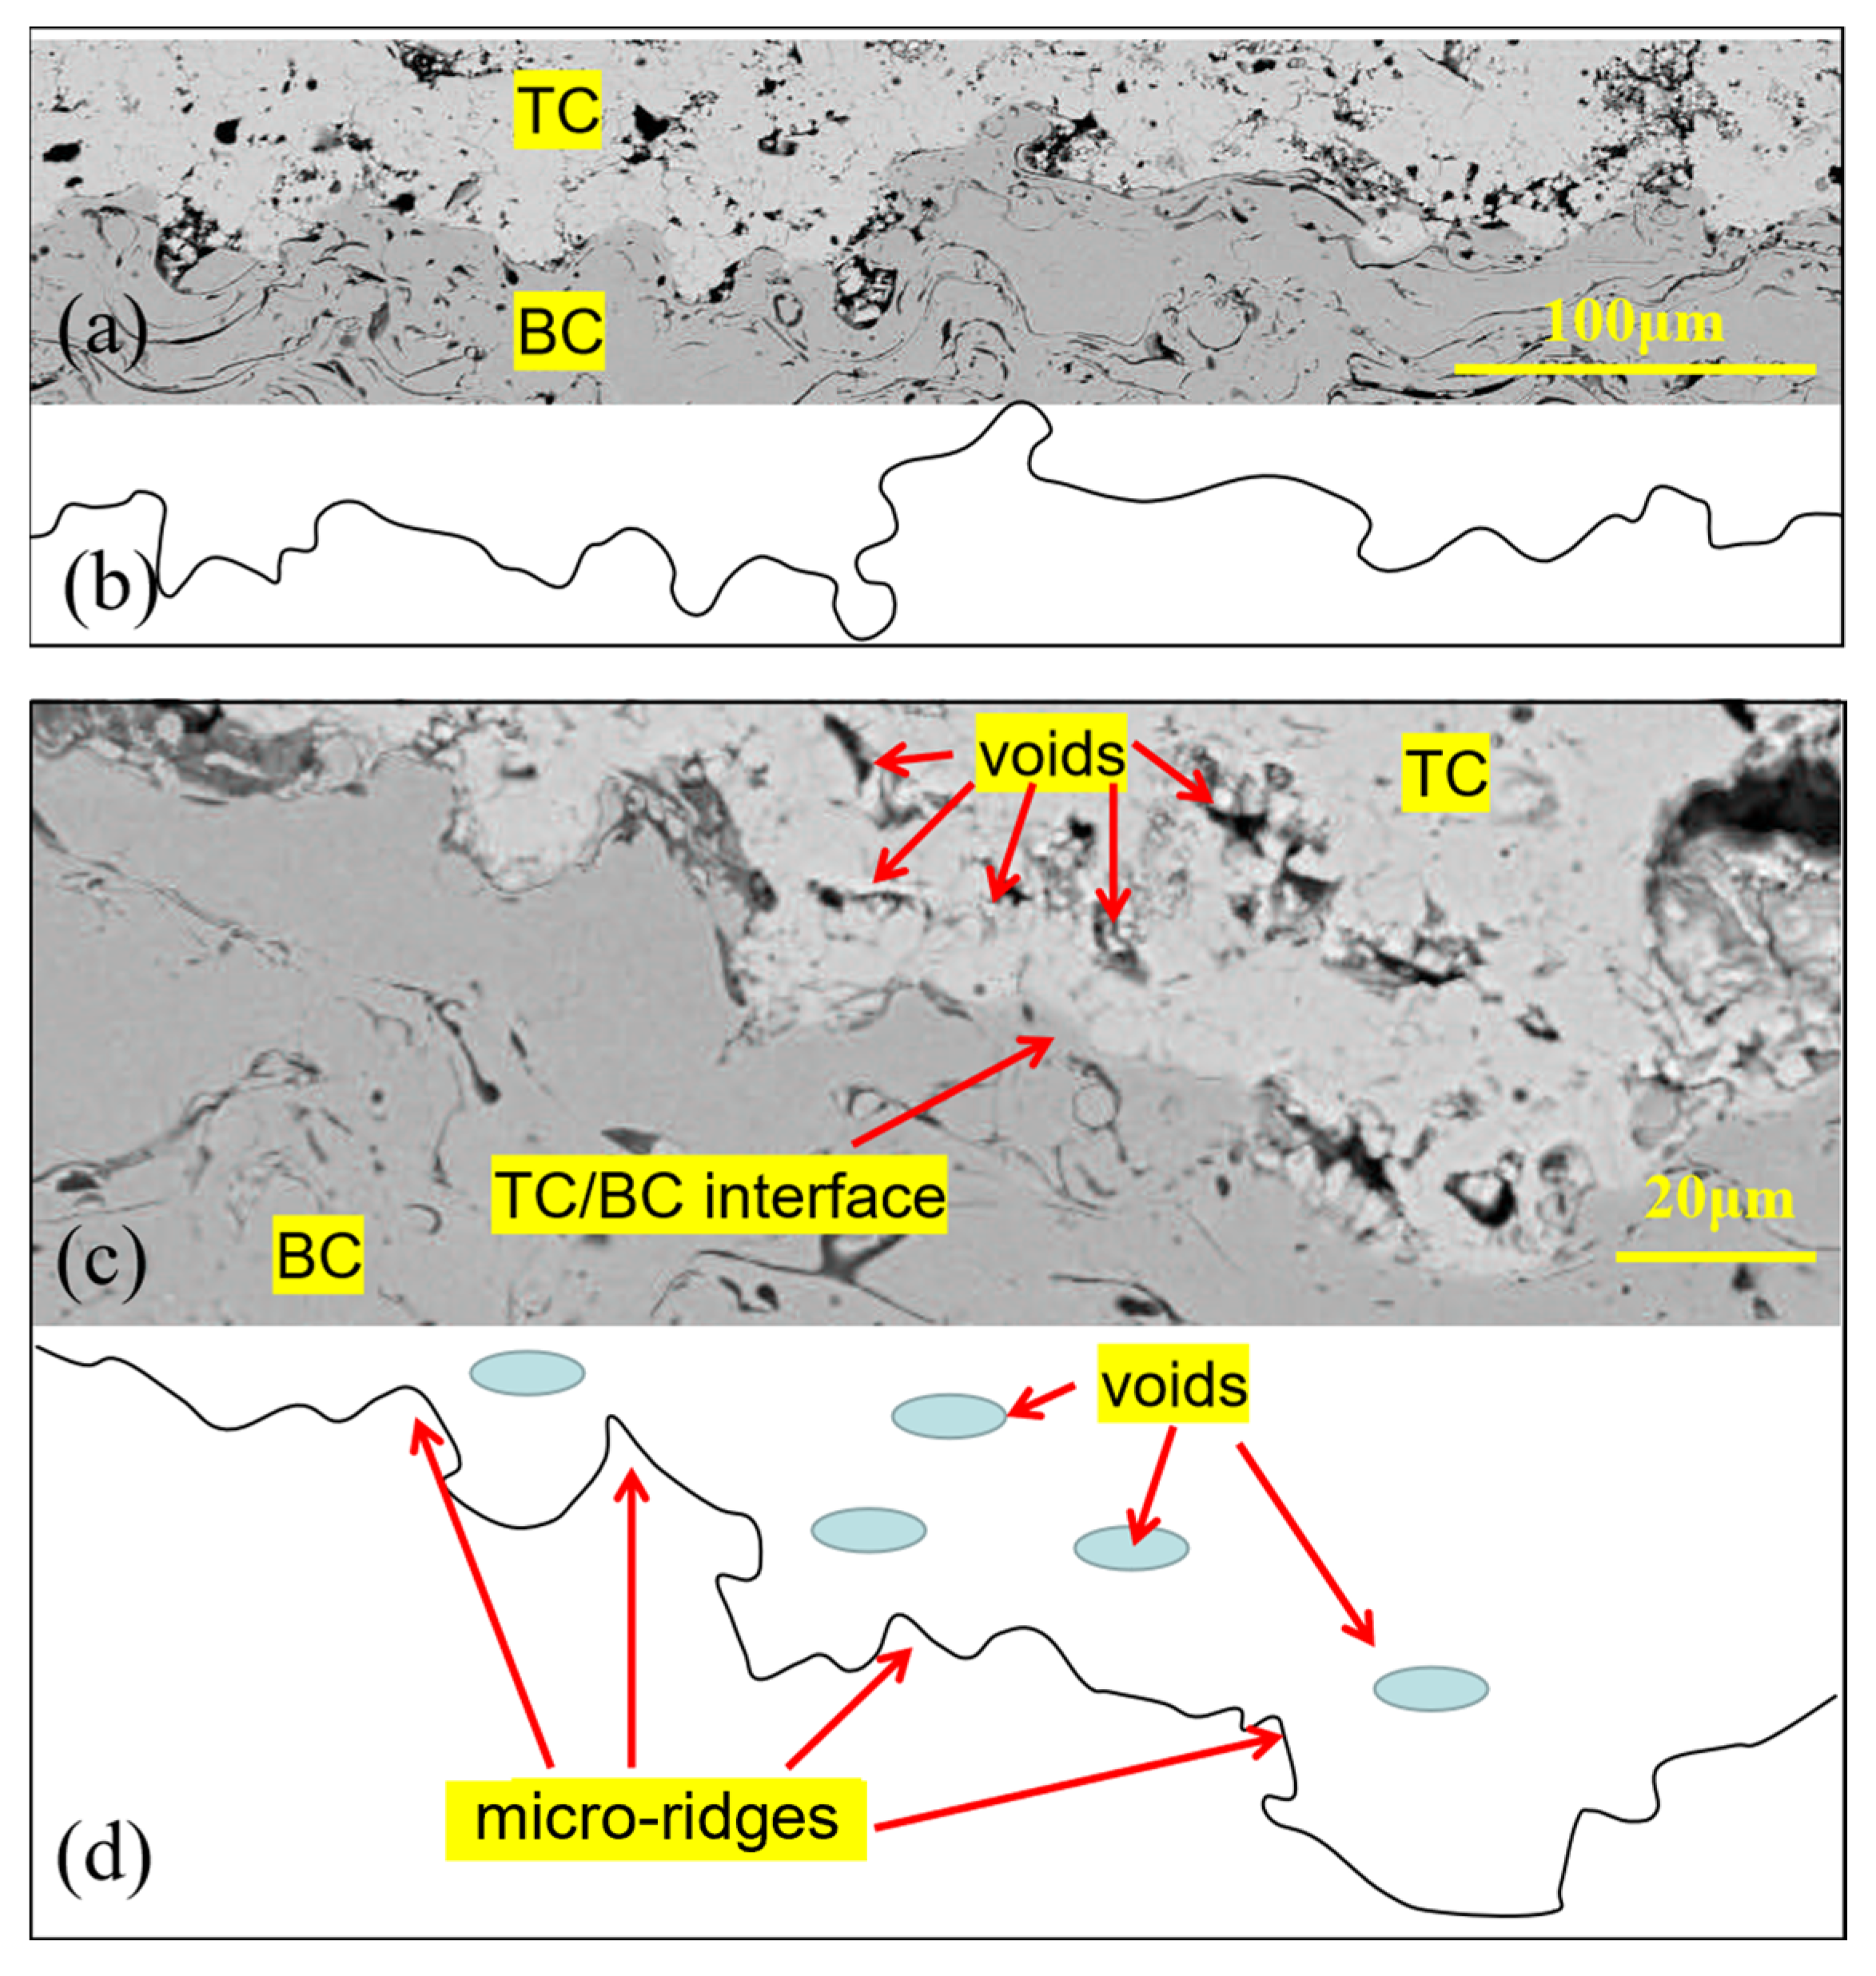
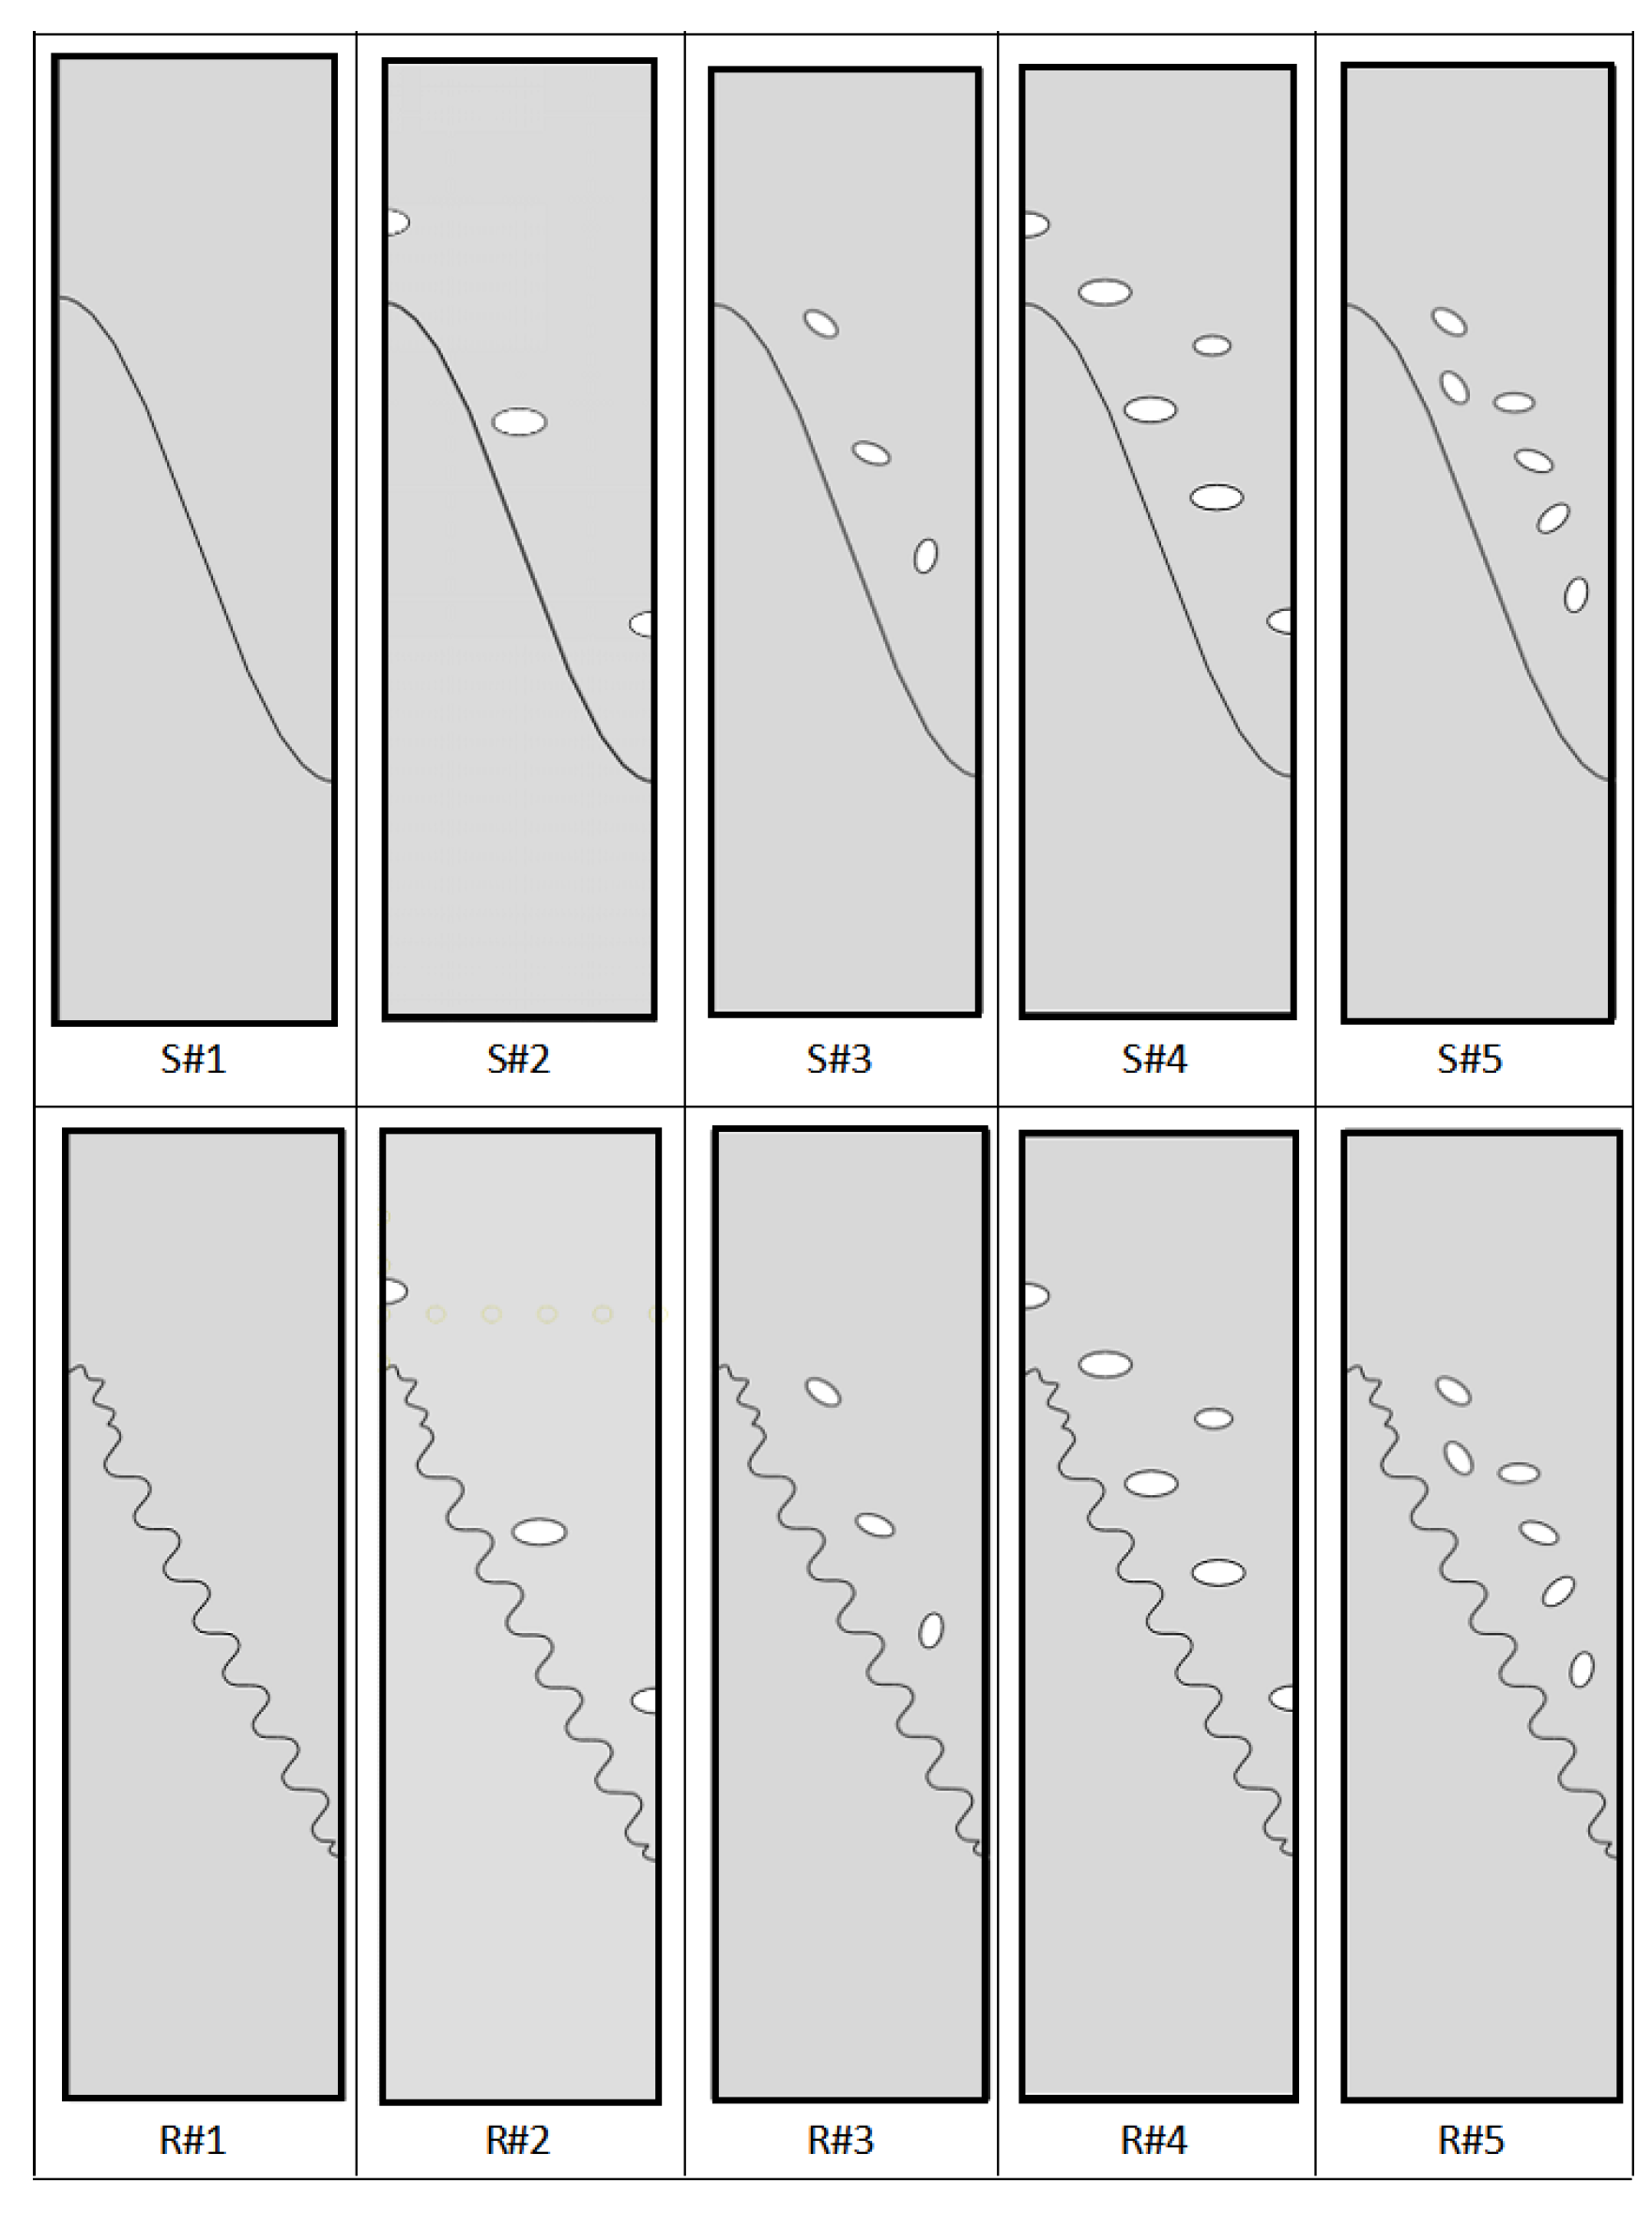
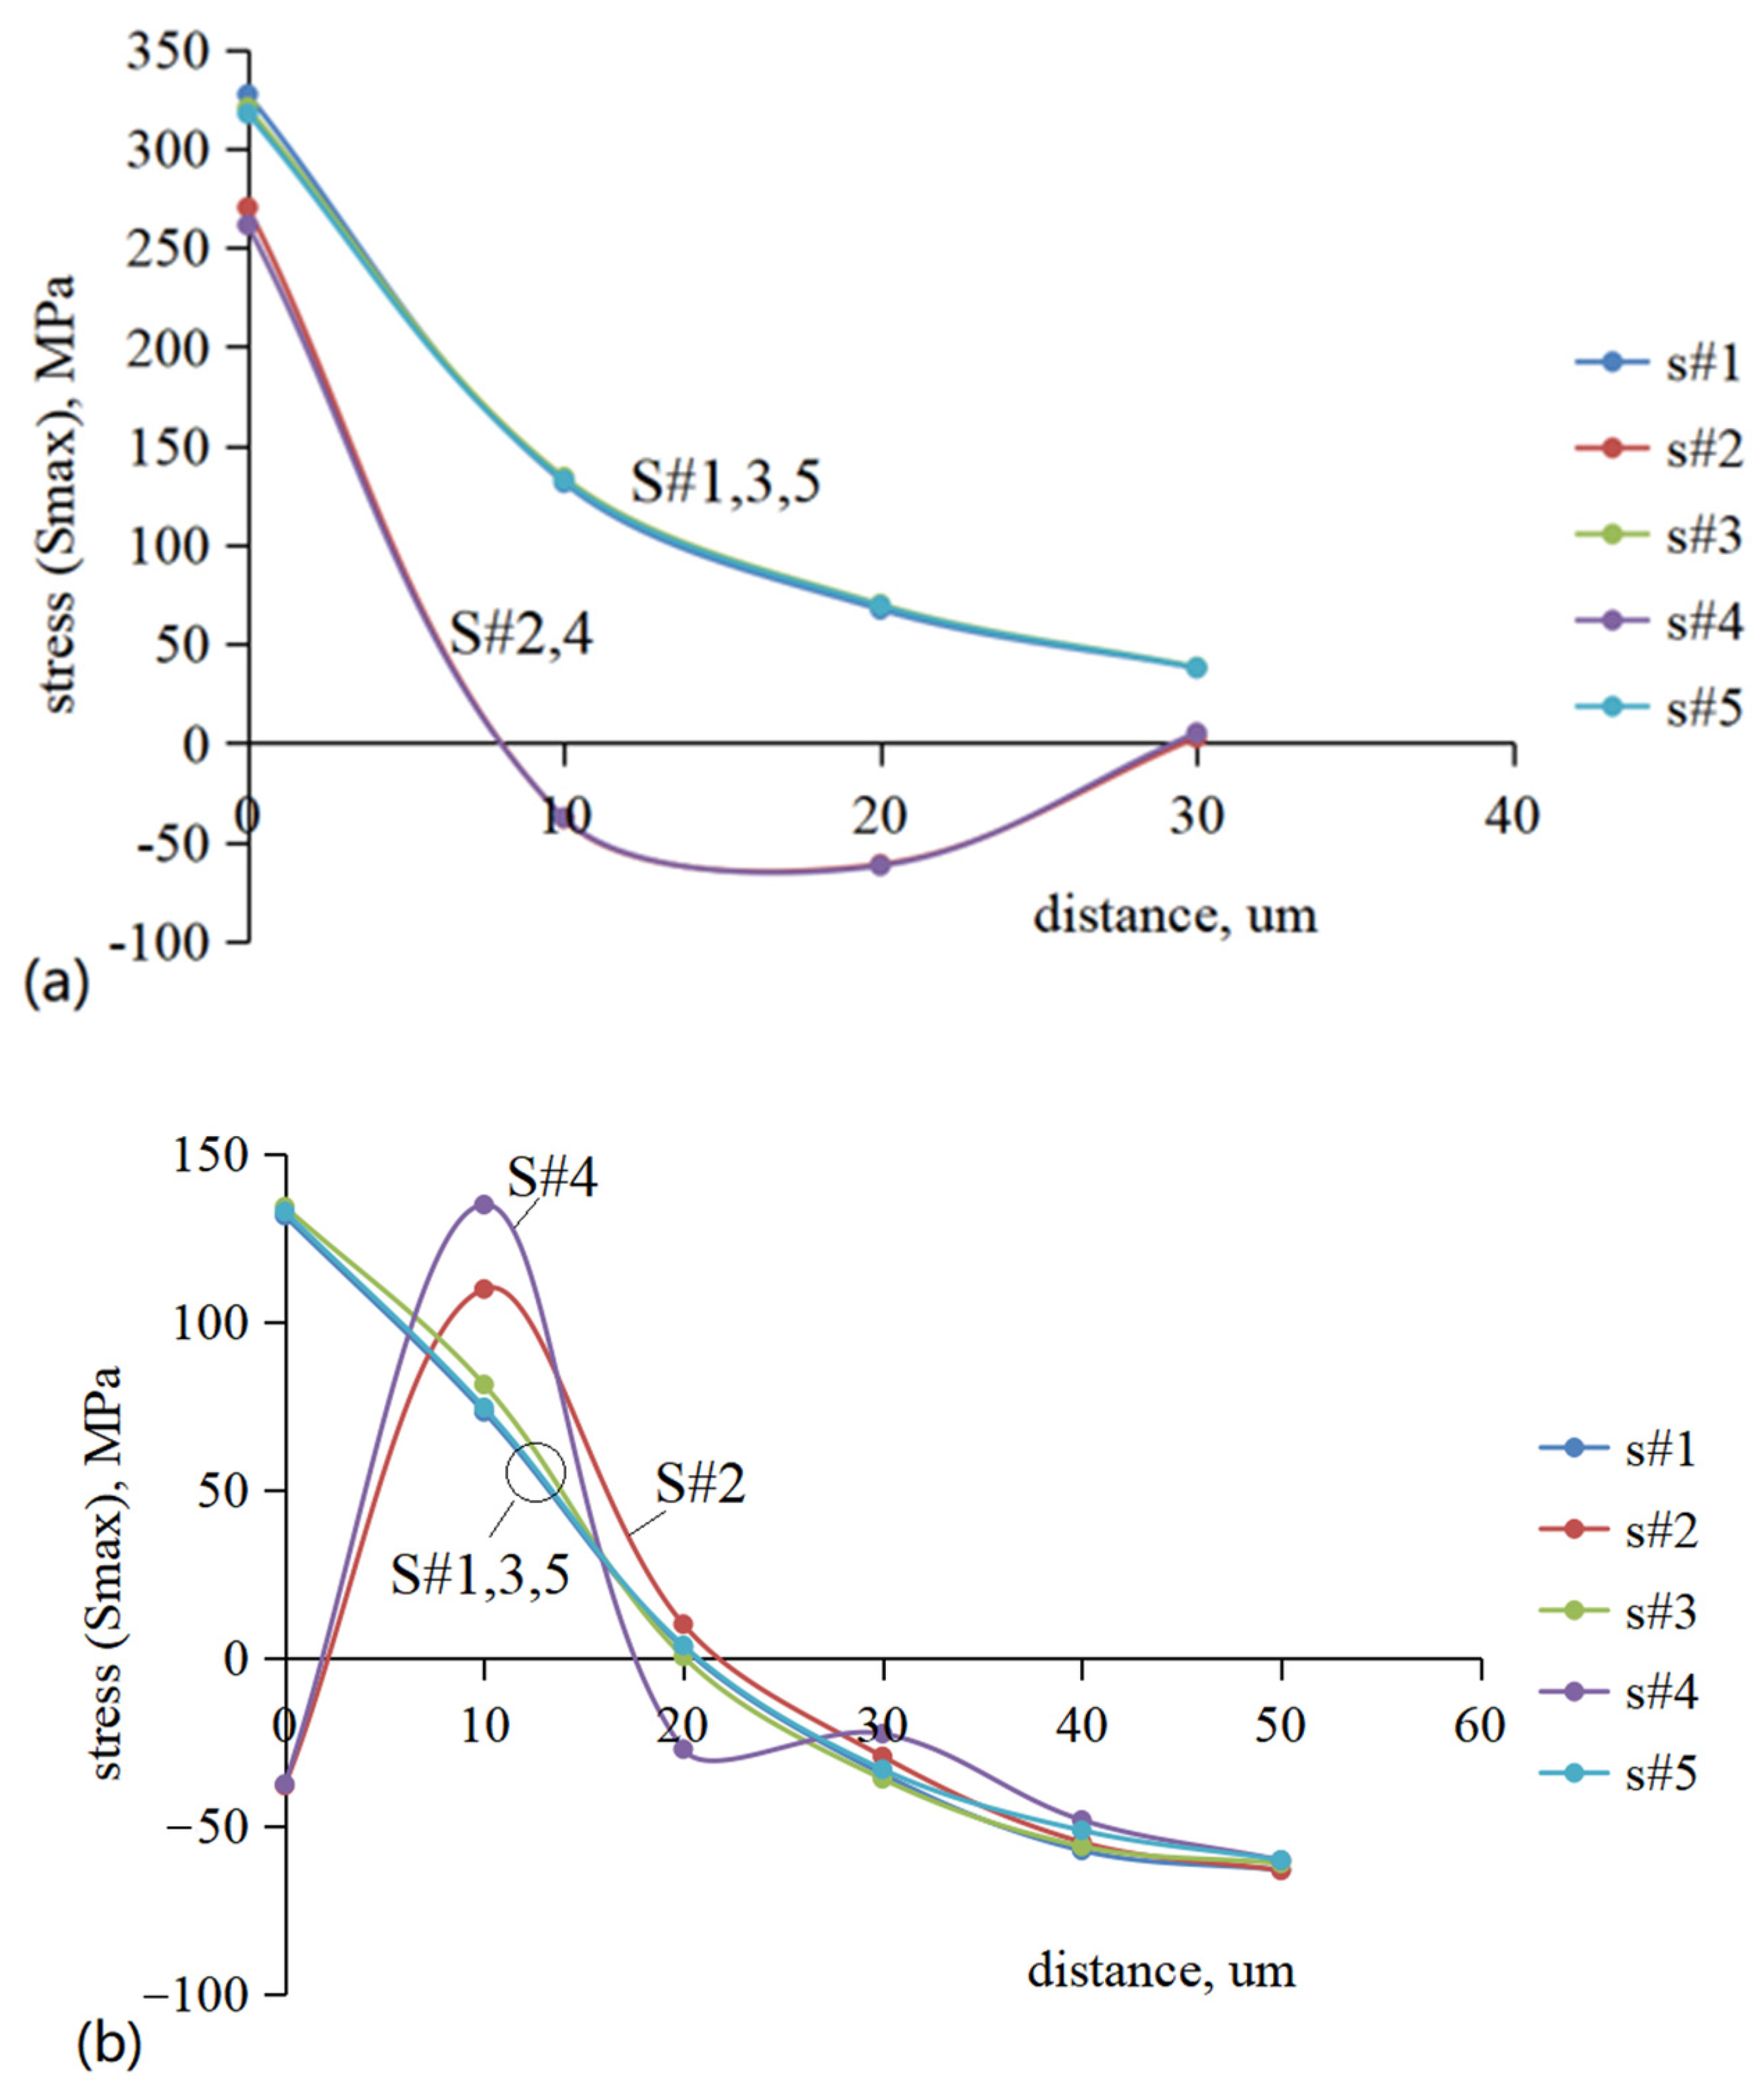
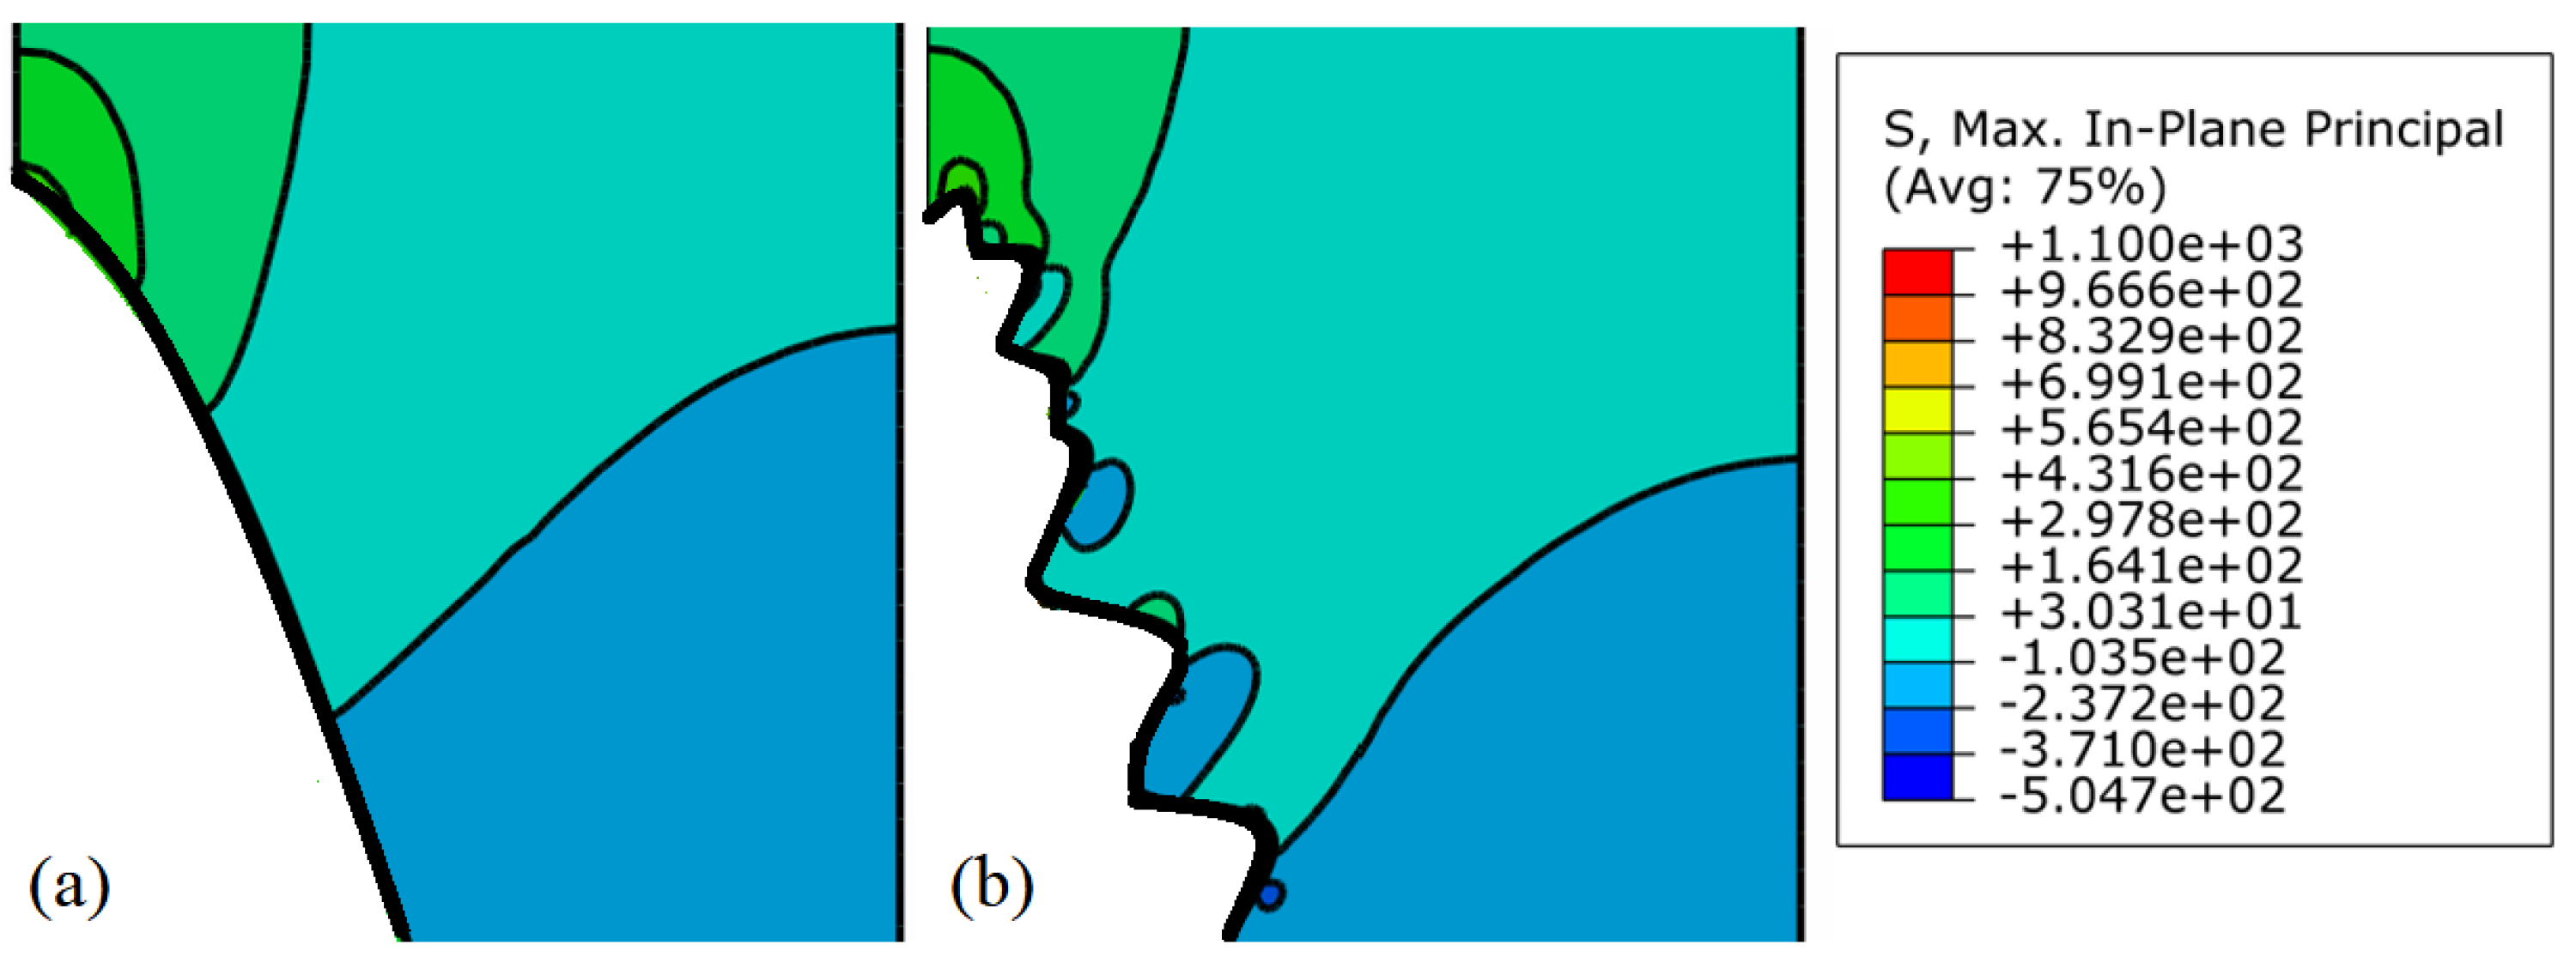
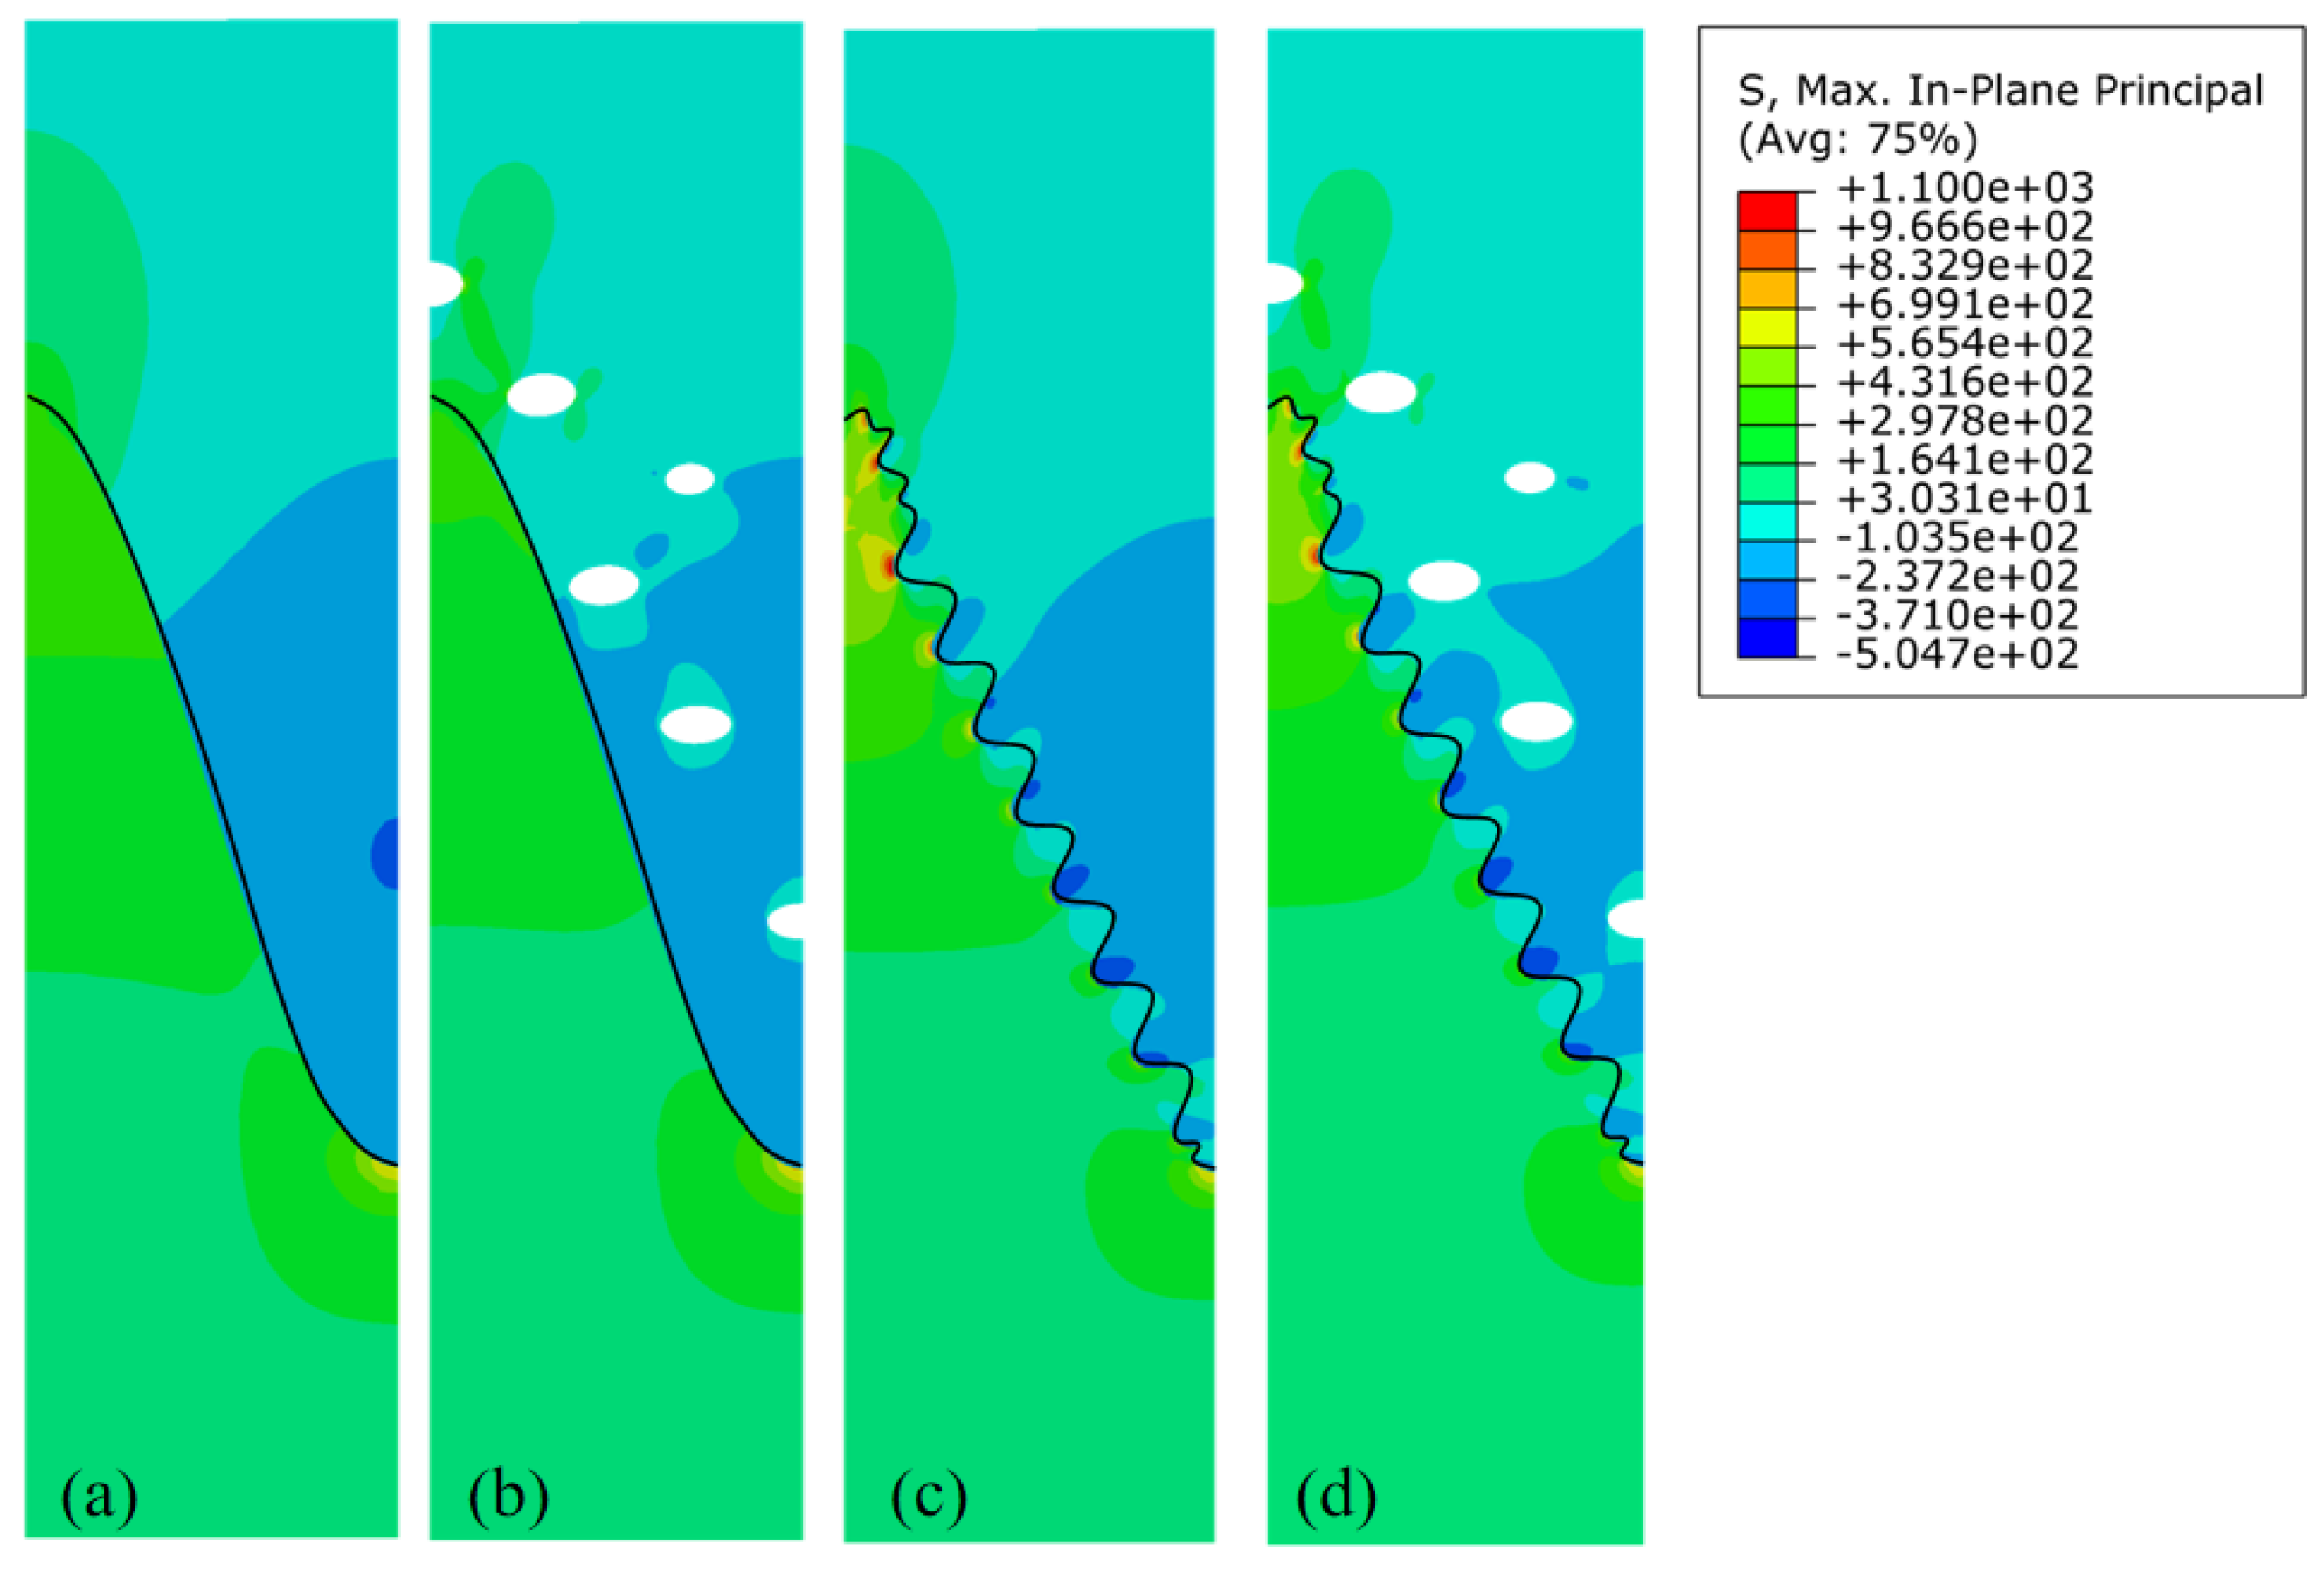
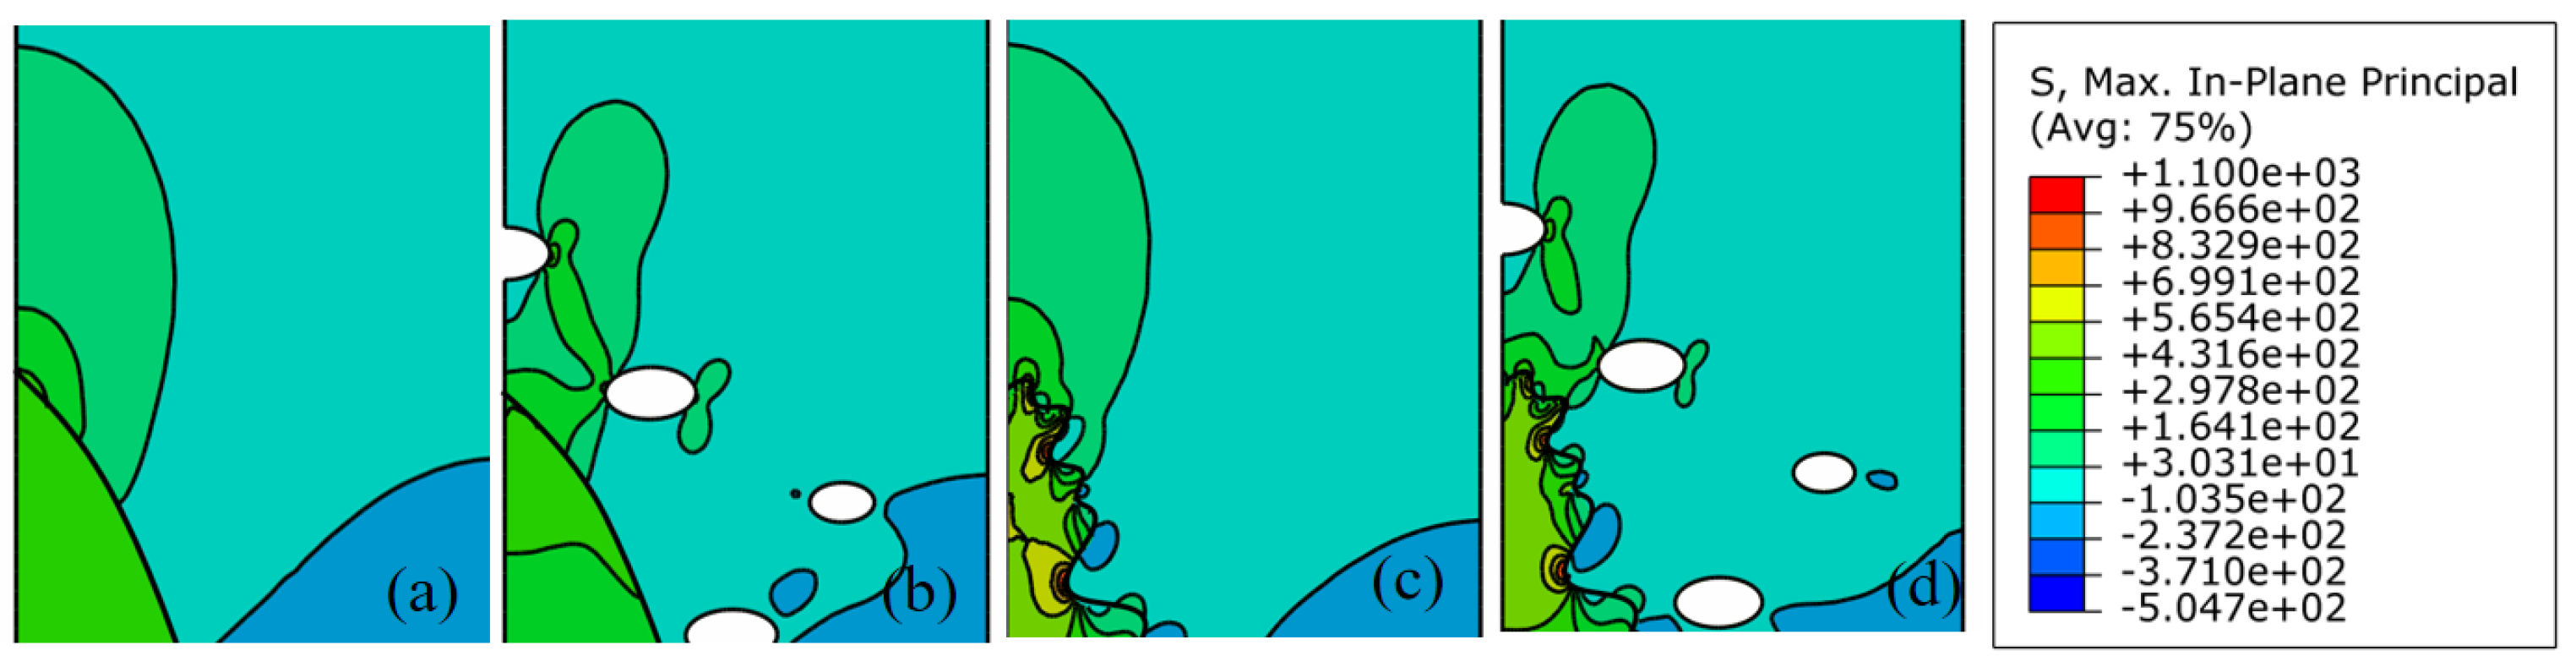
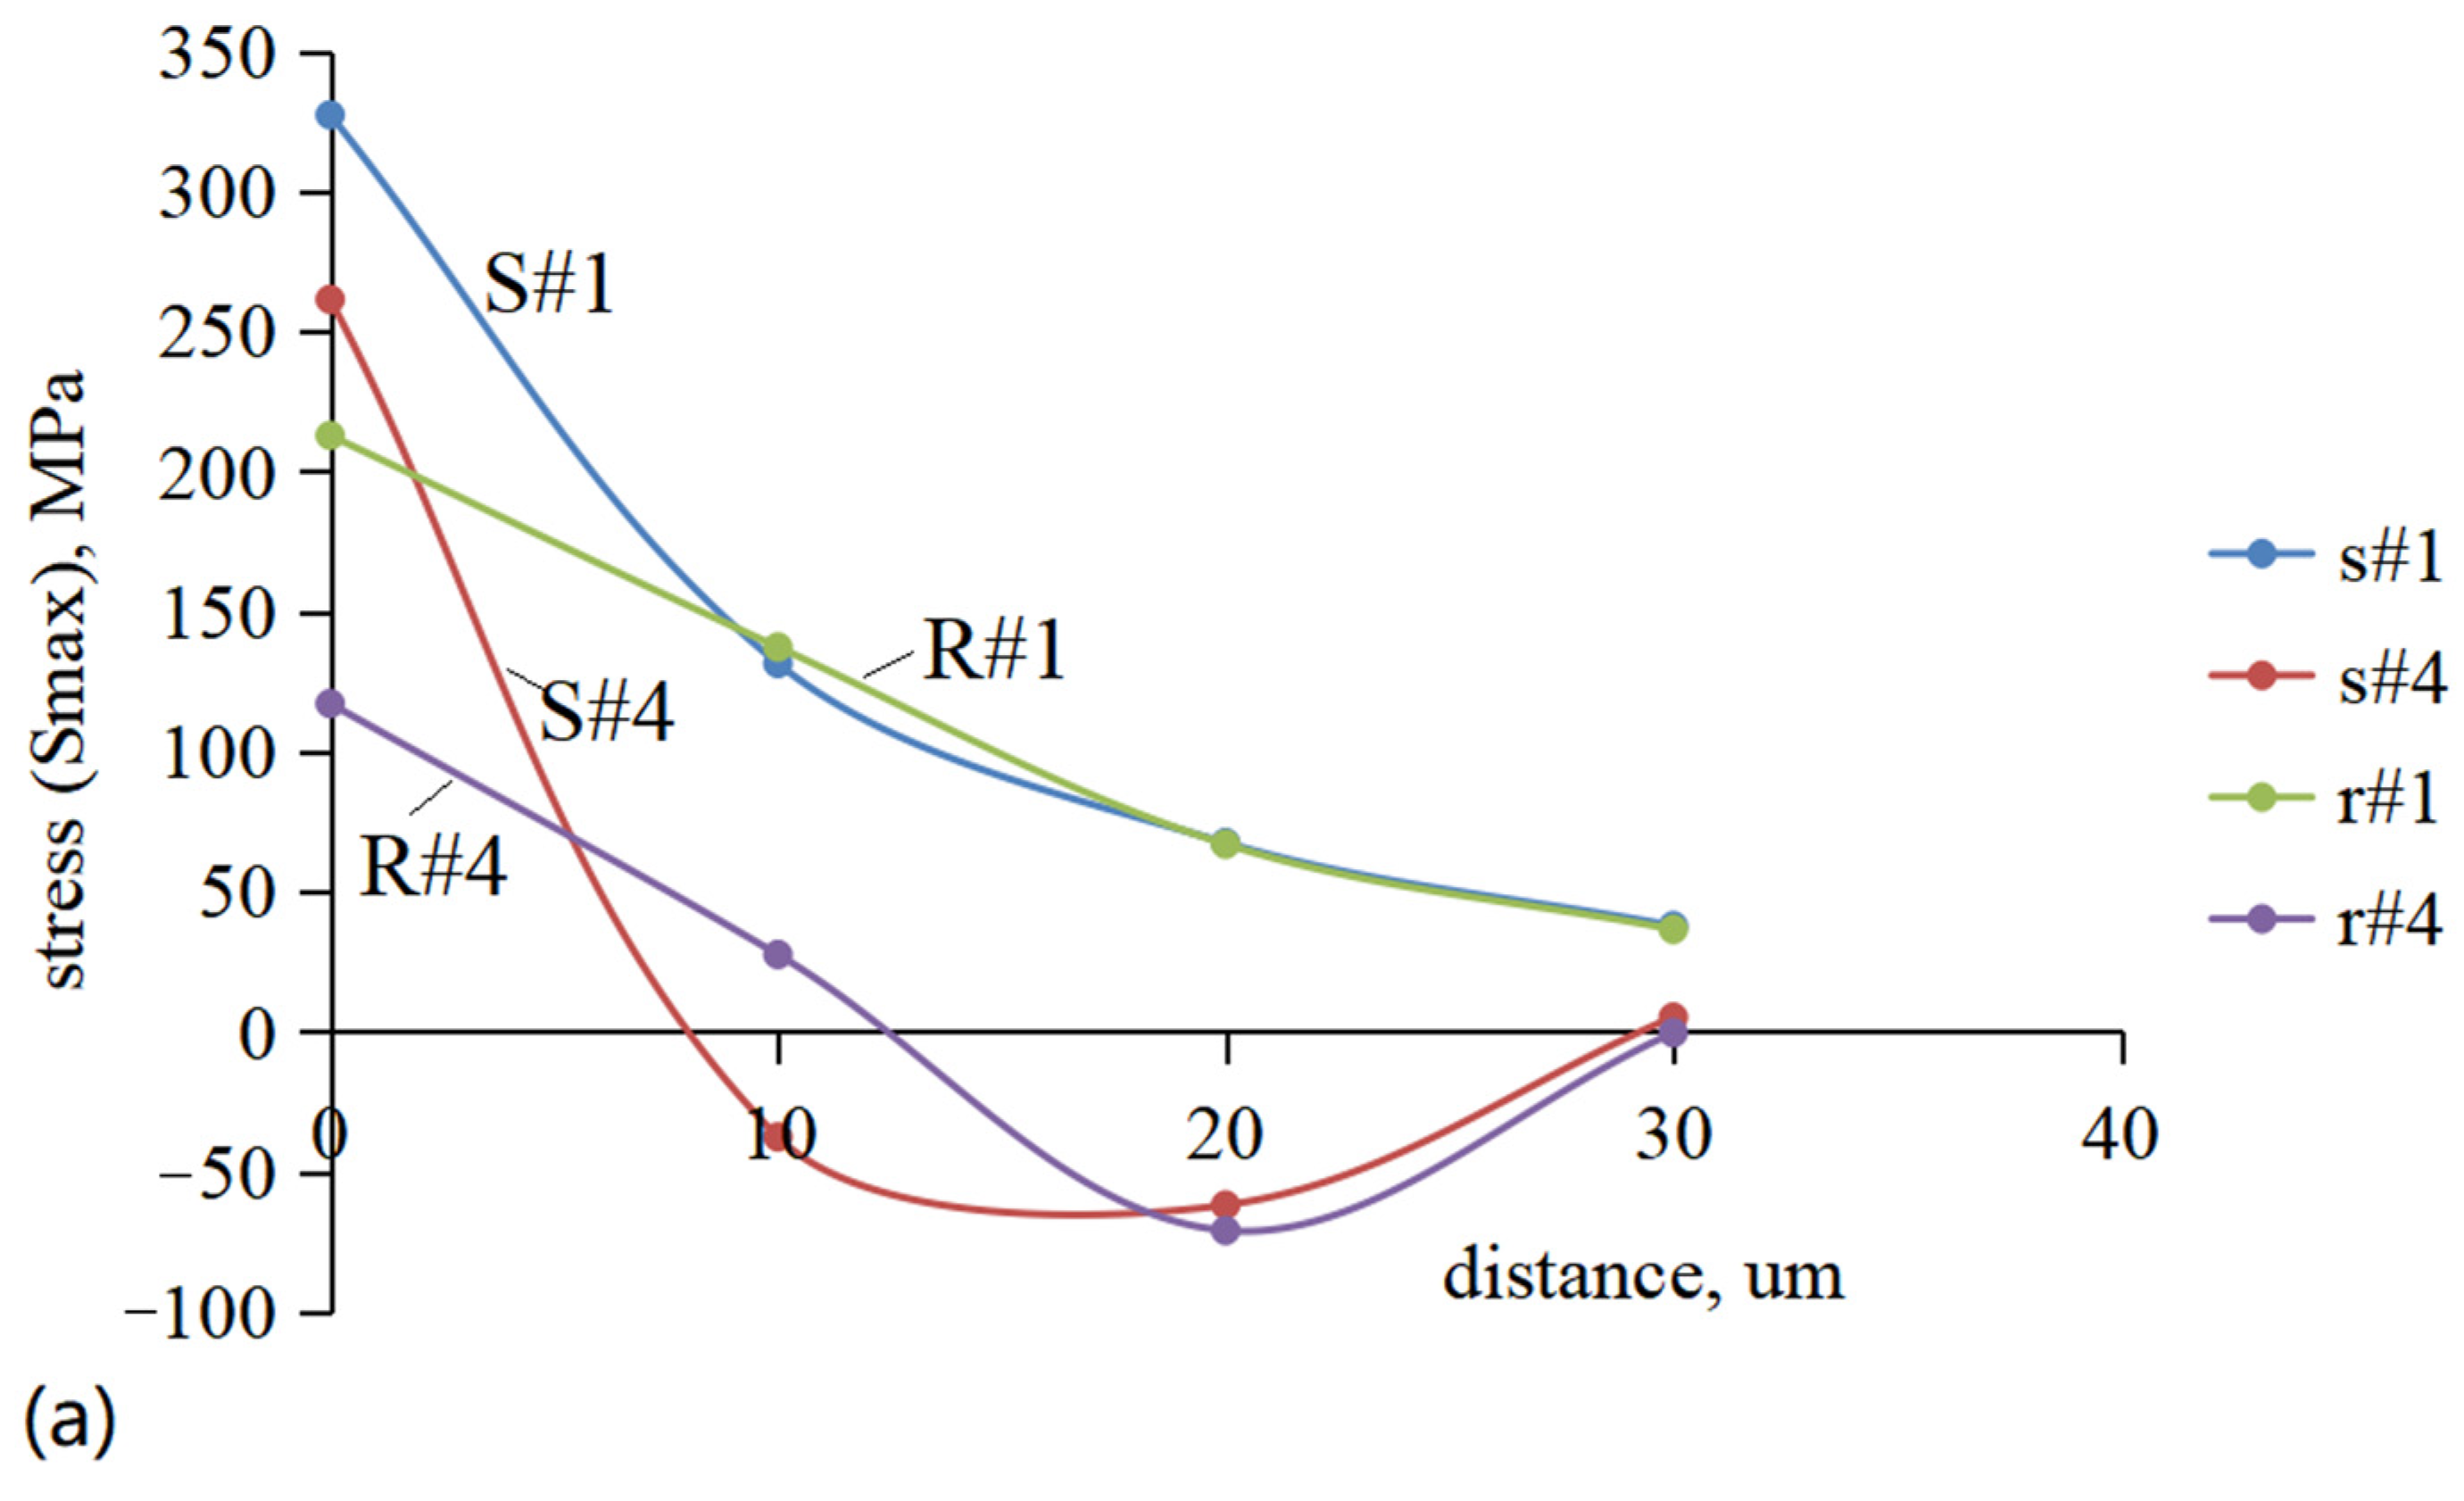
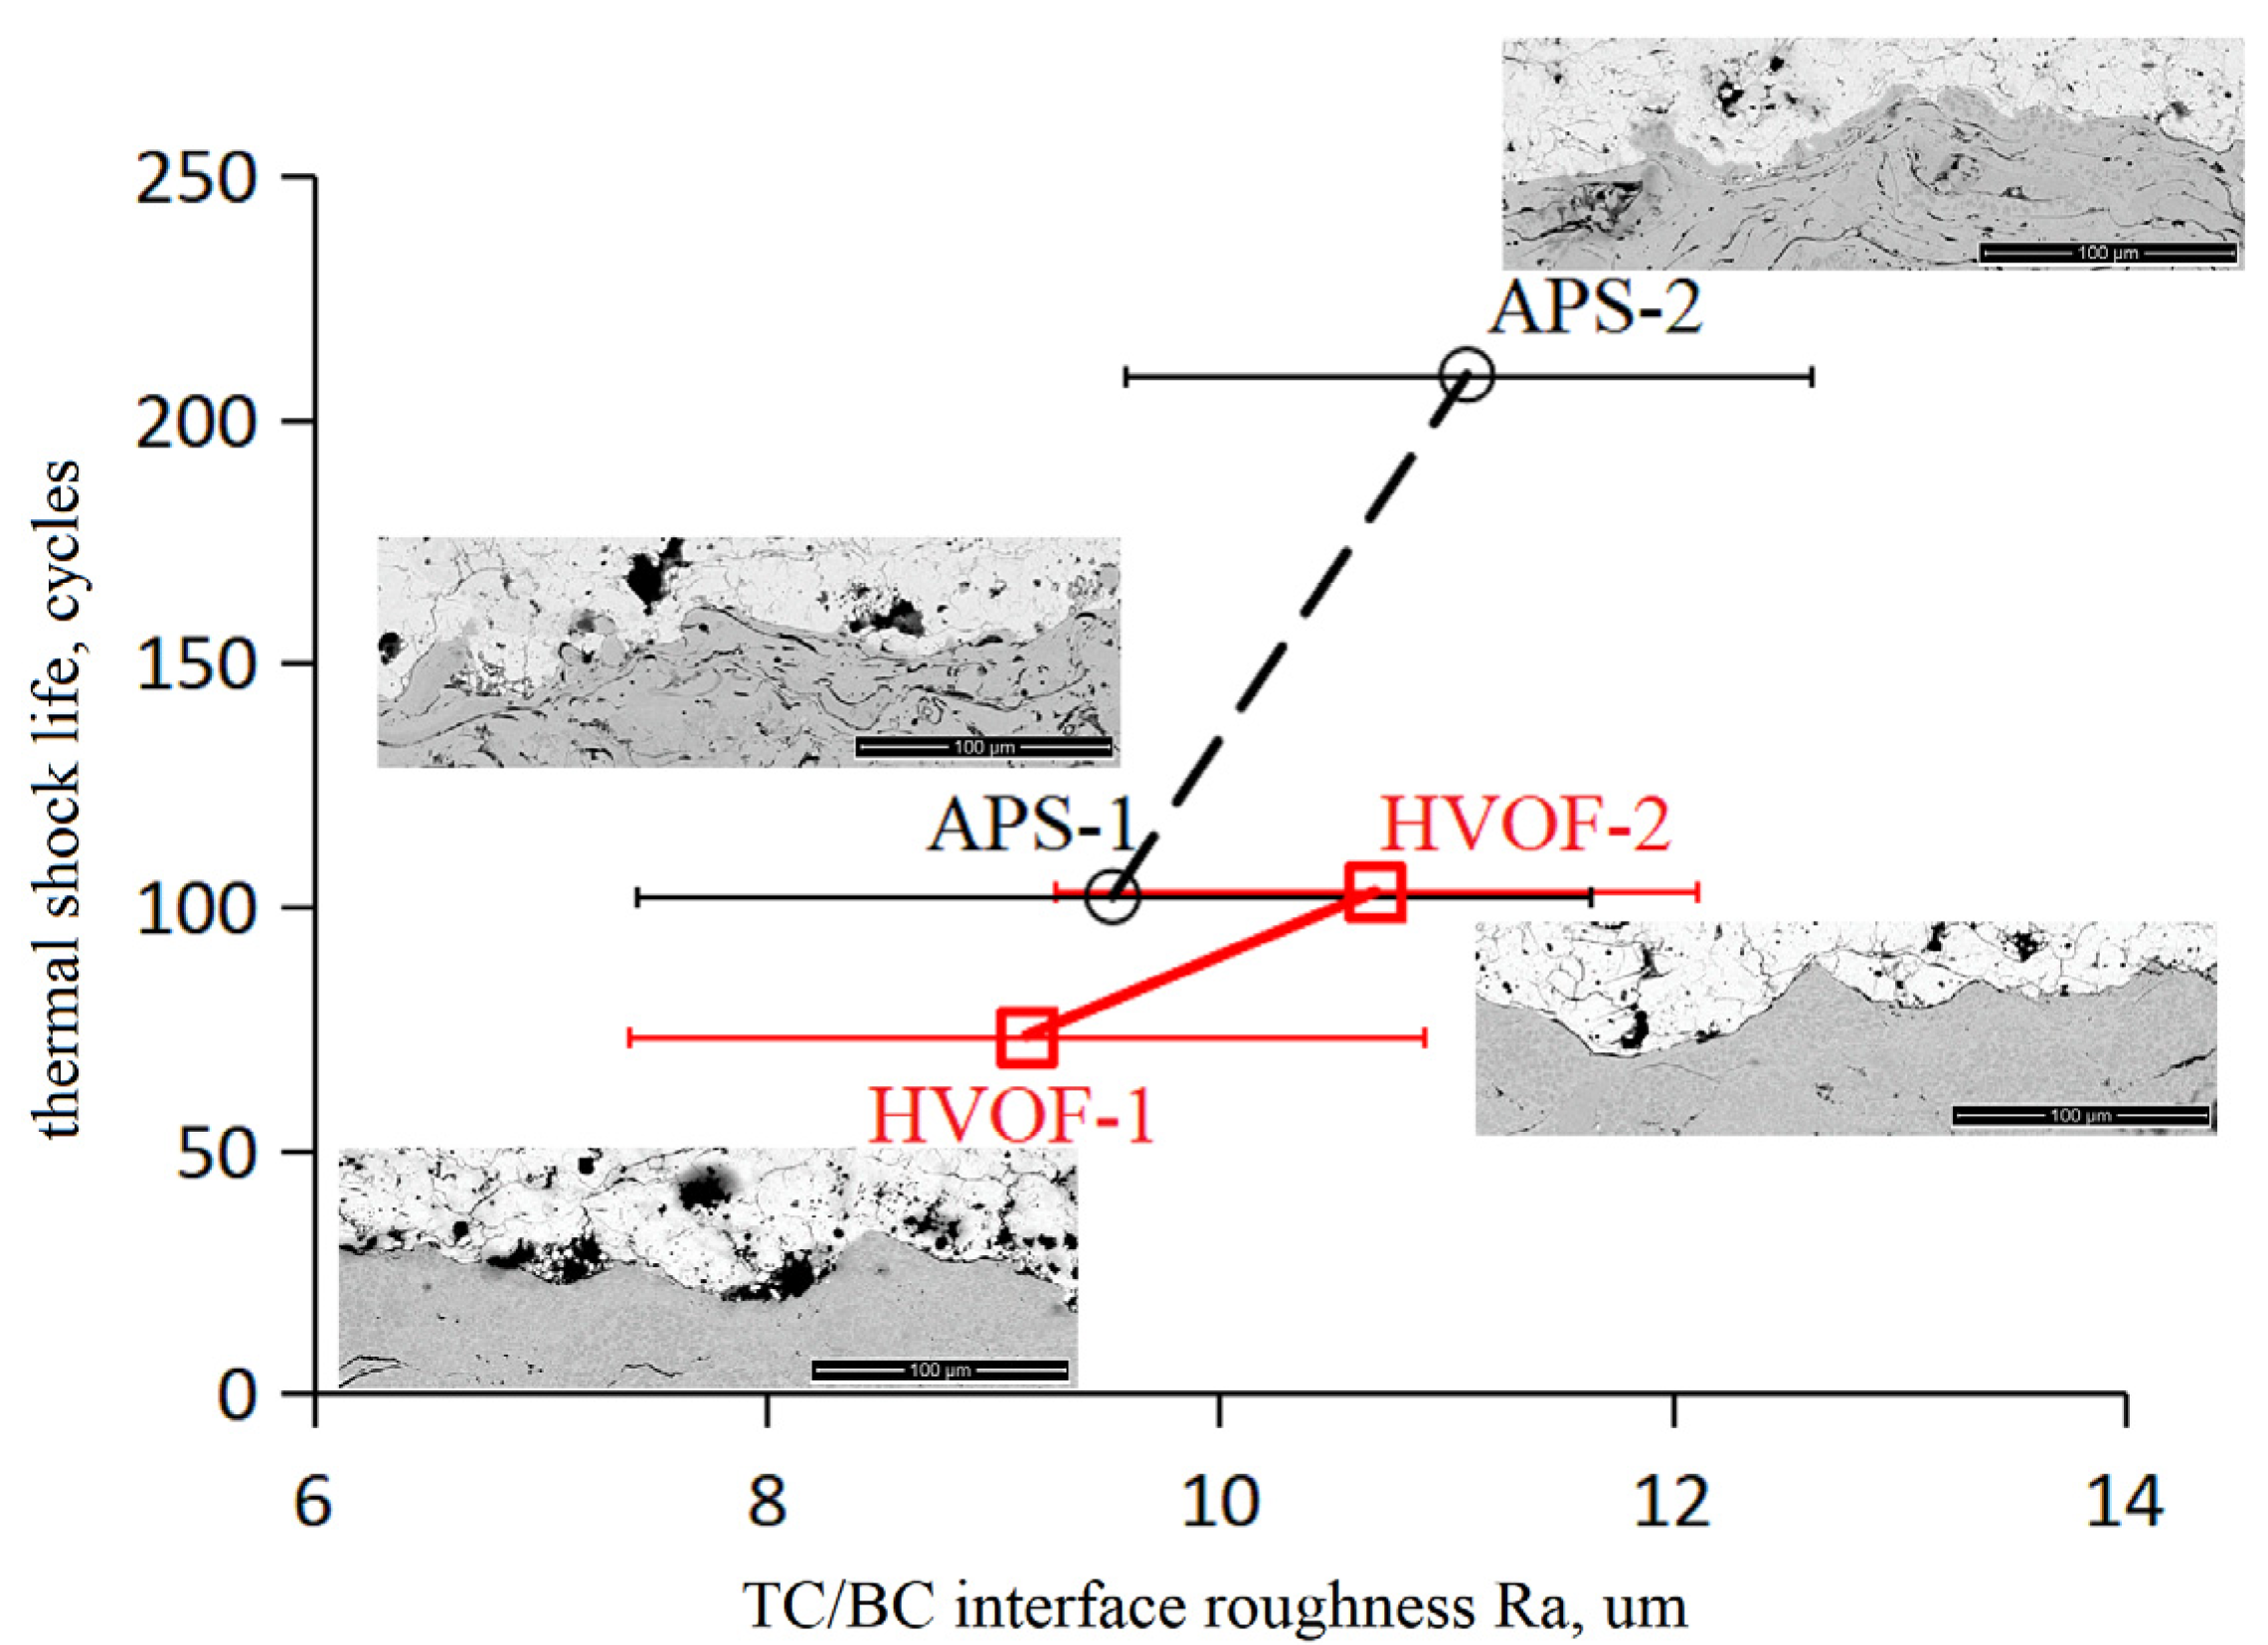
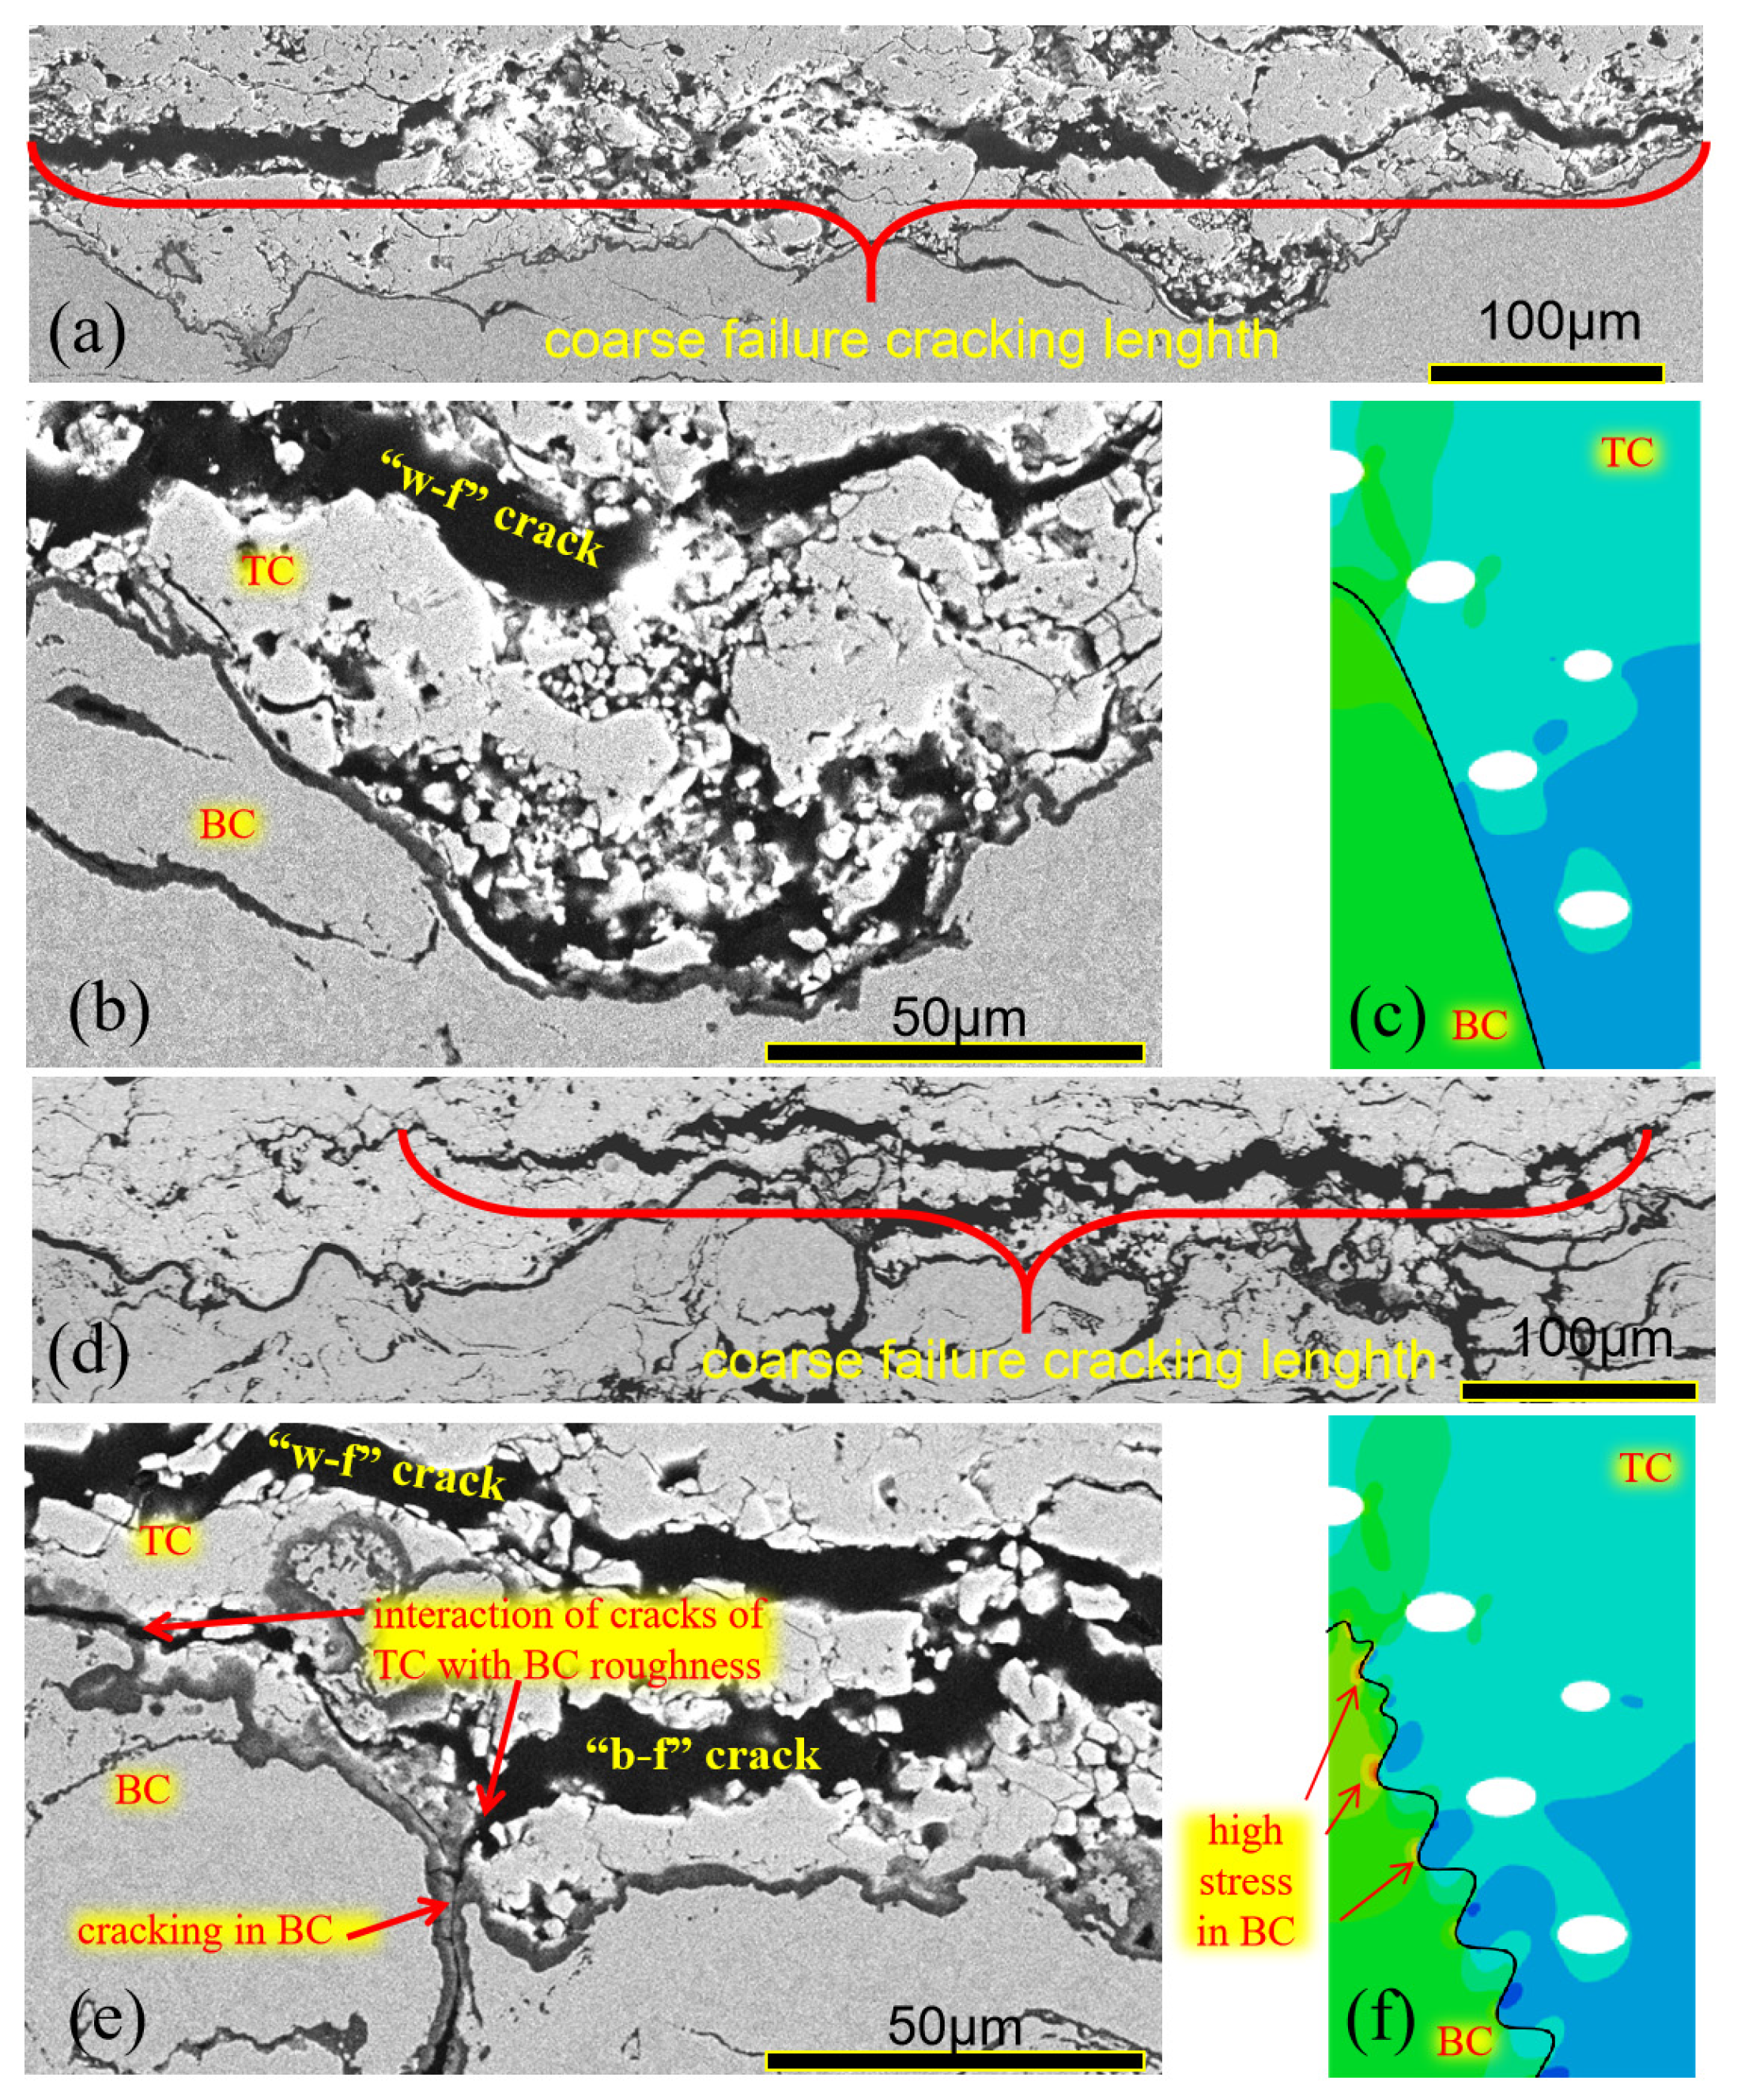
The function of the voids in TCs included the dilution effect of the stress concentration at the macro-scale, a releasing effect of the tensile stress along the vertical direction above the BC peak, and the “stress trapping” effect, causing higher stress at the horizontal tips of the voids at a micro-scale. As the tensile stress of the TC was higher at the horizontal tip positions of the voids above the TC peak, cracks preferably propagated horizontally along such voids to cause white failure in HVOF BC TBCs.
2.
In APS BC TBCs, the micro-rough BC interface played an important role. The micro-interface roughness did not have much effect on the stresses in the TC, aside from at the TC peak, but had a significant influence on the increased “stress trapping” effect at the interface. This “stress trapping” effect occurred both in the TC and BC sections, which promoted more interactions between the TC cracks and the interface to cause more black failures. The improved thermal shock lifetime of the TBCs by using APS-made BCs confirmed the modelling results.

Author Contributions

Conceptualization, X.L. and S.H.; methodology, T.S.; software, T.S.; validation, X.L., T.S. and X.P.; formal analysis, T.S.; investigation, X.P.; data curation, X.L.; writing—original draft preparation, X.L.; writing—review and editing, T.S. All authors have read and agreed to the published version of the manuscript.

Funding

This research received no external funding.

Institutional Review Board Statement

Not applicable.

Informed Consent Statement

Not applicable.

Data Availability Statement

The original contributions presented in this study are included in the article. Further inquiries can be directed to the corresponding author.

Conflicts of Interest

Author Xiaoliang Lu was employed by the University of Science and Technology Beijing. The remaining authors declare that the research was conducted in the absence of any commercial or financial relationships that could be construed as a potential conflict of interest.

References

  1. Clarke, D.R.; Phillpot, S.R. Thermal Barrier Coatings. Mater. Today 2005, 6, 22–29. [Google Scholar] [CrossRef]
  2. Vassen, R.; Stuke, A.; Stöver, D. Recent developments in the field of thermal barrier coatings. J. Therm. Spray. Technol. 2009, 18, 181–186. [Google Scholar] [CrossRef]
  3. Beele, W.; Marijnissen, G.; Van Lieshout, A. The evolution of thermal barrier coatings—Status and upcoming solutions for today’s key issues. Surf. Coat. Technol. 2002, 120, 61–67. [Google Scholar] [CrossRef]
  4. Vassen, R.; Giesen, S.; Stöver, D. Lifetime of plasma-sprayed thermal barrier coatings: Comparison of numerical and experimental results. J. Therm. Spray. Technol. 2009, 18, 835–845. [Google Scholar] [CrossRef]
  5. Rtzer-Scheibe, H.J.; Schulz, U. The Effects of Heat Treatment and Gas Atmosphere on the Thermal Conductivity of APS and EB-PVD PYSZ Thermal Barrier Coatings. Surf. Coat. Technol. 2007, 201, 7880–7888. [Google Scholar] [CrossRef]
  6. Yuan, K.; Peng, R.L.; Li, X.H.; Johansson, S.; Wang, Y.D. Some Aspects of Elemental Behaviour in HVOF MCrAlY Coatings in High-Temperature Oxidation. Surf. Coat. Technol. 2014, 261, 86–101. [Google Scholar] [CrossRef]
  7. Yuan, F.H.; Chen, Z.X.; Huang, Z.W.; Wang, Z.G.; Zhu, S.J. Oxidation behavior of thermal barrier coatings with hvof and detonation-sprayed NiCrAlY bondcoats. Corros. Sci. 2008, 50, 1608–1617. [Google Scholar] [CrossRef]
  8. Gupta, M. Establishment of Relationships Between Coating Microstructure and Thermal Conductivity in Thermal Barrier Coatings by Finite Element Modelling. Master’s Thesis, University West, Trollhättan, Sweden, 2011. [Google Scholar]
  9. Lee, S.S.; Jeon, S.; Lee, J.H.; Jung, Y.G.; Myoung, S.W.; Yang, B.I.; Lu, Z. Effects of microstructure design and feedstock species in the bond coat on thermal stability of thermal barrier coatings. Int. J. Nanotechnol. 2018, 15, 545–554. [Google Scholar] [CrossRef]
  10. Goral, M.; Sosnowy, P. Microstructure of thermal barrier coatings deposited by APS method with application of new type ceramic powders. J. Achiev. Mat. Manuf. Eng. 2012, 55, 912–917. [Google Scholar]
  11. Huang, J.B.; Wang, W.Z.; Li, Y.J.; Fang, H.J.; Ye, D.D.; Zhang, X.C.; Tu, S.T. A novel strategy to control the microstructure of plasma-sprayed YSZ thermal barrier coatings. Surf. Coat. Technol. 2020, 402, 126304. [Google Scholar] [CrossRef]
  12. Jonnalagadda, K.P.; Eriksson, R.; Yuan, K.; Li, X.H.; Ji, X.; Yu, Y.; Peng, R.L. Comparison of damage evolution during thermal cycling in a high purity nano and a conventional thermal barrier coating. Surf. Coat. Technol. 2017, 322, 47–56. [Google Scholar] [CrossRef]
  13. Scrivani, A.; Rizzi, G.; Berndt, C.C. Enhanced thick thermal barrier coatings that exhibit varying porosity. Mat. Sci. Eng. A 2008, 476, 1–7. [Google Scholar] [CrossRef]
  14. Jonnalagadda, K.P.; Eriksson, R.; Yuan, K.; Li, X.H.; Ji, X.; Yu, Y.; Peng, R.L. A study of damage evolution in high purity nano TBCs during thermal cycling_ A fracture mechanics based modelling approach. J. Eur. Ceram. Soc. 2017, 37, 2889–2899. [Google Scholar] [CrossRef]
  15. Sjöström, S.; Brodin, H.; Jinnestrand, M. Thermomechanical fatigue life of a TBC—Comparison of computed and measured behaviour of delamination cracks. In Proceedings of the 13th International Conference on Fracture, Beijing, China, 16–21 June 2013; pp. 1170–1179. [Google Scholar]
  16. Funke, C.; Mailand, J.C.; Siebert, B.; Vaβen, R.; Stöver, D. Characterization of ZrO2-7 wt.% Y2O3 thermal barrier coatings with different porosities and FEM analysis of stress redistribution during thermal cycling of TBCs. Surf. Coat. Technol. 1997, 94, 106–111. [Google Scholar] [CrossRef]
  17. Weeks, M.D.; Subramanian, R.; Vaidya, A.; Mumm, D.R. Defining optimal morphology of the bond coat-thermal barrier coating interface of air-plasma sprayed thermal barrier coating systems. Surf. Coat. Technol. 2015, 273, 50–59. [Google Scholar] [CrossRef]
  18. Ranjbar-Far, M.; Absi, J.; Mariaux, G.; Dubois, F. Simulation of the effect of material properties and interface roughness on the stress distribution in thermal barrier coatings using finite element method. Mater. Des. 2010, 31, 772–781. [Google Scholar] [CrossRef]
  19. Liu, Y.; Persson, C.; Wigren, J. Experimental and numerical life prediction of thermally cycled thermal barrier coatings. J. Therm. Spray. Technol. 2004, 13, 415–424. [Google Scholar] [CrossRef]
  20. Busso, E.P.; Wright, L.; Evans, H.E.; McCartney, L.N.; Saunders, S.R.J.; Osgerby, S.; Nunn, J. A physics-based life prediction methodology for thermal barrier coating systems. Acta Mater. 2007, 55, 1491–1503. [Google Scholar] [CrossRef]
  21. Nowak, W.; Naumenko, D.; Mor, G.; Mor, F.; Mack, D.E.; Vassen, R.; Singheiser, L.; Quadakkers, W.J. Effect of processing parameters on MCrAlY bondcoat roughness and lifetime of APS-TBC systems. Surf. Coat. Technol. 2014, 260, 82–89. [Google Scholar] [CrossRef]
  22. Eriksson, R.; Sjöström, S.; Brodin, H.; Johansson, S.; Östergren, L.; Li, X.H. TBC bond coat–top coat interface roughness: Influence on fatigue life and modelling aspects. Surf. Coat. Technol. 2013, 236, 230–238. [Google Scholar] [CrossRef]
  23. Yuan, K.; Yu, Y.; Wen, J.-F. A study on the thermal cyclic behavior of thermal barrier coatings with different MCrAlY roughness. Surf. Coat. Technol. 2017, 137, 72–80. [Google Scholar] [CrossRef]
Figure 1. (a) Cross-sectional micro-structure of a typical TBCs made by APS; (b) the contour of the TC/BC interface of (a); (c) micro-morphology near the interface; (d) the contour of the interface with micro-ridges and voids in TC.
Coatings 15 00097 g001
Figure 2. FE models: (a) considering the micro-rough interface; (b) considering both the micro-rough interface and nearby voids in the TC.
Coatings 15 00097 g002
Figure 3. FE models.
Coatings 15 00097 g003
Figure 4. Stress maps in smooth interface FE models with different distributions of voids: (a) S#1, (b) S#2, (c) S#3, (d) S#4, (e) S#5.
Coatings 15 00097 g004
Figure 5. Stress maps near the TC peak from the results of Figure 4: (a) S#1, (b) S#2, (c) S#3, (d) S#4, (e) S#5. The distance between two adjacent points shown in the figure (a) was 10 μm, and point O started at the top of the TC/BC interface.
Coatings 15 00097 g005
Figure 6. Stress profiles in TCs above the TC peak: (a) along vertical direction, (b) along horizontal direction. The data are corresponding to the results of Figure 5.
Coatings 15 00097 g006
Figure 7. Stress maps in rough interface FE models with different distributions of voids: (a) S#1, (b) S#2, (c) S#3, (d) S#4, (e) S#5.
Coatings 15 00097 g007
Figure 8. Comparison of the detailed stress distribution in TC part near the peak of BC: (a) with smooth interface (S#1), (b) with rough interface (R#1).
Coatings 15 00097 g008
Figure 9. Comparison of stress distribution influenced by micro-roughness and voids: (a) smooth interface and no voids (S#1), (b) smooth interface and voids (R#4), (c) rough interface and no voids (R#1), and (d) rough interface and voids (R#4).
Coatings 15 00097 g009
Figure 10. Stress maps near the TC peak from the results of Figure 9: (a) S#1, (b) S#4, (c) R#1, and (d) R#4.
Coatings 15 00097 g010
Figure 11. Stress profiles in TCs above the TC peak: (a) along the vertical direction; (b) along the horizontal direction. The point distribution for the analyses is the same as shown in Figure 5a.
Coatings 15 00097 g011aCoatings 15 00097 g011b
Figure 12. Water-cooling thermal shock results of TBCs with different interface Ra roughness. The BCs were made by either APS or HVOF, and the TCs were made by APS.
Coatings 15 00097 g012
Figure 13. Failure micro-structure near the TC/BC interface: (a,b) show HVOF BC; (d,e) show APS BC; and the simulated stress distribution in coatings with (c) a smooth interface and (f) a rough interface are shown. White failure (“a–f”) was caused by cracking in ceramic TC; black failure (“b–f”) was caused by cracking along the TC/BC interface or in the BC.
Coatings 15 00097 g013
Table 1. Material constants used for FE simulation.
ComponentYoung’s Modulus (GPa)Poisson’s RatioCoefficient of Expansion
(10−6 1/°C)
Ceramic TC (YSZ)530.2510.2
Metallic BC (MCrAlY)2250.314
Disclaimer/Publisher’s Note: The statements, opinions and data contained in all publications are solely those of the individual author(s) and contributor(s) and not of MDPI and/or the editor(s). MDPI and/or the editor(s) disclaim responsibility for any injury to people or property resulting from any ideas, methods, instructions or products referred to in the content.

