
Effect of Laser Energy Density on the Microstructure and Mechanical Properties of Al2O3/Inconel 718 Nanocomposites Fabricated by SLM


Abstract
1. Introduction
2. Materials and Methods
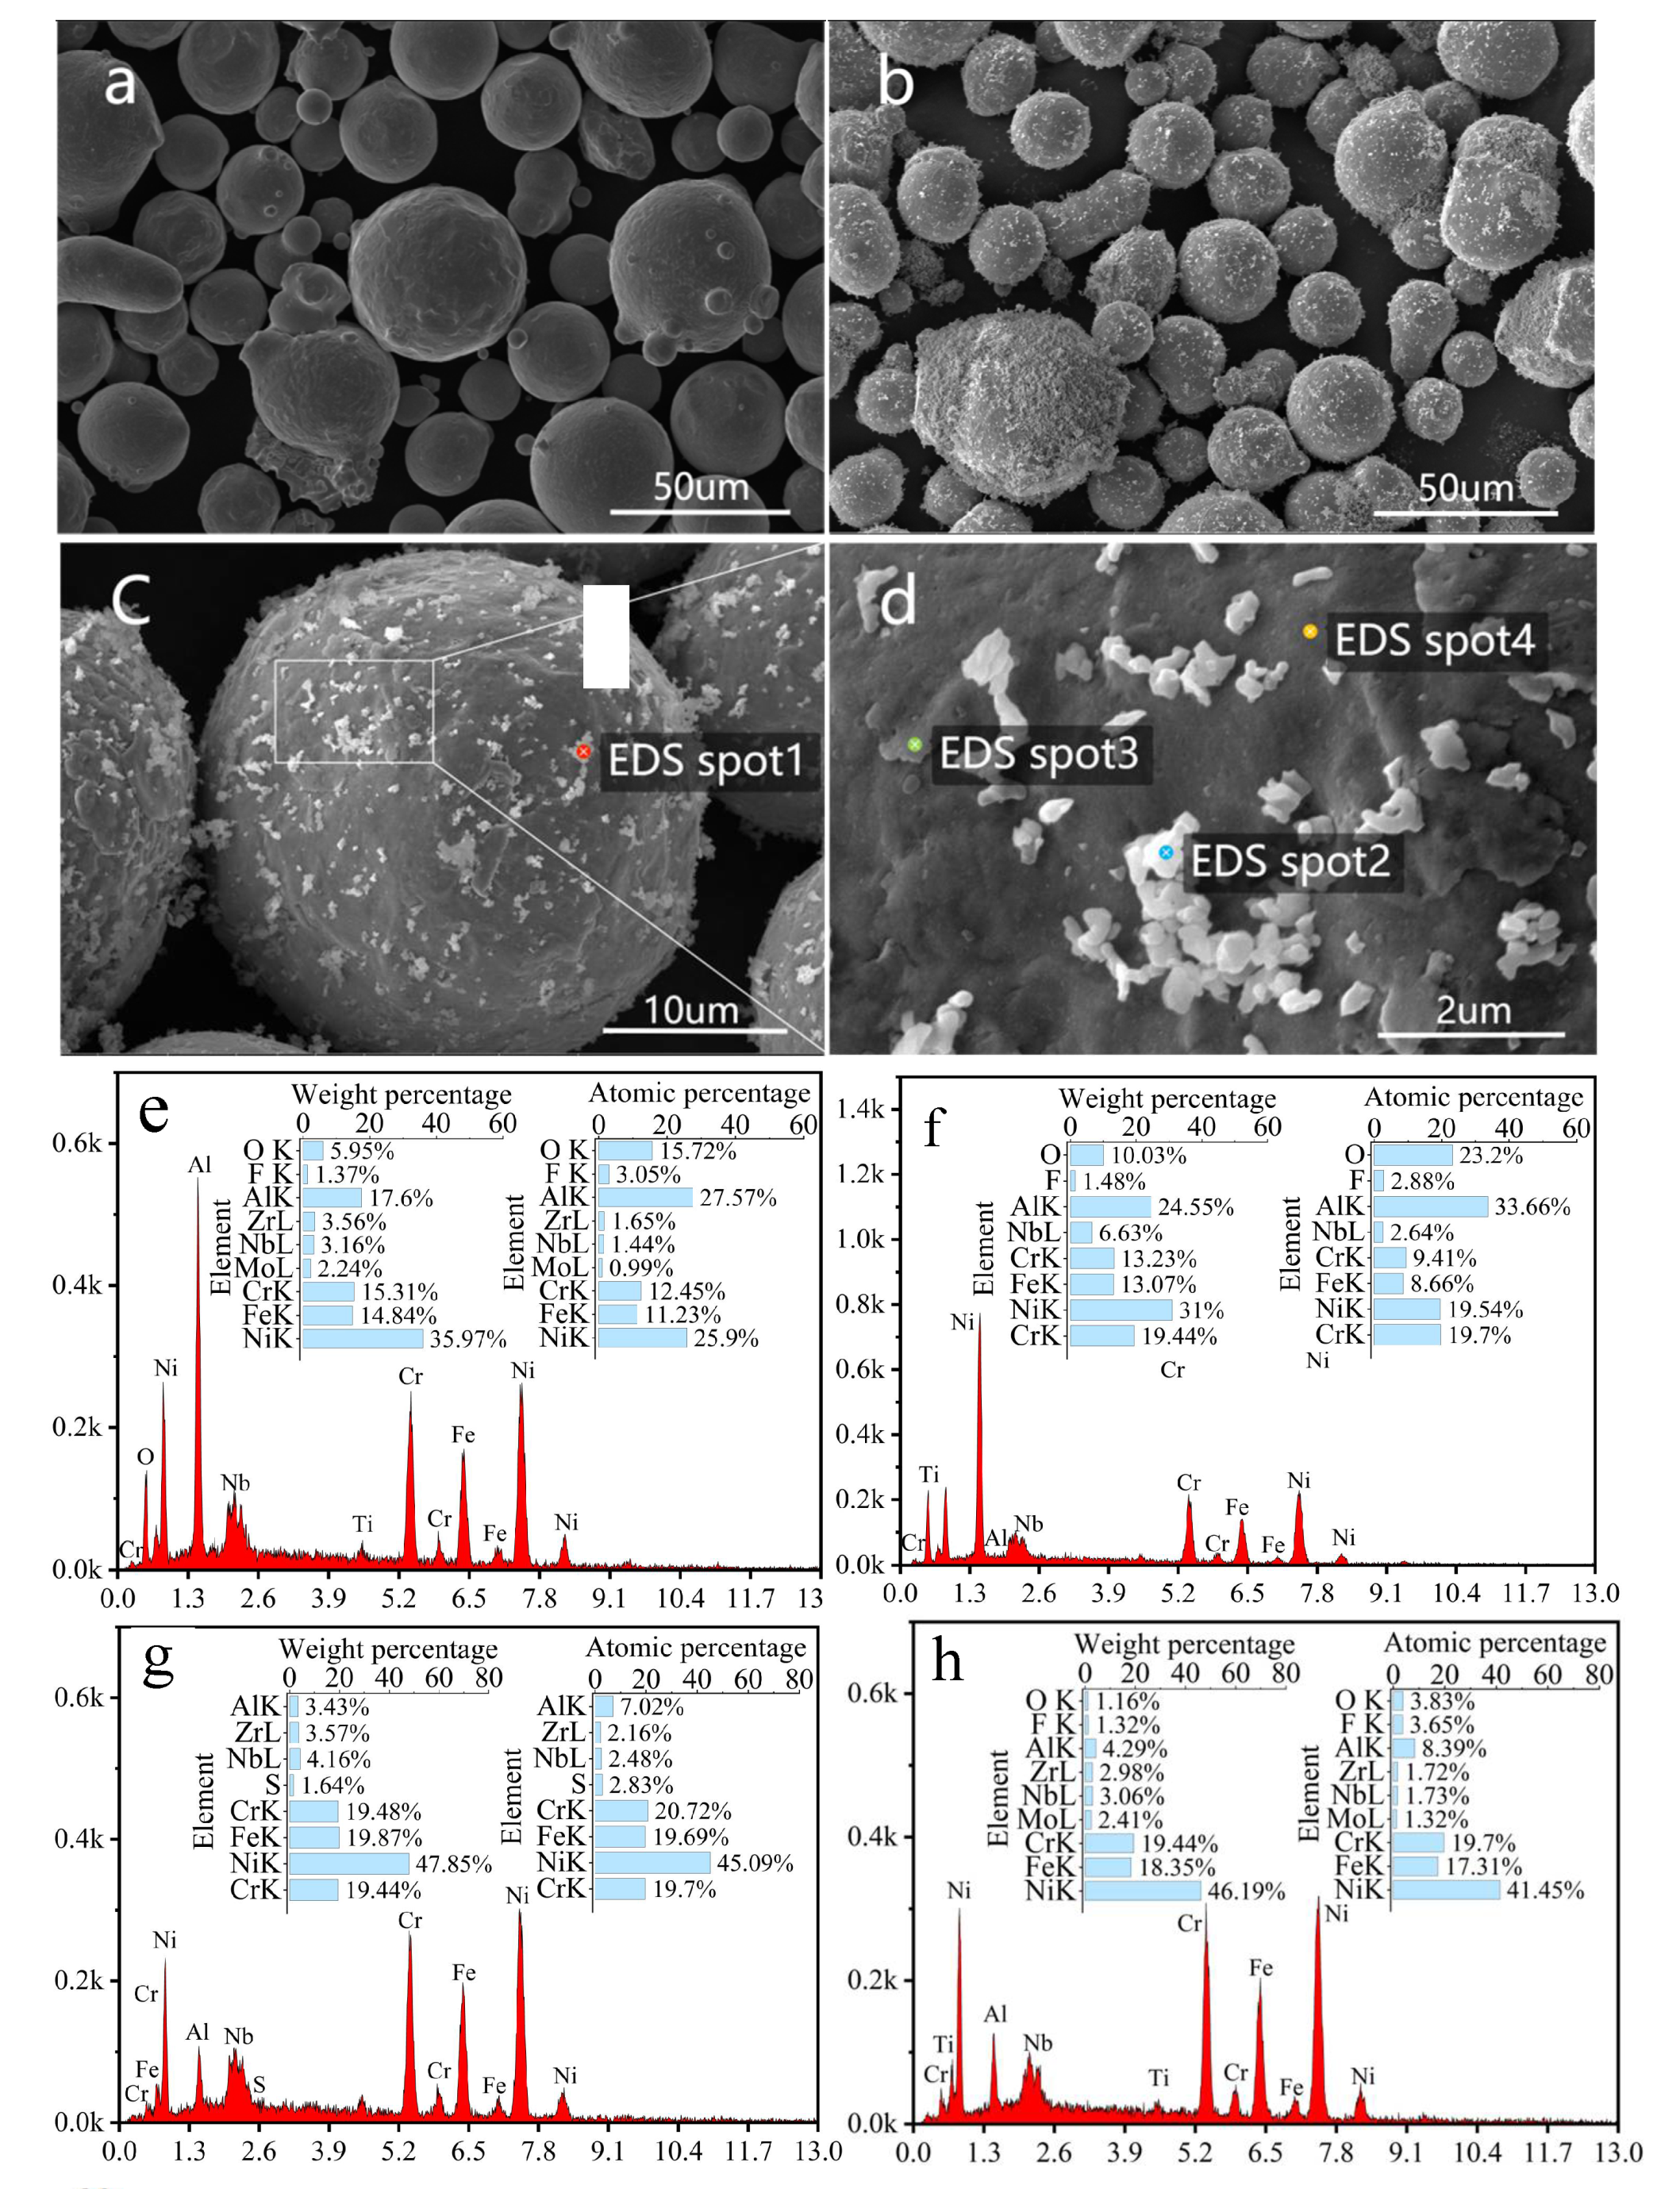
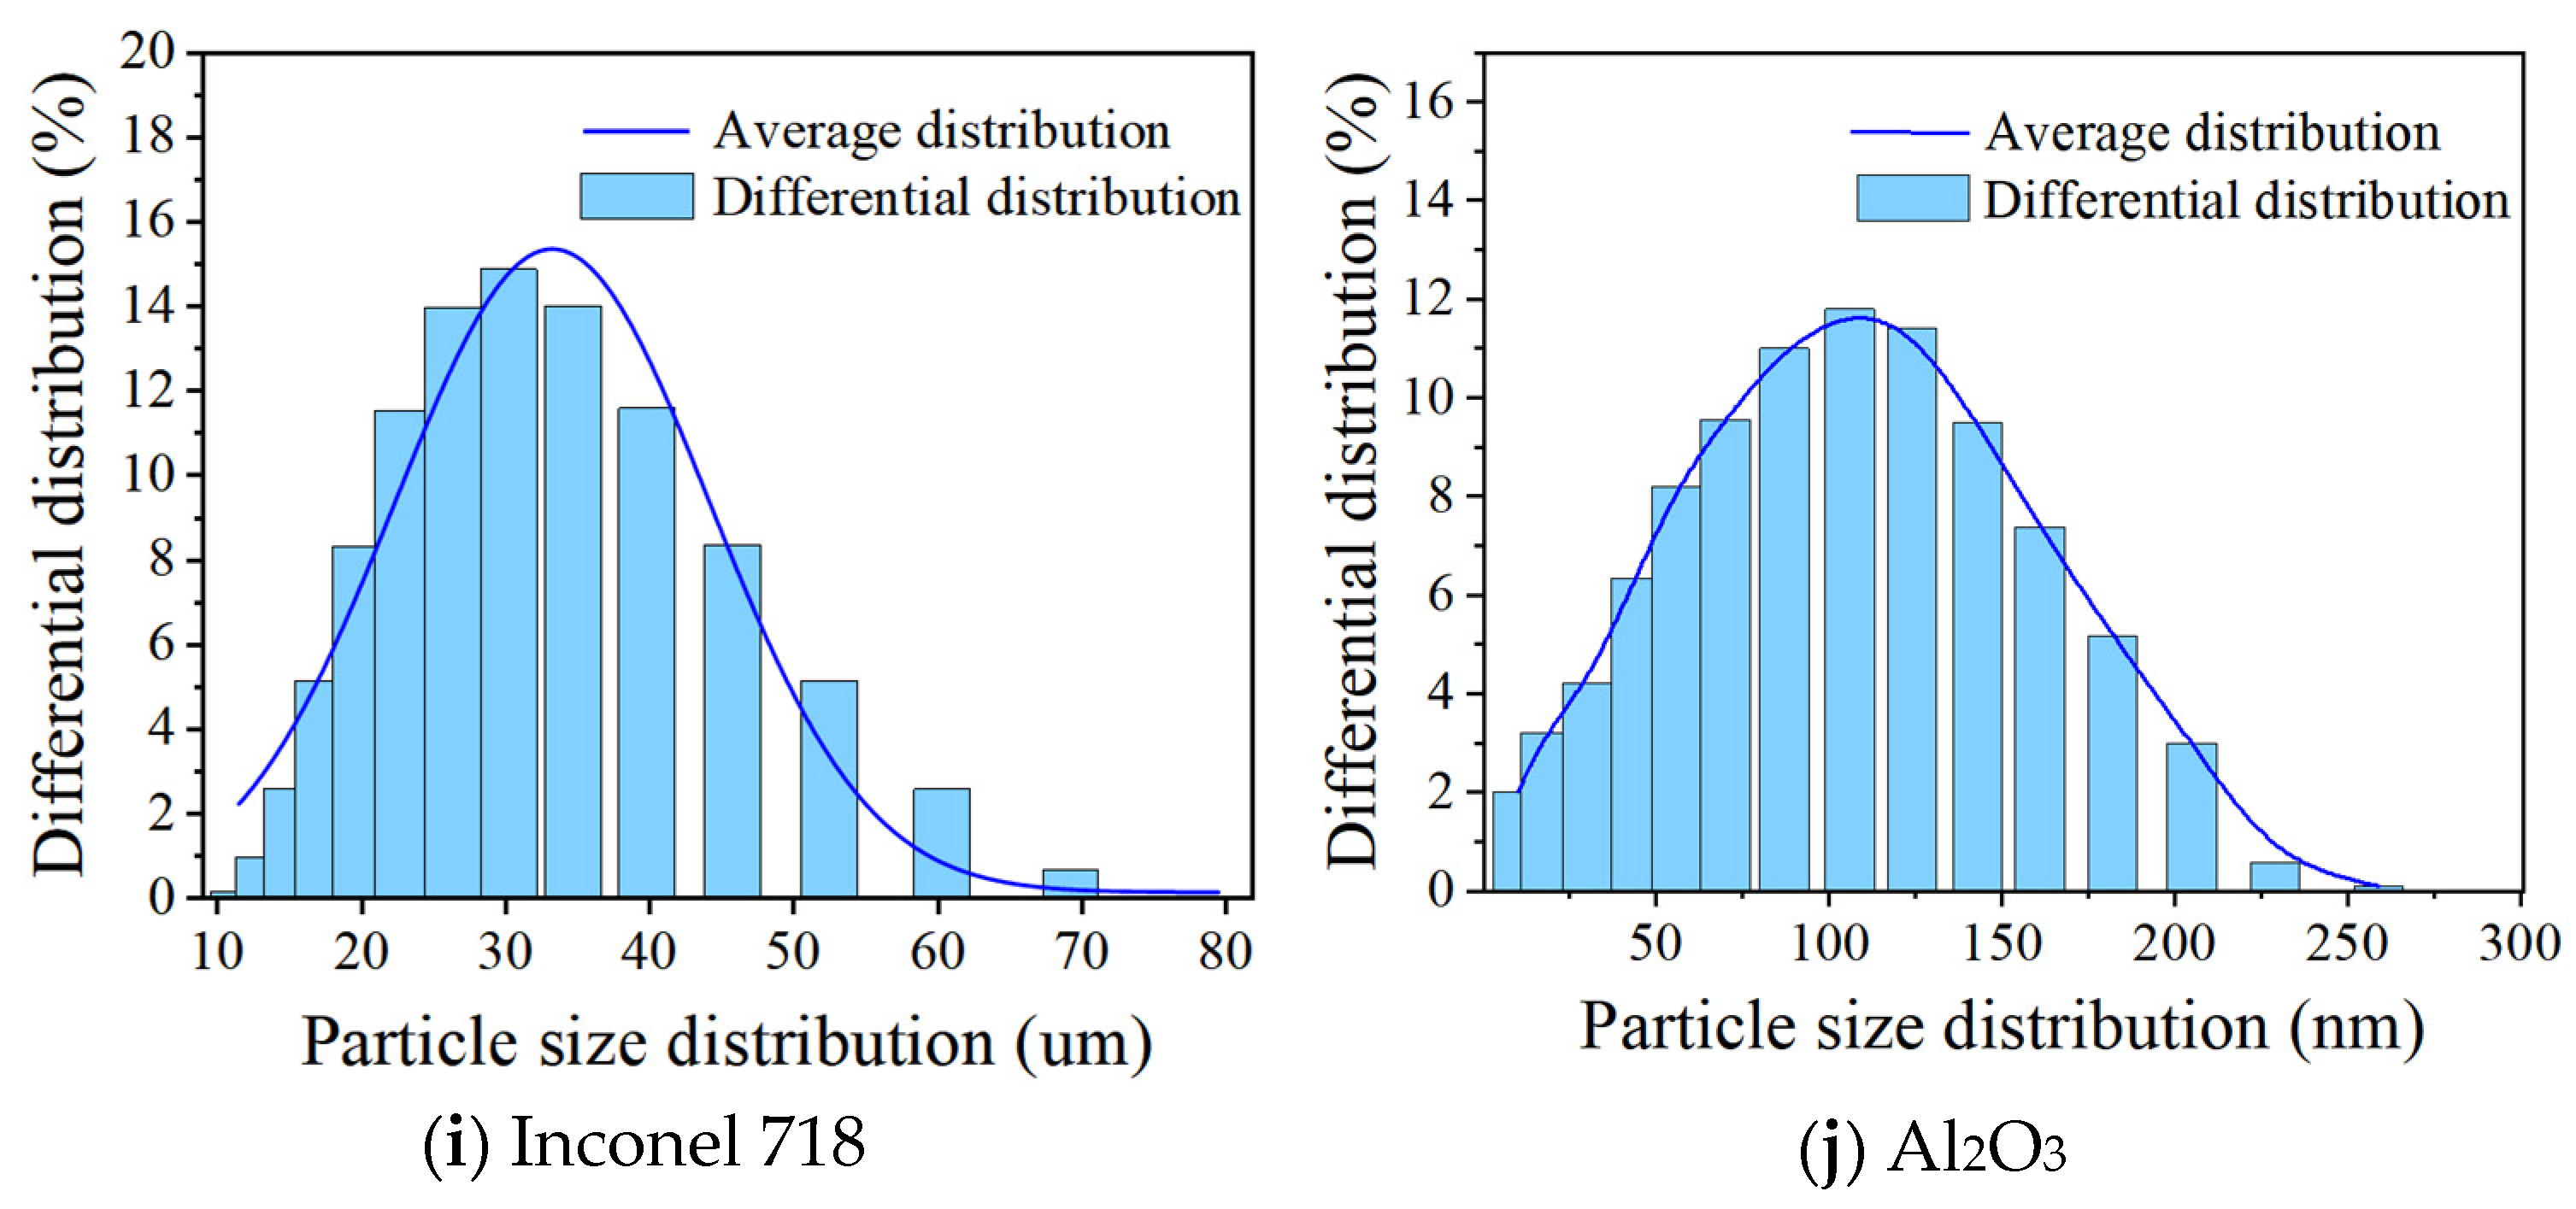
2.1. Materials
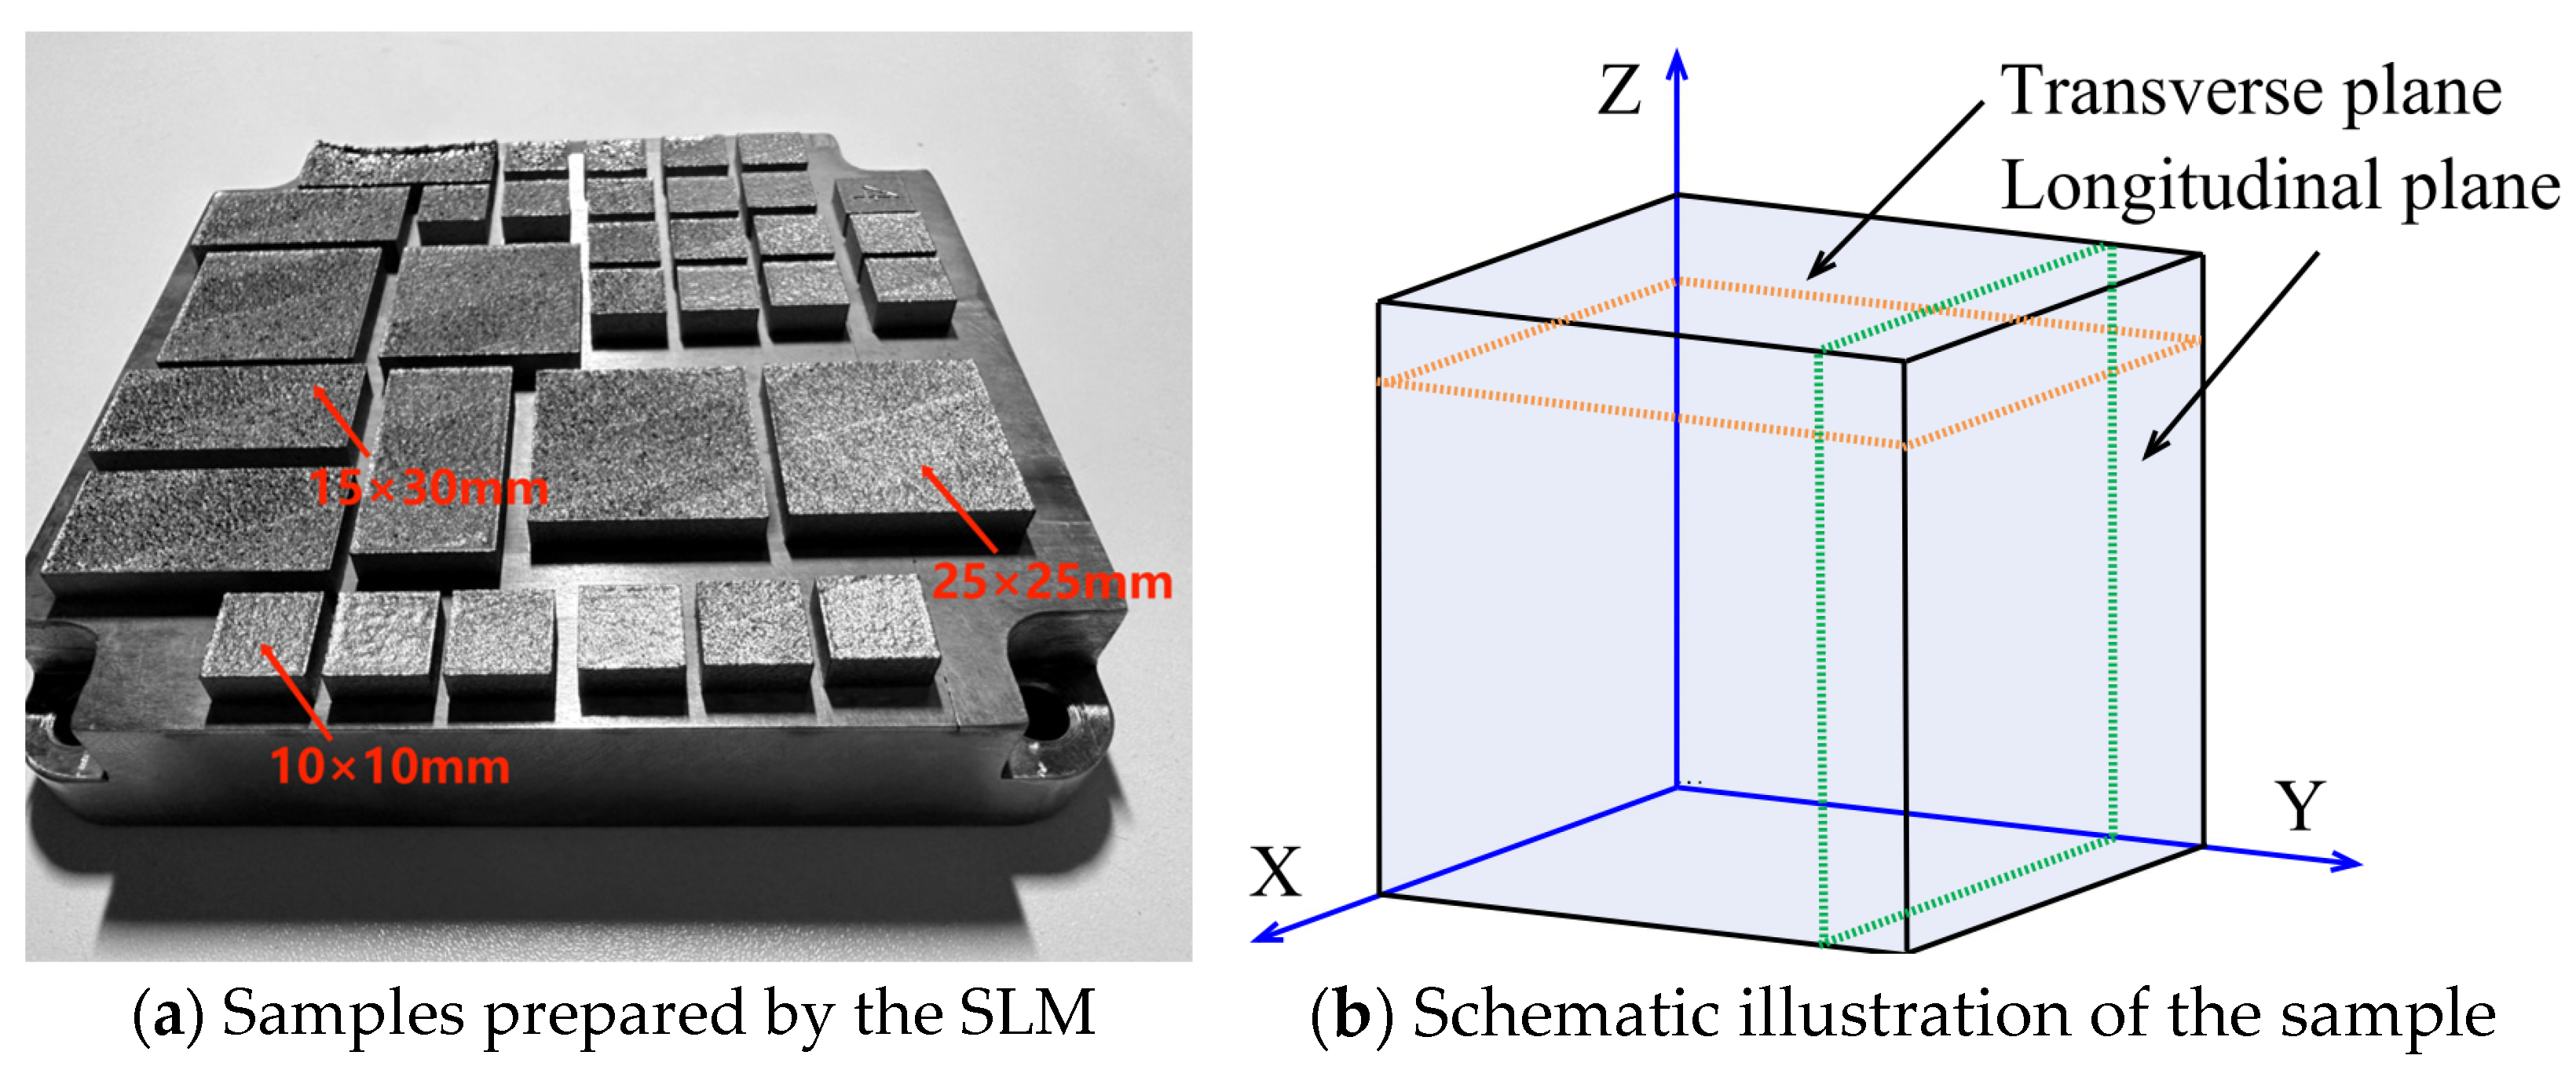
2.2. SLM Processing
2.3. Microstructure Characterization and Mechanical Properties Tests
2.4. Statistical Analyses
3. Results and Discussion
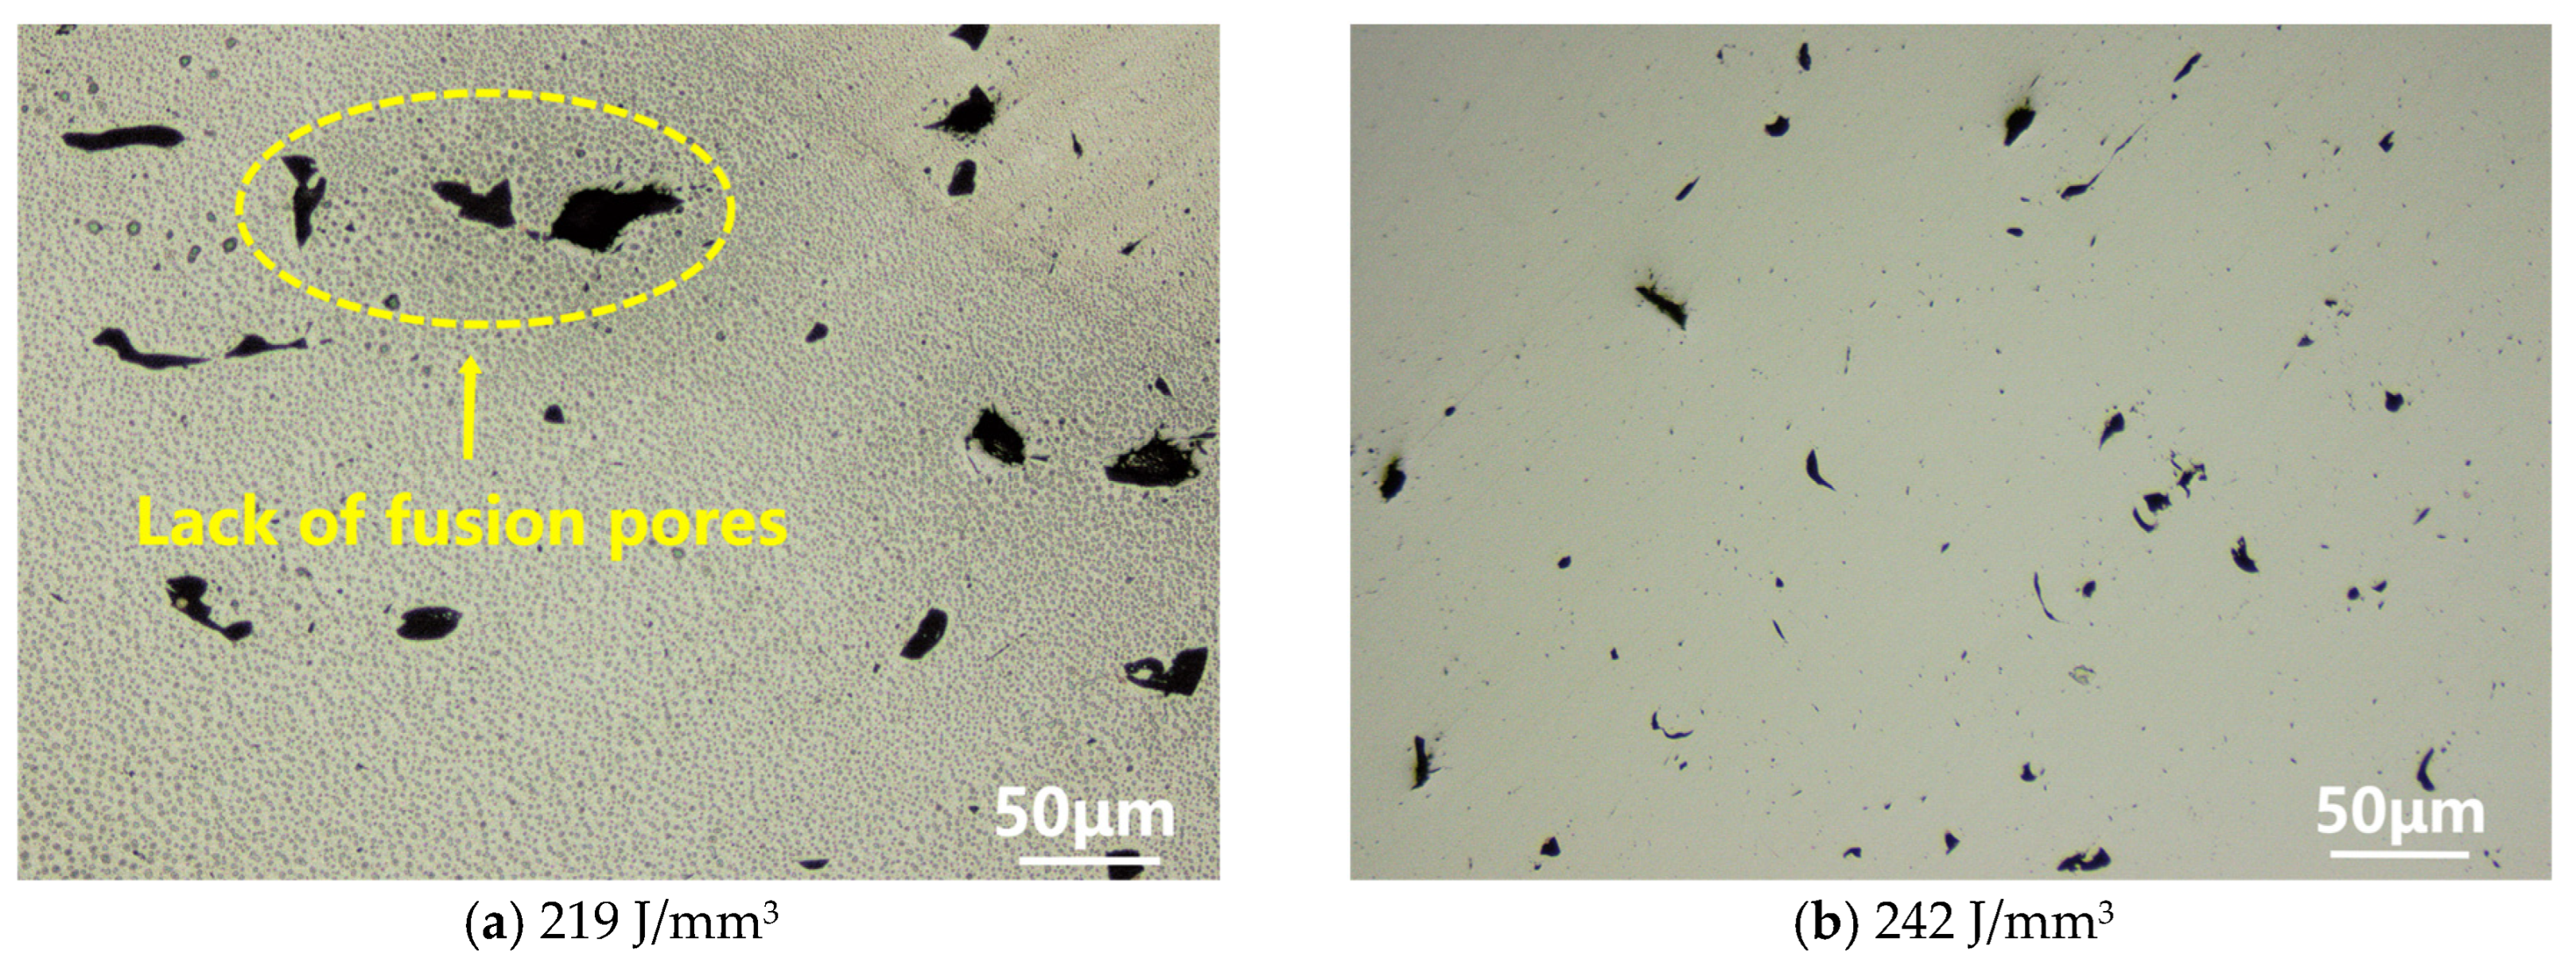
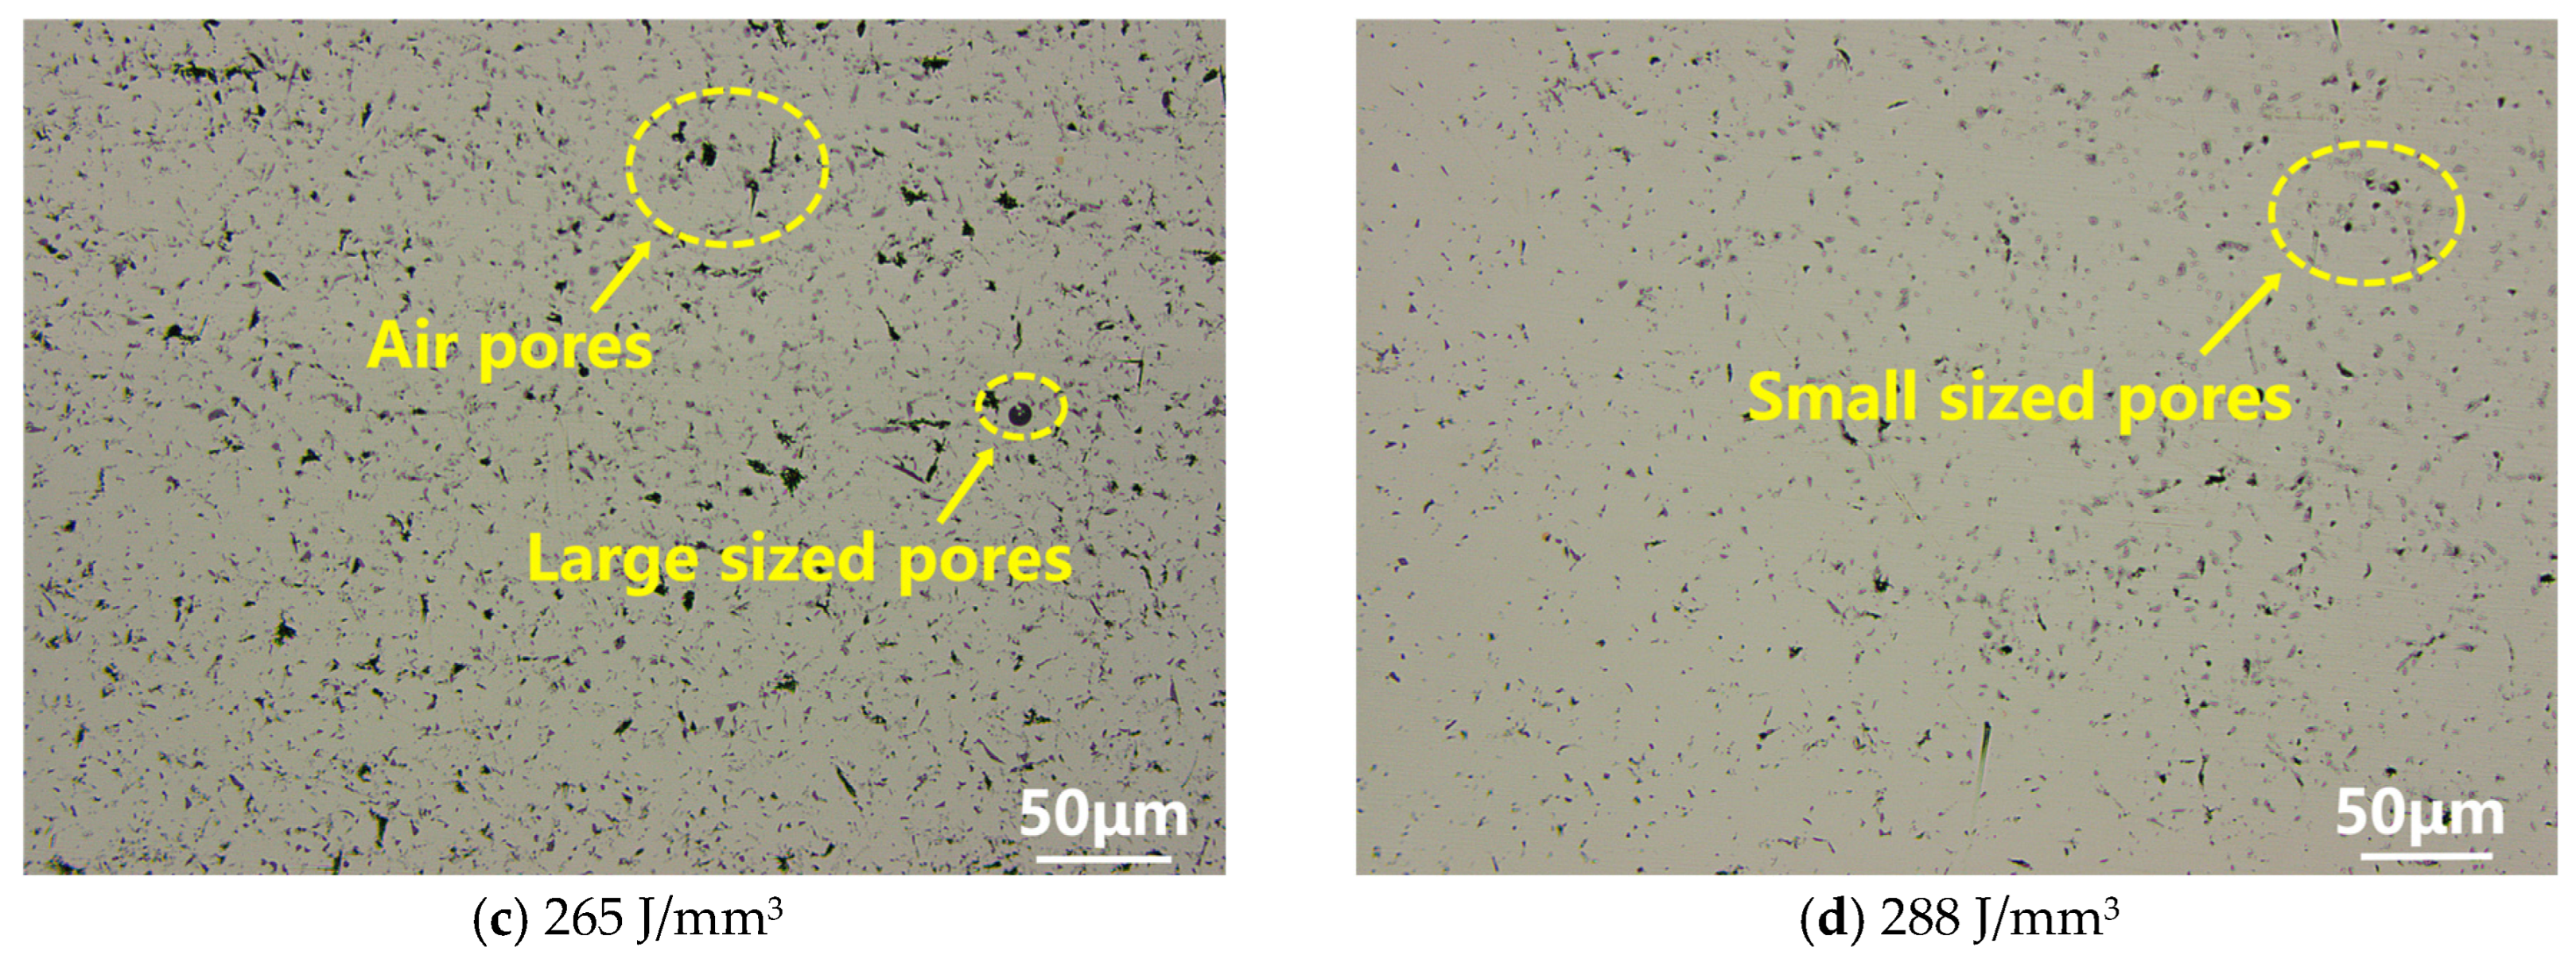
3.1. Effects of Laser Energy Density on the Sample Compactness
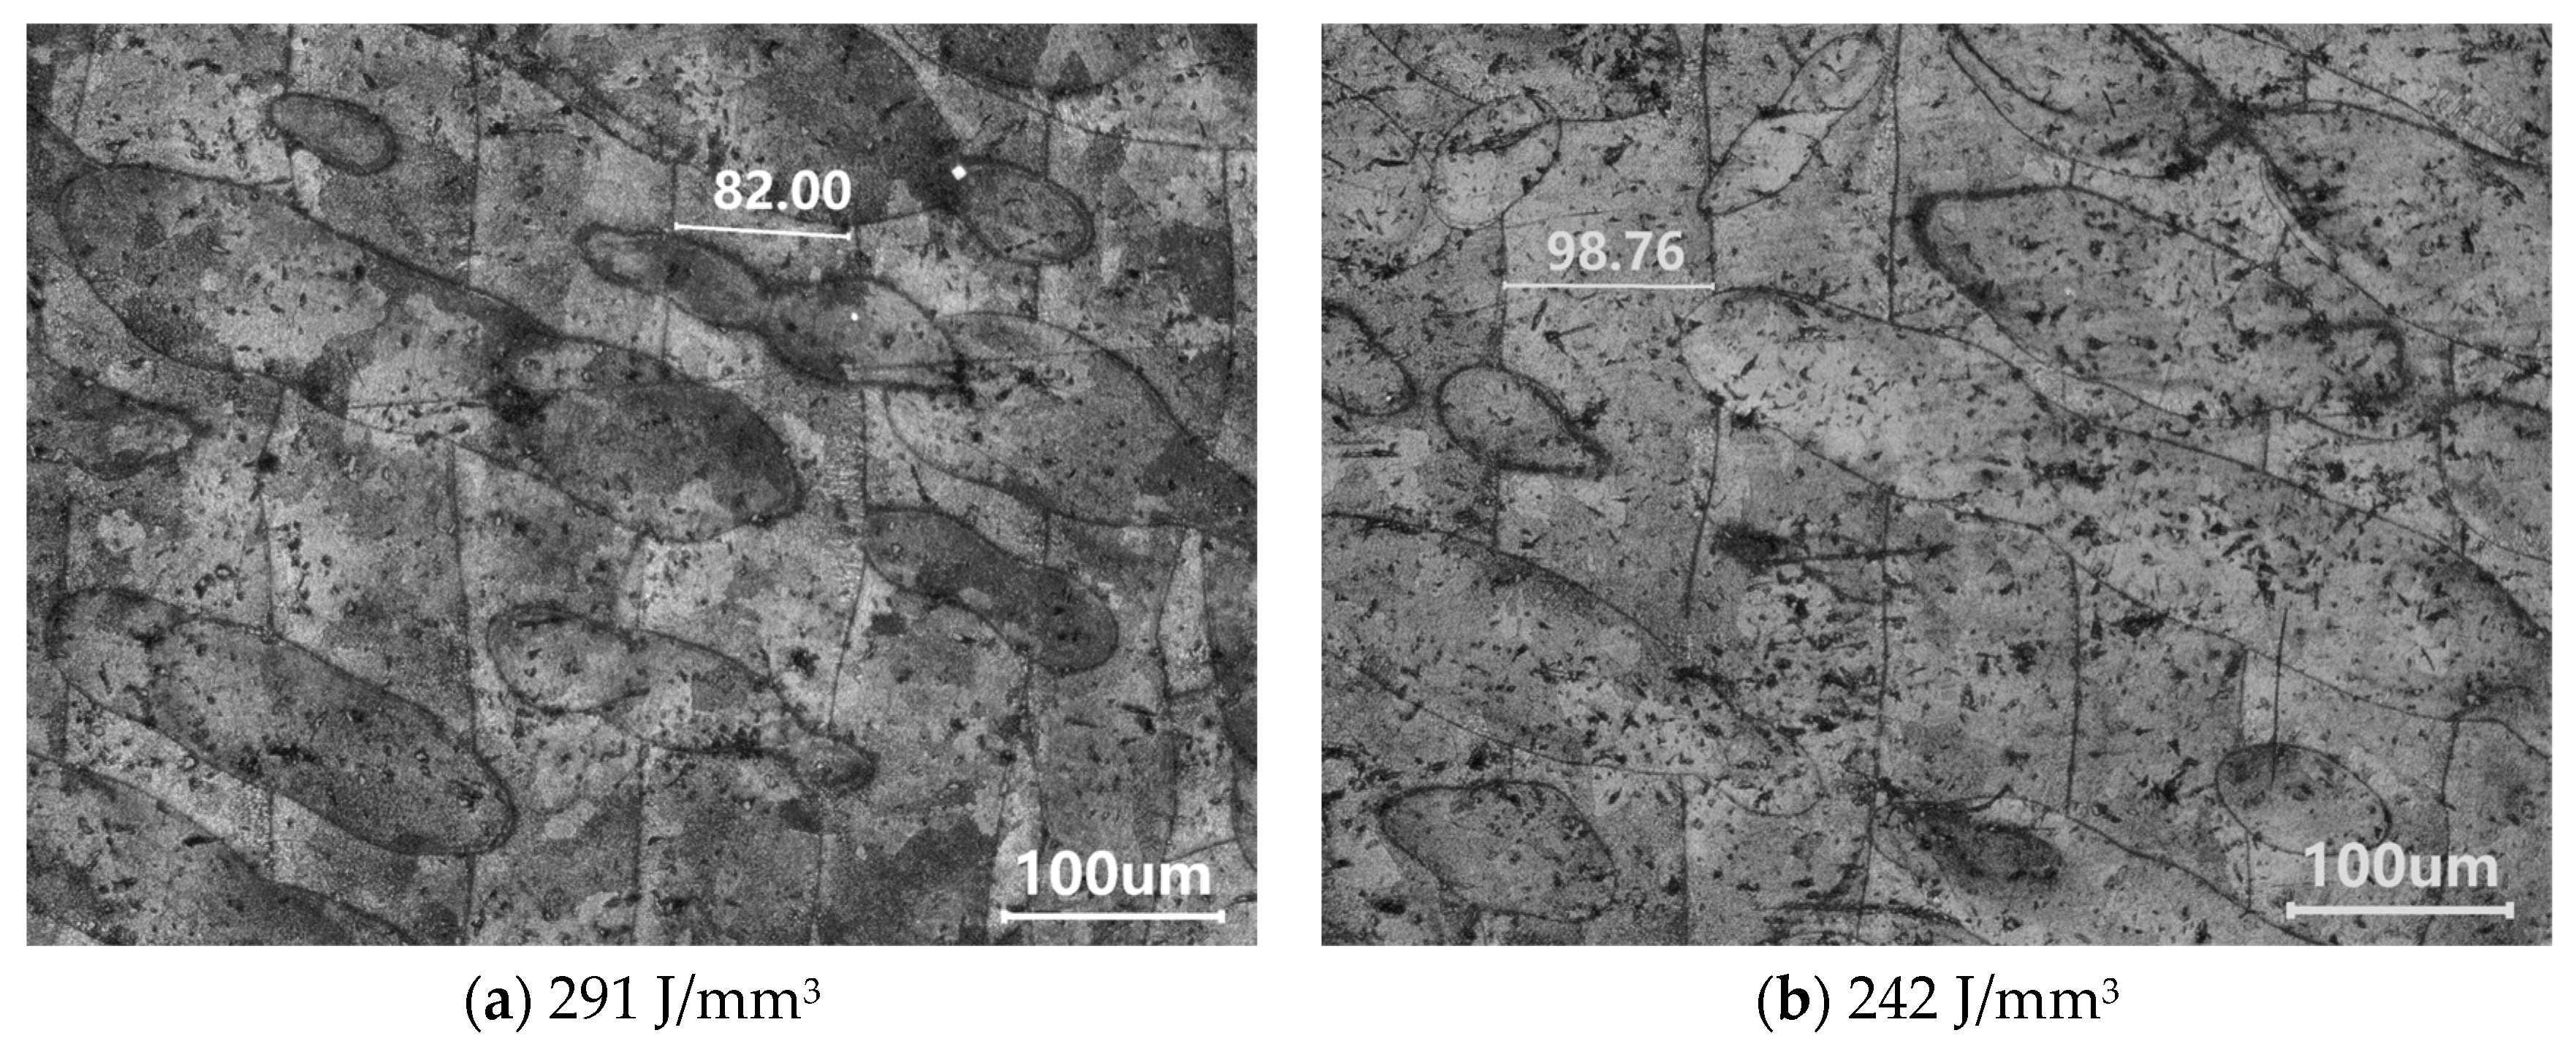
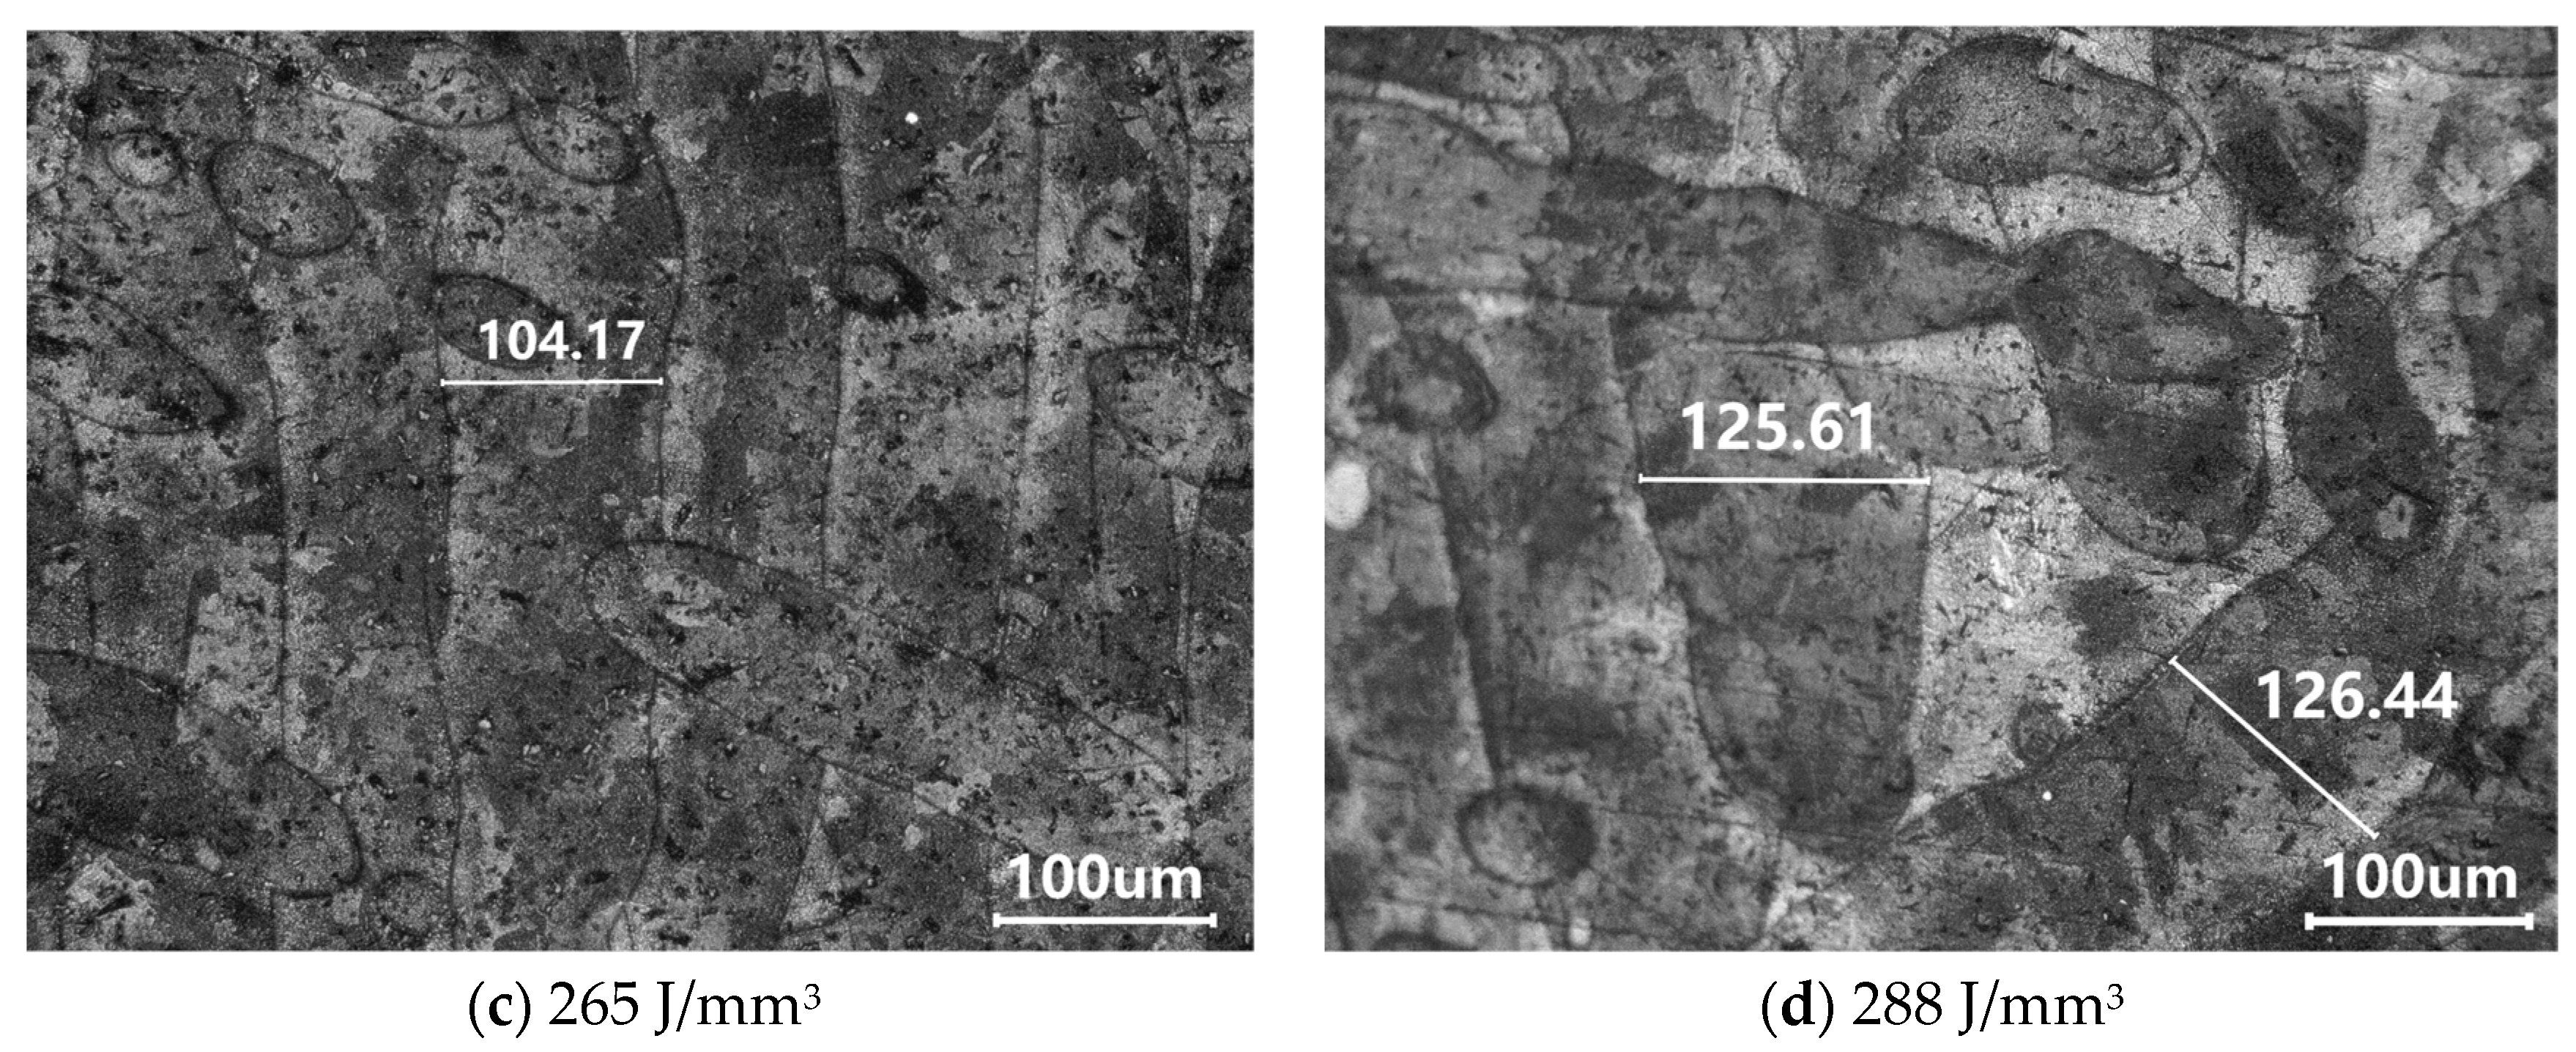
3.2. Effect of Laser Energy Density on the Microstructure of Sample
3.3. Influence of Laser Energy Density on Hardness and Wear Performance of Sample Parts
4. Conclusions
- (1)
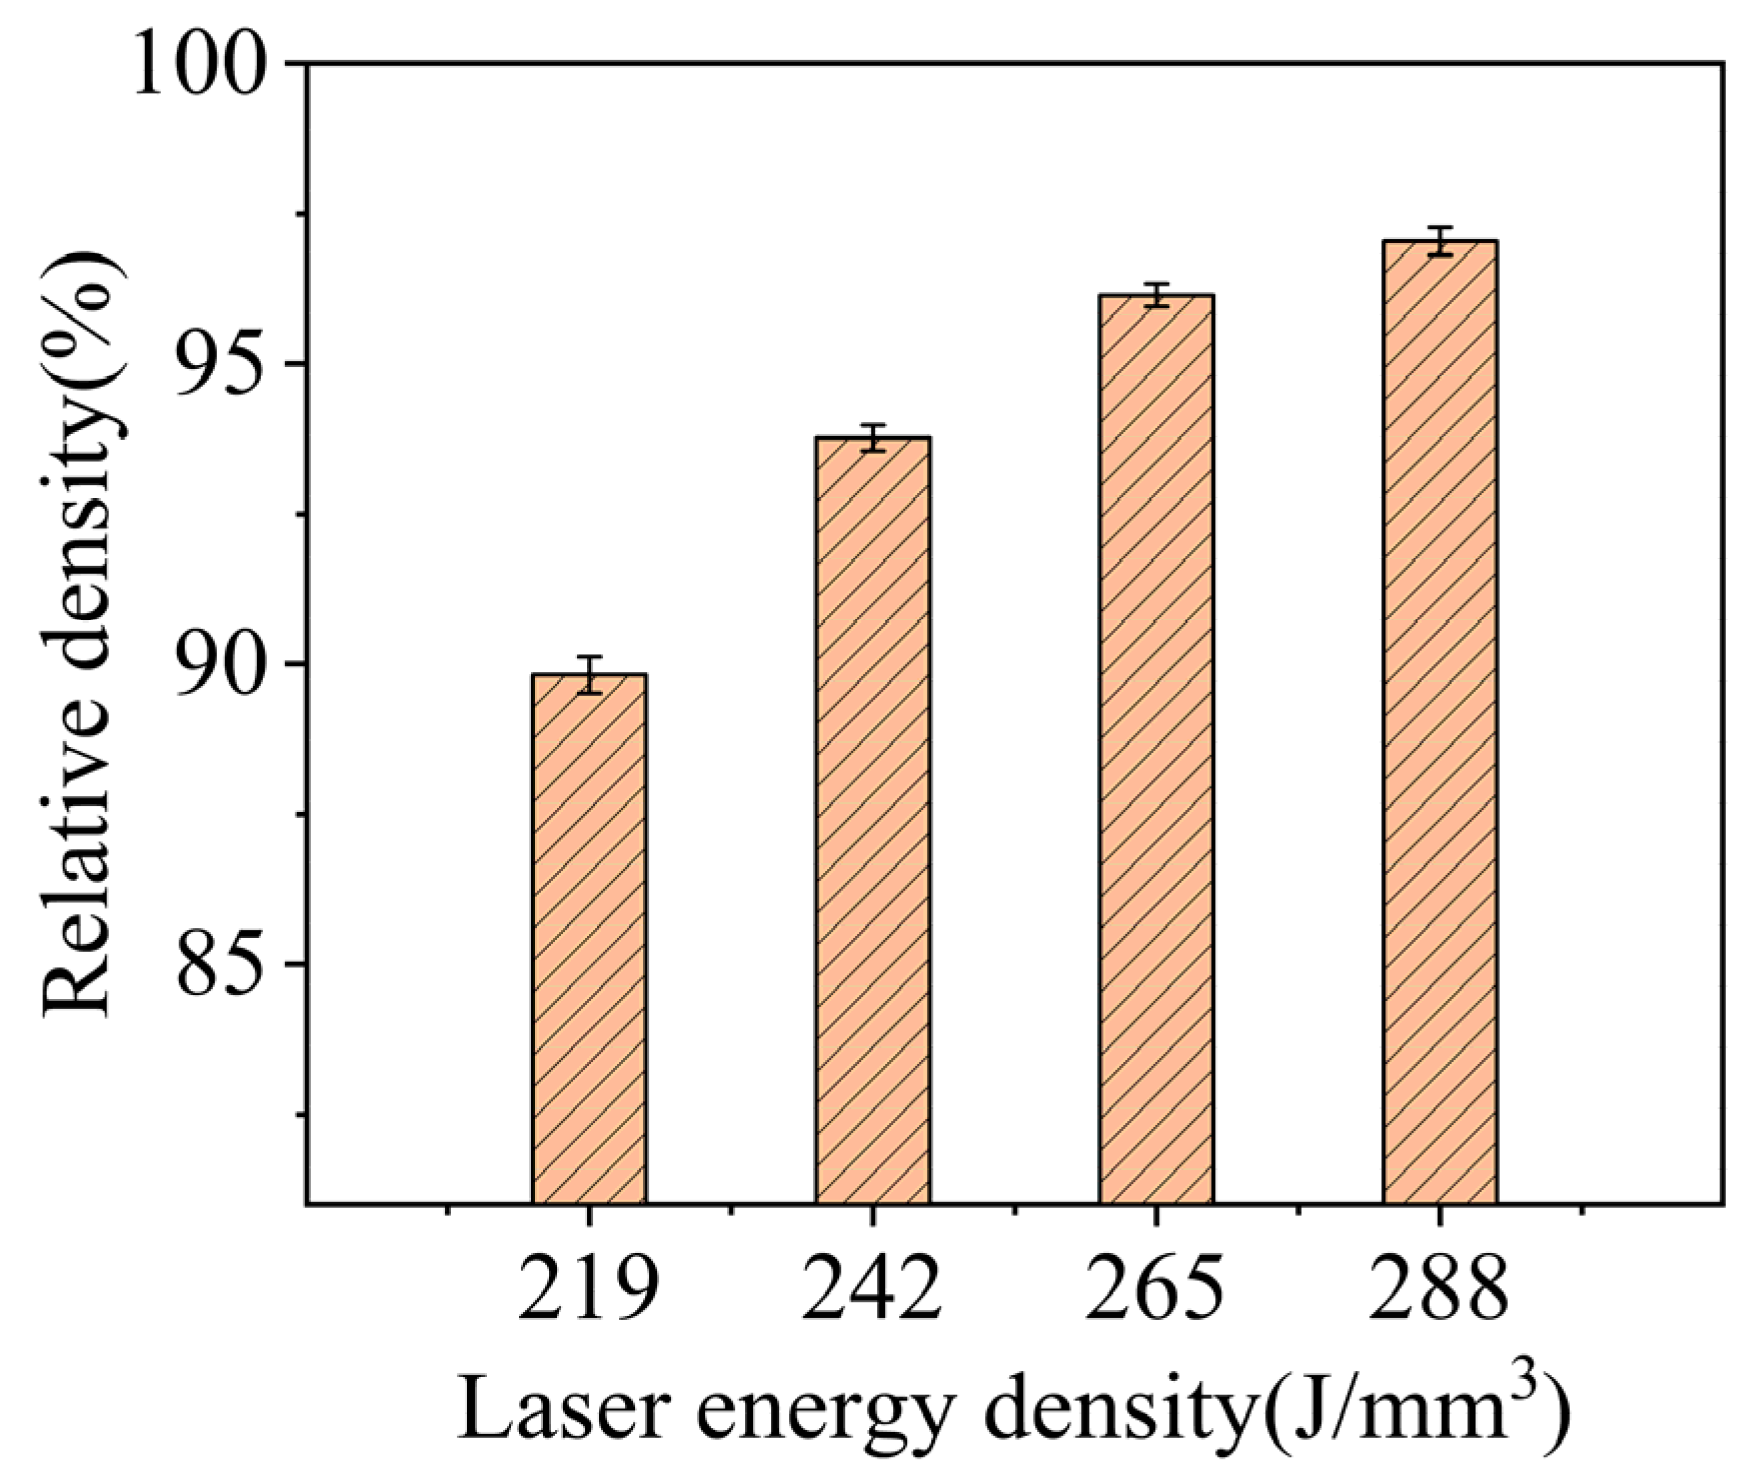
- Laser energy density has a great effect on the compactness of Al2O3/Inconel 718 nanocomposites processed by SLM. When E increases from 219 J/mm3 to 288 J/mm3, the relative density increases from 89.82% to 97.04%.
- (2)
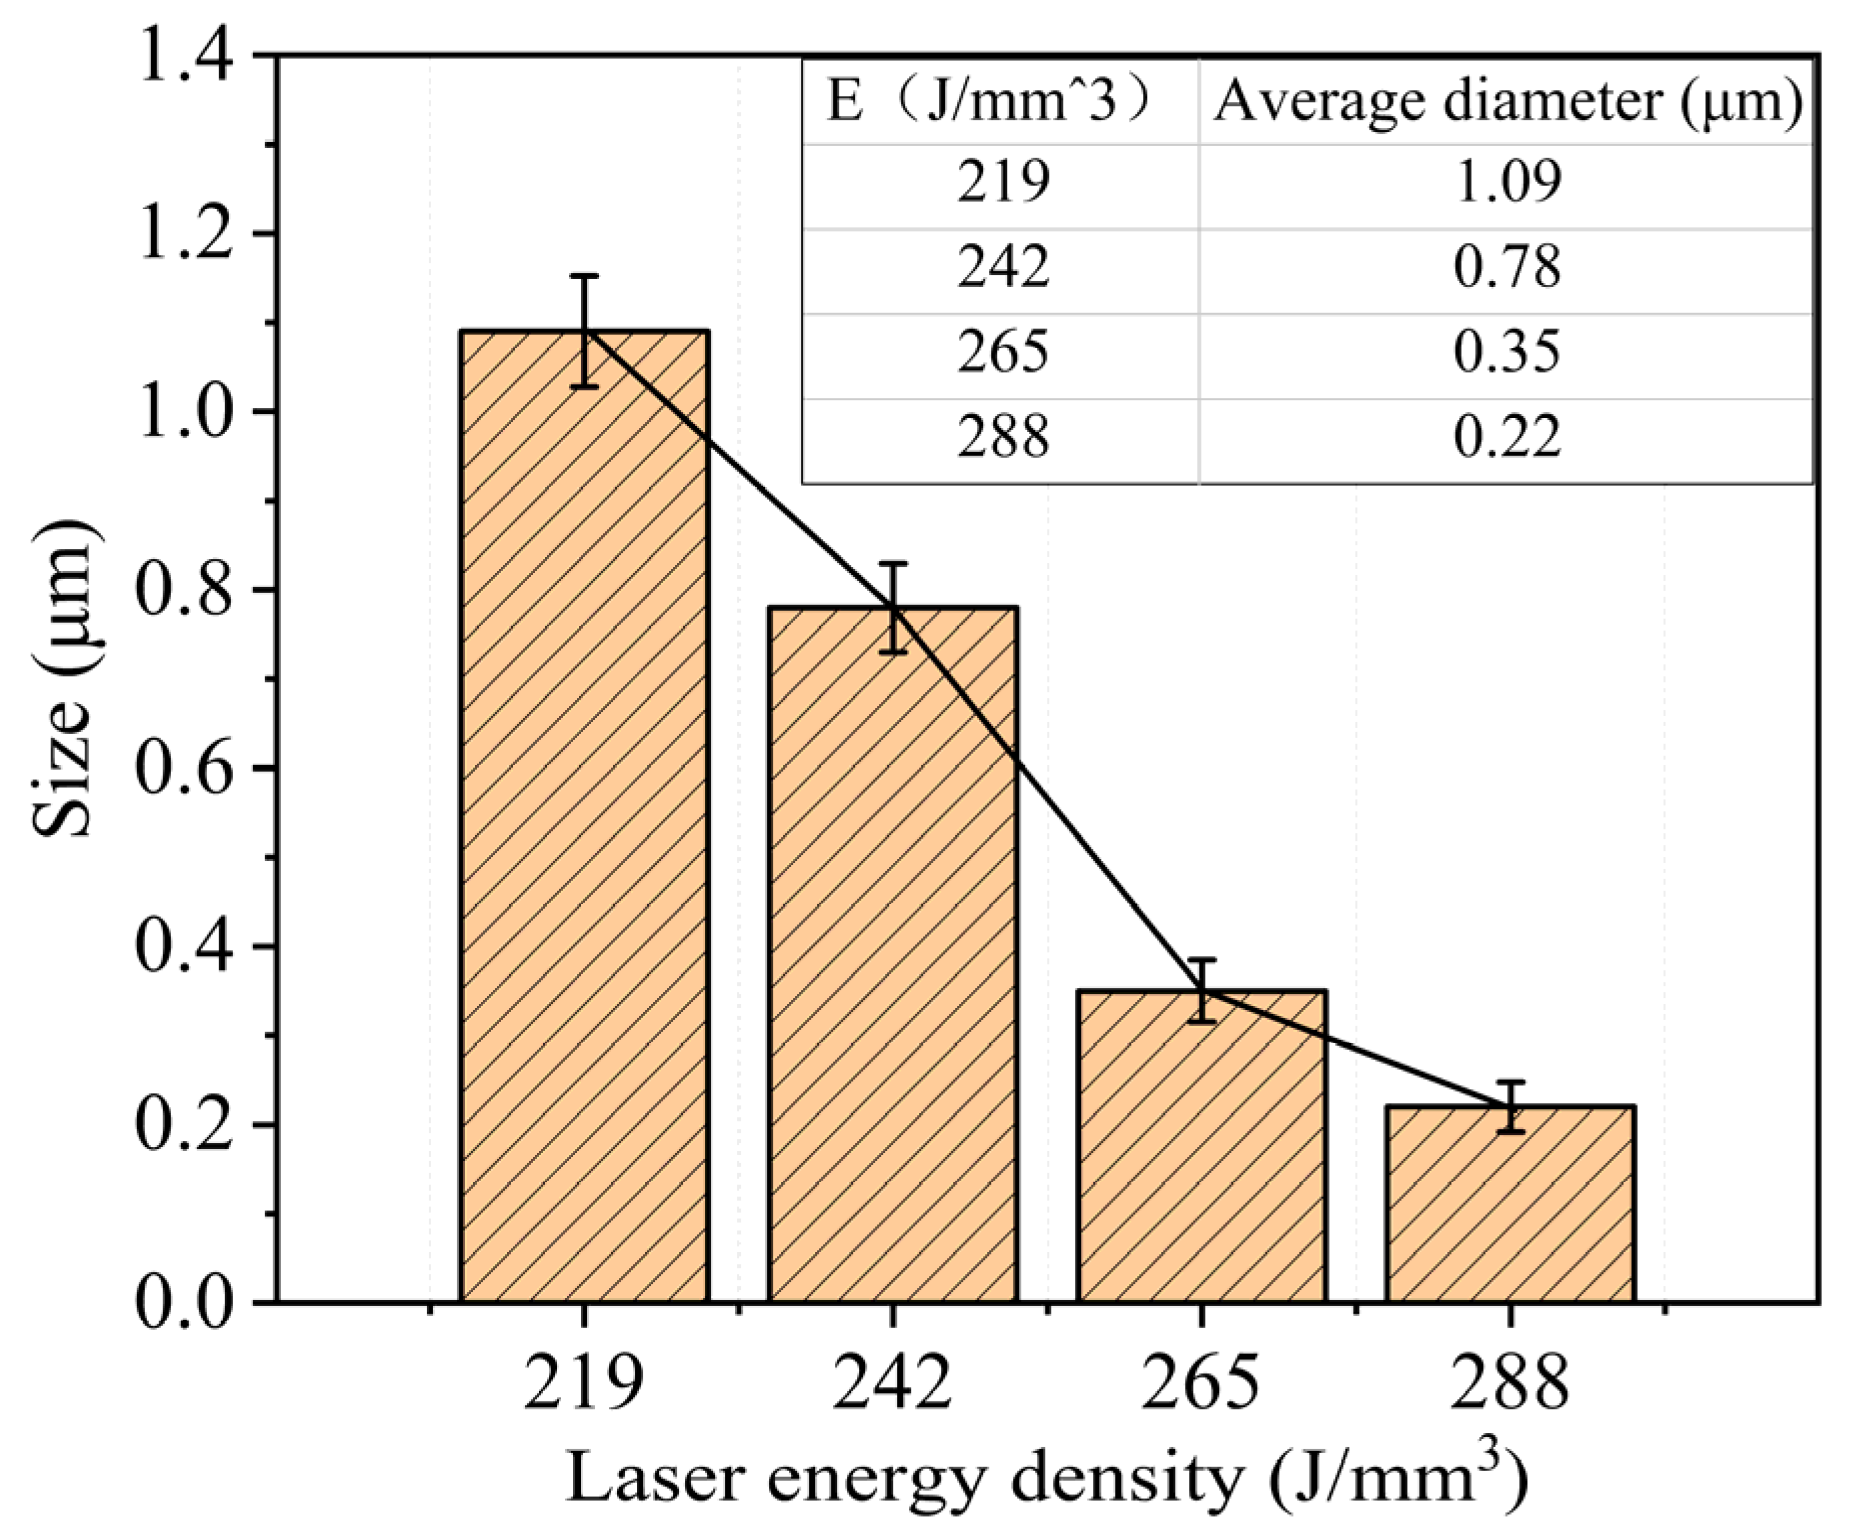
- With the increase in laser energy density, the overall size of the molten pool increases. With the input of high thermal energy, the particle size of the enhanced phase decreases with the increase in E, and it is diffusely distributed in the matrix when E is 288 J/mm3. The average grain diameter of the columnar grains decreased from 1.09 μm to 0.22 μm.
- (3)
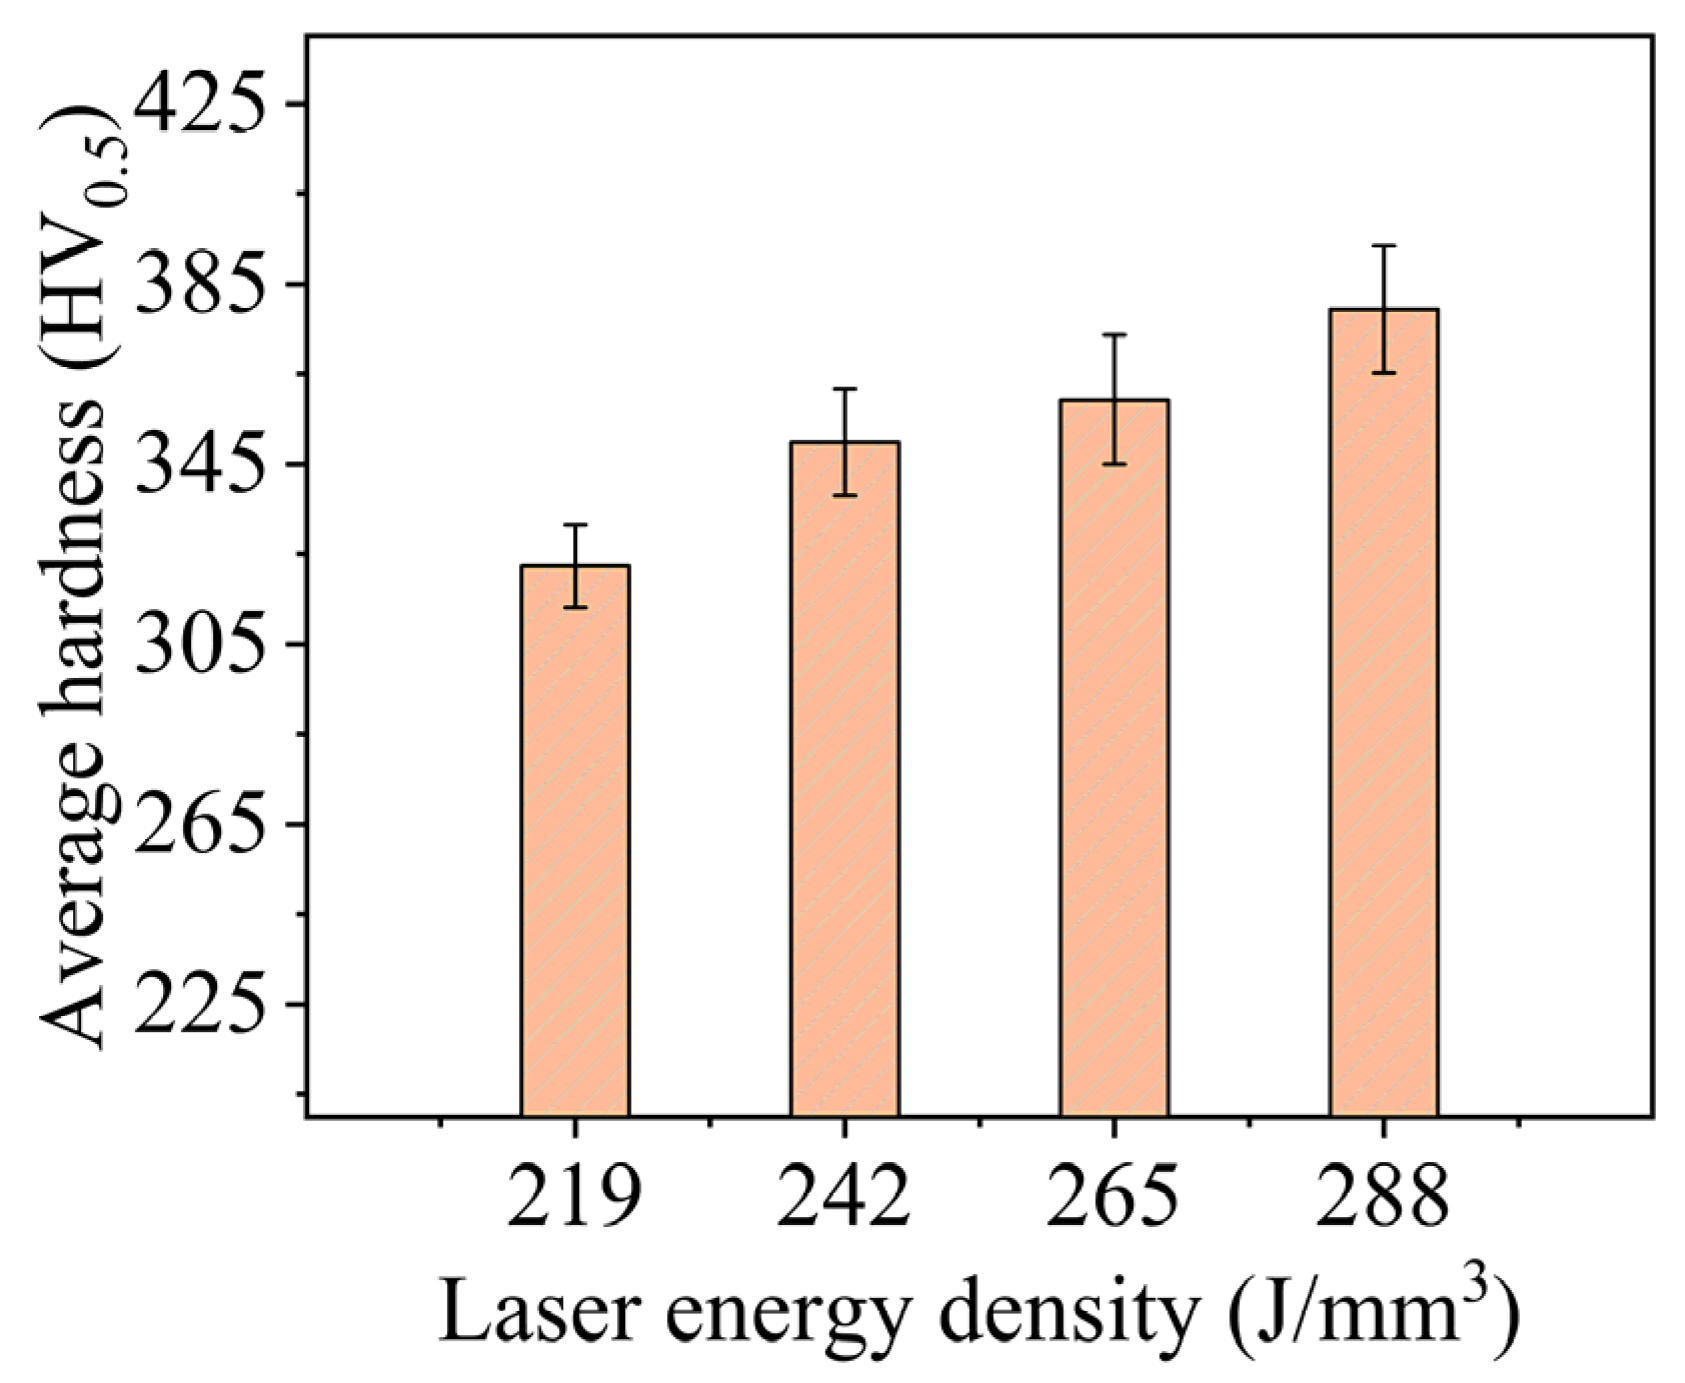
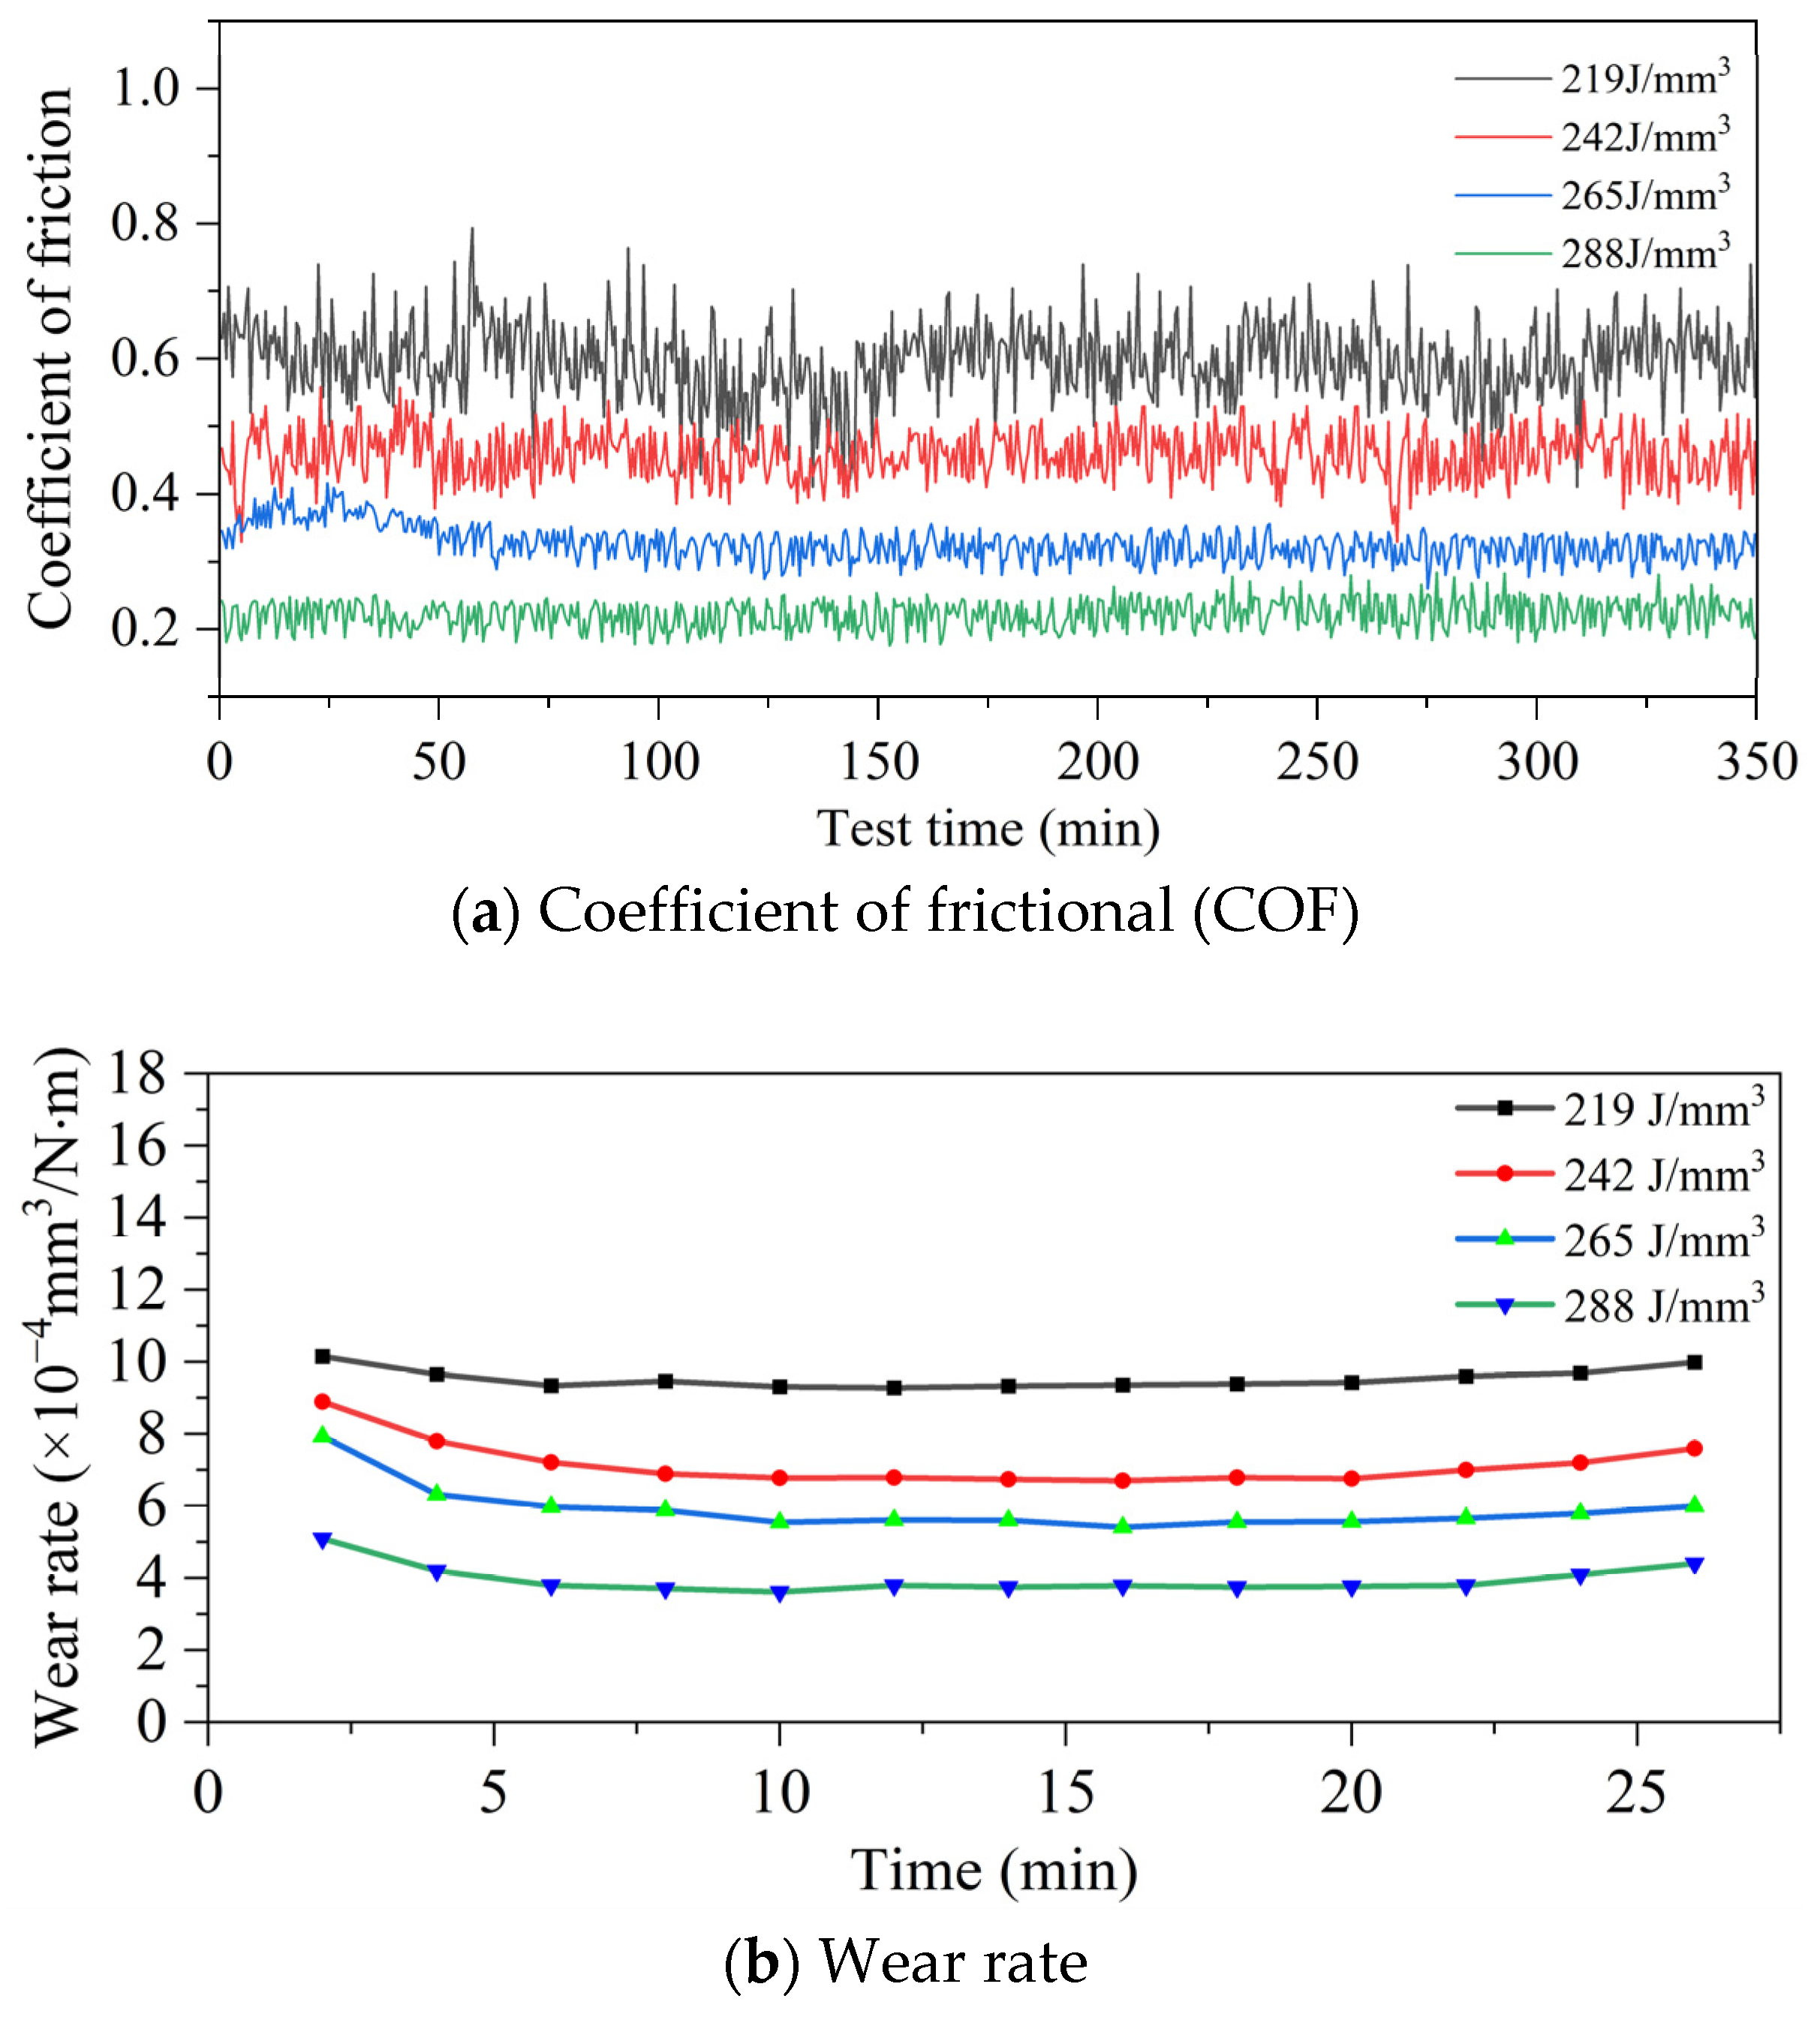
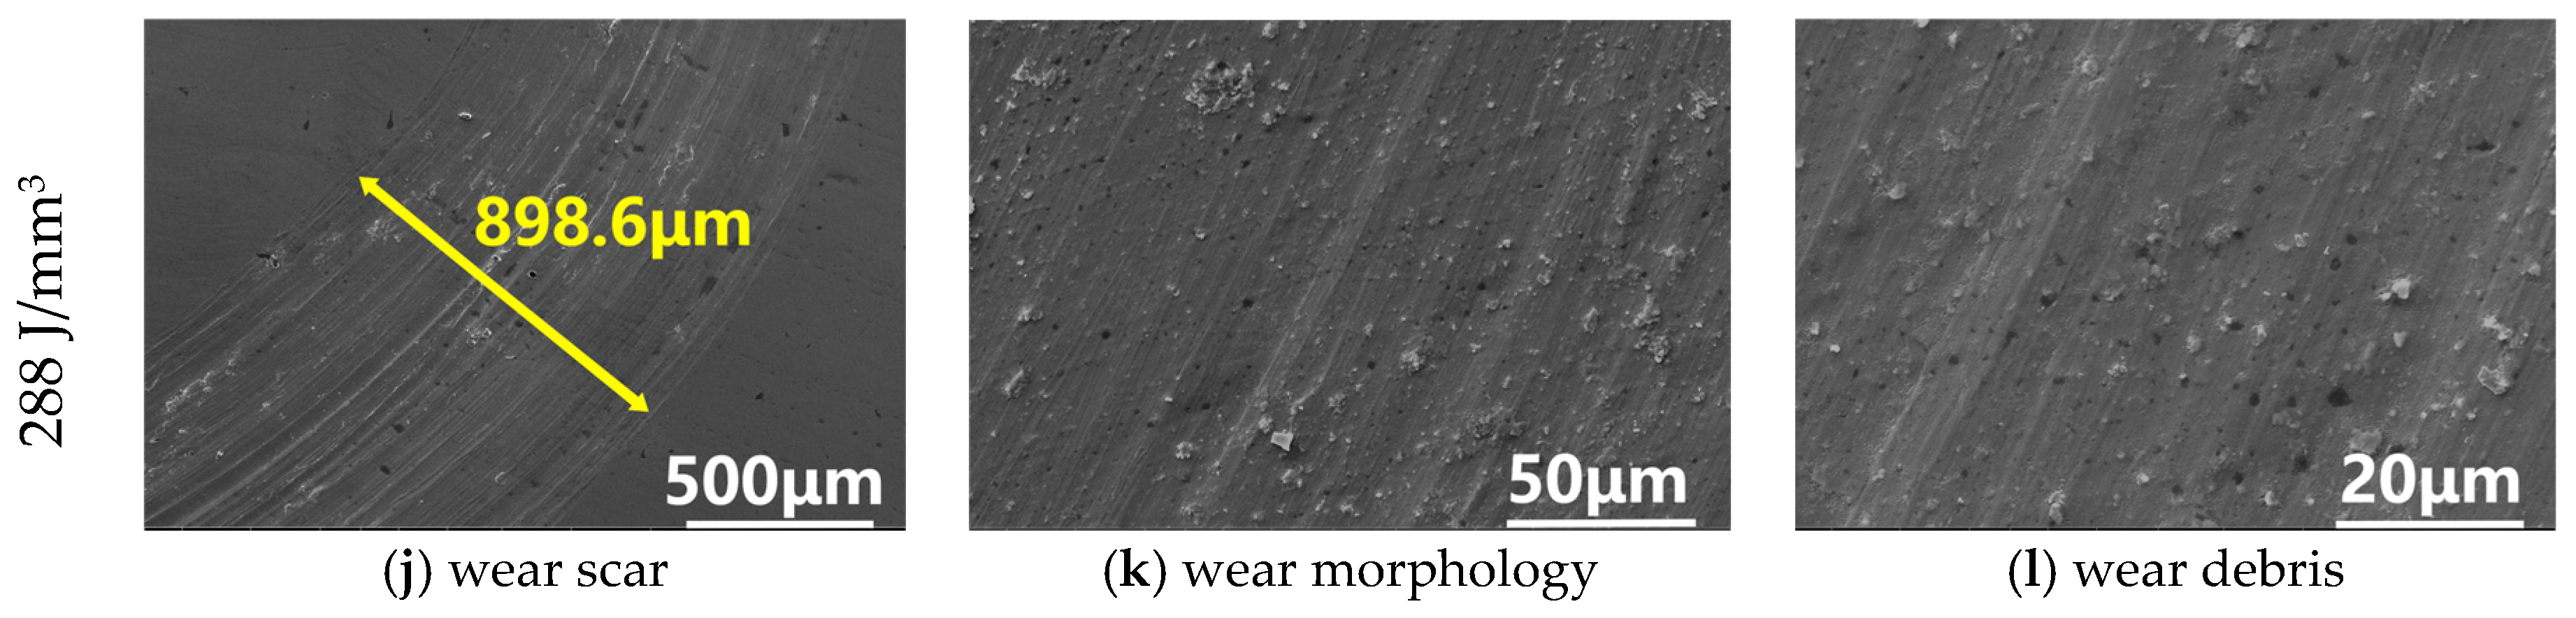
- The laser energy density affects the hardness and wear properties of Al2O3/Inconel 718 nanocomposites processed by SLM. When the laser energy density is high, the sample exhibits favorable hardness and wear resistance. The average microhardness of samples with 288 J/mm3 reaches 379.32 HV0.5 Compared with 219 J/mm3 sample, the increase is 15.01%. The average friction coefficient and wear rate decreased to 0.24 and 3.75 × 10⁻⁴ mm3/N·m, respectively. Notably, compared with the samples with E of 219 J/mm3, these values reduced significantly by 60.65% and 60.15%, respectively.
Author Contributions
Funding
Institutional Review Board Statement
Informed Consent Statement
Data Availability Statement
Conflicts of Interest
References
- Zhao, L.; Liu, S.R.; Jiang, L.; Yang, L.X.; Zhu, L.L.; Wang, H.; Zhang, W.Y.; Huang, Z.W.; Deng, Y.B.; Broeckmann, C. A high-throughput strategy for rapid synthesis and characterization of Ni-based superalloys. Rare Met. 2022, 41, 2693–2700. [Google Scholar] [CrossRef]
- Rodenkirchen, C.; Ackerman, A.K.; Mignanelli, P.M.; Cliff, A.; Wise, G.J.; Breul, P.; Douglas, J.O.; Bagot, P.A.J.; Moody, M.P.; Appleton, M. Effect of Alloying on the Microstructure, Phase Stability, Hardness, and Partitioning Behavior of a New Dual-Superlattice Nickel-Based Superalloy. Metall. Mater. Trans. A 2023, 54, 1902–1923. [Google Scholar] [CrossRef]
- Padmavathi, K.R.; Ramakrishnan, R.; Karthikeyan, L.; Tamizhselvan, S.; Babu, S.C. Comparison of the mechanical properties of micro/nano SiC/TiO2 reinforced aluminium metal matrix composites. Mater. Today Proc. 2023, 72, 1996–2001. [Google Scholar] [CrossRef]
- Lin, Z.; Su, Y.; Qiu, C.; Yang, J.; Chai, X.; Liu, X.; Ouyang, Q.; Zhang, D. Configuration effect and mechanical behavior of particle reinforced aluminum matrix composites. Scr. Mater. 2023, 224, 115–135. [Google Scholar] [CrossRef]
- Raghavendra, C.R.; Basavarajappa, S.; Sogalad, I. Multi-objective Optimization of Electrodeposition of Ni–Al2O3 Nano Composite Coating on Al6061 Substrate. Trans. Indian Inst. Met. 2018, 71, 2119–2132. [Google Scholar] [CrossRef]
- Irshad, H.M.; Hakeem, A.S.; Ahmed, B.A.; Ali, S.; Ali, S.; Ali, S.; Ehsan, M.A.; Laoui, T. Effect of Ni content and Al2O3 particle size on the thermal and mechanical properties of Al2O3/Ni composites prepared by spark plasma sintering. Int. J. Refract. Met. H. 2018, 76, 25–32. [Google Scholar] [CrossRef]
- Ma, Y.; Sun, J.; Xie, X.; Hu, Y.; Yan, P. An investigation on finegrain formation and structural character in cast IN718 superalloy. J Mater Process Technol. 2003, 137, 5–39. [Google Scholar] [CrossRef]
- Rui–Song, J.; Wen–Hu, W.; Guo–Dong, S.; Zeng–Qiang, W. Experimental investigation on machinability of in situ formed TiB2 particles reinforced Al MMCs. J. Manuf. Process. 2016, 23, 249–257. [Google Scholar] [CrossRef]
- Akbari, M.K.; Baharvandi, H.R.; Mirzaee, O. Fabrication of nano-sized Al2O3 reinforced casting aluminum composite focusing on preparation process of reinforcement powders and evaluation of its properties. Compos Part B Eng. 2013, 55, 426–432. [Google Scholar] [CrossRef]
- Hu, Q.; Zhao, H.; Li, F. Microstructures and properties of SiC particles reinforced aluminum-matrix composites fabricated by vacuum-assisted high pressure die casting. Mater. Sci. Eng. A 2017, 680, 270–277. [Google Scholar] [CrossRef]
- Fri, K.; Laazizi, A.; Bensada, M.; Alami, M.E.; Ouannou, A.; Akhrif, I.; Jai, M.E.; Fajoui, J. Microstructural and heat treatment analysis of 316L elaborated by SLM additive manufacturing process. Int. J. Adv. Manuf. Technol. 2023, 124, 2289–2297. [Google Scholar] [CrossRef]
- Liu, Z.; Zhao, D.; Wang, P.; Yan, M.; Yang, C.; Chen, Z.; Lu, J.; Lu, Z. Additive manufacturing of metals: Microstructure evolution and multistage control. J. Mater. Sci. Technol. 2022, 100, 224–236. [Google Scholar] [CrossRef]
- Takezawa, A.; Kobashi, M. Design methodology for porous composites with tunable thermal expansion produced by multi-material topology optimization and additive manufacturing. Compos Part B Eng. 2017, 131, 21–29. [Google Scholar] [CrossRef]
- Khorasani, A.M.; Gibson, I.; Awan, U.S.; Ghaderi, A. The effect of SLM process parameters on density, hardness, tensile strength and surface quality of Ti-6Al-4V. Elsevier 2019, 25, 176–186. [Google Scholar] [CrossRef]
- Yu, W.H.; Sing, S.L.; Chua, C.K.; Kuo, C.N.; Tian, X.L. Particle-reinforced metal matrix nanocomposites fabricated by selective laser melting: A state of the art review. Prog. Mater. Sci. 2019, 104, 330–379. [Google Scholar] [CrossRef]
- Han, Q.; Gu, Y.; Huang, J.; Wang, L.; Setchi, R. Selective laser melting of Hastelloy X nanocomposite: Effects of TiC reinforcement on crack elimination and strength improvement. Compos Part B Eng. 2020, 202, 108442. [Google Scholar] [CrossRef]
- Rong, T.; Gu, D. Formation of novel graded interface and its function on mechanical properties of WC1−x reinforced Inconel 718 composites processed by selective laser melting. J. Alloys Compd. 2016, 680, 333–342. [Google Scholar] [CrossRef]
- Yu, Z.; Xu, Z.; Guo, Y.; Sha, P.; Liu, R.; Xin, R.; Li, L.; Chen, L.; Wang, X.; Zhang, Z. Analysis of microstructure, mechanical properties, wear characteristics and corrosion behavior of SLM-NiTi under different process parameters. J. Manuf. Process. 2022, 75, 637–650. [Google Scholar] [CrossRef]
- Yi, J.H.; Kang, J.W.; Wang, T.J.; Wang, X.; Hu, Y.Y.; Feng, T.; Feng, Y.L.; Wu, P.Y. Effect of laser energy density on the microstructure, mechanical properties, and deformation of Inconel 718 samples fabricated by selective laser melting. J. Alloys Compd. 2019, 786, 481–488. [Google Scholar] [CrossRef]
- Gu, D.; Zhang, H.; Dai, D.; Xia, M.; Poprawe, R. Laser additive manufacturing of nano-TiC reinforced Ni-based nanocomposites with tailored microstructure and performance. Compos Part B Eng. 2019, 163, 585–597. [Google Scholar] [CrossRef]
- Cooper, D.E.; Blundell, N.; Maggs, S.; Gibbons, G.J. Additive layer manufacture of Inconel 625 metal matrix composites, reinforcement material evaluation. J. Mater. Process. Technol. 2013, 213, 2191–2200. [Google Scholar] [CrossRef]
- Chen, H.; Wang, X.; Ren, X. Size effect on fatigue performance of SLM-ed AlSi10Mg alloy: Role of defect size distribution. Int. J. Fatigue 2024, 182, 108163. [Google Scholar] [CrossRef]
- Gu, D.D.; Ma, C.L.; Xia, M.J.; Dai, D.H.; Shi, Q.M. A multiscale understanding of the thermodynamic and kinetic mechanisms of laser additive manufacturing. Engineering 2017, 3, 675–684. [Google Scholar] [CrossRef]
- King, W.E.; Barth, H.D.; Castillo, V.M.; Gallegos, G.F.; Gibbs, J.W.; Hahn, D.E.; Kamath, C.; Rubenchik, A.M. Observation of keyhole-mode laser melting in laser powder-bedfusion additive manufacturing. J. Mater. Process. Technol. 2014, 214, 15–25. [Google Scholar] [CrossRef]
- Prabaharan, P.; Ramkumar, K.D.; Arivazhagan, N. Characterization of microstructure and mechanical properties of Super Ni 718 alloy and AISI 316L dissimilar weldments. J. Mater. Res. 2014, 29, 3011–3023. [Google Scholar] [CrossRef]
- Sefene, E.M. State-of-the-art of selective laser melting process: A comprehensive review. J. Manuf. Syst. 2022, 63, 250–274. [Google Scholar] [CrossRef]
- Zhai, W.; Zhou, W.; Nai, S.M.L. Grain refinement of 316l stainless steel through in-situ alloying with ti in additive manufacturing. Mat. Sci. Eng. A Struct. 2022, 840, 142912. [Google Scholar] [CrossRef]
- Ni, M.; Chen, C.; Wang, X.; Wang, P.; Li, R.; Zhang, X.; Zhou, K. Anisotropic tensile behavior of in situ precipitation strengthened Inconel 718 fabricated by additive manufacturing. Mater. Sci. Eng. A 2017, 701, 344–351. [Google Scholar] [CrossRef]
- Jordanovová, V.; Losertová, M.; Štencek, M.; Lukášová, T.; Simha Martynková, G.; Peikertová, P. Microstructure and properties of nanostructured coating on ti6al4v. Materials 2020, 13, 708. [Google Scholar] [CrossRef]
- Rong, T.; Gu, D.; Shi, Q.; Cao, S.; Xia, M. Effects of tailored gradient interface on wear properties of WC/inconel 718 composites using selective laser melting. Surf. Coat. Technol. 2016, 307, 418–427. [Google Scholar] [CrossRef]
- Li, J.; Qu, H.; Bai, J. Grain boundary engineering during the laser powder bed fusion of tic/316l stainless steel composites: New mechanism for forming tic-induced special grain boundaries. Acta Mater. 2022, 226, 117605. [Google Scholar] [CrossRef]
- Zhang, Z.; Chen, D.L. Consideration of Orowan strengthening effect in particulate-reinforced metal matrix nanocomposites: A model for predicting their yield strength. Scr. Mater. 2006, 54, 1321–1326. [Google Scholar] [CrossRef]


| Element | Ni | Cr | Si | Mo | Nb | Co | Mn | Al | Ti | C | Fe |
|---|---|---|---|---|---|---|---|---|---|---|---|
| wt% | 53.10 | 18.20 | 0.07 | 3.10 | 4.99 | 0.08 | 0.09 | 0.45 | 0.92 | 0.06 | Bal. |
| Molding Parameters | Value |
|---|---|
| Laser power (P) | 145 W, 160 W, 175 W, 190 W |
| Scanning speed (v) | 200 mm/s |
| Hatch spacing (d) | 110 μm |
| Layer thickness (h) | 30 μm |
| Laser spot size | 80 μm |
| Construct chamber oxygen content | <0.1% |
| Scanning mode | 67° rotary scan |
| Laser Energy Density (J/mm3) | 219 | 242 | 265 | 288 | p-Value |
|---|---|---|---|---|---|
| Relative Density (%) | 89.82 ± 0.06 | 93.76 ± 0.03 | 96.14 ± 0.02 | 97.04 ± 0.03 | 0.0305 |
| Laser Energy Density (J/mm3) | 219 | 242 | 265 | 288 | p-Value |
|---|---|---|---|---|---|
| Molten pool depth (μm) | 32.21 ± 5.23 | 41.69 ± 4.65 | 55.84 ± 4.89 | 69.21 ± 6.38 | 0.0212 |
| Molten pool width (μm) | 82.23 ± 8.65 | 82.23 ± 8.65 | 106.65 ± 7.35 | 126.02 ± 7.98 | 0.0234 |
| Laser Energy Density (J/mm3) | 219 | 242 | 265 | 288 | p-Value |
|---|---|---|---|---|---|
| Size (μm) | 1.09 ± 0.062 | 0.78 ± 0.051 | 0.35 ± 0.035 | 0.22 ± 0.028 | 0.0172 |
| Laser Energy Density (J/mm3) | 219 | 242 | 265 | 288 | p-Value |
|---|---|---|---|---|---|
| Average hardness (HV0.5) | 322.36 ± 9.24 | 349.82 ± 11.82 | 359.32 ± 14.31 | 379.32 ± 14.12 | 0.0362 |
Disclaimer/Publisher’s Note: The statements, opinions and data contained in all publications are solely those of the individual author(s) and contributor(s) and not of MDPI and/or the editor(s). MDPI and/or the editor(s) disclaim responsibility for any injury to people or property resulting from any ideas, methods, instructions or products referred to in the content. |
© 2025 by the authors. Licensee MDPI, Basel, Switzerland. This article is an open access article distributed under the terms and conditions of the Creative Commons Attribution (CC BY) license (https://creativecommons.org/licenses/by/4.0/).
Share and Cite
Zhang, H.; Zhang, G.; Yu, W.; Jiang, L.; Xiang, J.; Xia, Y.; Liu, K. Effect of Laser Energy Density on the Microstructure and Mechanical Properties of Al2O3/Inconel 718 Nanocomposites Fabricated by SLM. Coatings 2025, 15, 81. https://doi.org/10.3390/coatings15010081
Zhang H, Zhang G, Yu W, Jiang L, Xiang J, Xia Y, Liu K. Effect of Laser Energy Density on the Microstructure and Mechanical Properties of Al2O3/Inconel 718 Nanocomposites Fabricated by SLM. Coatings. 2025; 15(1):81. https://doi.org/10.3390/coatings15010081
Chicago/Turabian StyleZhang, Haozhe, Guixiang Zhang, Wenhui Yu, Linzhi Jiang, Jinli Xiang, Yandan Xia, and Kun Liu. 2025. "Effect of Laser Energy Density on the Microstructure and Mechanical Properties of Al2O3/Inconel 718 Nanocomposites Fabricated by SLM" Coatings 15, no. 1: 81. https://doi.org/10.3390/coatings15010081
APA StyleZhang, H., Zhang, G., Yu, W., Jiang, L., Xiang, J., Xia, Y., & Liu, K. (2025). Effect of Laser Energy Density on the Microstructure and Mechanical Properties of Al2O3/Inconel 718 Nanocomposites Fabricated by SLM. Coatings, 15(1), 81. https://doi.org/10.3390/coatings15010081