Abstract
In this work, 2D simulations of stainless steel nitriding through a mask were performed with two configurations: with and without lateral adsorption under the mask, depending on the strength of the mask adhesion. The stress-induced diffusion and trapping–detrapping process are included as the main mechanisms of nitrogen mass transport. The main focus is on the analysis of the swelling process, which affects the expansion of the material. The surface concentration profiles and topographical profiles along the surface are calculated and compared with experimentally registered ones taken from the literature, and they show a good agreement. This allows for estimation of the values of model parameters. Because nitriding processes takes place in vertical and horizontal directions, the anisotropic aspect of nitriding are analyzed. It is shown that the adherence of the mask significantly influences the topographical profile and the anisotropy of nitriding, because in the case of a weakly adhered mask, a lateral adsorption process takes place under the mask. The influence of swelling and anisotropy in the case of pattern nitriding in small dimensions is discussed.
1. Introduction
Austenitic stainless steels have a very wide range of applications, such as in nuclear power plants as cladding of light water reactors [1]; in the food, pharmaceutical, chemical industries [2]; in biomedicine as dental and orthopedic implants as well as cardiovascular stents [3], etc. For medical reasons, this alloy is widely used because of its high corrosion resistance due to a protective layer consisting of a chromium oxide film [4,5], acceptable biocompatibility [6], good mechanical properties such as high tensile strength and toughness [7], relatively low production cost, and easier processing [8]. However, austenitic stainless steels, like all alloys used in biological bodies, have limiting factors such as wear, localized corrosion, and cytotoxicity, which occur when an implant of this alloy is used for a long time, during which the toxic metal ions Cr3+, Fe2+, and Ni+ are released and thus cause an inflammatory or allergic reactions [9]. These negative properties must be improved for the safe use of austenitic stainless steel. The biocompatibility and durability of austenitic stainless steels depend on the surface properties of the alloy. Therefore, surface treatment is a suitable method to extend the service life of parts of this alloy. Surface treatment can increase surface hardness and corrosion resistance, thereby reducing the generation of harmful ions and debris during friction or corrosion. Surface morphology is also important, as a smoother surface prevents platelet aggregation, which can lead to thrombosis, but a rougher surface can improve the biocompatibility and adhesion of some cell types, such as endothelial cells [10,11].
A frequently used and studied surface treatment method for improving austenitic stainless steels properties is moderate-temperature plasma nitriding at temperatures below 450 °C. The moderate temperature of 450 °C was chosen because at higher temperatures, the formation of chromium nitride becomes favorable, which reduces the corrosion resistance of the alloy [12,13]. The nitriding time is also important factor with respect to nitride formation. By keeping the temperature low enough, this method ensures good corrosion resistance and rapid formation of a thick and strong nitrided layer. The main feature of this method is the nitrogen penetration to the subsurface layers after adsorption on the surface. The high nitrogen content causes high internal stresses that distort the surface-centered cubic lattice, and this supersaturated solid solution is called expanded austenite, which maintains a good corrosion resistance, high hardness, and low coefficient of friction [14,15,16].
Results presented by several researchers show that, by using nitriding, it is possible to create surfaces with various patterns [17,18,19,20,21]. Czerwiec et al. presented a new surface texturing method of austenitic stainless steel using plasma nitriding. Their results showed that the surface pattern was formed due to the introduction of a high nitrogen content, which caused compressive residual stress and expansion of the nitrided layer [17]. Katoh et al. [18] developed a micro-texturing method in which martensitic stainless steels were nitrided through a pattern mask formed by an inkjet printer. This method allowed them to create a micro pattern on the surface with two regions of different hardness and height. Menéndez et al. [19] showed that a periodic ferromagnetic structure can be formed on the surface of a paramagnetic austenitic stainless steel using through-mask ion beam nitriding. Marcos et al. [20] showed that it is important to pay attention to the nitrogen diffusion through the mask when performing micropatterning using a fixed silicon oxide mask. It is important to monitor the diffusion under the mask, as it can even cause deformation of the mask edges. Our previous work [21] showed that the swelling of the alloy has a significant influence on the nitrogen distribution depth profile. These works showed that the swelling during nitriding of an alloy is an important phenomenon, and if controlled, it can have great applicability; however, this aspect has not been fully analyzed in the literature.
A number of studies have been conducted and models have been developed for the qualitative and quantitative understanding of mechanisms resulting in geometrical changes in nitrided alloys. Möller et al. showed that the nitriding of stainless steel depends on the diffusion of nitrogen into bulk under the effect of traps created by chromium atoms in the alloy [22]. In the works of Jespersen et al. [23] and Kücükyildiz et al. [24], the elasto-plastic accommodation of the lattice expansion and composition-dependent diffusion coefficients were analyzed. The influence of lattices’ stresses on the nitriding process were experimentally analyzed by Christiansen and Somers [25]. Our previous modeling of the nitriding mechanisms showed that stress-induced diffusion and swelling of the alloy take place during nitriding of austenitic stainless steels [21]. It was shown that the nitrogen penetration into austenitic stainless steels also depends on the orientation of the crystal lattice, i.e., the nature of the nitriding process is anisotropic [26]. The individual grain anisotropic lattice rotation induced by plasma nitriding was discovered by Stinville and his coworkers [27]. They performed an analysis using the Taylor–Bishop–Hill theory for the plastic deformation of polycrystals and showed that the theory predicts the total rotations reasonably well, both in their amplitude and in direction. Reinders et al. [28] developed a model that allowed them to predict the thickness and corrosion resistance of an expanded austenite layer depending on the nitriding time and temperature. Bozek et al. [29] provided a new model for the simulation of low-temperature nitriding of steel. They introduced interdiffusion in the alloy by incorporating Maxwell’s model for viscoelastic solids and combining it with Vegard’s rule, as well as conservation of mass with Darken’s bi-velocity method. They concluded that nitrogen transport during nitriding is assisted by the stress and strain, which depend on the mobility of components and viscosity coefficient. However, these works leave unanswered questions of how nitriding will proceed in 2D space when nitriding conditions are not constant along the entire nitriding surface.
This work aims to show the changes in surface geometric dimensions resulting from the distribution of nitrogen in the alloy after nitriding through the mask and to determine the effect of undermask adsorption and anisotropy of nitrogen distribution in the nitrided zone. To achieve those objectives, a generalized system of diffusion equations is described that includes nitrogen transport under various driving forces and alloy expansion. The model was used to simulate nitrogen transport in a 2D sample during nitriding in two different cases: (1) nitriding through a weakly adhered mask when undermask adsorption may occur; and (2) nitriding through a strongly adhered mask when undermask adsorption can be neglected. The model, which involves two main mass transport mechanisms, the lattice stress-induced diffusion and the trapping–detrapping, is adopted for the first time for nitriding through a mask. The influence of undermask adsorption has never been analyzed before. Important and new results and conclusions are obtained considering surface topography, nitrogen depth distribution, and anisotropic aspects. The simulation results are discussed and verified with experimental measurements from the literature.
2. The Model
Considering the stress-induced diffusion mechanism and trapping–detrapping process, the nitrogen concentration is convenient to split into diffusing nitrogen with relative concentration Cdif and nitrogen in trap sites Ctrap, so that the variation in the total amount of nitrogen Csum at a given layer of solid can be expressed as Csum = Cdif + Ctrap. The diffusion equation in the case of stress-induced diffusion and trapping–detrapping is written as [26]:
where D is the diffusion coefficient, Vm is the partial molar volume of nitrogen in the solid matrix, R is the universal gas constant, and T is the temperature. The stress depends linearly on the concentration as , where Xstress is the anisotropic stress factor, which depends on crystallographic orientation and involves the Hooke’s law for elastic anisotropy. The formula and a detailed description of the calculation of the parameter Xstress can be found in our previous work, Ref. [26].
The trapping–detrapping term is expressed as follows [26]:
where K = 4π Rt D/h, where h is the thickness of monolayer; Rt is the characteristic confinement radius of an individual trap site, taken as the lattice constant; Ht is the concentration of traps; N0 is the concentration of host atoms; EB is the detrapping activation energy; and kB is Boltzmann’s constant.
In order to adapt the model for pattern nitriding when nitriding goes on through a mask, the two-dimensional (2D) case is analyzed: nitriding occurs to the depth of the solid in the y-direction and along the surface in the x-direction (see Figure 1). We assume that Dx = Dy = D, so the diffusivity itself is isotropic; however, the geometry of the mask may result in anisotropic nitriding because of the swelling process, which will be introduced into the model later.
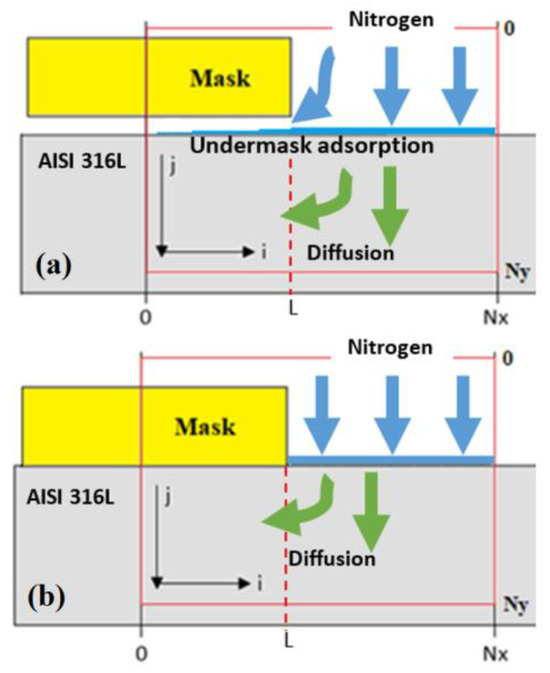
Figure 1.
The schematic presentation of nitriding through a mask in two simulated cases: with (a) and without (b) undermask adsorption.
The equation with which to calculate the concentration variation in the i,j cell (i changes along the surface, x direction, and j changes according to the depth, y direction) (Figure 1), using Equation (1), is expressed in finite increments and obtains the following form:
where hx,y is the size of cell and is the nitrogen adsorption term which takes place only on the surface, i.e., at j = 0. The adsorption process takes place on the free-of-mask surface; however, in the case of weak adherence of the mask, undermask adsorption may take place. A schematic presentation of undermask adsorption is shown in Figure 1. It is assumed in the model that undermask adsorption decreases exponentially in the direction from the edge toward the center of the mask. According to the Lengmiurian adsorption model, the adsorption rate is proportional to the amount of vacant adsorption sites, and the adsorption rate can be expressed as follows:
where a is the sticking coefficient, L is the coordinate of mask edge position, x > L is the maskless region, and x < L is undermask (Figure 1).
The swelling process, which consists of plastic deformation of the material and results in the expansion of the material, is assumed to be linearly proportional to the concentration and can be written as follows:
where —new cell length along x or y-axis, h—initial cell length (equal to the thickness of monolayer, see Equation (2)), and α—expansion coefficient (correlates with Vegard’s constant for nitrogen dissolved in austenite).
This model assumes that: (1) the nitrogen diffusion occurs not only due to the concentration gradient, but also due to induced lattice stresses; (2) the Cr-N trapping–detrapping effect takes place; (3) particles enter the system due to adsorption through the surface, which also may occur under the mask; (4) the swelling effect, which results in the expansion of material and changes of topographic profile, is included.
The values of the model parameters are summarized in Table 1, which were obtained from our previous works and the literature [26,30,31,32,33], and fitting of experimental results is presented below.

Table 1.
Simulation parameters.
The boundary conditions used for the simulation of nitrogen mass transport are as follows:
The boundary condition is used at the bottom and sides of the simulation system space:
The purposed model can be used to describe the nitrogen mass transport in austenitic stainless steel during the nitriding processes at temperatures lower than the temperature of chromium nitride formation (450 °C). Furthermore, for nitrided layers containing the γN phase, various types of strains (thermal, compositional, elastic, and plastic) can be considered. In our model, we consider compositional stress. The advantage of 2D modelling is that it allows for the simulation of the formation of patterned structures when nitriding is performed through the masks. In such cases, the surface morphology changes significantly due to the expansion of the lattice upon nitrogen permeation. The initial flat surface acquires a complex geometrical topography. Only 2D modeling allows us to simulate geometrical changes in surface topography. However, the disadvantage is the higher cost of computing resources and longer computation time.
3. Results and Discussions
In order to verify the suitability of the proposed model for nitriding in two-dimensional (2D) systems, it was compared with the experimental results from Ref. [34]. The test conditions were as follows: a 316L austenitic stainless steel single crystal sample with a Miller index (100) of crystallographic orientation was half-masked by using a 200 μm thickness Si wafer. It was subsequently plasma-nitrided for 60 min at 400 °C via plasma generation in a quartz tube using electromagnetic excitation at 13.56 MHz with an incident input power of 700 W. Equation (3) was used for the entire work and was solved numerically in such a way as to obtain profiles of nitrogen concentrations, and Equation (5) was used to determine the influence of concentration on changes in element geometrical dimensions due to induced swelling. Undetermined model parameters D, α, and a were found by fitting of experimental curves and by comparing the simulation and experimental results of the light interferometry topographic profile [34] and nitrogen depth profiles [35]. The best fitting of experimental results was obtained at values of D = 1.7 × 10⁻¹⁵ m2/s; α = 0.85; N0 = 3 × 10²² m−2; and a = 0.0016. Other parameters are presented in Table 1. A comparison of the results of the nitriding simulation performed here with the experimental one from ref. [34] can be seen in Figure 2. The blue curves in Figure 2 compare the nitrogen concentration profiles calculated using the model equation (marked as M) and experimental equation (marked as E). The orange curves are topographic profiles of swelling, experimental (red dot line, E), and calculated (solid and dashed lines, M) results.
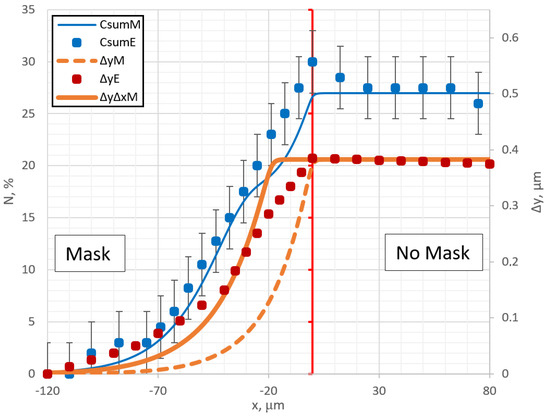
Figure 2.
Surface topographic profiles (orange) and nitrogen surface concentration profiles (blue) at D1 = m2/s. Curves (M) are calculated results of the proposed model and E are the experimental results from ref. [34]. “Mask” and “No Mask” indicate undermask and maskless regions, respectively (see Figure 1).
An important part of the simulations was to obtain a suitable coefficient of expansion α, which would help to approximate the expansion of the alloy. The best fitting was obtained at α = 0.85. This parameter is important to include because it represents changes in alloy size (expansion), which can have a significant impact on impurity concentration depth profiles. This phenomenon (swelling) and its importance have been observed in many studies. Colleagues have performed nitriding simulations of austenitic stainless steel and observed that swelling has a significant effect on the nitrogen depth profile [21]. Meanwhile, Stinville et al. [36] have shown through experiments that plasma nitriding can cause swelling of 316L austenitic stainless steel. The experimental and theoretical nitrogen concentration profiles (blue) are in fairly good agreement over the entire surface. But an interesting phenomenon is observed in the theoretical concentration profile curve: step formation at the mask edge region is seen. In experimental curves, this step is not so well expressed and can be related with the accuracy of measurements. Experimentally, it is not easy to detect. This phenomenon of step formation in the concentration curve will be discussed in detail below. Considering surface topographic profile curves (Figure 2, orange), it can be seen that in the direct nitriding region, the simulation reproduces the experimental results quite accurately and a clear correlation is visible between swelling and concentration. However, in the area under the mask, near the edge, there is a clear discrepancy between the experiment and the model results. It can be interpreted that during nitriding, the expansion of the alloy occurs not only perpendicular to the surface, but also in parallel direction to the surface. The influence of this lateral swelling is shown in the ΔyΔxM curve in Figure 2. This curve (ΔyΔxM) is a better fit of the experimental profile curve ΔyE than the curve ΔyM, where the lateral swelling (in parallel to the surface) is not included. However, the overall fitting with curve ΔyΔxM is also not good and deviates significantly from the experimental results at the top and at the bottom near the edge regions, so in the calculations presented below, the lateral swelling will not be included. The literature results [27,37] showed that during uniform nitriding of the surface, it is enough to pay attention only to the expansion of the alloy perpendicular to the surface, because the alloy grains maintain their original position and shape after nitriding due to the constraint of uniformly nitrided surrounding neighbors. Those studies have also shown that nitriding of a polycrystalline alloy can highlight individual grains due to different effects of plasma etching on grains with different crystallographic orientations, in turn revealing a polycrystalline microstructure [38]. However, Figure 2 shows that lateral swelling is important process and in general cannot be neglected.
Figure 3a–c shows nitriding 2D profiles calculated at different nitriding diffusion rates. All other parameters were the same as for the results presented in Figure 2. In particular, Figure 3a is the 2D plot of the results presented in Figure 2 (both calculated at D1 = m2/s). Figure 3b,c show the influence of diffusivity on the concertation and topographical profiles. Interesting and important curves are in the transition region at the edge of the mask. Despite the covered surface area under the mask, nitrogen penetration occurs because of two processes: lateral diffusion and undermask adsorption. In this case, the undermask adsorption is included into simulations, as it can occur if the mask is not well adhered to the surface and gas molecules can penetrate under the mask. The experimental conditions [34], the results of which are fitted here (Figure 2 and Figure 3a), support this assumption (200 μm thickness Si wafer was placed as a mask), so the Si wafer was not well adhered. The undermask adsorption rate, according to Equation (4), has an exponential decrease from the edge of the mask in the direction toward the center of the mask (Figure 1). The case without undermask adsorption will be analyzed below; however, the much better fitting of the experimental results [34] was obtained when undermask adsorption took place (Figure 2).
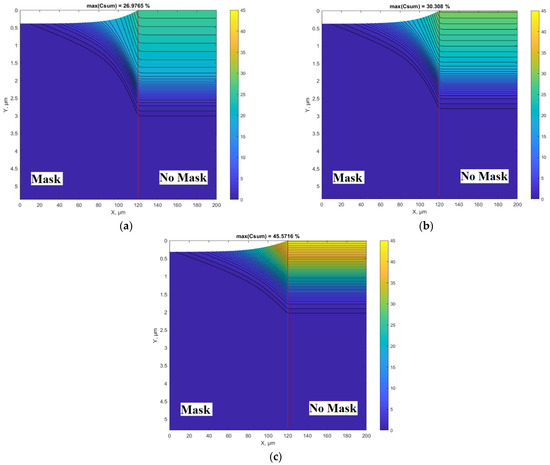
Figure 3.
Two-dimensional concentration profiles of nitrogen, with undermask adsorption calculated at different diffusion coefficients: (a) D1 = m2/s; (b) D2 = m2/s; (c) D3 = m2/s. Red vertical line shows the position of the mask edge.
Figure 4 shows the distribution of the average nitrogen amount (solid lines) added up over all depth layers and divided by number of layers, as well as the surface topographic profiles (dot lines) at different diffusion rates. The expansion of the alloy is proportional to the concentration of nitrogen, as shown in other studies [34], but the obtained curves show an important quantitative relationship. Also, some interesting observations can be seen: in Figure 2, the observed step in the surface concentration profile curve at the edge area of the mask is no longer observed in the curves of Figure 4, where the overall summarized nitrogen amount is the depth is presented. This indicates that this effect needs to be analyzed in more detail and the reasons for it need to be found; moreover, such a step can be observed in some experimental results [34]. However, it is below the range of dispersion of experimental points. In order to detect this step, it would need some additional attempts, which have not been conducted before and are probably limited by the methods of the measurements. In experimental measurements of surface concentration, the detecting signal arrives not only from the surface monolayers, but also from the several deeper layers. The depth of the layers from which the signal arrives depends on the applied analytical method. For example, using Auger Electron Spectroscopy (AES), which is most surface-sensitive method, because of the small escape depth of electrons [39,40], the signal arrives from the first several nanometers, so from more than 10 monolayers (1 monolayer is 2–3 angstroms). Thus, to experimentally detect the theoretically predicted effects on the top monolayers is very complicated. The experimental results presented in Figure 2 were obtained by EDX (Energy-dispersive X-ray analysis), where X-rays are generated in a region of about 2 microns in depth [41]. This means that the experimental results can be more comparable with Figure 4 (concentration of nitrogen summarized over the depth) than with Figure 2, where the concentration of the top monolayer is presented.
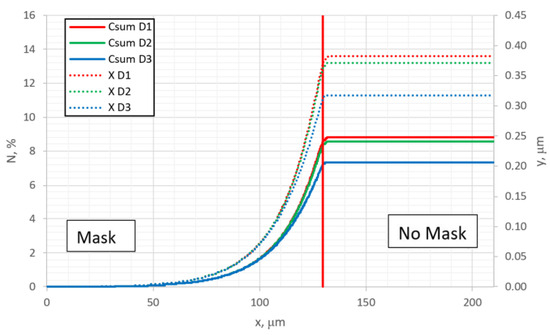
Figure 4.
Profiles of average overall nitrogen concentration through all layers (solid lines) and surface topographic profiles (dash lines) at different diffusion coefficients: D1 = m2/s, D2 = m2/s, D3 = m2/s.
In Figure 5, nitrogen surface concentration (first layer, j = 0) profiles along the surface at different diffusion rates are shown. It is seen that with an increase in the diffusion rate, the step in the profile curve in near-edge region of the mask is more well expressed. This may be the answer as to why this step is observed in some experiments and not in others [20,34,37]. In order to understand the reason for the step formation, in Figure 6, profiles of trapped Ctrap and diffusion Cdif nitrogen are outputted separately. The Ctrap profile exhibits a characteristic horizontal plateau [22]. It can be seen that the nitrogen concentration in the traps has the greatest influence. It can be obviously seen now that the step in the resulting nitrogen profile Csum is formed because of the trapping of nitrogen. Thus, the step in the lateral profile under the mask clearly shows the significant influence of the nitrogen-trapping process. This step is seen in Figure 1c of ref. [34], if one looks at the individual measured points instead of smoothed data. In the cases where the influence of trapping is not so sufficient, this step cannot be observed.
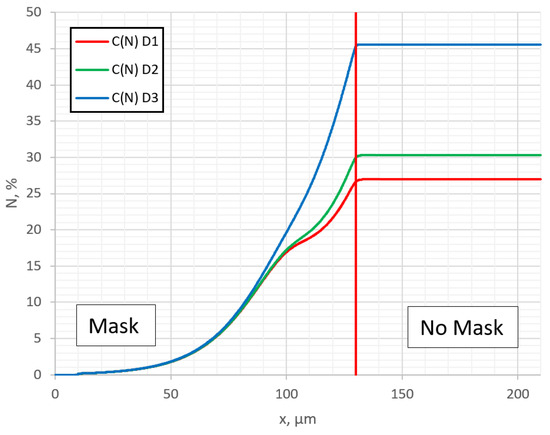
Figure 5.
Profiles of nitrogen concentration in parallel to the surface at different diffusion coefficients: D1 = m2/s, D2 = m2/s, D3 = m2/s.
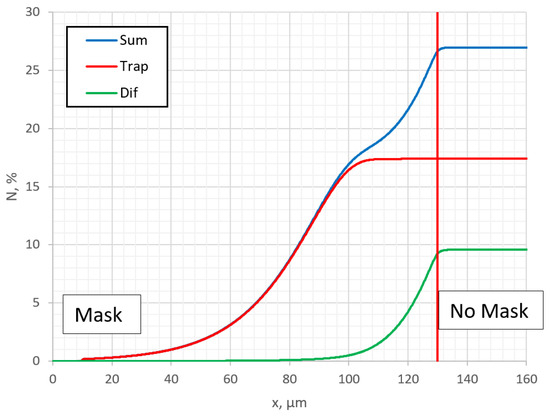
Figure 6.
Profiles of total (Sum), trapped (Trap), and diffusing (Dif) nitrogen surface concentrations in parallel to the surface in the case with undermask adsorption at D = m2/s.
In Figure 7, the depth dependence of the nitrogen concentration perpendicularly to the surface, calculated at different diffusion coefficients and compared with experimental results [35], is shown. It was obtained for plasma nitriding of single crystals of austenitic stainless steel 316L at temperatures of 400 °C. The comparison with the experimental profile allows us to estimate the adequacy of the calculations and to find the values of the model parameters. Figure 7 shows that the distribution of nitrogen concentration is highly dependent on the diffusion coefficient: at low diffusivity, the depth distribution of nitrogen resembles a sloping incline, while at higher diffusivity, nitrogen penetrates into deeper layers faster and the nitrogen profile acquires the shape of a plateau, the edge of which strongly depends on the nitrogen in the trap or the amount of chromium in the alloy. Note that level of trapped nitrogen does not change with diffusivity and only shifts deeper into the bulk of the sample.
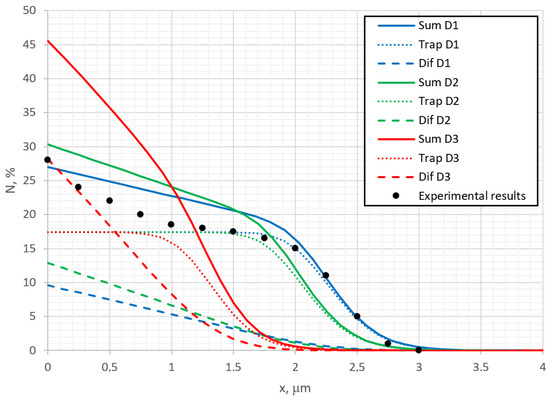
Figure 7.
Depth profiles of nitrogen concentration of entire depth (solid line) and its composition (dash and dotted lines) at different diffusion coefficients: (blue) D1 = m2/s, (green) D2 = m2/s, (red) D3 = m2/s, compared to experimental results from ref. [35].
Because the nitriding takes place in two directions, perpendicularly and in parallel with respect to the surface, it is important to quantitatively analyze those differently directed nitriding processes. Figure 8 shows the variations in nitriding depth yN and nitriding width xN under the mask with nitriding time. Here, the nitriding depth is taken to be the distance from the surface to the layer (y direction) where the nitrogen concentration reached 5%, and the nitriding width is the distance from the mask edge to the lateral layer (x direction), with the same concentration. Mathematically, the nitriding width and depth can be expressed as xN = i(L) − i(5%), and yN = j(0) − j(5%), respectively. Looking at the curves of Figure 8, it can be seen that nitriding width xN increases with time, but not linearly, and the diffusion coefficient does not significantly affect this parameter. The change in nitrided depth yN is not linear with time either, and the value of the diffusion coefficient has a strong influence. When two perpendicular nitriding processes take place, it is interesting to analyze the anisotropic effects of those processes. For that reason, the quantitative anisotropy parameter, denoted as aspect ratio A = 2xN/yN [42], can be introduced (2 is because the undermask nitriding was assumed to occur on both sides of the mask). In Figure 8, the aspect ratio of nitriding is shown as function of time and diffusion rate. It can be noticed that the aspect ratio decreases over nitriding time, approaching a steady state value, and depends on the diffusion coefficient; with a decrease in the diffusion coefficient, the aspect ratio increases. This phenomenon is influenced by the fact that the concentration changes near the surface more significantly compared with the deeper layers, and as the diffusion coefficient decreases, it increases the surface concentration and the aspect ratio as well. The dependence of the aspect ratio on the time and the diffusion rate means that the nitriding process has an anisotropic character.
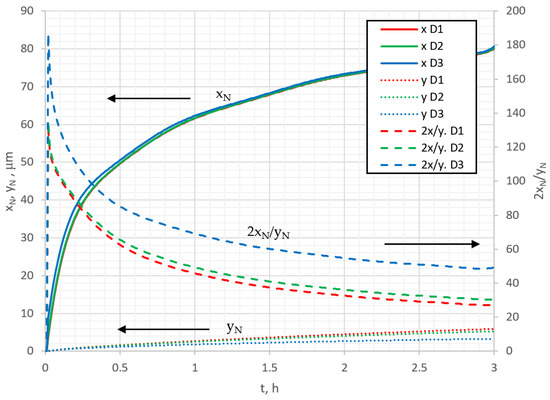
Figure 8.
The dependencies of nitriding depth yN, width xN, and aspect ratio 2xN/yN on nitriding time in the case with undermask adsorption, calculated at: D1 = m2/s, D2 = m2/s, D3 = m2/s.
The next part of the simulation was related to cases where a mask is strongly adhered to the surface of alloy (e.g., grown or deposited as a thin coating, etc.), where the gas species have no possibility to move under the mask, and where undermask adsorption cannot take place and is excluded (see Figure 1). This is an interesting case for analysis because, in this case, undermask nitriding can only occur because of lateral diffusion in parallel to the surface, and it gives us a possibility to analyze the lateral diffusion process alone as well as its influence on the swelling effect and topographical changes of the surface. Figure 9a–c show the results when undermask adsorption is not included. Considering the topographic profile, the results significantly differ from the previous case shown in Figure 3a–c. In the case when undermask adsorption is included, the maskless region topographically is flat. At the edge of the mask, the surface topographic line abruptly changes (see Figure 3). In cases where undermask adsorption does not take place, the surface topographic line in the maskless region is not flat; it is curved and approaches the horizontal part gradually, but monotonously (Figure 9). This can be an important aspect in the case of pattern nitriding, especially with small dimensions of patterns. This phenomenon can be seen in more detail in Figure 10, where the parallel summarized (over the depth) nitrogen and topographic profiles are shown and compared for different diffusion rates. Figure 10 can be compared with similar curves of Figure 4 (for undermask adsorption case), and from this comparison, the qualitative and quantitative influence of undermask adsorption can be seen in more detail.
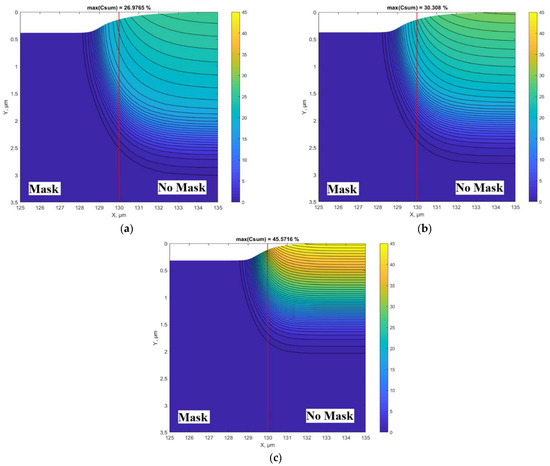
Figure 9.
Two-dimensional concentration profiles of nitrogen without undermask adsorption, calculated at different diffusion coefficients: (a) D1 = m2/s; (b) D2 = m2/s; (c) D3 = m2/s. Red vertical line shows the position of the mask edge.
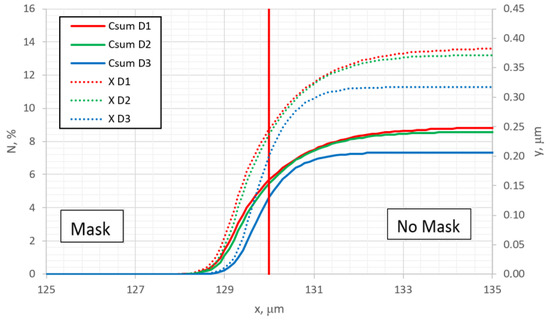
Figure 10.
Profiles of nitrogen average overall concentration through all layers (solid lines) and surface topographic profiles (dash lines) at different diffusion coefficients: D1 = m2/s, D2 = m2/s, D3 = m2/s.
The distribution of nitrogen surface concentration along the surface is presented in Figure 11, which also shows the dependence of the nitrogen concentration profile on the diffusion rate in a case when undermask adsorption is not included. As in the previous case with undermask adsorption (Figure 5), a step in the curve of surface nitrogen concentration is observed, and the reason for this step is the same, i.e., there is significant influence of the nitrogen-trapping process. To confirm this assumption, the profiles of the surface concentration of nitrogen species Ctrap and Cdiff are separately outputted and shown in Figure 12, which can be compared with Figure 6 in order to see the difference with and without undermask adsorption. The main difference in these two cases is that the curve of diffusing nitrogen Cdif, in the case of undermask adsorption, remains horizontal in the entire undermask region until the point of the mask edge position, while in the case without undermask adsorption, the Cdif curve in this region is curved. The curves of Ctrap in both cases are qualitatively similar, i.e., both are horizontal when crossing the mask edge position (red vertical line in Figure 6 and Figure 12); only in the case of undermask adsorption is the Ctrap curve more shifted to the mask region because of swelling. This shift, quantitatively, is quite big. The results of Figure 6 and Figure 12 indicate that the difference is near 130 μm despite the calculation parameters, including diffusivity, being similar. This confirms once again that the adherence of a mask has a very significant influence on the nitriding process and topographical surface changes in the case of 2D pattern nitriding.
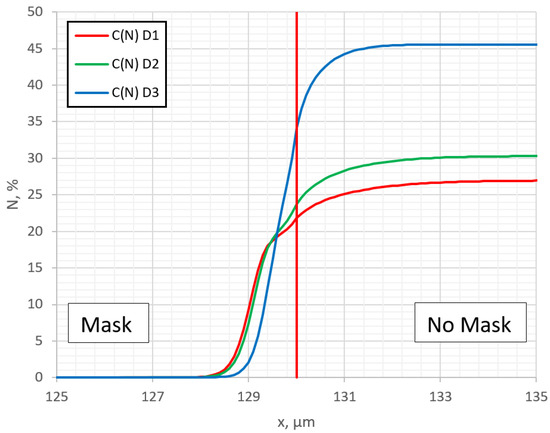
Figure 11.
Profiles of nitrogen concentration parallel to surface, calculated with different diffusion coefficients: D1 = m2/s, D2 = m2/s, D3 = m2/s.
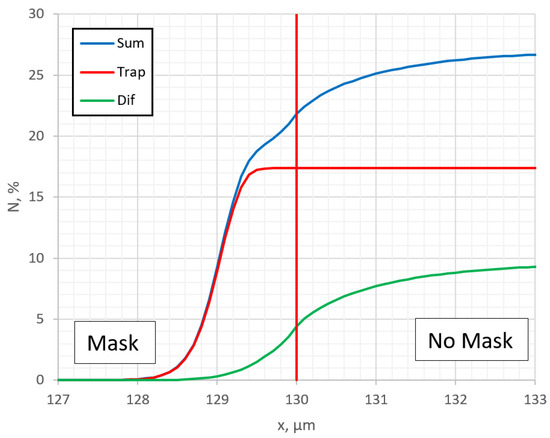
Figure 12.
Profiles of total (Sum), trapped (Trap), and diffusing (Dif) nitrogen surface concentrations in parallel to surface in the case without undermask adsorption at D = m2/s.
Considering the perpendicular direction of nitriding, the results without undermask adsorption are quantitatively identical to the case with undermask adsorption. They are not presented here because the obtained graph was identical to Figure 7; however, this is true only in the regions relatively far from the edges of the mask. Considering the edge regions of the mask, the topographic profiles in those two cases differ, and the depth distribution of nitrogen differs as well. Figure 13 shows the depth profiles with and without undermask adsorption in the region of the mask edge. The profiles are qualitatively similar, but significantly differ quantitatively. The penetration and overall absorbed nitrogen amount are lower when undermask adsorption does not take place.
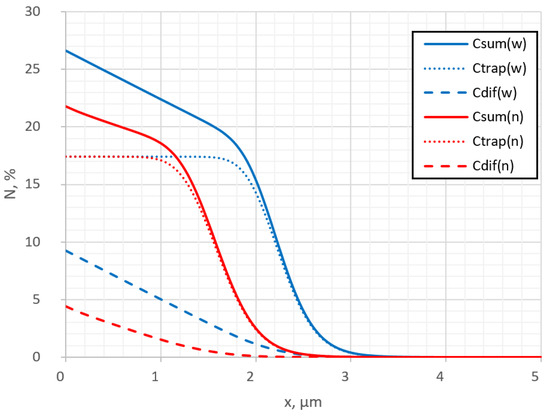
Figure 13.
Depth profiles with (w) and without (n) undermask adsorption in the edge region of the mask at D = m2/s.
The anisotropy of nitriding in two perpendicular directions in the case when undermask adsorption did not take place is analyzed in Figure 14, where the time dependencies of nitriding depth along the x and y directions, as well as the aspect ratios at different diffusion rates, are calculated. Both xN and yN increased with time nonlinearly, and both increased with the increase in diffusivity. From this point of view, the results differ from the previous case (with undermask adsorption), where xN decreased with increasing diffusivity. But the main difference from the previous case (with undermask adsorption, see Figure 8) is that aspect ratio quickly approached a horizontal shape and became almost independent on time. It also weakly depended on the diffusion coefficient. This indicates a conclusion that perpendicular nitriding in the parallel and perpendicular directions in the case without undermask adsorption was isotropic. The anisotropy of nitriding was observed only in the case when undermask adsorption was possible, i.e., for masks that are not well adhered. However, even with well-adhered masks, the anisotropy of nitriding can occur because the crystalline lattice orientation influences the anisotropy [26].
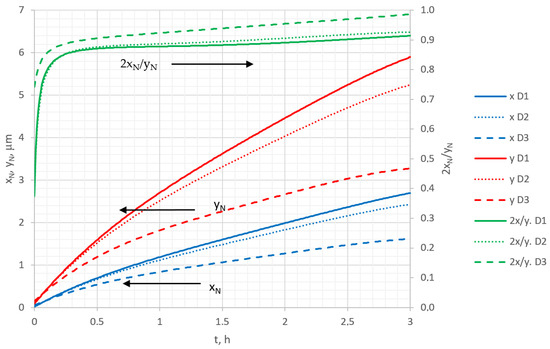
Figure 14.
The dependencies of nitriding depth yN, width xN, and aspect ratio 2xN/yN on nitriding time in the case without undermask adsorption, calculated at: D1 = m2/s, D2 = m2/s, D3 = m2/s.
4. Conclusions
During the gradient nitriding, the expansion of material (because of swelling process) is more significantly expressed perpendicularly to the surface; however, in the parallel direction, the expansion takes place as well and can be an important aspect in the case of small pattern dimensions.
The process of lateral undermask adsorption is a quite important process and cannot be neglected in the case of masks which are not well adhered. The mask’s adherence has a significant influence on the formation of the geometrical shape of the surface topographical profile during pattern nitriding.
The adherence of the mask influences the anisotropy of nitriding: if the mask is well adhered and the lateral adsorption under the mask can be neglected, the nitriding is almost isotropic, and only at short times during nitriding is some anisotropy observed. In the case of not well adhered masks because of lateral adsorption process under the mask the anisotropy of nitriding is significant, dependent on time and diffusivity.
Quite often observed step in the lateral nitrogen concentration profile at the edge of the mask, which is also dependent on diffusivity, is formed because of nitrogen atoms being trapped in trap sites. It can be considered as direct evidence of the trapping–detrapping process.
Author Contributions
Conceptualization, P.A., R.Č.-T. and A.G.; methodology, P.A. and A.G.; software, P.A.; validation, P.A., R.Č.-T. and A.G.; formal analysis, P.A. and A.G.; investigation, P.A. and A.G.; resources, P.A. and R.Č.-T.; data curation, P.A. and A.G.; writing—original draft preparation, P.A.; writing—review and editing, R.Č.-T. and A.G.; visualization, P.A. and A.G.; supervision, A.G. All authors have read and agreed to the published version of the manuscript.
Funding
This research received no external funding.
Institutional Review Board Statement
Not applicable.
Informed Consent Statement
Not applicable.
Data Availability Statement
Data is contained within the article.
Conflicts of Interest
The authors declare that they have no known competing financial interests or personal relationships that could have appeared to influence the work reported in this paper.
References
- Ehrlich, K.; Konys, J.; Heikinheimo, L. Materials for high performance light water reactors. J. Nucl. Mater. 2004, 327, 140–147. [Google Scholar] [CrossRef]
- Michler, T. Reference Module in Materials Science and Materials Engineering. In Austenitic Stainless Steels; Elsevier: Amsterdam, The Netherlands, 2016. [Google Scholar] [CrossRef]
- Talha, M.; Kumar, S.; Behera, C.; Sinha, O. Effect of cold working on biocompatibility of Ni-free high nitrogen austenitic stainless steels using Dalton’s Lymphoma cell line. Mater. Sci. Eng. C 2014, 35, 77–84. [Google Scholar] [CrossRef] [PubMed]
- Prasad, M.A.; Dharmalingam, G.; Salunkhe, S. Microstructural evaluation of gas nitrided AISI 316 LN austenitic stainless steel. Mater. Today Proc. 2022, 68, 1887–1890. [Google Scholar] [CrossRef]
- Stio, M.; Martinesi, M.; Treves, C.; Borgioli, F. Cultures and co-cultures of human blood mononuclear cells and endothelial cells for the biocompatibility assessment of surface modified AISI 316L austenitic stainless steel. Mater. Sci. Eng. C 2016, 69, 1081–1091. [Google Scholar] [CrossRef] [PubMed]
- Moghadasi, K.; Isa, M.S.M.; Ariffin, M.A.; Jamil, M.Z.M.; Raja, S.; Wu, B.; Yamani, M.; Bin Muhamad, M.R.; Yusof, F.; Jamaludin, M.F.; et al. A review on biomedical implant materials and the effect of friction stir based techniques on their mechanical and tribological properties. J. Mater. Res. Technol. 2022, 17, 1054–1121. [Google Scholar] [CrossRef]
- Gyaneshwar, T.; Nitesh, R.; Sagar, T.; Pranav, K.; Rustagi, N. Treatment of pediatric femoral shaft fractures by stainless steel and titanium elastic nail system: A randomized comparative trial. Chin. J. Traumatol. = Zhonghua Chuang Shang Za Zhi 2016, 19, 213–216. [Google Scholar] [CrossRef] [PubMed]
- Bandyopadhyay, A.; Mitra, I.; Goodman, S.B.; Kumar, M.; Bose, S. Improving biocompatibility for next generation of metallic implants. Prog. Mater. Sci. 2023, 133, 101053. [Google Scholar] [CrossRef] [PubMed]
- Hedberg, Y.S.; Wallinder, I.O. Metal release from stainless steel in biological environments: A review. Biointerphases 2015, 11, 018901. [Google Scholar] [CrossRef]
- Bottoli, F.; Jellesen, M.S.; Christiansen, T.L.; Winther, G.; Somers, M.A.J. High Temperature Solution-Nitriding and Low-Temperature Nitriding of AISI 316: Effect on Pitting Potential and Crevice Corrosion Performance. Appl. Surf. Sci. 2018, 431, 24–31. [Google Scholar] [CrossRef]
- Yazıcı, M.; Çomaklı, O.; Yetim, T.; Yetim, A.F.; Çelik, A. Investigation of mechanical, tribological and magnetic properties after plasma nitriding of AISI 316L stainless steel produced with different orientations angles by selective laser melting. Surf. Coat. Technol. 2023, 467, 129676. [Google Scholar] [CrossRef]
- Lu, Y.; Li, D.; Ma, H.; Liu, X.; Wu, M.; Hu, J. Enhanced plasma nitriding efficiency and properties by severe plastic deformation pretreatment for 316L austenitic stainless steel. J. Mater. Res. Technol. 2021, 15, 1742–1746. [Google Scholar] [CrossRef]
- Manova, D.; Mändl, S. Initial phase formation during nitriding of austenitic stainless steel. Surf. Coat. Technol. 2023, 456, 129258. [Google Scholar] [CrossRef]
- Che, H.; Tong, S.; Wang, K.; Lei, M.; Somers, M.A. Co-existence of γ’N phase and γN phase on nitrided austenitic Fe–Cr–Ni alloys- I. experiment. Acta Mater. 2019, 177, 35–45. [Google Scholar] [CrossRef]
- Lu, S.; Zhao, X.; Wang, S.; Li, J.; Wei, W.; Hu, J. Performance enhancement by plasma nitriding at low gas pressure for 304 austenitic stainless steel. Vacuum 2017, 145, 334–339. [Google Scholar] [CrossRef]
- Calabokis, O.P.; de la Rosa, Y.E.N.; Lepienski, C.M.; Cardoso, R.P.; Borges, P.C. Crevice and pitting corrosion of low temperature plasma nitrided UNS S32750 super duplex stainless steel. Surf. Coat. Technol. 2021, 413, 127095. [Google Scholar] [CrossRef]
- Czerwiec, T.; Marcos, G.; Thiriet, T.; Guo, Y.; Belmonte, T. Austenitic stainless steel patterning by plasma assisted diffusion treatments. IOP Conf. Ser. Mater. Sci. Eng. 2009, 5, 012012. [Google Scholar] [CrossRef]
- Katoh, T.; Aizawa, T.; Yamaguchi, T. Plasma assisted nitriding for micro-texturing onto martensitic stainless steels. Manuf. Rev. 2015, 2, 2. [Google Scholar] [CrossRef]
- Menéndez, E.; Martinavicius, A.; Liedke, M.; Abrasonis, G.; Fassbender, J.; Sommerlatte, J.; Nielsch, K.; Suriñach, S.; Baró, M.D.; Nogués, J.; et al. Patterning of magnetic structures on austenitic stainless steel by local ion beam nitriding. Acta Mater. 2008, 56, 4570–4576. [Google Scholar] [CrossRef]
- Marcos, G.; Guilet, S.; Cleymand, F.; Thiriet, T.; Czerwiec, T. Stainless steel patterning by combination of micro-patterning and driven strain produced by plasma assisted nitriding. Surf. Coat. Technol. 2011, 205, S275–S279. [Google Scholar] [CrossRef]
- Galdikas, A.; Moskalioviene, T. Swelling effect on stress induced and concentration dependent diffusion of nitrogen in plasma nitrided austenitic stainless steel. Comput. Mater. Sci. 2013, 72, 140–145. [Google Scholar] [CrossRef]
- Möller, W.; Parascandola, S.; Telbizova, T.; Günzel, R.; Richter, E. Surface processes and diffusion mechanisms of ion nitriding of stainless steel and aluminium. Surf. Coat. Technol. 2001, 136, 73–79. [Google Scholar] [CrossRef]
- Jespersen, F.N.; Hattel, J.H.; Somers, M.A.J. Modelling the evolution of composition-and stress-depth profiles in austenitic stainless steels during low-temperature nitriding. Model. Simul. Mater. Sci. Eng. 2016, 24, 025003. [Google Scholar] [CrossRef]
- Kücükyildiz, C.; Sonne, M.R.; Thorborg, J.; Somers, M.A.; Hattel, J.H. Thermo-chemical-mechanical simulation of low temperature nitriding of austenitic stainless steel; inverse modelling of surface reaction rates. Surf. Coat. Technol. 2020, 381, 125145. [Google Scholar] [CrossRef]
- Christiansen, T.L.; Somers, M.A. The Influence of Stress on Interstitial Diffusion—Carbon Diffusion Data in Austenite Revisited. Defect Diffus. Forum 2010, 297–301, 1408–1413. [Google Scholar] [CrossRef]
- Galdikas, A.; Moskalioviene, T. The Anisotropic Stress-Induced Diffusion and Trapping of Nitrogen in Austenitic Stainless Steel during Nitriding. Metals 2020, 10, 1319. [Google Scholar] [CrossRef]
- Stinville, J.; Cormier, J.; Templier, C.; Villechaise, P. Modeling of the lattice rotations induced by plasma nitriding of 316L polycrystalline stainless steel. Acta Mater. 2015, 83, 10–16. [Google Scholar] [CrossRef]
- Reinders, P.M.; Bräuer, G. A model to predict the s-phase thickness and the change in corrosion behavior toward H2SO4 of 316L austenitic stainless steel after plasma nitriding. Surf. Coat. Technol. 2023, 475, 130135. [Google Scholar] [CrossRef]
- Bożek, B.; Sapa, L.; Tkacz-Śmiech, K.; Danielewski, M.; Rybak, J. A Mathematical Model and Simulations of Low Temperature Nitriding. Comput. Model. Eng. Sci. 2022, 130, 777–803. [Google Scholar] [CrossRef]
- Galdikas, A.; Pranevičius, L. Surface composition changes of ternary alloys in the non-steady state regime of preferential sputtering. Nucl. Instrum. Methods Phys. Res. Sect. B Beam Interact. Mater. At. 2000, 164–165, 868–872. [Google Scholar] [CrossRef]
- Qadri, S.; Sasidhar, K.; Meka, S. High nitrogen alloying of AISI 316 L stainless steel powder by nitriding. Powder Technol. 2021, 390, 456–463. [Google Scholar] [CrossRef]
- Williamson, D.; Davis, J.; Wilbur, P. Effect of austenitic stainless steel composition on low-energy, high-flux, nitrogen ion beam processing. Surf. Coat. Technol. 1998, 103–104, 178–184. [Google Scholar] [CrossRef]
- Czerwiec, T.; Andrieux, A.; Marcos, G.; Michel, H.; Bauer, P. Is “expanded austenite” really a solid solution? Mössbauer observation of an annealed AISI 316L nitrided sample. J. Alloys Compd. 2019, 811, 151972. [Google Scholar] [CrossRef]
- Menéndez, E.; Templier, C.; Abrasonis, G.; Lopez-Barbera, J.F.; Nogués, J.; Temst, K.; Sort, J. A combinatorial study of the mechanical and magnetic properties of a gradually nitrided austenitic stainless steel single crystal. CrystEngComm 2014, 16, 3515–3520. [Google Scholar] [CrossRef][Green Version]
- Menéndez, E.; Templier, C.; Garcia-Ramirez, P.; Santiso, J.; Vantomme, A.; Temst, K.; Nogués, J. Magnetic Properties of Single Crystalline Expanded Austenite Obtained by Plasma Nitriding of Austenitic Stainless Steel Single Crystals. ACS Appl. Mater. Interfaces 2013, 5, 10118–10126. [Google Scholar] [CrossRef]
- Stinville, J.C.; Templier, C.; Villechaise, P.; Pichon, L. Swelling of 316L austenitic stainless steel induced by plasma nitriding. J. Mater. Sci. 2011, 46, 5503–5511. [Google Scholar] [CrossRef]
- Rivière, J.; Pichon, L.; Drouet, M.; Poquillon, D.; Galdikas, A. Silicon based coatings deposited by dynamic ion mixing for oxidation protection of a Ti6242 alloy. Surf. Coat. Technol. 2007, 201, 8343–8347. [Google Scholar] [CrossRef]
- Tao, X.; Liu, X.; Matthews, A.; Leyland, A. The influence of stacking fault energy on plasticity mechanisms in triode-plasma nitrided austenitic stainless steels: Implications for the structure and stability of nitrogen-expanded austenite. Acta Mater. 2019, 164, 60–75. [Google Scholar] [CrossRef]
- Zangwill, A. Physics at Surfaces; Cambridge University Press: New York, NY, USA, 1988. [Google Scholar]
- Ferrón, J.; Goldberg, E.; De Bernardez, L.; Buitrago, R. Escape depth of auger electrons; the elastic scattering effect. Surf. Sci. 1982, 123, 239–246. [Google Scholar] [CrossRef]
- Titus, D.; Samuel, E.J.J.; Roopan, S.M. Chapter 12—Nanoparticle characterization techniques. In Micro and Nano Technologies, Green Synthesis, Characterization and Applications of Nanoparticles; Shukla, A.K., Iravani, S., Eds.; Elsevier: Amsterdam, The Netherlands, 2019; pp. 303–319. ISBN 9780081025796. [Google Scholar] [CrossRef]
- Knizikevičius, R.; Galdikas, A.; Grigonis, A. Real dimensional simulation of anisotropic etching of silicon in CF4+O2 plasma. Vacuum 2002, 66, 39–47. [Google Scholar] [CrossRef]
Disclaimer/Publisher’s Note: The statements, opinions and data contained in all publications are solely those of the individual author(s) and contributor(s) and not of MDPI and/or the editor(s). MDPI and/or the editor(s) disclaim responsibility for any injury to people or property resulting from any ideas, methods, instructions or products referred to in the content. |
© 2024 by the authors. Licensee MDPI, Basel, Switzerland. This article is an open access article distributed under the terms and conditions of the Creative Commons Attribution (CC BY) license (https://creativecommons.org/licenses/by/4.0/).